Celsia SA ESP · BVC:CELSIA
Celsia SA ESP — Celsia — Non-Deal Roadshow (April 2018)
15 slides from Celsia SA ESP's roadshow presentation, April 2018

Slide 1: Corporate Presentation
CORPORATE PRESENTATION BTG Pactual’s North Andean Investor Trip Colombia & Peru April 2018

Slide 2: Agenda
AGENDA 1. Company overview 2. Next steps for strong long– term success 3. Financial review
Slide 3: 1. Company Overview
1. COMPANY OVERVIEW
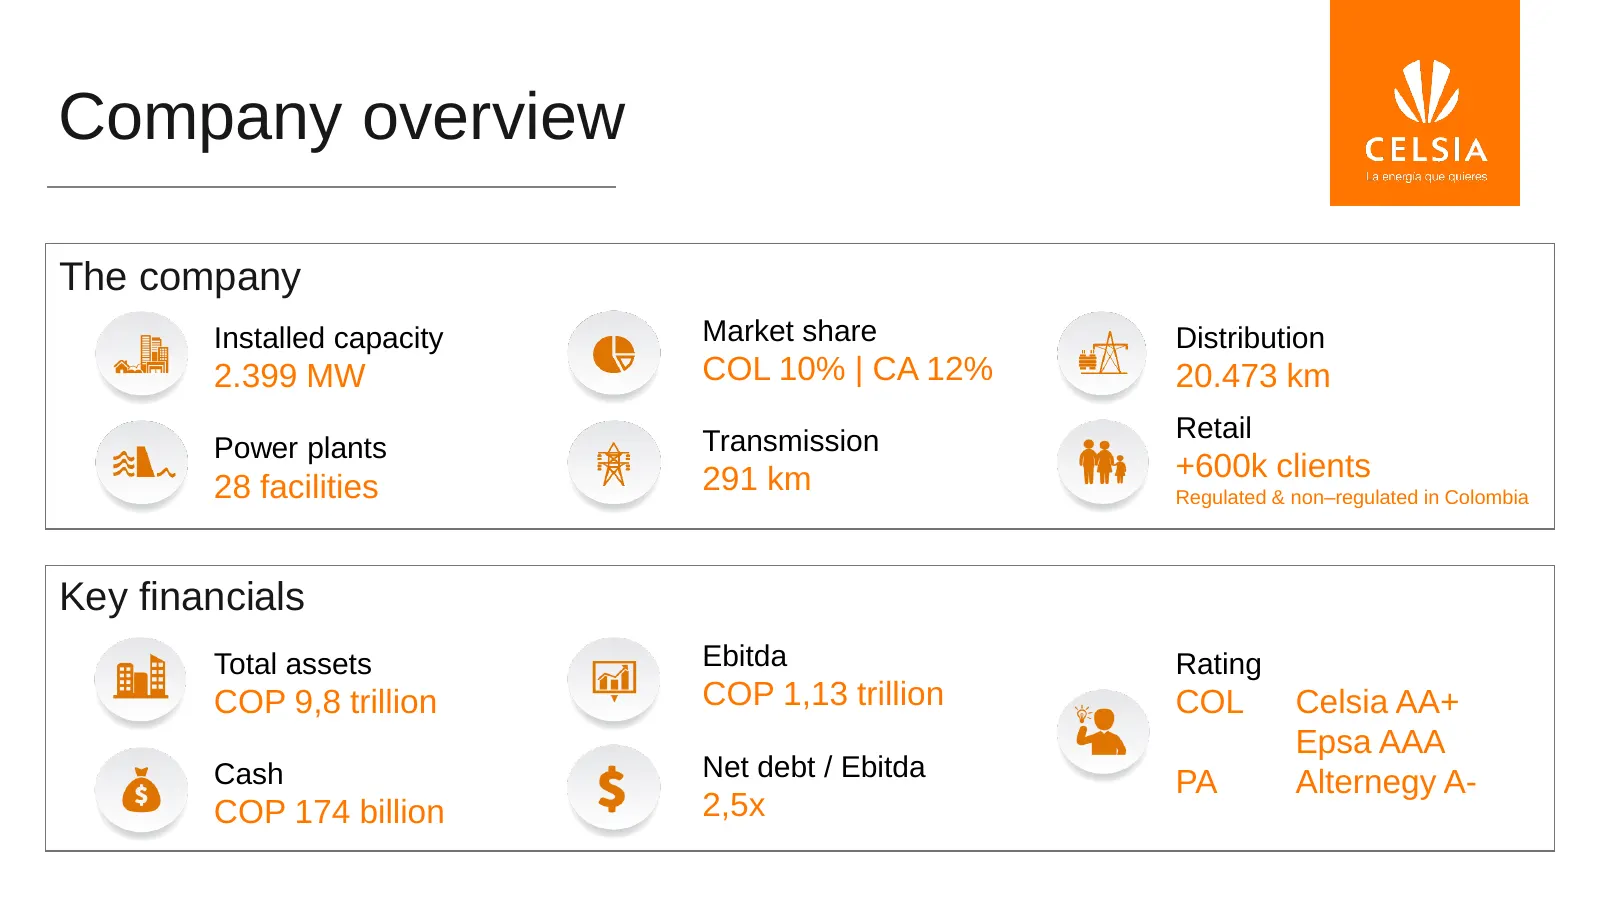
Slide 4: Company overview
Company overview The company Installed capacity Market share Distribution 2.399 MW COL 10% | CA 12% 20.473 km Transmission Retail Power plants 291 km +600k clients 28 facilities Regulated & non–regulated in Colombia Key financials Total assets Ebitda Rating COP 9,8 trillion COP 1,13 trillion COL Cel
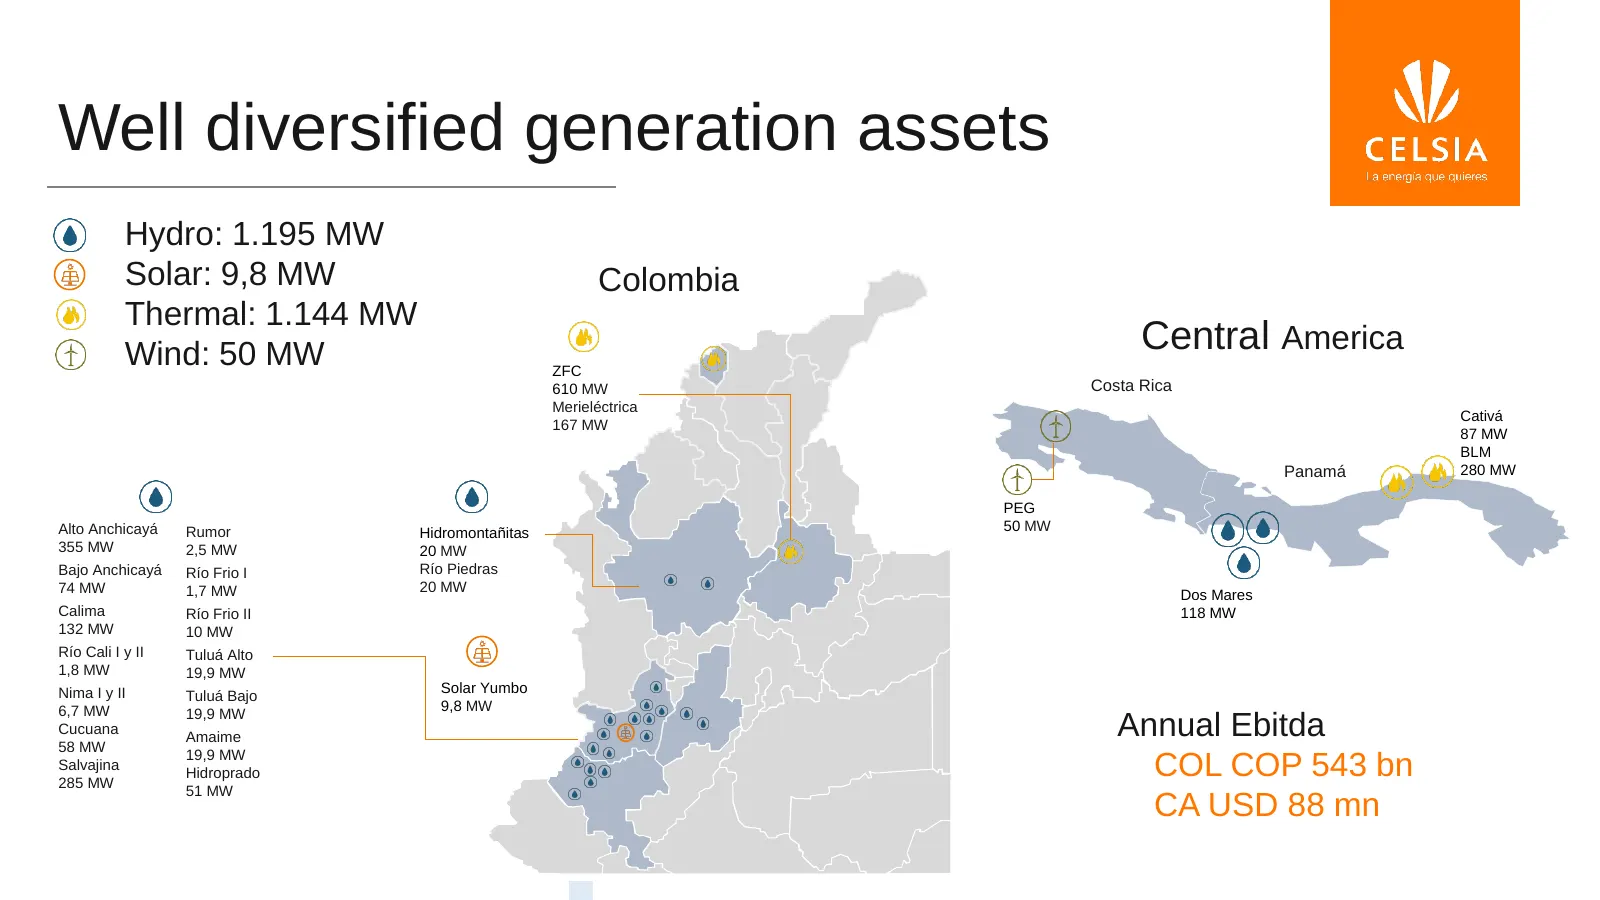
Slide 5: Well diversified generation assets
Well diversified generation assets Hydro: 1.195 MW Solar: 9,8 MW Colombia Thermal: 1.144 MW Wind: 50 MW Central America ZFC 610 MW Costa Rica Merieléctrica Cativá 167 MW 87 MW BLM Panamá 280 MW PEG Alto Anchicayá Rumor Hidromontañitas 50 MW 355 MW 2,5 MW 20 MW Bajo Anchicayá Río Frio I Río Piedras 7
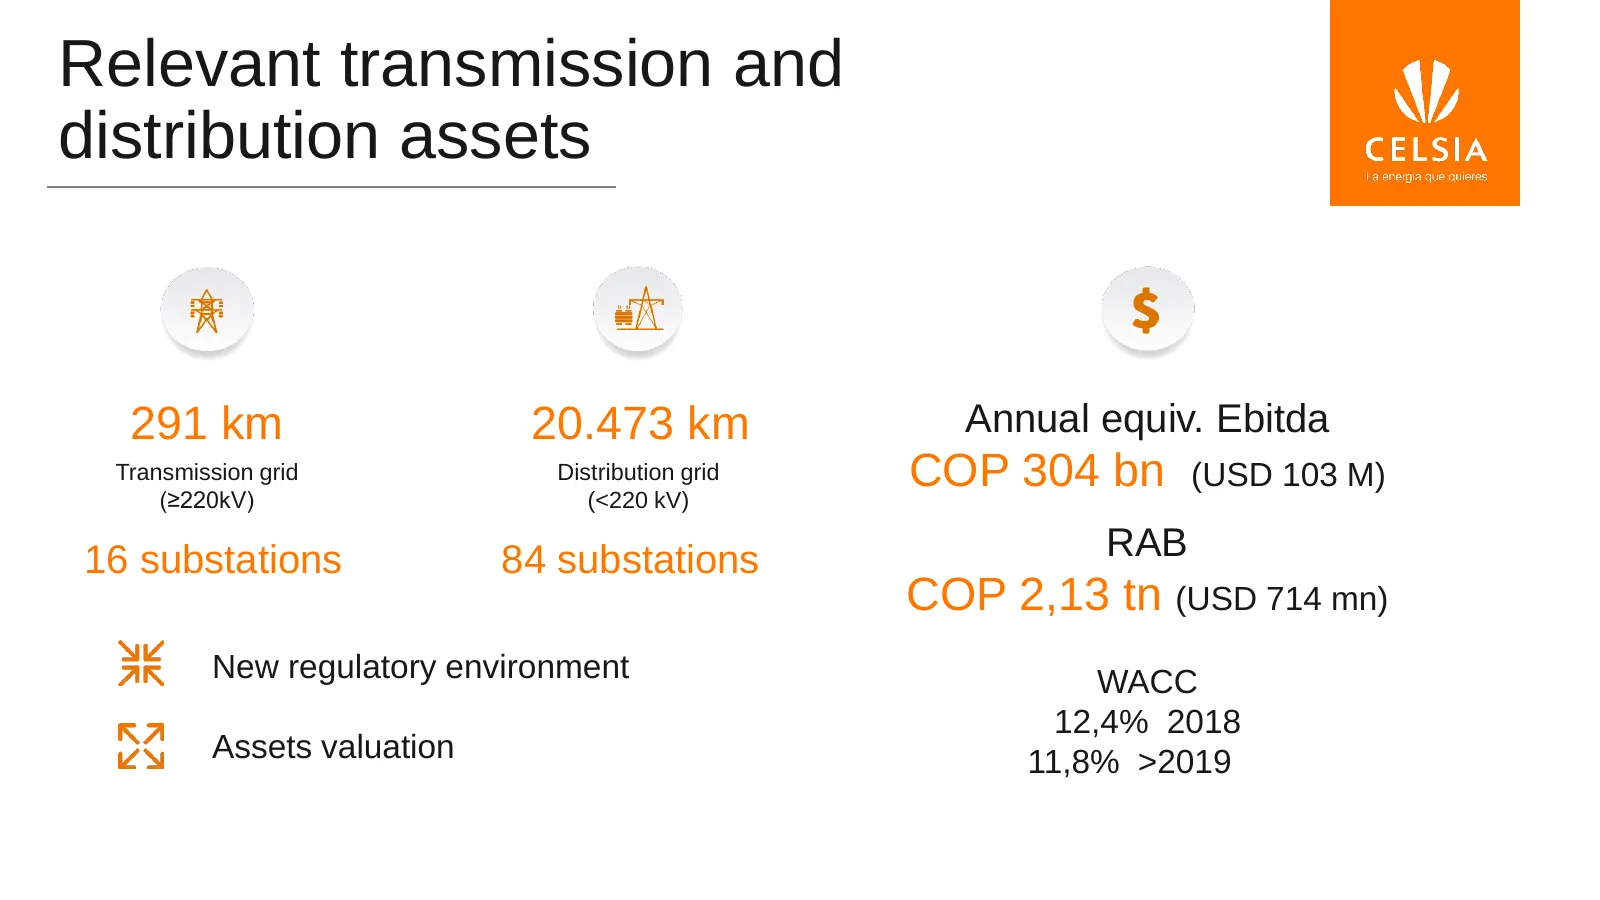
Slide 6: Relevant transmission and distribution assets
Relevant transmission and distribution assets 291 km 20.473 km Annual equiv. Ebitda Transmission grid (≥220kV) Distribution grid (<220 kV) COP 304 bn (USD 103 M) 16 substations 84 substations RAB COP 2,13 tn (USD 714 mn) New regulatory environment WACC 12,4% 2018 Assets valuation 11,8% >2019
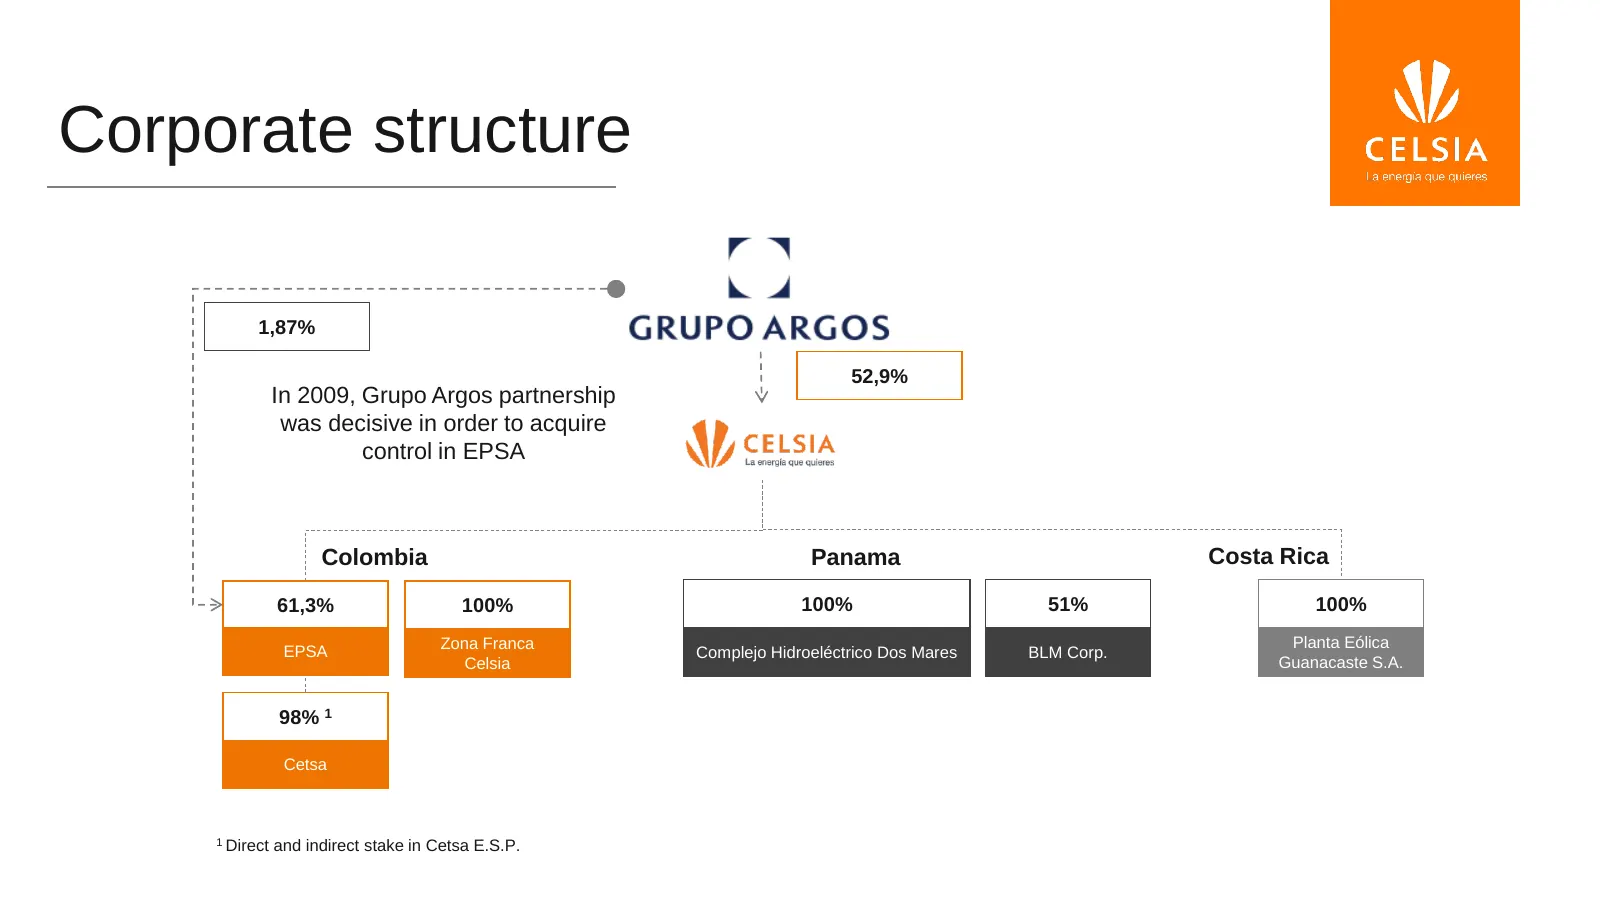
Slide 7: Corporate structure
Corporate structure 1,87% 52,9% In 2009, Grupo Argos partnership was decisive in order to acquire control in EPSA Colombia Panama Costa Rica 61,3% 100% 100% 51% 100% Zona Franca Planta Eólica EPSA Complejo Hidroeléctrico Dos Mares BLM Corp. Celsia Guanacaste S.A. 98% 1 Cetsa 1 Direct and indirect st

Slide 8: 2. Next steps for strong long-term success
2. NEXT STEPS FOR STRONG LONG– TERM SUCCESS
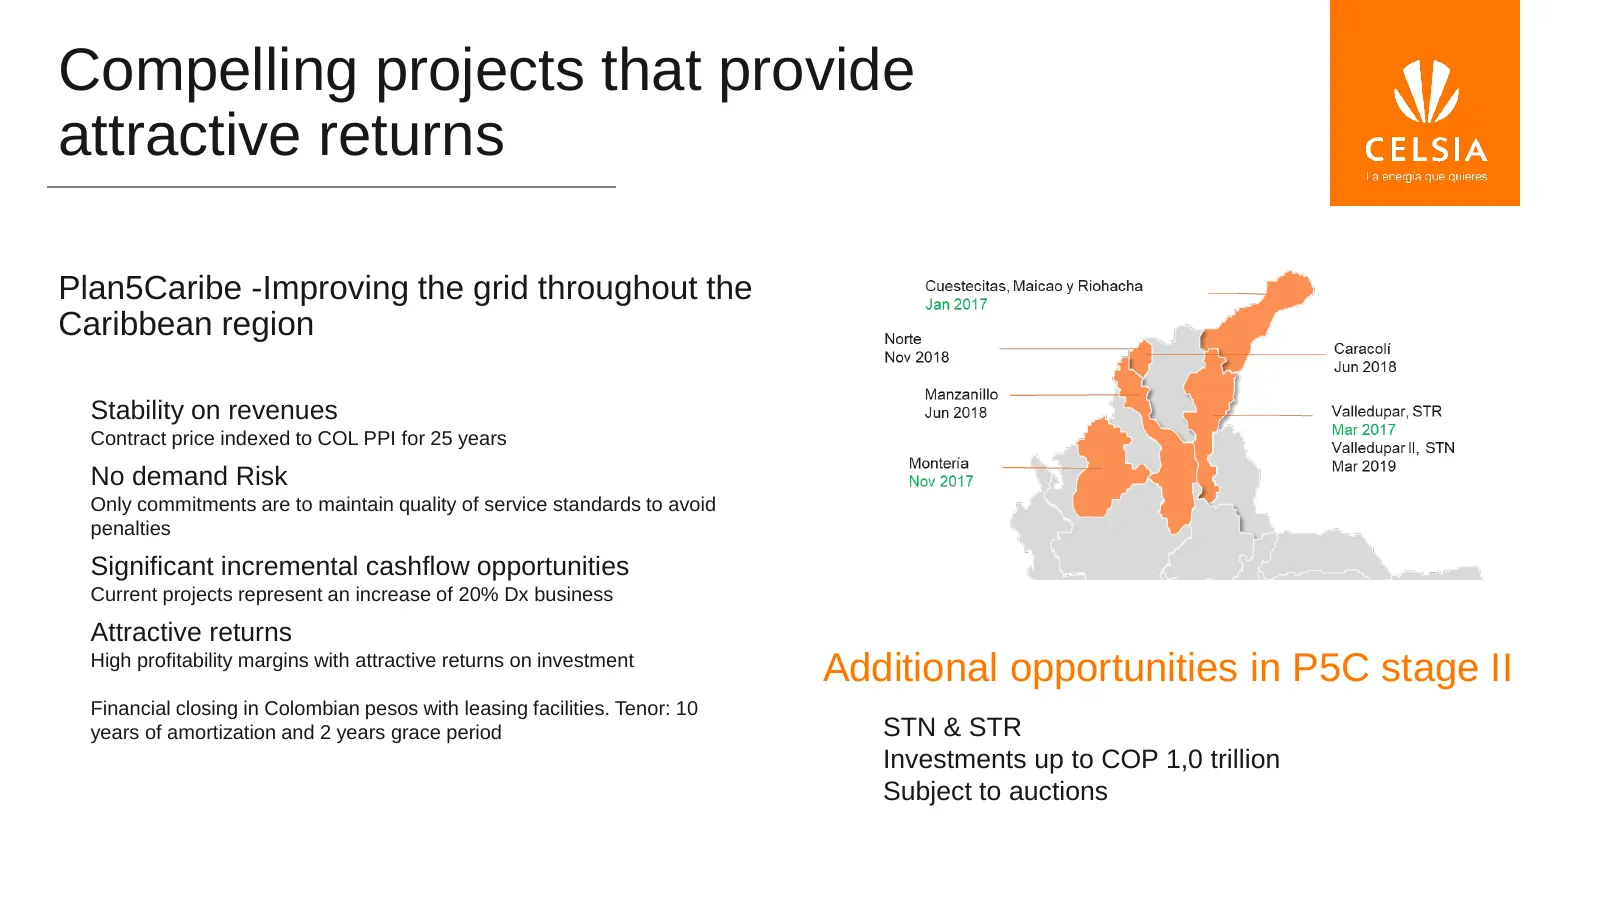
Slide 9: Compelling projects that provide attractive returns
Compelling projects that provide attractive returns Plan5Caribe -Improving the grid throughout the Caribbean region Stability on revenues Contract price indexed to COL PPI for 25 years No demand Risk Only commitments are to maintain quality of service standards to avoid penalties Significant increme
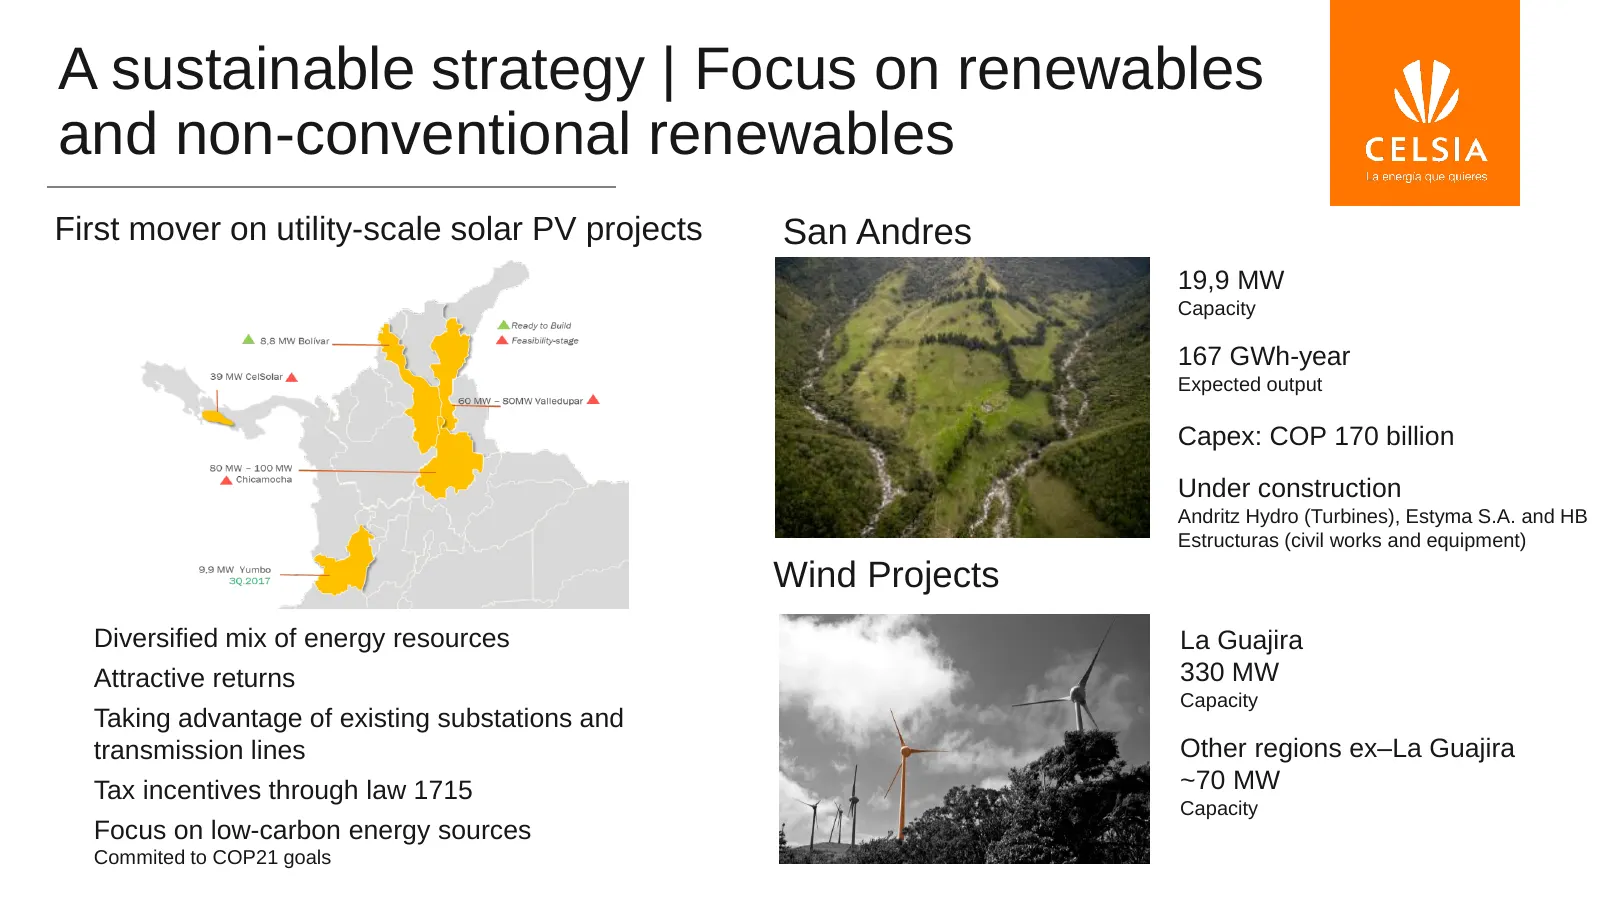
Slide 10: A sustainable strategy: focus on renewables and non-conventional renewables
A sustainable strategy | Focus on renewables and non-conventional renewables First mover on utility-scale solar PV projects San Andres 19,9 MW Capacity 167 GWh-year Expected output Capex: COP 170 billion Under construction Andritz Hydro (Turbines), Estyma S.A. and HB Estructuras (civil works and equ
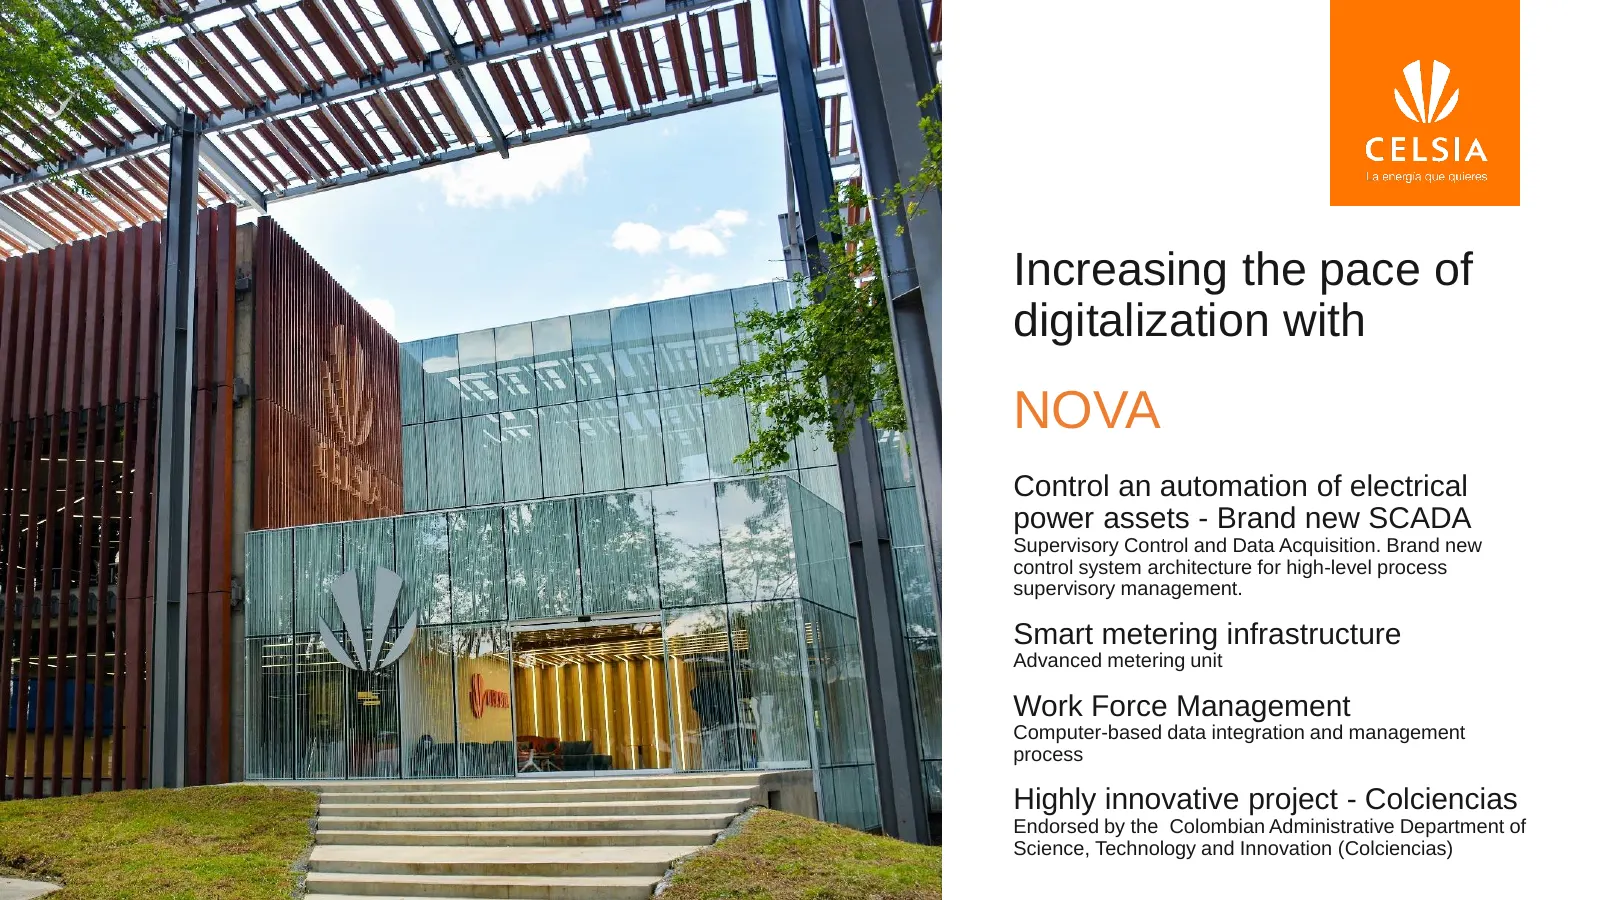
Slide 11: Increasing the pace of digitalization with NOVA
Increasing the pace of digitalization with NOVA Control an automation of electrical power assets - Brand new SCADA Supervisory Control and Data Acquisition. Brand new control system architecture for high-level process supervisory management. Smart metering infrastructure Advanced metering unit Work
Slide 12: Key takeaways
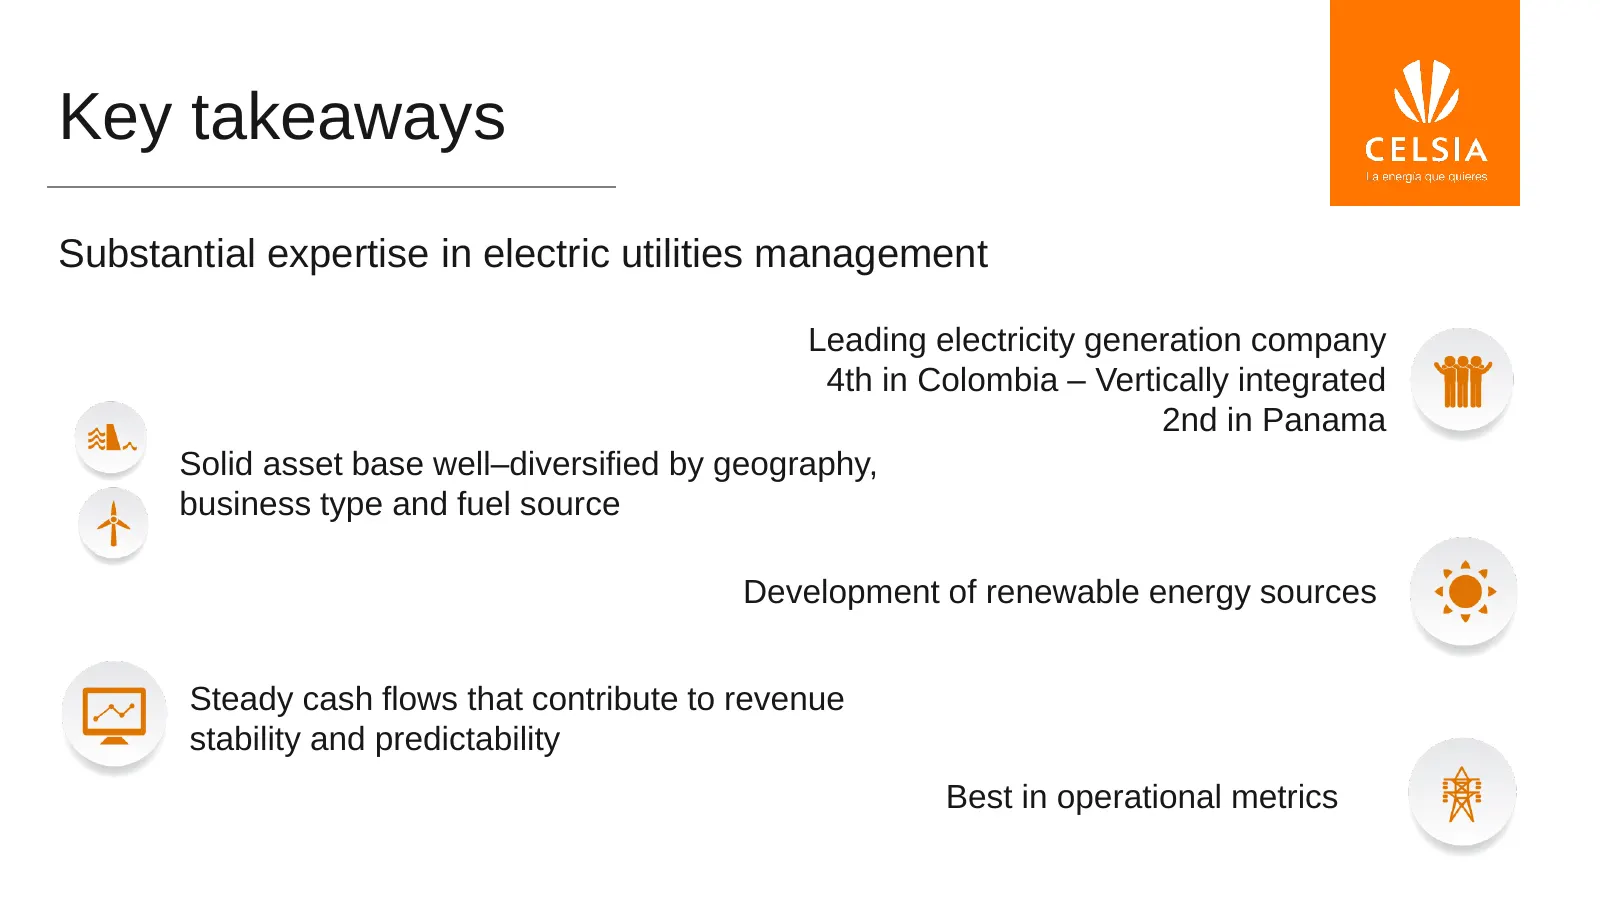
Key takeaways Substantial expertise in electric utilities management Leading electricity generation company 4th in Colombia – Vertically integrated 2nd in Panama Solid asset base well–diversified by geography, business type and fuel source Development of renewable energy sources Steady cash flows th

Slide 13: 3. Financial review
W CELSIA 3. FINANCIAL REVIEW
Slide 14: Consolidated financial results
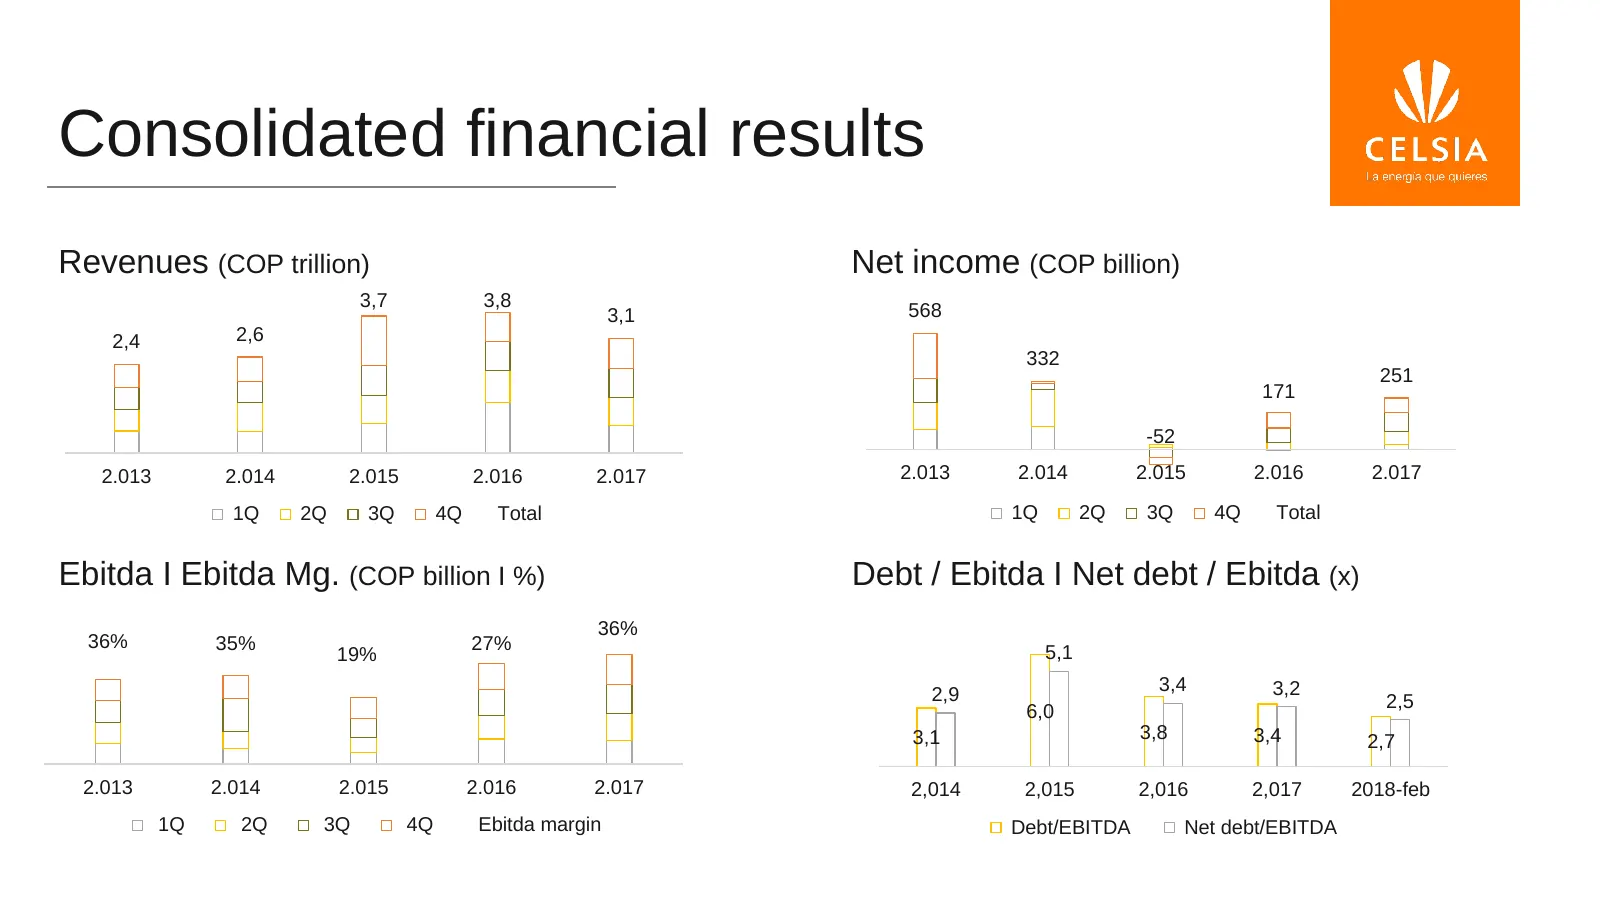
Consolidated financial results Revenues (COP trillion) Net income (COP billion) 3,7 3,8 3,1 568 2,4 2,6 332 251 171 -52 2.013 2.014 2.015 2.016 2.017 2.013 2.014 2.015 2.016 2.017 1Q 2Q 3Q 4Q Total 1Q 2Q 3Q 4Q Total Ebitda I Ebitda Mg. (COP billion I %) Debt / Ebitda I Net debt / Ebitda (x) 36% 36%
Slide 15: Consolidated debt profile
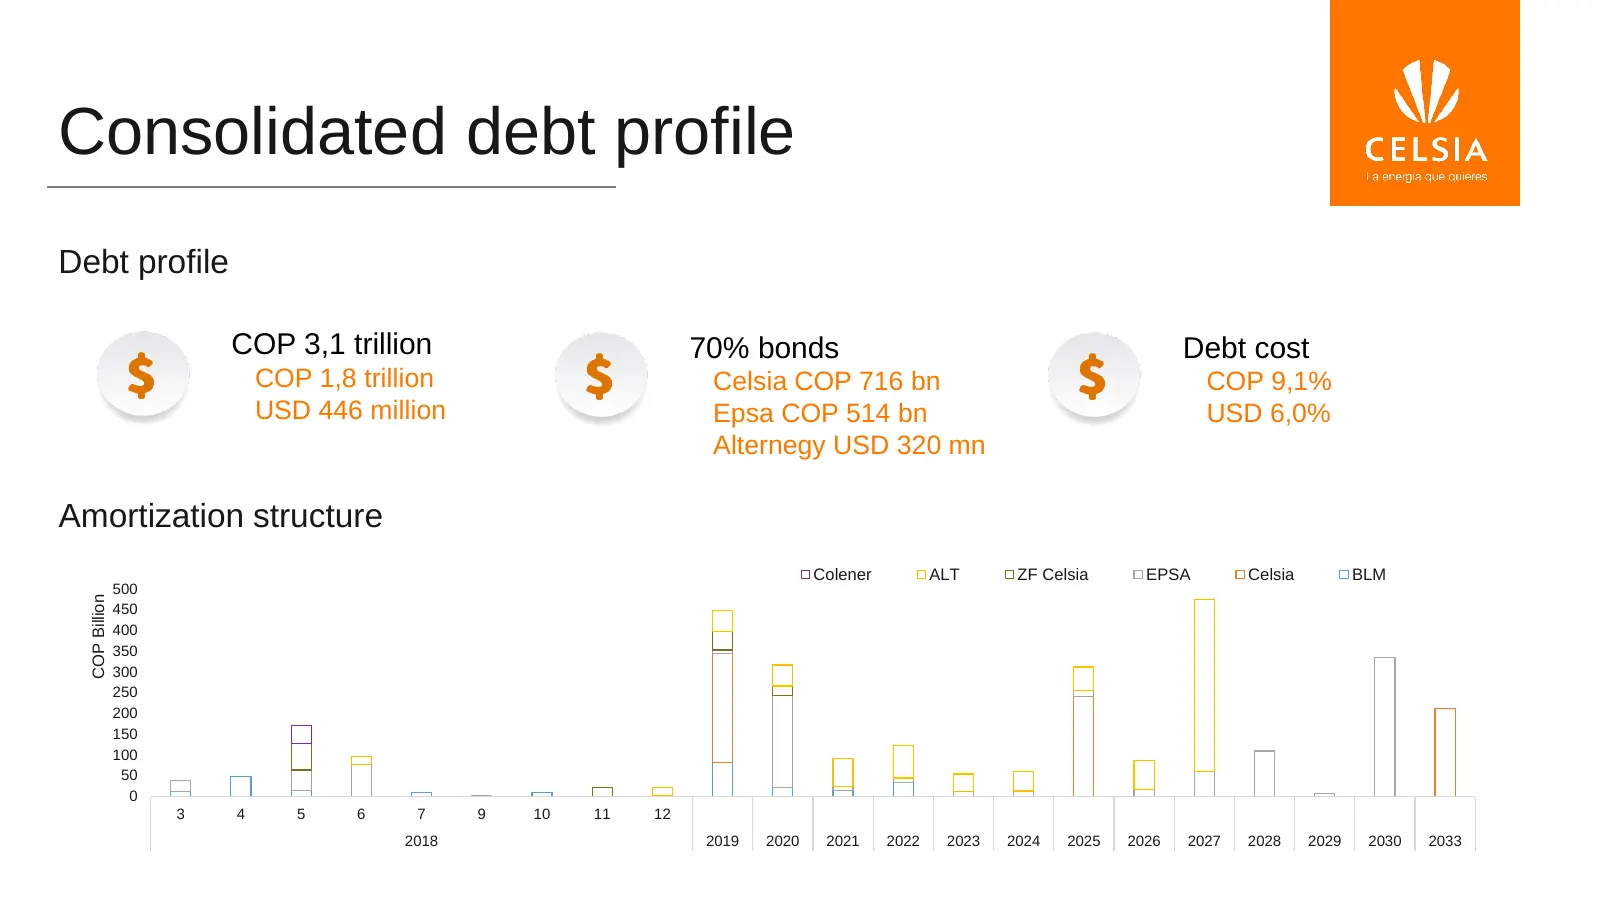
Consolidated debt profile Debt profile COP 3,1 trillion 70% bonds Debt cost COP 1,8 trillion Celsia COP 716 bn COP 9,1% USD 446 million Epsa COP 514 bn USD 6,0% Alternegy USD 320 mn Amortization structure Colener ALT ZF Celsia EPSA Celsia BLM 500 COP Billion 450 400 350 300 250 200 150 100 50 0 3 4
Source: Internet Archive copy of celsia.com
More decks from Celsia SA ESP
 Q3 2026 Earnings Presentation15 slides · November 2026
 Celsia — Investor Presentation (June 2026)26 slides · June 2026
 Celsia — Investor Presentation (June 2026)26 slides · June 2026
 Q4 2025 Earnings Presentation28 slides · February 2026
 Q2 2026 Earnings Presentation16 slides · 2026
 Investor Day (October 2025)46 slides · October 2025