Duke Realty — REIT Week: 2012 NAREIT Investor Forum
40 slides from Duke Realty's conference presentation, Jun 12, 2012
Slide 1: REIT Week: 2012 NAREIT Investor Forum
RELIABLE. ANSWERS. REIT WEEK: 2012 NAREIT INVESTOR FORUM JUNE 12-14 Exhibit 99.1
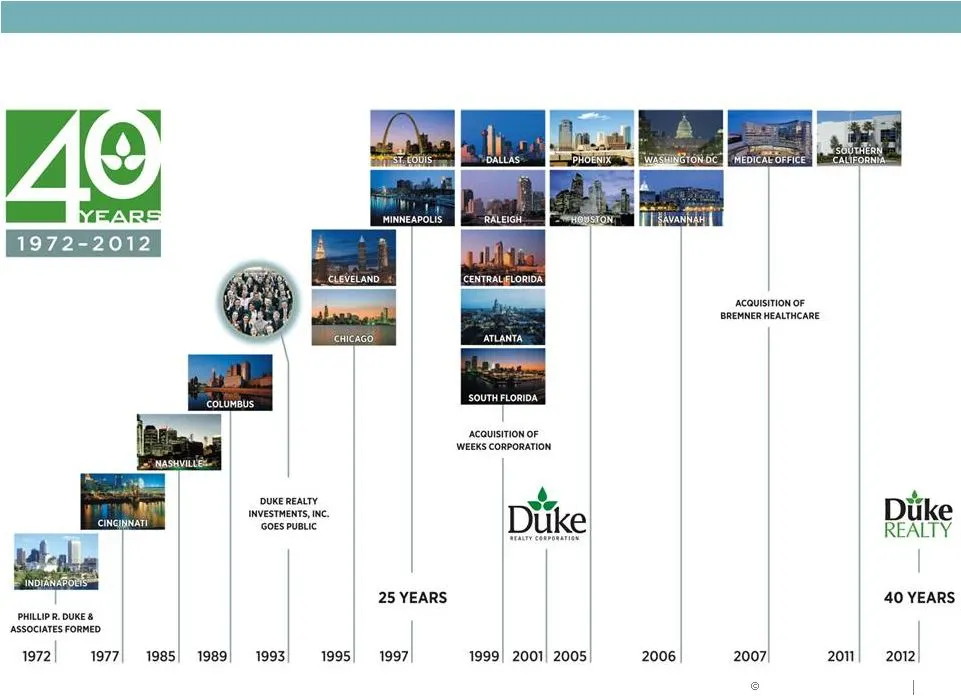
Slide 2: 40 Years Timeline
RELIABLE. ANSWERS . 40 Years Timeline
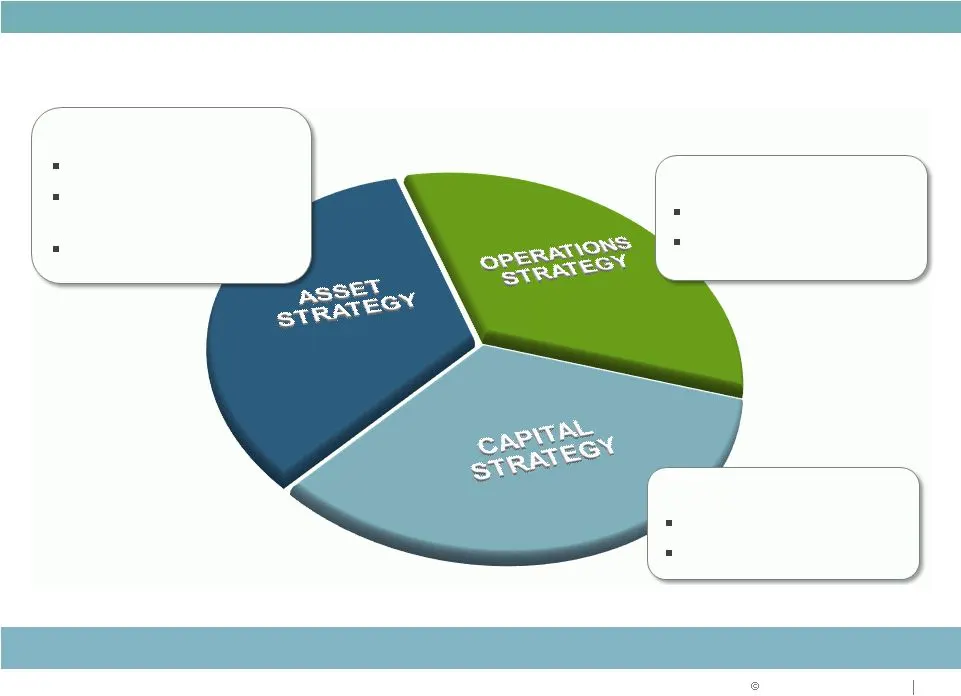
Slide 3: Strategies for delivering shareholder value
RELIABLE. ANSWERS . Focus on: Increasing cash flow Maximizing return on assets Strategy for Success Focus on: Improving coverage ratios Improving ratings Focus on: Portfolio repositioning Strategic acquisitions & dispositions Development opportunities Strategies for delivering shareholder value
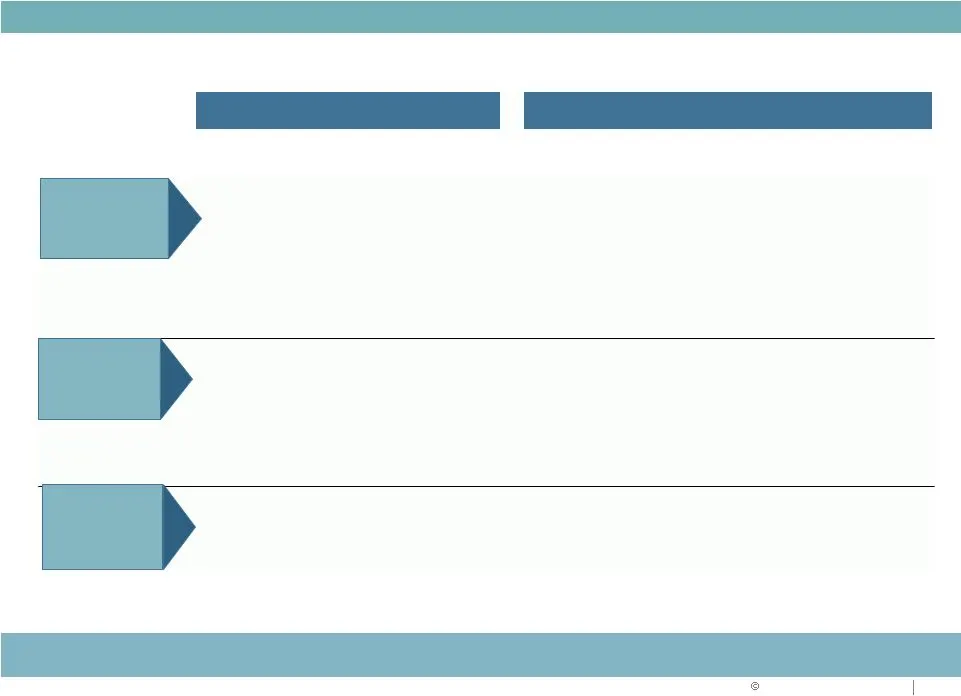
Slide 4: 2012 Goals and Objectives Q1 2012 Update
RELIABLE. ANSWERS . 2012 Goals and Objectives Q1 2012 Update Strategic Focus Solid Q1 start and executing across all three aspects of our strategy Operations Strategy Asset Strategy Capital Strategy • Lease-up portfolio, manage cap ex; reach positive same property income growth • Balance execution w

Slide 5: Operations Strategy
OPERATIONS STRATEGY
Slide 6: Focus on Fundamentals
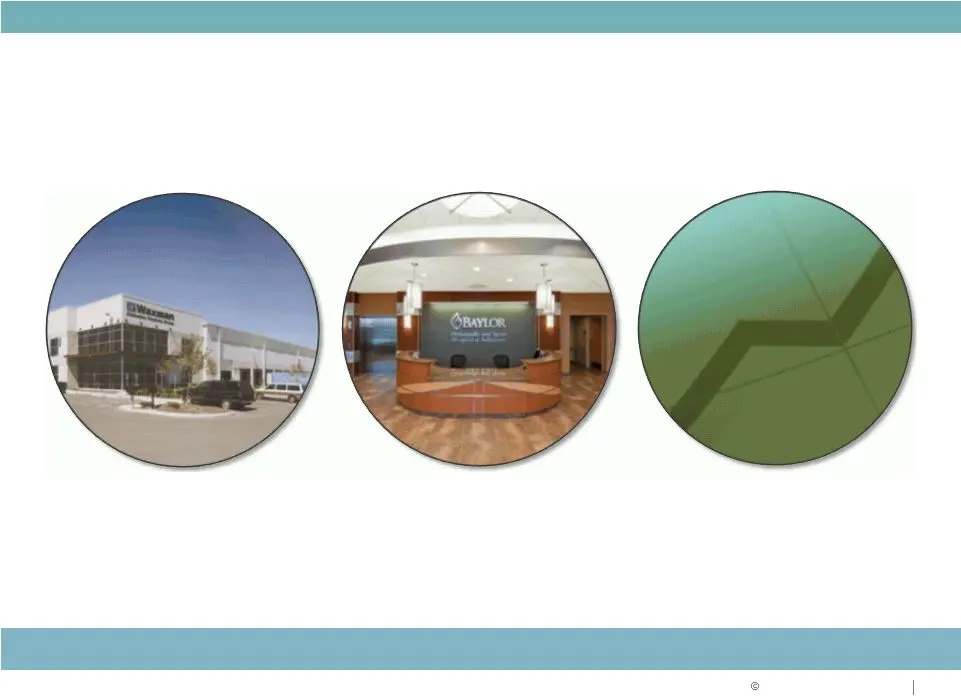
OPERATIONS STRATEGY Focus on Fundamentals LEASING OF PORTFOLIO STRATEGIC NEW DEVELOPMENT AND LAND DISPOSITION AFFO PAYOUT Maximize return on assets
Slide 7: Consistent Operating Performance
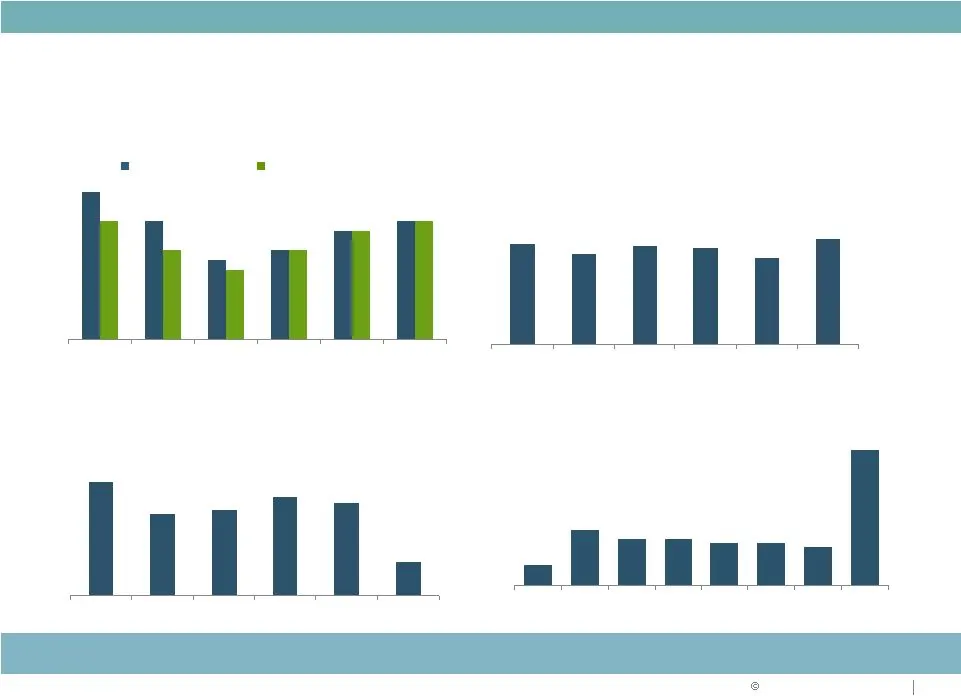
OPERATIONS STRATEGY 2012 YTD 29.9 2012 YTD Consistent Operating Performance Stabilized Occupancy (%) Strong historical stabilized occupancy – fundamentals improving Lease Renewals (%) Strong lease renewal percentages Stabilized occupancy In-service occupancy Leasing Activity New Leases and Renewals
Slide 8: Consistent NOI Growth Outperformance
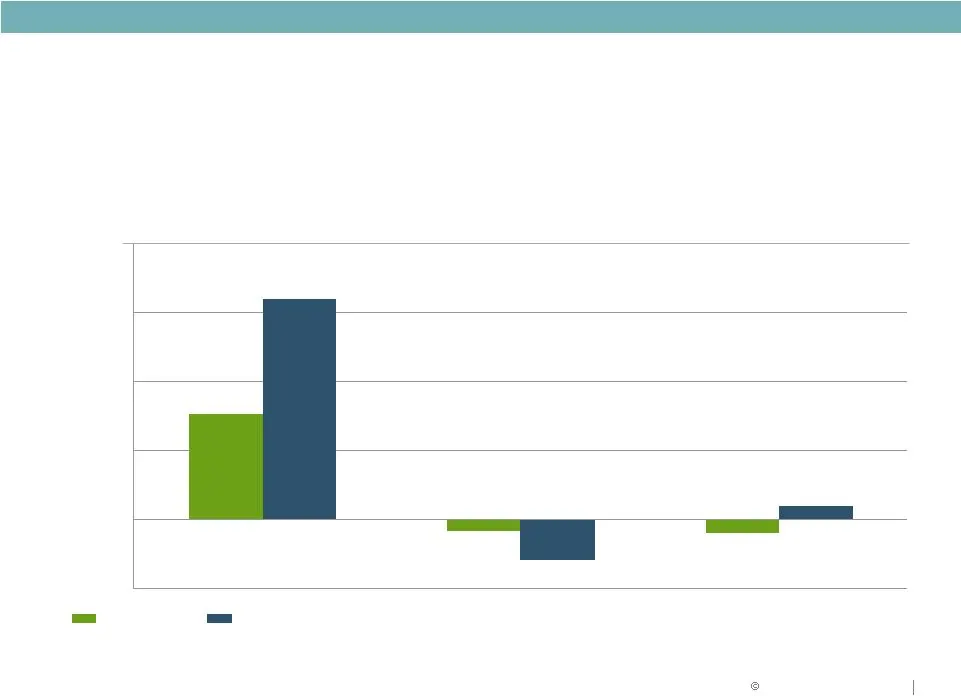
OPERATIONS STRATEGY 1.5% (0.2%) (0.2%) 3.2% (0.6%) 0.2% (1.0%) 0.0% 1.0% 2.0% 3.0% 4.0% Suburban Office Peers Industrial Peers 5-Year Avg. 1-Year Avg. Annual Same-Store NOI Growth (1) %, y-y Sources SNL and company filings Duke Realty Suburban Office Peers (2) Industrial Peers (3) Consistent NOI Gro
Slide 9: Positioned for NAV Growth
RELIABLE. ANSWERS . Increased management & service fees Accretive future development Lease up existing vacancy Increase Rents/ Reduced Capex Accretive future acquisitions Positioned for NAV Growth KEY NAV GROWTH DRIVERS Portfolio occupancy of 92.1% Strong leasing pipeline Demonstrated track record o
Slide 10: Land and Development Capabilities
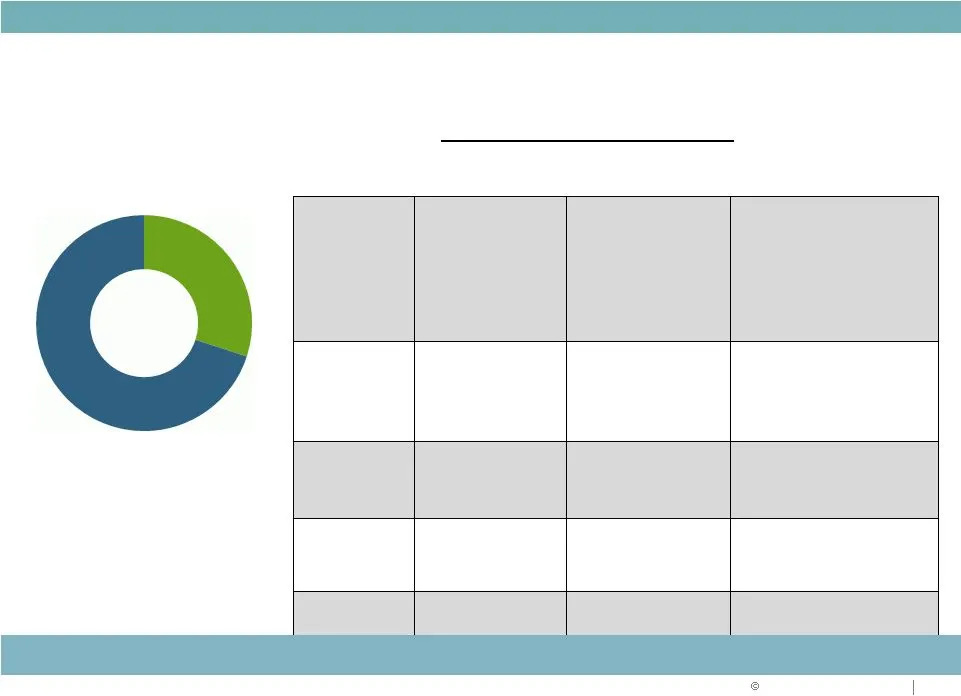
Office 30% Industrial 70% OPERATIONS STRATEGY Land and Development Capabilities $498 million HELD FOR DEVELOPMENT Industrial Office Midwest 26.3 2.8 Indianapolis, Chicago, Cincinnati, Columbus, Minneapolis, and St. Louis major positions East 3.8 2.1 New Jersey, Baltimore, Washington D.C., and Raleig
Slide 11: Indianapolis – Industrial
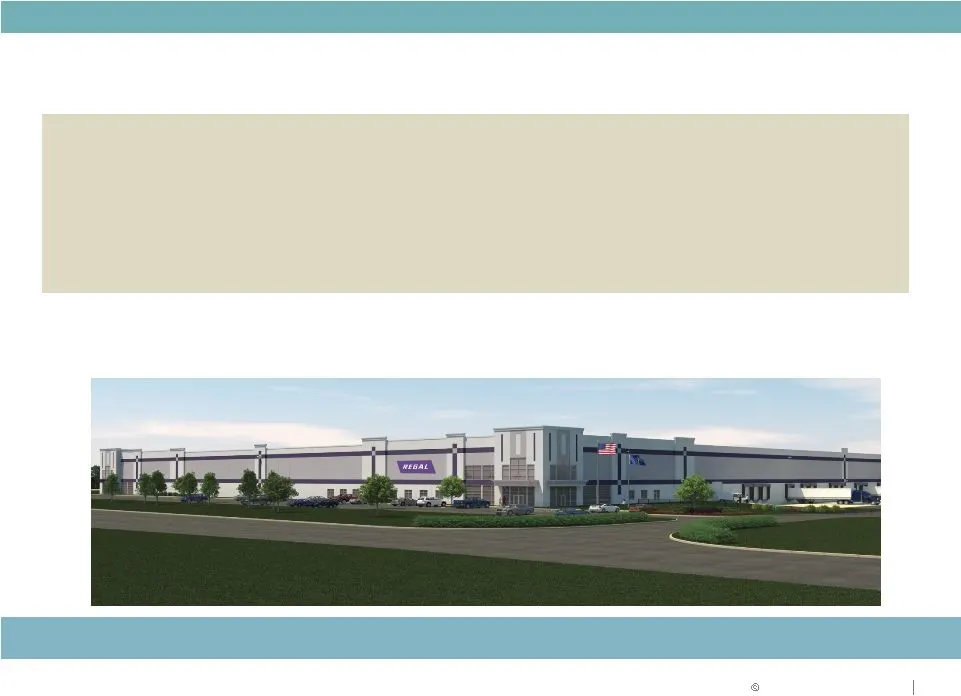
OPERATIONS STRATEGY OPERATIONS STRATEGY Indianapolis – Industrial Expand Industrial • Regal Beloit build-to-suit bulk distribution facility • 376,000 square feet, ten year lease term to growing global manufacturing company • Duke Realty won with strategic land position • $15 million project, 10 year
Slide 12: Northeast U.S. – Bulk Industrial Build-to-Suit
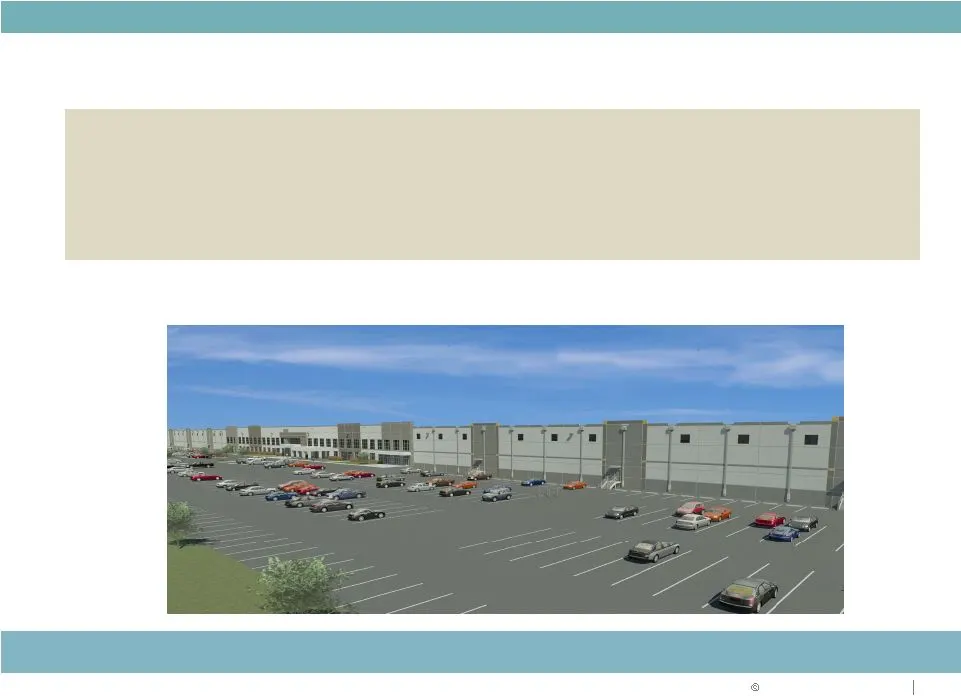
OPERATIONS STRATEGY Northeast U.S. – Bulk Industrial Build-to-Suit Repeat business new development with growing tenant • Regional distribution center build-to-suit in Delaware for Amazon • 1,015,000 square feet • Twelve year lease term • $82 million project, 12 year average yield 8.33%
Slide 13: Indianapolis – Medical Office
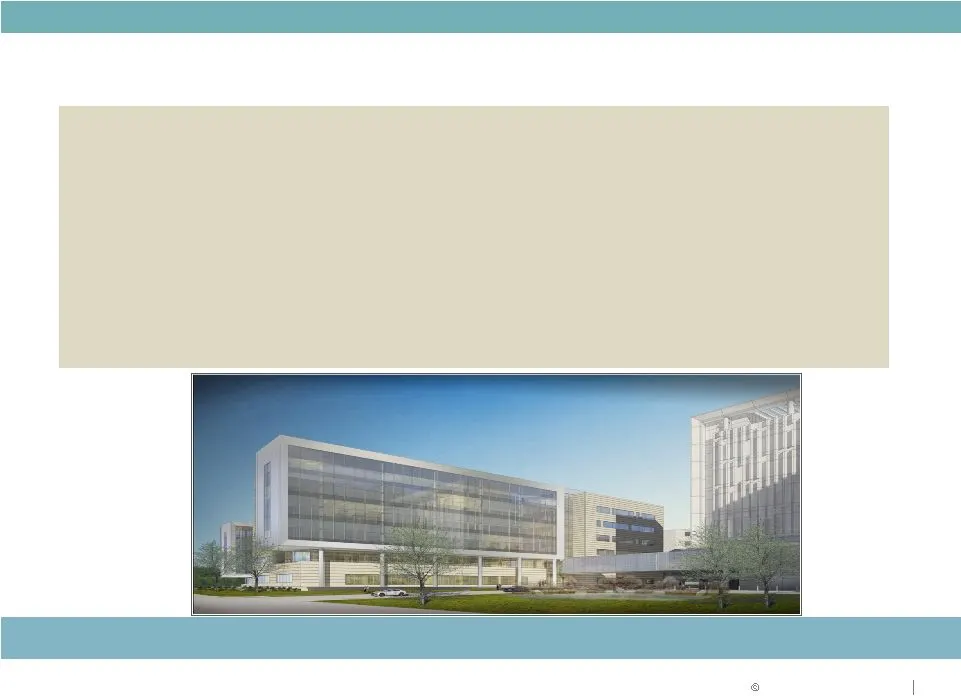
OPERATIONS STRATEGY Indianapolis – Medical Office Grow Medical Office • Wishard Faculty Office Building • Aa2 rated system sponsored by Marion County • 275,000 square feet • Thirty year lease term • 50/50 Joint Venture with Hospital System • On campus of new hospital to open in 2013 • $90 million pr
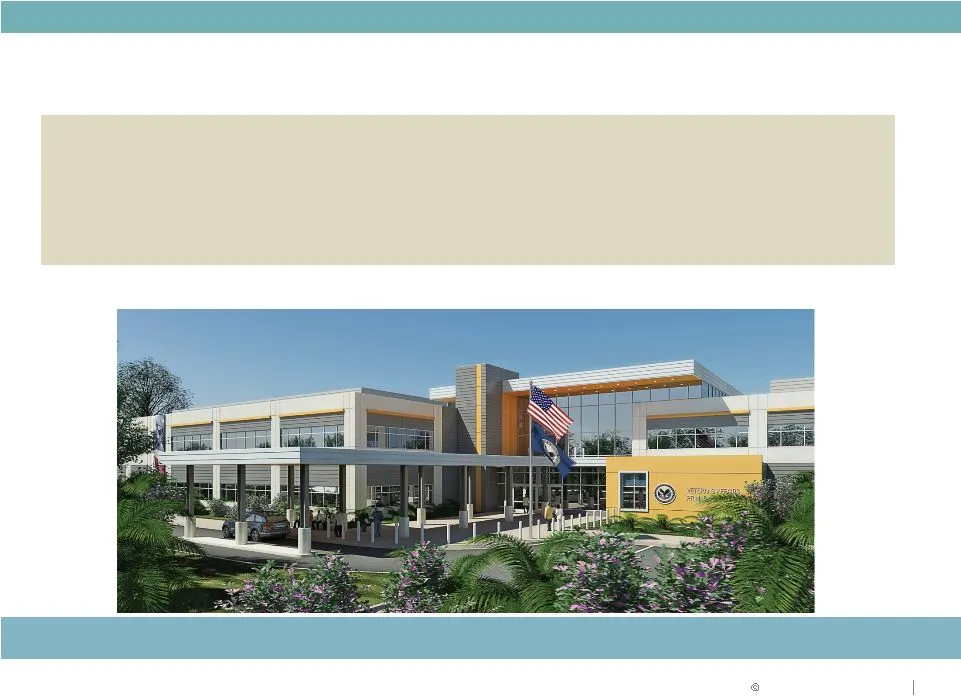
Slide 14: Tampa – Medical Office
RELIABLE. ANSWERS . Tampa – Medical Office • VA Primary Care Annex at Tampa • Leased to Department of Veterans Affairs • 120,000 square feet • $41 million project, 20 year average yield of 8.20% Grow Medical Office

Slide 15: Asset Strategy
ASSET STRATEGY
Slide 16: Proven ability to execute: repositioning track record
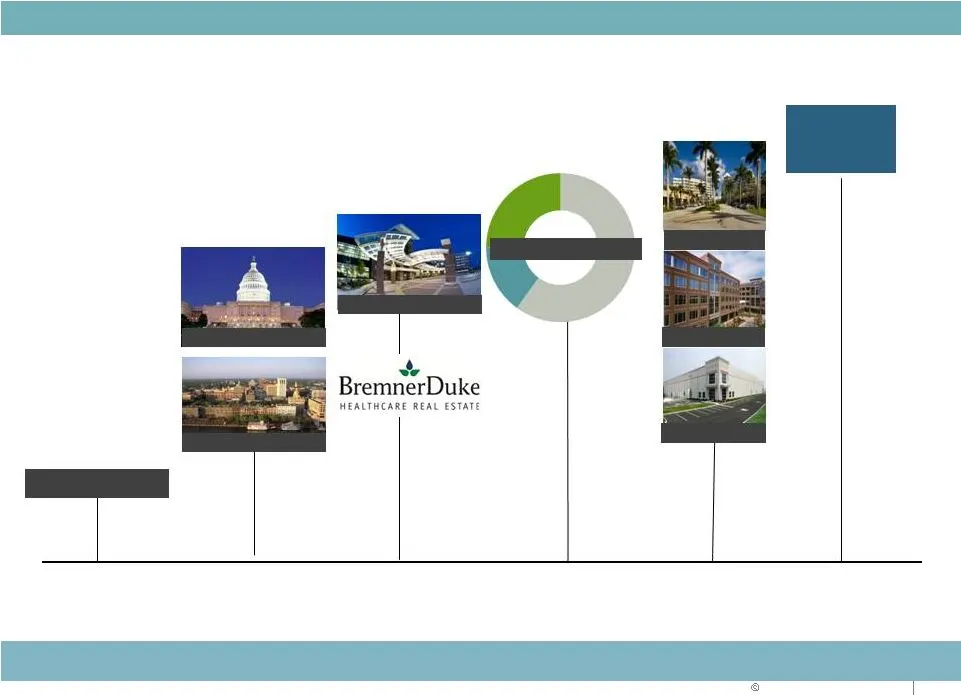
Flex disposition Savannah Washington DC Healthcare Asset Strategy Dugan CBRERT Premier Suburban Office Disposition ASSET STRATEGY Proven ability to execute $1 Billion Repositioning Track Record $1 Billion
Slide 17: Asset Strategy by product and geography
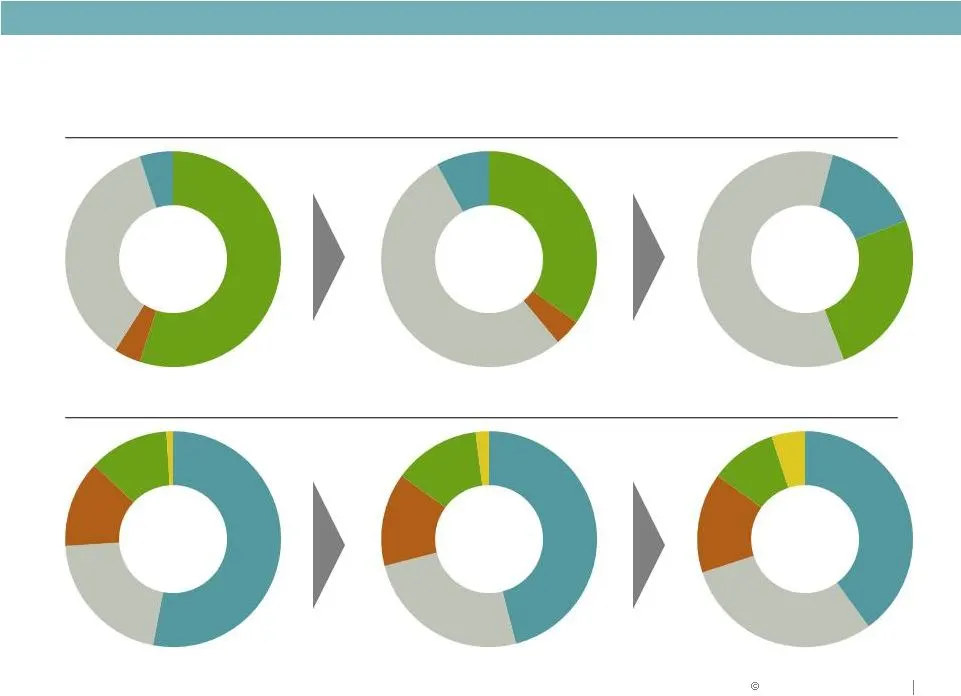
ASSET STRATEGY Asset Strategy March 31, 2012 BY PRODUCT BY GEOGRAPHY Southeast 21% Southeast 24% Southeast 30% Office 55% Retail 4% Industrial 36% Medical Office 5% Office 32% Retail 4% Industrial 53% Medical Office 11% Office 25% Industrial 60% Medical Office 15% Midwest 53% East 13% West 1% Midwes
Slide 18: Asset Strategy: Road Map
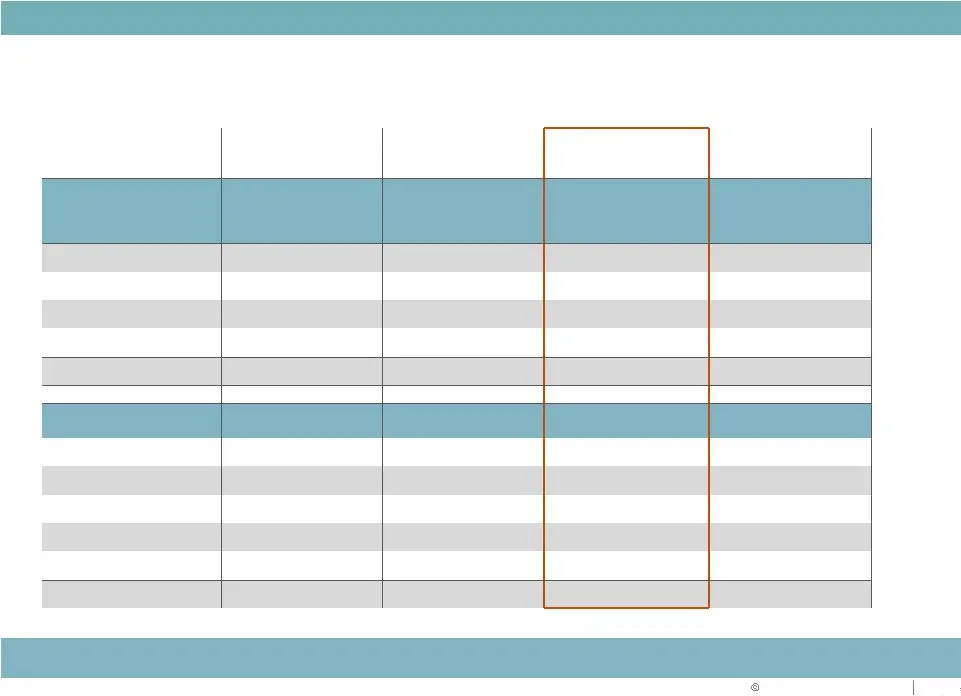
PRODUCT TYPE Amount % Amount % Acquisitions / Developments / Repositioning Amount % REGION ASSET STRATEGY Asset Strategy: Road Map ($ in millions) Investment 12/31/10 Investment 3/31/12 ACTION PLAN Investment Industrial $3,645 45% $4,264 53% $656 $4,920 60% Office 3,770 46% 2,529 32% (479) 2,050 25%
Slide 19: New, High Quality Portfolio with Long-term Leases
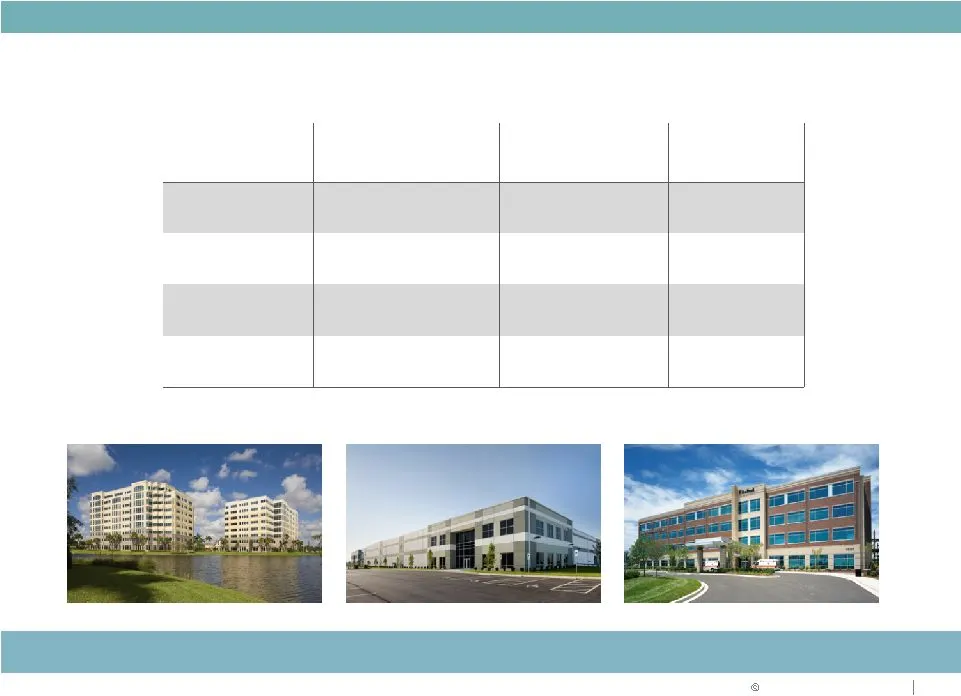
ASSET STRATEGY New, High Quality Portfolio with Long-term Leases Premier portfolio of assets Portfolio average Bulk Industrial Suburban Office Medical Office Property age 10.4 years 13.1 years 4.2 years Property size 221,000 SF 117,000 SF 82,000 SF Lease term 7.1 years 7.3 years 11.7 years Tenant si

Slide 20

Slide 21: Medical Office Strategy & Performance Update
MEDICAL OFFICE STRATEGY & Performance Update
Slide 22: Healthcare Data Points
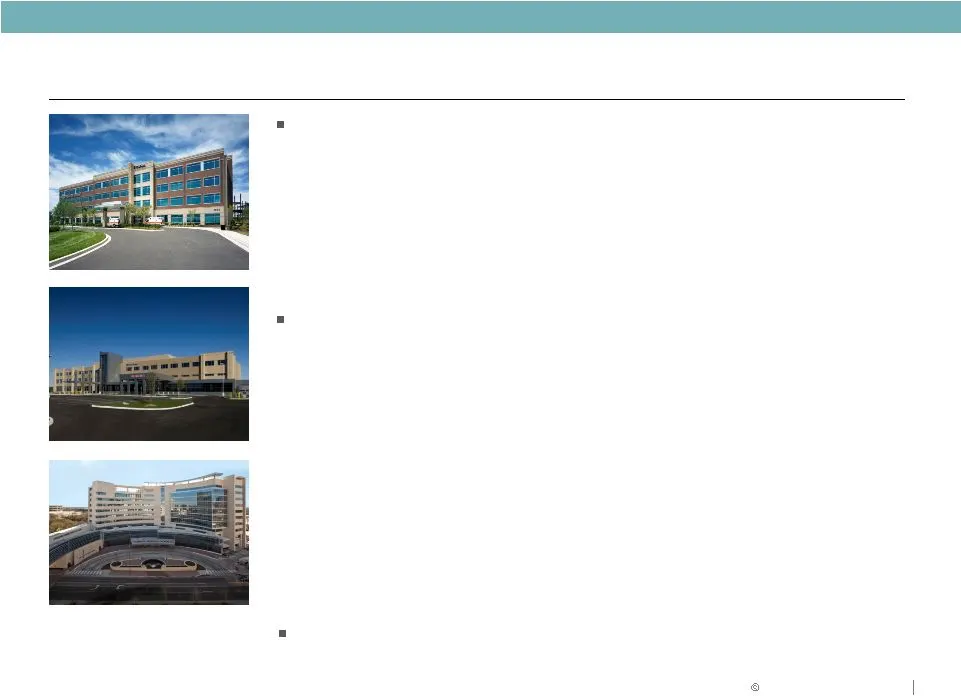
MEDICAL OFFICE STRATEGY Healthcare Data Points The nation’s largest industry • Represents more than 17% of GDP, predicted to exceed 23% by 2020 • Americans spend more than 5% of pre-tax income on healthcare. Lower income brackets pay 15% or more ($7,800 per capita health expenditures in 2008/2009) R
Slide 23: Trends in Inpatient Days and Outpatient Visits
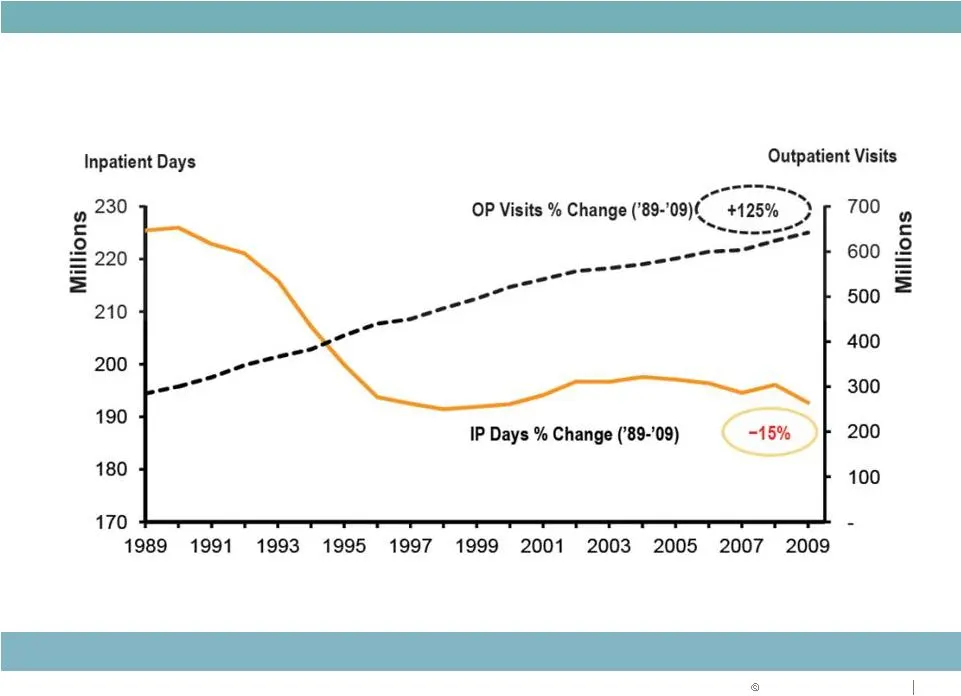
RELIABLE. ANSWERS . Source: AHA Trendwatch Chartbook, 2011 Trends in Inpatient Days and Outpatient Visits Outpatient demand drives occupancy in MOB’s
Slide 24: Trends in Medical Practice Ownership
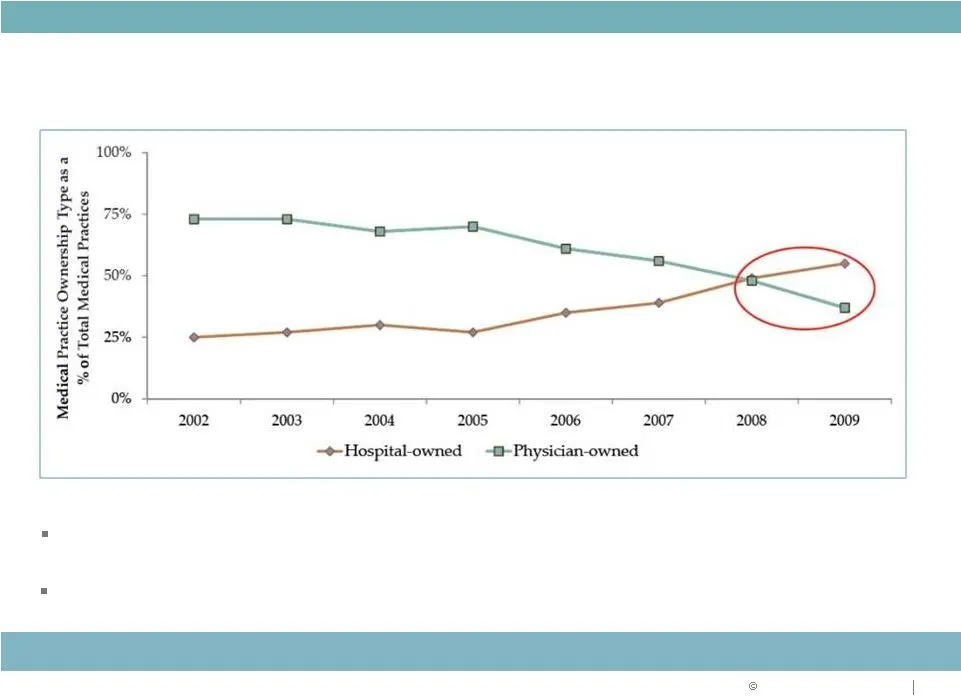
RELIABLE. ANSWERS . Trends in Medical Practice Ownership Hospitals are increasing physician employment to create efficiencies and to position themselves to become Accountable Care Organizations Source: MGMA Physician Compensation and Production Survey Report; Wall Street Journal, 10/8/10 Hospital-ow
Slide 25: Medical Office Portfolio at March 31, 2012
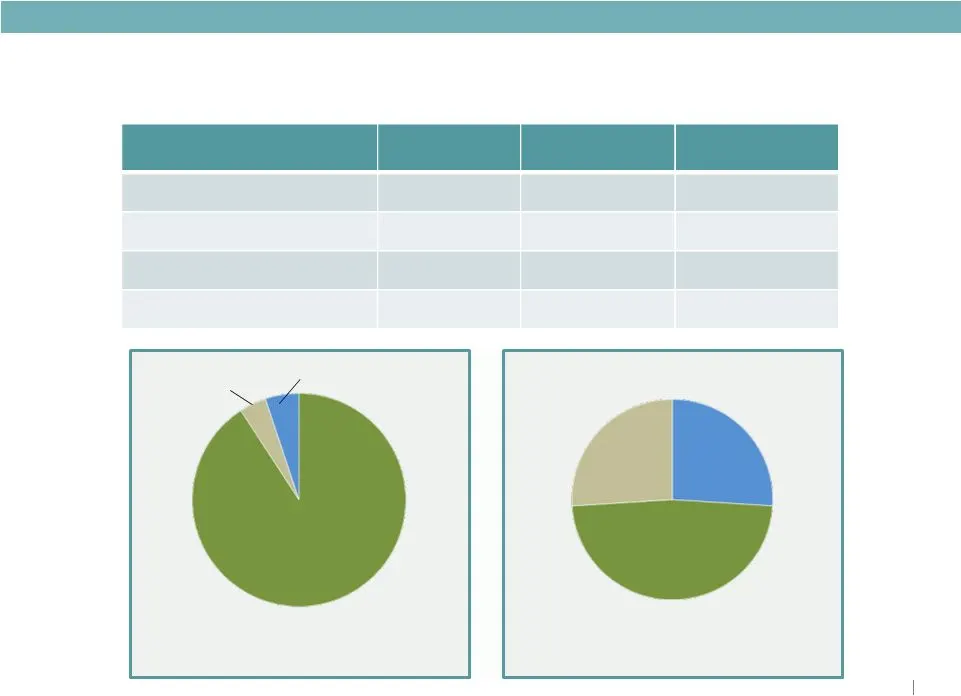
In-Service Under Development Total MEDICAL OFFICE STRATEGY Medical Office Portfolio at March 31, 2012 Properties Investment $ $695 M $145 M $840 M Square Feet 3.59 M 685 K 4.28 M Occupancy 91% 86% 90% © Duke Realty Corporation Local 15% Regional 55% National 30% Specialty Hospital 7% MOB On-Campus 8
Slide 26: Top Health System Relationships
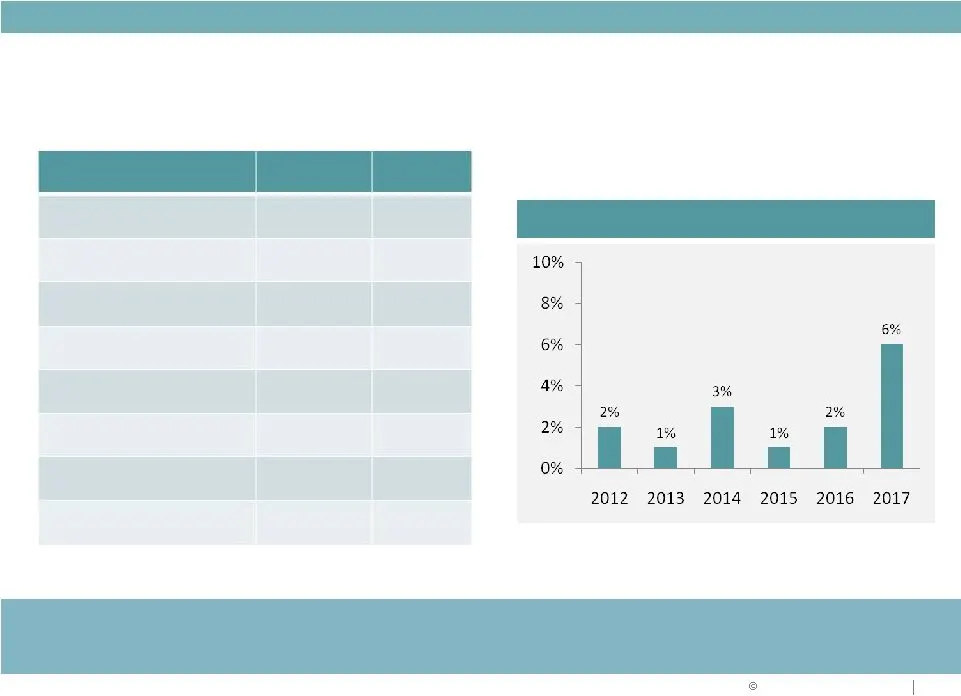
MEDICAL OFFICE STRATEGY Lease Maturity (% of Total Sq. Ft.) Health System Credit Rating ( Moody's) Rentable SF Top Health System Relationships High credit tenants and limited lease maturity result in stable and growing cash flow Baylor Health Care System Aa2 461,000 Ascension Health Aa1 367,000 Heal
Slide 27: Medical Office NOI and Portfolio Occupancy
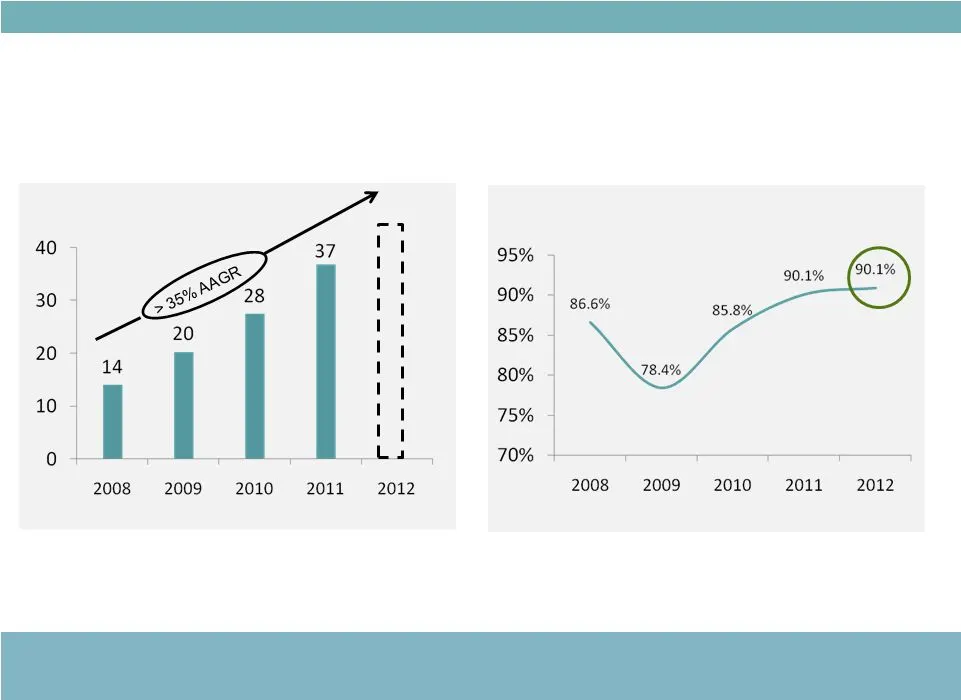
RELIABLE. ANSWERS . Medical Office NOI and Portfolio Occupancy Medical office business projected to reach or exceed 15% of total asset base by NOI in $millions Annual NOI Portfolio Occupancy *Projected for lease up of unstabilized and completed development assets * As of 3/31/2012
Slide 28: Recent Healthcare Developments
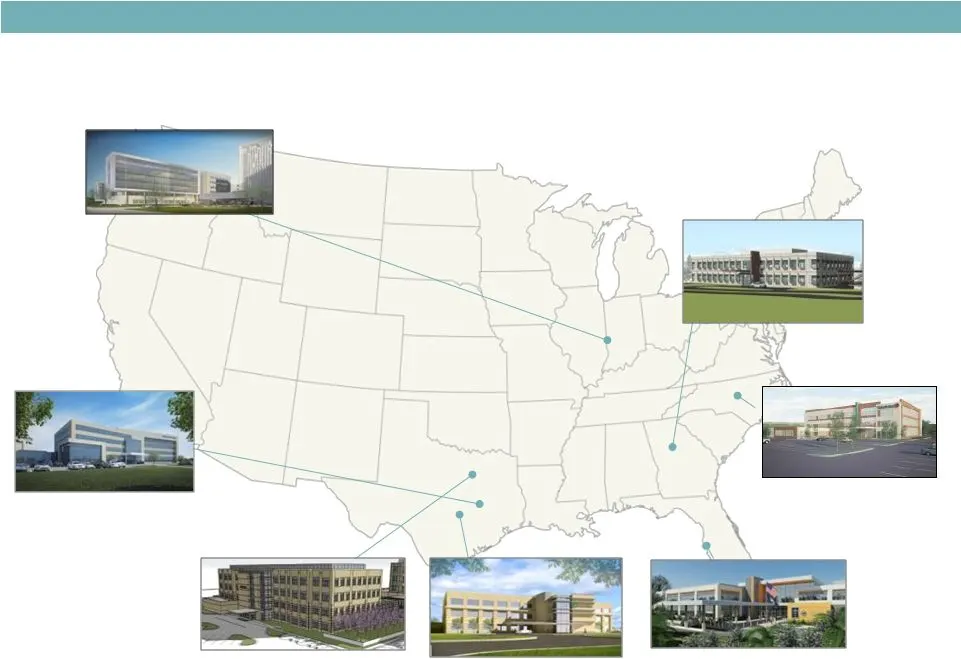
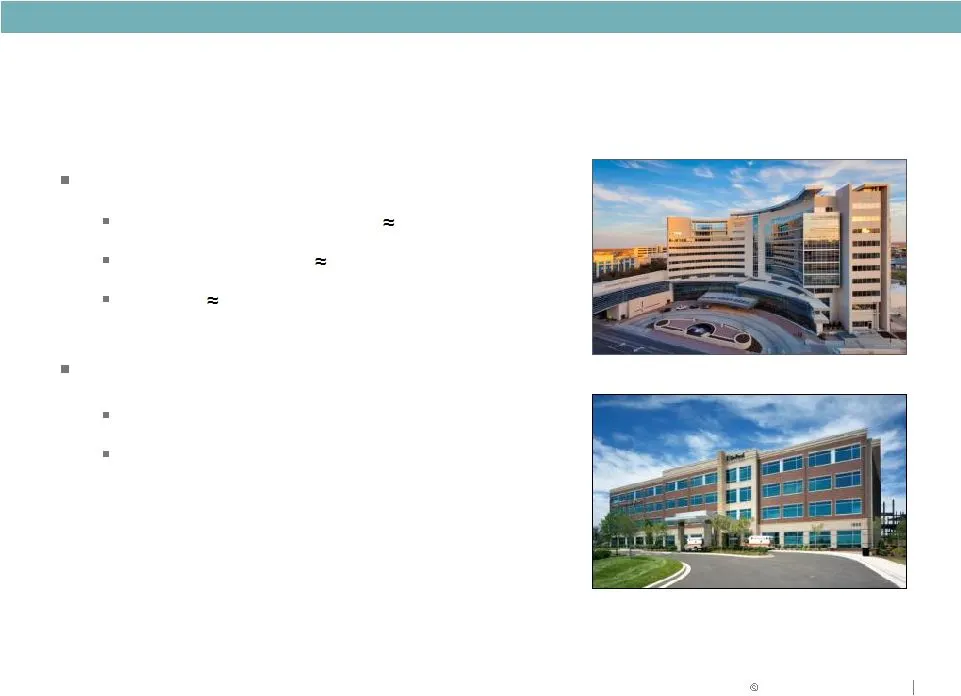
MEDICAL OFFICE STRATEGY Recent Healthcare Developments Baylor McKinney MOB I McKinney, TX 115,000 SF, 69% preleased WakeMed Raleigh Medical Park Raleigh, NC 86,000 SF, 58% preleased North Fulton MOB Atlanta, GA 52,000 SF, 52% preleased VA Tampa Tampa, FL 117,000 SF, 100% preleased Scott and White MO
Slide 29: Medical Office: Our Plan and Focus
MEDICAL OFFICE STRATEGY Our Plan Existing healthcare assets $840 Million New developments $200 Million in 2012 Acquire $200-$250 Million in 2012 and 2013 Our Focus Goal: Grow Medical Office to over $1.2 Billion by 2013 On-campus assets Major hospital system relationships

Slide 30: Capital Strategy and 2012 Guidance
CAPITAL STRATEGY AND 2012 GUIDANCE

Slide 31: Capital Strategy Focus
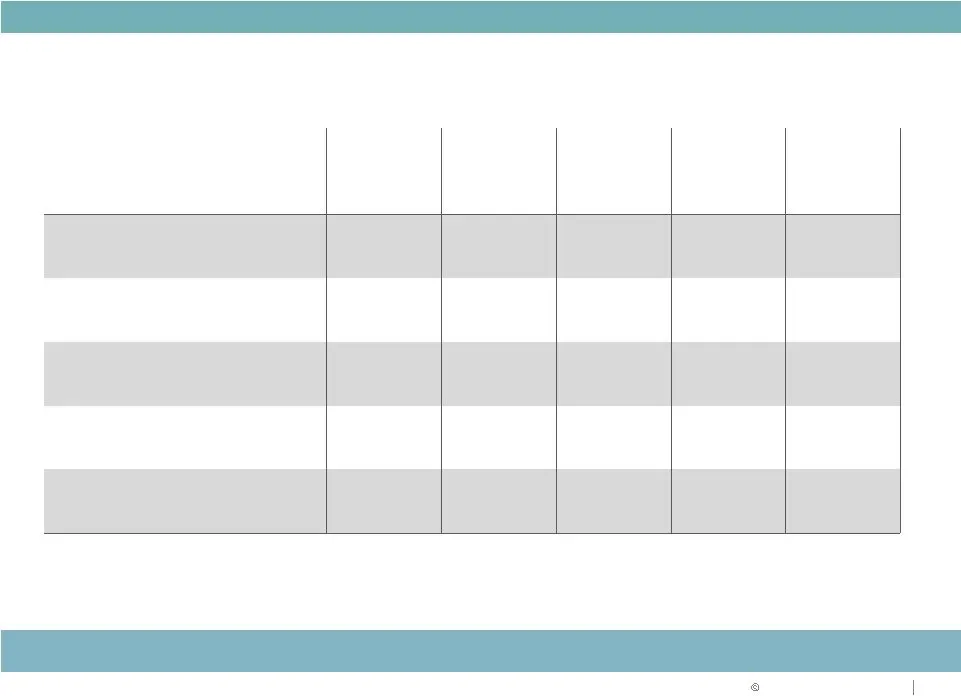
1 2 3 4 CAPITAL STRATEGY Capital Strategy Focus Reducing leverage Increasing coverage ratios Maintaining size and quality of unencumbered asset base Executing portfolio repositioning in alignment with capital strategy objectives Further improve balance sheet strength and ratings
Slide 32: Key Metrics & Goals
CAPITAL STRATEGY Key Metrics & Goals Actual Actual Actual 1Q Actual Goal Debt to Gross Assets 44.5% 46.3% 46.8% 47.3 45.0% Debt + Preferred to Gross Assets 54.9% 55.5% 55.6% 54.3 50.0% Fixed Charge Coverage Ratio 1.79 : 1 1.79 : 1 1.82 : 1 1.81:1 2.00 : 1 Debt/EBITDA 6.65 7.31 6.02* 6.56** < 6.00 De
Slide 33: Relative Performance of Duke Realty vs. All Comps
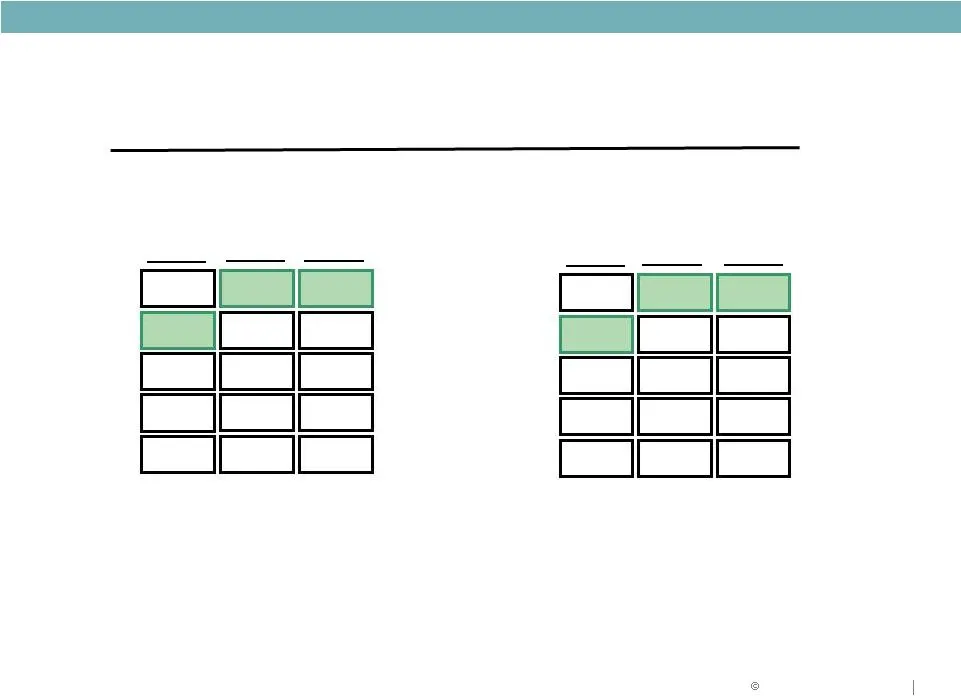
RELIABLE. ANSWERS . Relative Performance of Duke Realty vs. All Comps Notes 1. Comparables include BDN, CLI, DCT, EGP, FR, HIW, LRY, OFC, and PLD; PLD and AMB are included historically; figures shown on a market cap weighted basis 2. DRE stock price as of end of trading 5/31/12, @ $13.84 3. DRE perf
Slide 34: Duke Realty and Peers Barra Beta Analysis
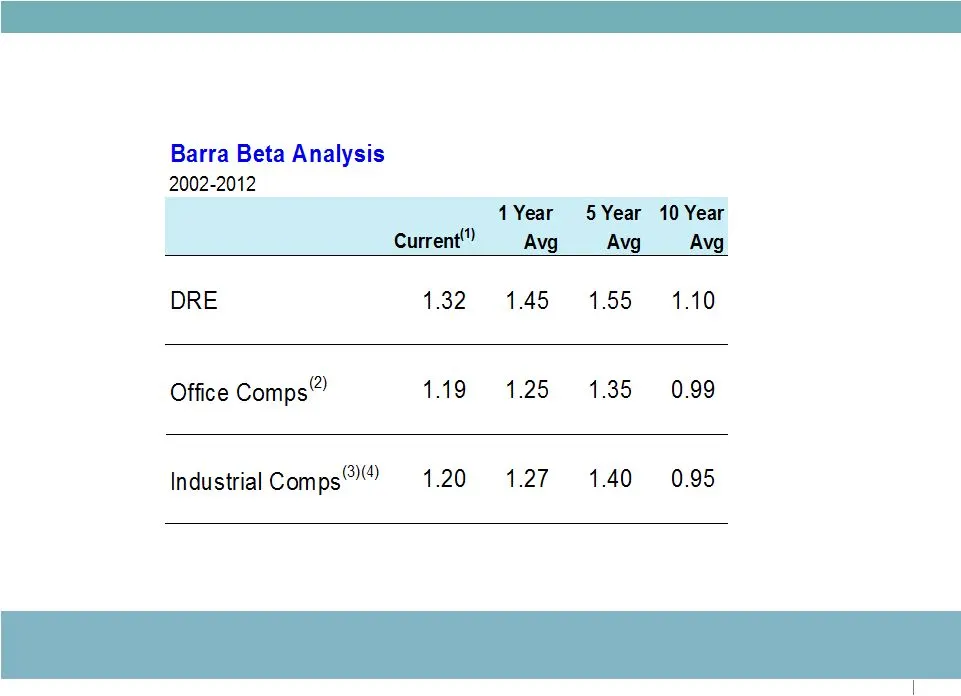
CAPITAL STRATEGY Notes 1. As of May 31, 2012 2. Includes LRY, HIW, CLI, BDN, and OFC 3. Includes PLD, FR, EGP, DCT, and LRY 4. DCT’s beta only available since its IPO. Barra began tracking DCT’s beta in Dec 2006 Duke Realty and Peers Barra Beta Analysis Beta Trends are Slowly Improving Consistent wi
Slide 35: Executing on capital strategy objectives
CAPITAL STRATEGY Executing on capital strategy objectives CAPITAL SOURCE YTD TOTAL Common Stock $230 - $575 $311 - $150 $1,266 Preferred Stock - $300 - - - - $300 Unsecured Debt $300 $325 $500 $250 - $300 $1,675 Secured Debt - - $270 - - - $270 Asset Dispositions $785 $475 $300 $533 $1,650 $65 $3,80
Slide 36: Strong support from high quality fixed income investors
CAPITAL STRATEGY Strong support from high quality fixed income investors $300 million 10 year senior notes offering T+ 280 (coupon of 4.375%) Significantly oversubscribed Lowest coupon in 10 year senior notes execution ever 60% of top 30 investors new $300,000,000 4.375% Senior Notes due June 15, 20
Slide 37: Liquidity Position
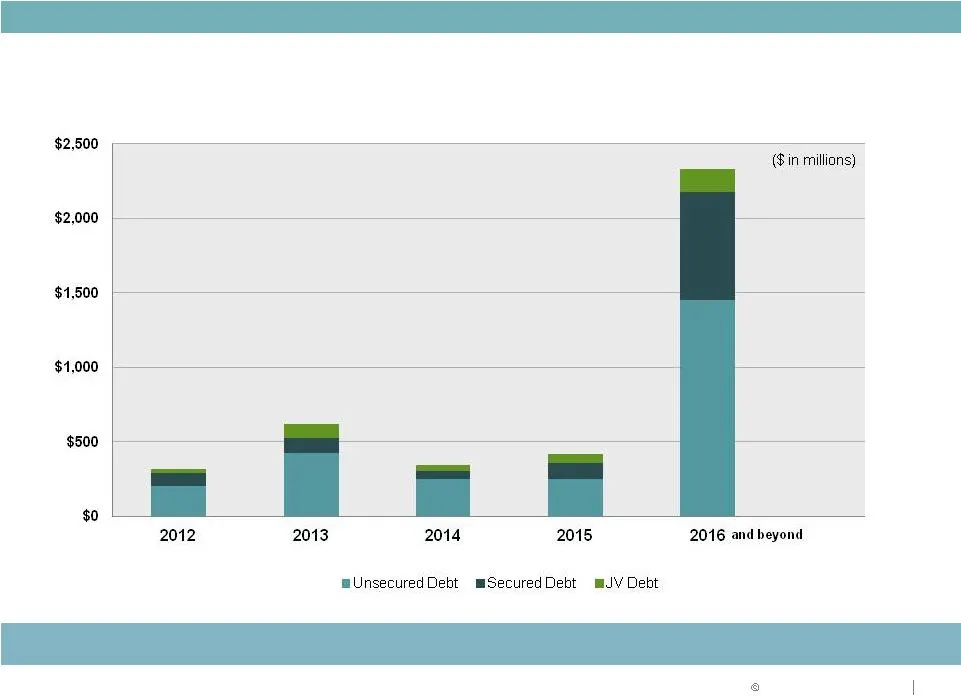
CAPITAL STRATEGY Liquidity Position Manageable debt maturities
Slide 38

Slide 39: Why Duke Realty?
MEDICAL OFFICE STRATEGY WHY DUKE REALTY? Quality portfolio improving with asset strategy Solid balance sheet improving with capital strategy Unmatched ability to execute on daily operations Development capabilities in place with existing land bank Talent and leadership depth to execute Delivering on

Slide 40: Forward-Looking Statement
RELIABLE. ANSWERS . Forward-Looking Statement This slide presentation contains statements that constitute “forward-looking statements” within the meaning of the Securities Act of 1933 and the Securities Exchange Act of 1934 as amended by the Private Securities Litigation Reform Act of 1995. These fo
Source: SEC EDGAR · 8-K filed Jun 12, 2012
More decks from Duke Realty Corporation
 Merger or Acquisition (June 2022)14 slides · Jun 13, 2022
 Investor Presentation (June 2021)58 slides · Jun 7, 2021
 Investor Presentation (May 2021)44 slides · May 10, 2021
 Investor Presentation (February 2021)58 slides · Feb 22, 2021
 NAREIT REITworld Virtual Investor Conference 202056 slides · Nov 16, 2020
 B of A Securities 2020 Global Real Estate Conference56 slides · Sep 15, 2020