Heartland Financial USA — Q1 2023 Earnings Presentation
29 slides from Heartland Financial USA's earnings presentation, Apr 24, 2023
Slide 1: We see Growth. 1st Quarter 2023 Financials
We see Growth. Ist Quarter 2023 Financials
Slide 2: Safe Harbor
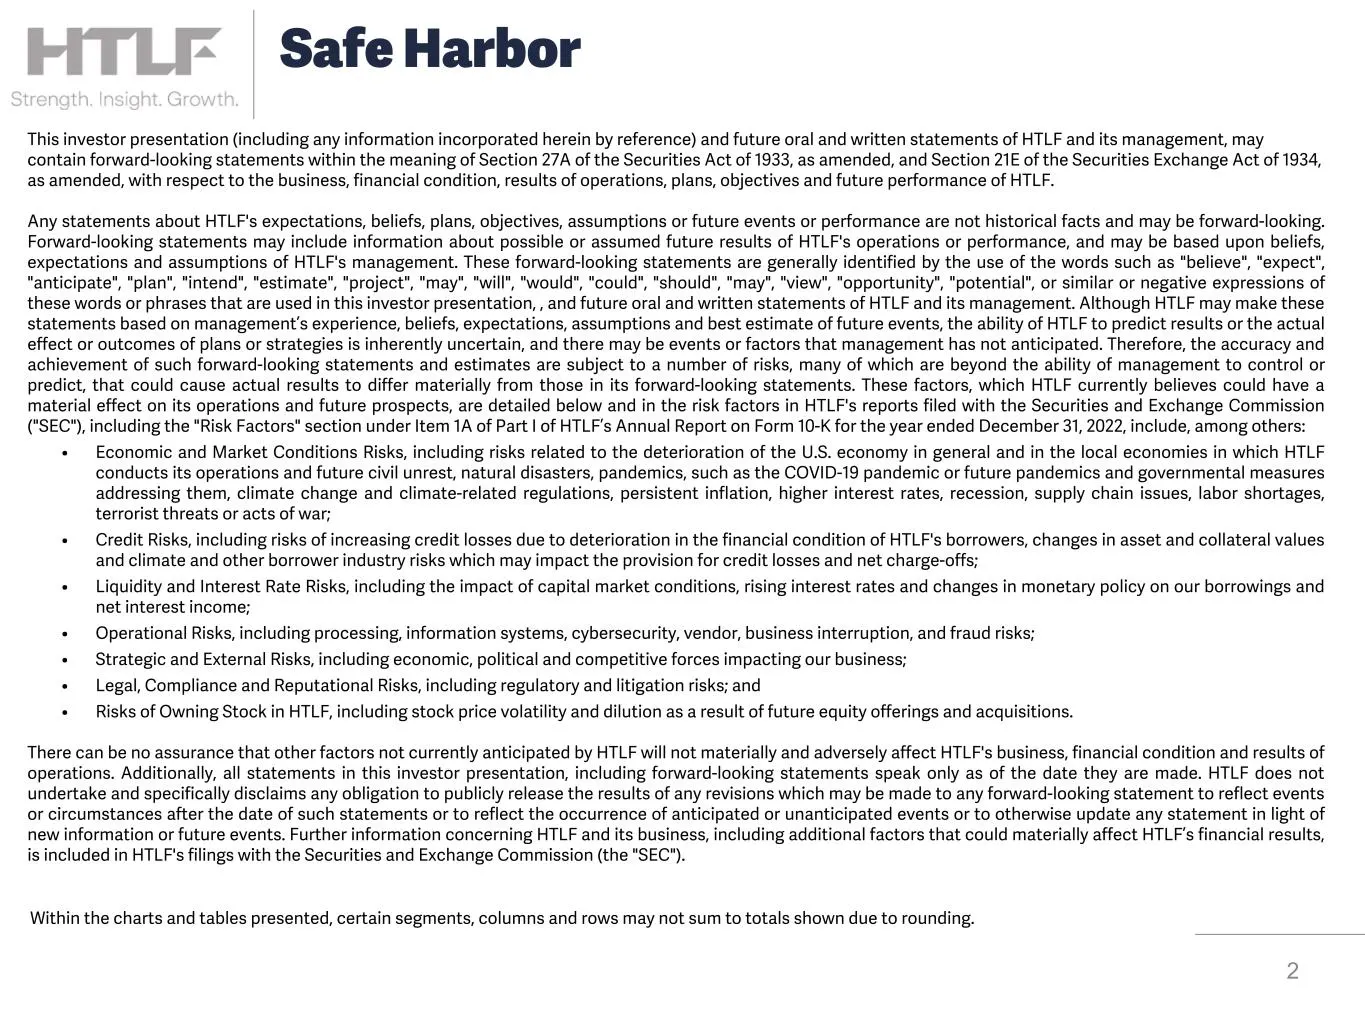
2 Safe Harbor Within the charts and tables presented, certain segments, columns and rows may not sum to totals shown due to rounding. This investor presentation (including any information incorporated herein by reference) and future oral and written statements of HTLF and its management, may contain
Slide 3: 1Q 2023 Highlights
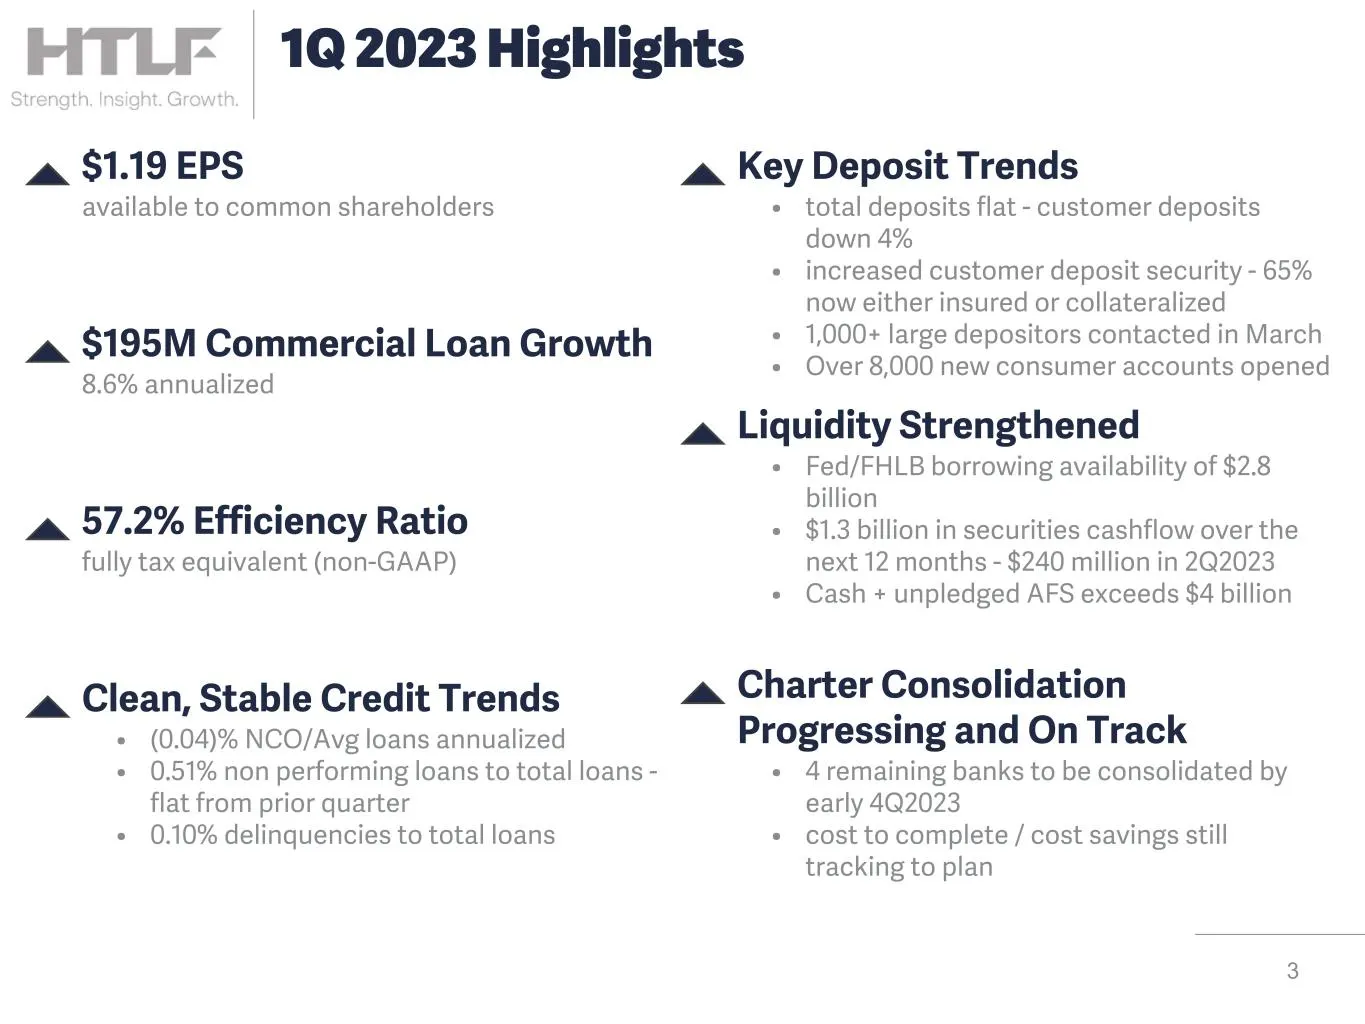
3 1Q 2023 Highlights Liquidity Strengthened • Fed/FHLB borrowing availability of $2.8 billion • $1.3 billion in securities cashflow over the next 12 months - $240 million in 2Q2023 • Cash + unpledged AFS exceeds $4 billion $1.19 EPS available to common shareholders Key Deposit Trends • total deposit
Slide 4: Liquidity and deposit actions
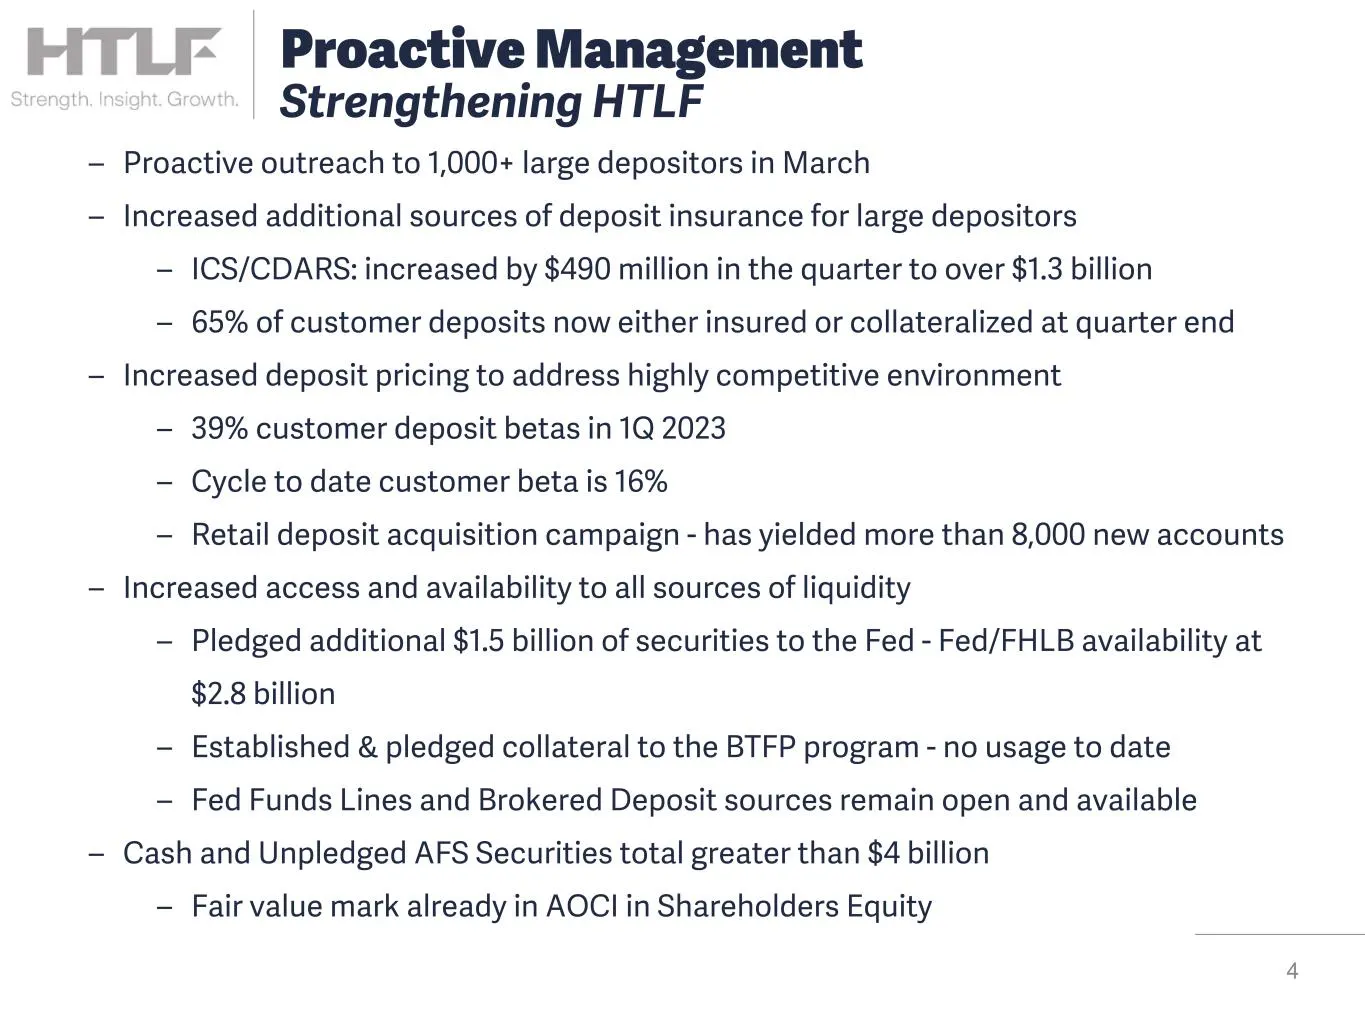
4 – Proactive outreach to 1,000+ large depositors in March – Increased additional sources of deposit insurance for large depositors – ICS/CDARS: increased by $490 million in the quarter to over $1.3 billion – 65% of customer deposits now either insured or collateralized at quarter end – Increased de
Slide 5: Diversified and Stable Deposit Base
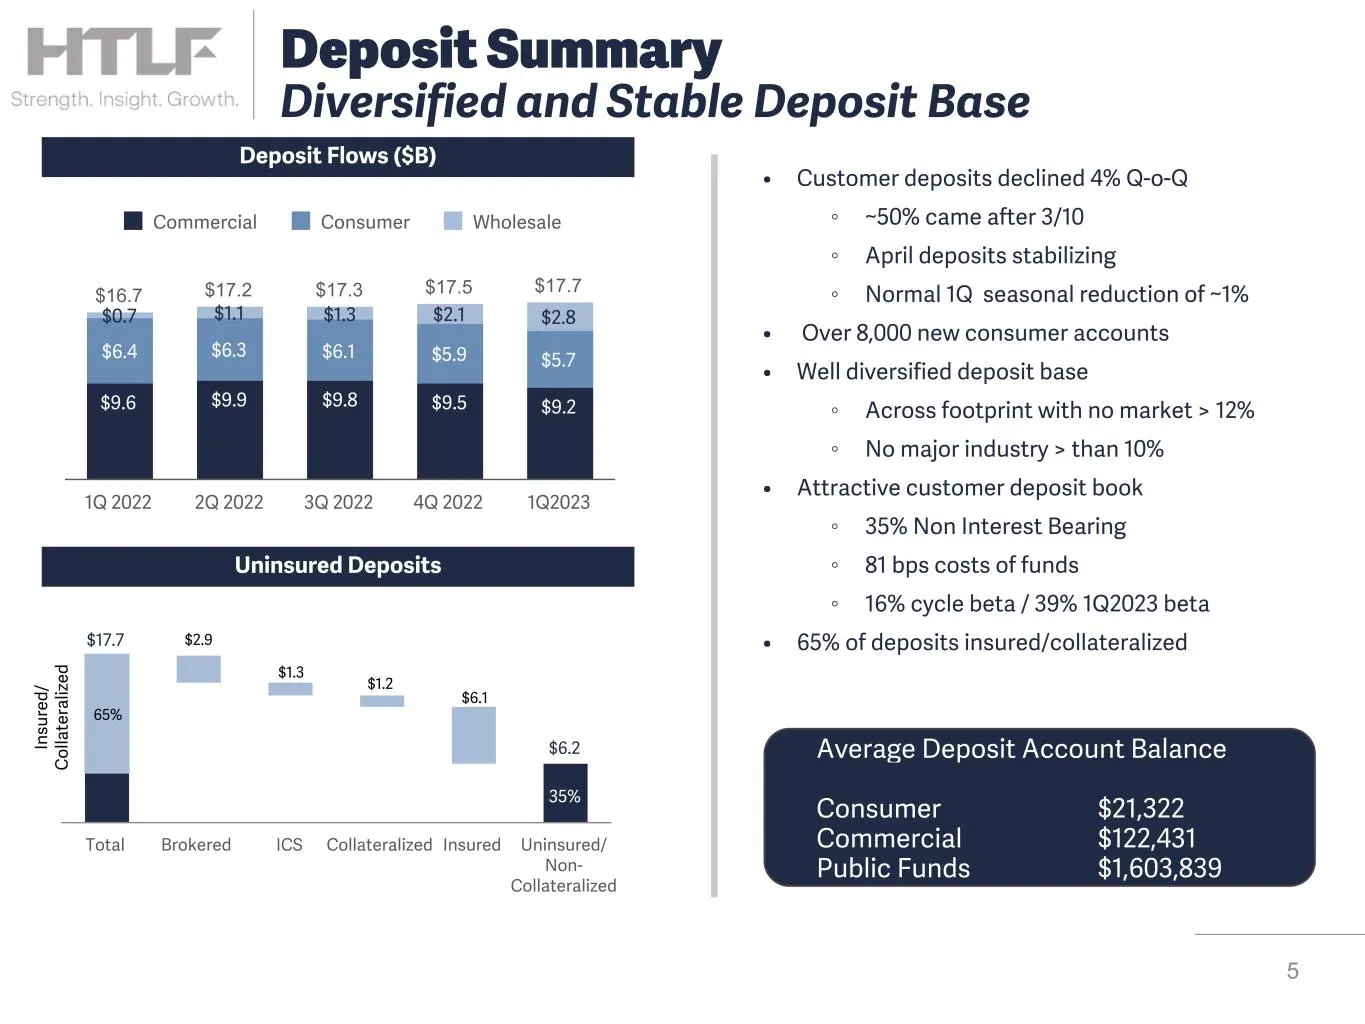
Deposit Flows ($B) 5 Deposit Summary Diversified and Stable Deposit Base Uninsured Deposits $17.7 $6.2 35% Total Brokered ICS Collateralized Insured Uninsured/ Non- Collateralized In su re d/ C ol la te ra liz ed $2.9 65% $1.3 $1.2 $6.1 $16.7 $17.2 $17.3 $17.5 $17.7 $9.6 $9.9 $9.8 $9.5 $9.2 $6.4 $6.
Slide 6: Deposit Diversification
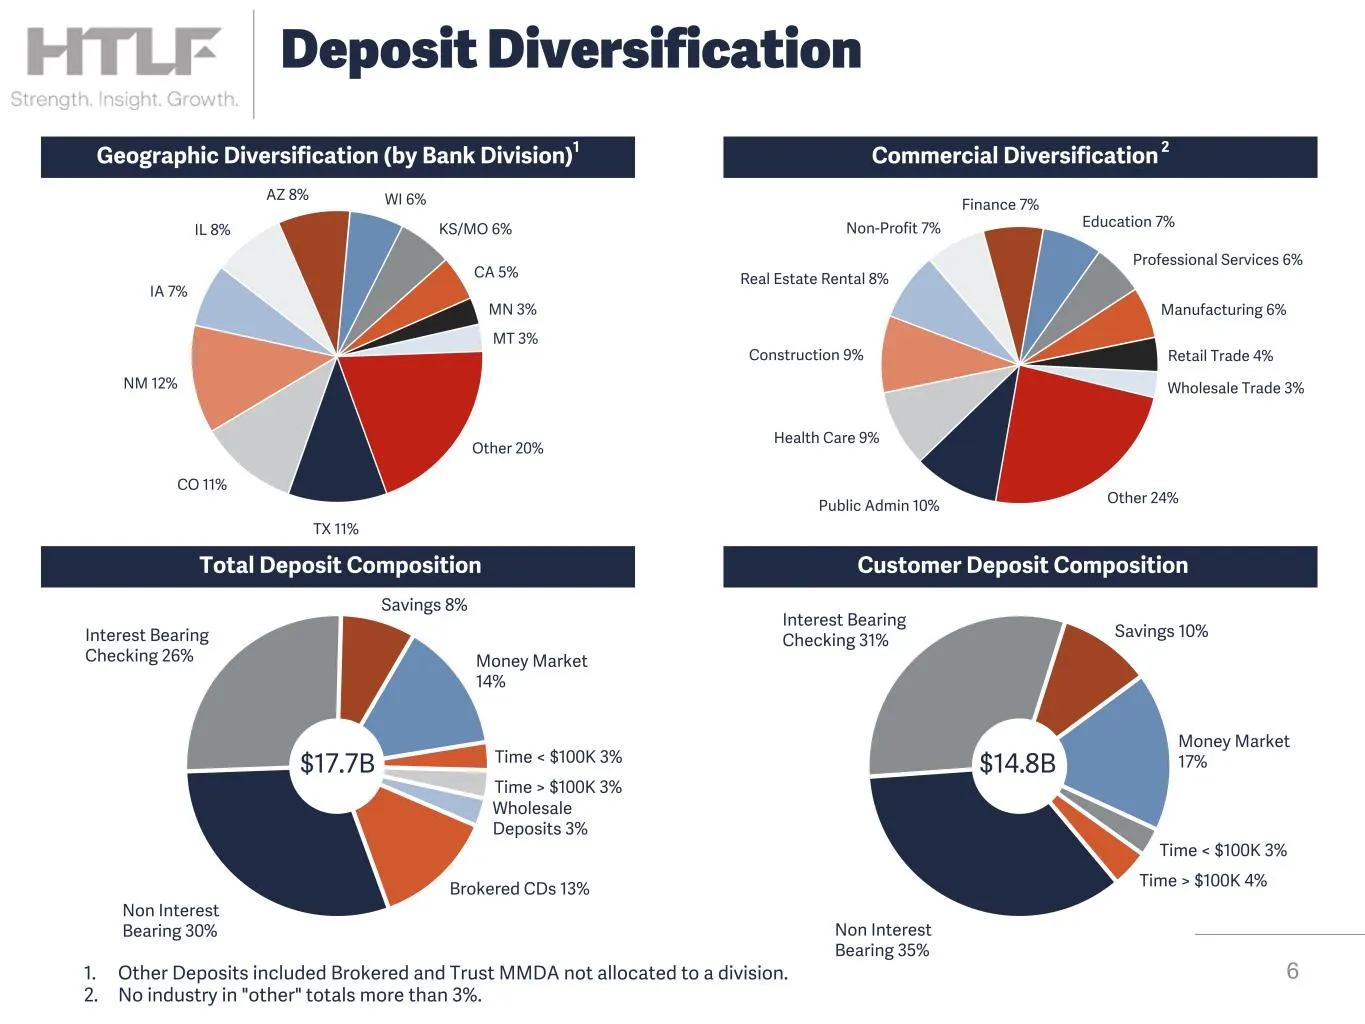
Non Interest Bearing 30% Interest Bearing Checking 26% Savings 8% Money Market 14% Time < $100K 3% Time > $100K 3% Wholesale Deposits 3% Brokered CDs 13% Geographic Diversification (by Bank Division)1 Commercial Diversification 2 6 Deposit Diversification Total Deposit Composition Public Admin 10% H
Slide 7: 1Q2023 Cost of Funds & Betas
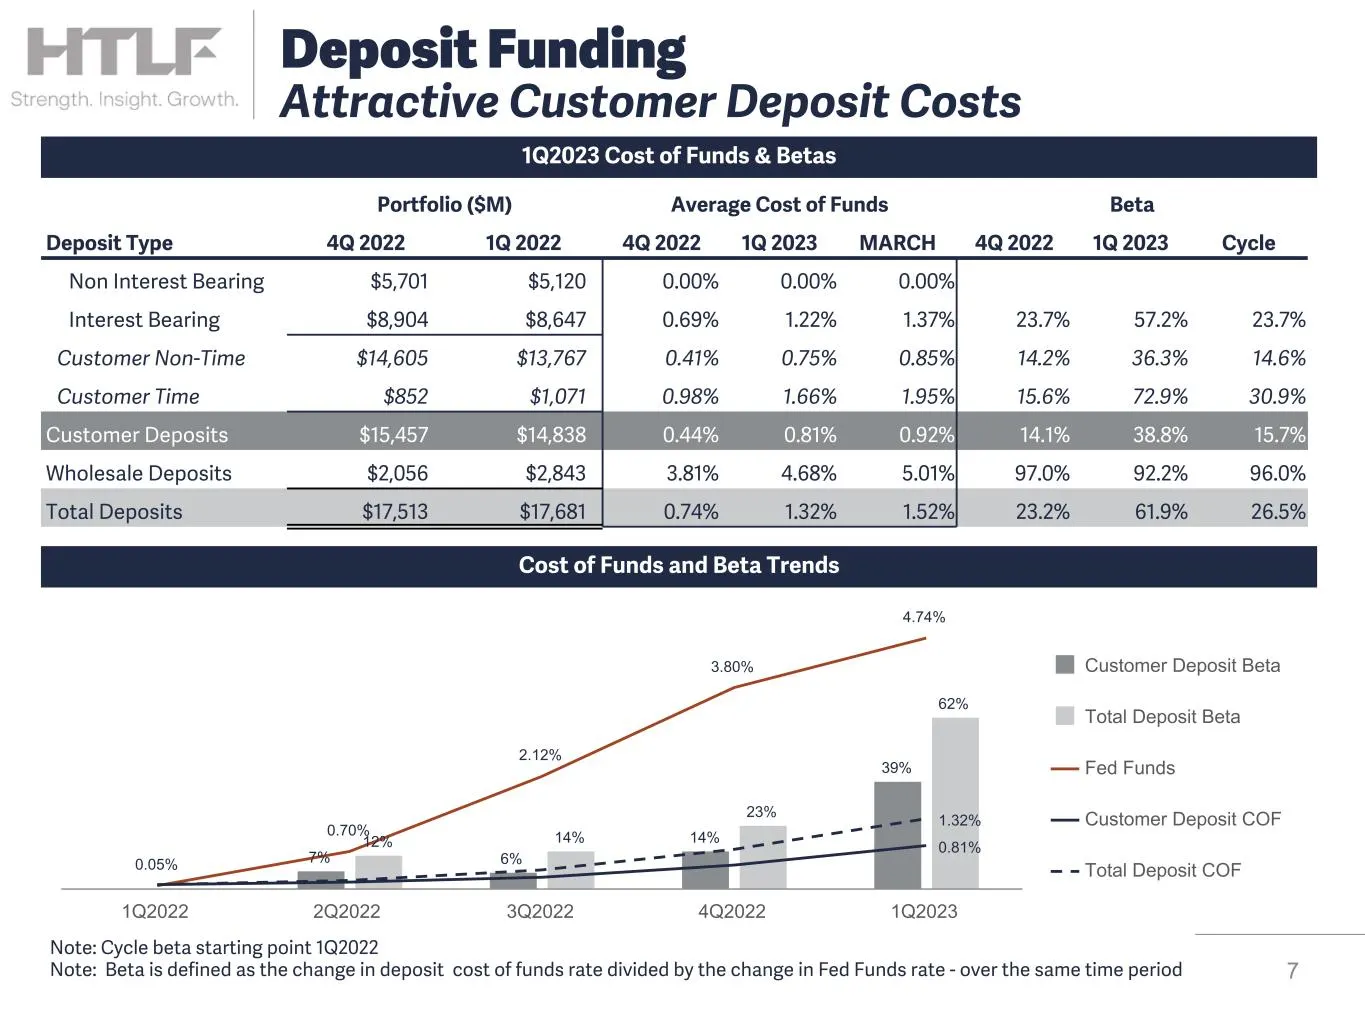
1Q2023 Cost of Funds & Betas 7 Deposit Funding Attractive Customer Deposit Costs Portfolio ($M) Average Cost of Funds Beta Deposit Type 4Q 2022 1Q 2022 4Q 2022 1Q 2023 MARCH 4Q 2022 1Q 2023 Cycle Non Interest Bearing $5,701 $5,120 0.00 % 0.00 % 0.00 % Interest Bearing $8,904 $8,647 0.69 % 1.22 % 1.3
Slide 8: Highly Liquid Balance Sheet
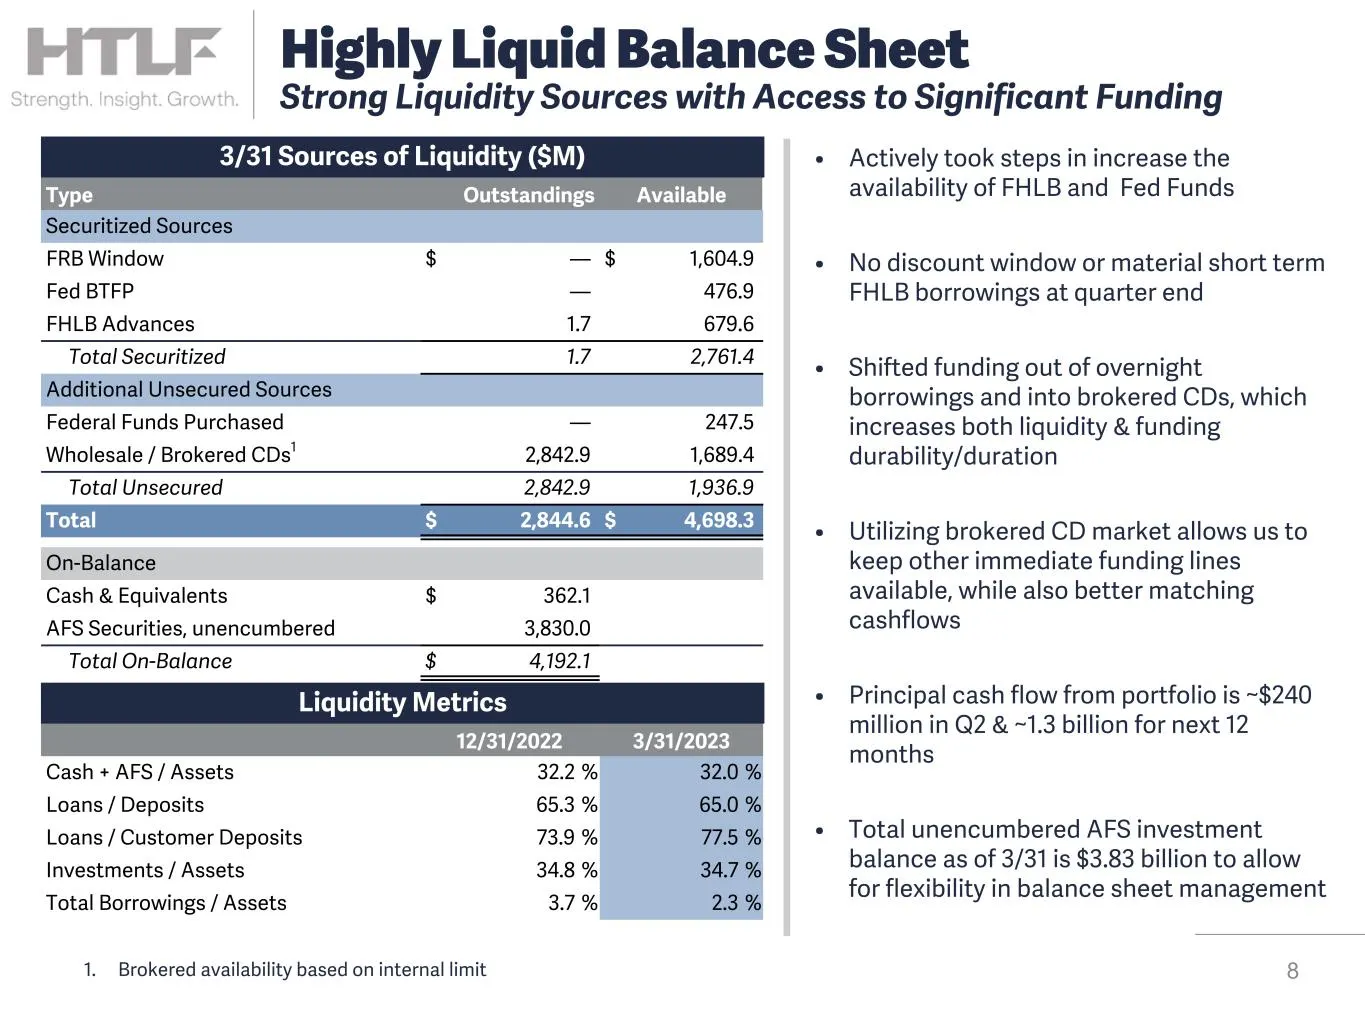
• Actively took steps in increase the availability of FHLB and Fed Funds • No discount window or material short term FHLB borrowings at quarter end • Shifted funding out of overnight borrowings and into brokered CDs, which increases both liquidity & funding durability/duration • Utilizing brokered C
Slide 9: Investment Portfolio
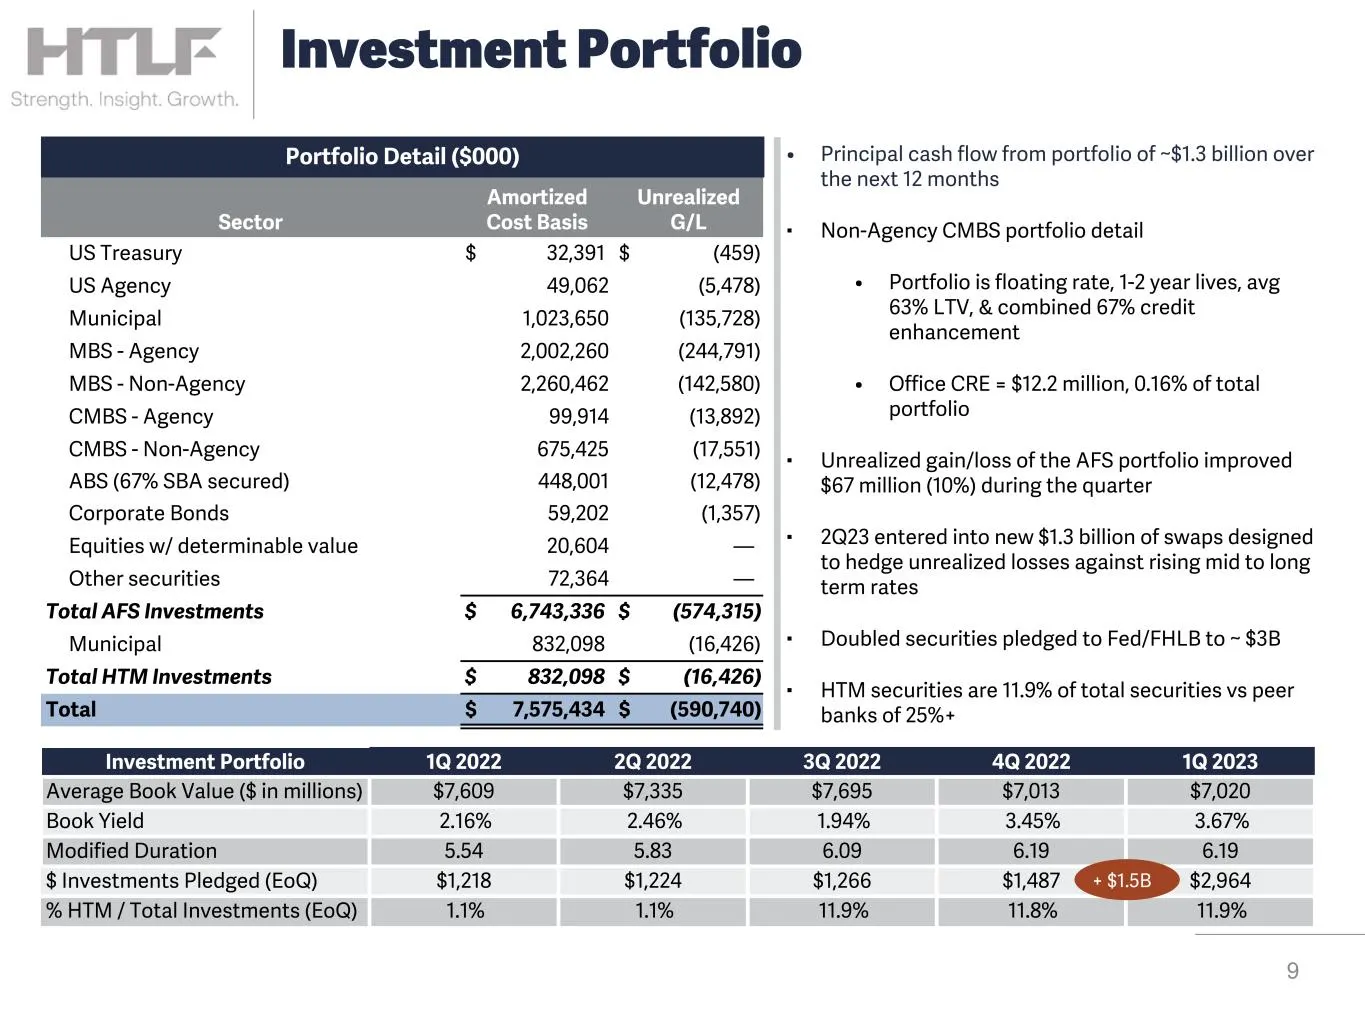
Investment Portfolio 1Q 2022 2Q 2022 3Q 2022 4Q 2022 1Q 2023 Average Book Value ($ in millions) $7,609 $7,335 $7,695 $7,013 $7,020 Book Yield 2.16% 2.46% 1.94% 3.45% 3.67% Modified Duration 5.54 5.83 6.09 6.19 6.19 $ Investments Pledged (EoQ) $1,218 $1,224 $1,266 $1,487 $2,964 % HTM / Total Investme
Slide 10: Diversified Loan Portfolio Across both Product and Footprint
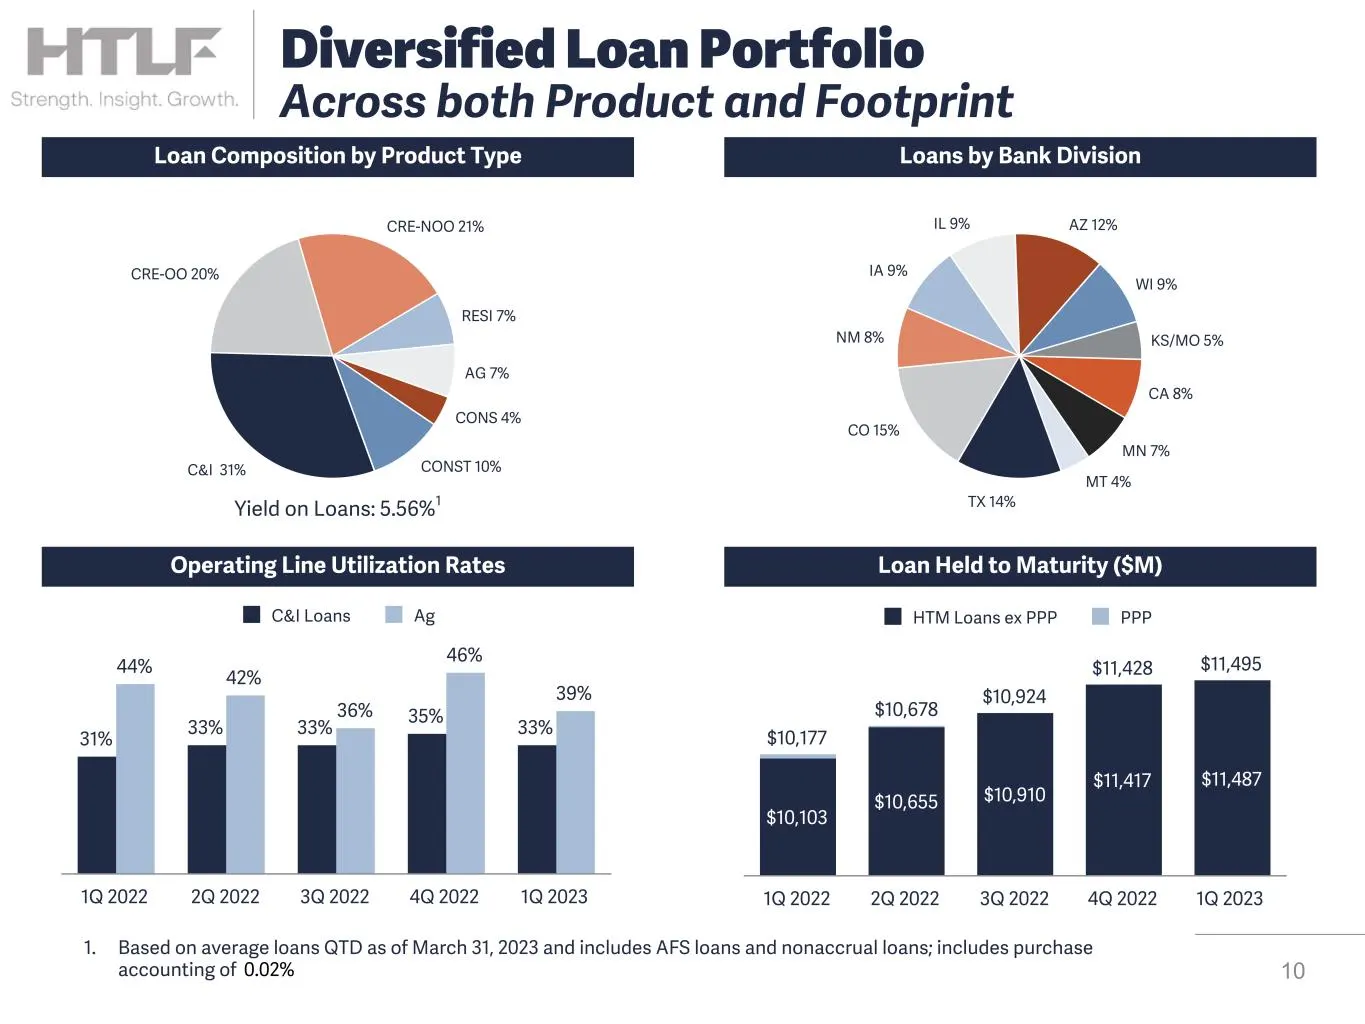
Loan Composition by Product Type Loans by Bank Division Loan Held to Maturity ($M)Operating Line Utilization Rates C&I 31% CRE-OO 20% CRE-NOO 21% RESI 7% AG 7% CONS 4% CONST 10% Yield on Loans: 5.56%1 TX 14% CO 15% NM 8% IA 9% IL 9% AZ 12% WI 9% KS/MO 5% CA 8% MN 7% MT 4% 31% 33% 33% 35% 33% 44% 42%
Slide 11: CRE Non Owner Occupied Portfolio
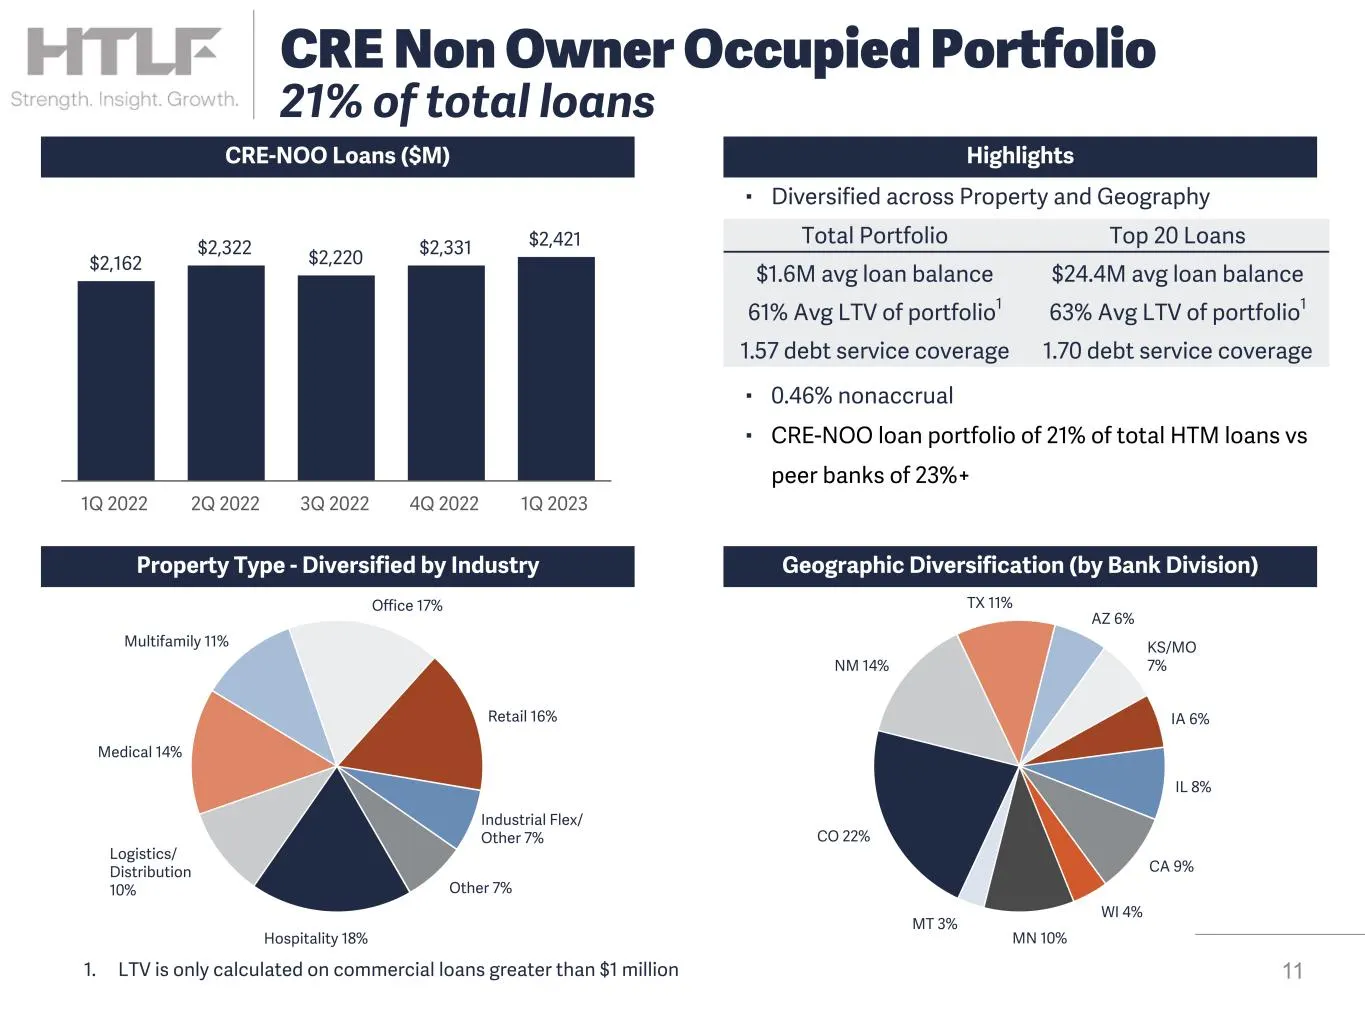
Highlights Hospitality 18% Logistics/ Distribution 10% Medical 14% Multifamily 11% Office 17% Retail 16% Industrial Flex/ Other 7% Other 7% CO 22% NM 14% TX 11% AZ 6% KS/MO 7% IA 6% IL 8% CA 9% WI 4% MN 10% MT 3% ▪ Diversified across Property and Geography ▪ 0.46% nonaccrual ▪ CRE-NOO loan portfolio
Slide 12: CRE Non Owner Occupied - Office
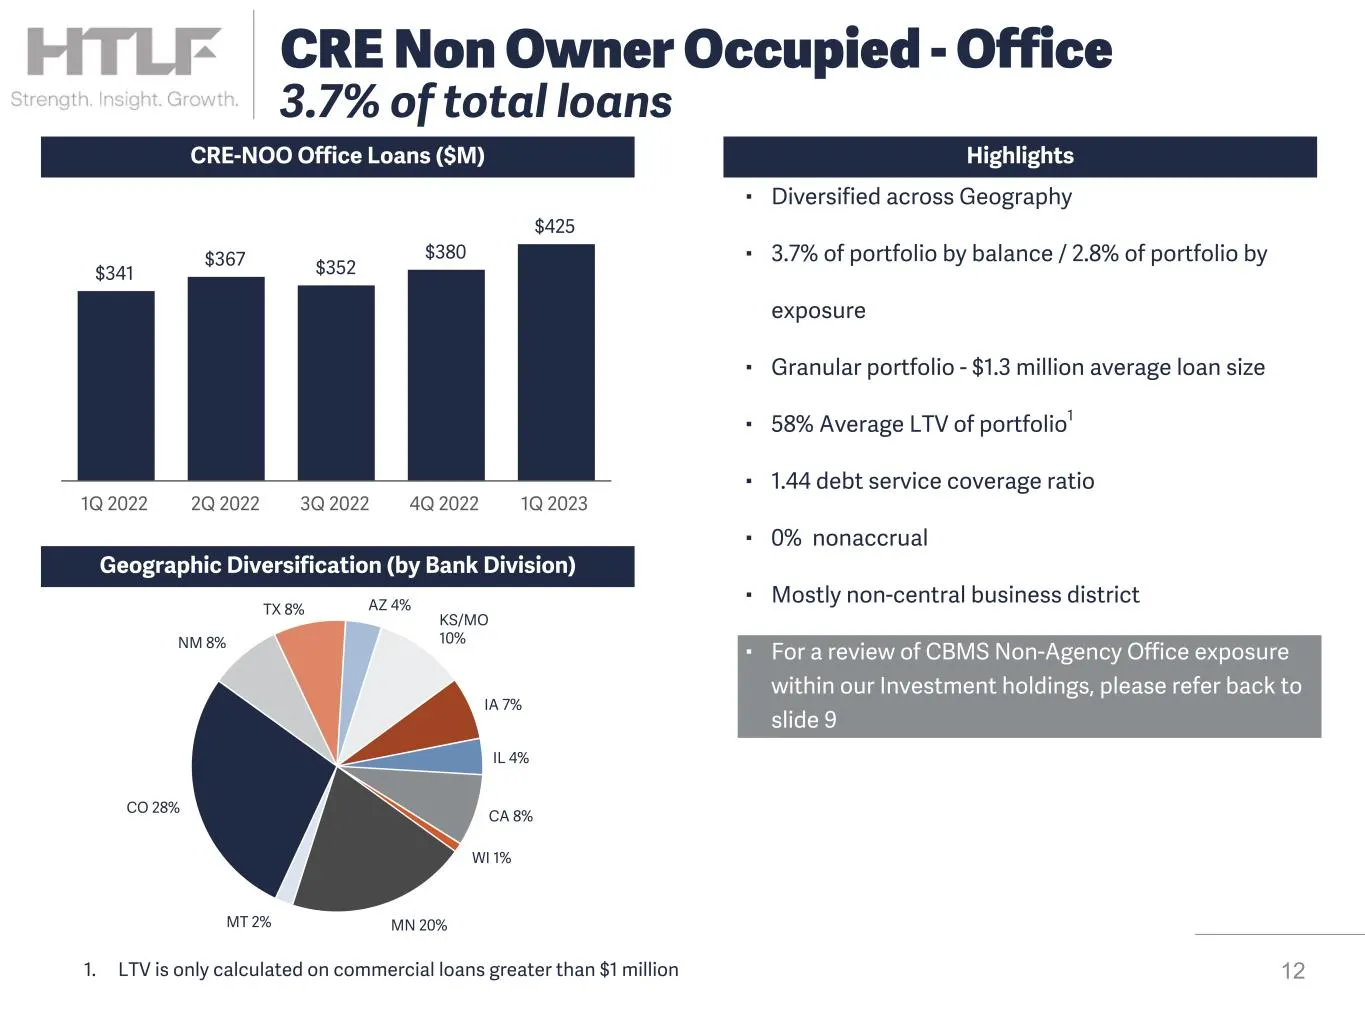
▪ Diversified across Geography ▪ 3.7% of portfolio by balance / 2.8% of portfolio by exposure ▪ Granular portfolio - $1.3 million average loan size ▪ 58% Average LTV of portfolio1 ▪ 1.44 debt service coverage ratio ▪ 0% nonaccrual ▪ Mostly non-central business district ▪ For a review of CBMS Non-Age
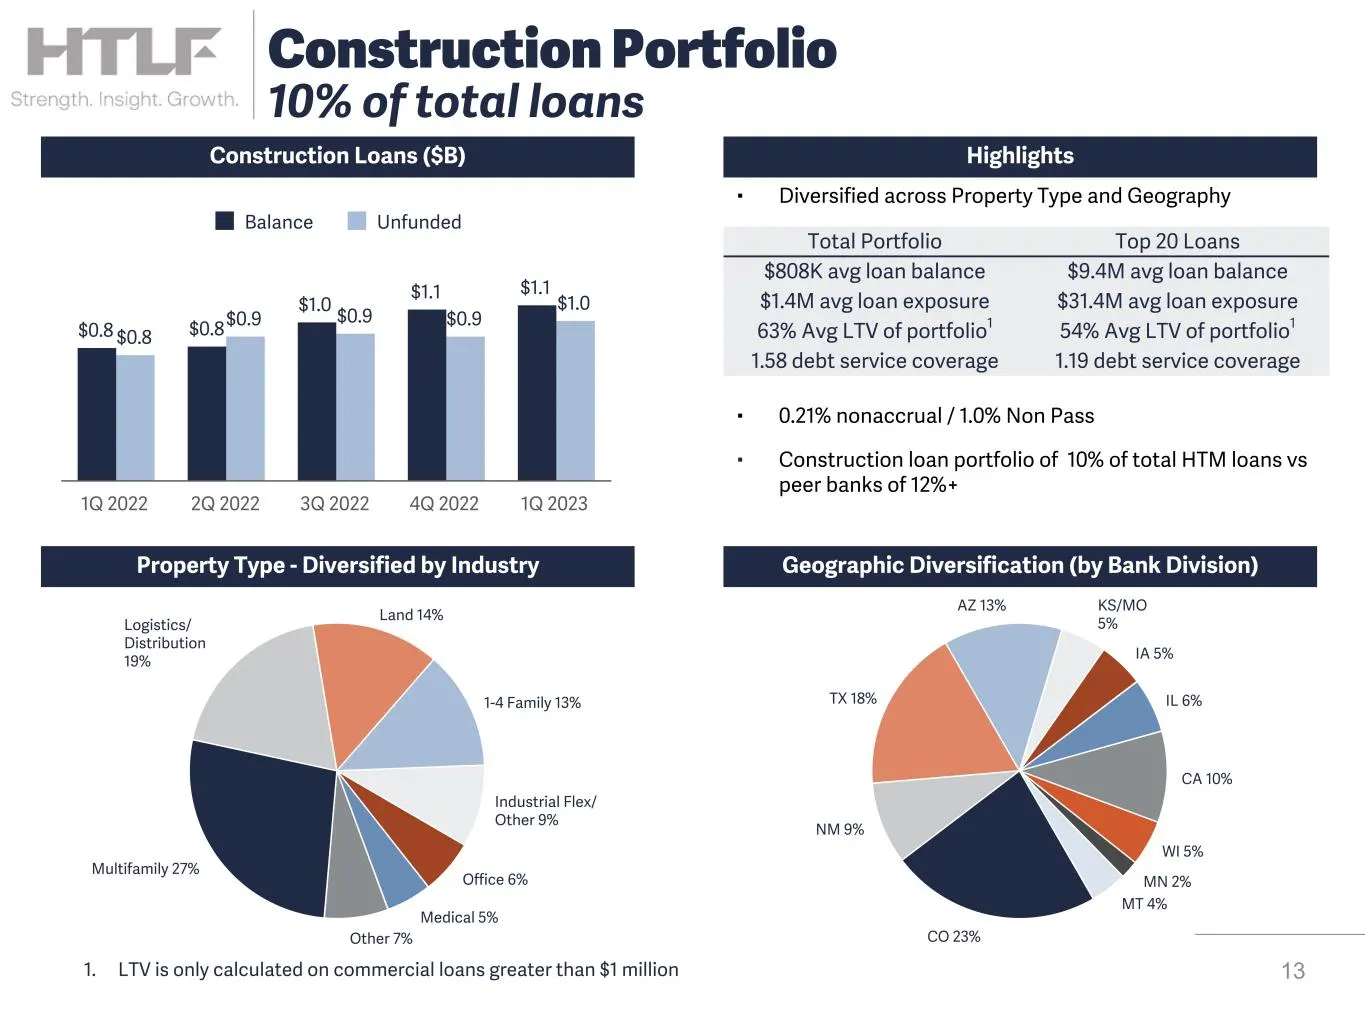
Slide 13: Construction Portfolio
13 Construction Portfolio 10% of total loans CO 23% NM 9% TX 18% AZ 13% KS/MO 5% IA 5% IL 6% CA 10% WI 5% MN 2% MT 4% Multifamily 27% Logistics/ Distribution 19% Land 14% 1-4 Family 13% Industrial Flex/ Other 9% Office 6% Medical 5% Other 7% ▪ Diversified across Property Type and Geography ▪ 0.21% n
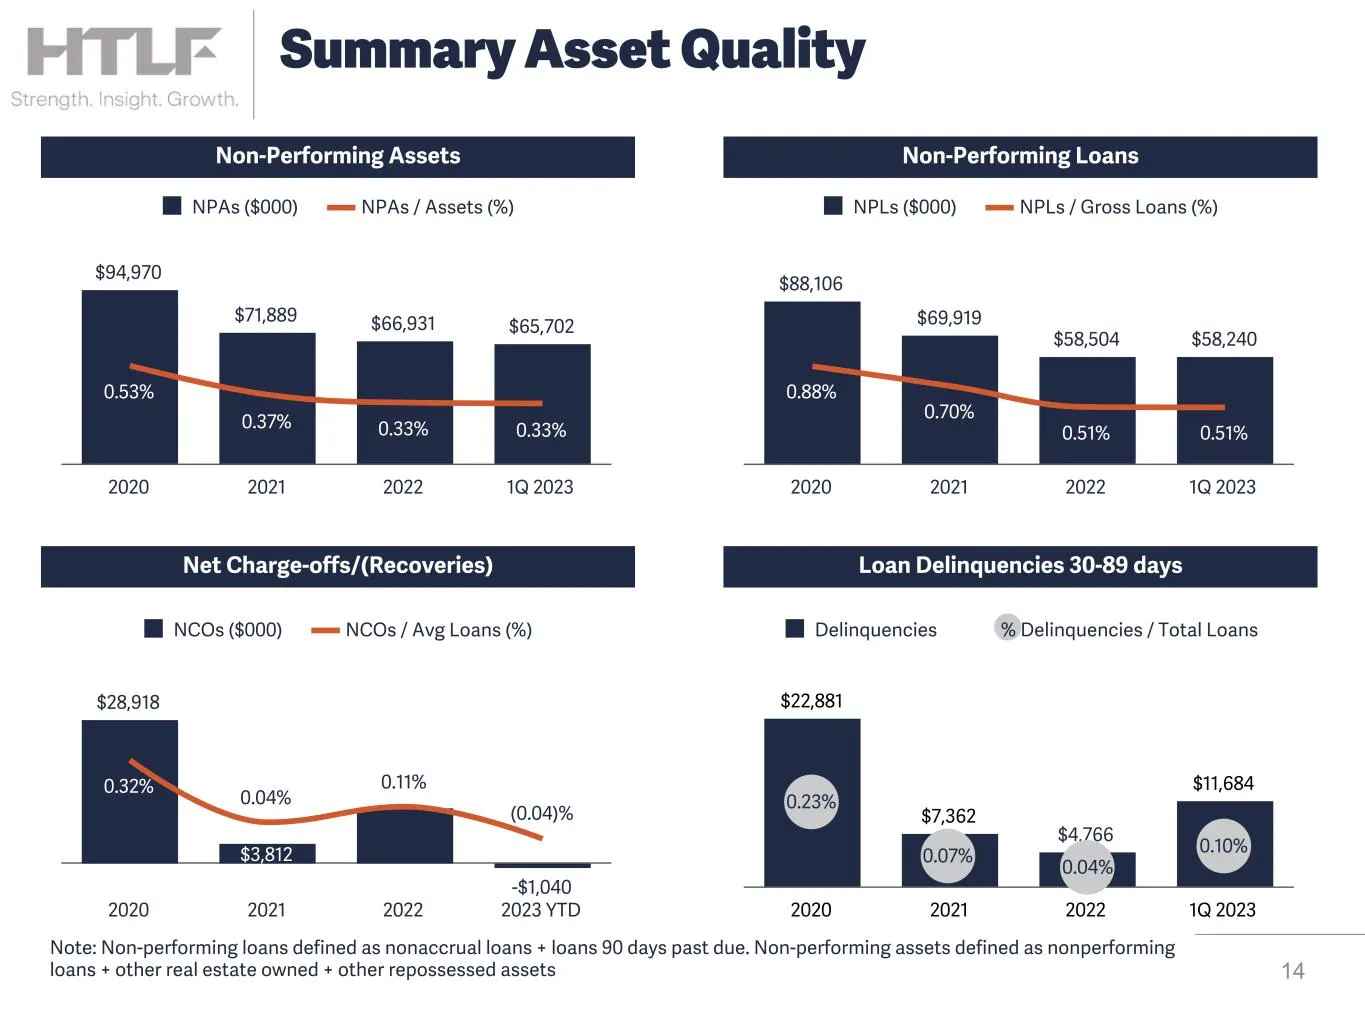
Slide 14: Summary Asset Quality
$22,881 $7,362 $4,766 $11,684 Delinquencies % Delinquencies / Total Loans 2020 2021 2022 1Q 2023 Non-Performing Assets Non-Performing Loans Net Charge-offs/(Recoveries) Loan Delinquencies 30-89 days $94,970 $71,889 $66,931 $65,702 0.53% 0.37% 0.33% 0.33% NPAs ($000) NPAs / Assets (%) 2020 2021 2022
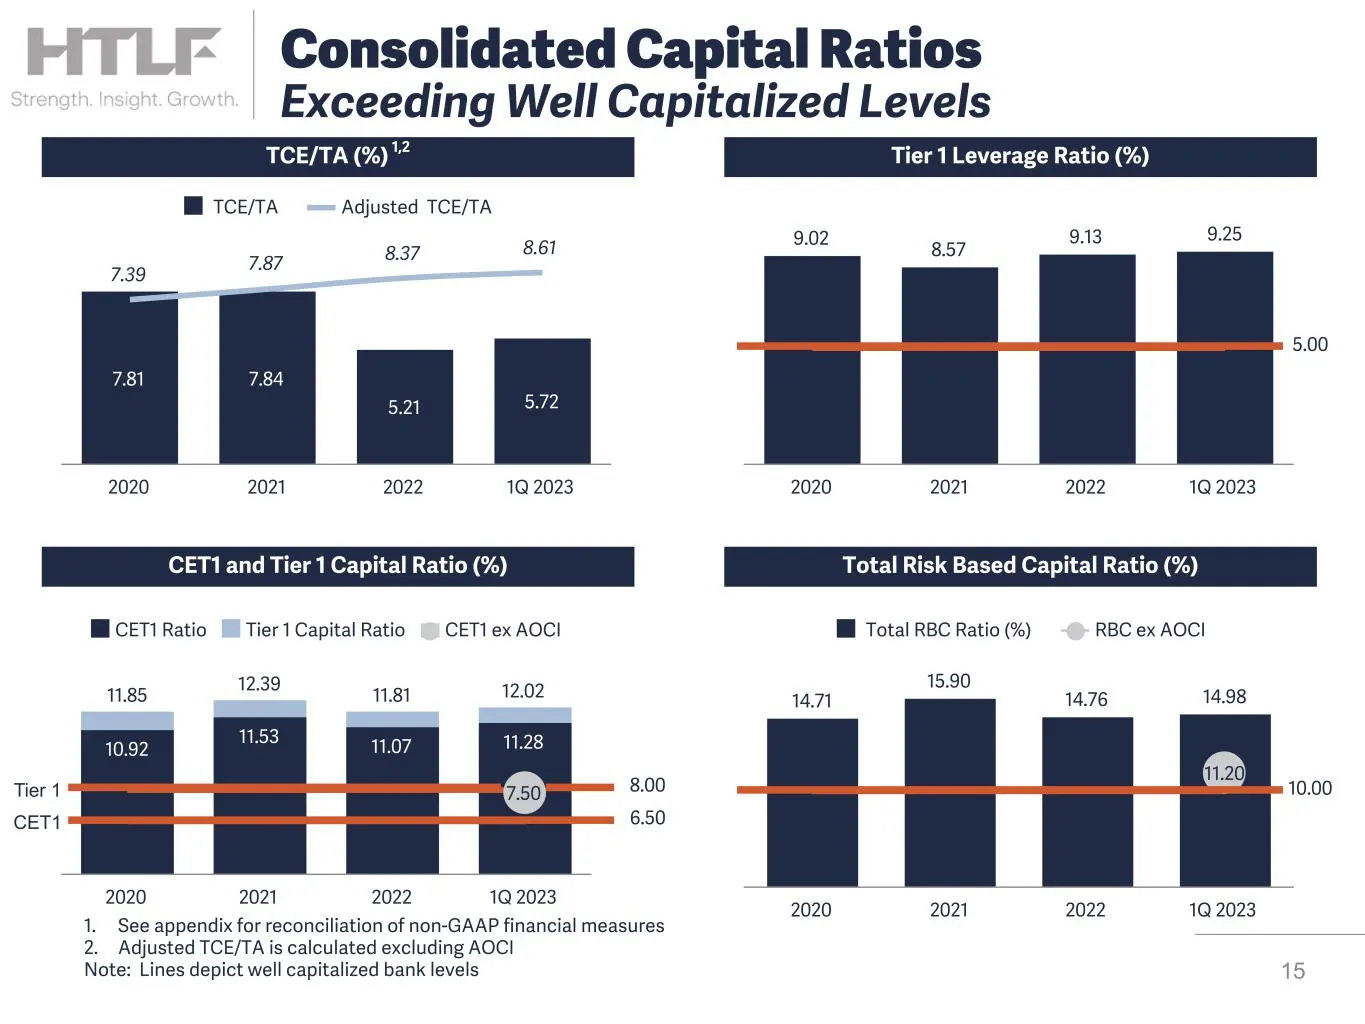
Slide 15: Consolidated Capital Ratios Exceeding Well Capitalized Levels
11.85 12.39 11.81 12.02 10.92 11.53 11.07 11.28 7.50 CET1 Ratio Tier 1 Capital Ratio CET1 ex AOCI 2020 2021 2022 1Q 2023 TCE/TA (%) 1,2 Tier 1 Leverage Ratio (%) CET1 and Tier 1 Capital Ratio (%) Total Risk Based Capital Ratio (%) 7.81 7.84 5.21 5.72 7.39 7.87 8.37 8.61 TCE/TA Adjusted TCE/TA 2020 2
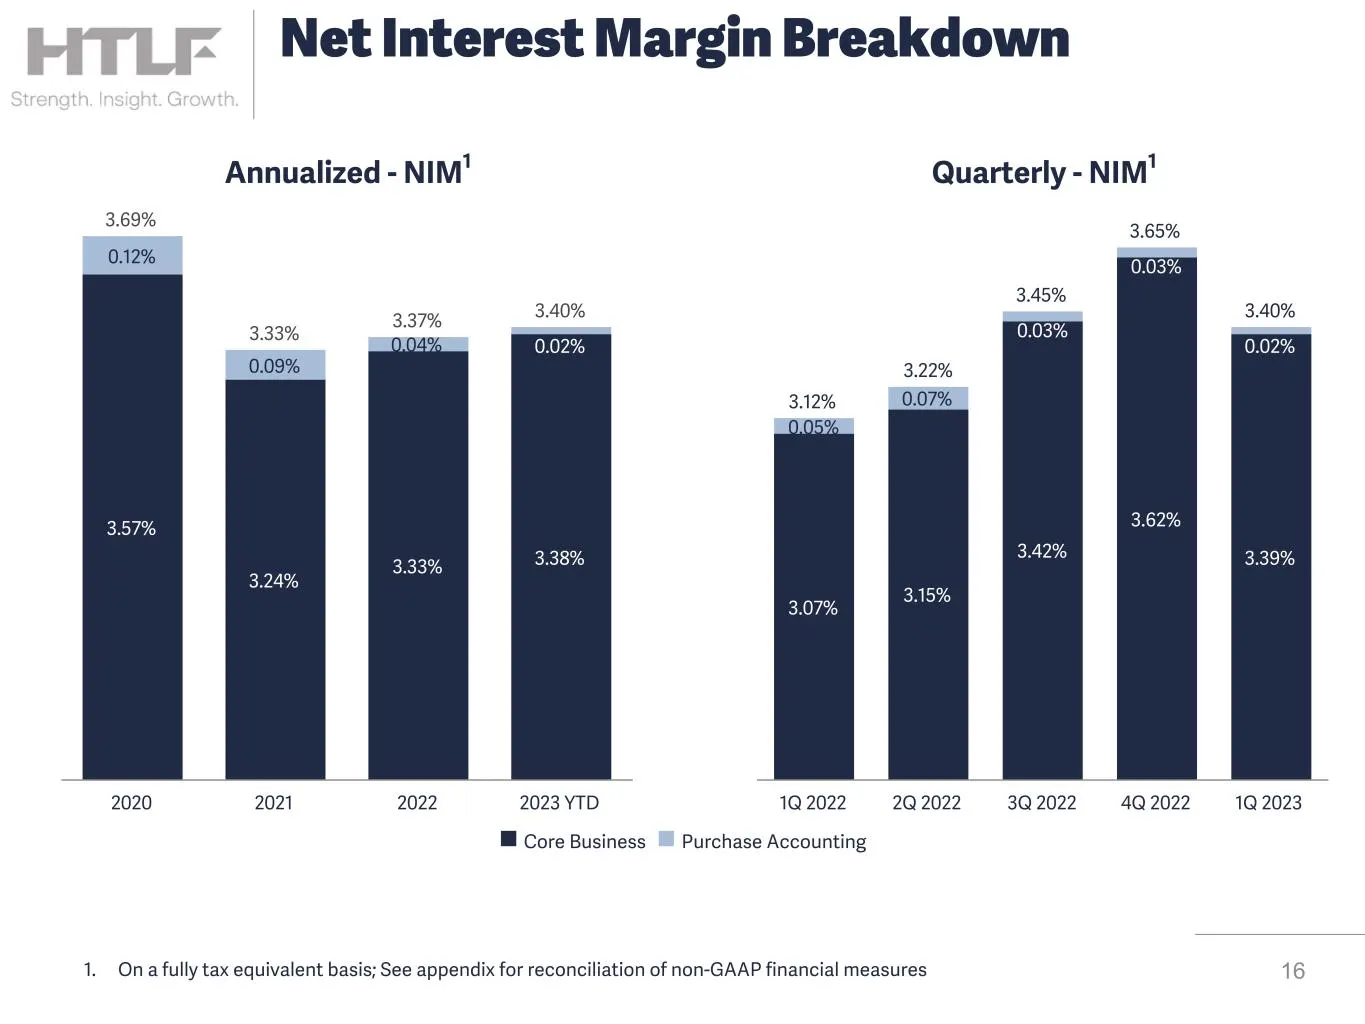
Slide 16: Net Interest Margin Breakdown
3.69% 3.33% 3.37% 3.40% 3.57% 3.24% 3.33% 3.38% 0.12% 0.09% 0.04% 0.02% 2020 2021 2022 2023 YTD 3.12% 3.22% 3.45% 3.65% 3.40% 3.07% 3.15% 3.42% 3.62% 3.39% 0.05% 0.07% 0.03% 0.03% 0.02% 1Q 2022 2Q 2022 3Q 2022 4Q 2022 1Q 2023 n Core Business n Purchase Accounting 161. On a fully tax equivalent basis
Slide 17: Bank Optimization Initiatives
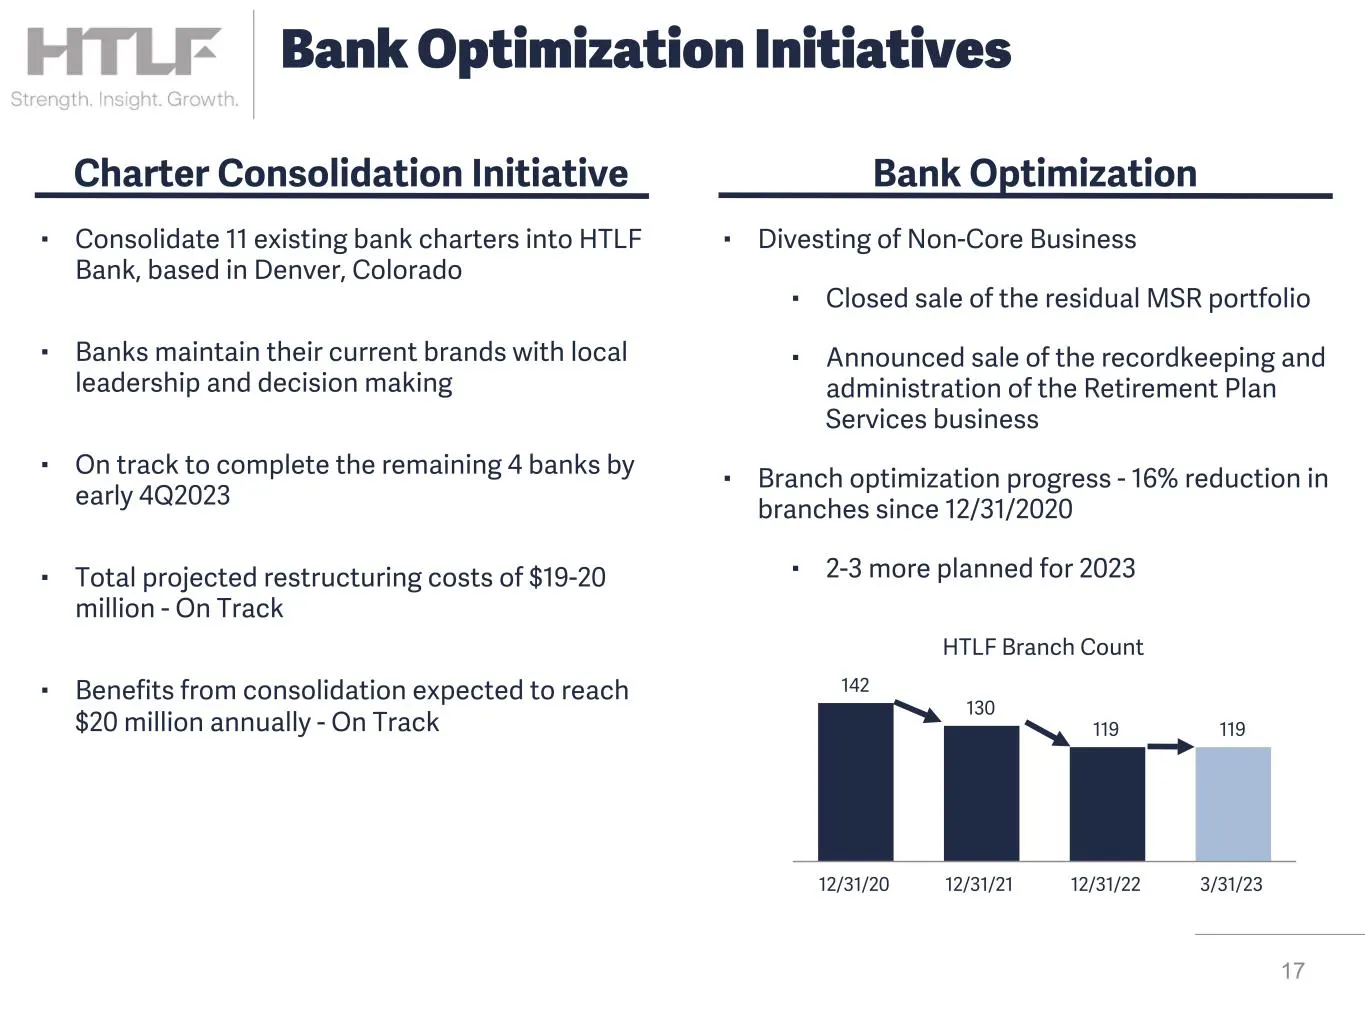
▪ Consolidate 11 existing bank charters into HTLF Bank, based in Denver, Colorado ▪ Banks maintain their current brands with local leadership and decision making ▪ On track to complete the remaining 4 banks by early 4Q2023 ▪ Total projected restructuring costs of $19-20 million - On Track ▪ Benefits
Slide 18: Operating Efficiency Improving by Leveraging Core Costs and Growth
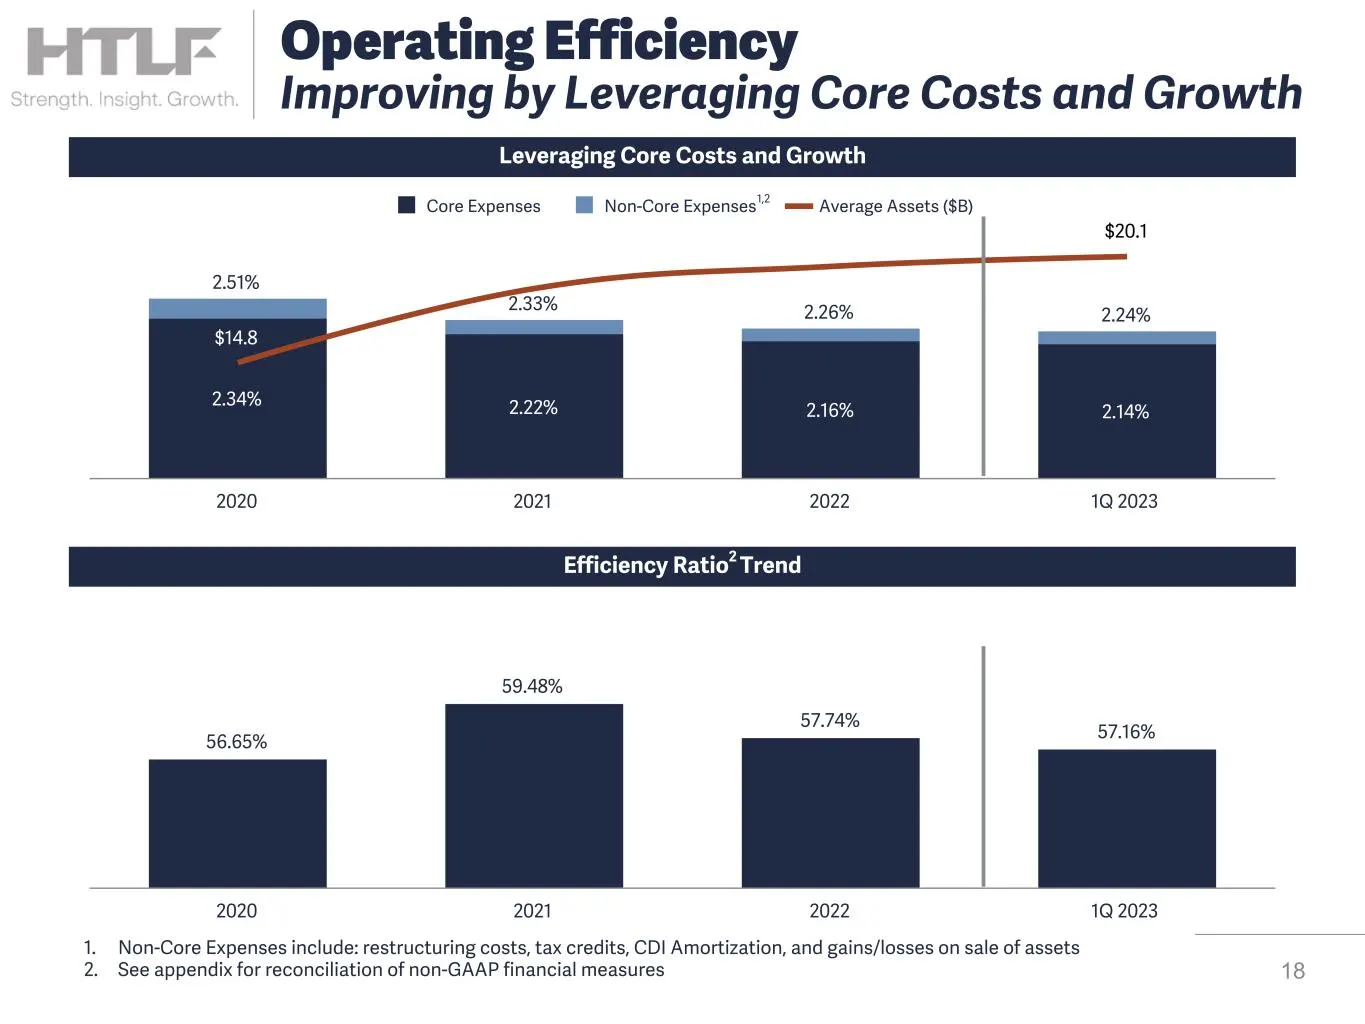
2.51% 2.33% 2.26% 2.24% 2.34% 2.22% 2.16% 2.14% $14.8 $20.1 Core Expenses Non-Core Expenses Average Assets ($B) 2020 2021 2022 1Q 2023 56.65% 59.48% 57.74% 57.16% 2020 2021 2022 1Q 2023 1. Non-Core Expenses include: restructuring costs, tax credits, CDI Amortization, and gains/losses on sale of asse
Slide 19: HTLF Investor Summary
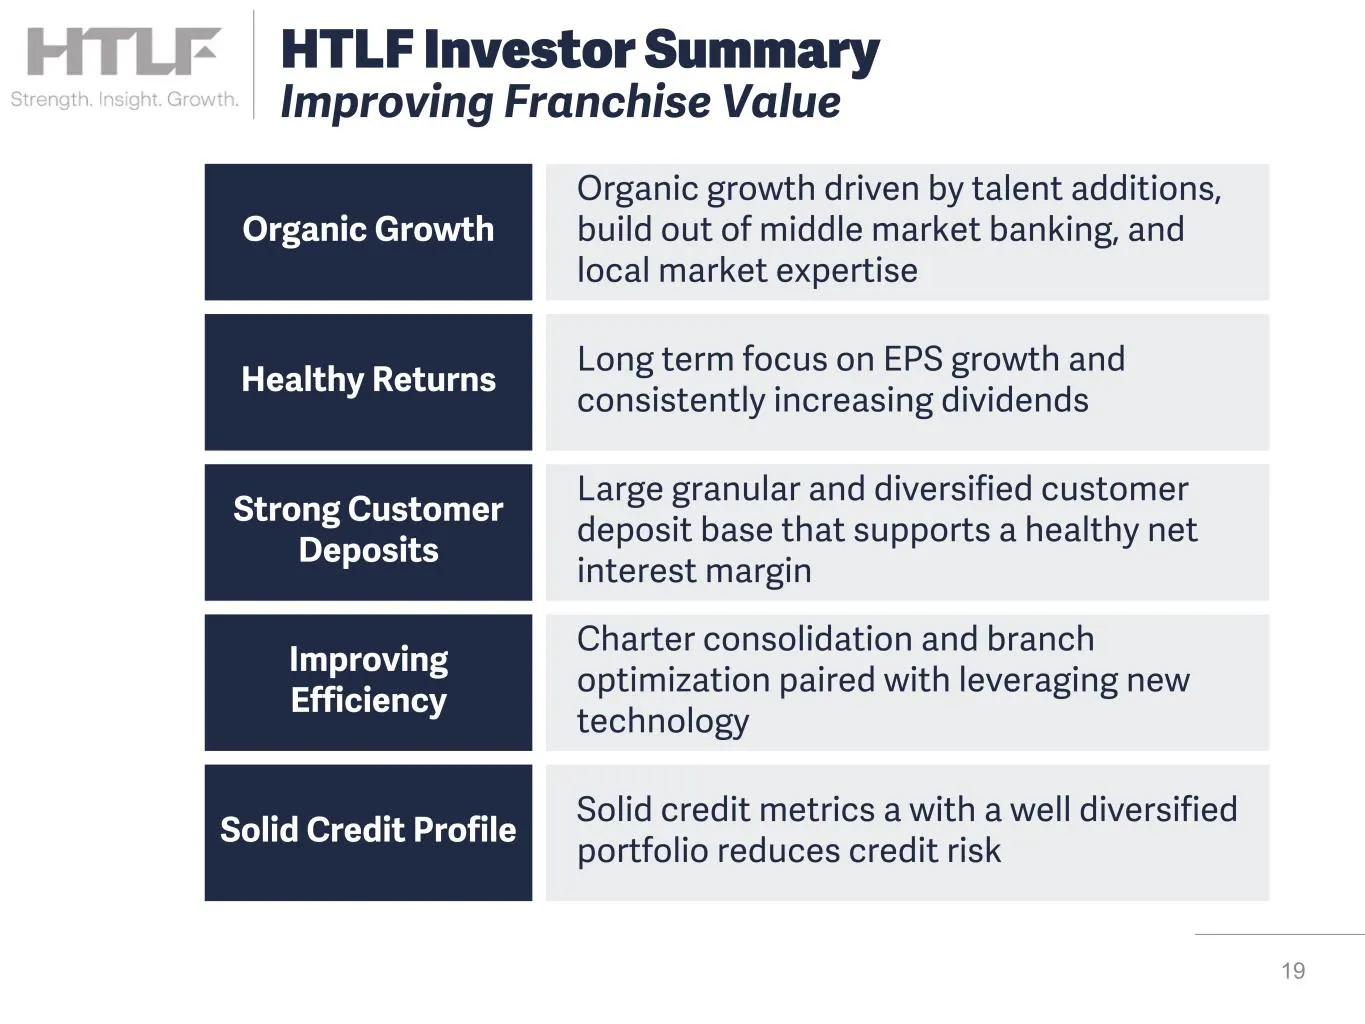
19 Organic Growth Healthy Returns Strong Customer Deposits Improving Efficiency Organic growth driven by talent additions, build out of middle market banking, and local market expertise Large granular and diversified customer deposit base that supports a healthy net interest margin Charter consolida
Slide 20: Contact Information
-ITLE Contact Information FTLF Strength. Insight. Growth. Bruce K. Lee President and CEO 563.587.4176 office 419.351.1274 cell BLee@htlf.com FHTLF Strength. Insight. Growth. Bryan R. McKeag EVP, Chief Financial Officer 563,5871994 office 920.284.0732 cell BMcKeag@htif.com FTLF Strength. Insight. Gro
Slide 21: Non-GAAP Reconciliations
21 Non-GAAP Reconciliations
Slide 22: Non-GAAP measure definitions
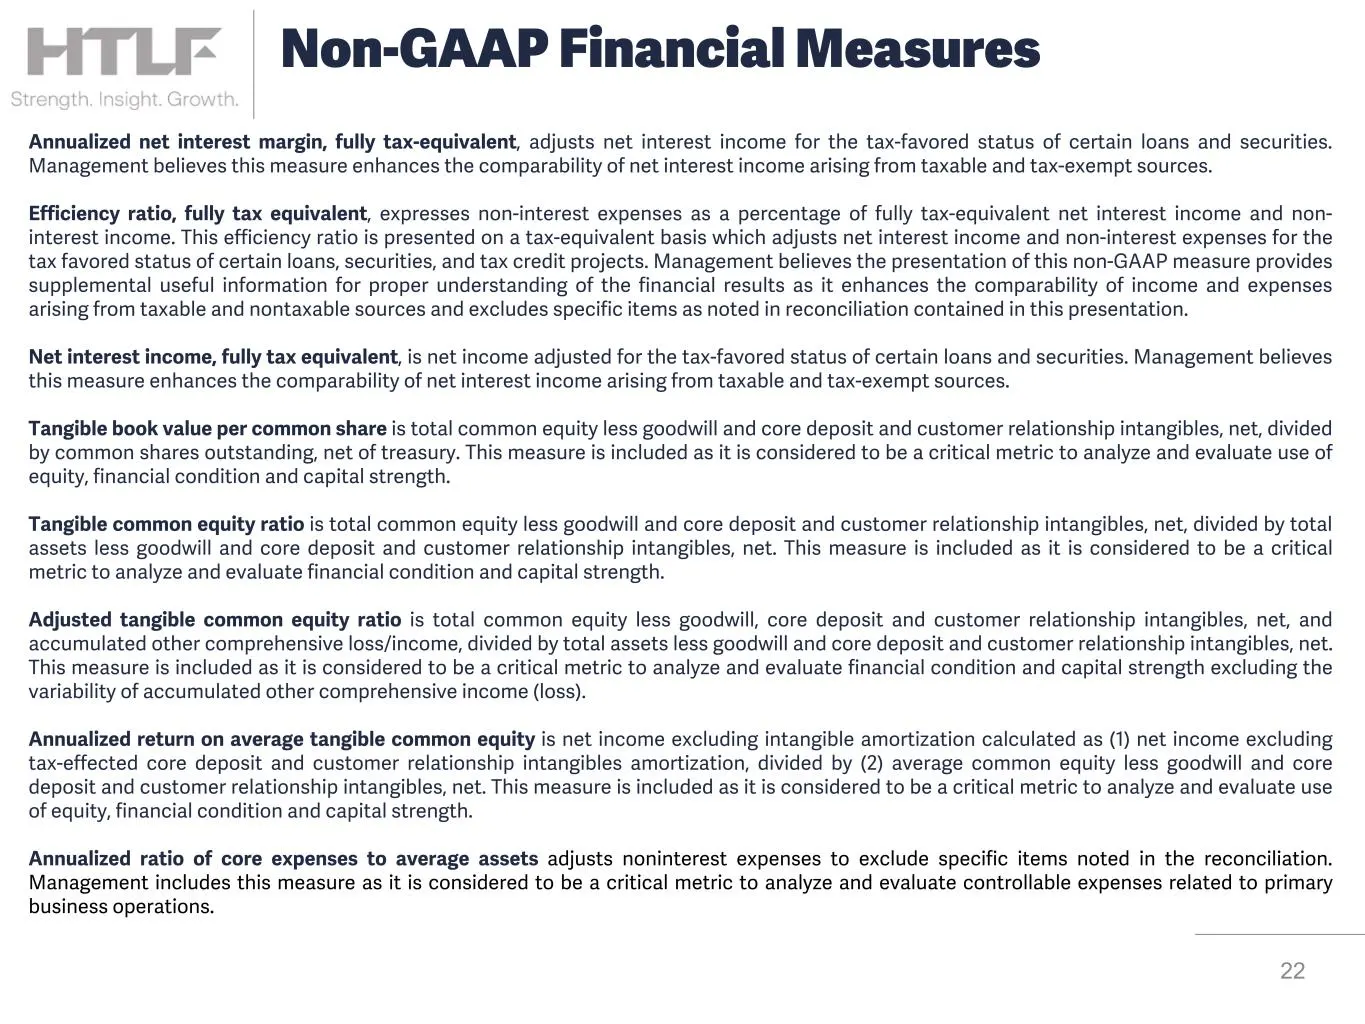
Annualized net interest margin, fully tax-equivalent, adjusts net interest income for the tax-favored status of certain loans and securities. Management believes this measure enhances the comparability of net interest income arising from taxable and tax-exempt sources. Efficiency ratio, fully tax eq
Slide 23: Reconciliation of Tangible Book Value and Tangible Common Equity Ratio
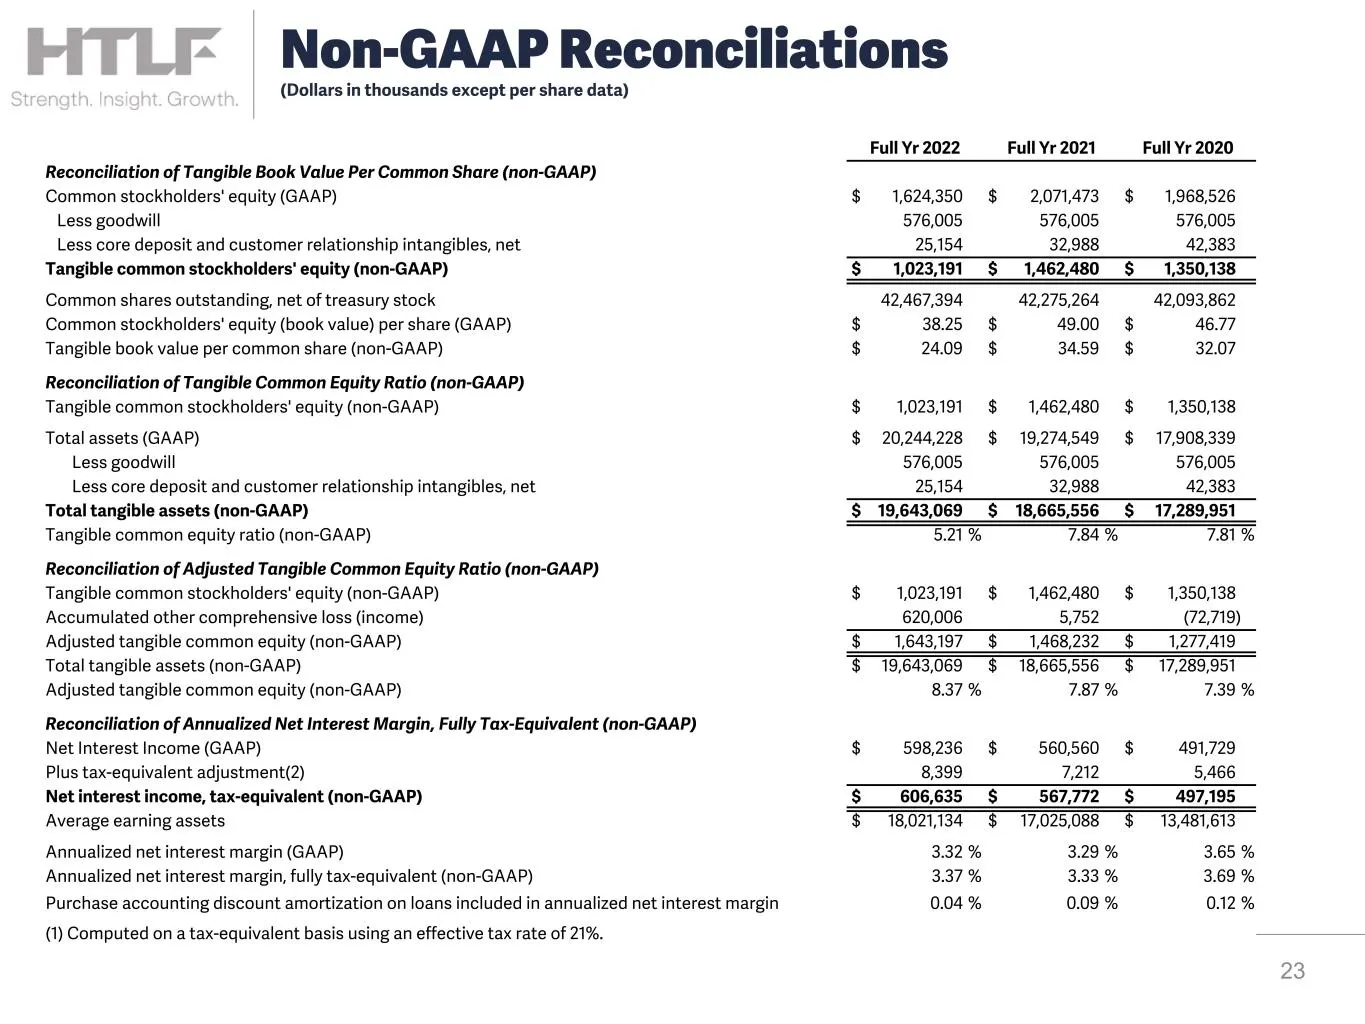
Full Yr 2022 Full Yr 2021 Full Yr 2020 Reconciliation of Tangible Book Value Per Common Share (non-GAAP) Common stockholders' equity (GAAP) $ 1,624,350 $ 2,071,473 $ 1,968,526 Less goodwill 576,005 576,005 576,005 Less core deposit and customer relationship intangibles, net 25,154 32,988 42,383 Tang
Slide 24: Reconciliation of Non-GAAP Measure-Efficiency Ratio
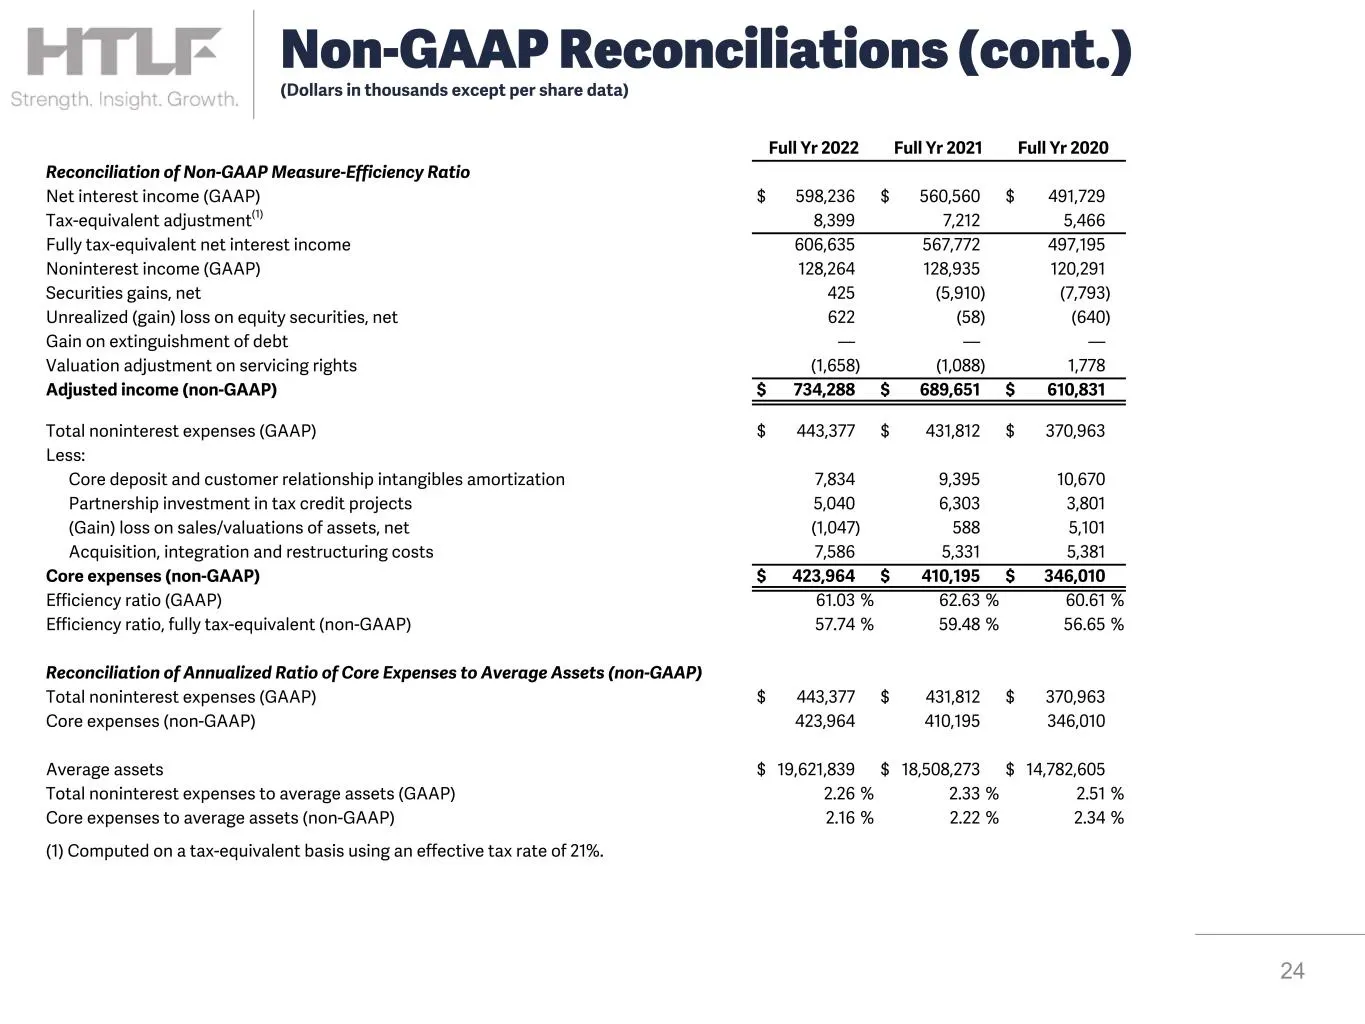
Full Yr 2022 Full Yr 2021 Full Yr 2020 Reconciliation of Non-GAAP Measure-Efficiency Ratio Net interest income (GAAP) $ 598,236 $ 560,560 $ 491,729 Tax-equivalent adjustment(1) 8,399 7,212 5,466 Fully tax-equivalent net interest income 606,635 567,772 497,195 Noninterest income (GAAP) 128,264 128,93
Slide 25: Non-GAAP Reconciliations (cont.)
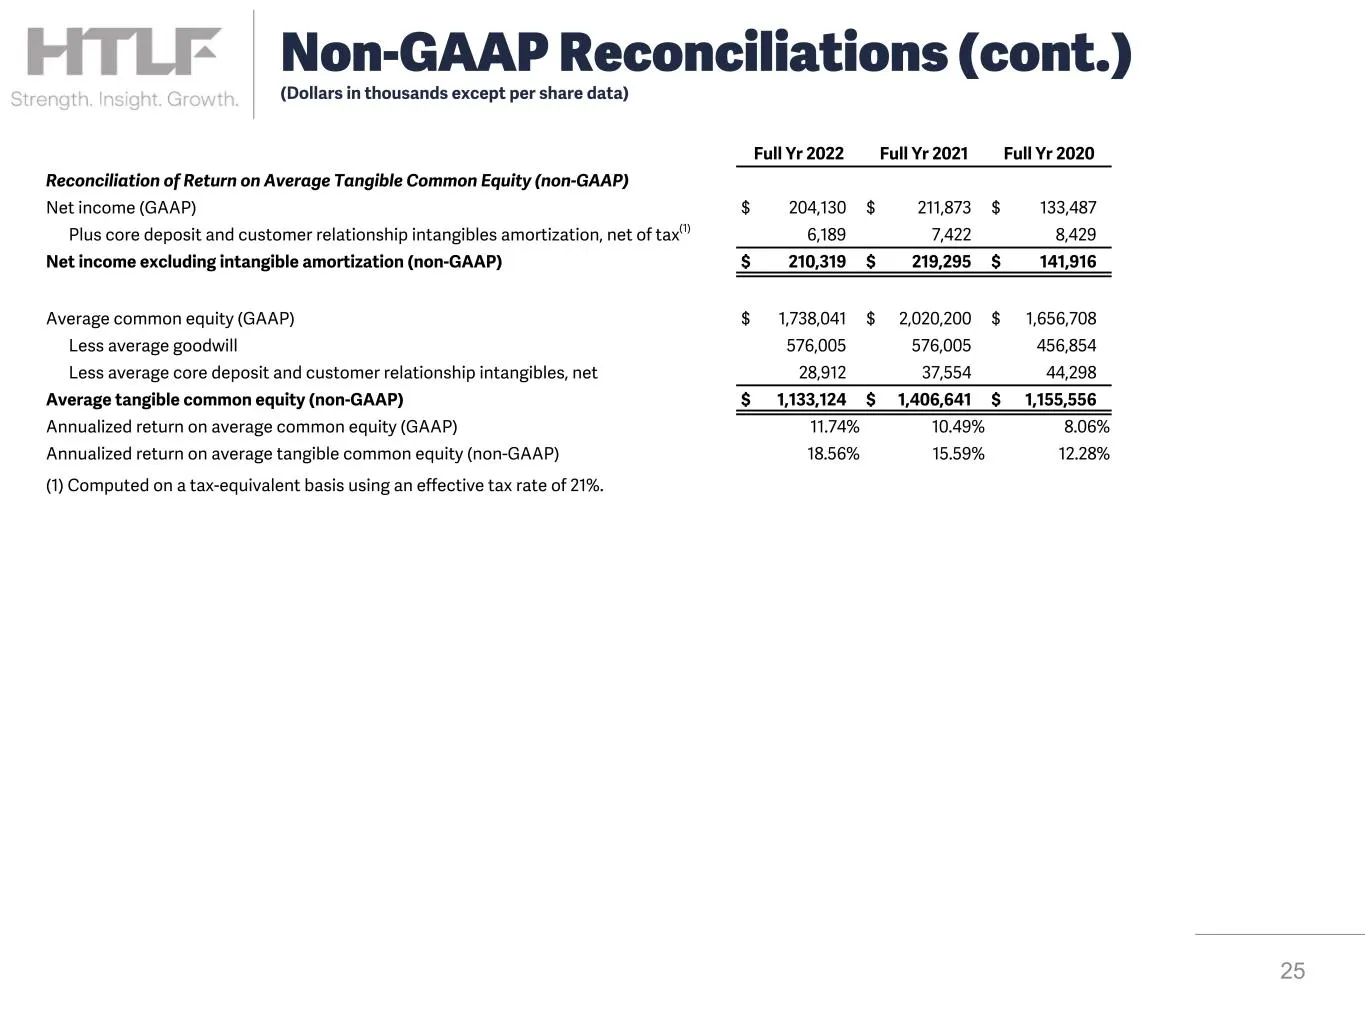
Non-GAAP Reconciliations (cont.) (Dollars in thousands except per share data) Full Yr 2022 Full Yr 2021 Full Yr 2020 Reconciliation of Return on Average Tangible Common Equity (non-GAAP) Net income (GAAP) $ 204,130 $ 211,873 $ 133,487 Plus core deposit and customer relationship intangibles amortizat
Slide 26: Reconciliation of Tangible Book Value Per Common Share
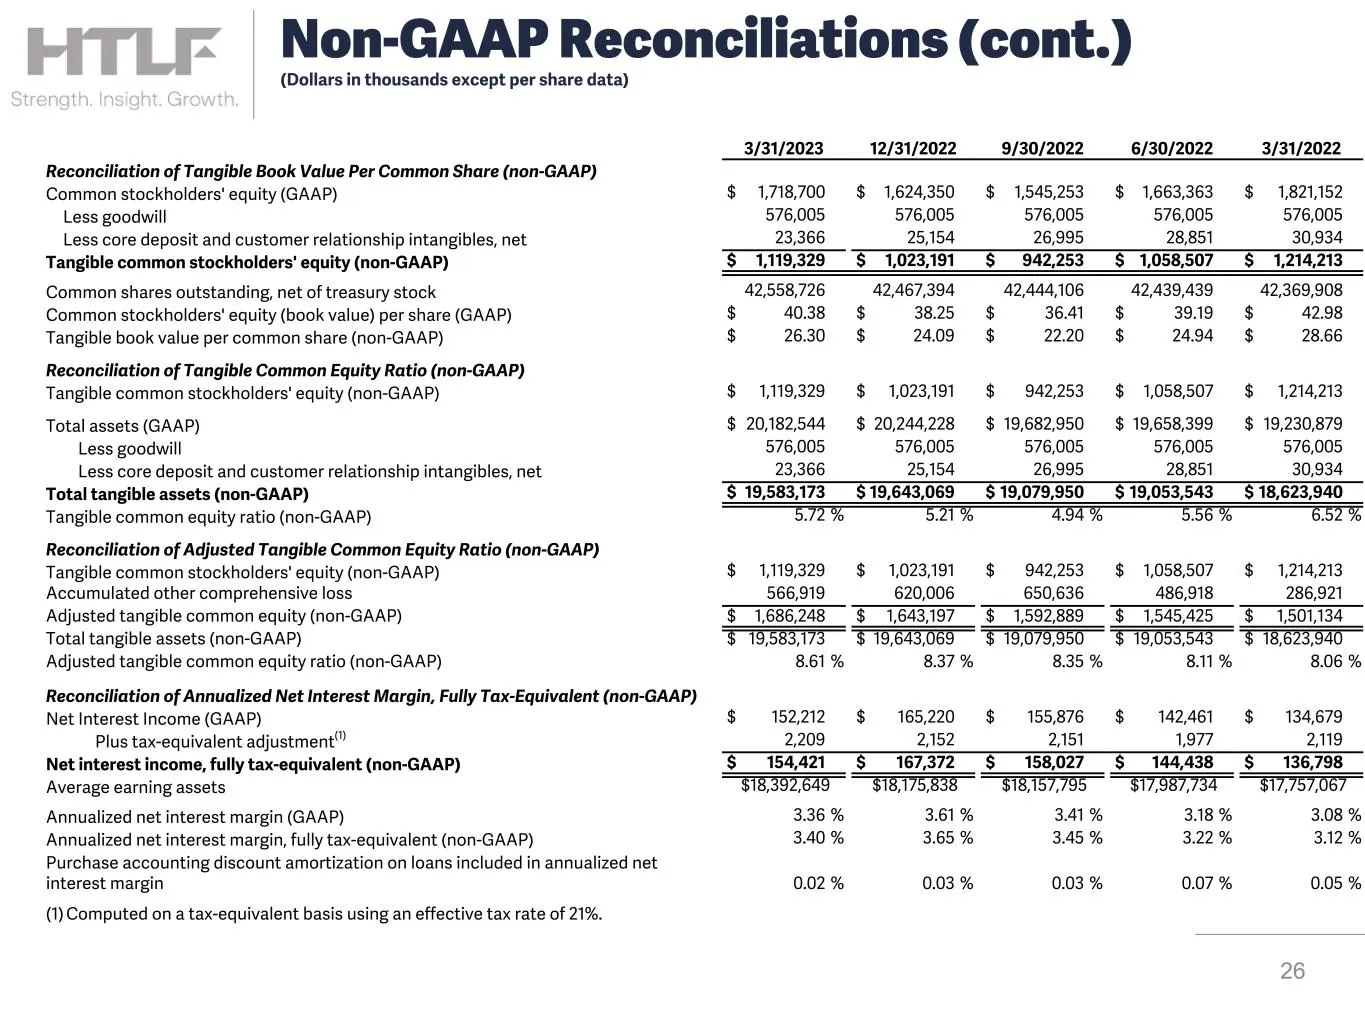
3/31/2023 12/31/2022 9/30/2022 6/30/2022 3/31/2022 Reconciliation of Tangible Book Value Per Common Share (non-GAAP) Common stockholders' equity (GAAP) $ 1,718,700 $ 1,624,350 $ 1,545,253 $ 1,663,363 $ 1,821,152 Less goodwill 576,005 576,005 576,005 576,005 576,005 Less core deposit and customer rel
Slide 27: Reconciliation of Non-GAAP Measure-Efficiency Ratio
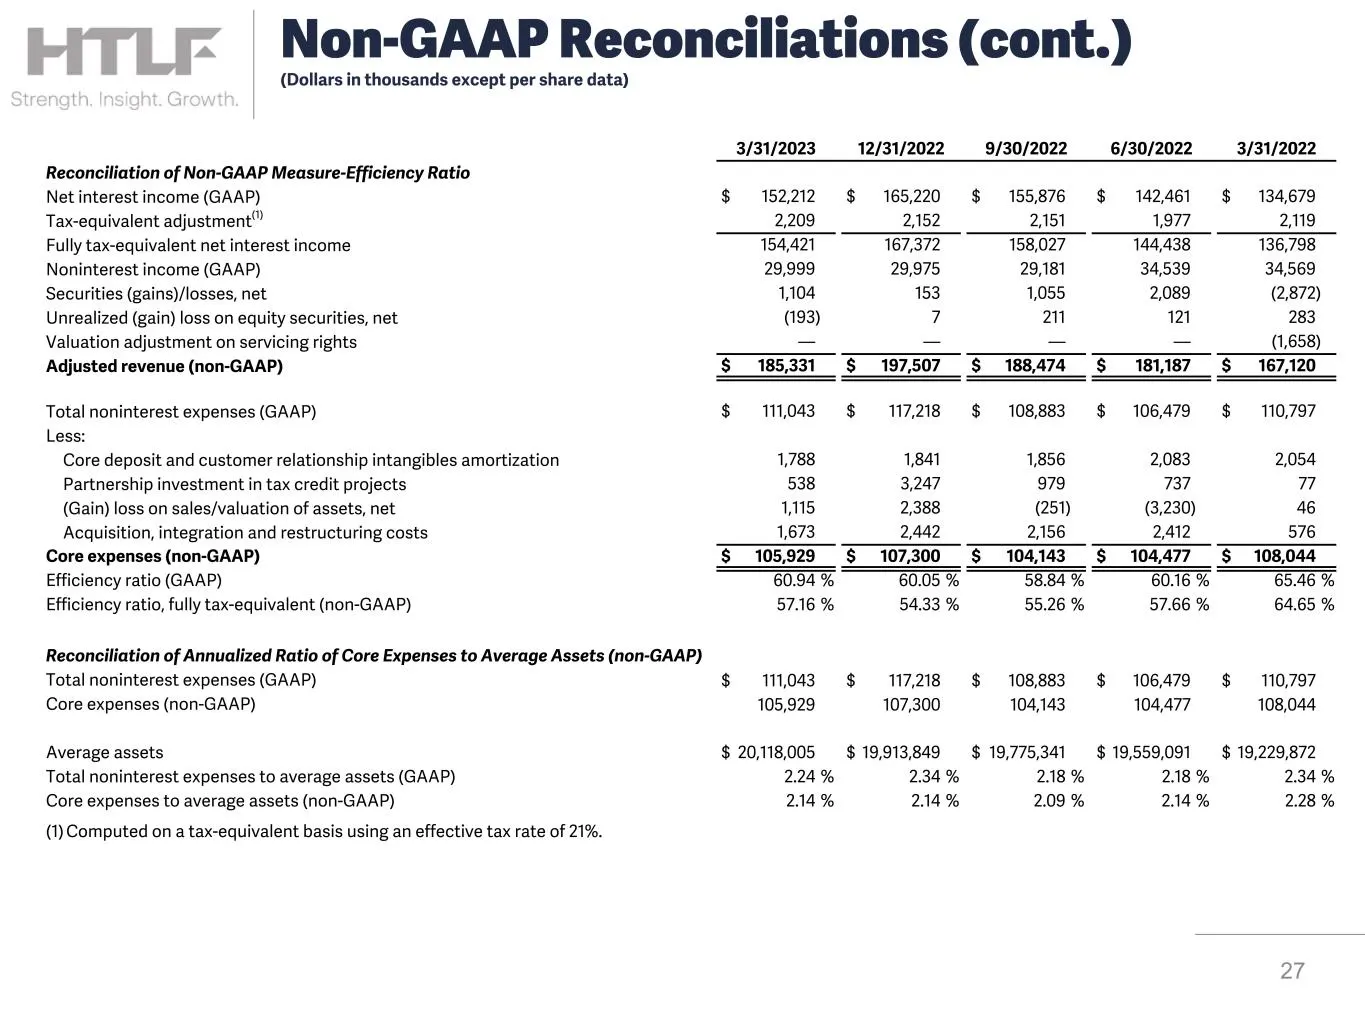
3/31/2023 12/31/2022 9/30/2022 6/30/2022 3/31/2022 Reconciliation of Non-GAAP Measure-Efficiency Ratio Net interest income (GAAP) $ 152,212 $ 165,220 $ 155,876 $ 142,461 $ 134,679 Tax-equivalent adjustment(1) 2,209 2,152 2,151 1,977 2,119 Fully tax-equivalent net interest income 154,421 167,372 158,
Slide 28: Non-GAAP Reconciliations (cont.)
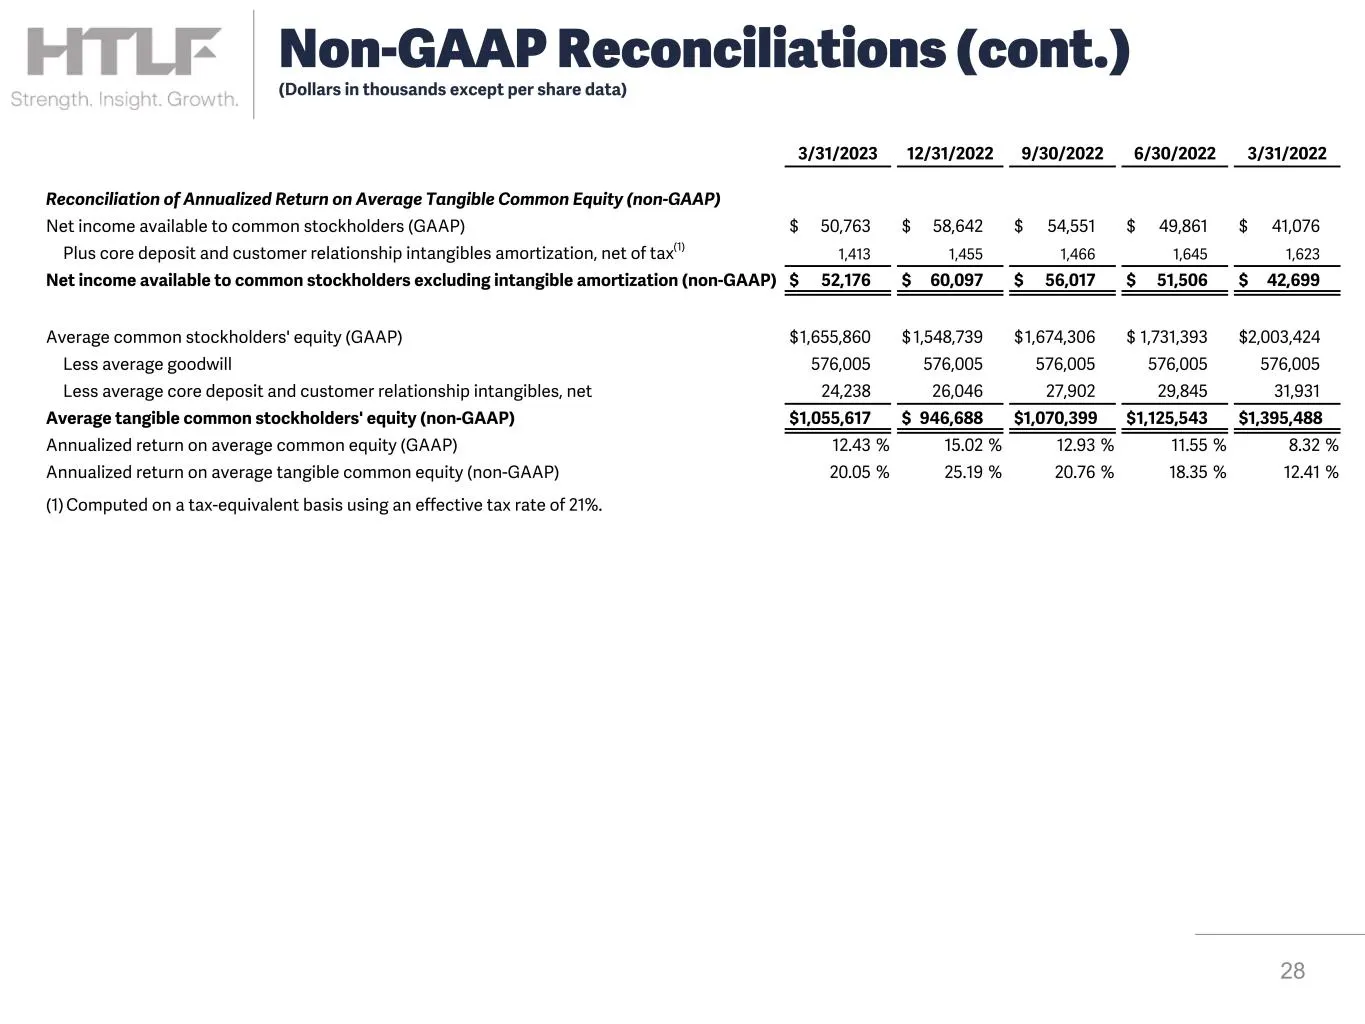
28 Non-GAAP Reconciliations (cont.) (Dollars in thousands except per share data) 3/31/2023 12/31/2022 9/30/2022 6/30/2022 3/31/2022 Reconciliation of Annualized Return on Average Tangible Common Equity (non-GAAP) Net income available to common stockholders (GAAP) $ 50,763 $ 58,642 $ 54,551 $ 49,861

Slide 29: Forward Together
Forward Together > FITLF Strength. Insight. Growth.
Source: SEC EDGAR · 8-K filed Apr 24, 2023
More decks from Heartland Financial USA Inc
 Merger or Acquisition (July 2024)6 slides · Jul 31, 2024
 Merger or Acquisition (May 2024)6 slides · May 2, 2024
 Merger or Acquisition (May 2024)27 slides · May 2, 2024
 Q4 2023 Earnings Presentation54 slides · Feb 13, 2024
 Q4 2023 Earnings Presentation35 slides · Jan 29, 2024
 Q3 2023 Earnings Presentation55 slides · Nov 15, 2023