LCL Resources Limited · ASX:LCL
LCL Resources — Metminco — Non-Deal Roadshow (August 2013)
36 slides from LCL Resources's roadshow presentation, Aug 12, 2013
Slide 1: Towards a mid-tier copper producer
Towards a mid-tier copper producer Roadshow – August 2013 12 August 2013 0
Slide 2: Disclaimer
Disclaimer This presentation (the “Presentation”) is strictly confidential to the recipient and has been prepared by Metminco Limited (“Metminco” or the “Company”) based on the information available to it. It is intended solely for the information of the initial recipient of this presentation. Metmi
Slide 3: Top 10 shareholders
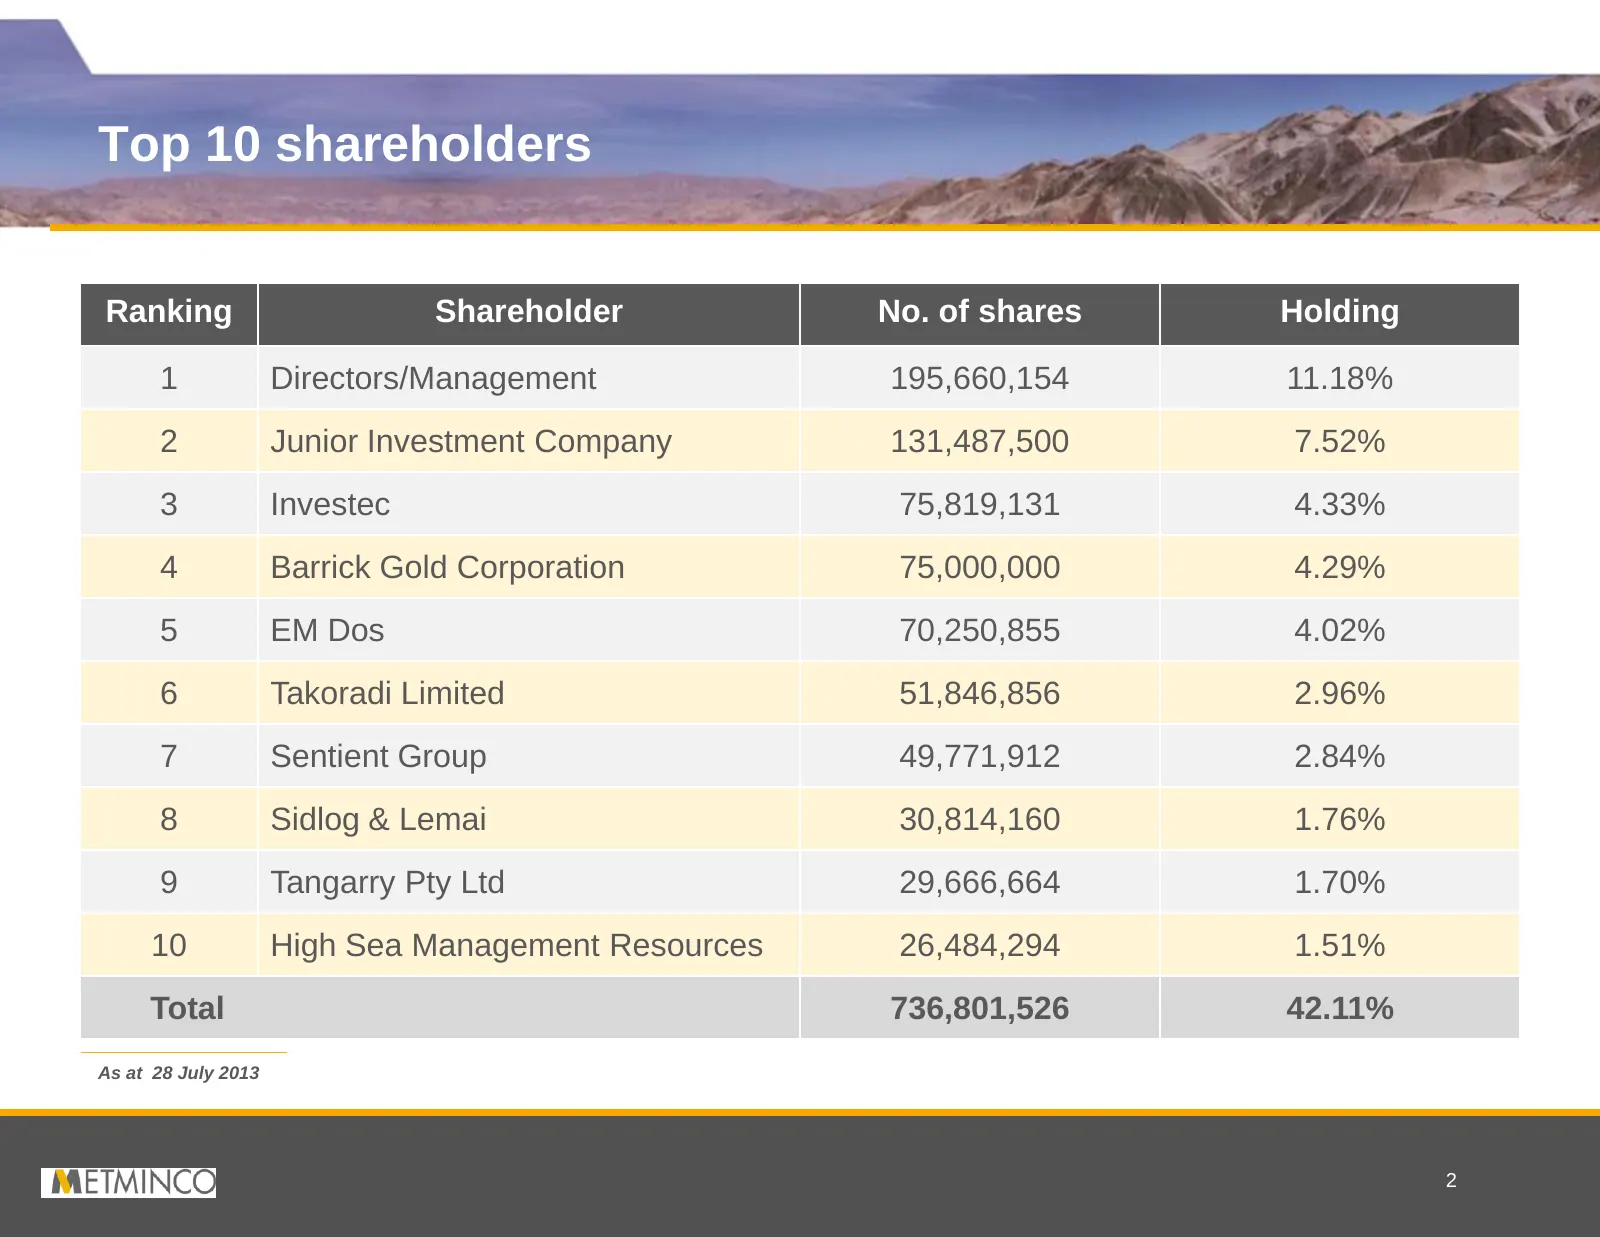
Top 10 shareholders Ranking Shareholder No. of shares Holding 1 Directors/Management 195,660,154 11.18% 2 Junior Investment Company 131,487,500 7.52% 3 Investec 75,819,131 4.33% 4 Barrick Gold Corporation 75,000,000 4.29% 5 EM Dos 70,250,855 4.02% 6 Takoradi Limited 51,846,856 2.96% 7 Sentient Group
Slide 4: Key assets
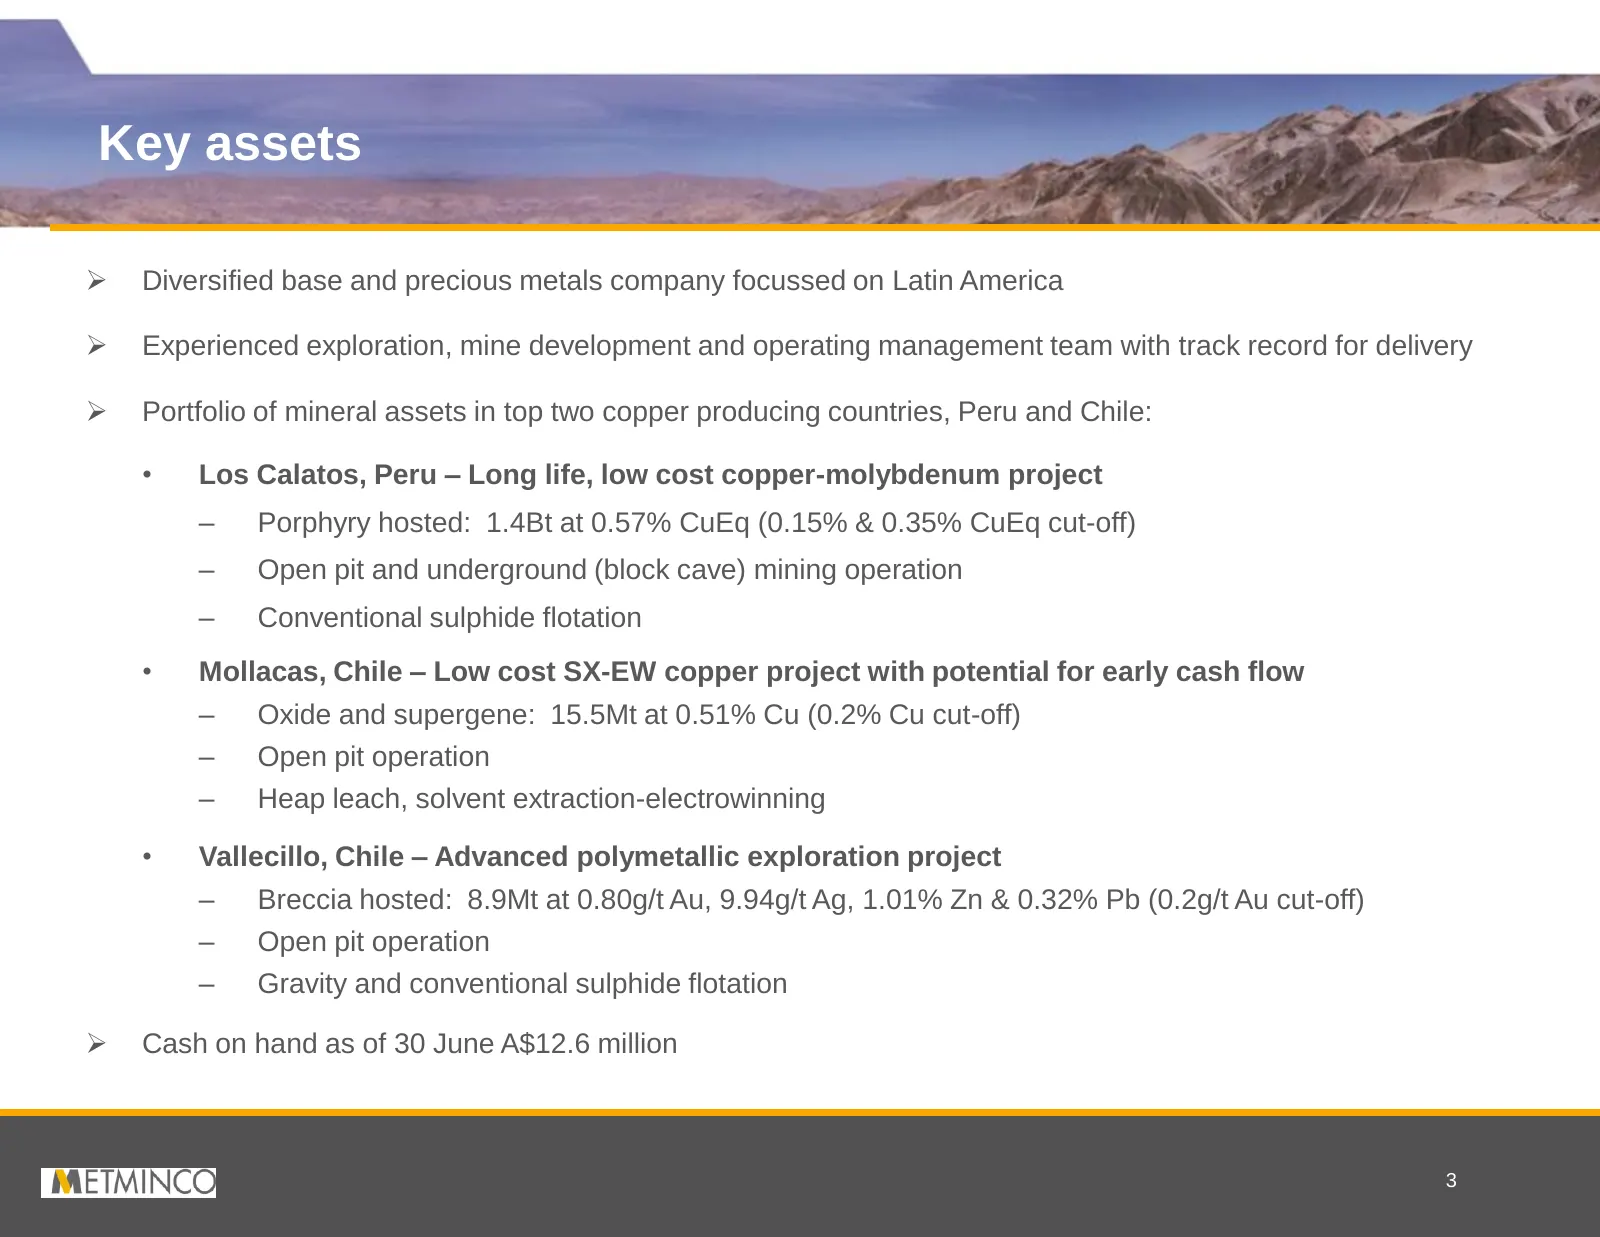
Key assets Diversified base and precious metals company focussed on Latin America Experienced exploration, mine development and operating management team with track record for delivery Portfolio of mineral assets in top two copper producing countries, Peru and Chile: • Los Calatos, Peru – Long
Slide 5: Projects are well-located
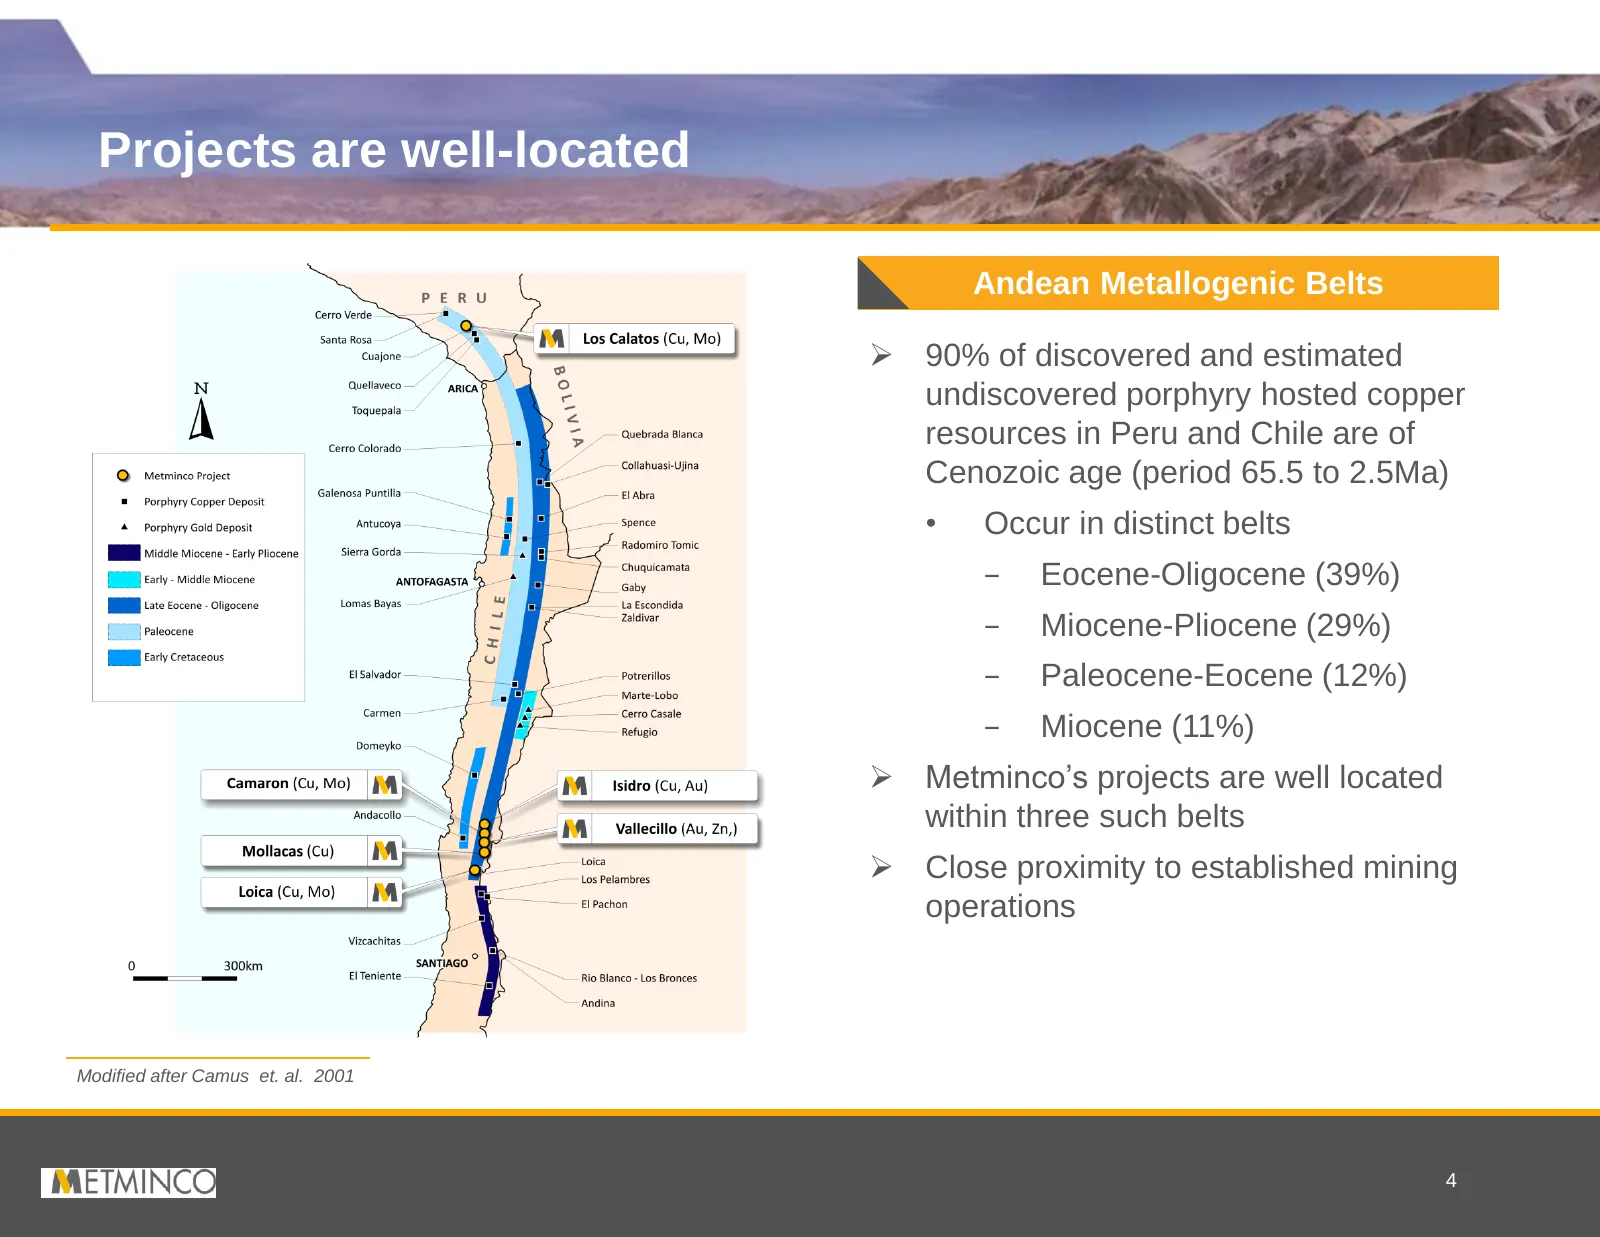
Projects are well-located Andean Metallogenic Belts 90% of discovered and estimated undiscovered porphyry hosted copper resources in Peru and Chile are of Cenozoic age (period 65.5 to 2.5Ma) • Occur in distinct belts − Eocene-Oligocene (39%) − Miocene-Pliocene (29%) − Paleocene-Eocene (12%) − Mioc
Slide 6: Toquepala
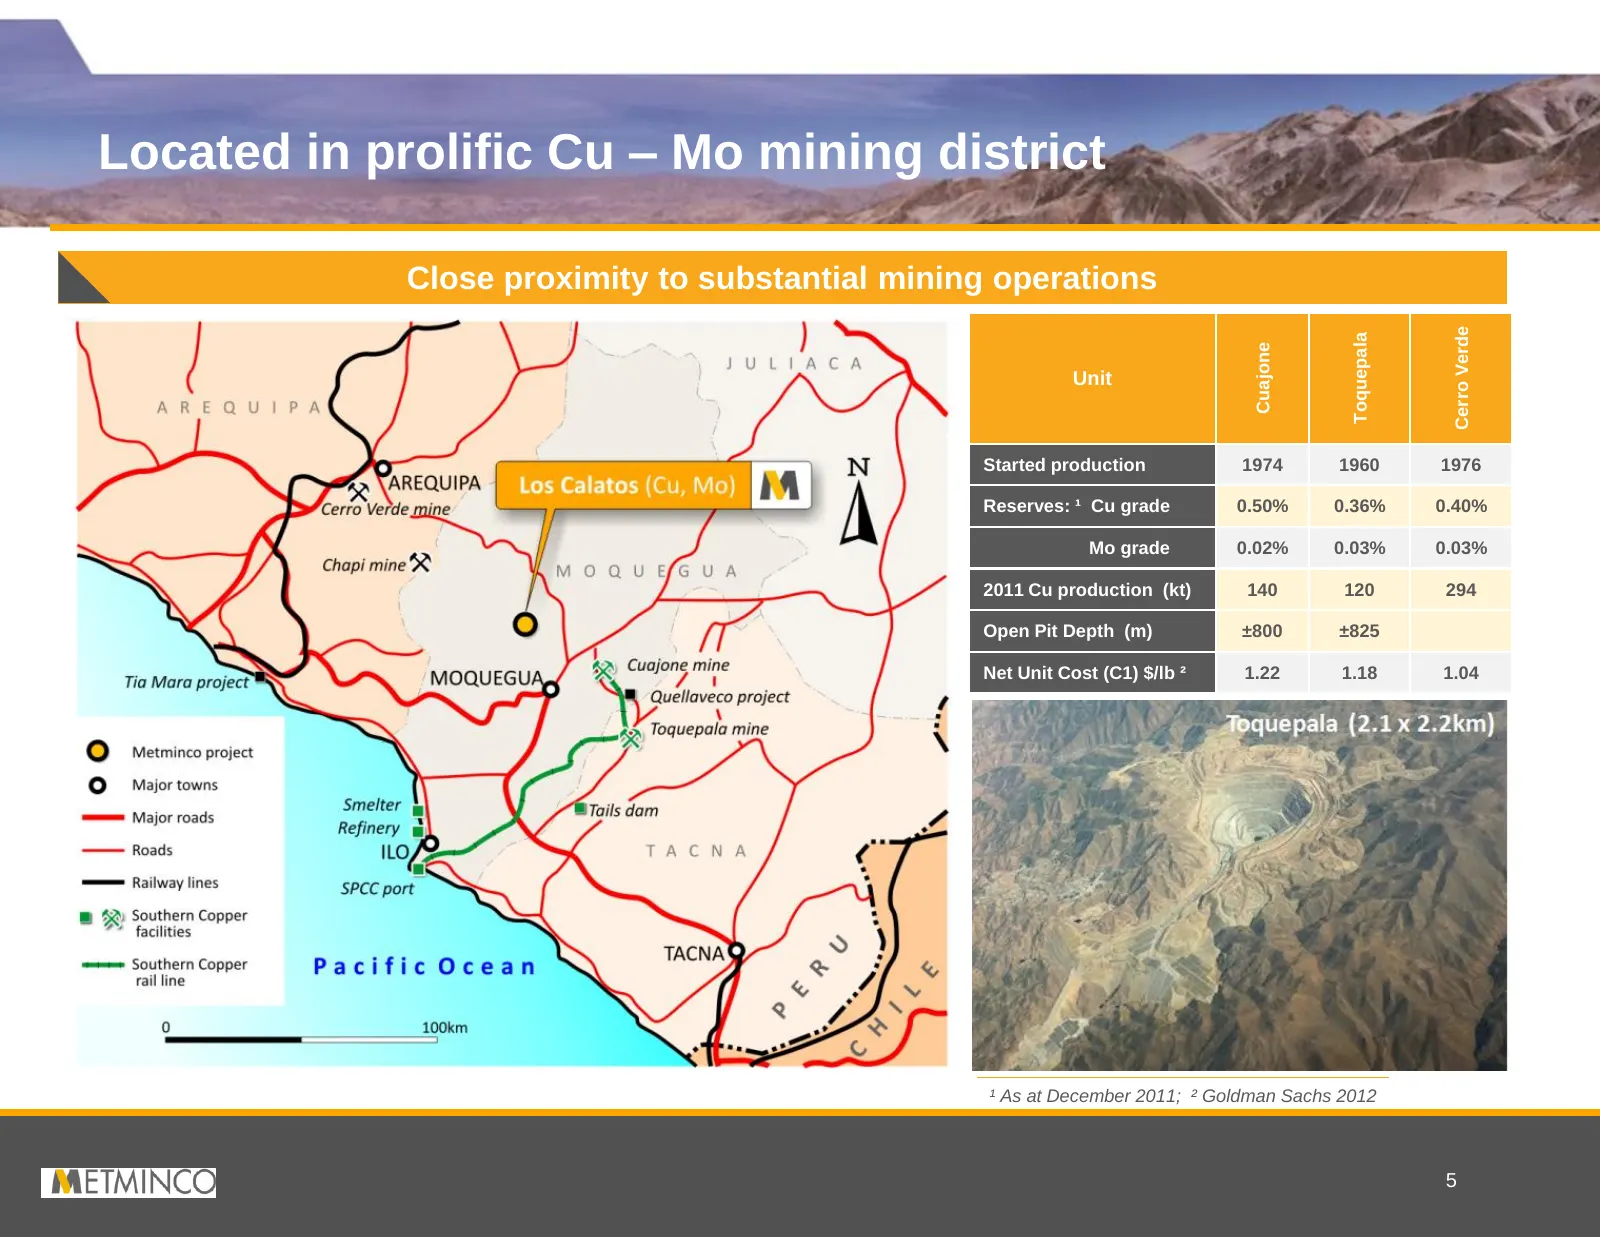
Located in prolific Cu – Mo mining district Close proximity to substantial mining operations Cerro Verde Toquepala Cuajone Unit Started production 1974 1960 1976 Reserves: ¹ Cu grade 0.50% 0.36% 0.40% Mo grade 0.02% 0.03% 0.03% 2011 Cu production (kt) 140 120 294 Open Pit Depth (m) ±800 ±825 Net Uni
Slide 7: Los Calatos in brief
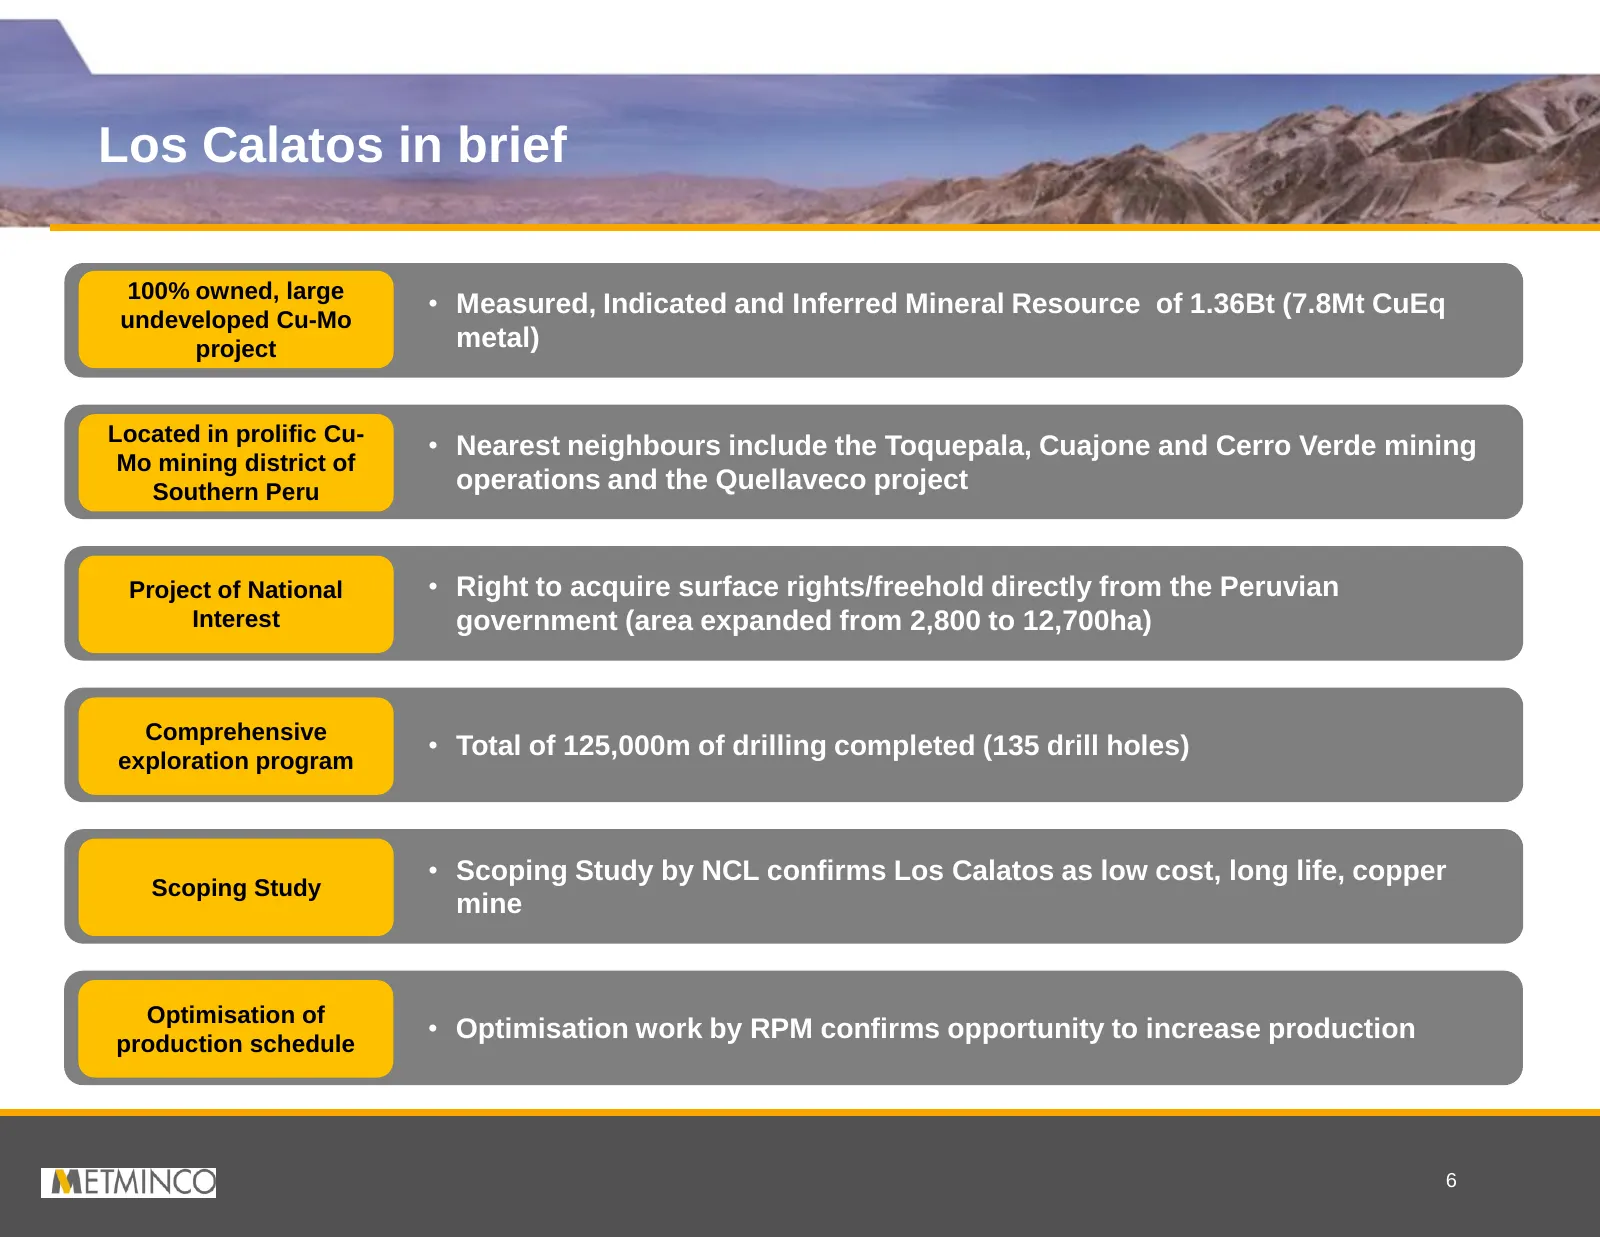
Los Calatos in brief 100% owned, large • Measured, Indicated and Inferred Mineral Resource of 1.36Bt (7.8Mt CuEq undeveloped Cu-Mo project metal) Located in prolific Cu- • Nearest neighbours include the Toquepala, Cuajone and Cerro Verde mining Mo mining district of Southern Peru operations and the
Slide 8: Regional infrastructure
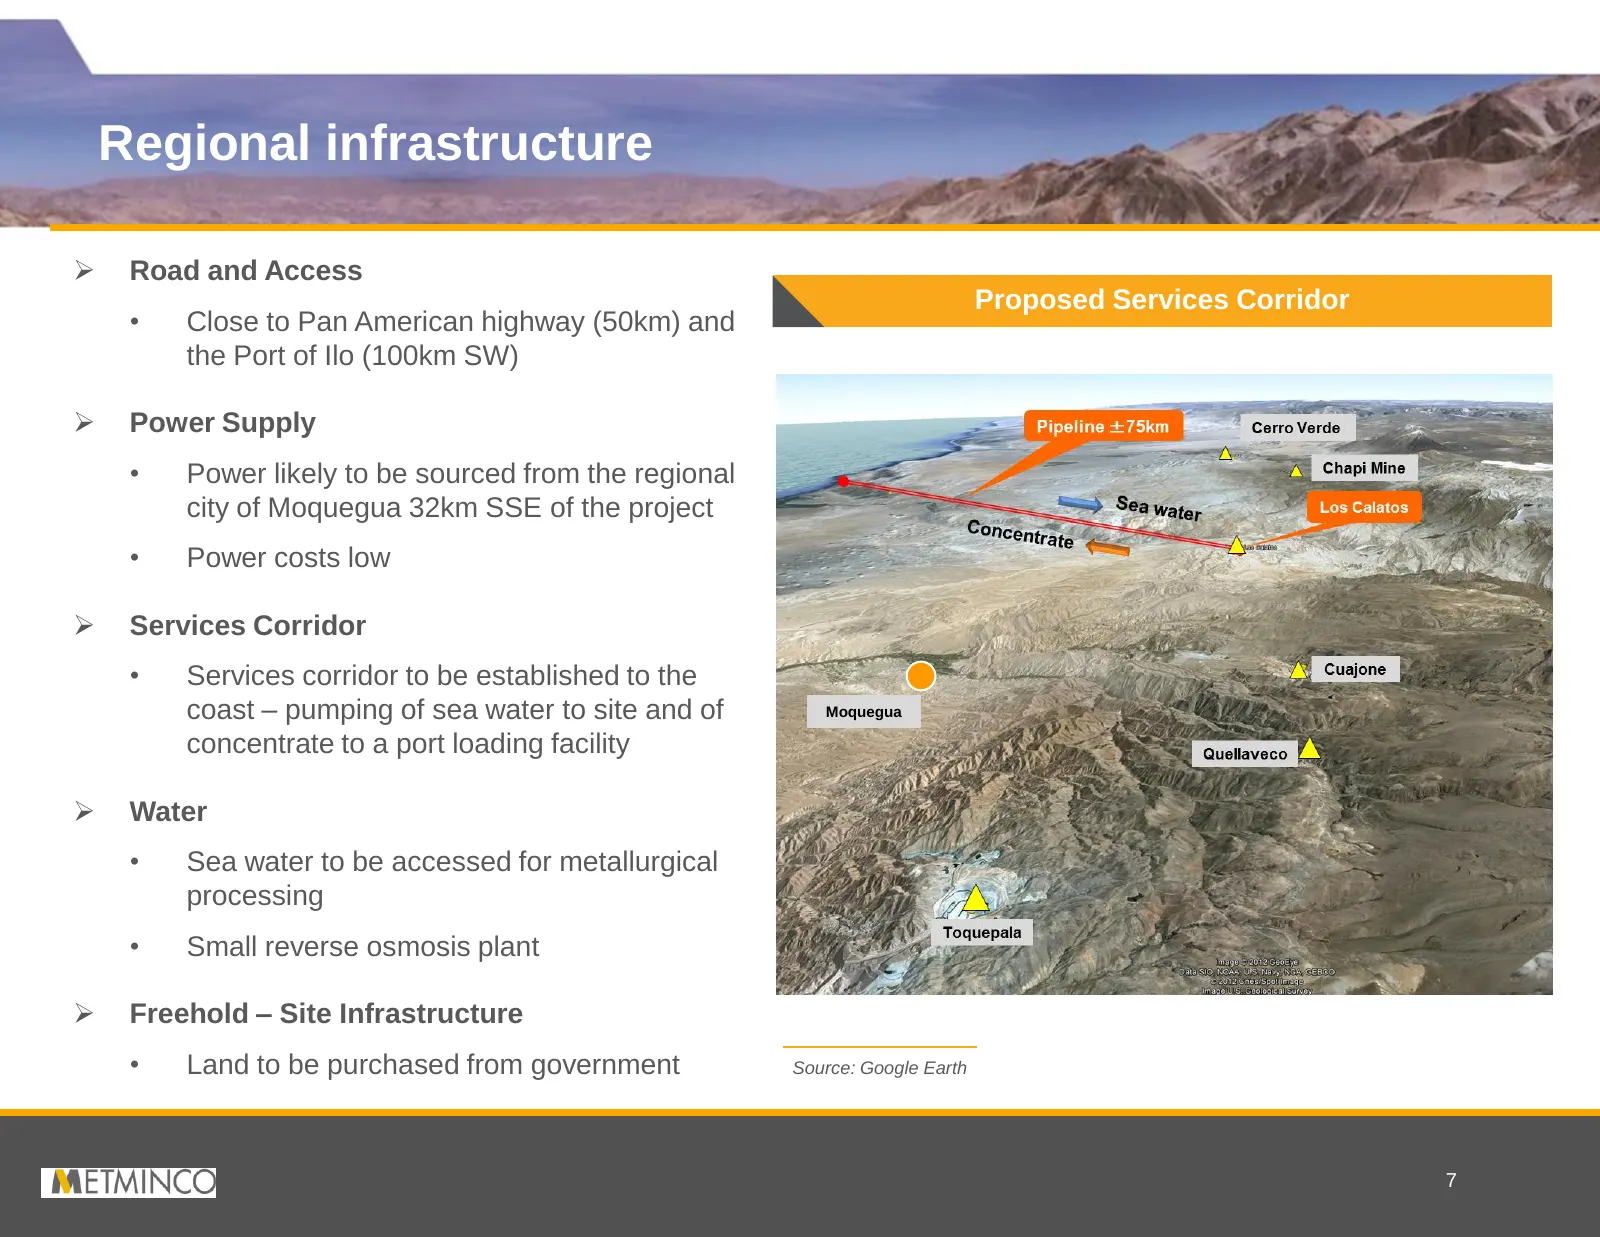
Regional infrastructure Road and Access Proposed Services Corridor • Close to Pan American highway (50km) and the Port of Ilo (100km SW) Power Supply • Power likely to be sourced from the regional city of Moquegua 32km SSE of the project • Power costs low Services Corridor • Services corridor
Slide 9: Substantial tenement holding position of 224km²
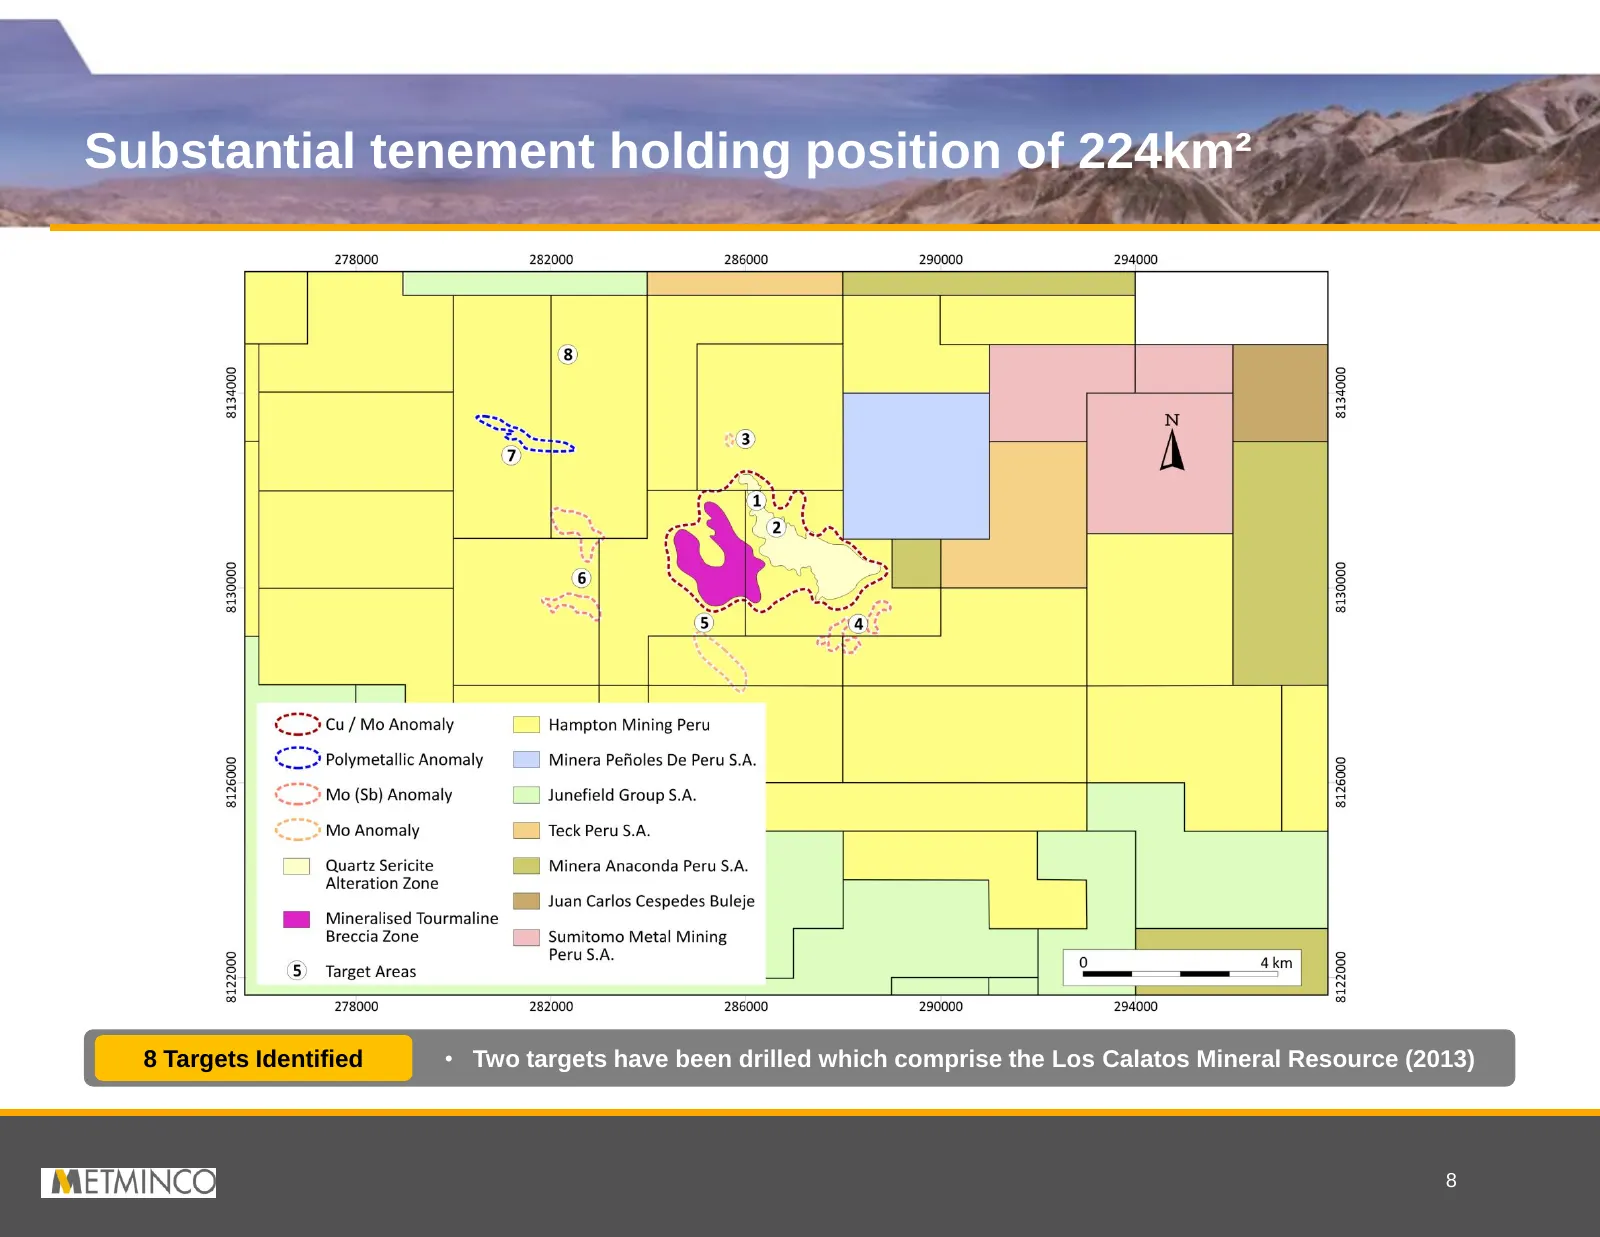
Substantial tenement holding position of 224km² 8 Targets Identified • Two targets have been drilled which comprise the Los Calatos Mineral Resource (2013) 8
Slide 10: Simplified geology and Cu and Mo isograde lines (1900m level)
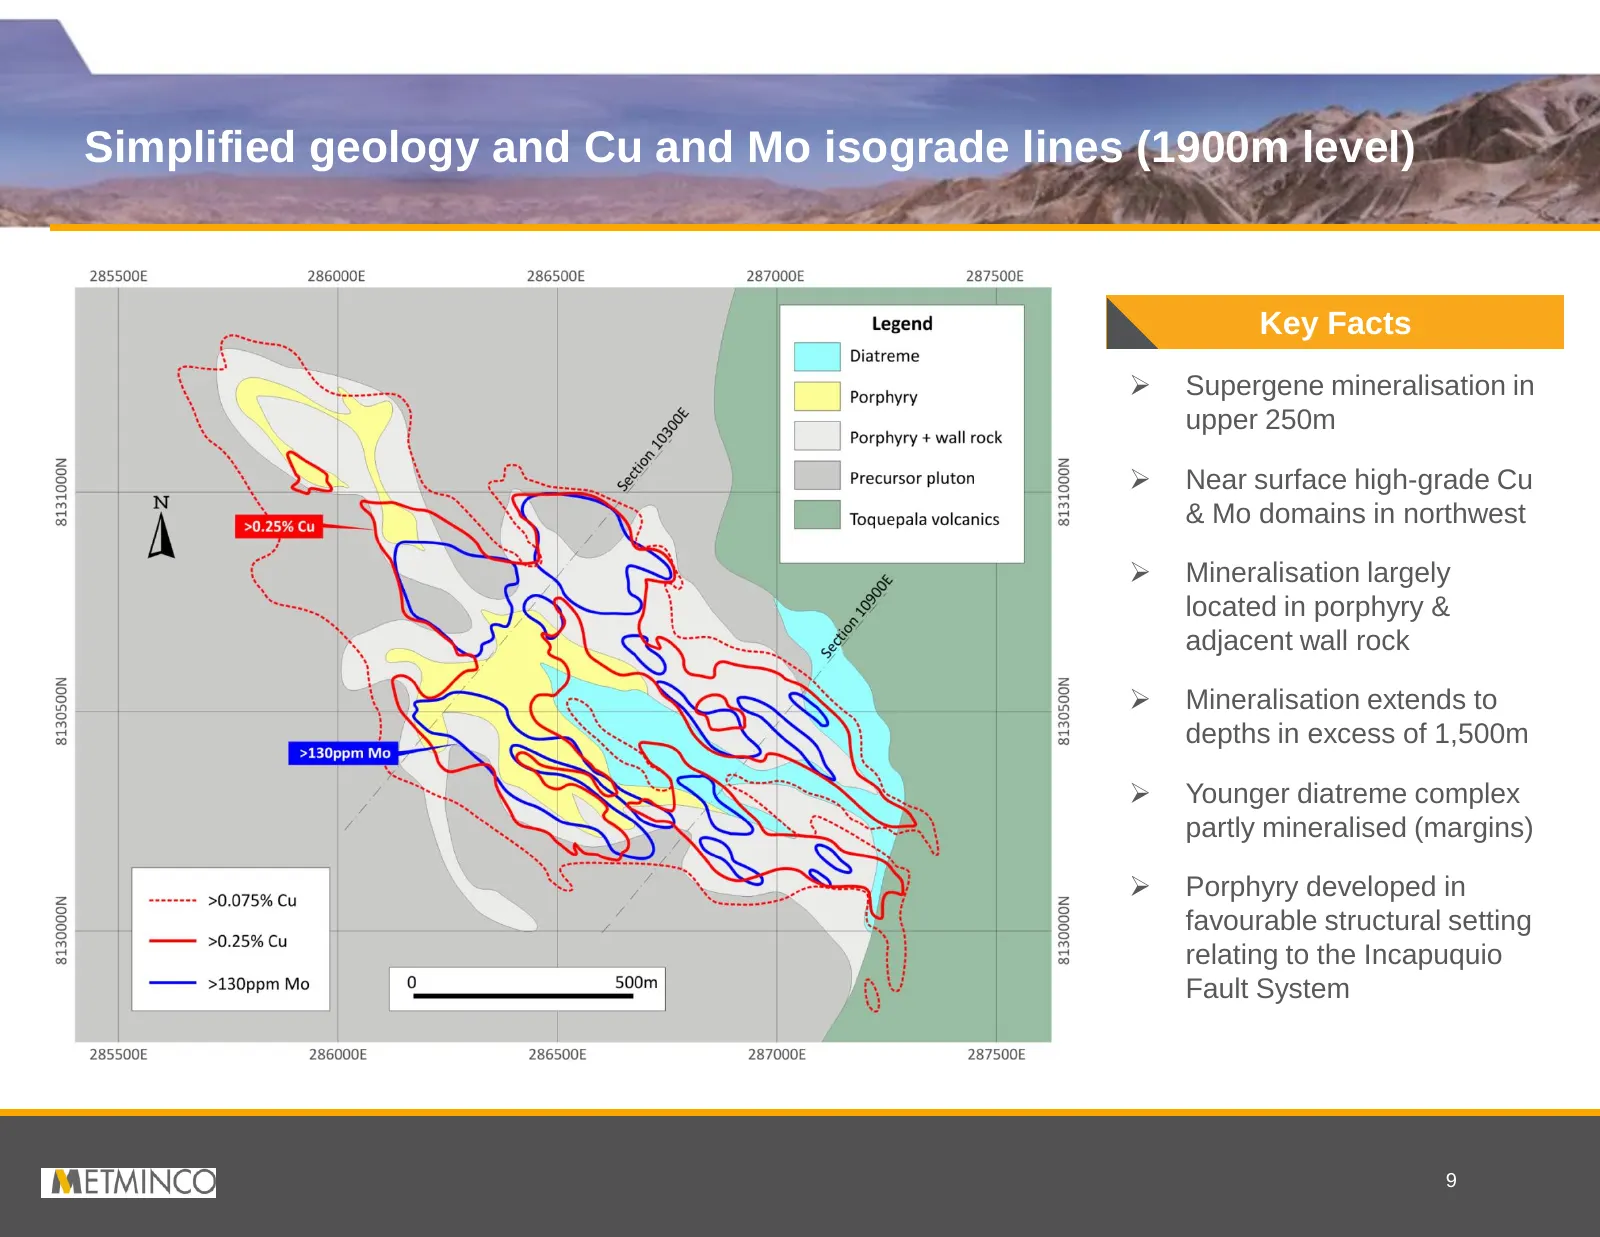
Simplified geology and Cu and Mo isograde lines (1900m level) Key Facts Supergene mineralisation in upper 250m Near surface high-grade Cu & Mo domains in northwest Mineralisation largely located in porphyry & adjacent wall rock Mineralisation extends to depths in excess of 1,500m Younger d
Slide 11: Geological sections – distribution of Cu mineralisation
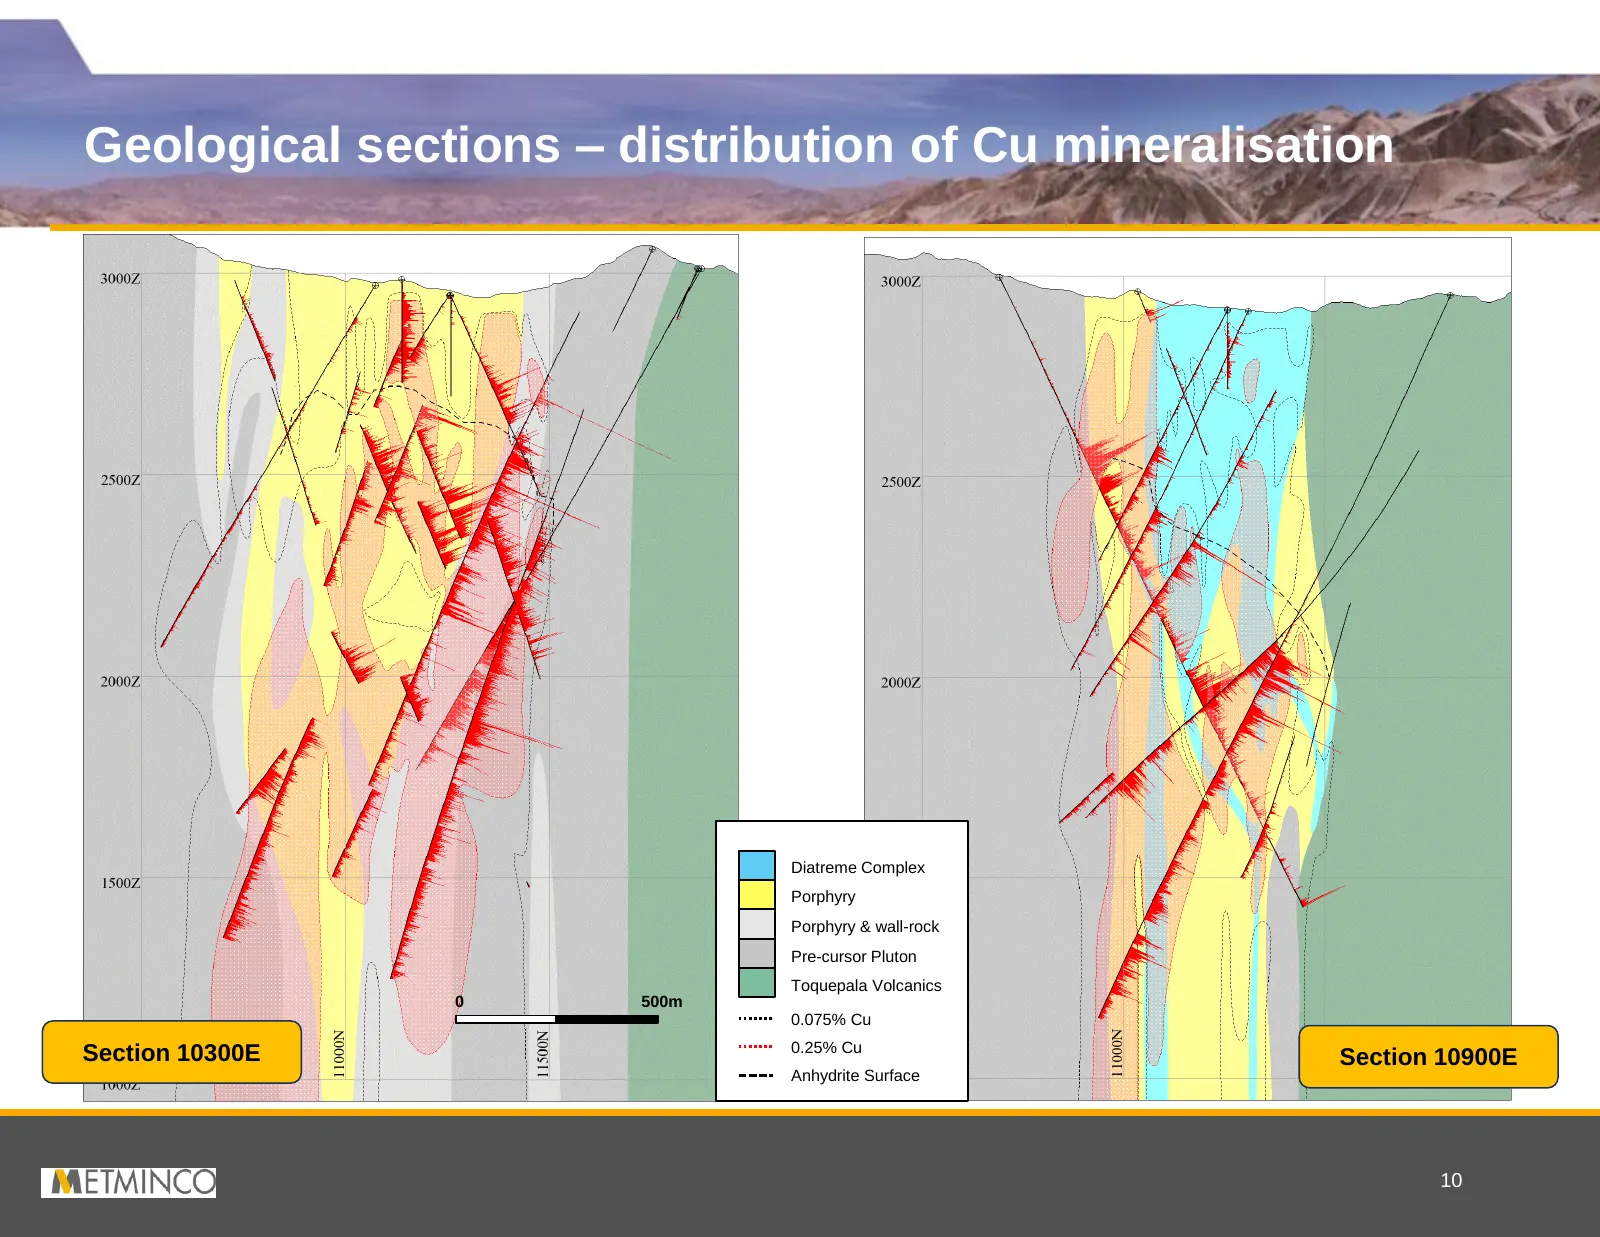
Geological sections – distribution of Cu mineralisation Diatreme Complex Porphyry Porphyry & wall-rock Pre-cursor Pluton Toquepala Volcanics 0 500m 0.075% Cu Section 10300E 0.25% Cu Section 10900E Anhydrite Surface 10
Slide 12: Mineral Resource Statement - February 2013
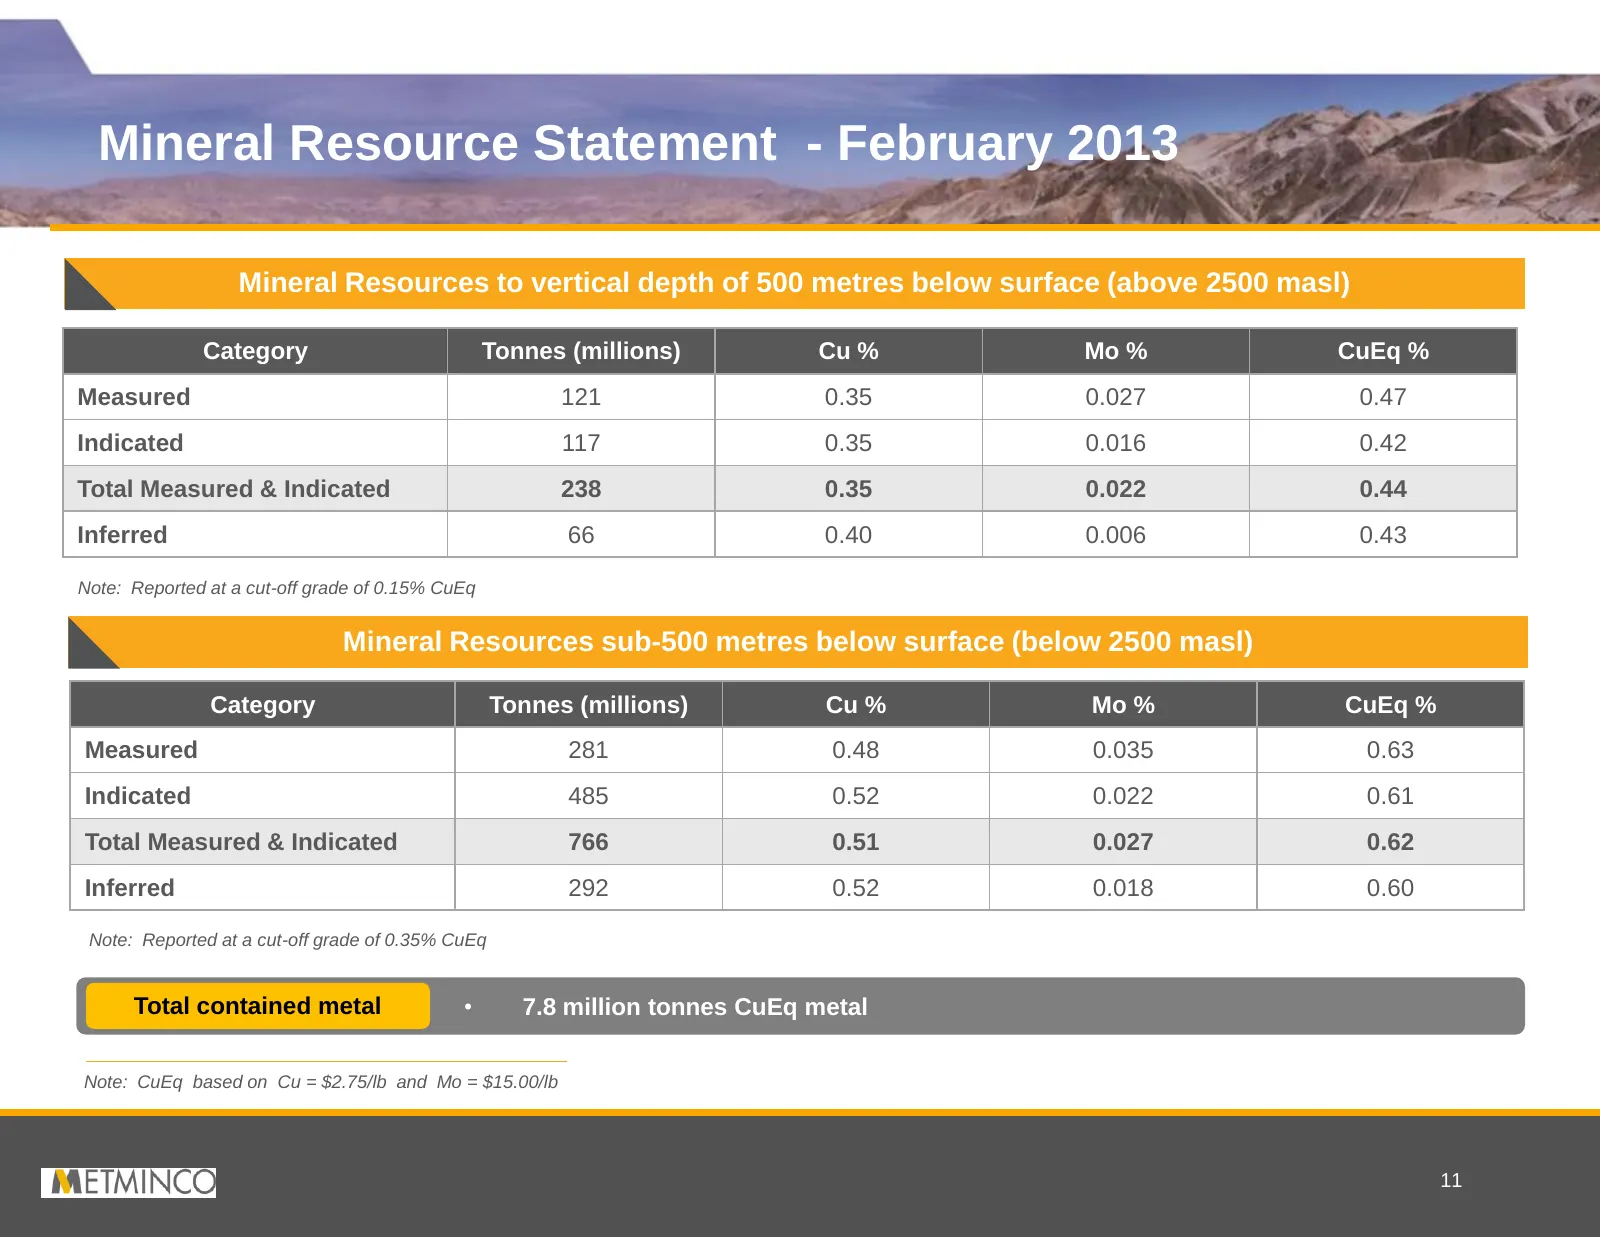
Mineral Resource Statement - February 2013 Mineral Resources to vertical depth of 500 metres below surface (above 2500 masl) Category Tonnes (millions) Cu % Mo % CuEq % Measured 121 0.35 0.027 0.47 Indicated 117 0.35 0.016 0.42 Total Measured & Indicated 238 0.35 0.022 0.44 Inferred 66 0.40 0.006 0.
Slide 13: Scoping study forms basis of optimisation work
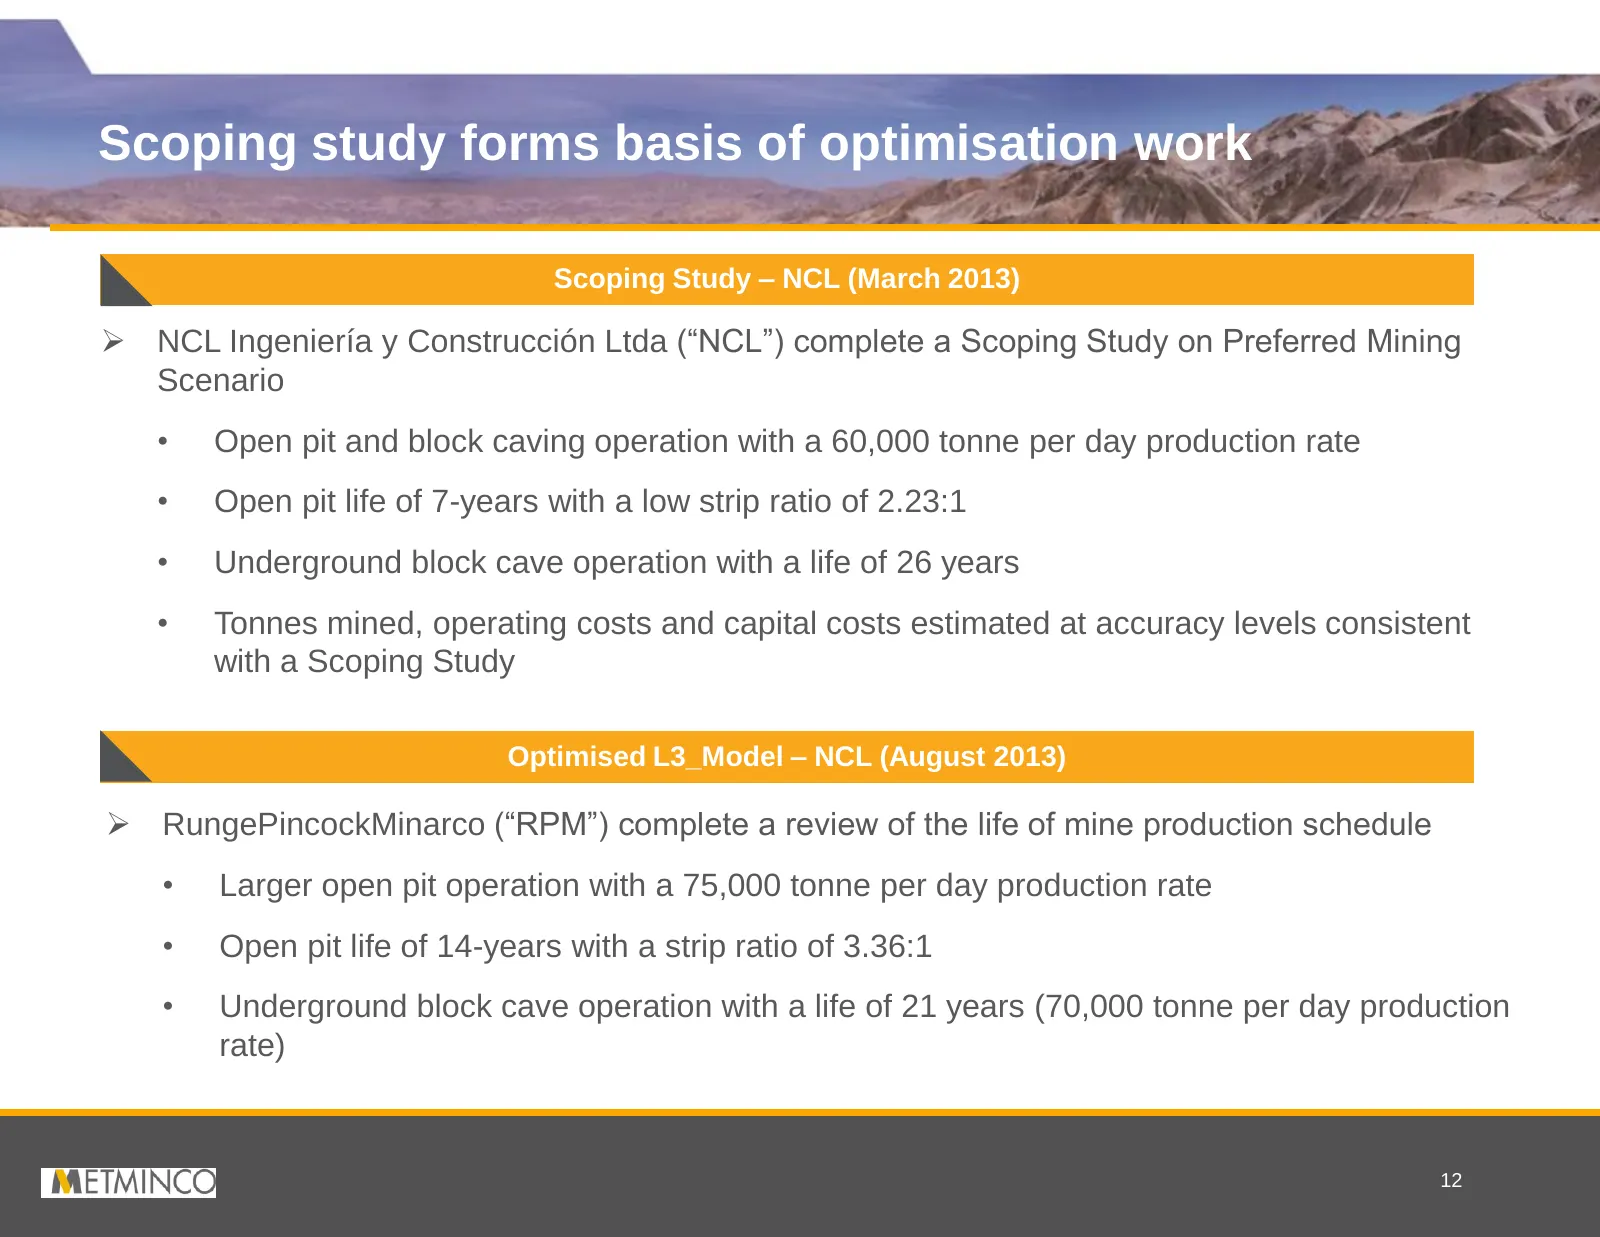
Scoping study forms basis of optimisation work Scoping Study – NCL (March 2013) NCL Ingeniería y Construcción Ltda (“NCL”) complete a Scoping Study on Preferred Mining Scenario • Open pit and block caving operation with a 60,000 tonne per day production rate • Open pit life of 7-years with a low s
Slide 14: Schematic section – preferred mining scenario
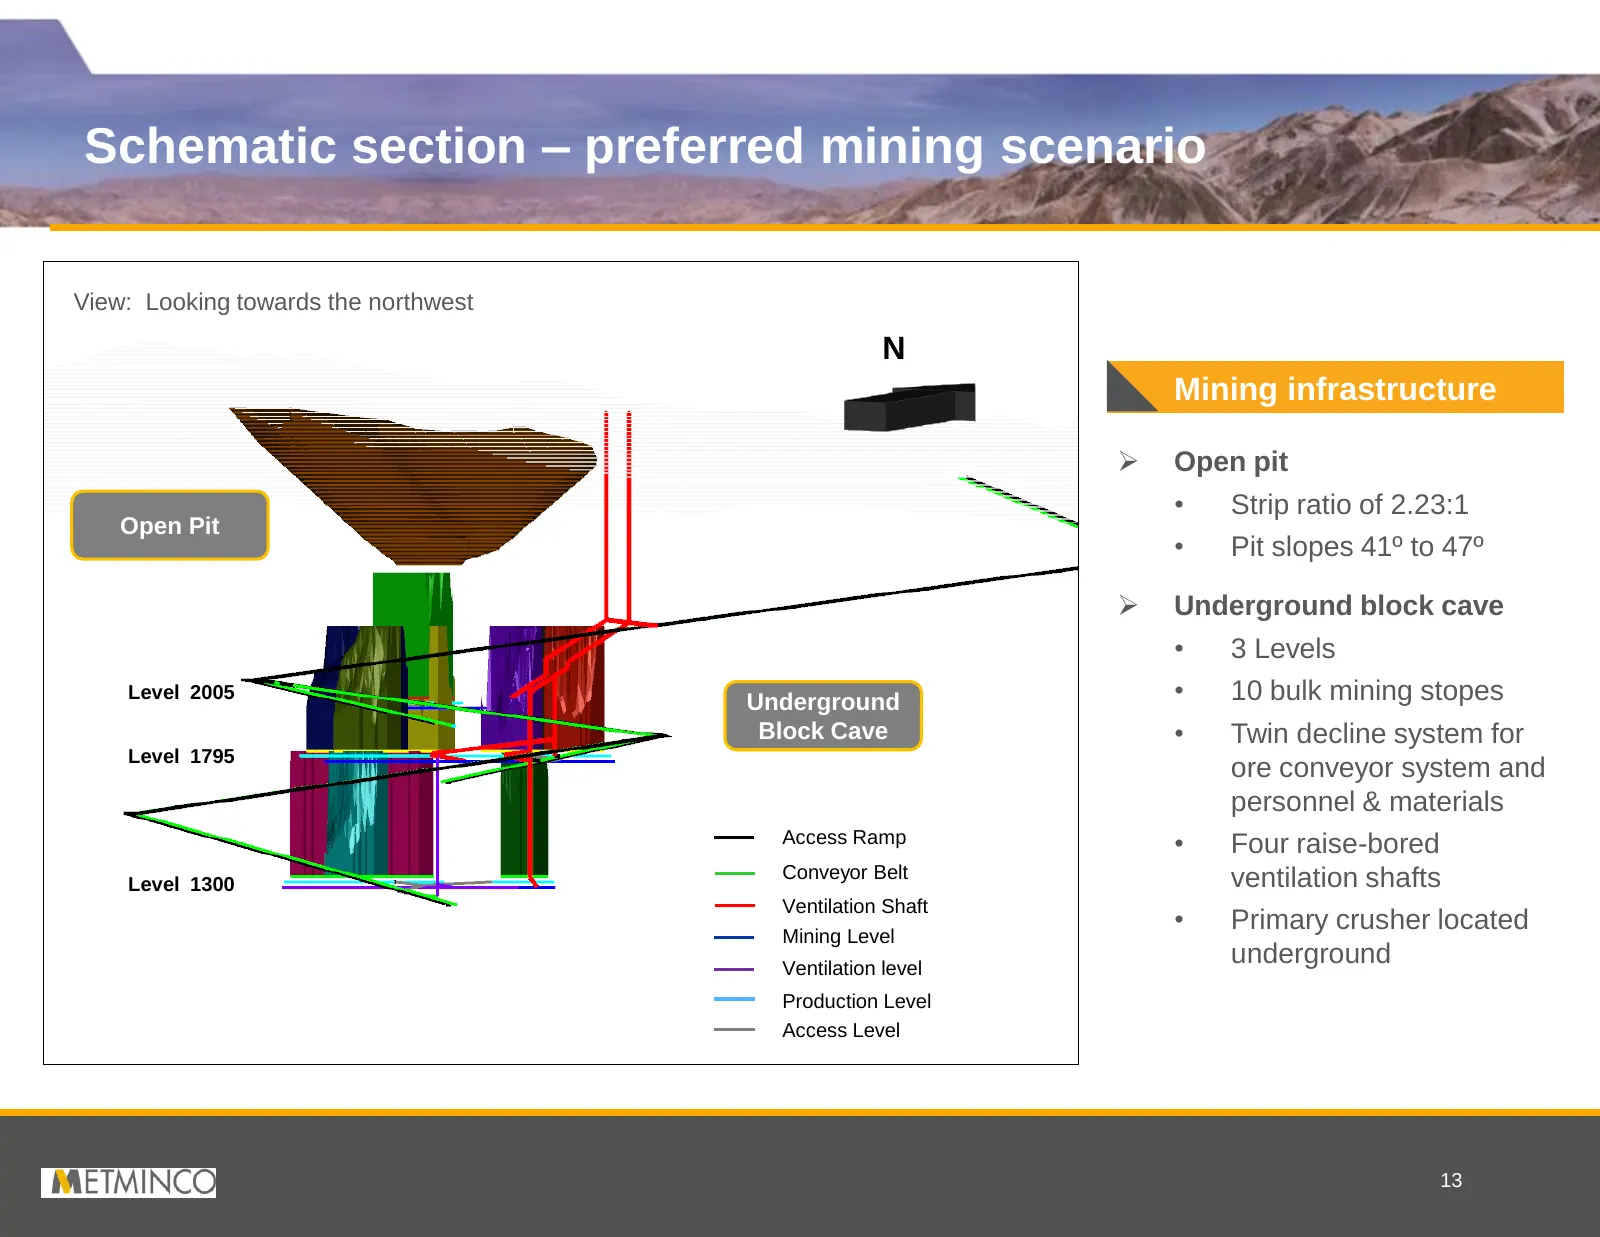
Schematic section – preferred mining scenario View: Looking towards the northwest N Mining infrastructure Open pit • Strip ratio of 2.23:1 Open Pit • Pit slopes 41º to 47º Underground block cave • 3 Levels Level 2005 Underground • 10 bulk mining stopes Block Cave • Twin decline system for Level
Slide 15: Block cave stopes constrained by 0.35% CuEq envelope
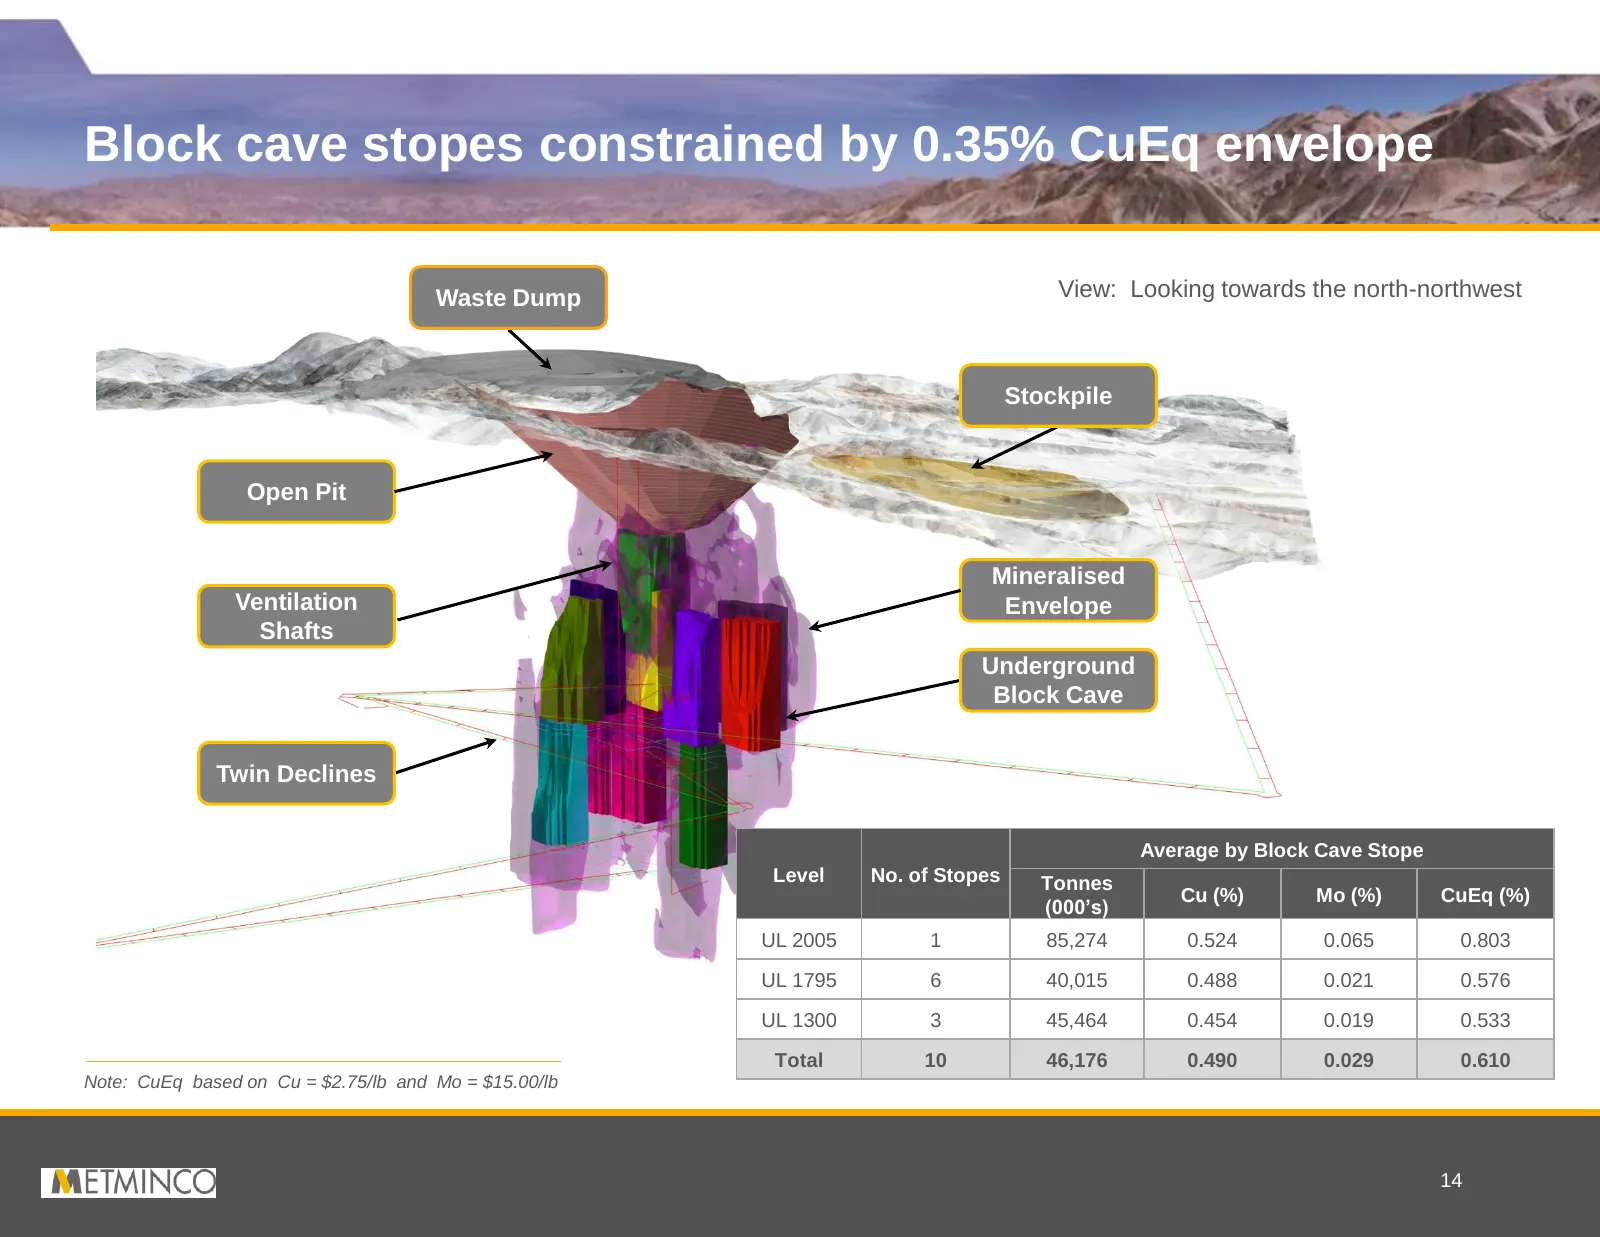
Block cave stopes constrained by 0.35% CuEq envelope Waste Dump View: Looking towards the north-northwest Stockpile Open Pit Mineralised Ventilation Envelope Shafts Underground Block Cave Twin Declines Average by Block Cave Stope Level No. of Stopes Tonnes Cu (%) Mo (%) CuEq (%) (000’s) UL 2005 1 85
Slide 16: Preferred Mining Scenario – tonnes mined and grade
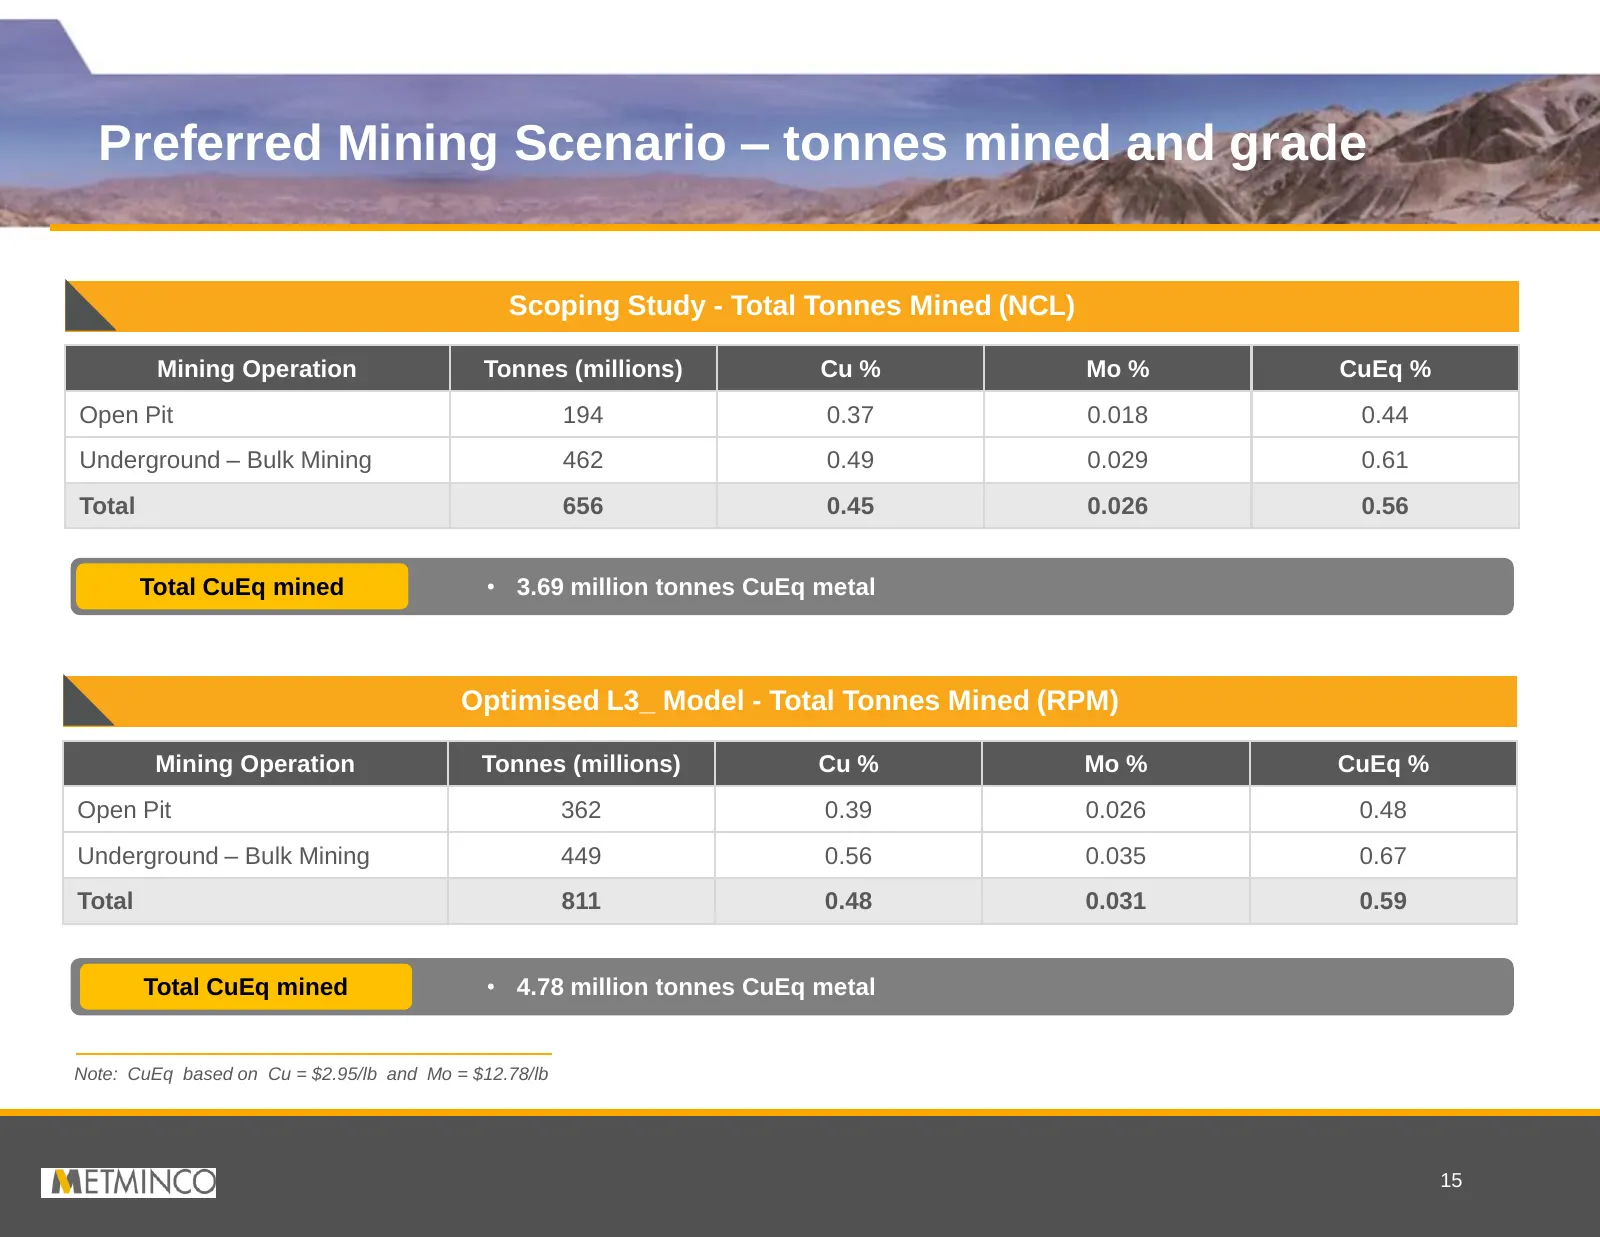
Preferred Mining Scenario – tonnes mined and grade Scoping Study - Total Tonnes Mined (NCL) Mining Operation Tonnes (millions) Cu % Mo % CuEq % Open Pit 194 0.37 0.018 0.44 Underground – Bulk Mining 462 0.49 0.029 0.61 Total 656 0.45 0.026 0.56 Total CuEq mined • 3.69 million tonnes CuEq metal Optim
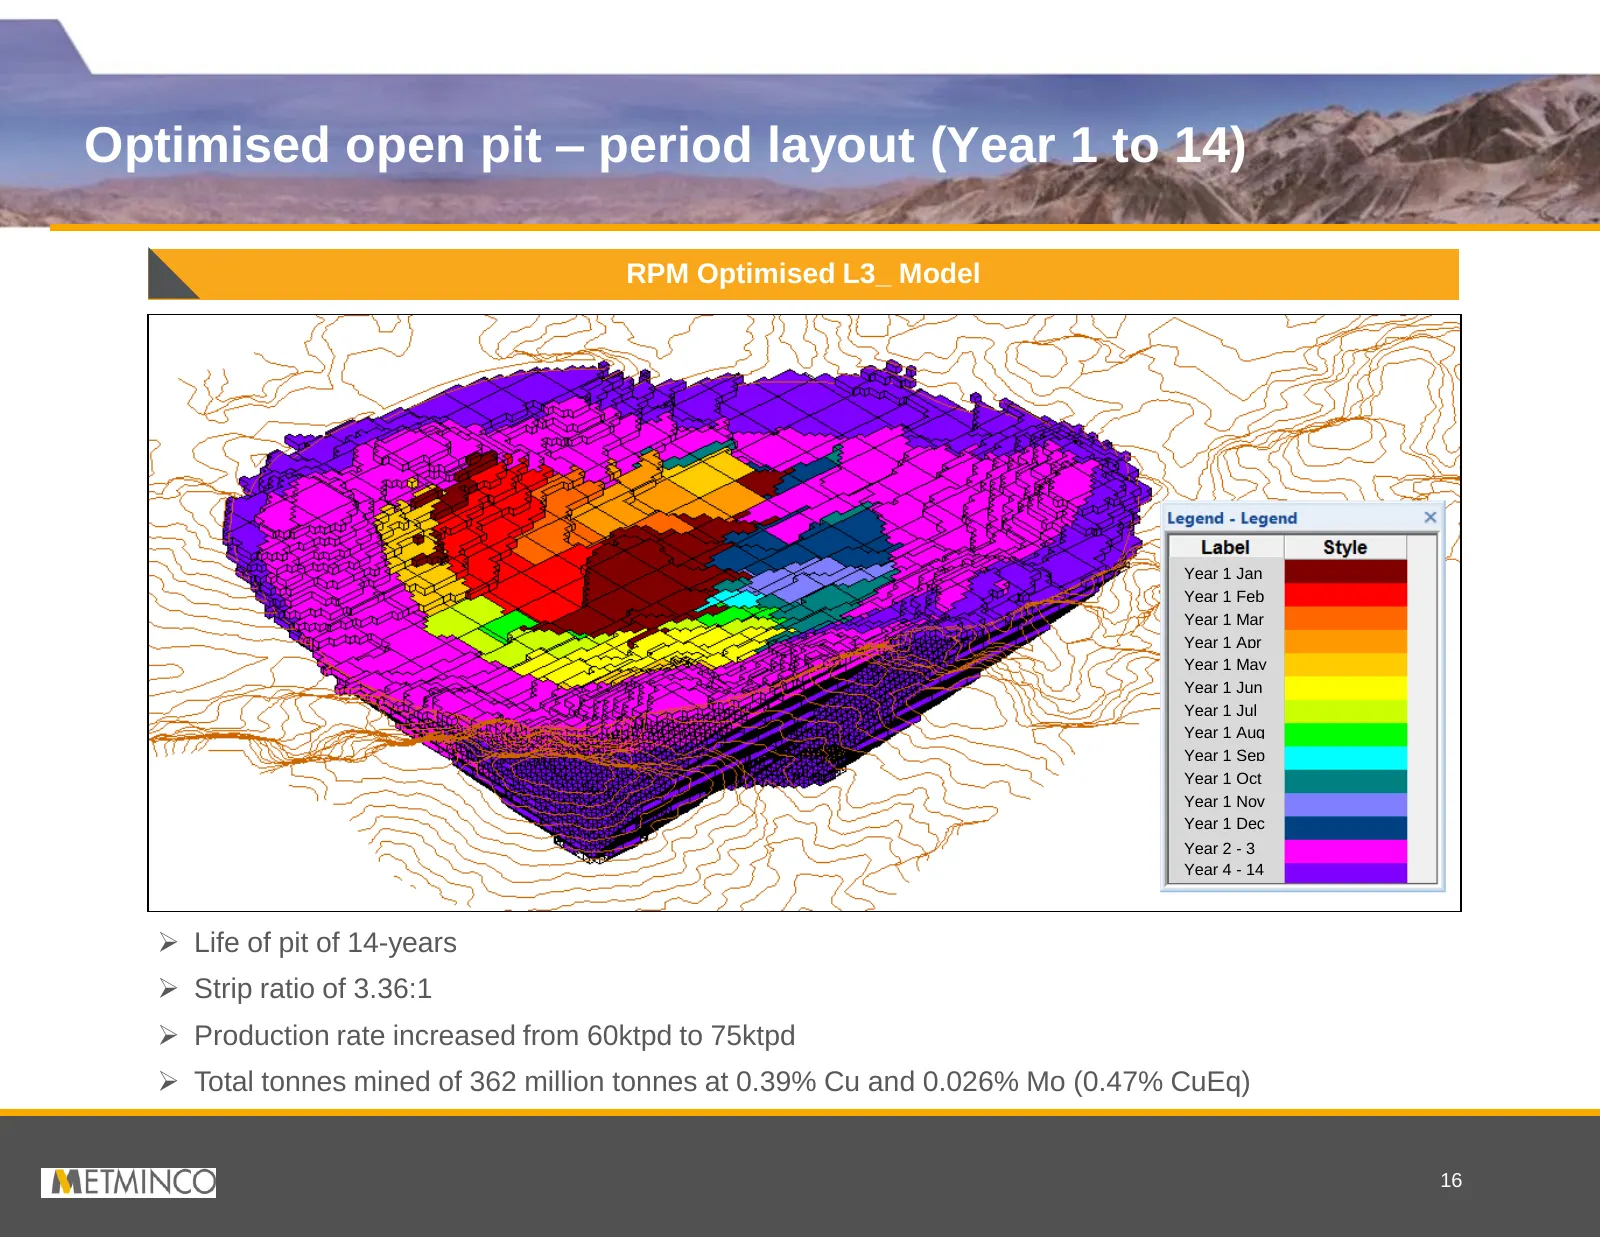
Slide 17: Optimised open pit – period layout (Year 1 to 14)
Optimised open pit – period layout (Year 1 to 14) RPM Optimised L3_ Model Year 1 Jan Year 1 Feb Year 1 Mar Year 1 Apr Year 1 May Year 1 Jun Year 1 Jul Year 1 Aug Year 1 Sep Year 1 Oct Year 1 Nov Year 1 Dec Year 2 - 3 Year 4 - 14 Life of pit of 14-years Strip ratio of 3.36:1 Production rate inc
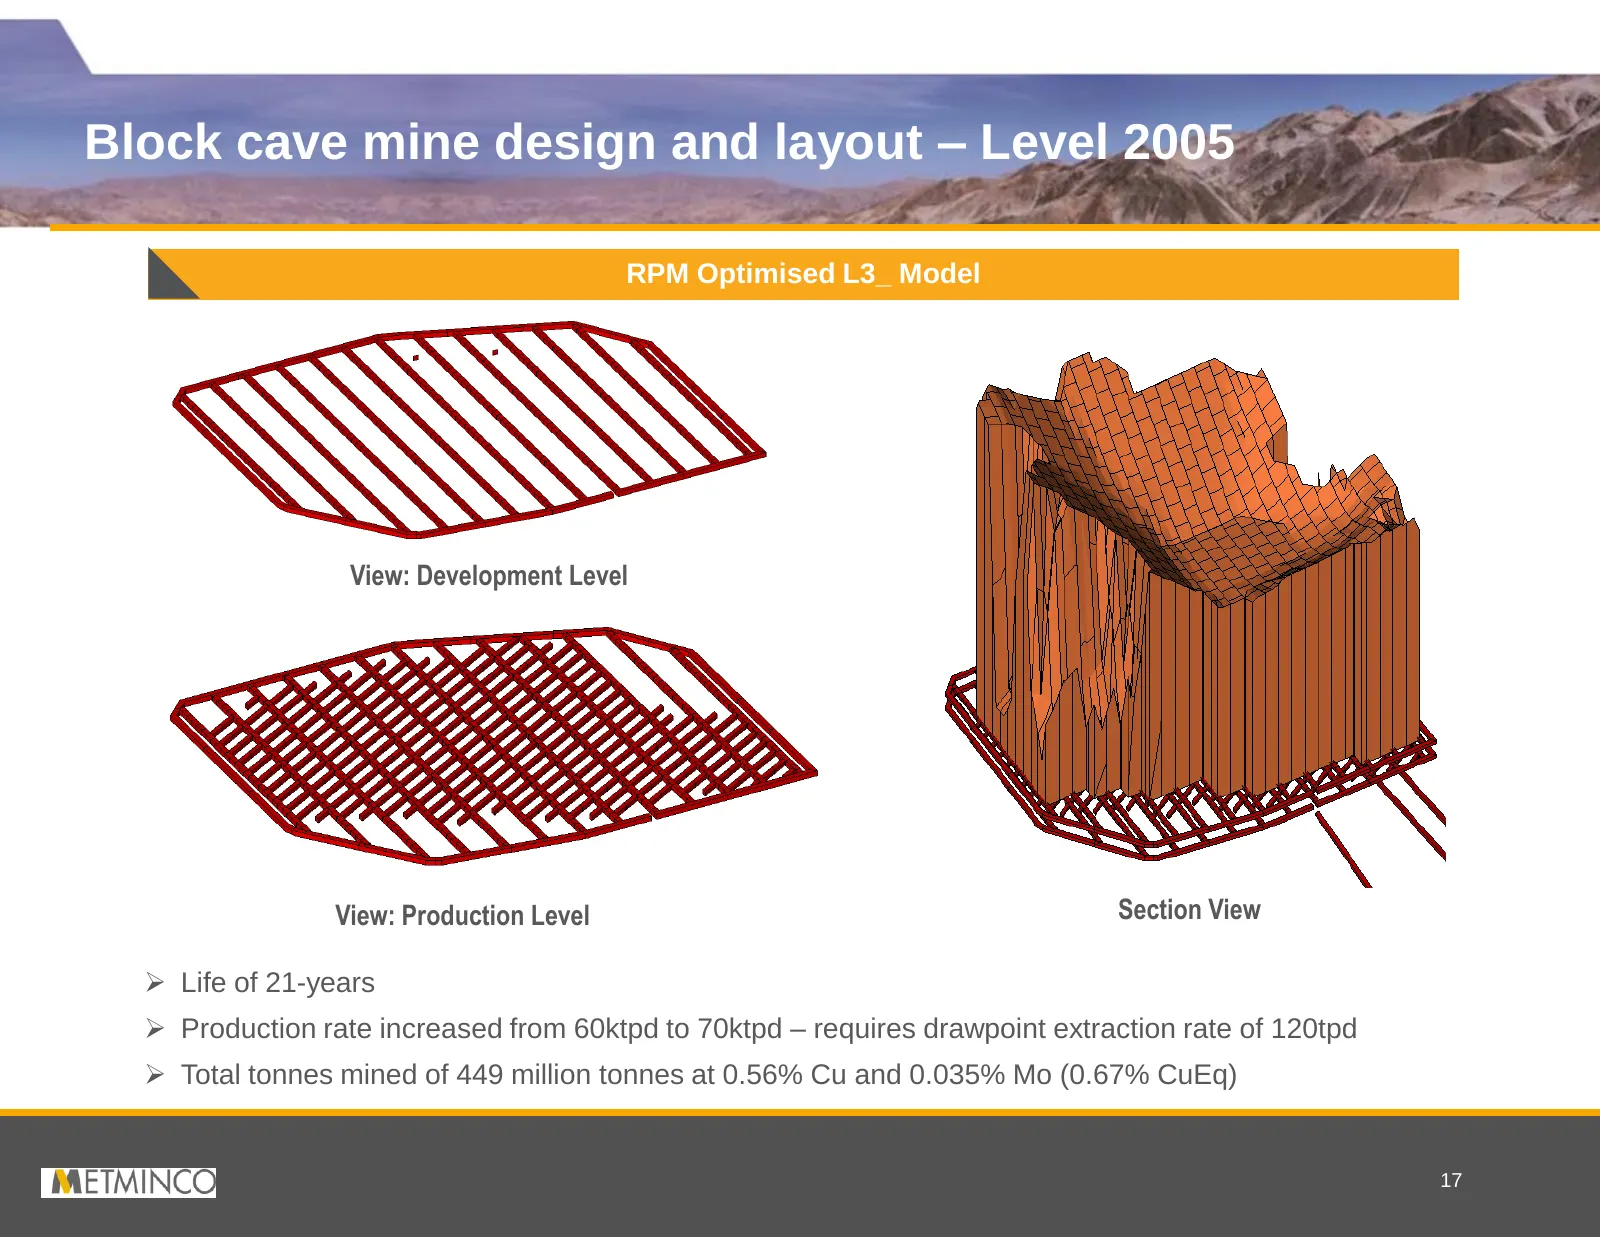
Slide 18: Block cave mine design and layout – Level 2005
Block cave mine design and layout – Level 2005 RPM Optimised L3_ Model View: Development Level View: Production Level Section View Life of 21-years Production rate increased from 60ktpd to 70ktpd – requires drawpoint extraction rate of 120tpd Total tonnes mined of 449 million tonnes at 0.56% C
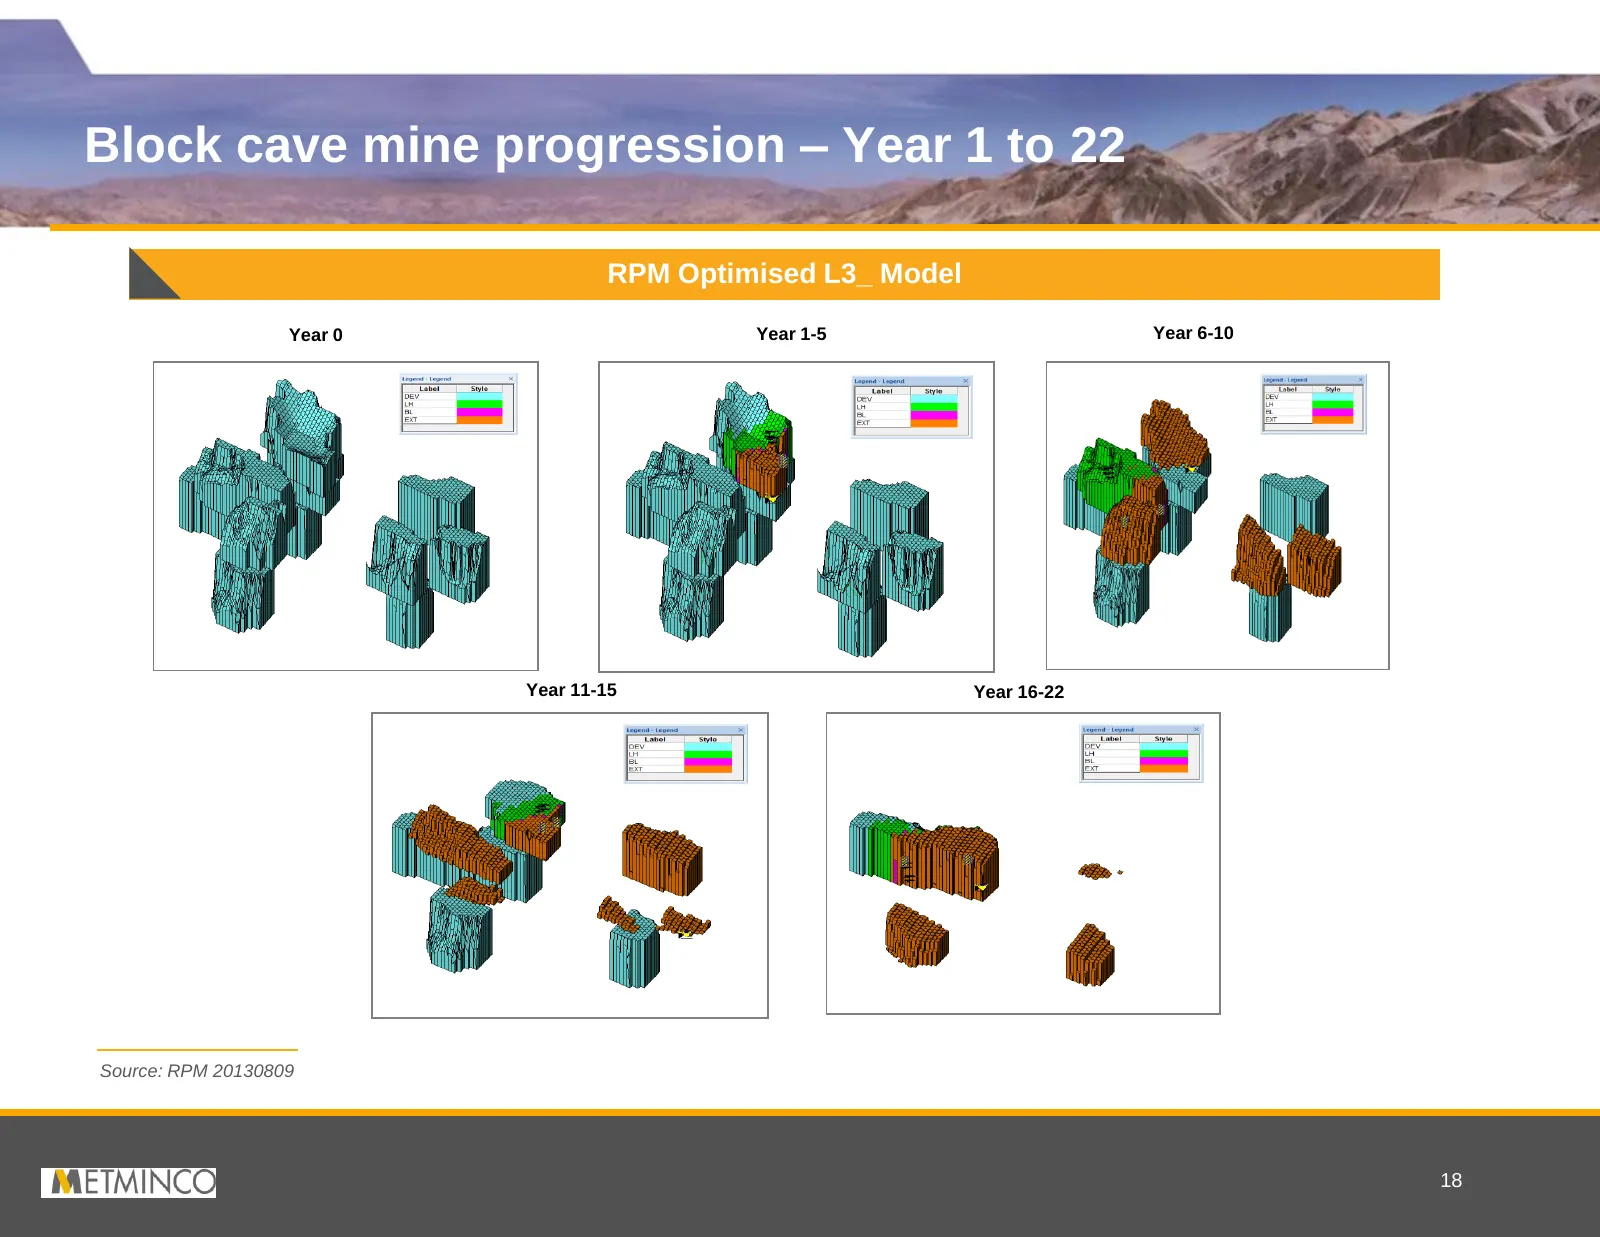
Slide 19: Block cave mine progression – Year 1 to 22
Block cave mine progression – Year 1 to 22 RPM Optimised L3_ Model Year 0 Year 1-5 Year 6-10 Year 11-15 Year 16-22 Source: RPM 20130809 18
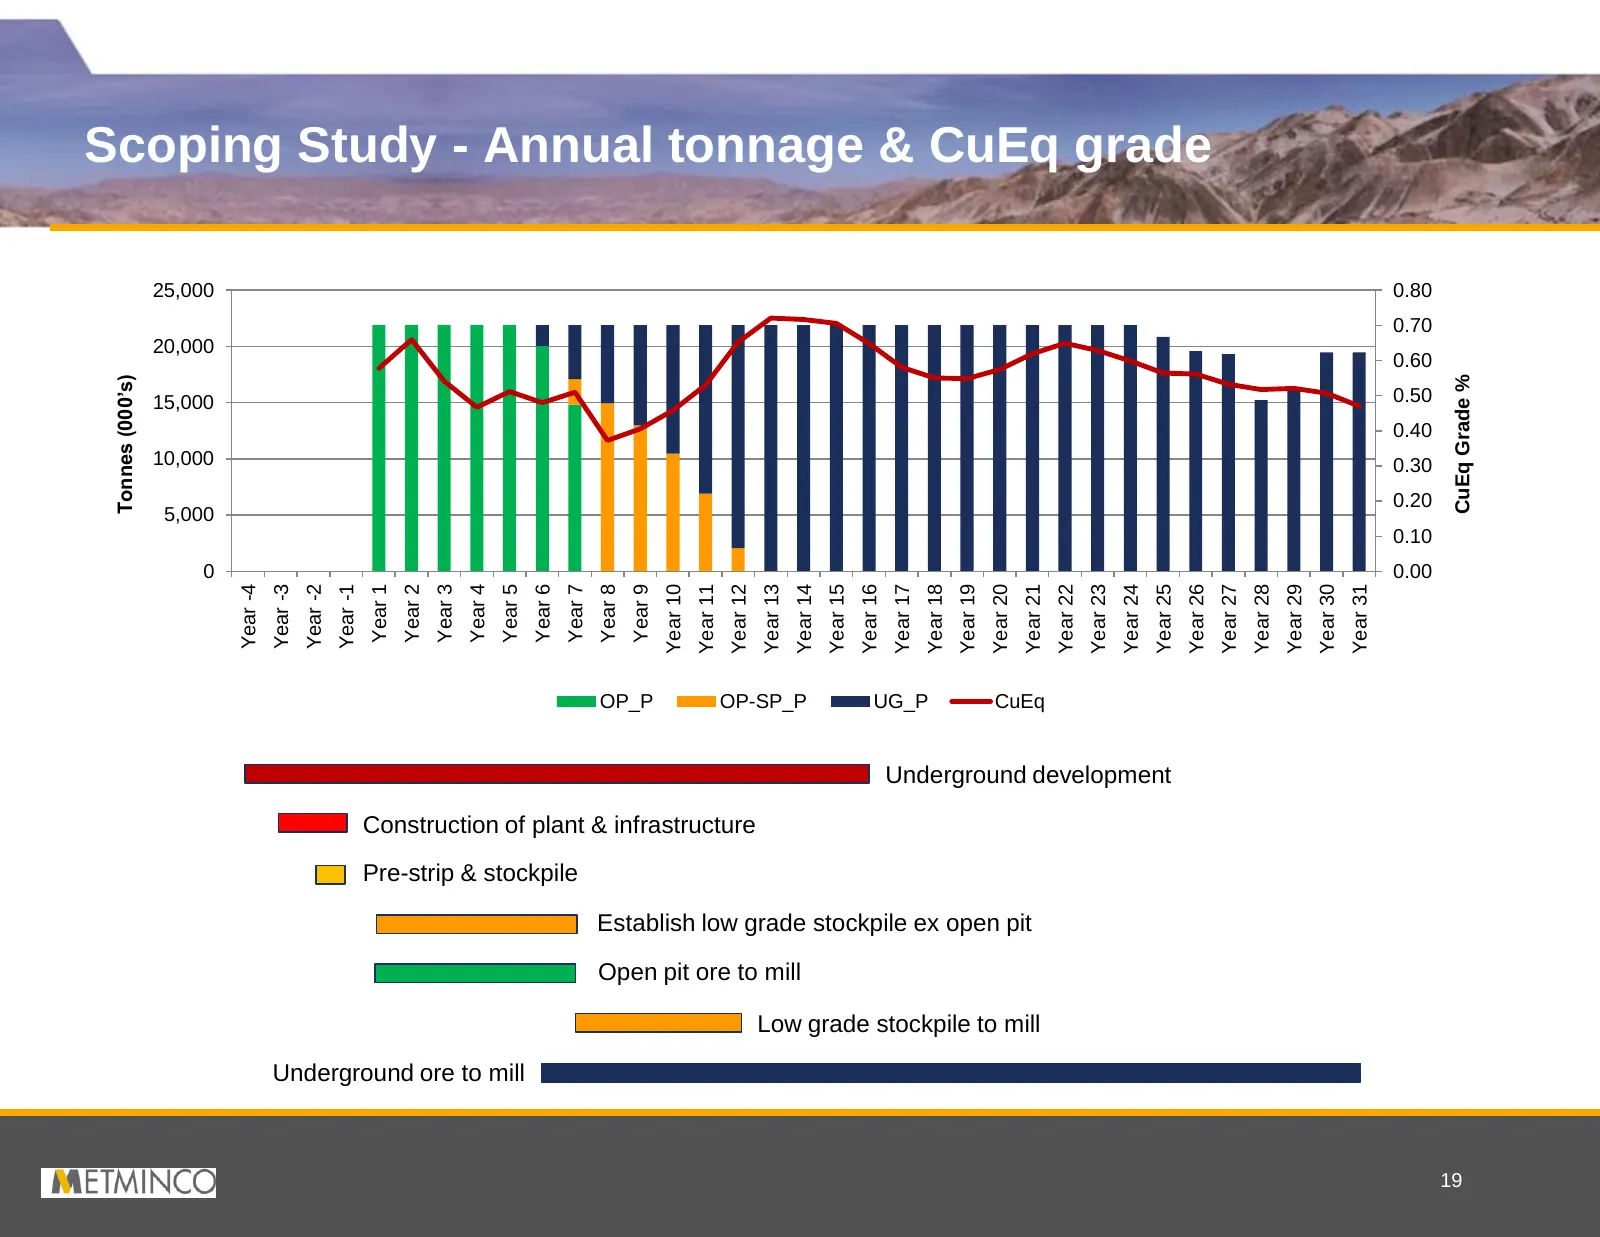
Slide 20: Scoping Study - Annual tonnage & CuEq grade
Scoping Study - Annual tonnage & CuEq grade 25,000 0.80 0.70 20,000 0.60 Tonnes (000’s) CuEq Grade % 15,000 0.50 0.40 10,000 0.30 0.20 5,000 0.10 0 0.00 Year -4 Year -3 Year -2 Year -1 Year 2 Year 1 Year 3 Year 4 Year 5 Year 6 Year 7 Year 8 Year 9 Year 10 Year 11 Year 12 Year 13 Year 14 Year 15 Year
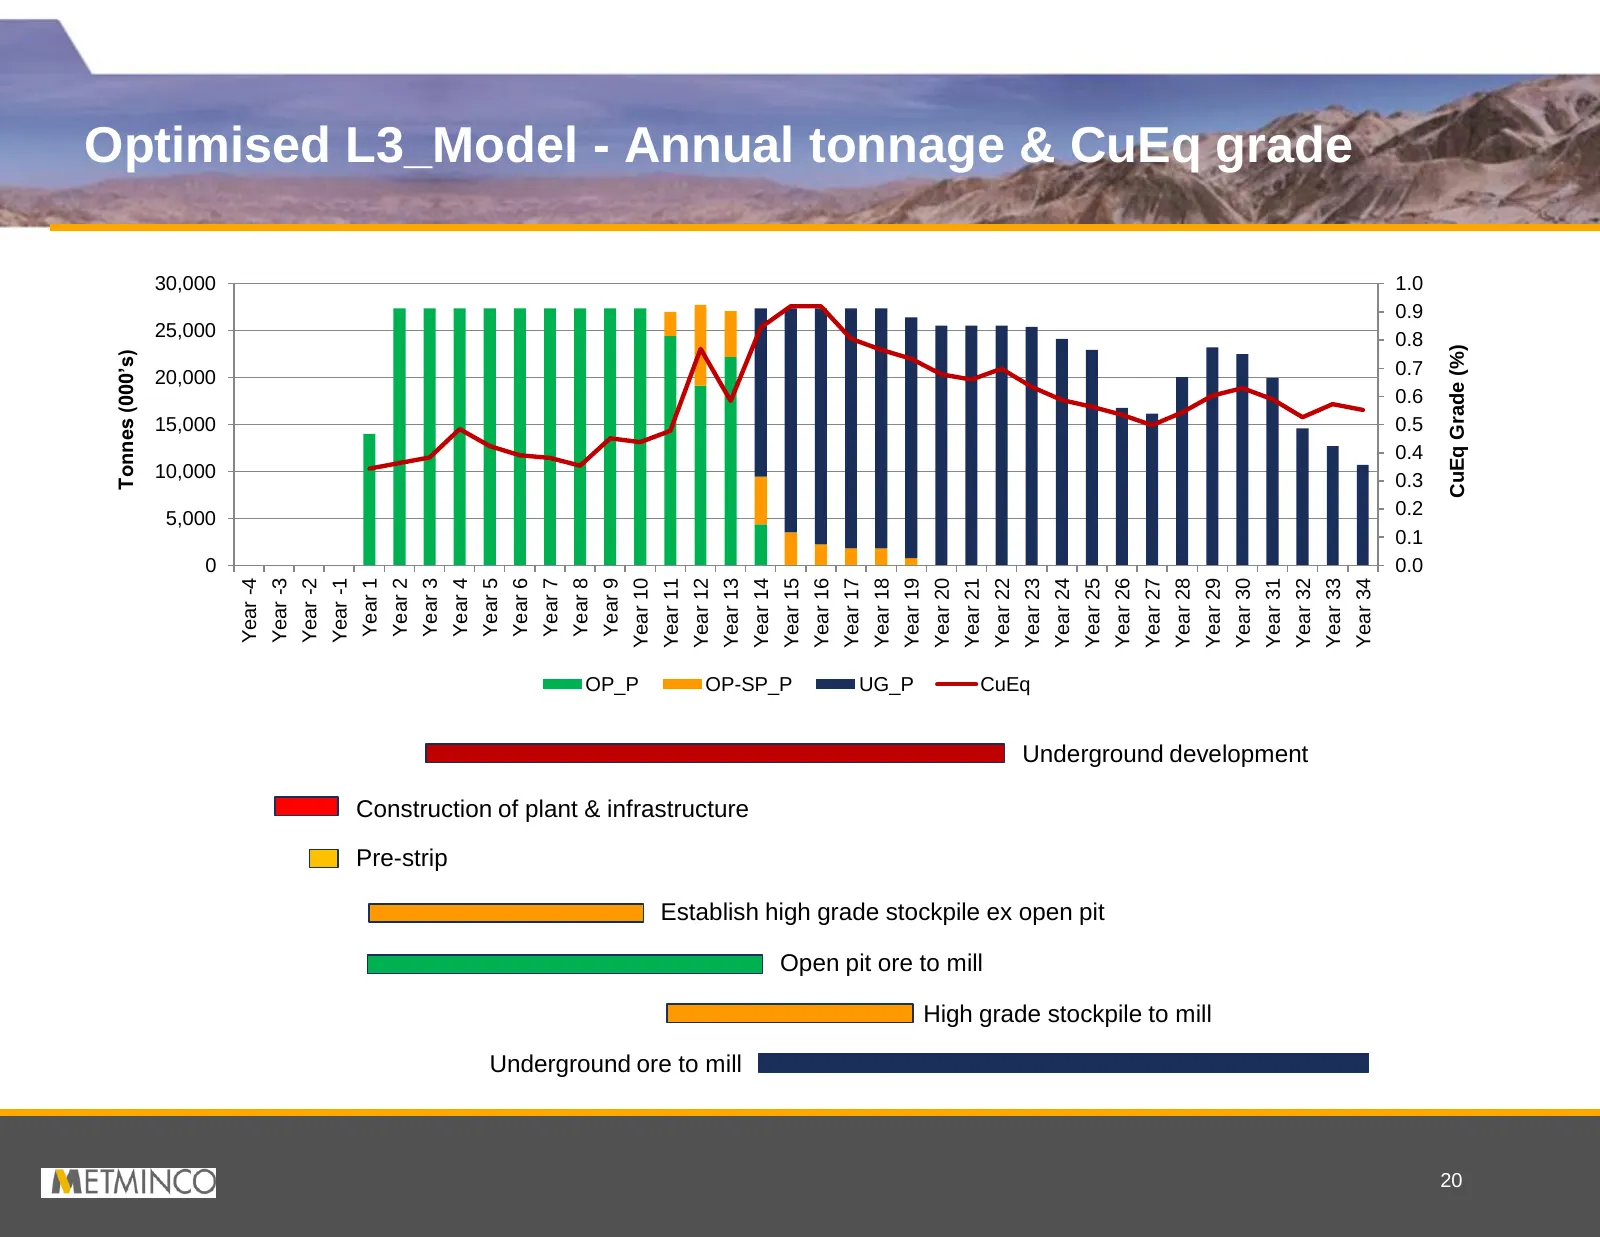
Slide 21: Optimised L3_Model - Annual tonnage & CuEq grade
Optimised L3_Model - Annual tonnage & CuEq grade 30,000 1.0 0.9 25,000 0.8 CuEq Grade (%) Tonnes (000’s) 20,000 0.7 0.6 15,000 0.5 0.4 10,000 0.3 5,000 0.2 0.1 0 0.0 Year -4 Year -3 Year -2 Year -1 Year 1 Year 2 Year 3 Year 4 Year 5 Year 6 Year 7 Year 8 Year 9 Year 10 Year 11 Year 12 Year 13 Year 14
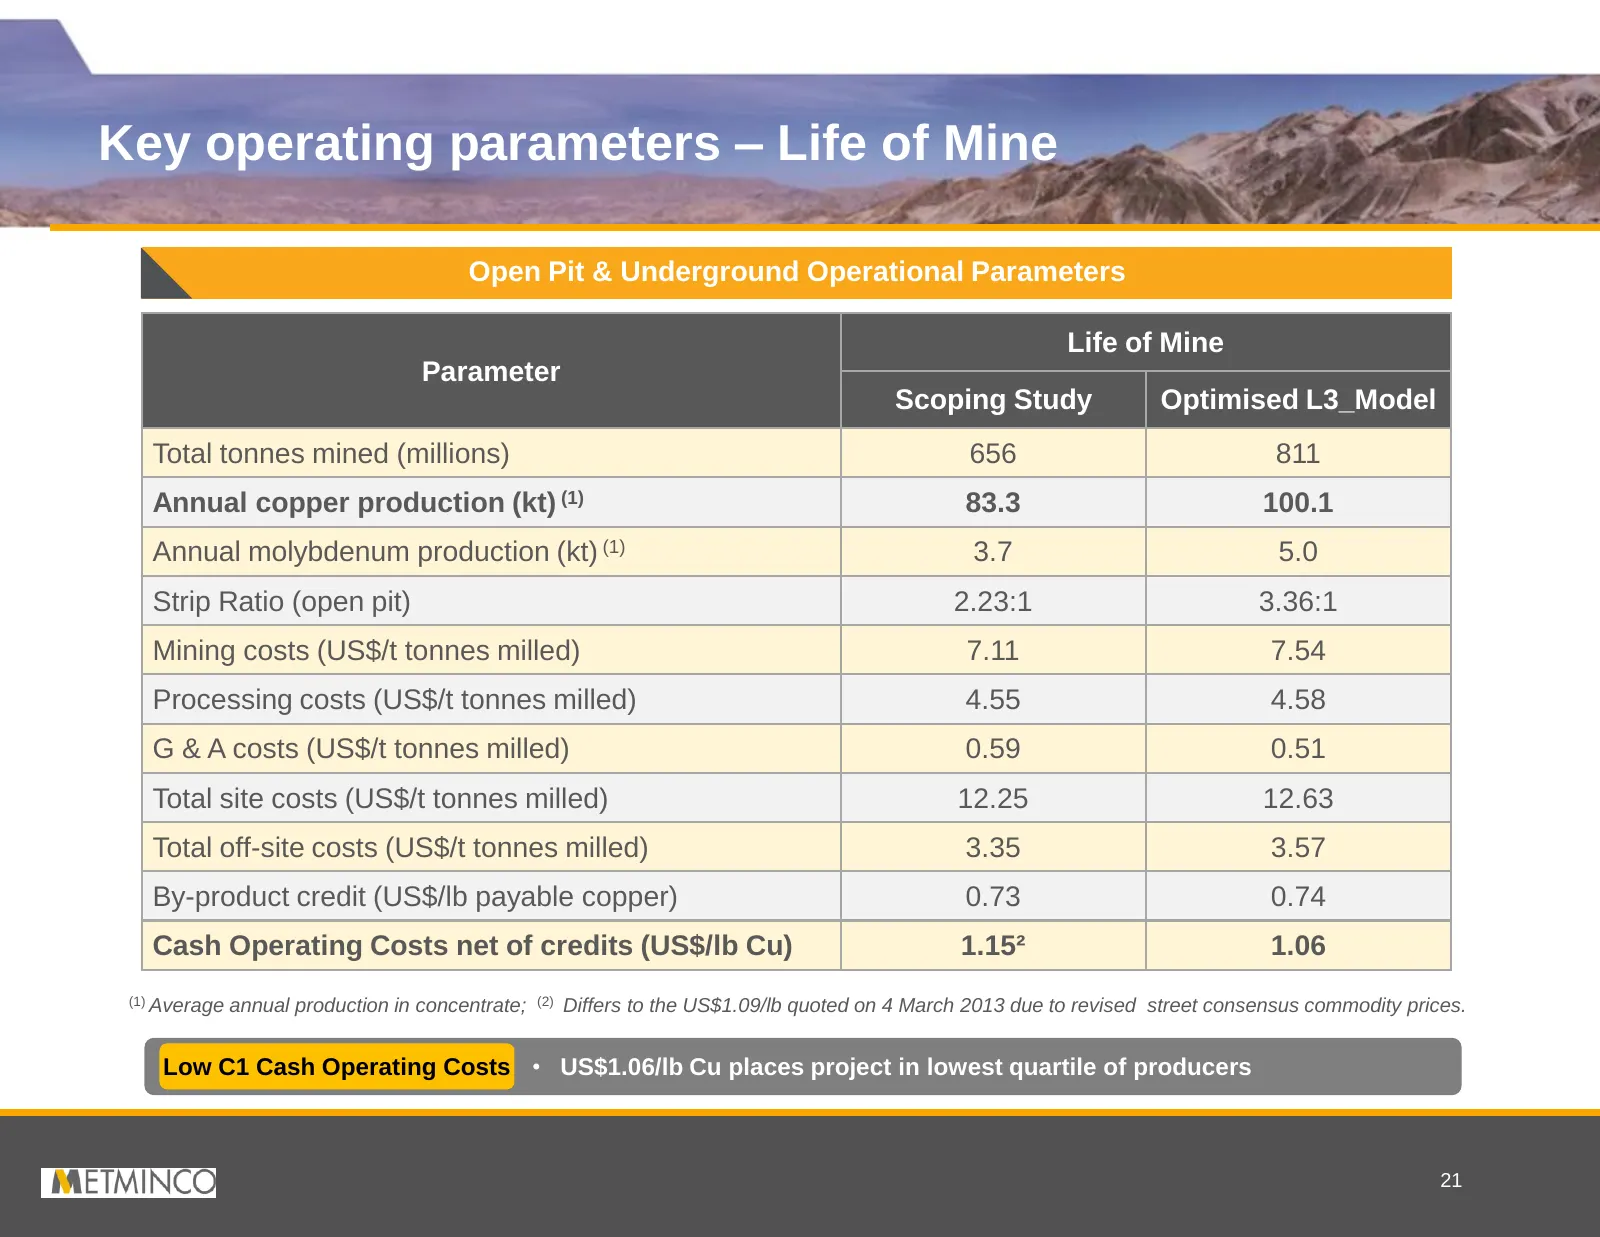
Slide 22: Key operating parameters – Life of Mine
Key operating parameters – Life of Mine Open Pit & Underground Operational Parameters Life of Mine Parameter Scoping Study Optimised L3_Model Total tonnes mined (millions) 656 811 Annual copper production (kt) (1) 83.3 100.1 Annual molybdenum production (kt) (1) 3.7 5.0 Strip Ratio (open pit) 2.23:1
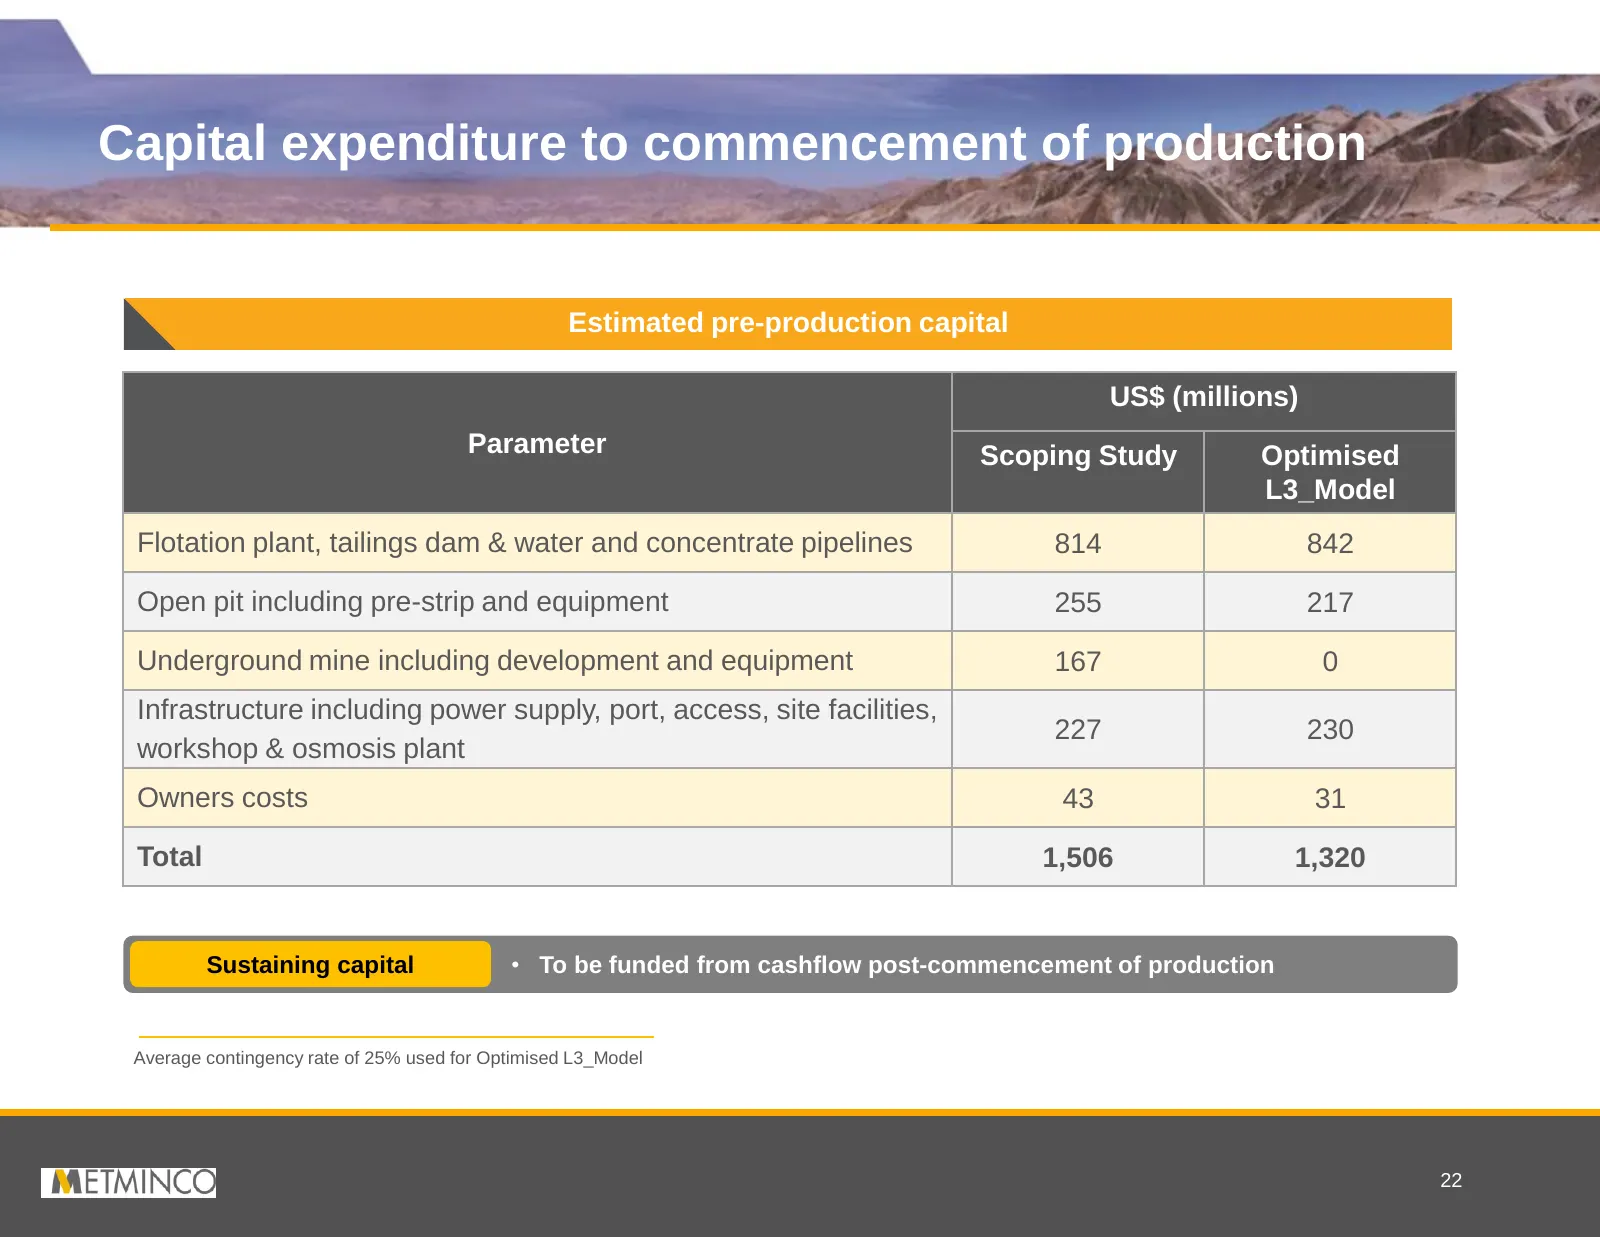
Slide 23: Capital expenditure to commencement of production
Capital expenditure to commencement of production Estimated pre-production capital US$ (millions) Parameter Scoping Study Optimised L3_Model Flotation plant, tailings dam & water and concentrate pipelines 814 842 Open pit including pre-strip and equipment 255 217 Underground mine including developme
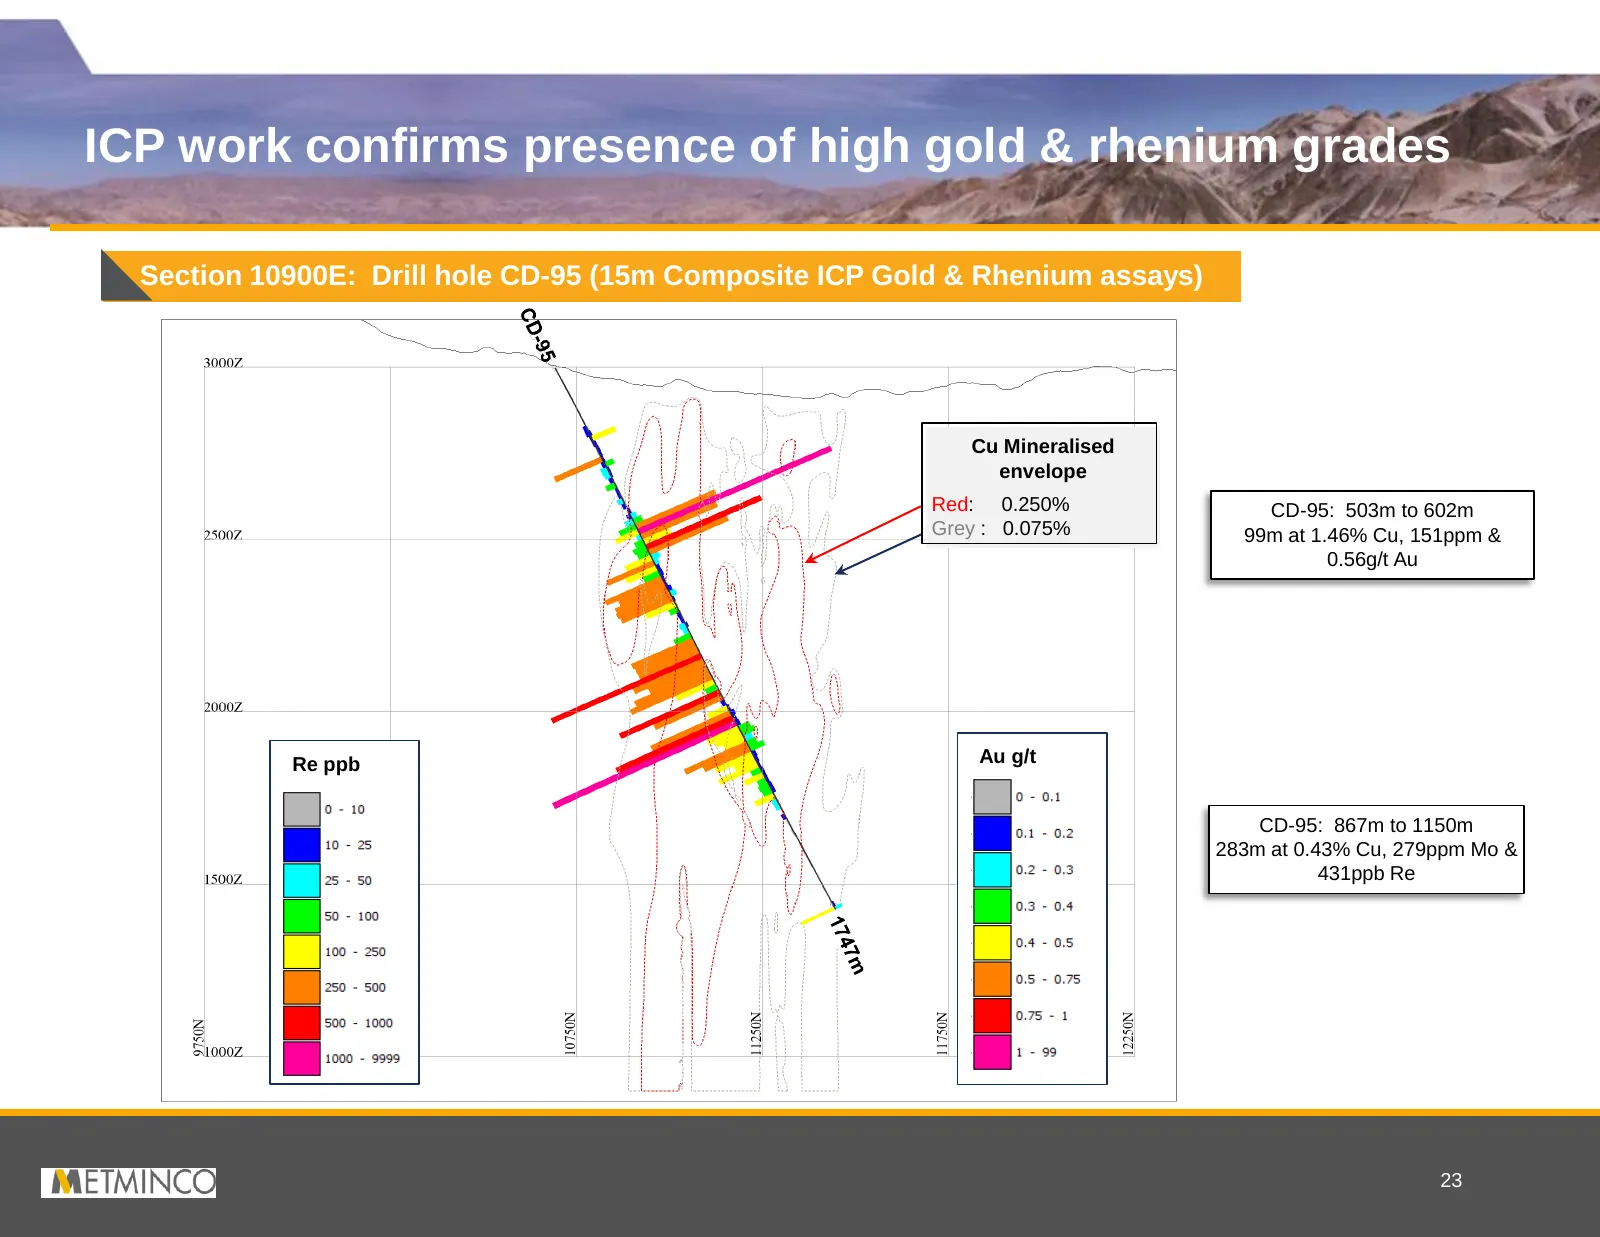
Slide 24: ICP work confirms presence of high gold & rhenium grades
ICP work confirms presence of high gold & rhenium grades Section 10900E: Drill hole CD-95 (15m Composite ICP Gold & Rhenium assays) Cu Mineralised envelope Red: 0.250% CD-95: 503m to 602m Grey : 0.075% 99m at 1.46% Cu, 151ppm & 0.56g/t Au Re ppb Au g/t CD-95: 867m to 1150m 283m at 0.43% Cu, 279ppm M
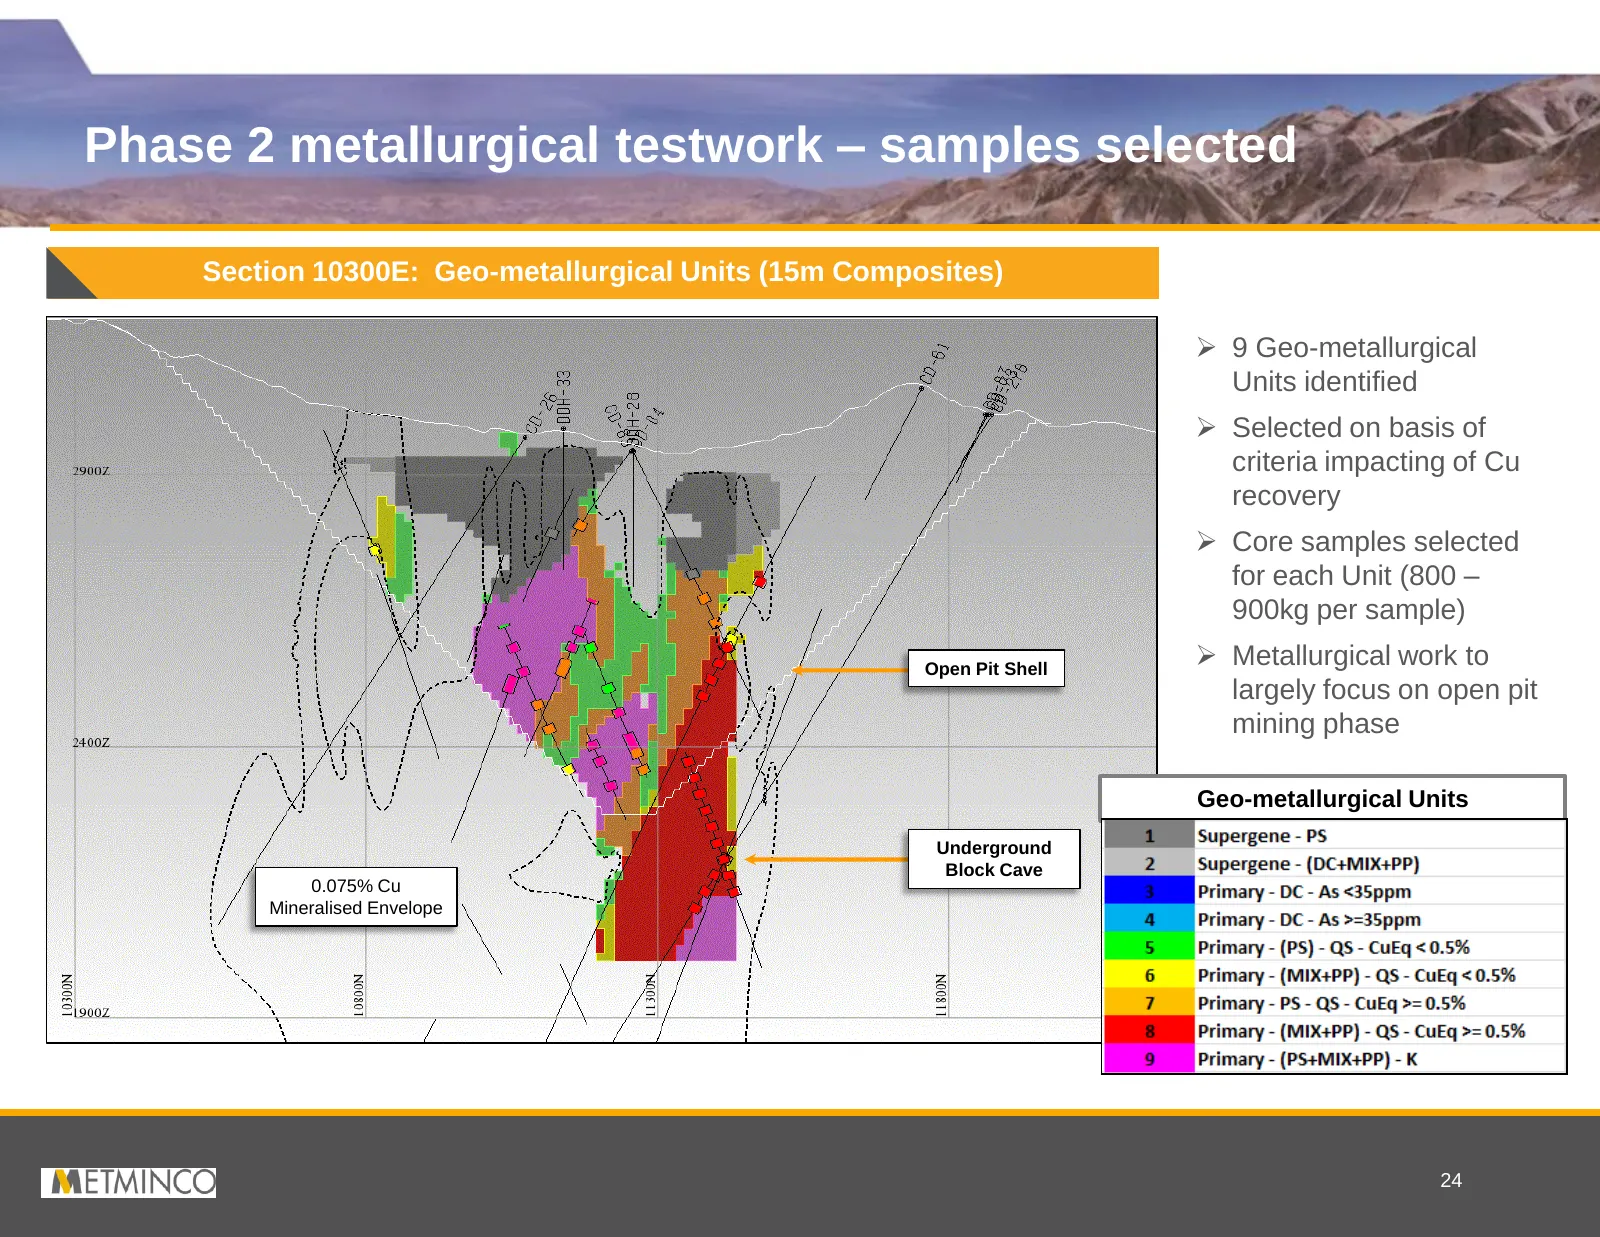
Slide 25: Phase 2 metallurgical testwork – samples selected
Phase 2 metallurgical testwork – samples selected Section 10300E: Geo-metallurgical Units (15m Composites) 9 Geo-metallurgical Units identified Selected on basis of criteria impacting of Cu recovery Core samples selected for each Unit (800 – 900kg per sample) Open Pit Shell Metallurgical wor
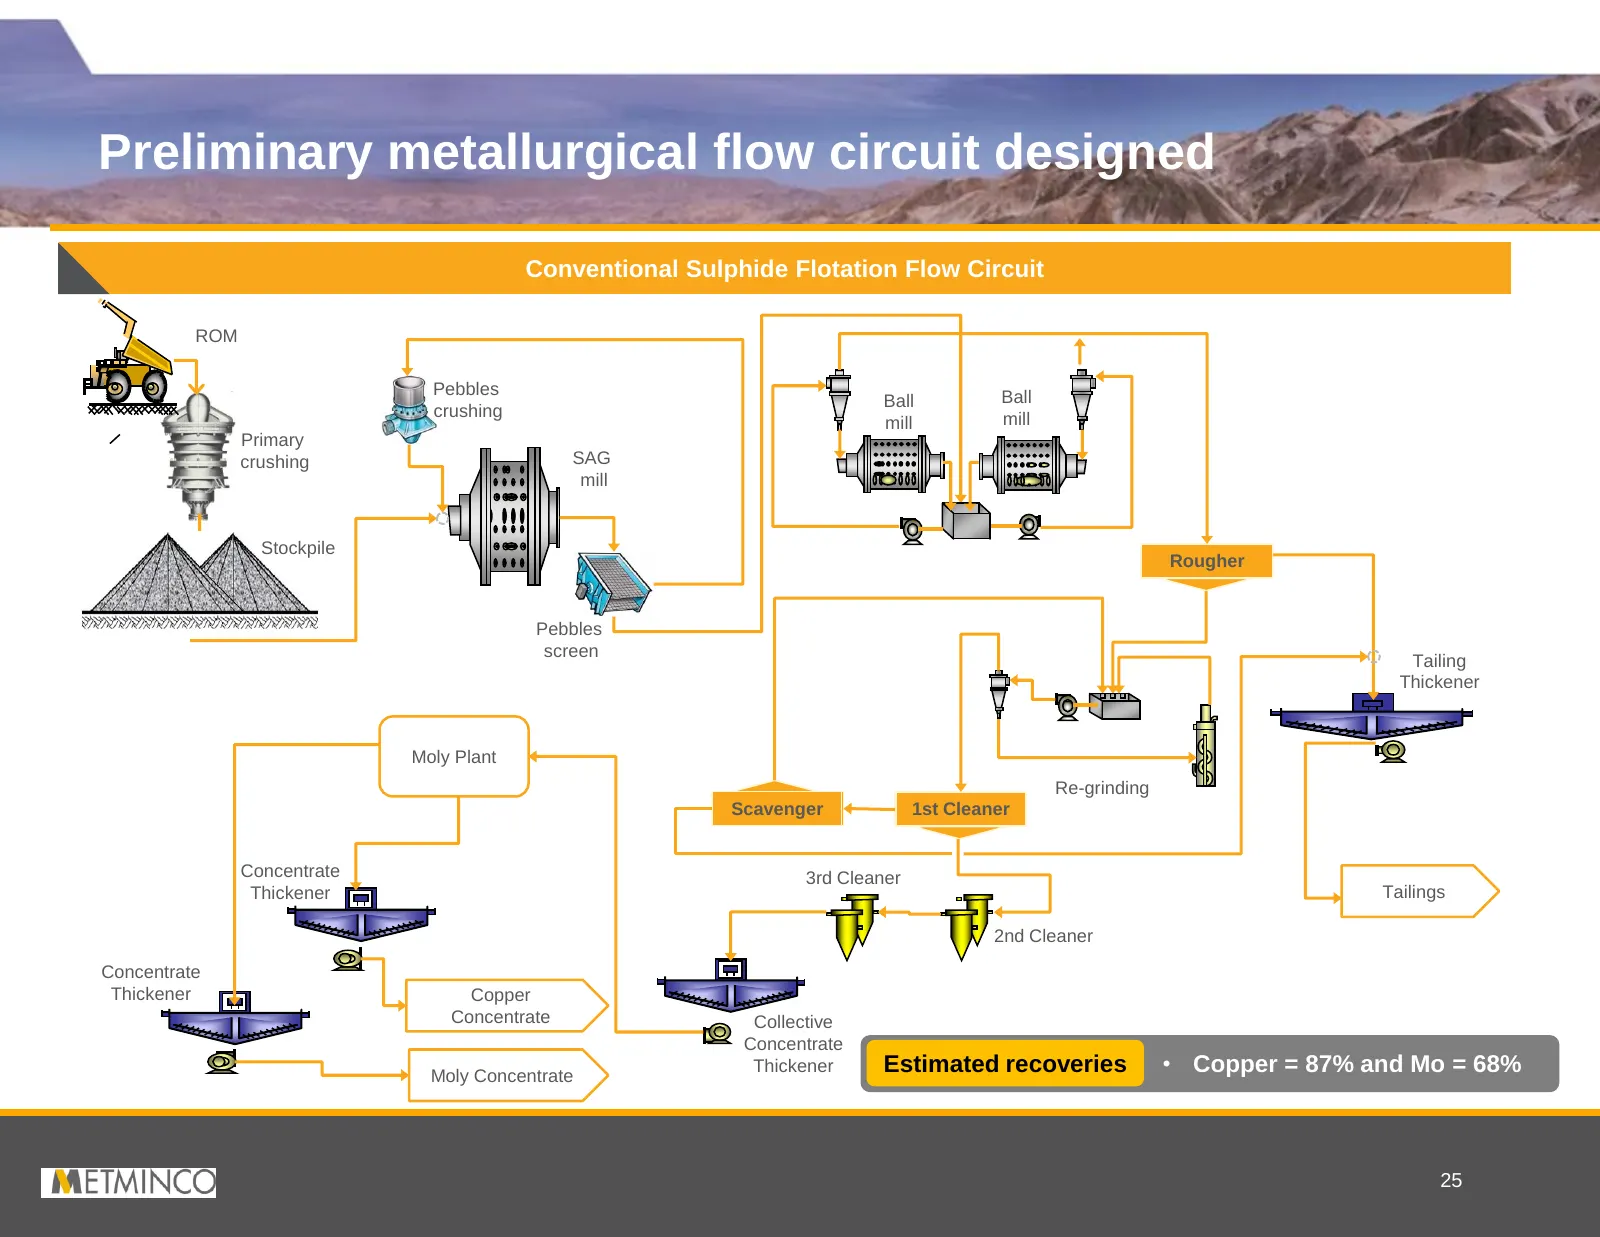
Slide 26: Preliminary metallurgical flow circuit designed
Preliminary metallurgical flow circuit designed Conventional Sulphide Flotation Flow Circuit ROM Pebbles Ball Ball crushing mill mill Primary crushing SAG mill Stockpile Rougher Pebbles screen Tailing Thickener Moly Plant Re-grinding Scavenger 1st Cleaner Concentrate 3rd Cleaner Thickener Tailings 2
Slide 27: Optimisation work in brief
Optimisation work in brief Work conducted by RPM at a high level, focused on optimising life of mine production schedule • NCL Scoping Study used as reference point • Incorporated recent pit optimisation work completed by Metminco Confirms the following: • Open pit – Life of open pit increases f
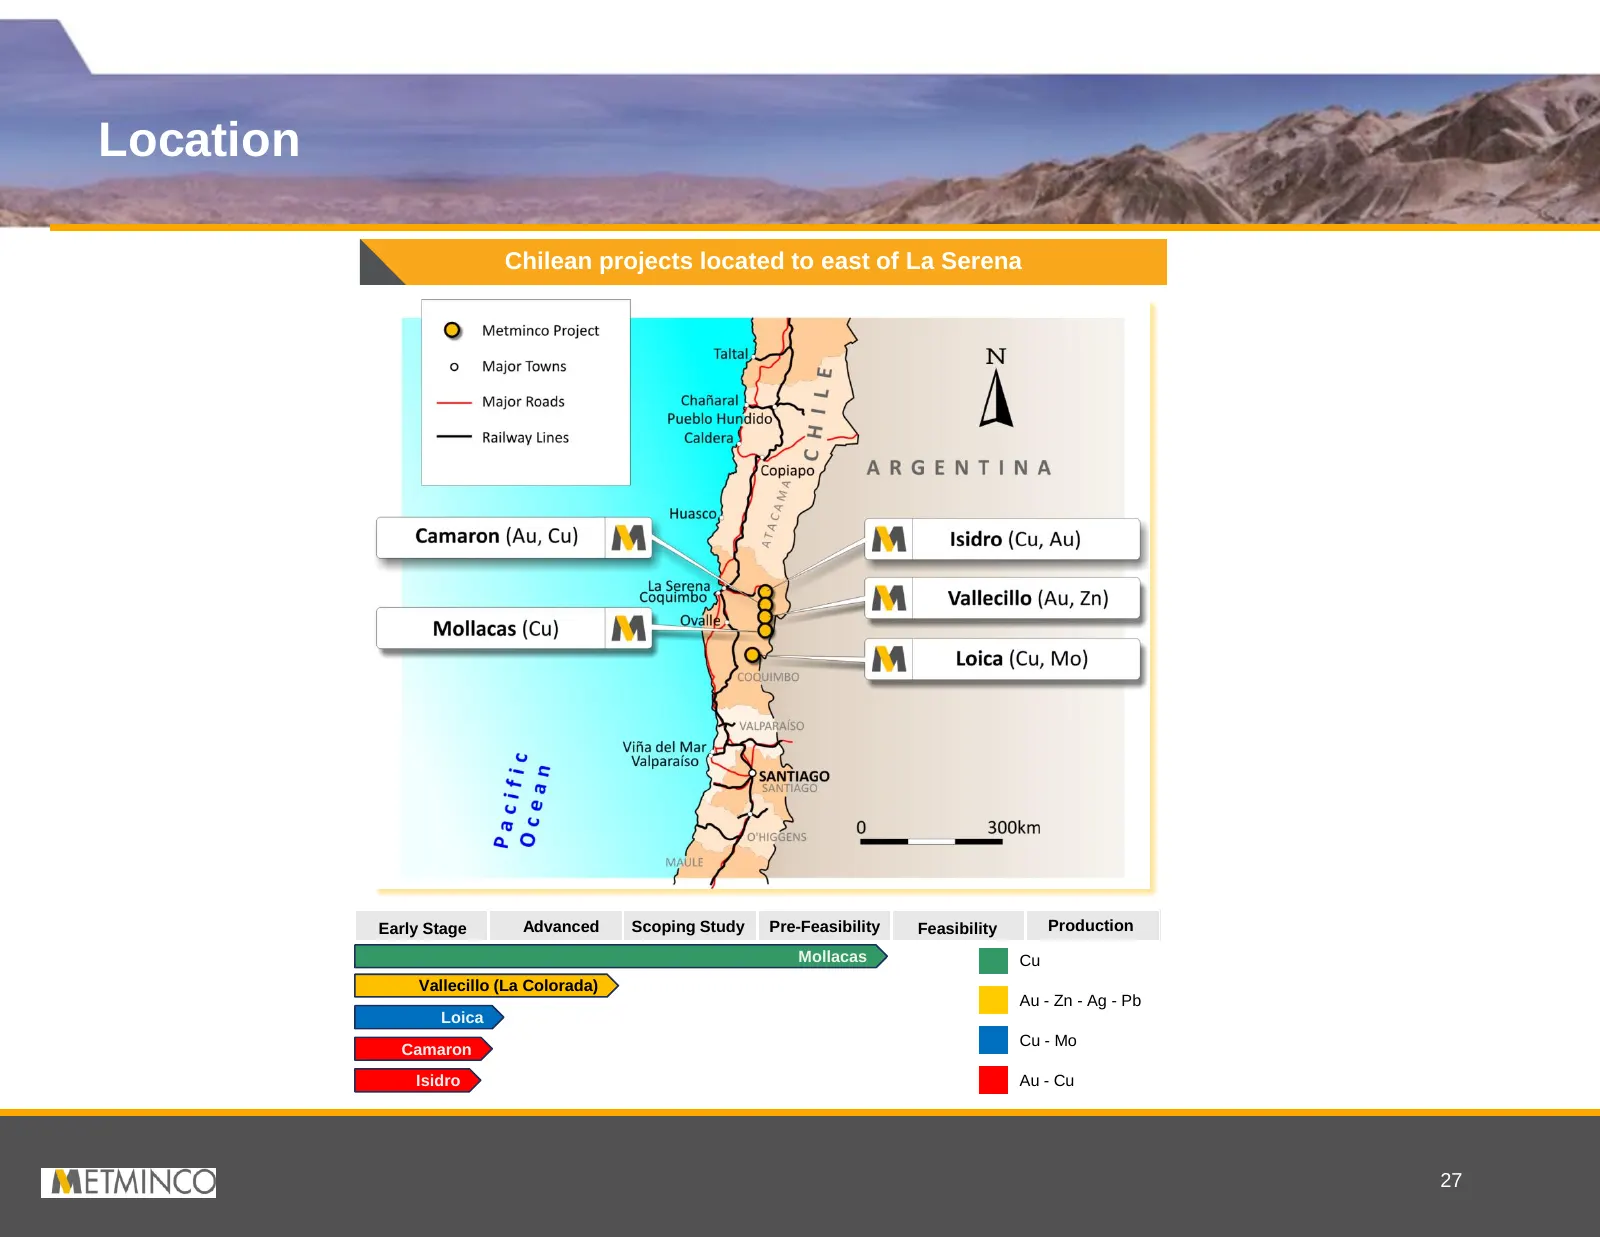
Slide 28: Location
Location Chilean projects located to east of La Serena Early Stage Advanced Scoping Study Pre-Feasibility Feasibility Production Mollacas Cu Vallecillo Vallecillo (La Colorada) Au - Zn - Ag - Pb Loica Isidro Cu - Mo Camaron Loica Isidro Au - Cu La Piedra 27
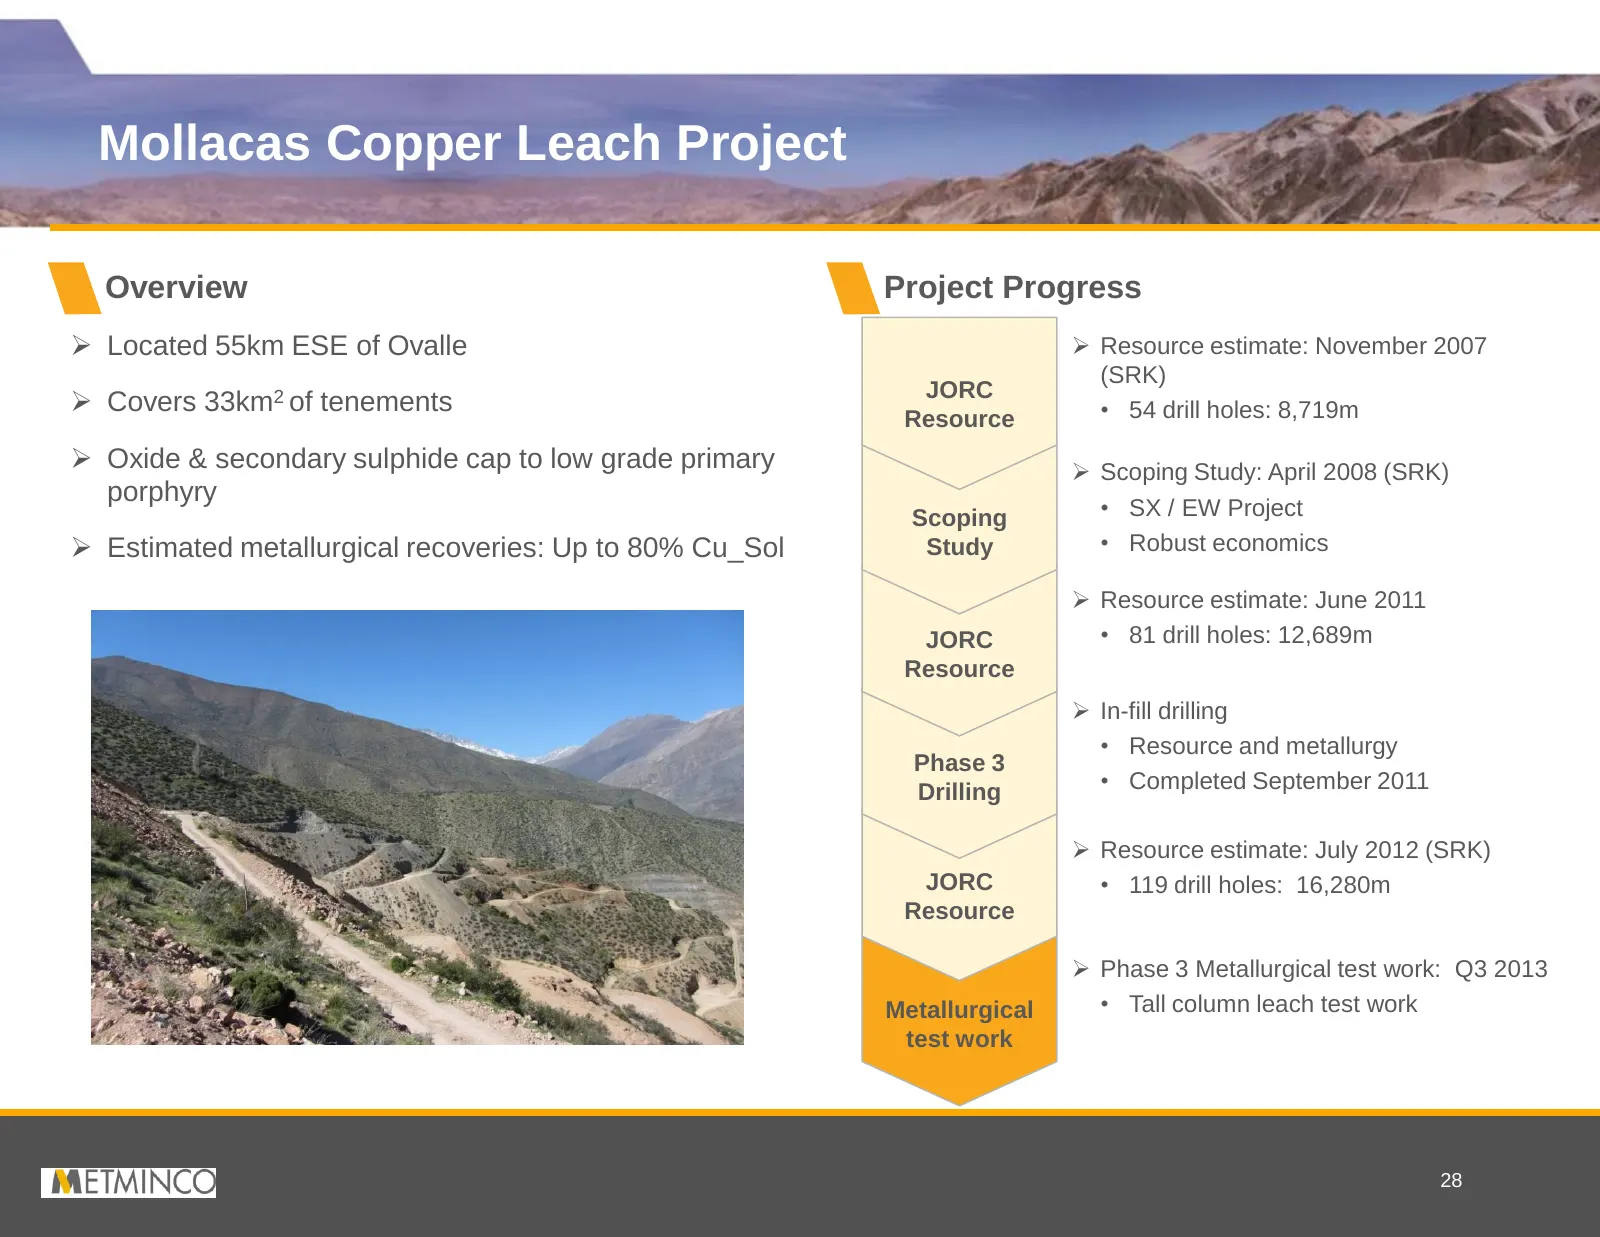
Slide 29: Mollacas Copper Leach Project
Mollacas Copper Leach Project Overview Project Progress Located 55km ESE of Ovalle Resource estimate: November 2007 (SRK) JORC Covers 33km2 of tenements • 54 drill holes: 8,719m Resource Oxide & secondary sulphide cap to low grade primary Scoping Study: April 2008 (SRK) porphyry • SX / EW
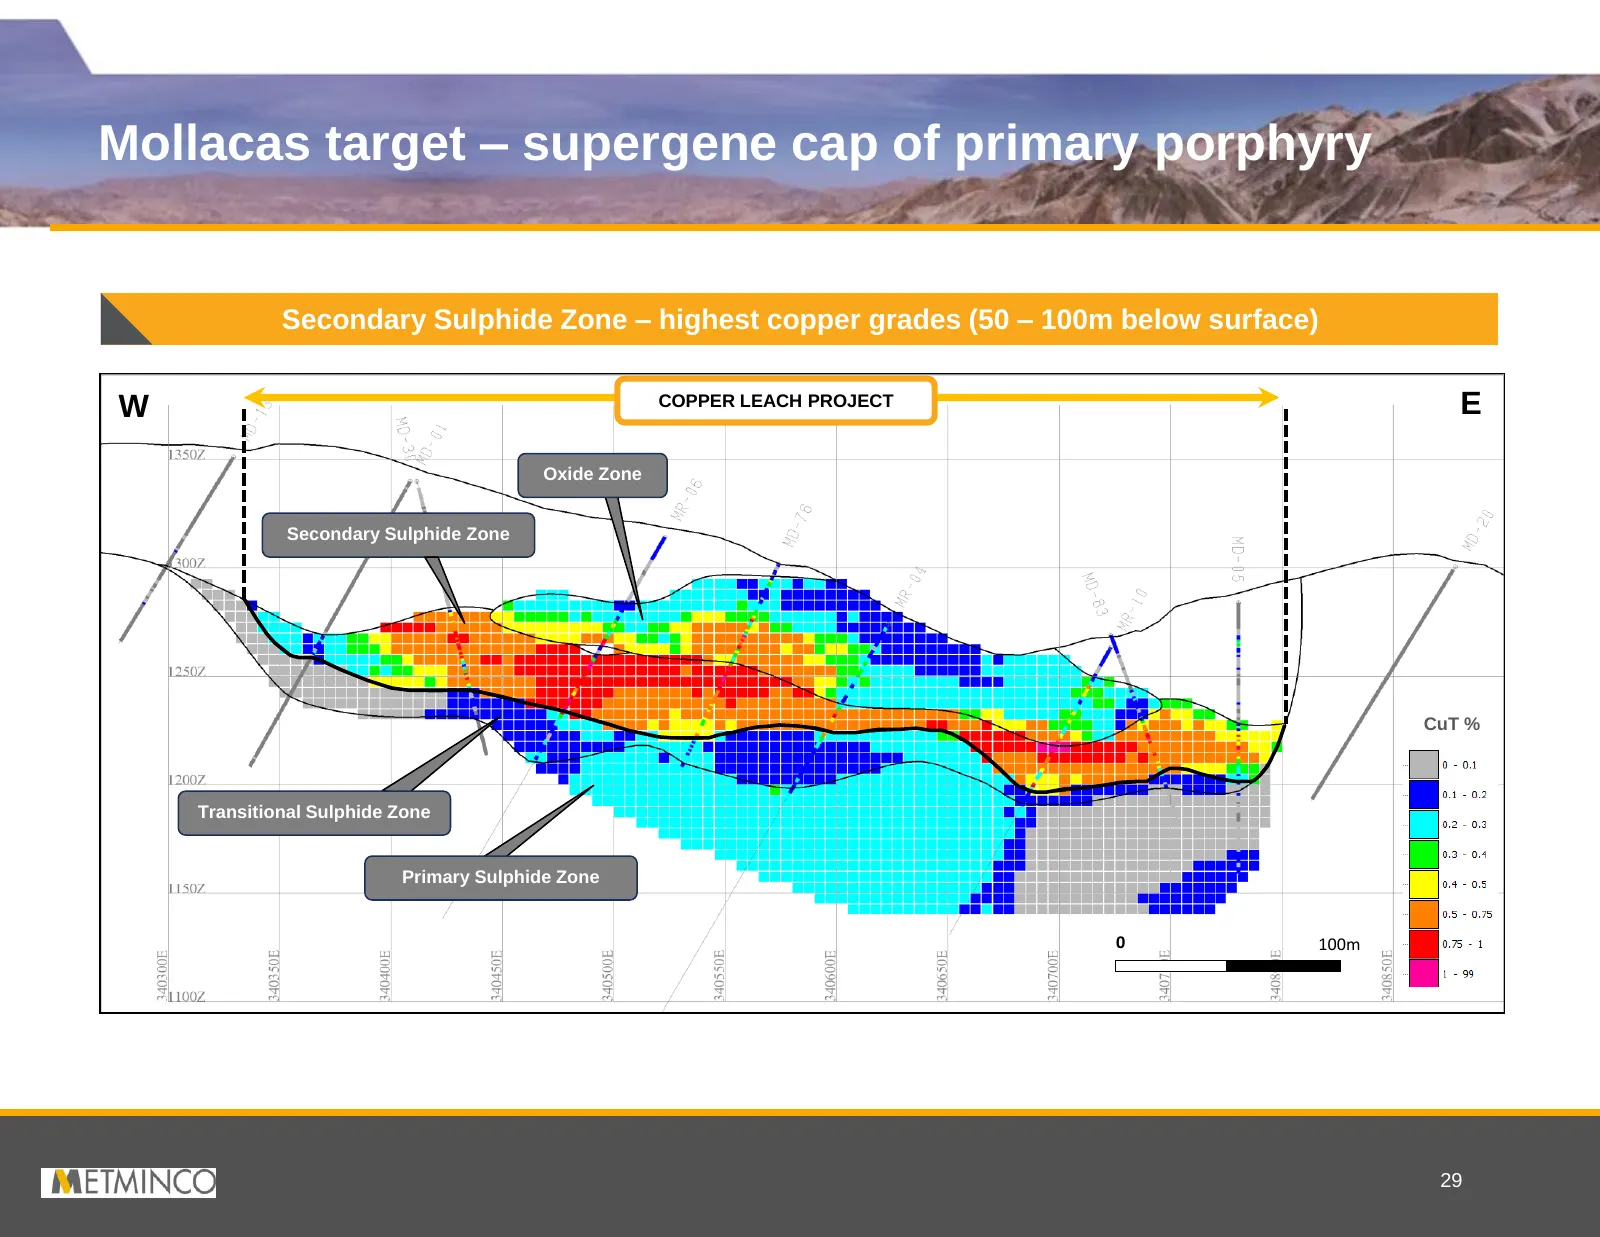
Slide 30: Mollacas target – supergene cap of primary porphyry
Mollacas target – supergene cap of primary porphyry Secondary Sulphide Zone – highest copper grades (50 – 100m below surface) W COPPER LEACH PROJECT E Oxide Zone Secondary Sulphide Zone CuT % Transitional Sulphide Zone Primary Sulphide Zone 0 100m 29
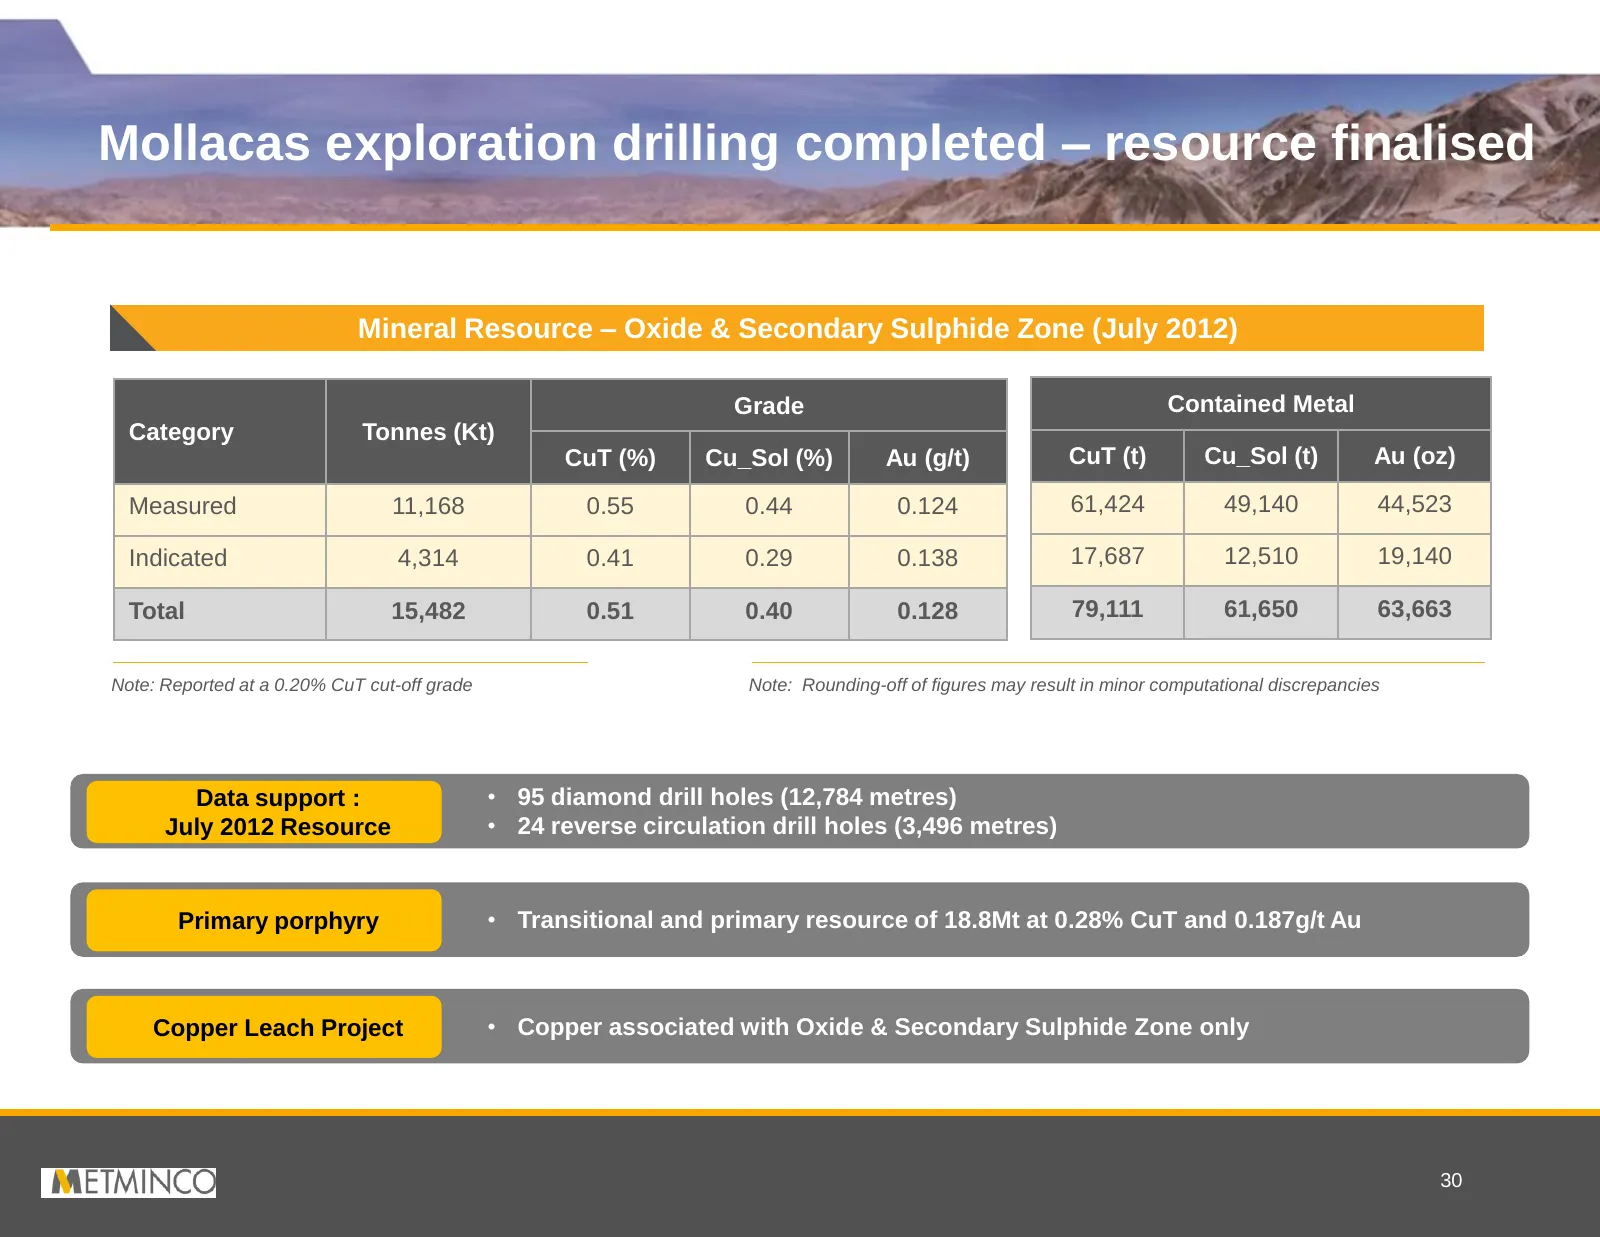
Slide 31: Mollacas exploration drilling completed – resource finalised
Mollacas exploration drilling completed – resource finalised Mineral Resource – Oxide & Secondary Sulphide Zone (July 2012) Grade Contained Metal Category Tonnes (Kt) CuT (%) Cu_Sol (%) Au (g/t) CuT (t) Cu_Sol (t) Au (oz) Measured 11,168 0.55 0.44 0.124 61,424 49,140 44,523 Indicated 4,314 0.41 0.29
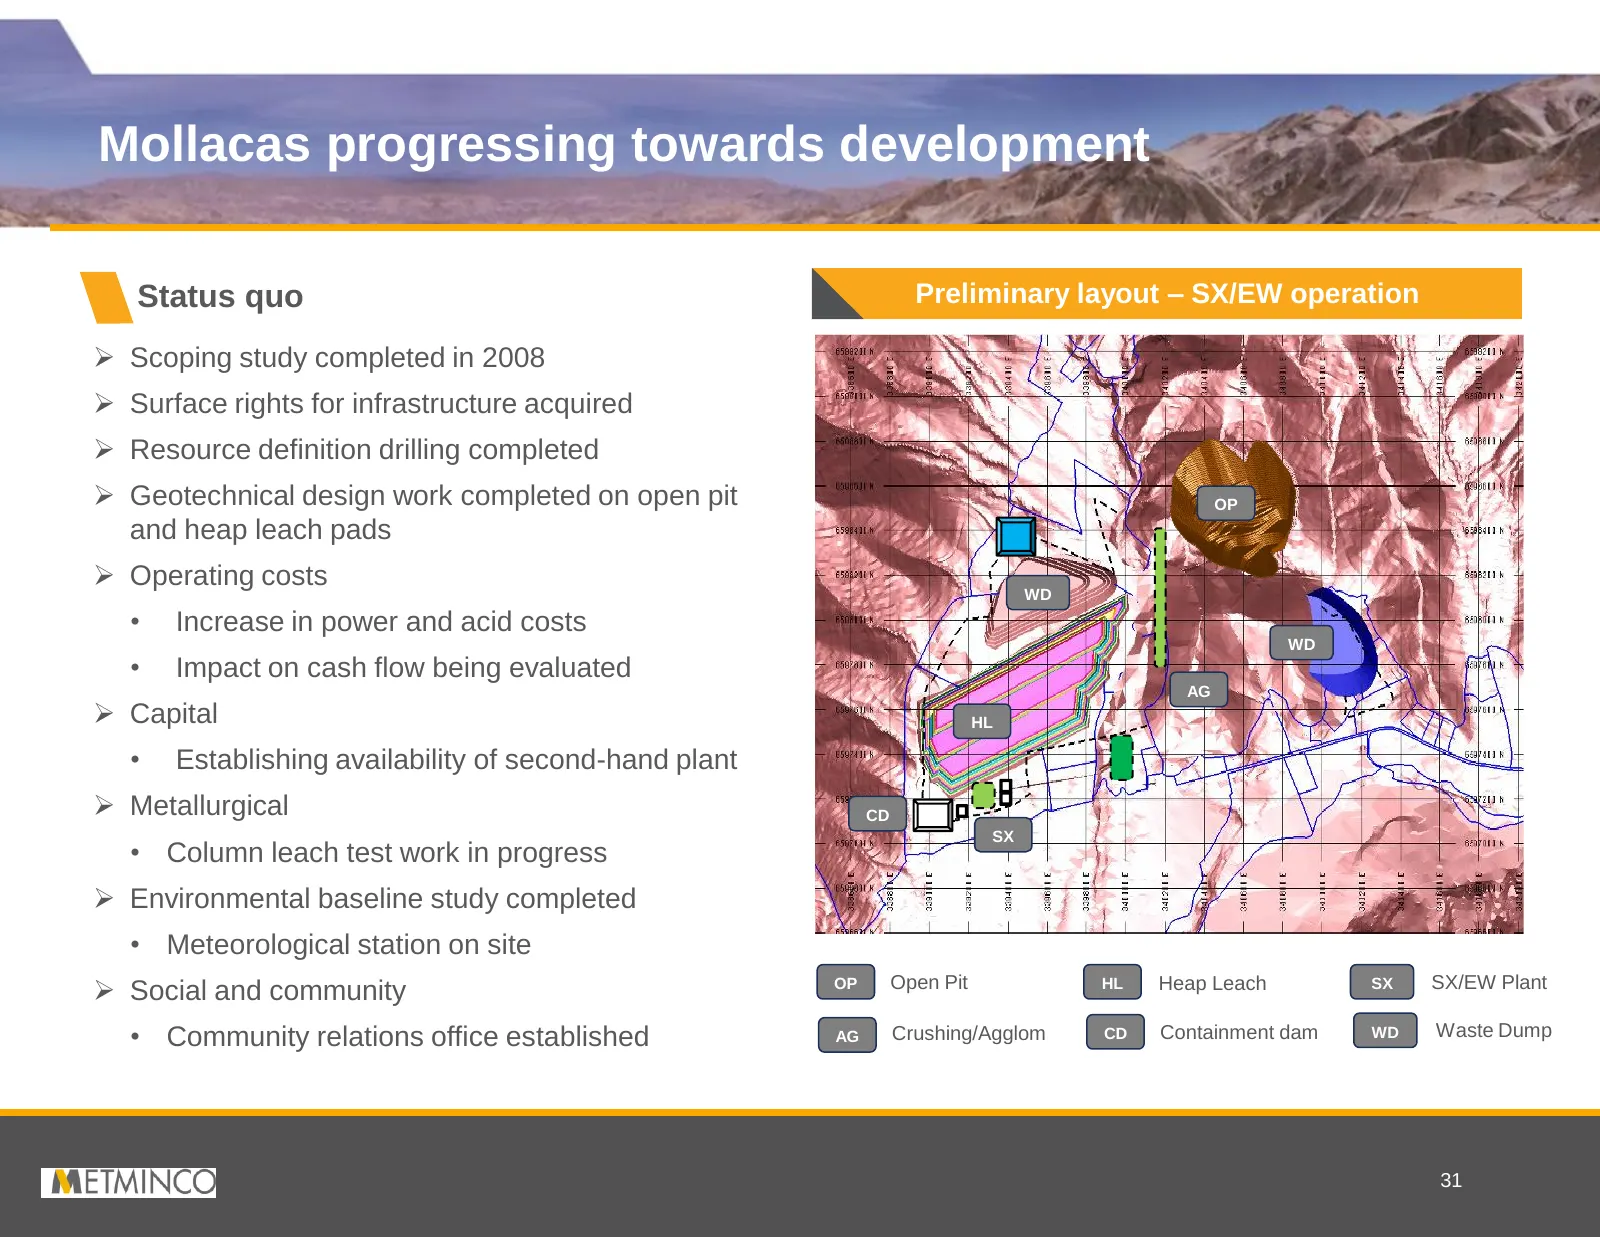
Slide 32: Mollacas progressing towards development
Mollacas progressing towards development Status quo Preliminary layout – SX/EW operation Scoping study completed in 2008 Surface rights for infrastructure acquired Resource definition drilling completed Geotechnical design work completed on open pit OP and heap leach pads Operating costs W
Slide 33: Metallurgical testwork in progress – to assist plant design
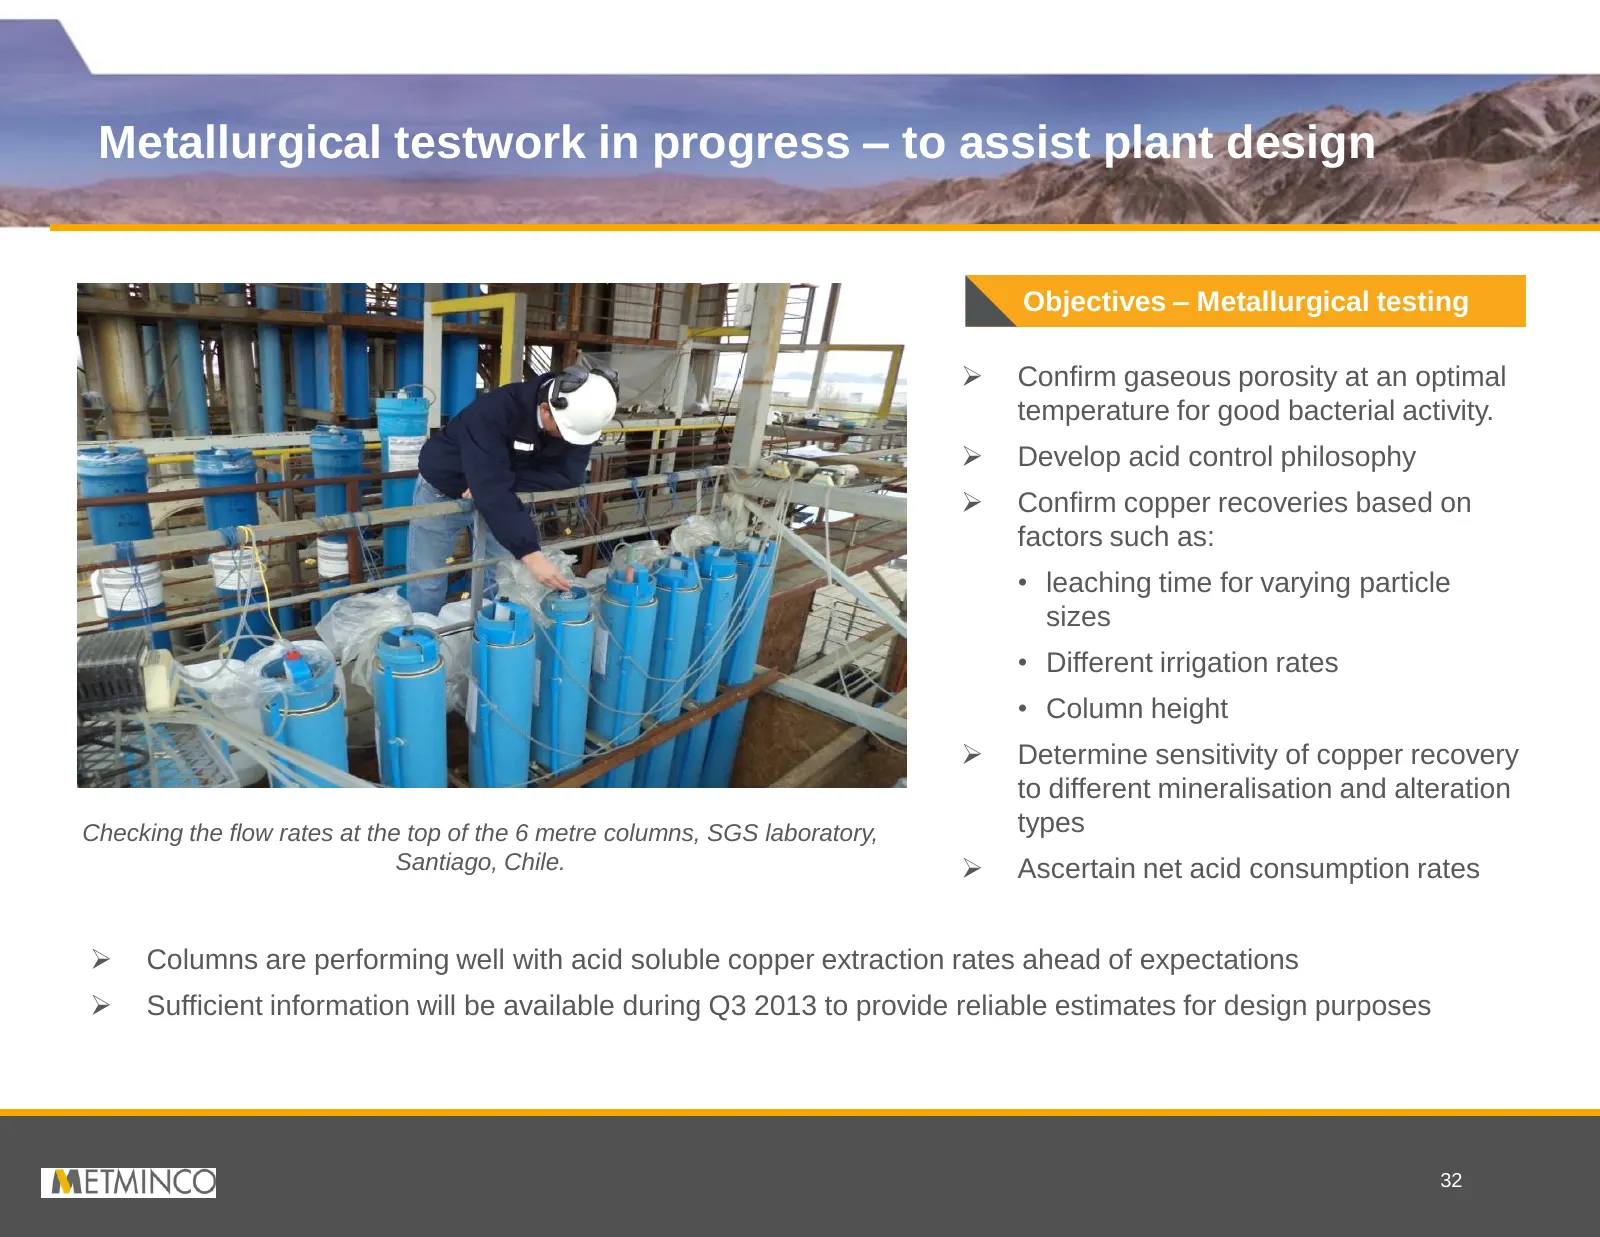
Metallurgical testwork in progress – to assist plant design Objectives – Metallurgical testing Confirm gaseous porosity at an optimal temperature for good bacterial activity. Develop acid control philosophy Confirm copper recoveries based on factors such as: • leaching time for varying particl
Slide 34: In summary
In summary Funding • Cash-on-hand as at 30 June 2013 of A$12.6m Los Calatos • Investment friendly jurisdiction • Highly deliverable with the designated status of ‘Project of National Interest’, no competing land usage and relatively low power costs • Scoping Study (NCL) confirms project as a pot
Slide 35: Copper Fundamentals
Appendix 1 Copper Fundamentals 34
Slide 36: Incremental demand and supply analysis
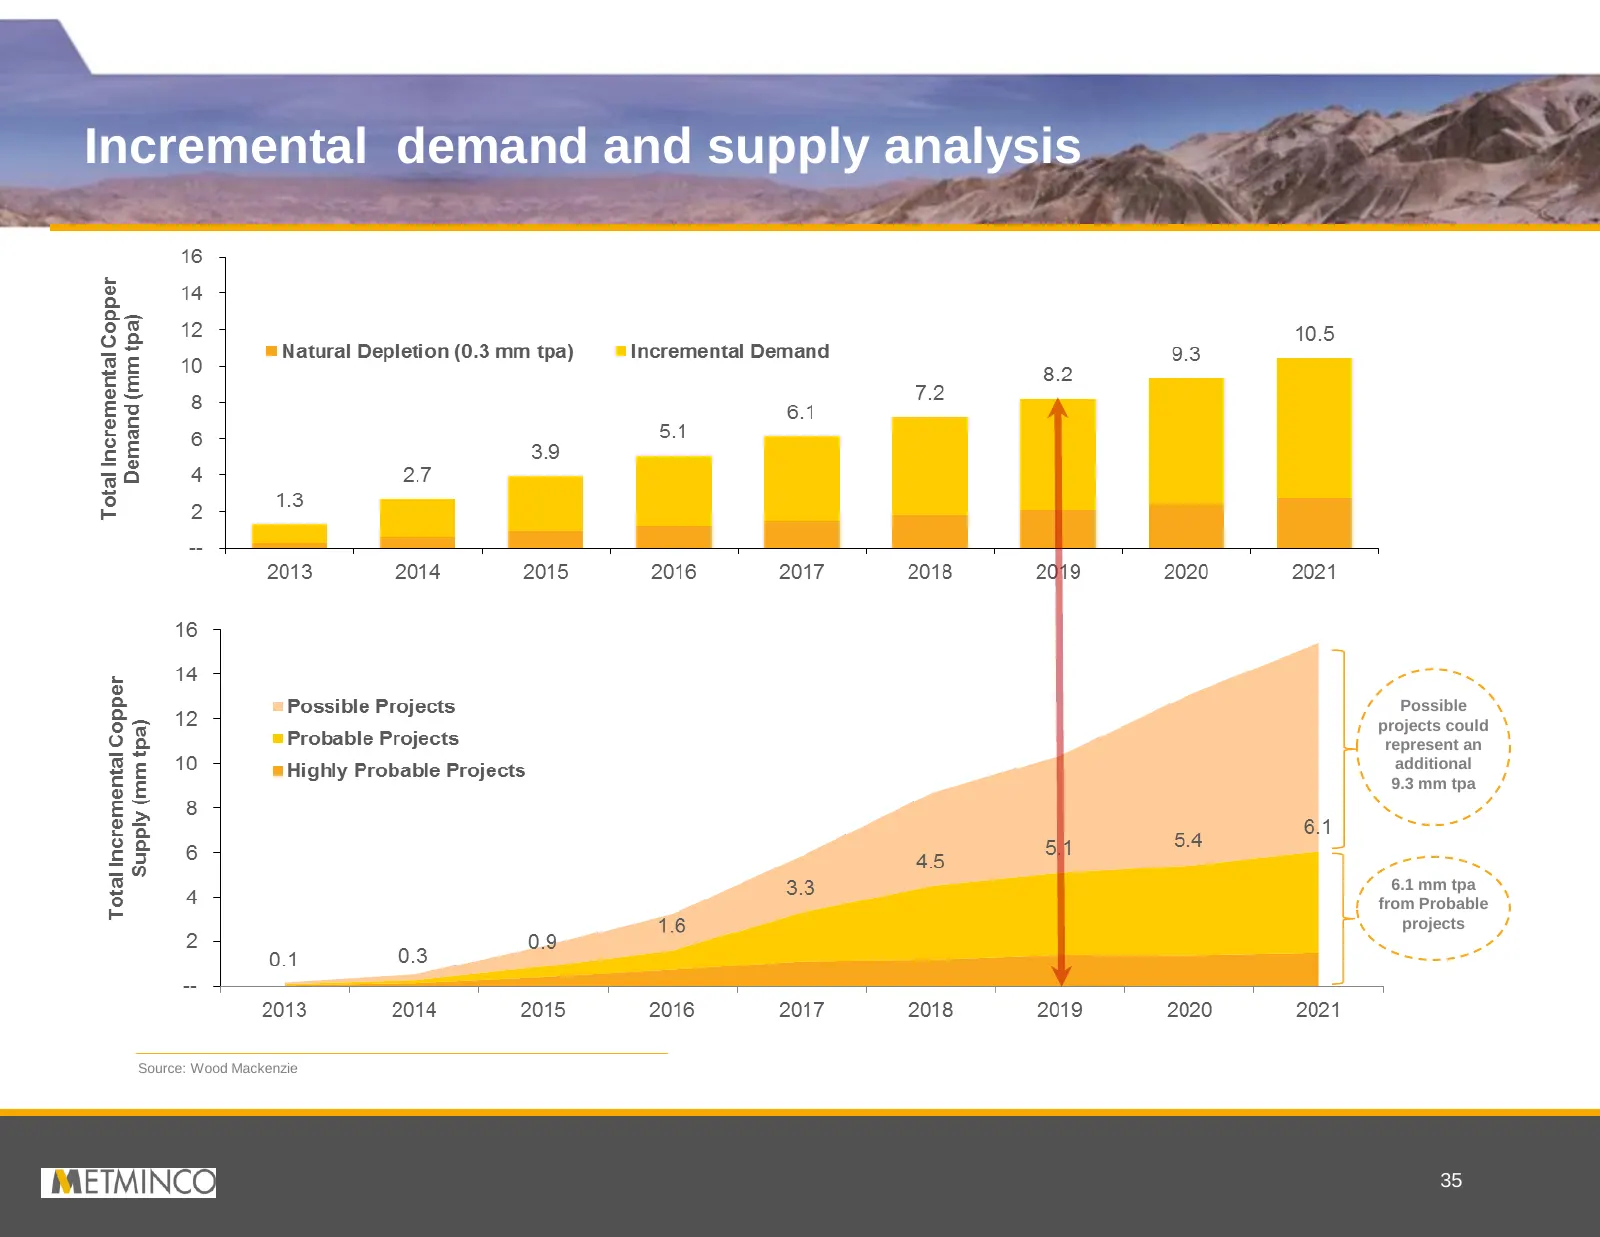
Incremental demand and supply analysis Possible projects could represent an additional 9.3 mm tpa 6.1 mm tpa from Probable projects Source: Wood Mackenzie 35
Source: Internet Archive copy of lclresources.au
More decks from LCL Resources Limited
 Shareholder Meeting (June 2025)10 slides · Jun 5, 2025
 Paydirt Nickel Conference 202314 slides · Oct 4, 2023
 Paydirt Nickel Conference 202313 slides · October 2023
 Los Cerros — Investor Presentation (June 2023)10 slides · Jun 8, 2023
 Los Cerros — Shareholder Meeting (May 2023)14 slides · May 31, 2023
 Los Cerros — Shareholder Meeting (May 2023)15 slides · May 31, 2023