Aleris International — Investor Presentation (April 2005)
27 slides from Aleris International's investor presentation, Apr 7, 2005
Slide 1: April 2005
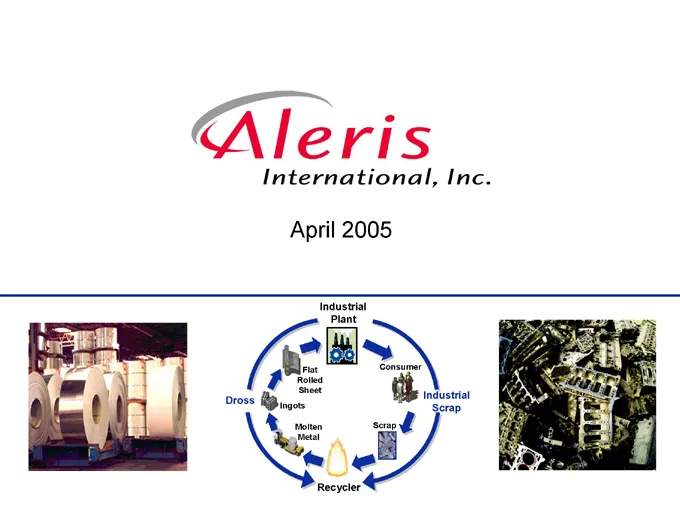
April 2005 Industrial Plant Flat Consumer Rolled Sheet Industrial Dross Ingots Scrap Molten Scrap Metal Recycler
Slide 2: Safe Harbor
Safe Harbor Statements contained in this presentation that state the company’s or its management’s expectations or predictions of the future are forward-looking statements intended to be covered by the safe harbor provisions of the Securities Act of 1933 and the Securities Exchange Act of 1934. The
Slide 3: Merger Overview
Merger Overview
Slide 4: The Merger
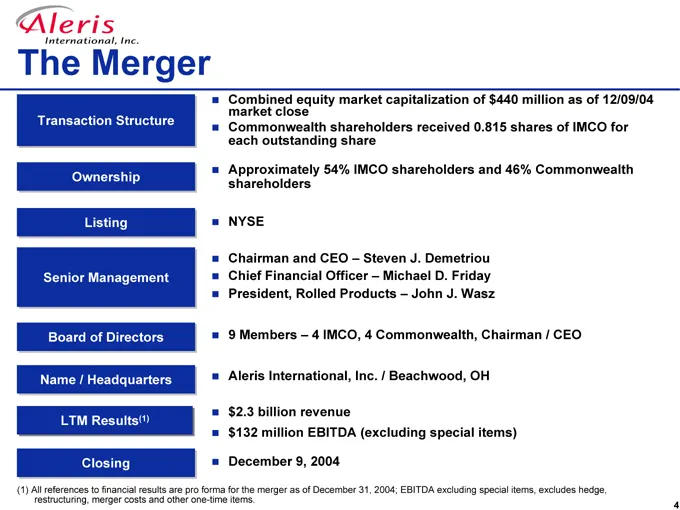
The Merger Transaction Structure Ownership Listing Senior Management Board of Directors Name / Headquarters LTM Results(1) Closing Combined equity market capitalization of $440 million as of 12/09/04 market close Commonwealth shareholders received 0.815 shares of IMCO for each outstanding share Appr
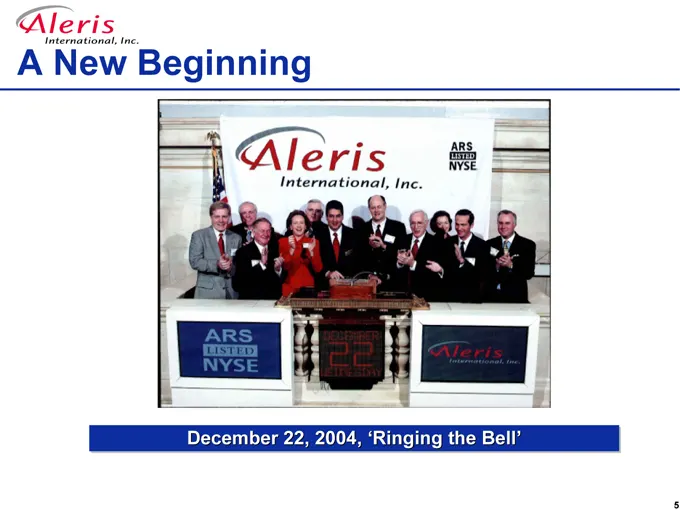
Slide 5: A New Beginning
A New Beginning December 22, 2004, ‘Ringing the Bell’
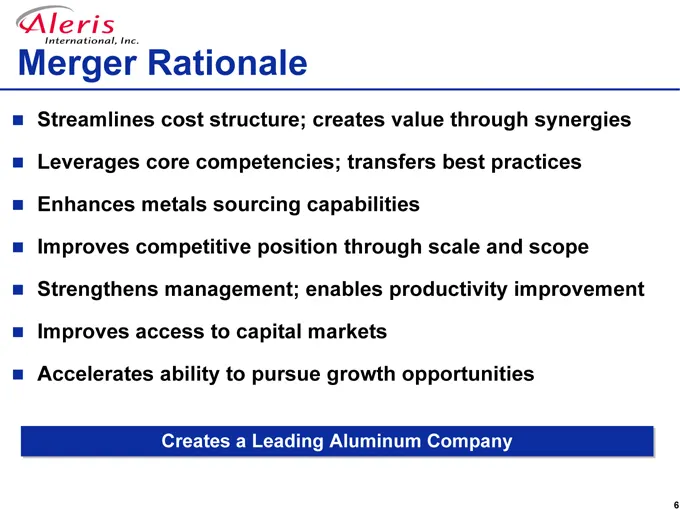
Slide 6: Merger Rationale
Merger Rationale Streamlines cost structure; creates value through synergies Leverages core competencies; transfers best practices Enhances metals sourcing capabilities Improves competitive position through scale and scope Strengthens management; enables productivity improvement Improves access to c
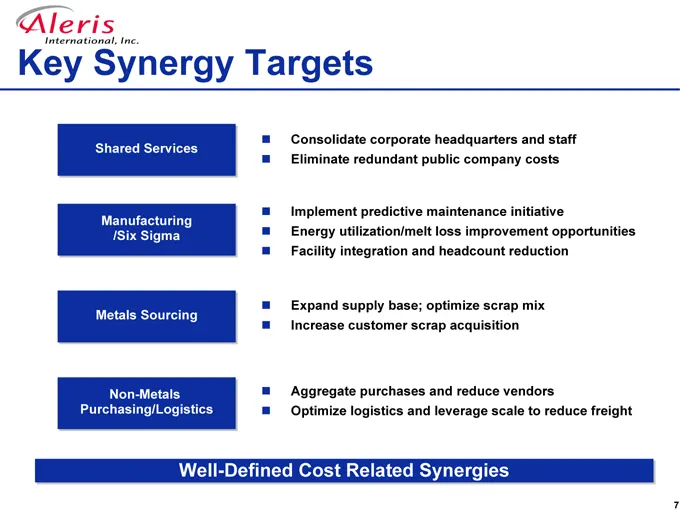
Slide 7: Key Synergy Targets
Key Synergy Targets Shared Services Manufacturing /Six Sigma Metals Sourcing Non-Metals Purchasing/Logistics Consolidate corporate headquarters and staff Eliminate redundant public company costs Implement predictive maintenance initiative Energy utilization/melt loss improvement opportunities Facili
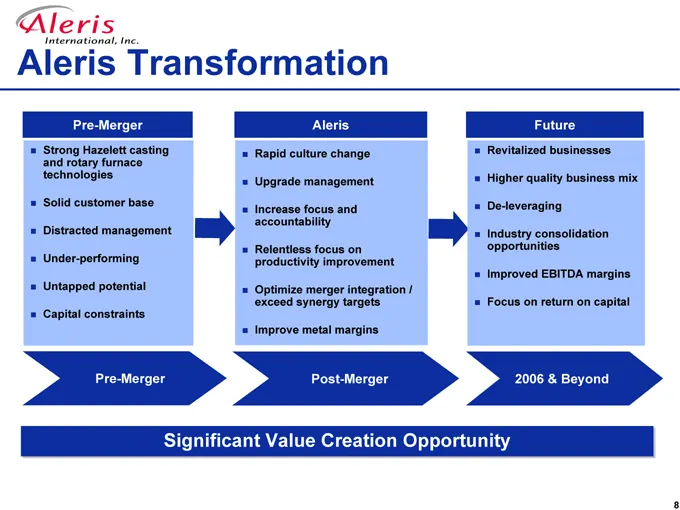
Slide 8: Aleris Transformation
Aleris Transformation Pre-Merger Strong Hazelett casting and rotary furnace technologies Solid customer base Distracted management Under-performing Untapped potential Capital constraints Aleris Rapid culture change Upgrade management Increase focus and accountability Relentless focus on productivity
Slide 9: Strategy
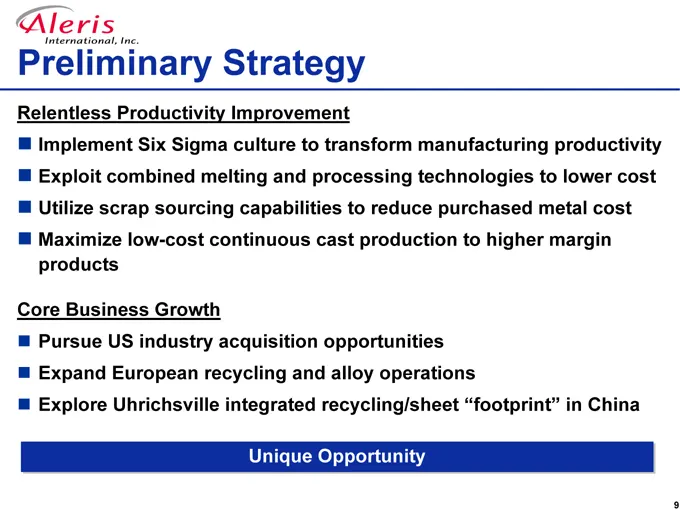
Preliminary Strategy Relentless Productivity Improvement Implement Six Sigma culture to transform manufacturing productivity Exploit combined melting and processing technologies to lower cost Utilize scrap sourcing capabilities to reduce purchased metal cost Maximize low-cost continuous cast product
Slide 10: Culture and Key Values
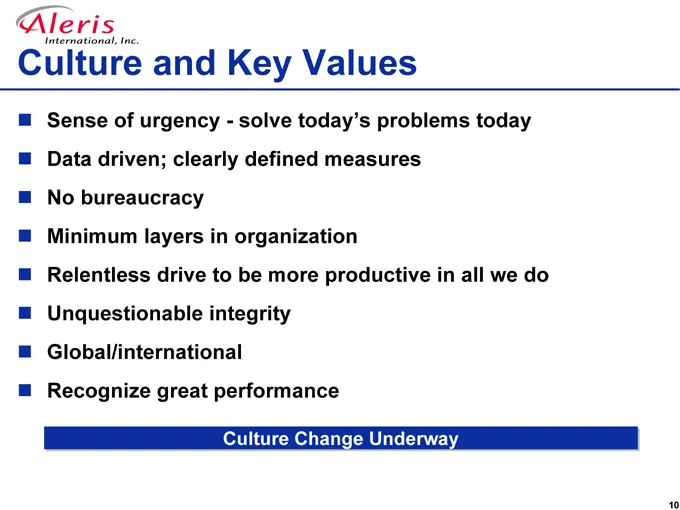
Culture and Key Values Sense of urgency—solve today’s problems today Data driven; clearly defined measures No bureaucracy Minimum layers in organization Relentless drive to be more productive in all we do Unquestionable integrity Global/international Recognize great performance Culture Change Underw
Slide 11: Successful Aleris Leader
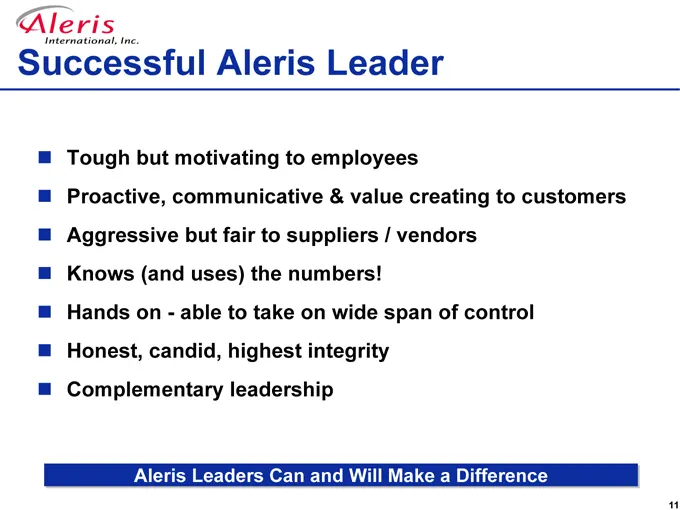
Successful Aleris Leader Tough but motivating to employees Proactive, communicative & value creating to customers Aggressive but fair to suppliers / vendors Knows (and uses) the numbers! Hands on—able to take on wide span of control Honest, candid, highest integrity Complementary leadership Aleris L
Slide 12: Business Overview
Business Overview
Slide 13: Mission Statement
Mission Statement To become a leading global provider of scrap-based aluminum and zinc products and services focused on generating the highest level of quality and productivity to exceed stakeholder expectations. Focus on providing outstanding value to customers through delivery performance, quality
Slide 14: Overview
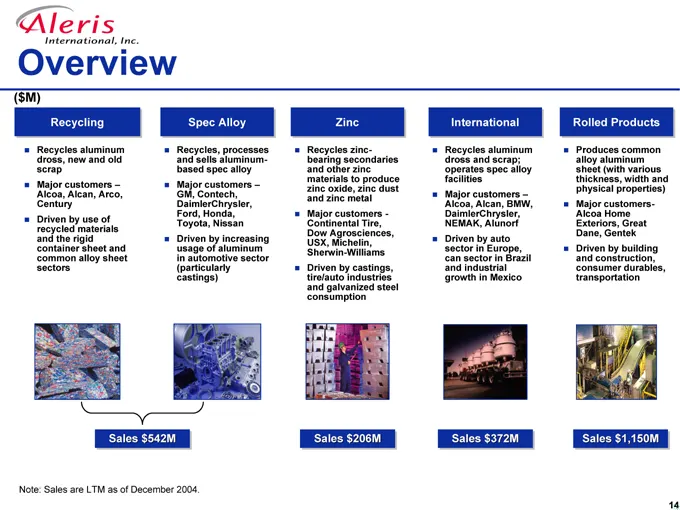
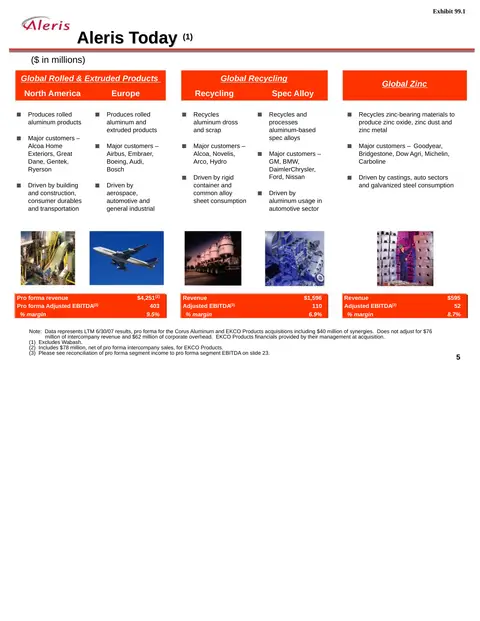
Overview ($M) Recycling Recycles aluminum dross, new and old scrap Major customers – Alcoa, Alcan, Arco, Century Driven by use of recycled materials and the rigid container sheet and common alloy sheet sectors Spec Alloy Recycles, processes and sells aluminum-based spec alloy Major customers – GM, C
Slide 15: Core Competency: Rotary Furnace Technology
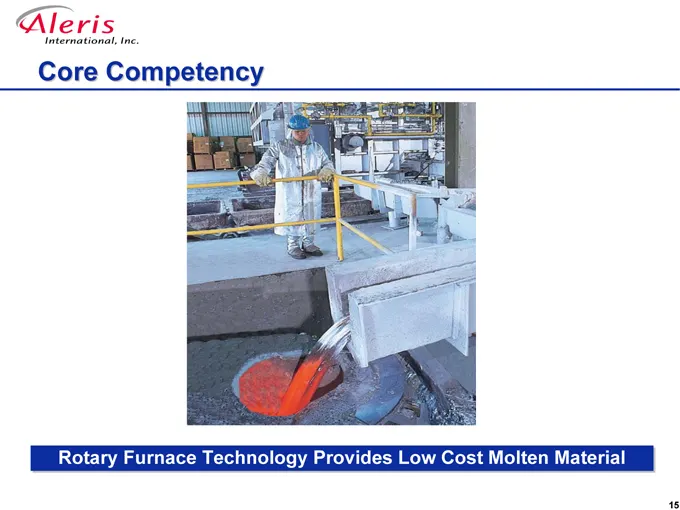
Core Competency Rotary Furnace Technology Provides Low Cost Molten Material
Slide 16: Core Competency: Continuous Casting Technology
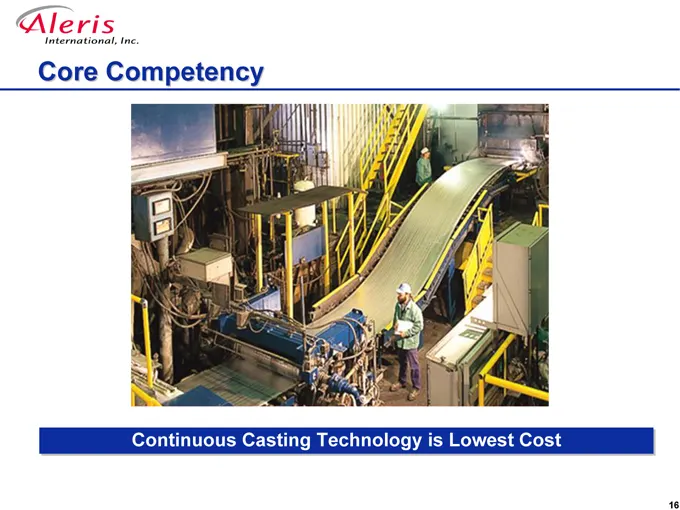
Core Competency Continuous Casting Technology is Lowest Cost
Slide 17: Key Highlights
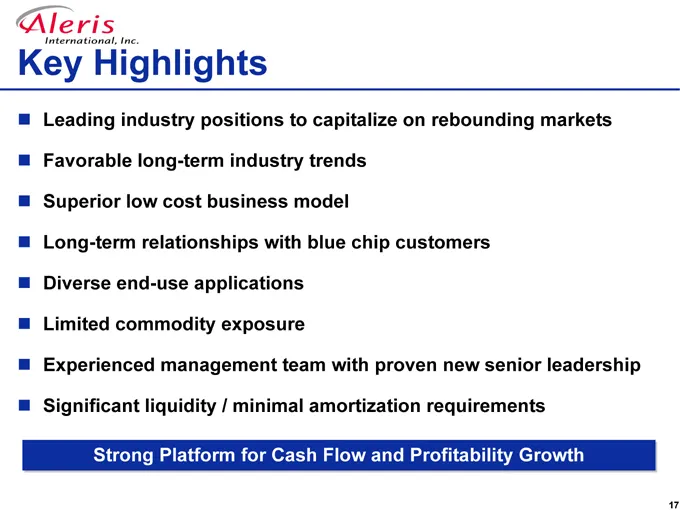
Key Highlights Leading industry positions to capitalize on rebounding markets Favorable long-term industry trends Superior low cost business model Long-term relationships with blue chip customers Diverse end-use applications Limited commodity exposure Experienced management team with proven new seni
Slide 18: Leading Industry Positions
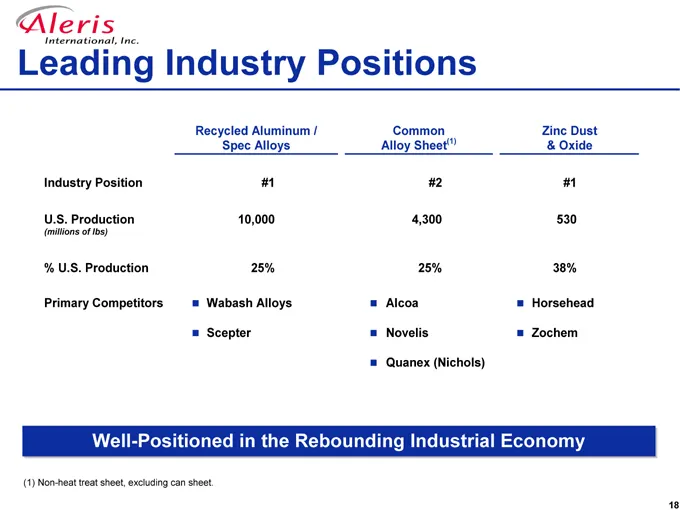
Leading Industry Positions Recycled Aluminum / Common Zinc Dust Spec Alloys Alloy Sheet(1) & Oxide Industry Position #1 #2 #1 U.S. Production 10,000 4,300 530 (millions of lbs) % U.S. Production 25% 25% 38% Primary Competitors Wabash Alloys Scepter Alcoa Novelis Quanex (Nichols) Horsehead Zochem Wel
Slide 19: Industry Trends
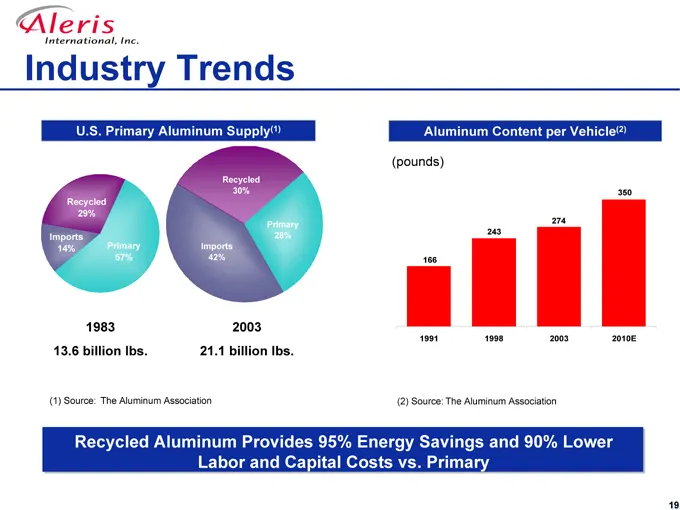
Industry Trends U.S. Primary Aluminum Supply(1) Recycled 29% Imports 14% Primary 57% Recycled 30% Imports 42% Primary 28% 1983 13.6 billion lbs. 2003 21.1 billion lbs. Aluminum Content per Vehicle(2) (pounds) 2010E (1) Source: The Aluminum Association (2) Source: The Aluminum Association Recycled Al
Slide 20: Industry Trends
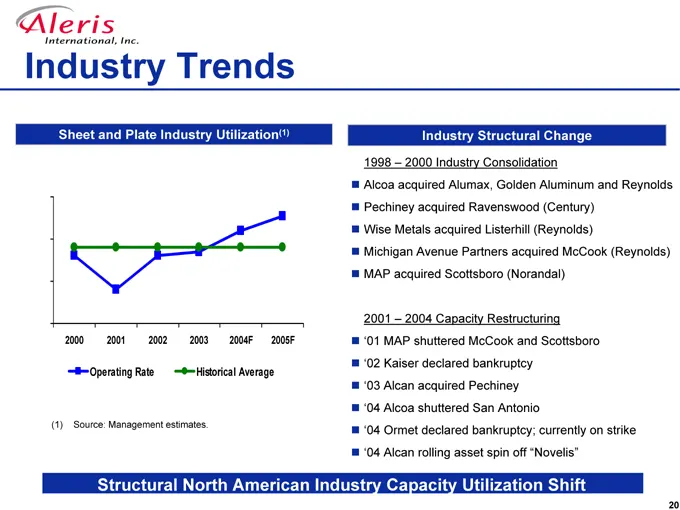
Industry Trends Sheet and Plate Industry Utilization(1) 2000 2001 2002 2003 2004F 2005F 90% 80% 70% 60% Operating Rate Historical Average (1) Source: Management estimates. Industry Structural Change 1998 – 2000 Industry Consolidation Alcoa acquired Alumax, Golden Aluminum and Reynolds Pechiney acqui
Slide 21: Superior Low Cost Business Model
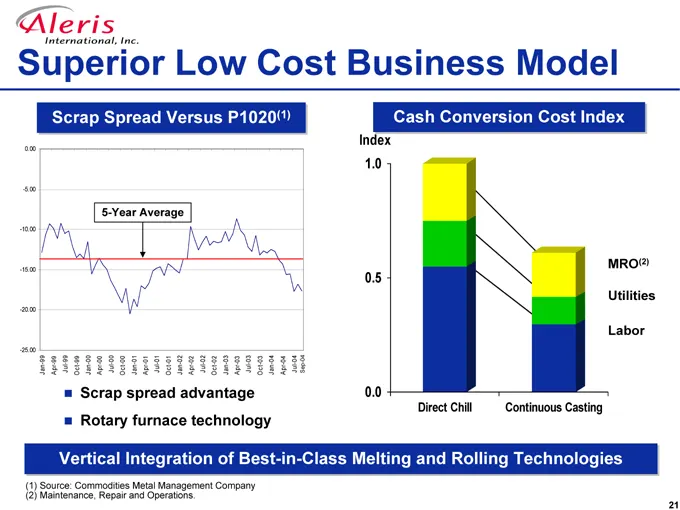
Superior Low Cost Business Model Scrap Spread Versus P1020(1) 0.00 -5.00 -10.00 -15.00 -20.00 -25.00 Jan-99 Apr-99 Jul-99 Oct-99 Jan-00 Apr-00 Jul-00 Oct-00 Jan-01 Apr-01 Jul-01 Oct-01 Jan-02 Apr-02 Jul-02 Oct-02 Jan-03 Apr-03 Jul-03 Oct-03 Jan-04 Apr-04 Jul-04 Sep-04 Scrap spread advantage Rotary f
Slide 22: Limited Commodity Exposure
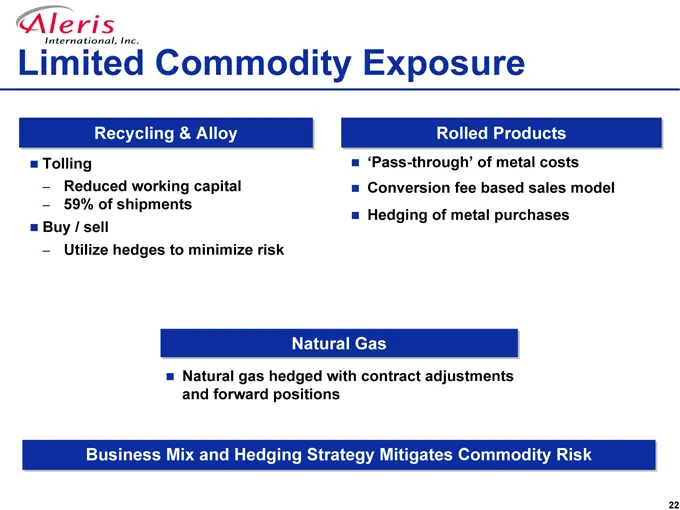
Limited Commodity Exposure Recycling & Alloy Tolling – Reduced working capital – 59% of shipments Buy / sell – Utilize hedges to minimize risk Rolled Products ‘Pass-through’ of metal costs Conversion fee based sales model Hedging of metal purchases Natural Gas Natural gas hedged with contract adjust
Slide 23: Key Business Drivers
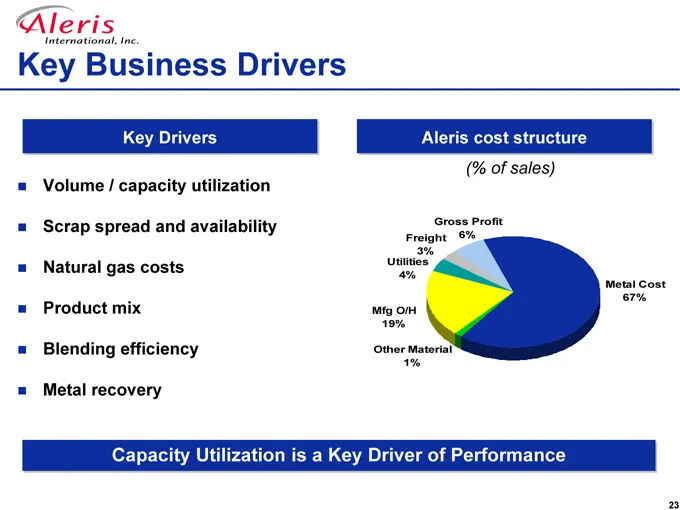
Key Business Drivers Key Drivers Volume / capacity utilization Scrap spread and availability Natural gas costs Product mix Blending efficiency Metal recovery Aleris cost structure (% of sales) Gross Profit 6% Other Material 1% Mfg O/H 19% Freight 3% Utilities 4% Metal Cost 67% Capacity Utilization i
Slide 24: Rolled Products Metal Margin Opportunity
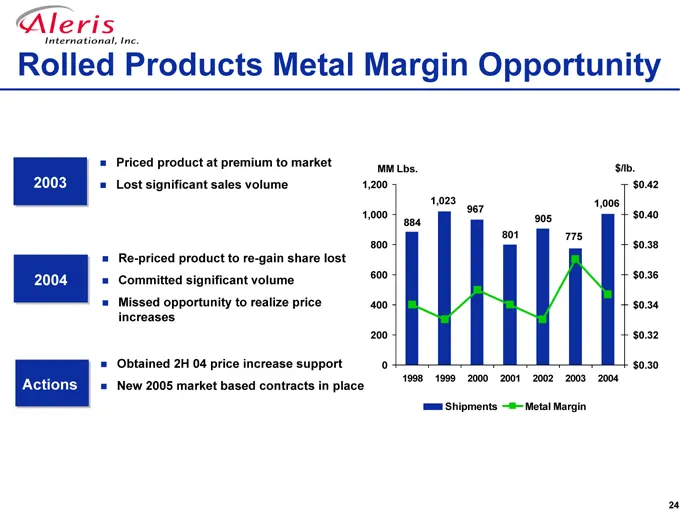
Rolled Products Metal Margin Opportunity 2003 2004 Actions Priced product at premium to market Lost significant sales volume Re-priced product to re-gain share lost Committed significant volume Missed opportunity to realize price increases Obtained 2H 04 price increase support New 2005 market based
Slide 25: Recent Performance
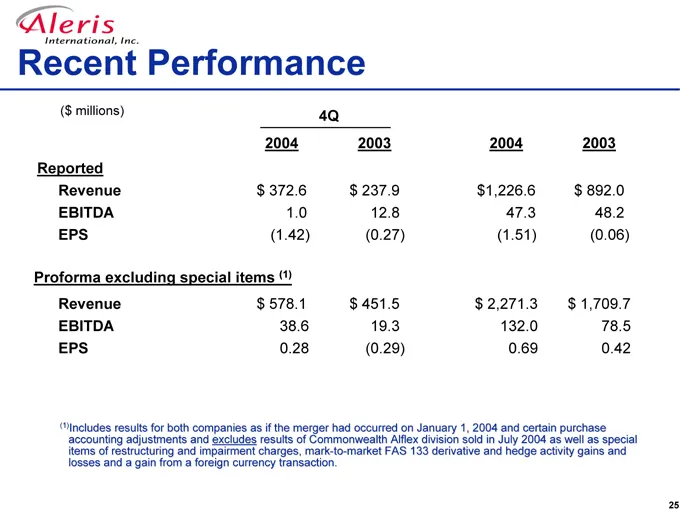
Recent Performance ($ millions) 4Q 2004 2003 2004 2003 Reported Revenue $372.6 $237.9 $1,226.6 $892.0 EBITDA 1.0 12.8 47.3 48.2 EPS (1.42) (0.27) (1.51) (0.06) Proforma excluding special items (1) Revenue $578.1 $451.5 $2,271.3 $1,709.7 EBITDA 38.6 19.3 132.0 78.5 EPS 0.28 (0.29) 0.69 0.42 (1)Includ
Slide 26: Cash & Debt Summary
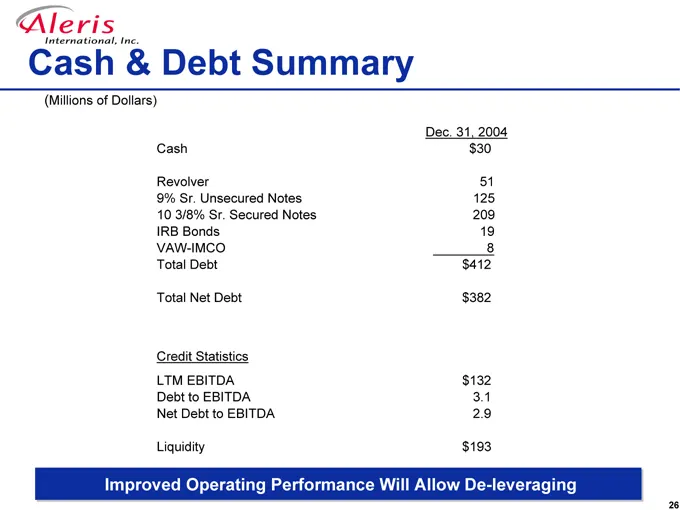
Cash & Debt Summary (Millions of Dollars) Dec. 31, 2004 Cash $30 Revolver 51 9% Sr. Unsecured Notes 125 10 3/8% Sr. Secured Notes 209 IRB Bonds 19 VAW-IMCO 8 Total Debt $412 Total Net Debt $382 Credit Statistics LTM EBITDA $132 Debt to EBITDA 3.1 Net Debt to EBITDA 2.9 Liquidity $193 Improved Operat
Slide 27: Recent Stock Performance
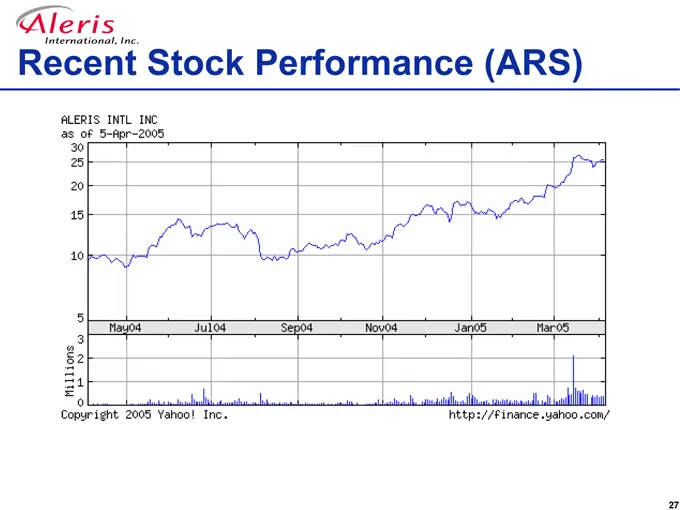
Recent Stock Performance (ARS) ALERIS INTL INC AS OF 5-APR-2005 30 25 20 15 10 5 3 2 1 0 MILLIONS COPYRIGHT 2005 YAHOO! INC. HTTP://FINANCE.YAHOO.COM/ MAY04 JUL04 SEP04 NOV04 JAN04 MAR04
Source: SEC EDGAR · 8-K filed Apr 7, 2005
More decks from Aleris International Inc
 2008 Bank of America Credit Conference26 slides · Nov 21, 2008
 Deutsche Bank Leverage Finance Conference 200828 slides · Sep 25, 2008
 FY2007 Earnings Presentation33 slides · Mar 31, 2008
 FY2007 Earnings Presentation33 slides · Mar 27, 2008
 Bear Stearns Commodity and Capital Goods Conference November 200723 slides · Nov 28, 2007
 Investor Presentation (October 2007)14 slides · Oct 3, 2007