Aleris International — Investor Presentation (October 2007)
14 slides from Aleris International's investor presentation, Oct 3, 2007
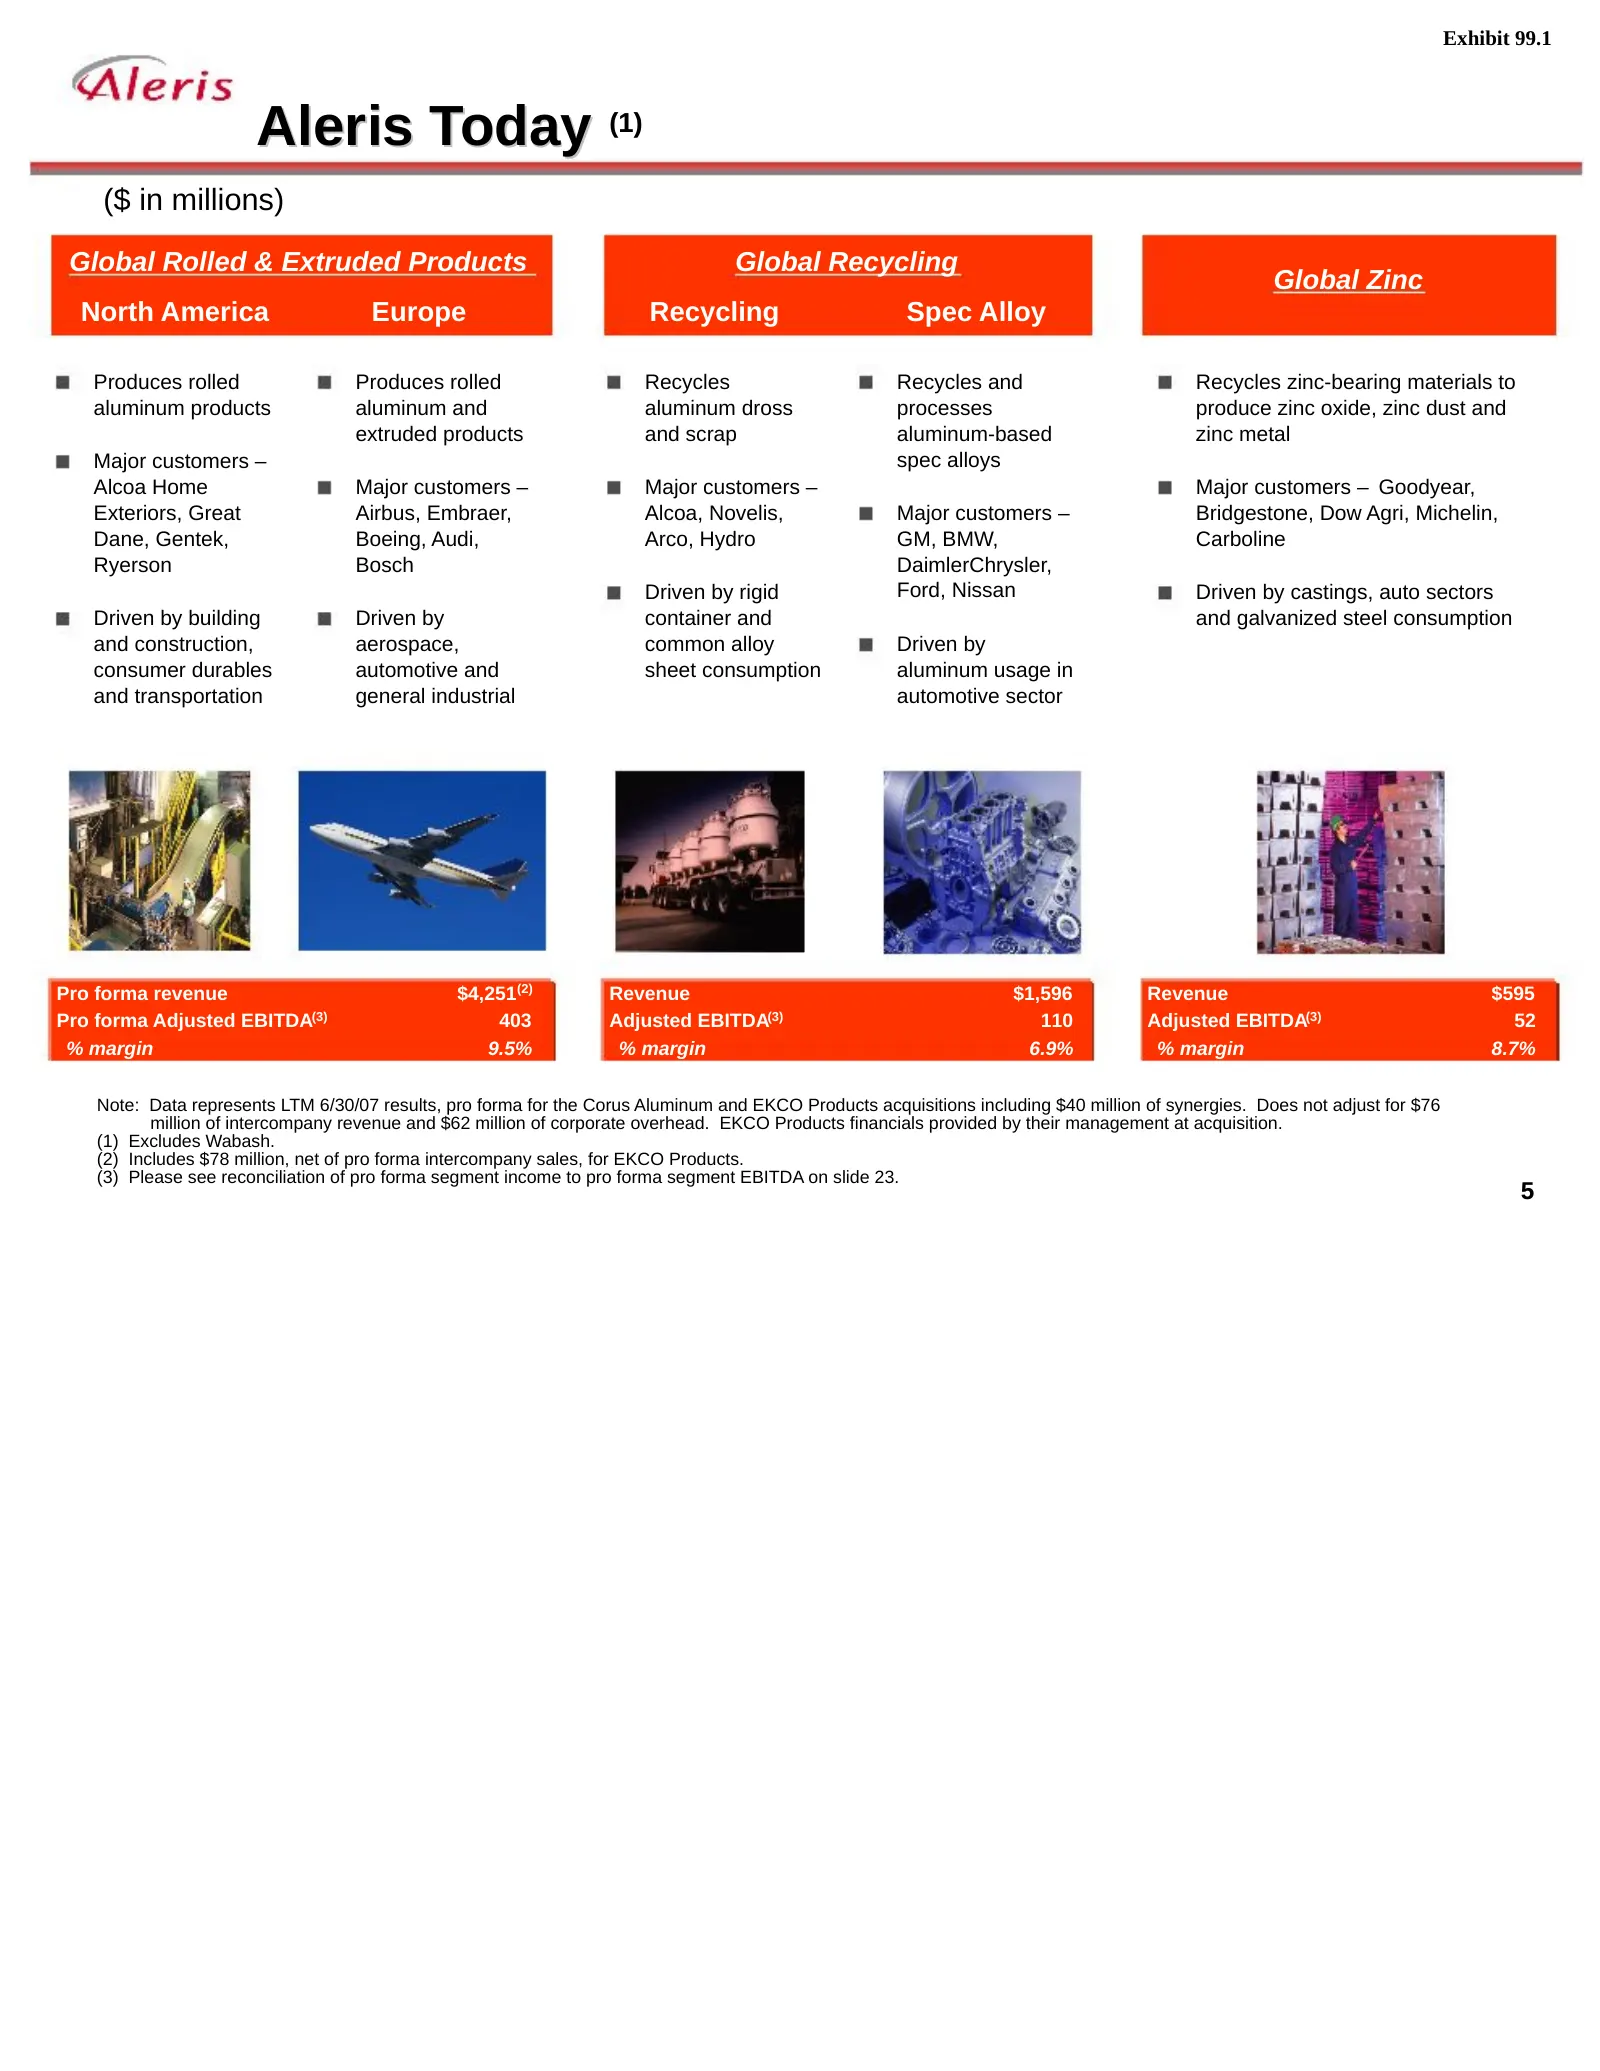
Slide 1: Aleris Today
Exhibit 99.1 Aleris Today (1) ($ in millions) Global Rolled & Extruded Products Global Recycling Global Zinc North America Europe Recycling Spec Alloy Produces rolled Produces rolled Recycles Recycles and Recycles zinc-bearing materials to aluminum products aluminum and aluminum dross processes prod
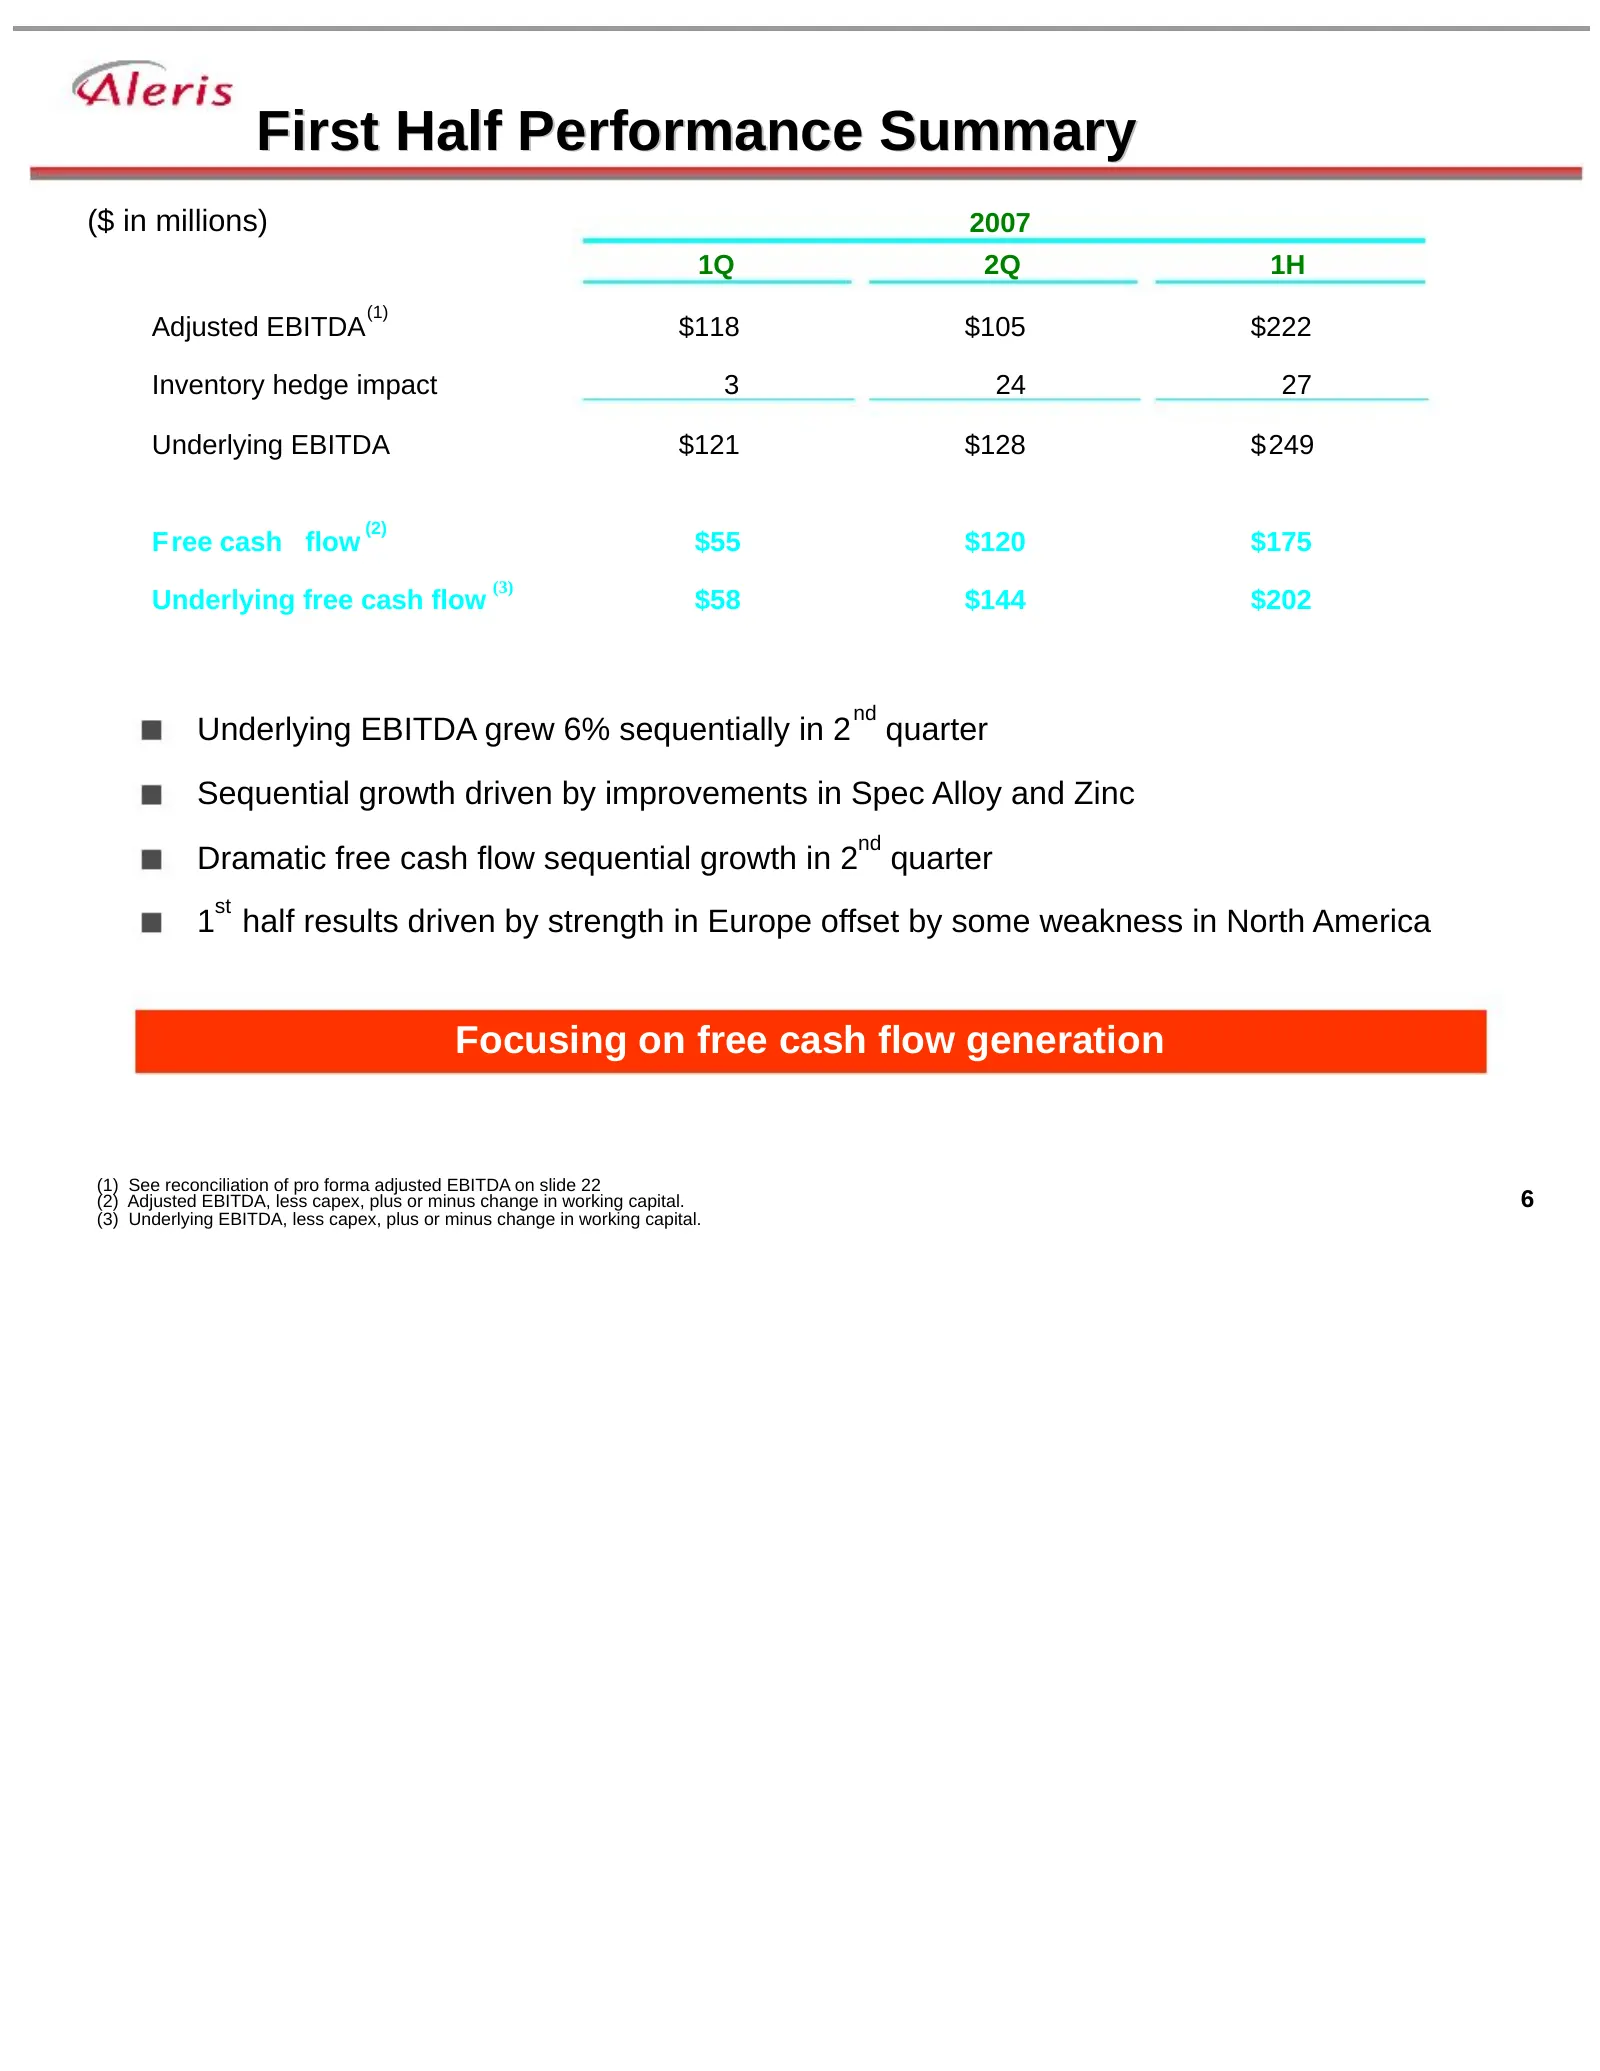
Slide 2: First Half Performance Summary
First Half Performance Summary ($ in millions) 2007 1Q 2Q 1H (1) Adjusted EBITDA $118 $105 $222 Inventory hedge impact 3 24 27 Underlying EBITDA $121 $128 $249 (2) Free cash flow $55 $120 $175 (3) Underlying free cash flow $58 $144 $202 nd Underlying EBITDA grew 6% sequentially in 2 quarter Sequenti
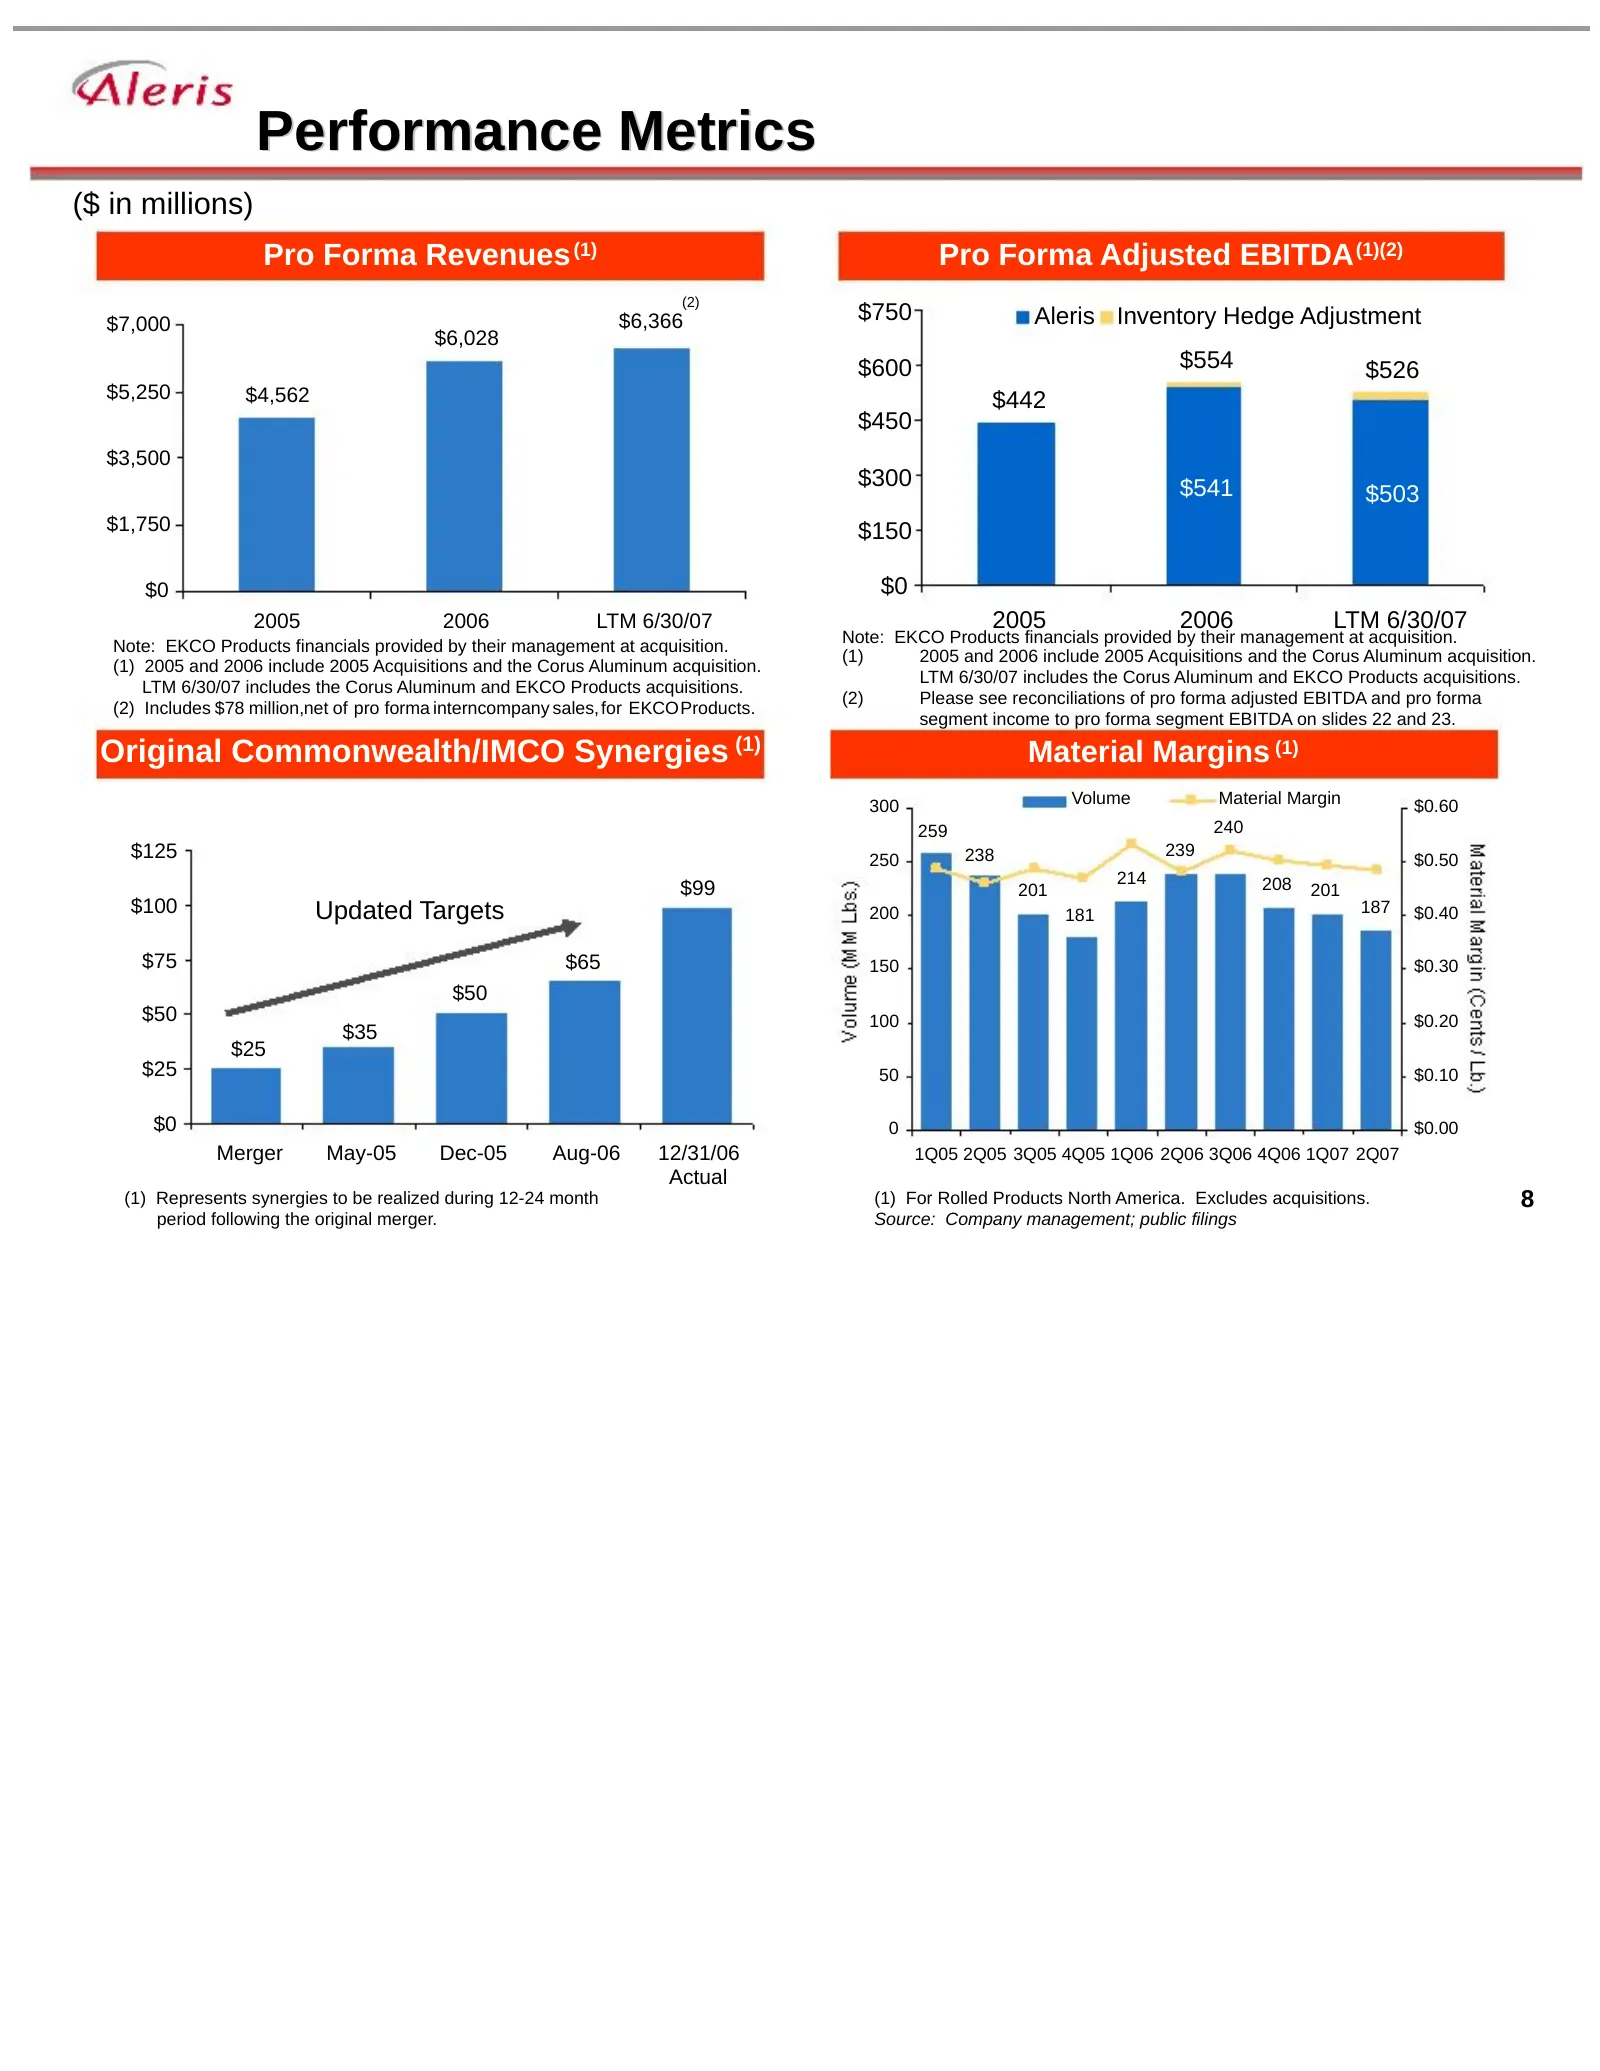
Slide 3: Performance Metrics
Performance Metrics ($ in millions) Pro Forma Revenues (1) Pro Forma Adjusted EBITDA (1)(2) (2) $7,000 $6,366 $750 Aleris Inventory Hedge Adjustment $6,028 $600 $554 $526 $5,250 $4,562 $442 $450 $3,500 $300 $541 $503 $1,750 $150 $0 $0 2005 2006 LTM 6/30/07 2005 2006 LTM 6/30/07 Note: EKCO Products f
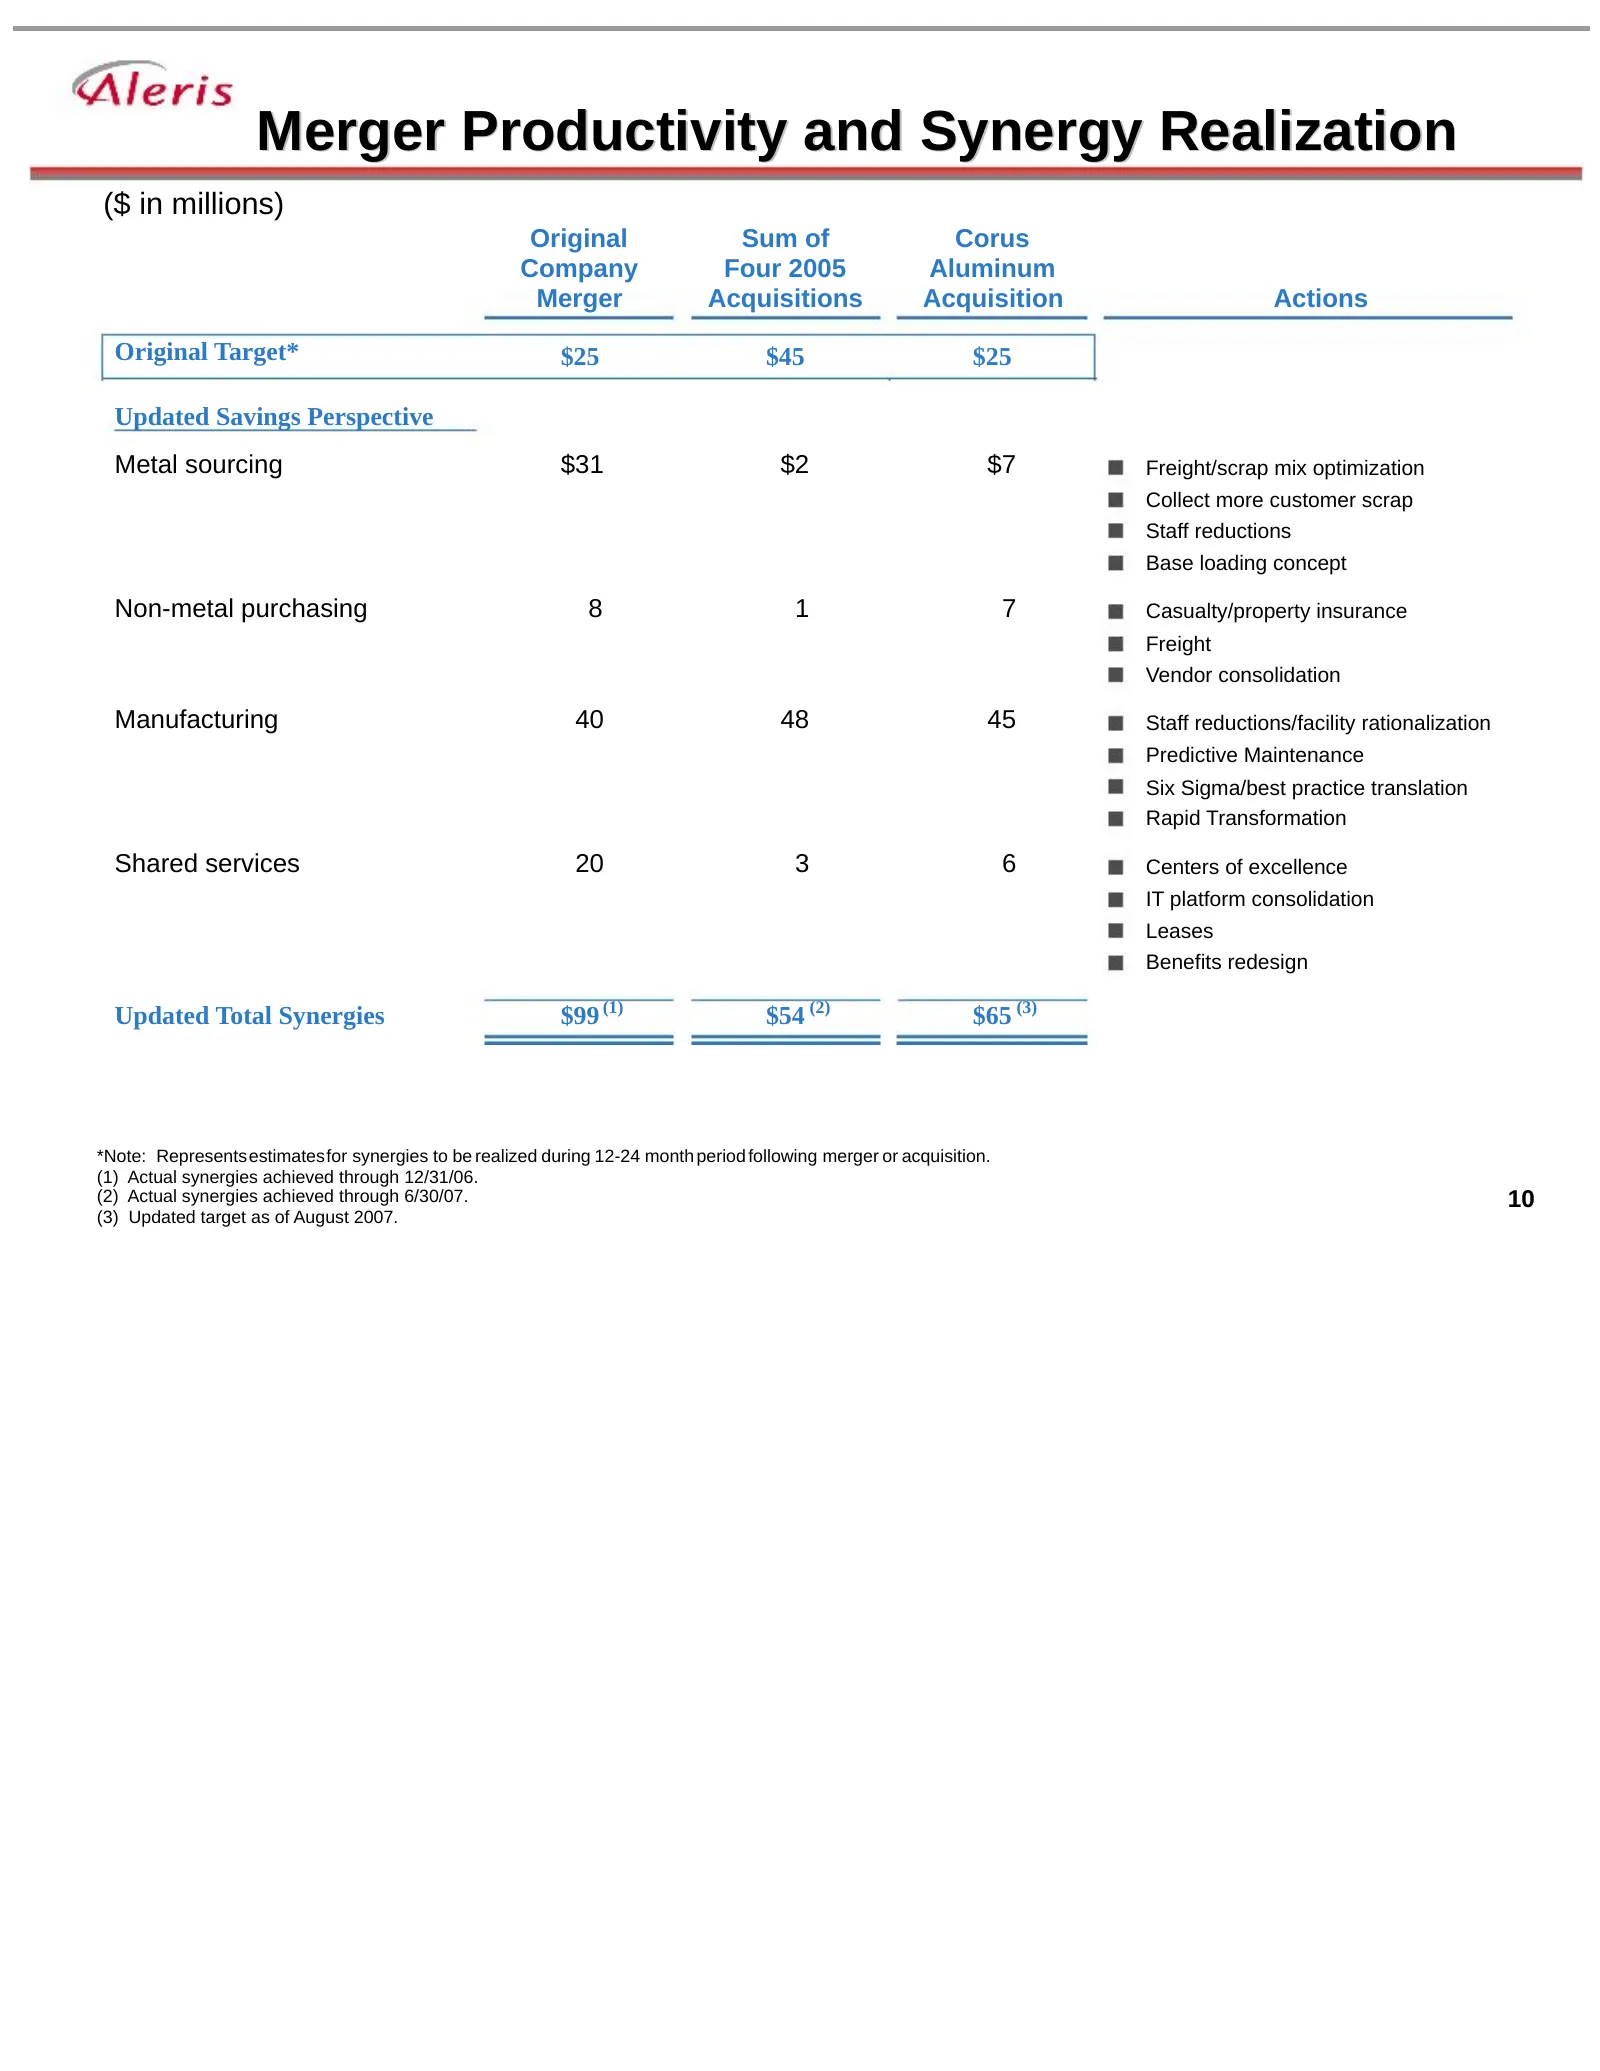
Slide 4: Merger Productivity and Synergy Realization
Merger Productivity and Synergy Realization ($ in millions) Original Sum of Corus Company Four 2005 Aluminum Merger Acquisitions Acquisition Actions Original Target* $25 $45 $25 Updated Savings Perspective Metal sourcing $31 $2 $7 Freight/scrap mix optimization Collect more customer scrap Staff redu
Slide 5: Global Rolled and Extruded Products Overview
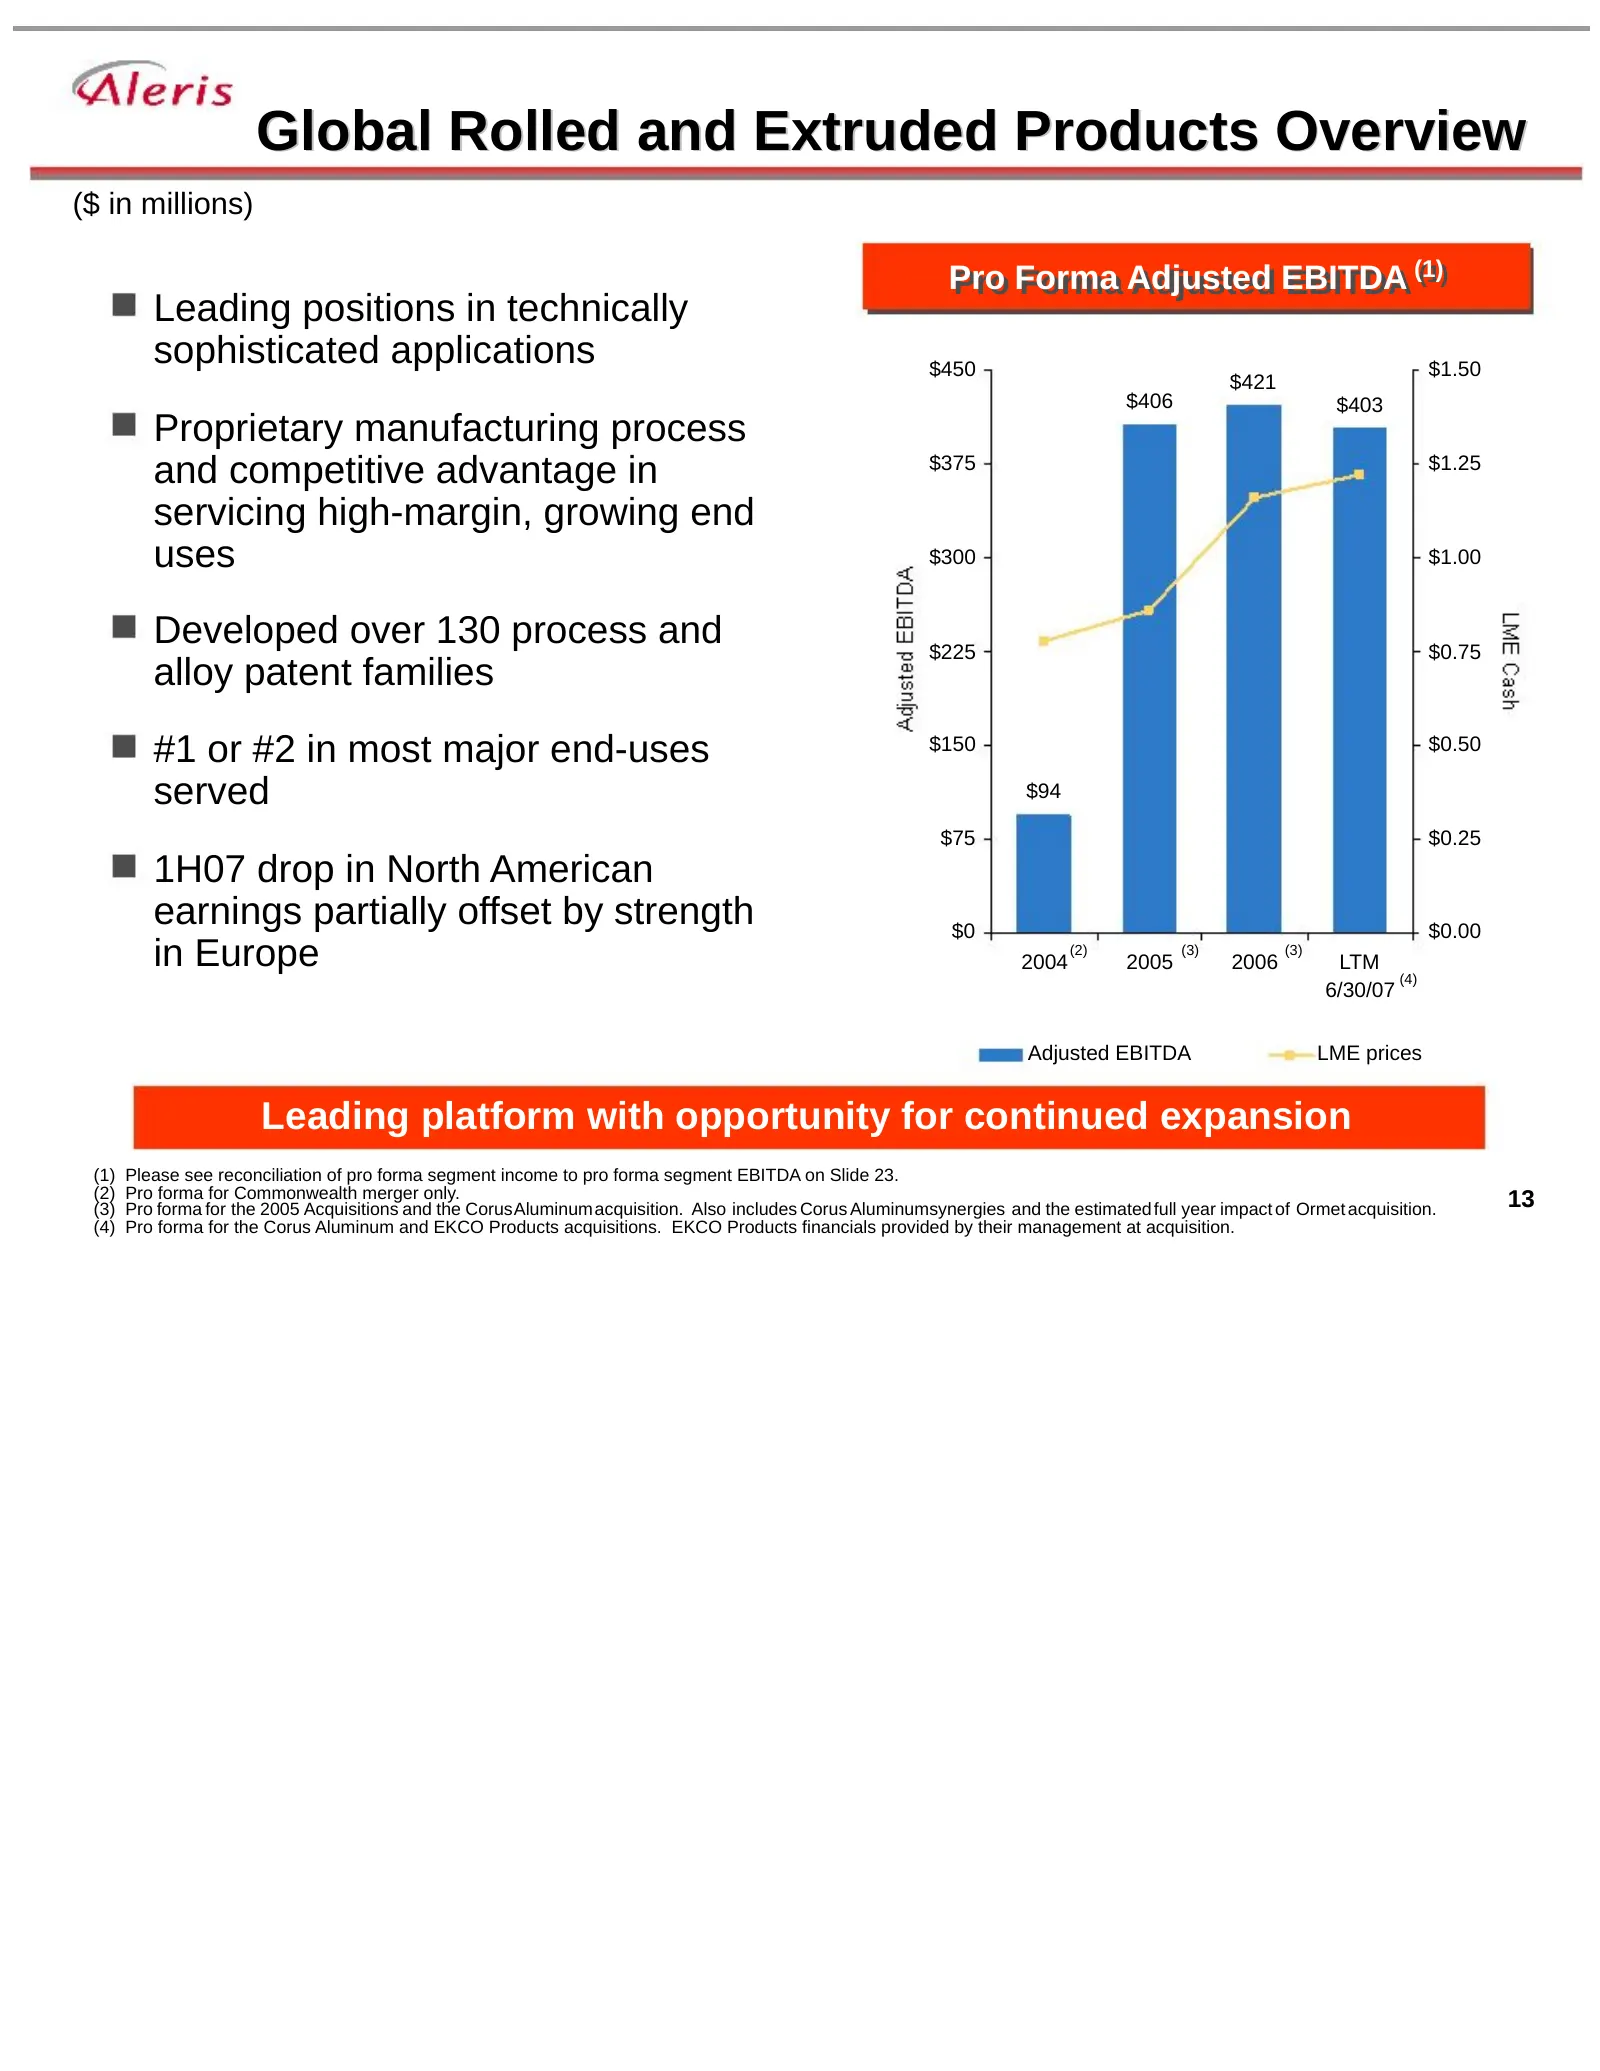
Global Rolled and Extruded Products Overview ($ in millions) Pro Pro Forma Forma Adjusted EBITDA (1) Adjusted EBITDA (1) Leading positions in technically sophisticated applications $450 $1.50 $421 $406 $403 Proprietary manufacturing process and competitive advantage in $375 $1.25 servicing high-marg
Slide 6: Strong Fundamentals in Aerospace Segment
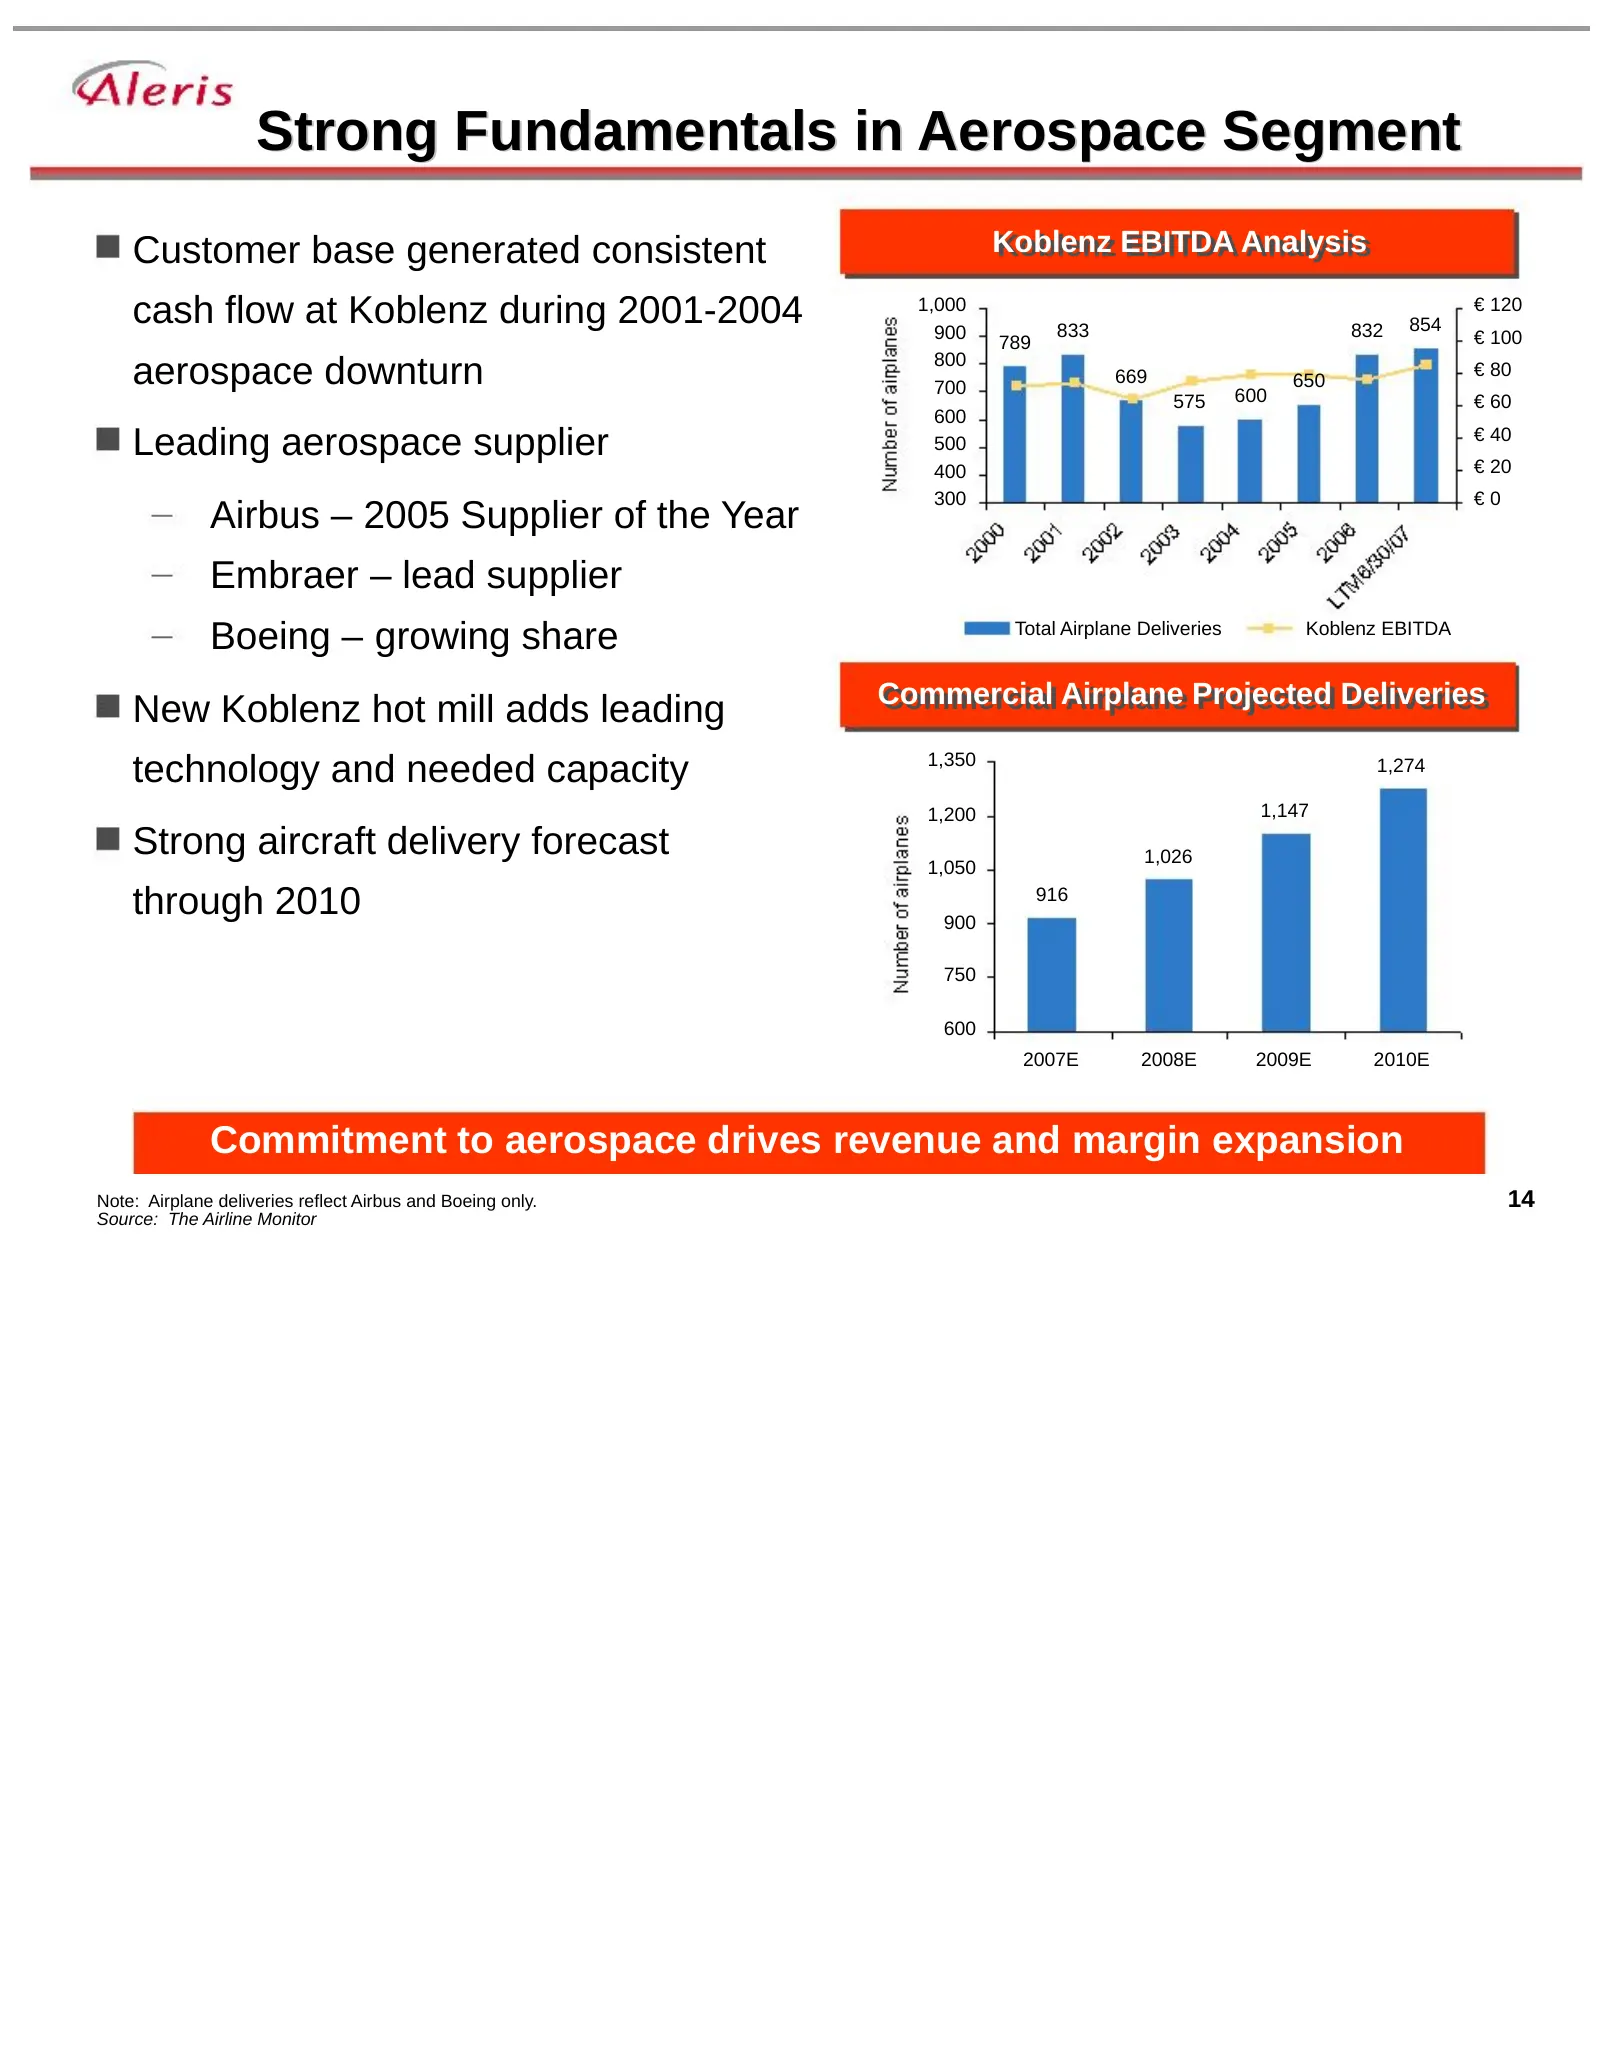
Strong Fundamentals in Aerospace Segment Customer base generated consistent Koblenz Koblenz EBITDA EBITDA Analysis Analysis cash flow at Koblenz during 2001-2004 1,000 900 833 832 854 € 120 789 € 100 800 aerospace downturn 700 669 600 650 € 80 575 € 60 600 Leading aerospace supplier 500 € 40 € 20 40
Slide 7: Global Recycling Profitability Profile
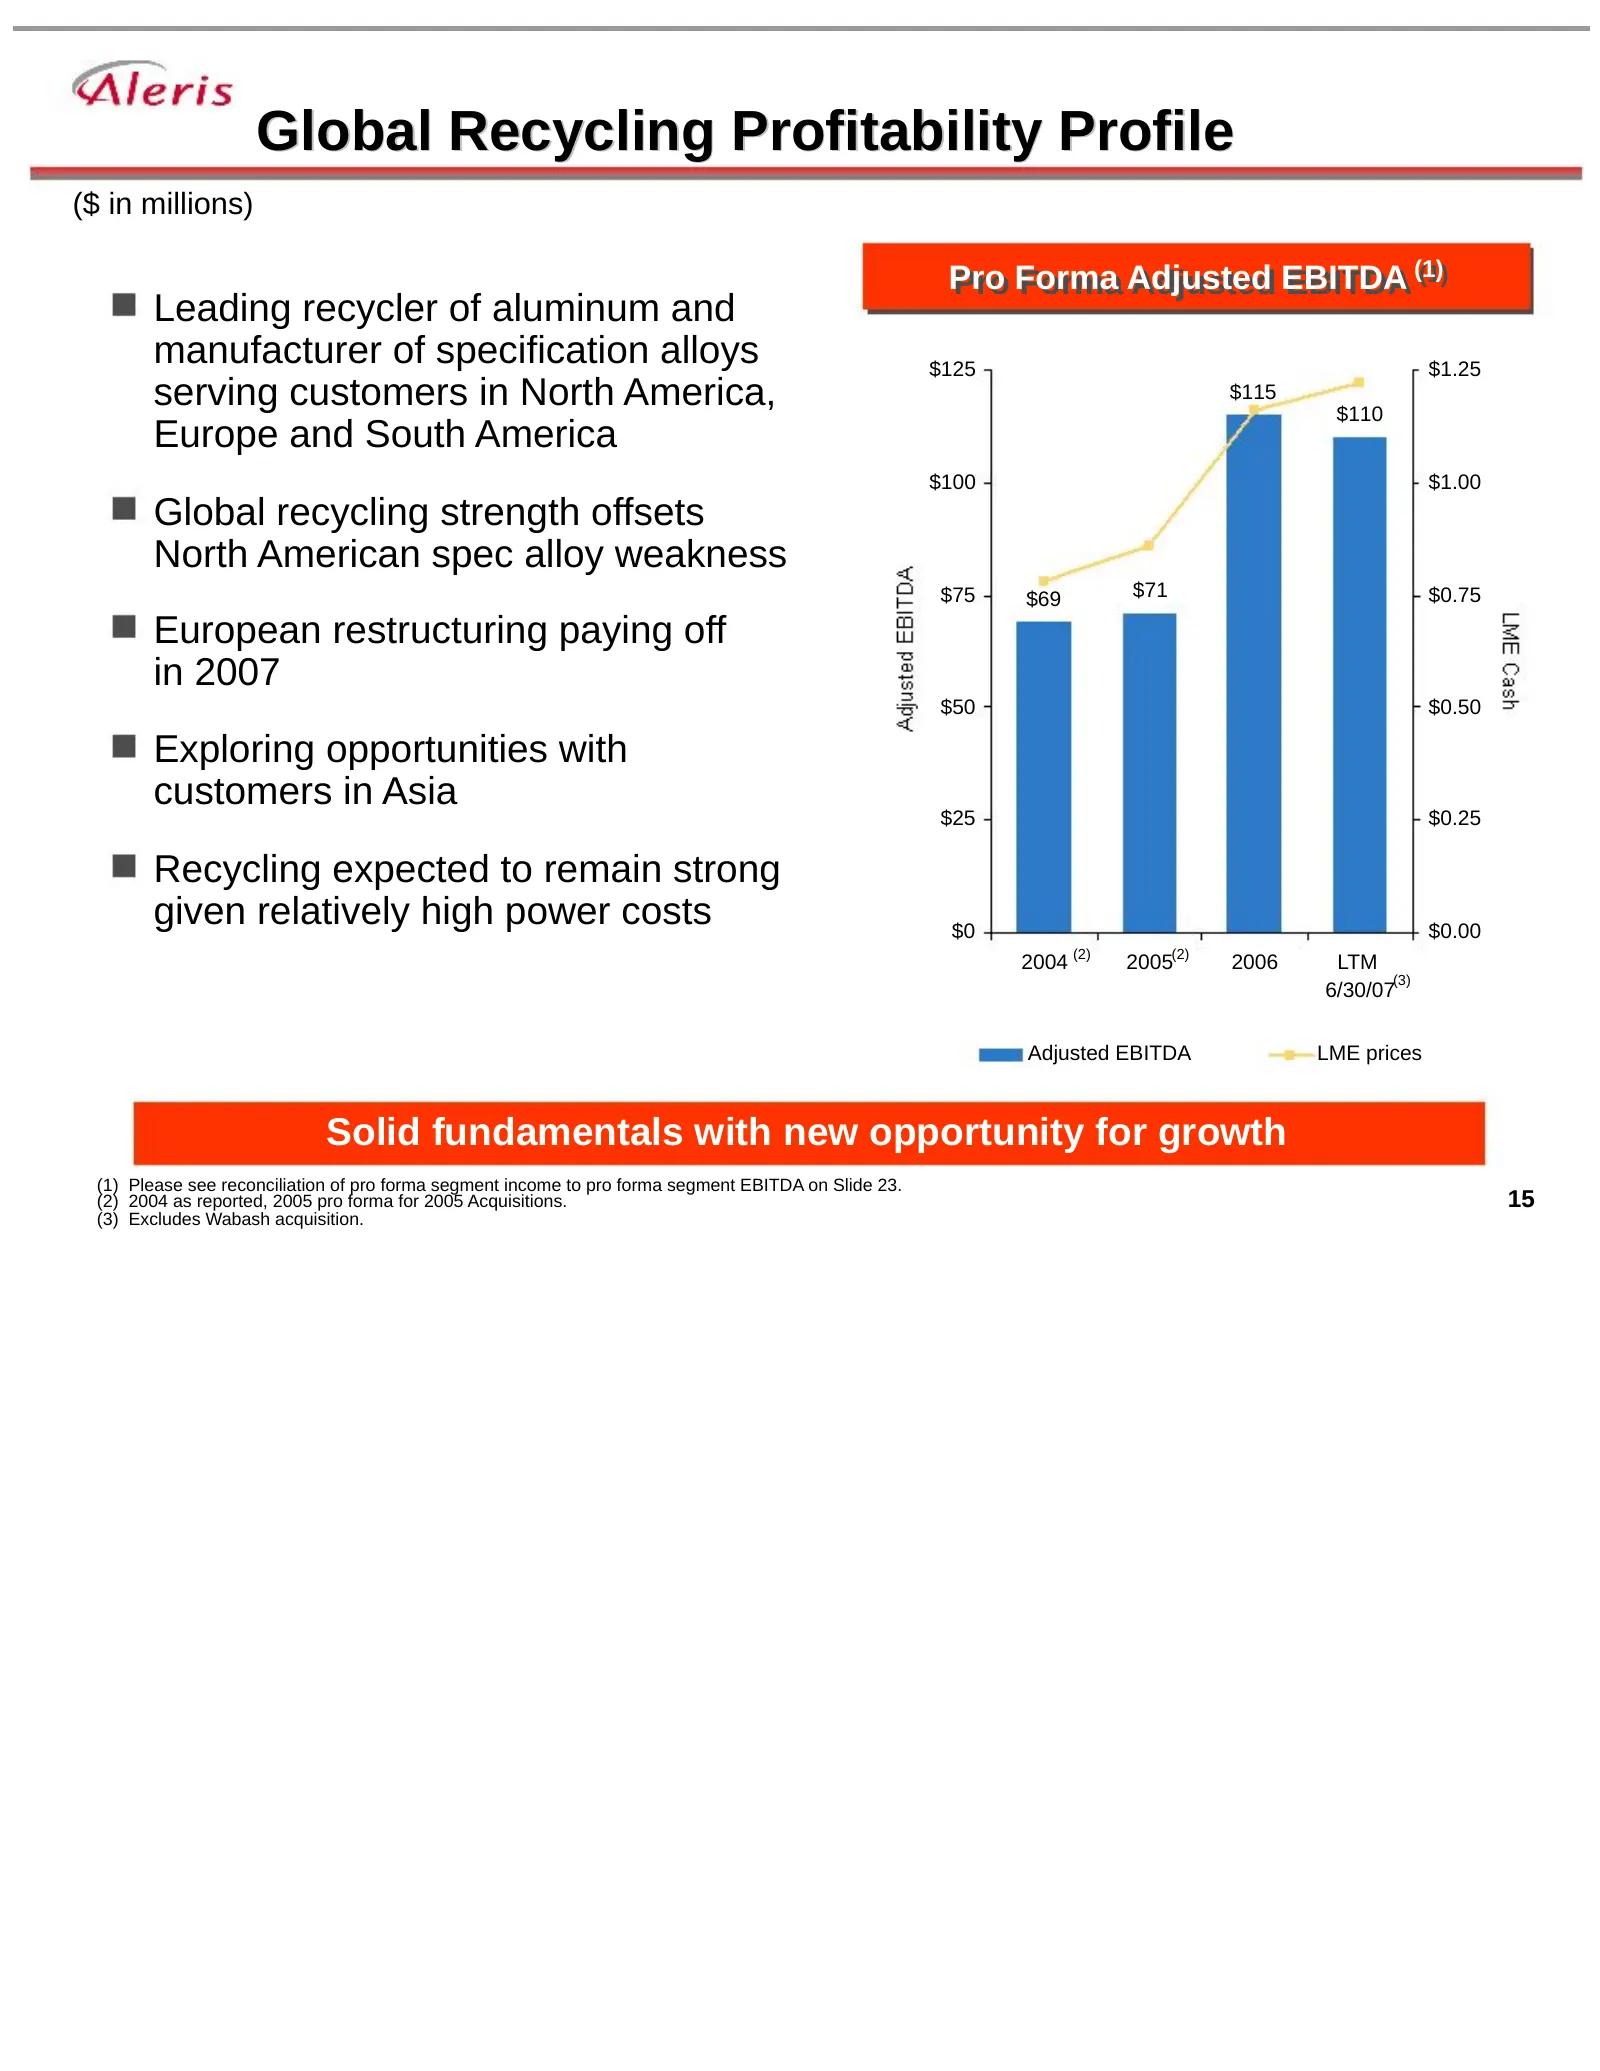
Global Recycling Profitability Profile ($ in millions) Pro Pro Forma Forma Adjusted EBITDA (1) Adjusted EBITDA (1) Leading recycler of aluminum and manufacturer of specification alloys $125 $1.25 serving customers in North America, $115 $110 Europe and South America $100 $1.00 Global recycling stren
Slide 8: Global Zinc Profitability Profile
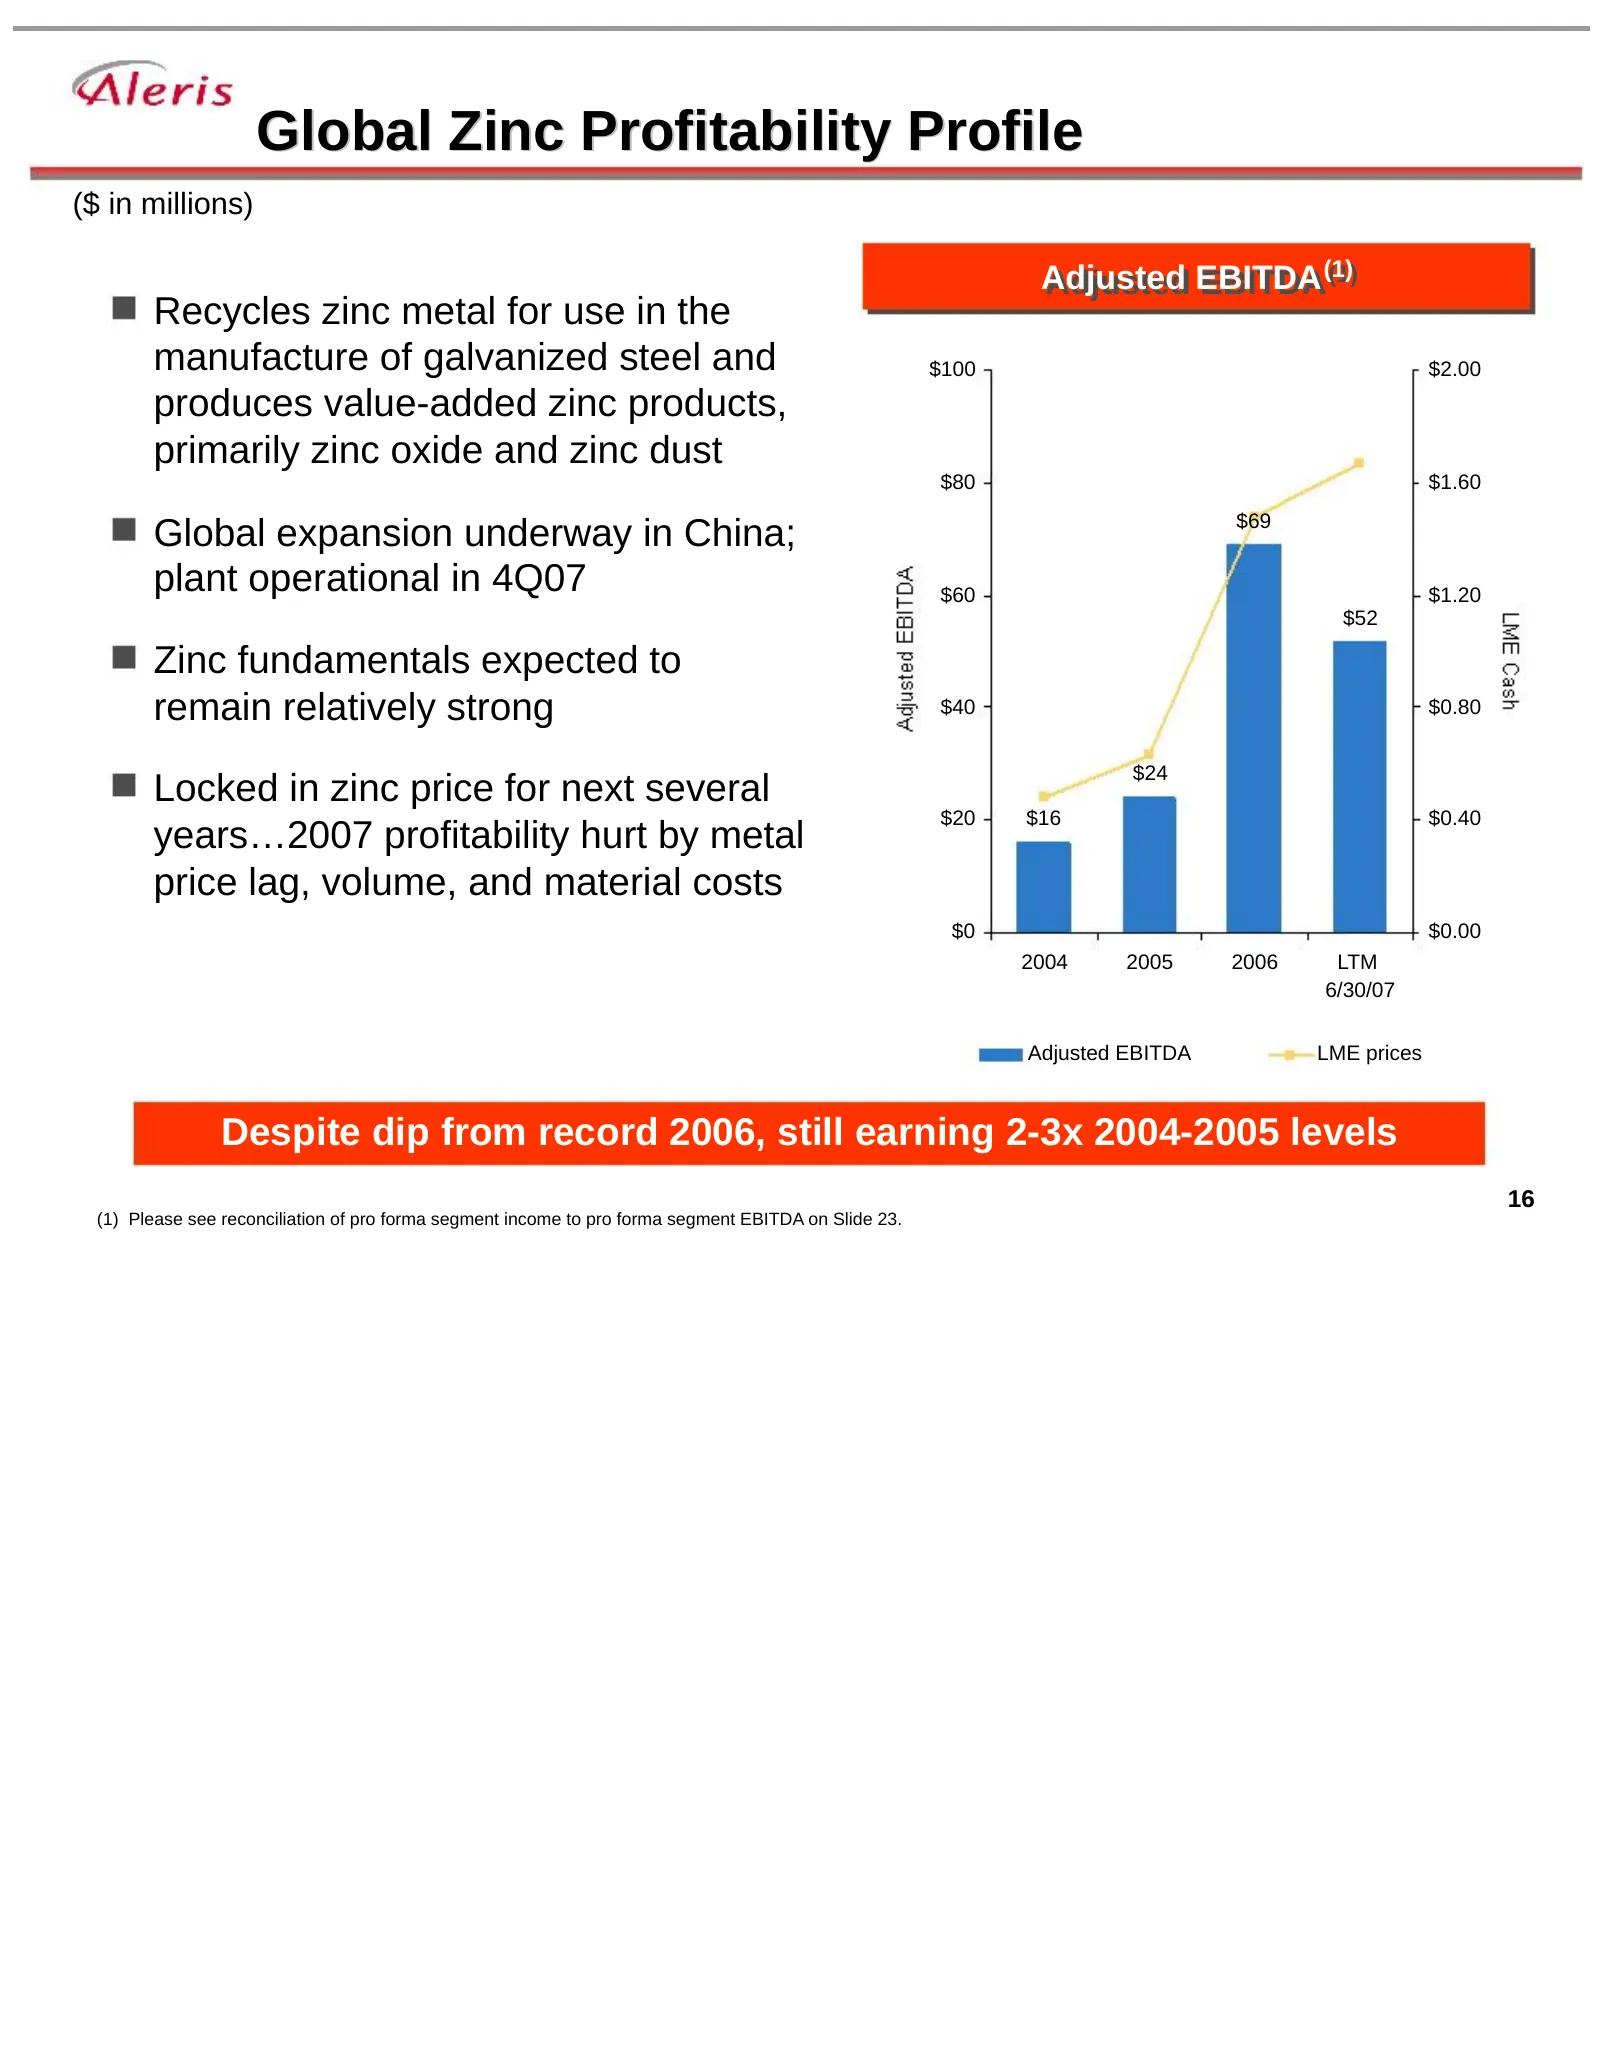
Global Zinc Profitability Profile ($ in millions) Adjusted EBITDA(1) Adjusted EBITDA (1) Recycles zinc metal for use in the manufacture of galvanized steel and $100 $2.00 produces value-added zinc products, primarily zinc oxide and zinc dust $80 $1.60 $69 Global expansion underway in China; plant op
Slide 9: Wabash Alloys – Overview / Rationale
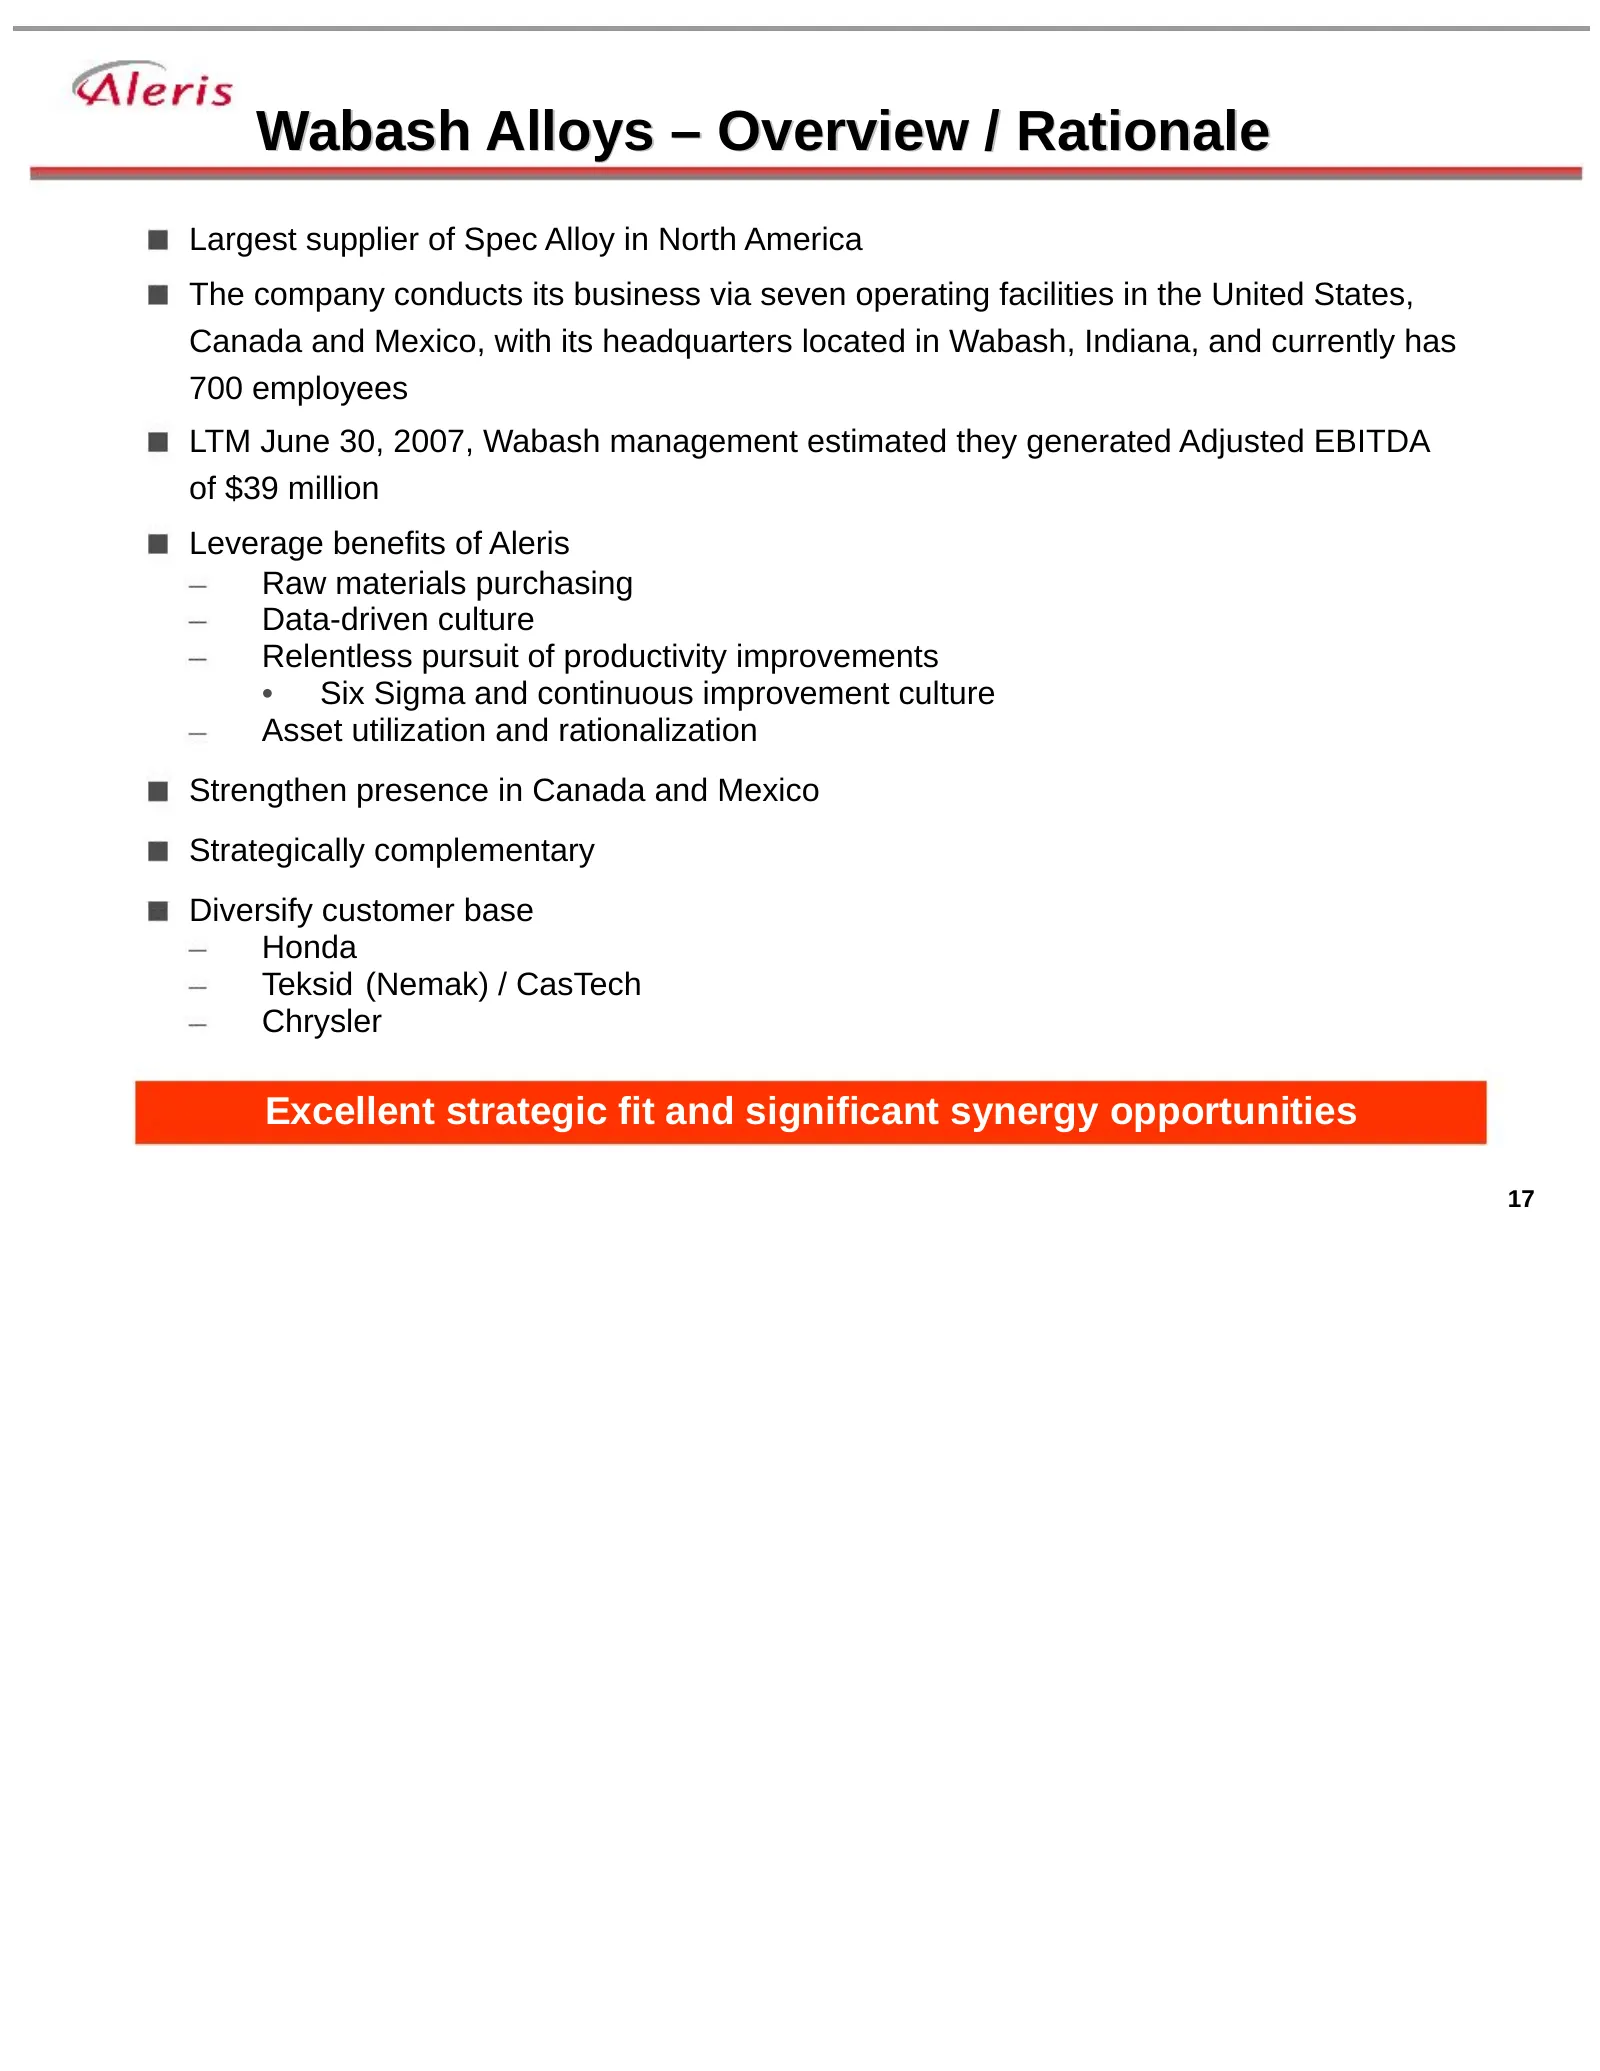
Wabash Alloys – Overview / Rationale Largest supplier of Spec Alloy in North America The company conducts its business via seven operating facilities in the United States, Canada and Mexico, with its headquarters located in Wabash, Indiana, and currently has 700 employees LTM June 30, 2007, Wabash m
Slide 10: Merger Productivity and Synergy Realization
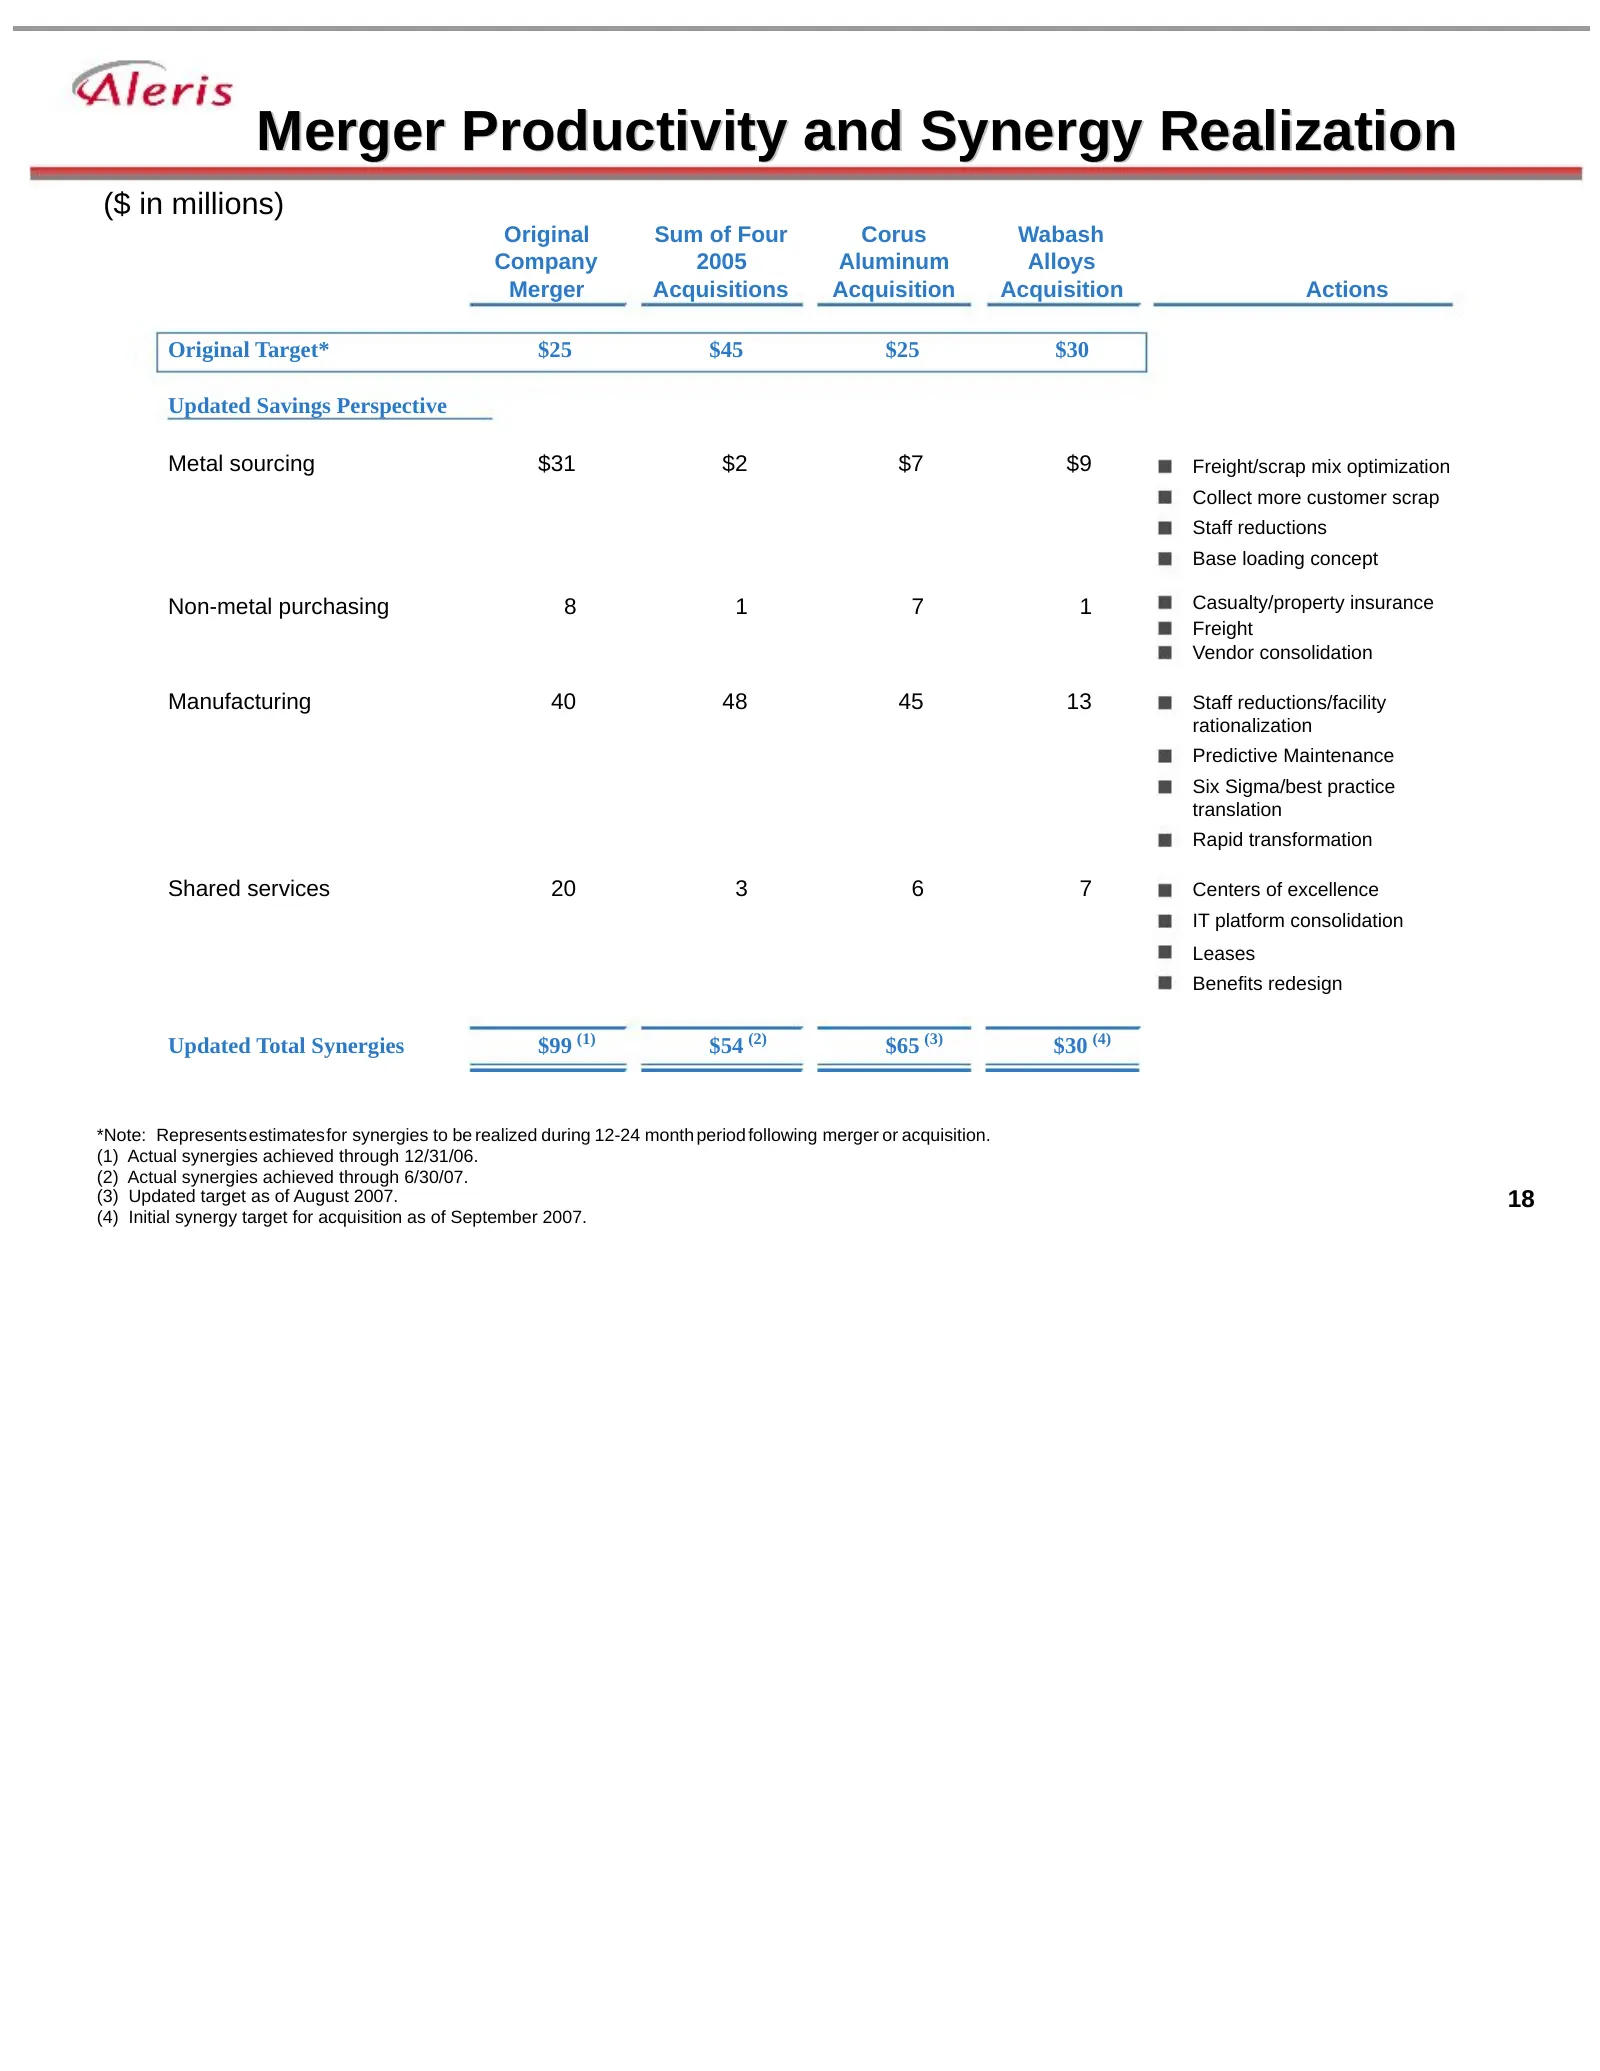
Merger Productivity and Synergy Realization ($ in millions) Original Sum of Four Corus Wabash Company 2005 Aluminum Alloys Merger Acquisitions Acquisition Acquisition Actions Original Target* $25 $45 $25 $30 Updated Savings Perspective Metal sourcing $31 $2 $7 $9 Freight/scrap mix optimization Colle
Slide 11: LTM Financial Results
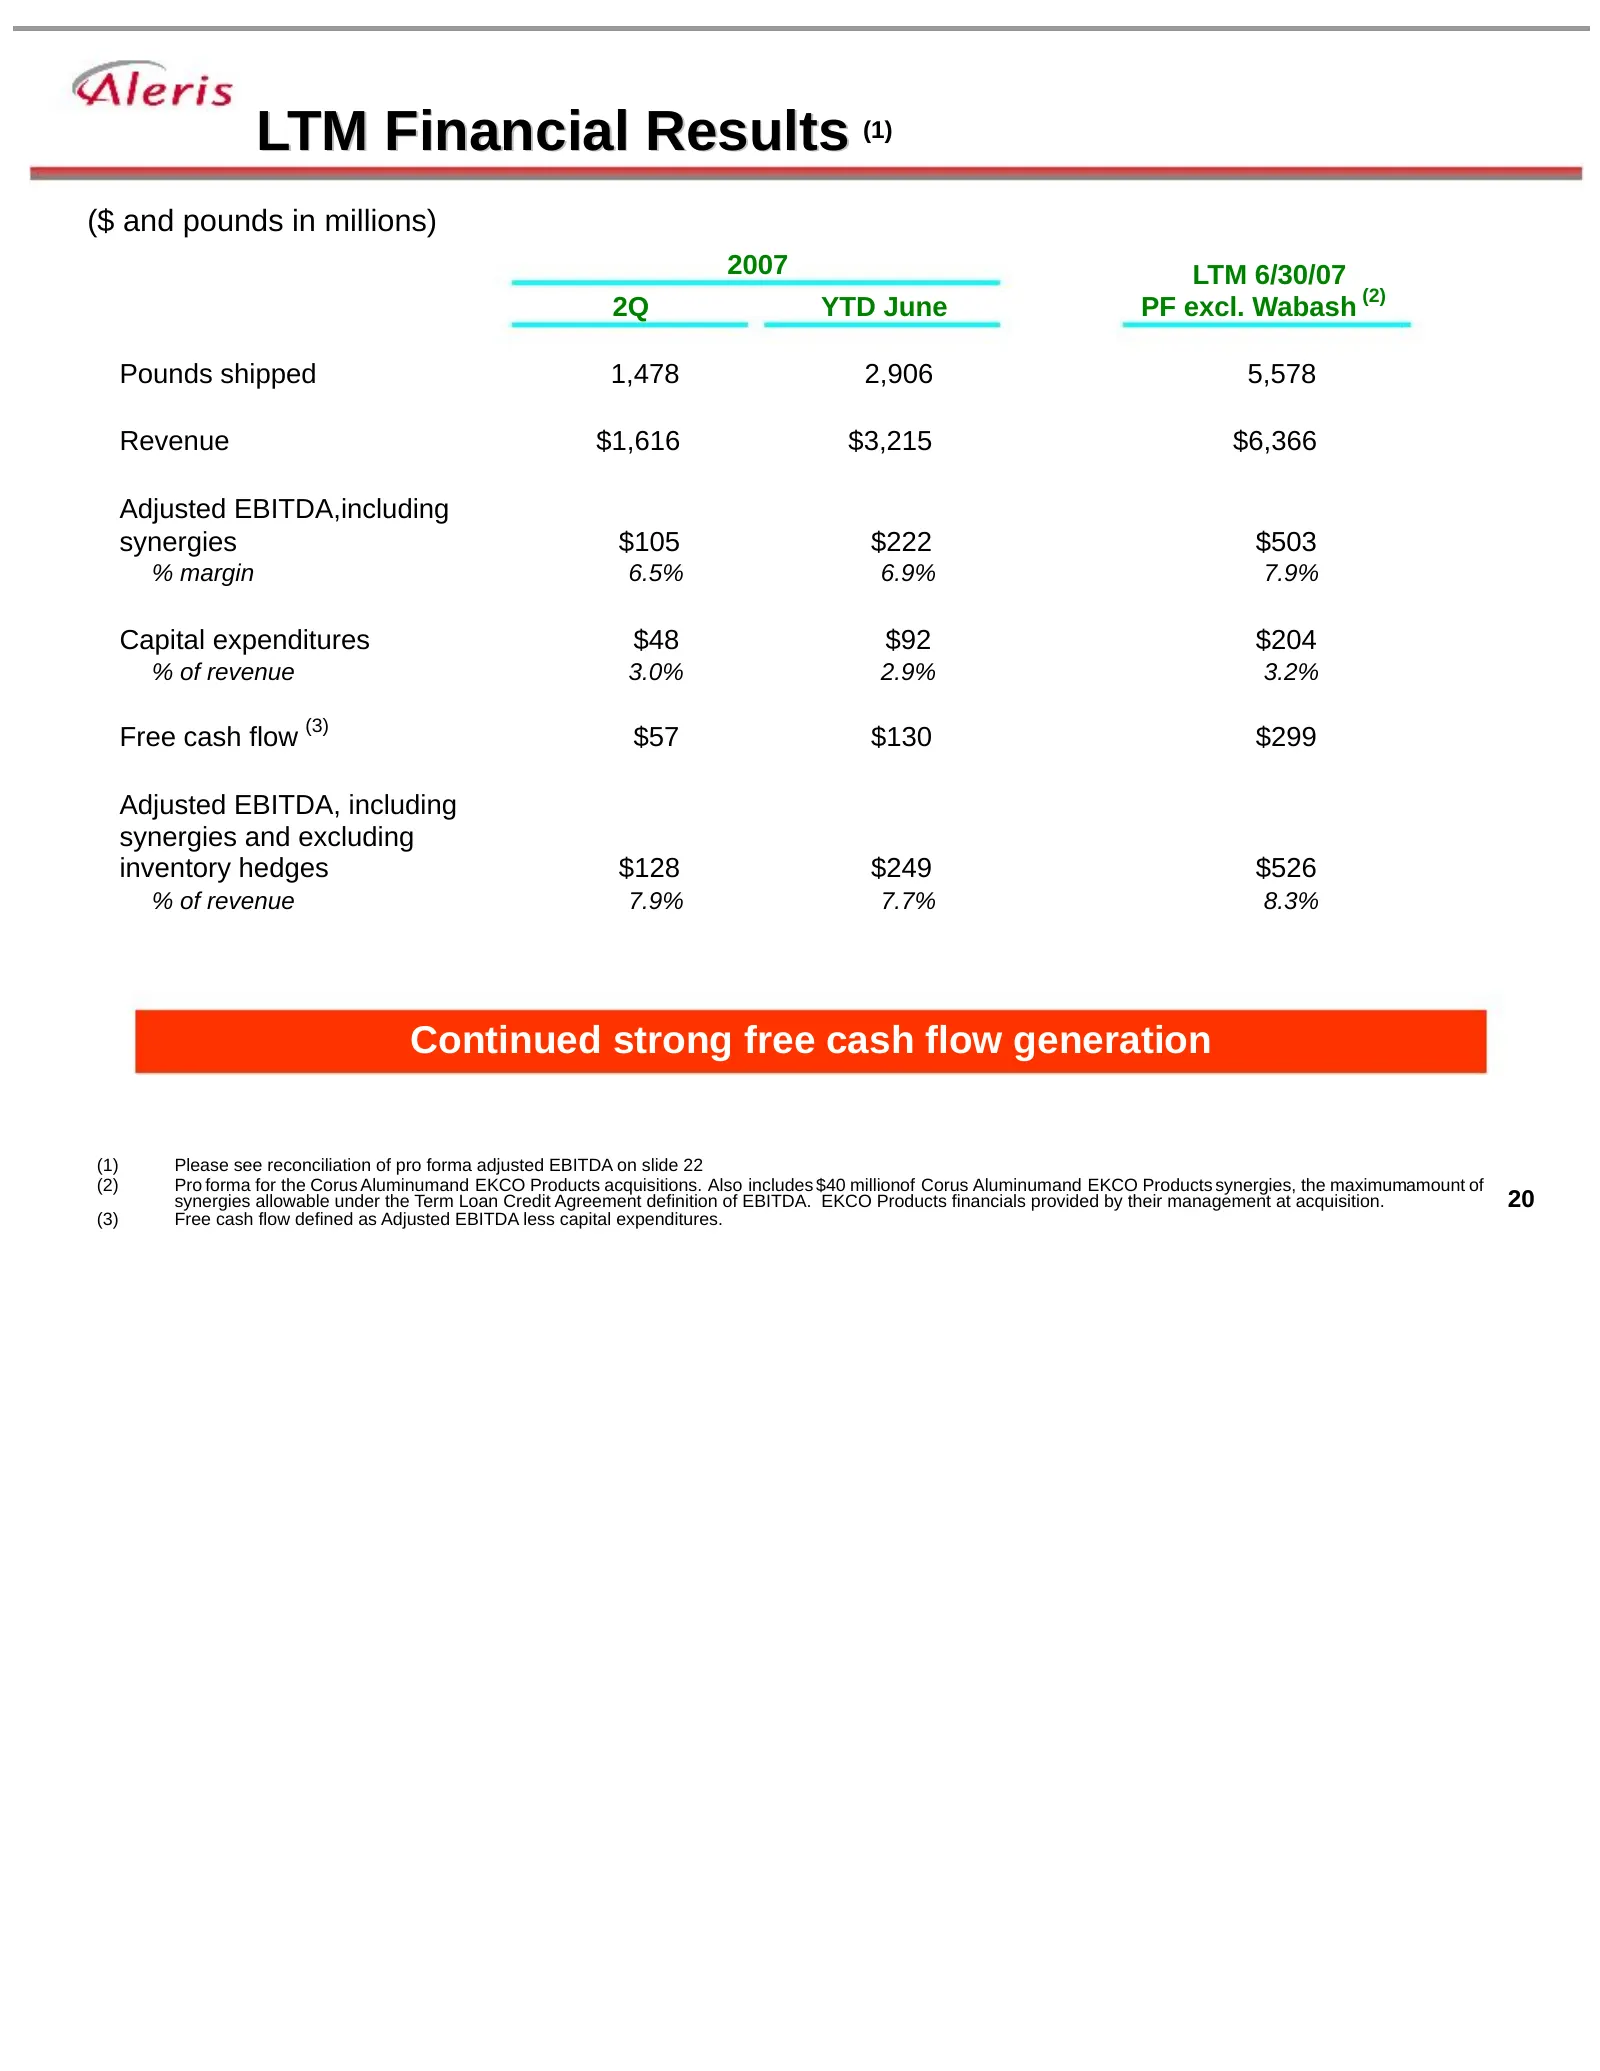
LTM Financial Results (1) ($ and pounds in millions) 2007 LTM 6/30/07 (2) 2Q YTD June PF excl. Wabash Pounds shipped 1,478 2,906 5,578 Revenue $1,616 $3,215 $6,366 Adjusted EBITDA,including synergies $105 $222 $503 % margin 6.5% 6.9% 7.9% Capital expenditures $48 $92 $204 % of revenue 3.0% 2.9% 3.2%
Slide 12: Pro Forma Capital Expenditures Overview
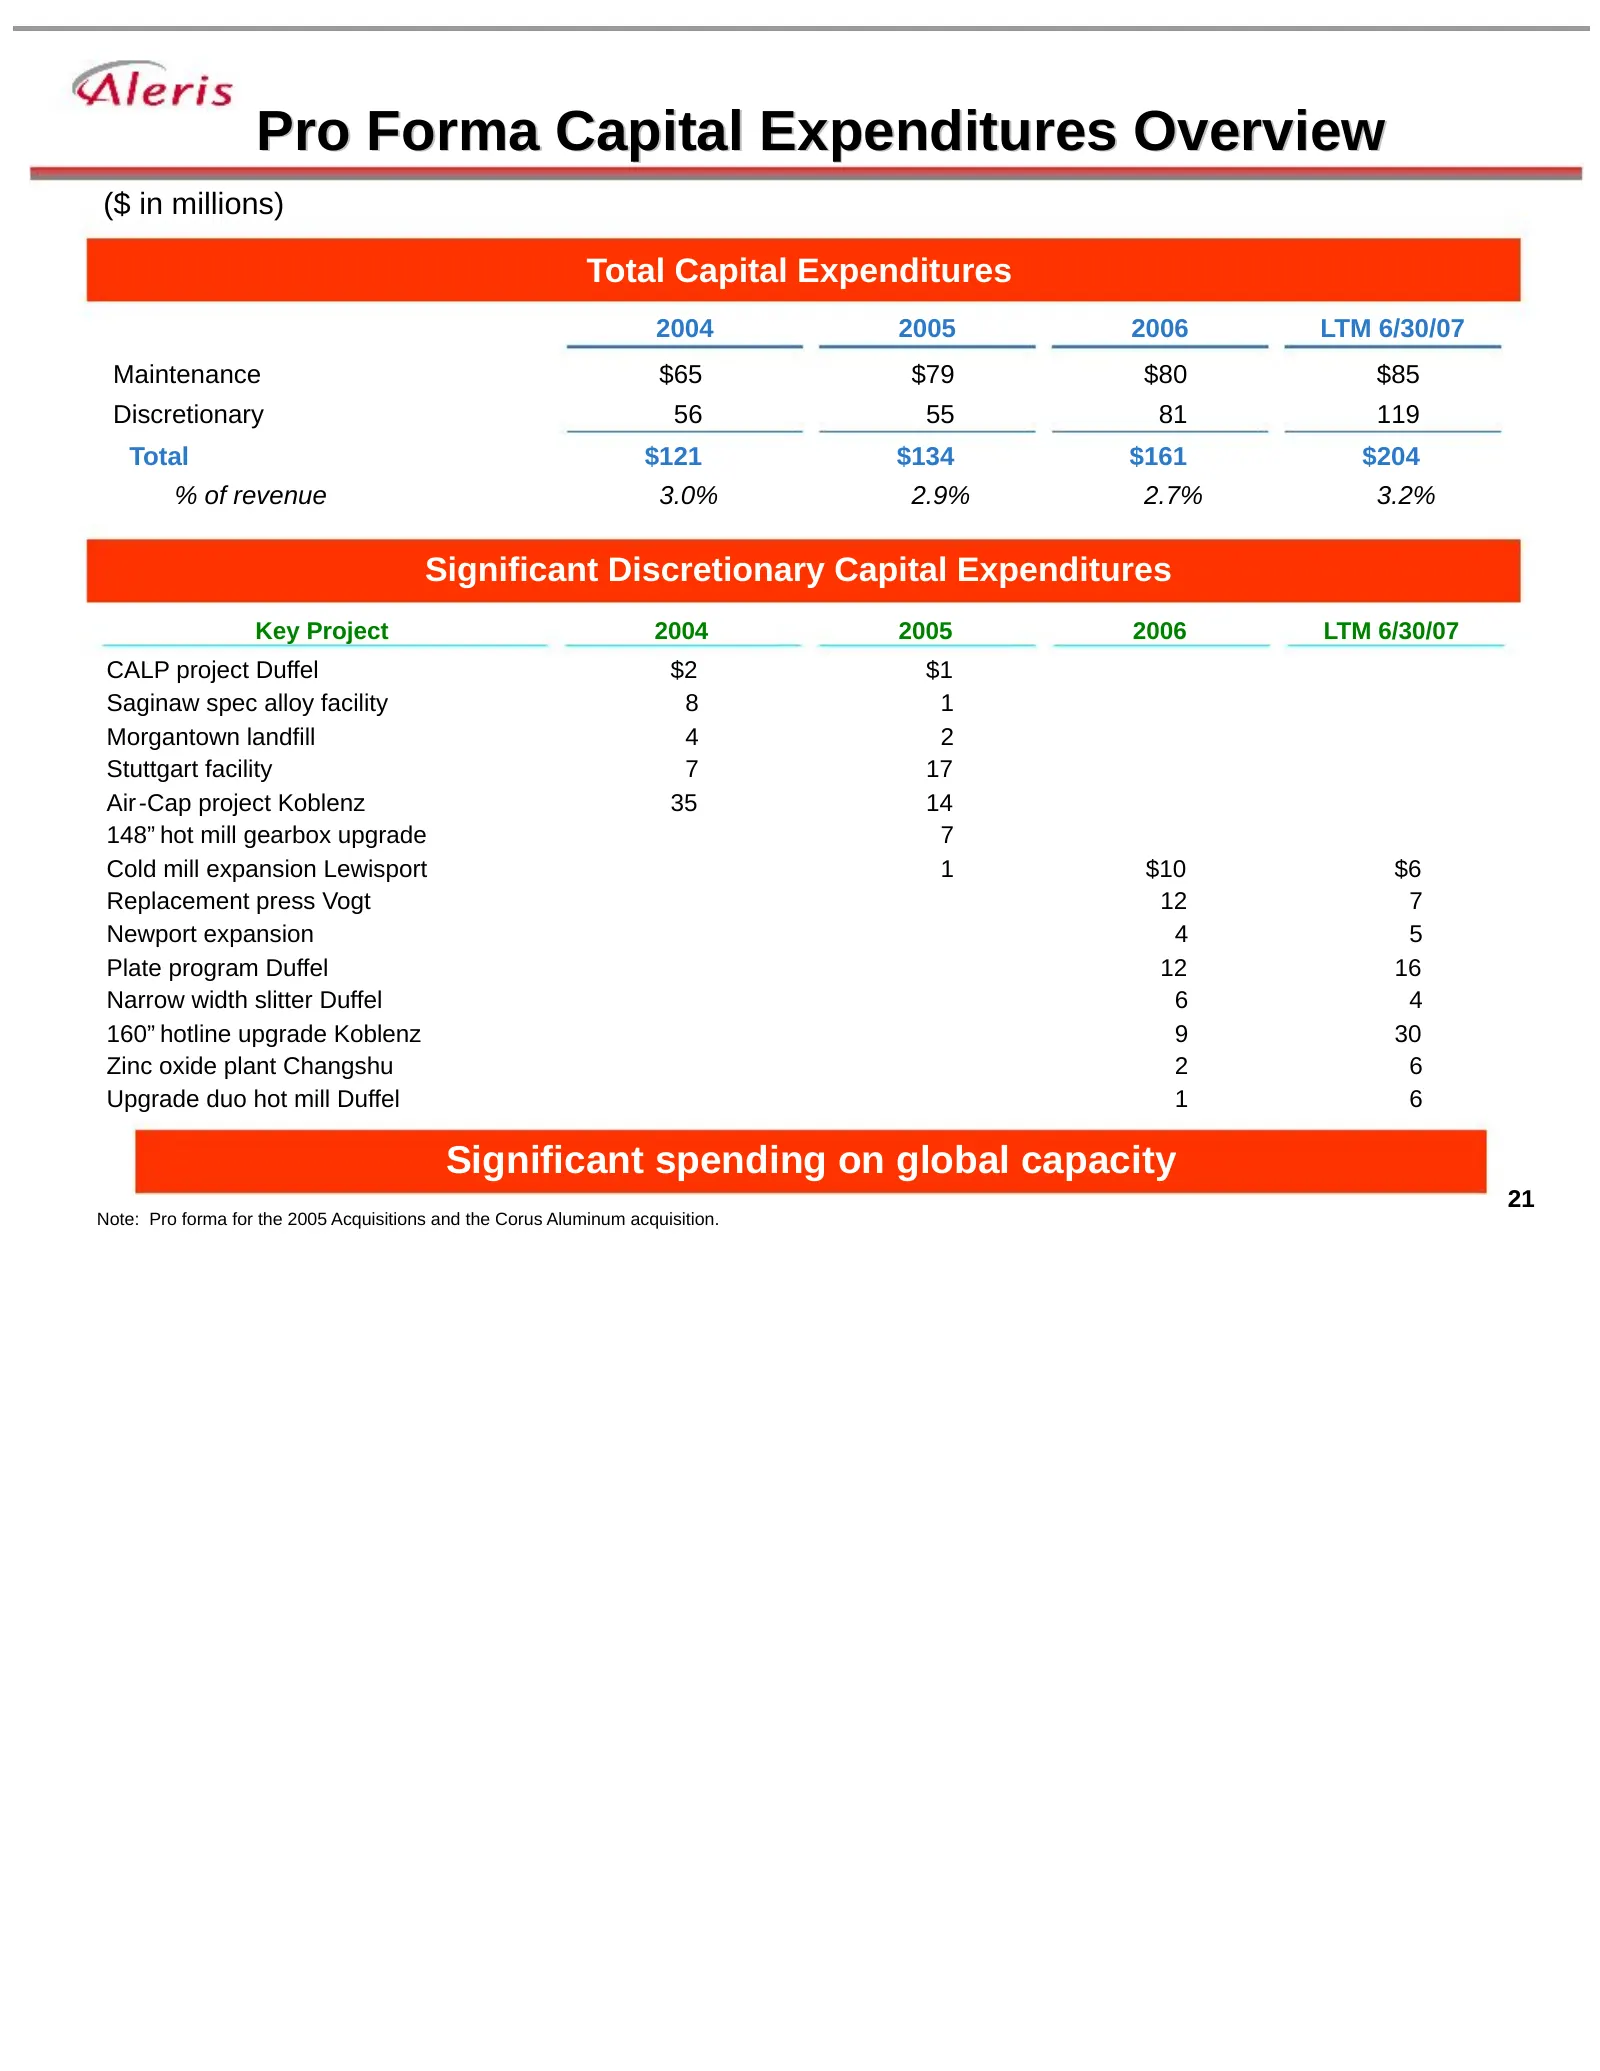
Pro Forma Capital Expenditures Overview ($ in millions) Total Capital Expenditures 2004 2005 2006 LTM 6/30/07 Maintenance $65 $79 $80 $85 Discretionary 56 55 81 119 Total $121 $134 $161 $204 % of revenue 3.0% 2.9% 2.7% 3.2% Significant Discretionary Capital Expenditures Key Project 2004 2005 2006 LT
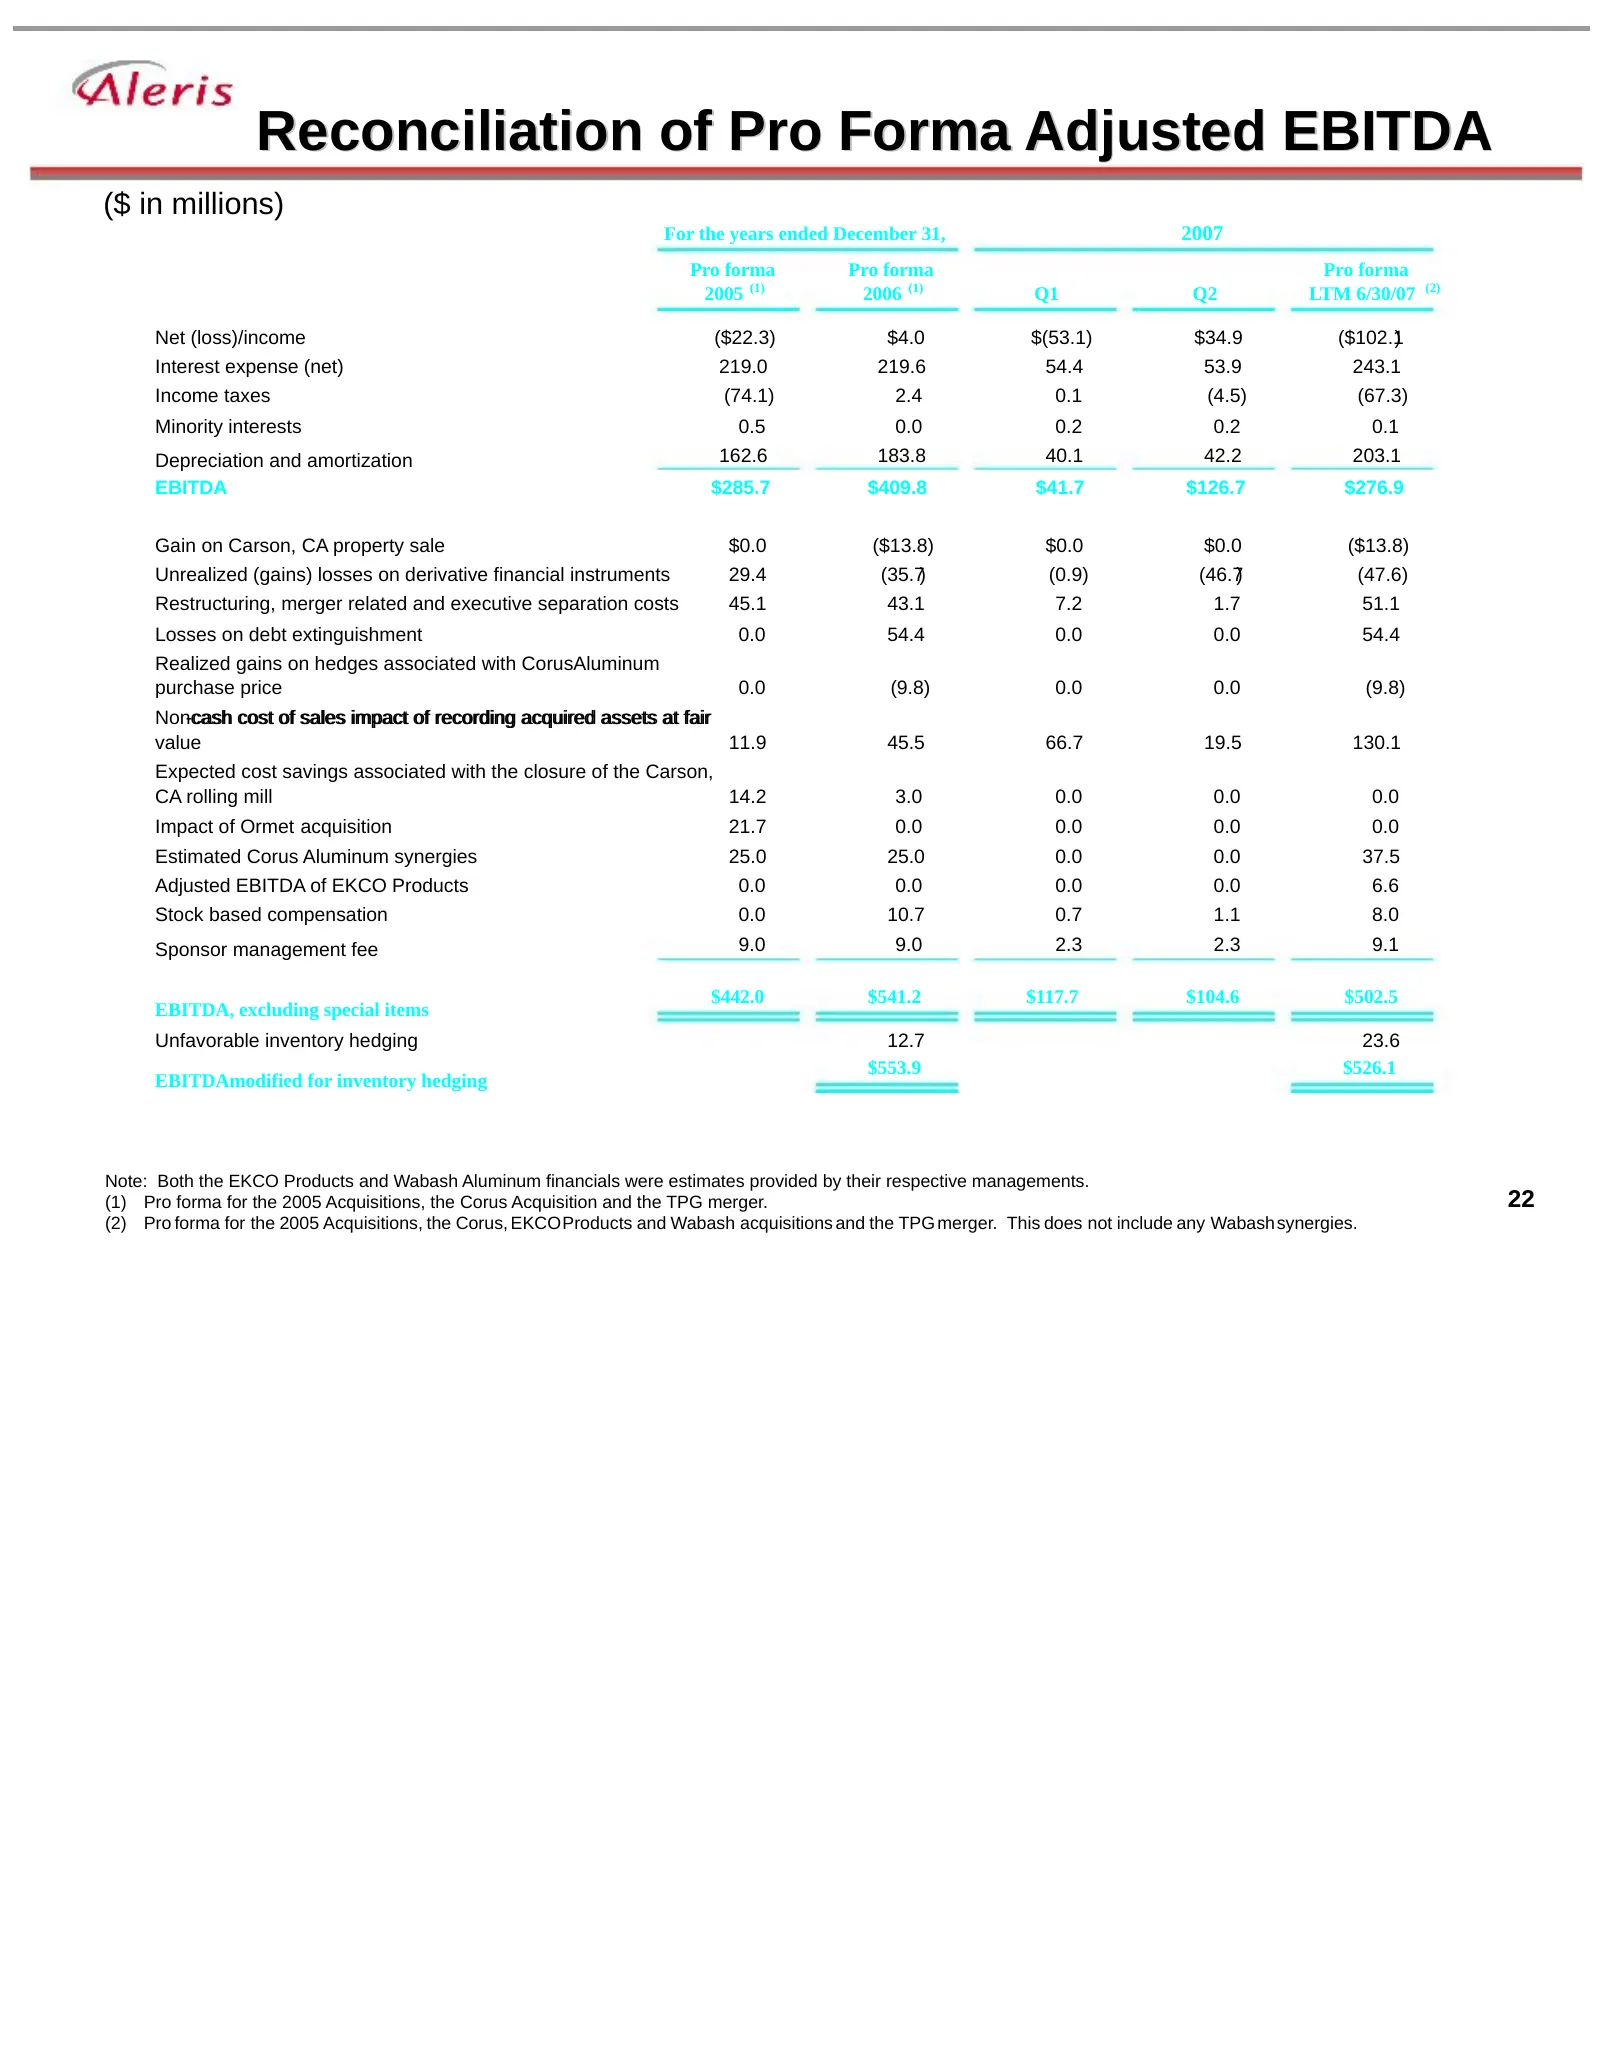
Slide 13: Reconciliation of Pro Forma Adjusted EBITDA
Reconciliation of Pro Forma Adjusted EBITDA ($ in millions) For the years ended December 31, 2007 Pro forma Pro forma Pro forma 2005 (1) 2006 (1) Q1 Q2 LTM 6/30/07 (2) Net (loss)/income ($22.3) $4.0 $(53.1) $34.9 ($102.1) Interest expense (net) 219.0 219.6 54.4 53.9 243.1 Income taxes (74.1) 2.4 0.1
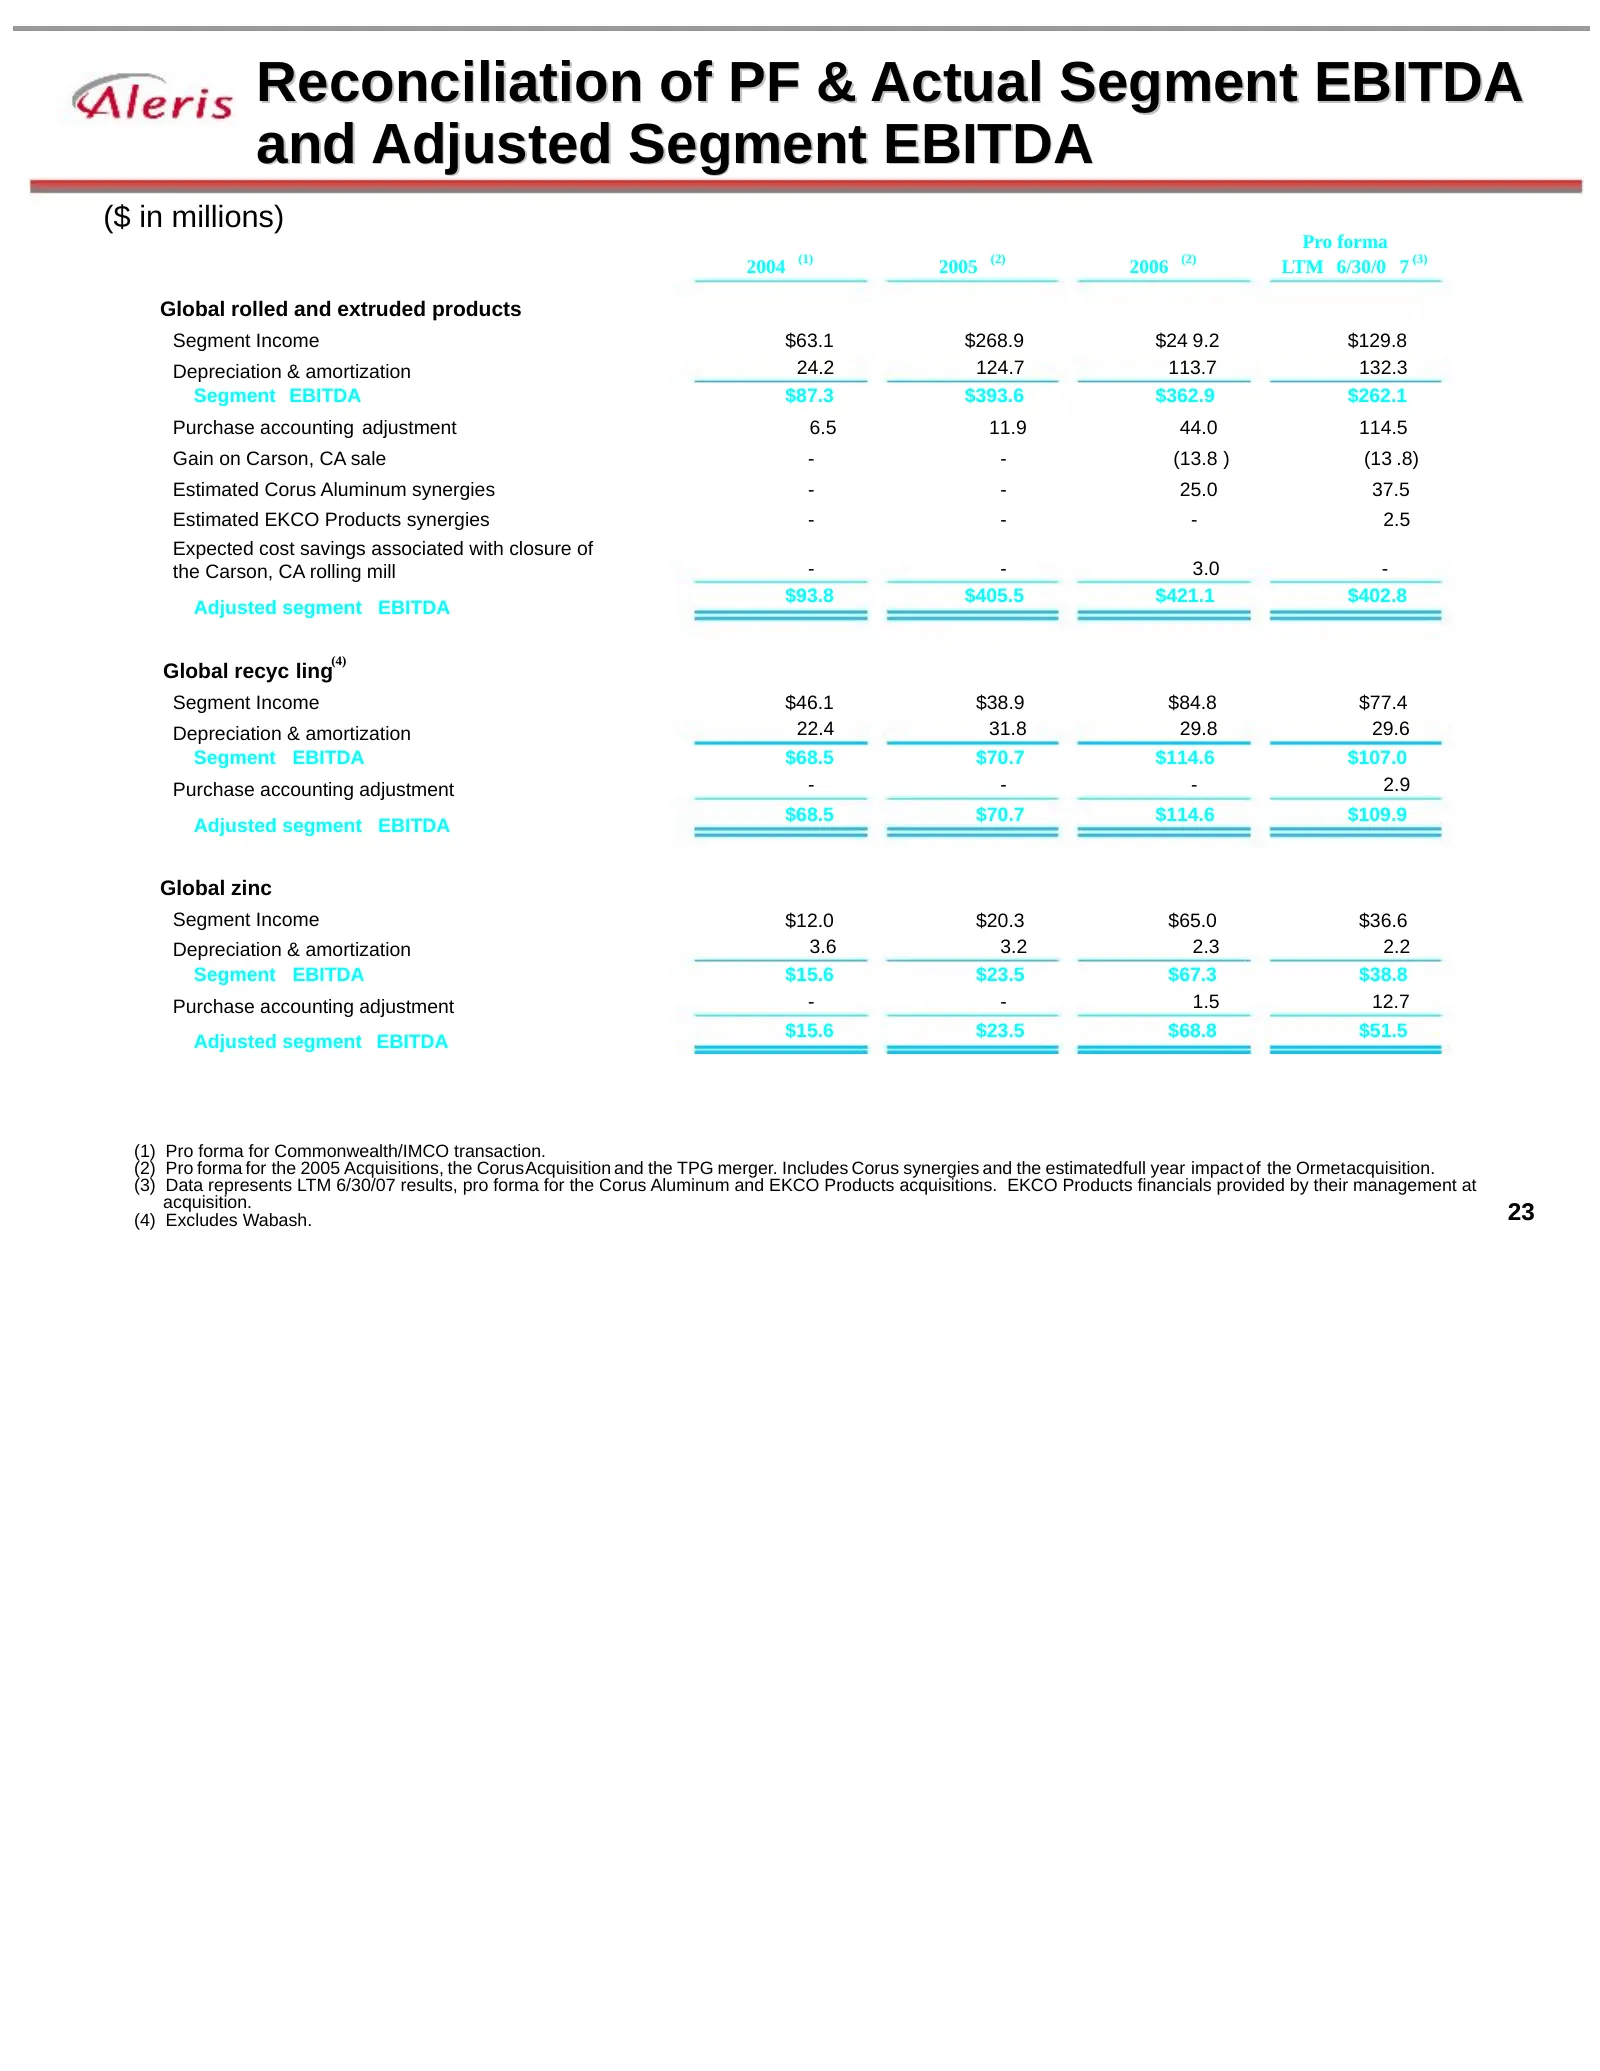
Slide 14: Reconciliation of PF & Actual Segment EBITDA and Adjusted Segment EBITDA
Reconciliation of PF & Actual Segment EBITDA and Adjusted Segment EBITDA ($ in millions) Pro forma (1) (2) (2) (3) 2004 2005 2006 LTM 6/30/0 7 Global rolled and extruded products Segment Income $63.1 $268.9 $24 9.2 $129.8 Depreciation & amortization 24.2 124.7 113.7 132.3 Segment EBITDA $87.3 $393.6
Source: SEC EDGAR · 8-K filed Oct 3, 2007
More decks from Aleris International Inc
 2008 Bank of America Credit Conference26 slides · Nov 21, 2008
 Deutsche Bank Leverage Finance Conference 200828 slides · Sep 25, 2008
 FY2007 Earnings Presentation33 slides · Mar 31, 2008
 FY2007 Earnings Presentation33 slides · Mar 27, 2008
 Bear Stearns Commodity and Capital Goods Conference November 200723 slides · Nov 28, 2007
 Debt Investor Presentation (March 2007)6 slides · Mar 7, 2007