Innophos — Annual Industrials Conference 2011
22 slides from Innophos's conference presentation, Sep 26, 2011
Slide 1: Annual Industrials Conference
Randy Gress - Chief Executive Officer Innophos Holdings, Inc. a ‘. 6 Annual Industrials Conference September 26, 2011
Slide 2: Safe Harbor
Safe Harbor * During the course of this presentation, management may make forward-looking statements regarding financial performance and future events. We will attempt to identify these statements by use of words such as expect, believe, anticipate, intend, and other words that denote future events.
Slide 3: Our Vision
Our Vision To be the most successful, most competitive and first choice Specialty Phosphates company in the world ©iInnophos September 26, 2011 4
Slide 4: Innophos: the Specialty Phosphates Leader in North America
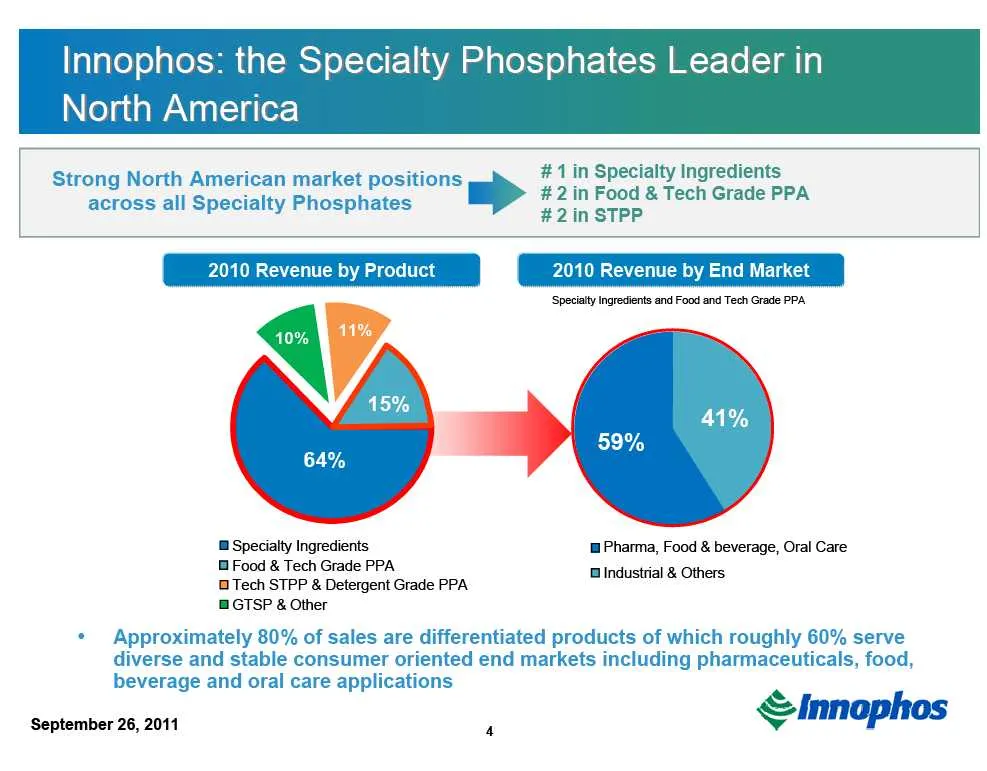
Innophos: the Specialty Phosphates Leader in North America #1 in Specialty Ingredients #2 in Food & Tech Grade PPA #2 in STPP 2010 Revenue by Product 2010 Revenue by End Market ‘Specialty Ingredients and Food and Tech Grade PPA Strong North American market positions across all Specialty Phosphates %
Slide 5: Success in Food Ingredients Positions IPHS for Attractive Future Opportunities
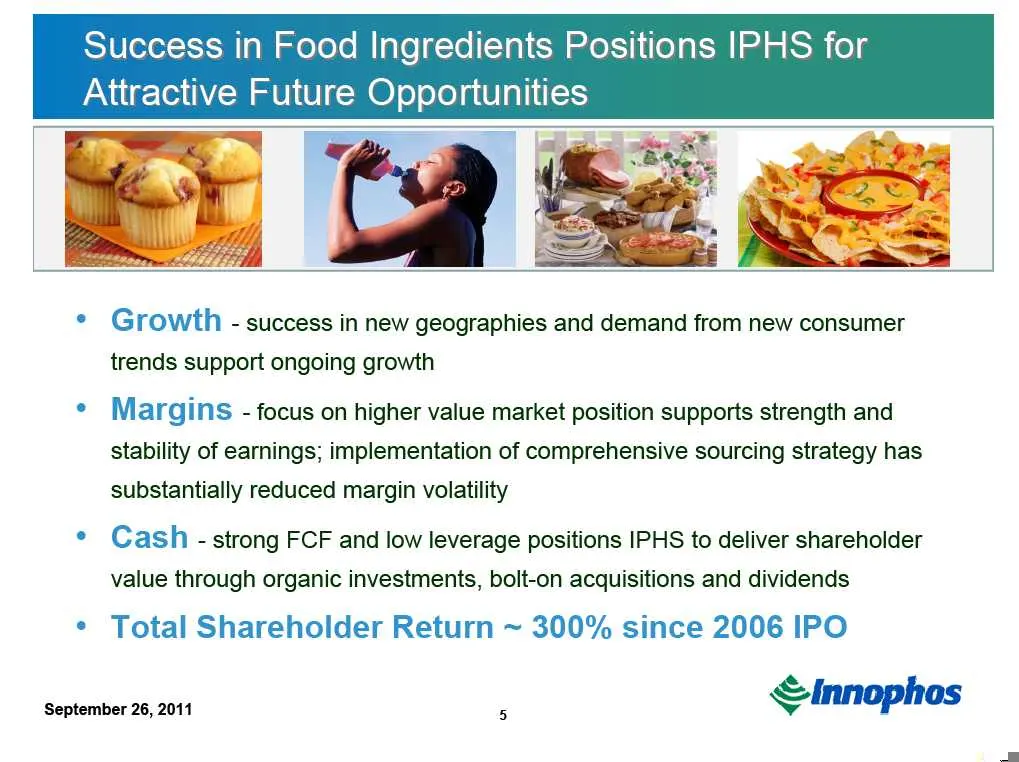
Success in Food Ingredients Positions IPHS for Attractive Future Oppeoreaiies Ek ta ta ce * Growth - success in new geographies and demand from new consumer trends support ongoing growth ¢ Margins - focus on higher value market position supports strength and stability of earnings; implementation of
Slide 6: Innophos: Our Business & Markets
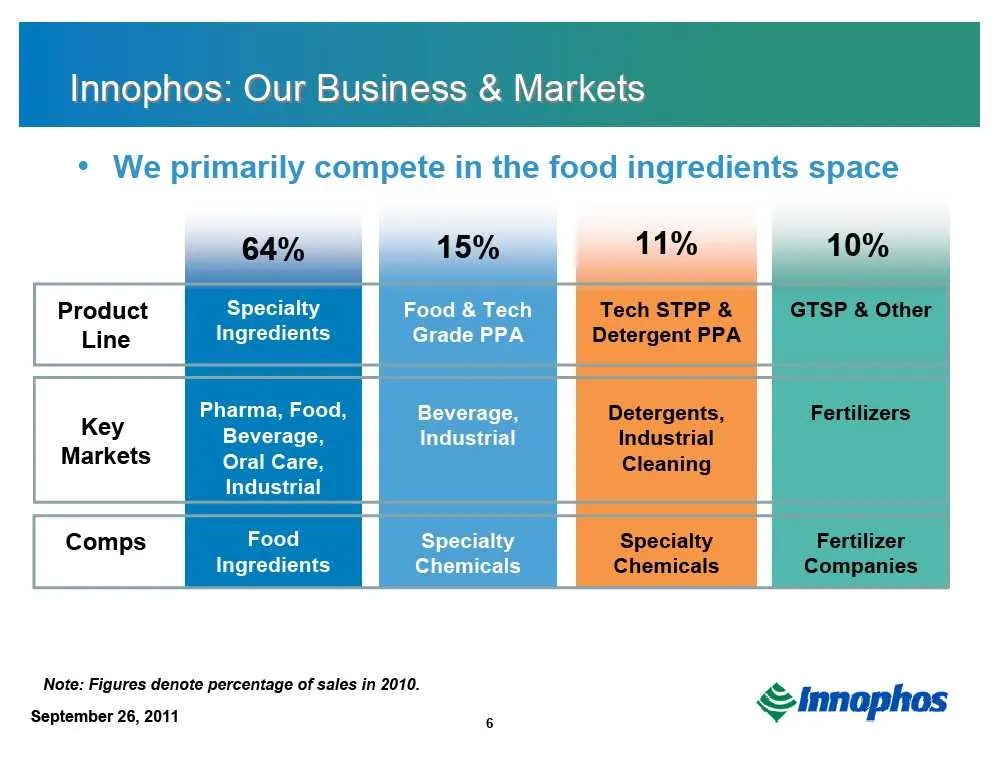
Innophos: Our Business & Markets 64% 15% y 10% Product pe Line Greate Key : = od Markets Ora Comps ood Note: Figures denote percentage of sales in 2010. September 26, 2011 a ©Innophos
Slide 7: Specialty Ingredients Provide Key Functionality to a Broad Range of Everyday Products
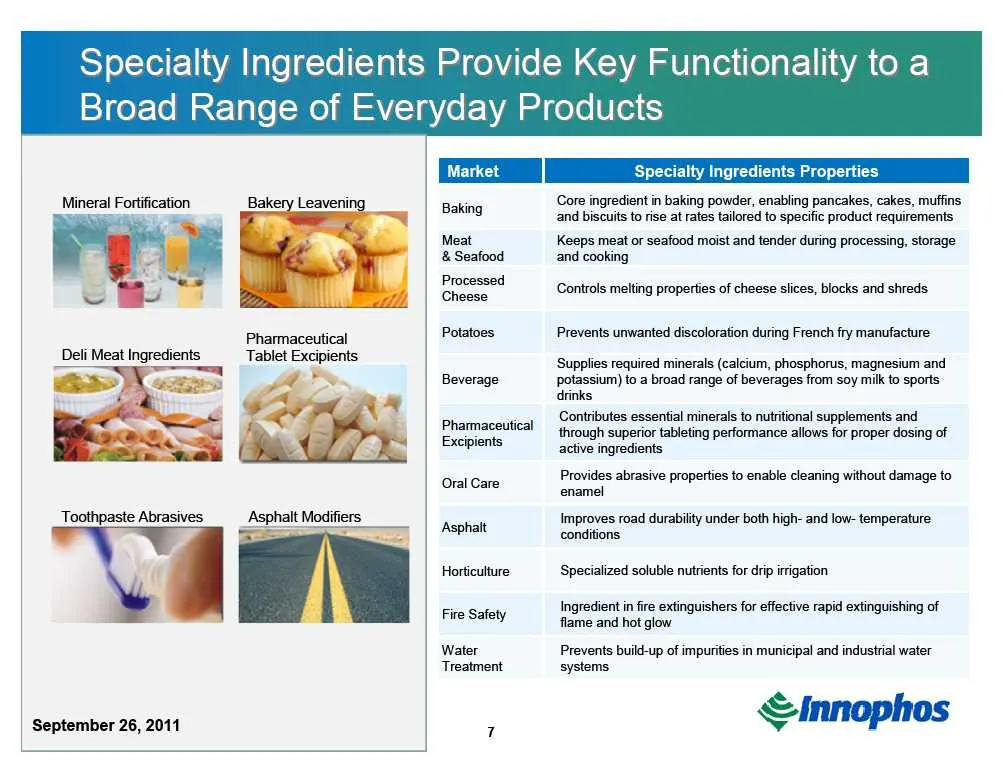
Specialty Ingredients Provide Key Functionality to a Broad Range of Everyday Products Specialty Ingredients Properties Mineral Fortification = Core ingredient in baking powder, enabling pancakes, cakes, muffins : i mg and biscuits to rise at rates tailored to specific product requirements Meat Keeps
Slide 8: Global Specialty Phosphates market and Innophos Growth Profile
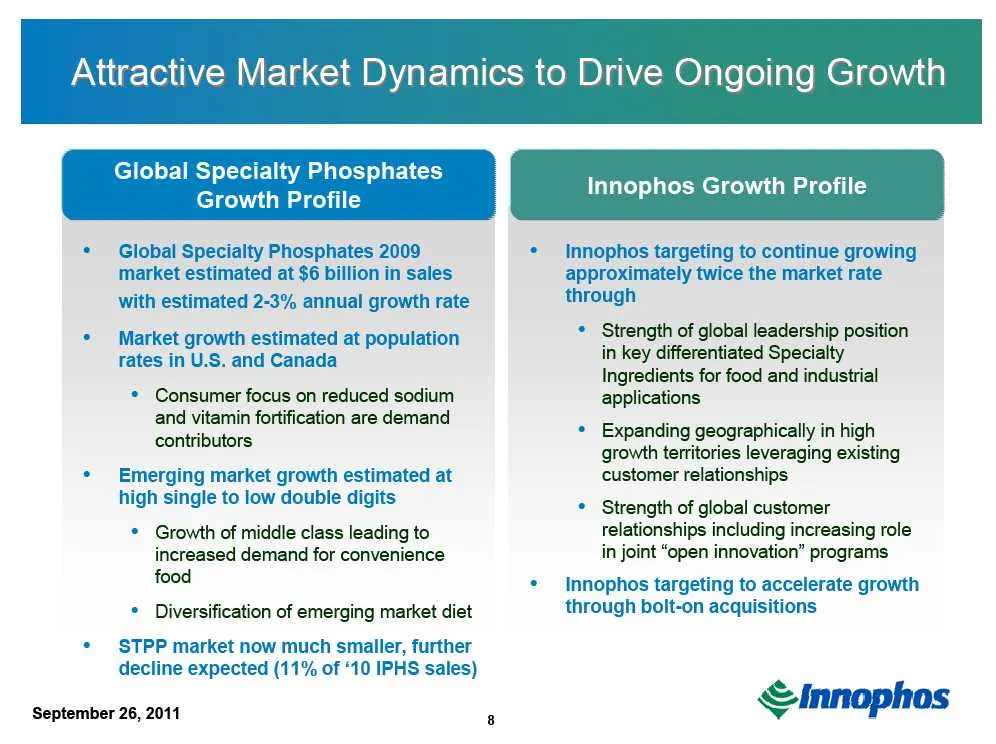
Global Specialty Phosphates 2009 market estimated at $6 billion in sales with estimated 2-3% annual growth rate Market growth estimated at population rates in U.S. and Canada * Consumer focus on reduced sodium and vitamin fortification are demand contributors Emerging market growth estimated at high
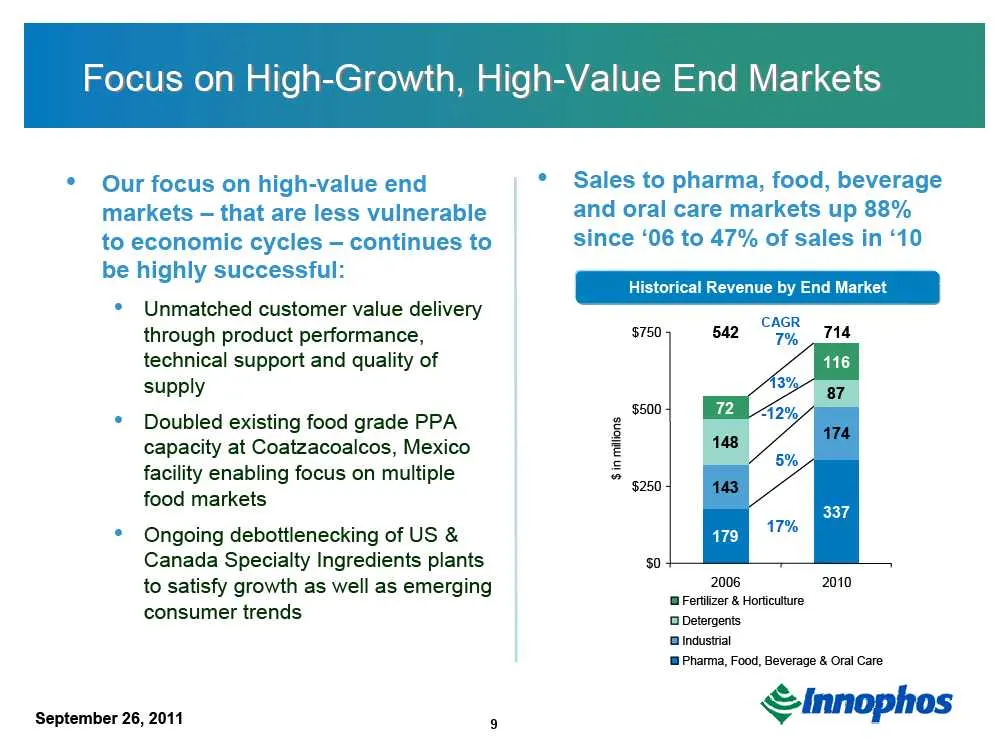
Slide 9: Focus on High-Growth, High-Value End Markets
Focus on High-Growth, High-Value End Markets * Our focus on high-value end * Sales to pharma, food, beverage markets — that are less vulnerable and oral care markets up 88% to economic cycles — continues to since ‘06 to 47% of sales in ‘10 be highly successful: * Unmatched customer value delivery ca
Slide 10: Strength of Customer Relationships
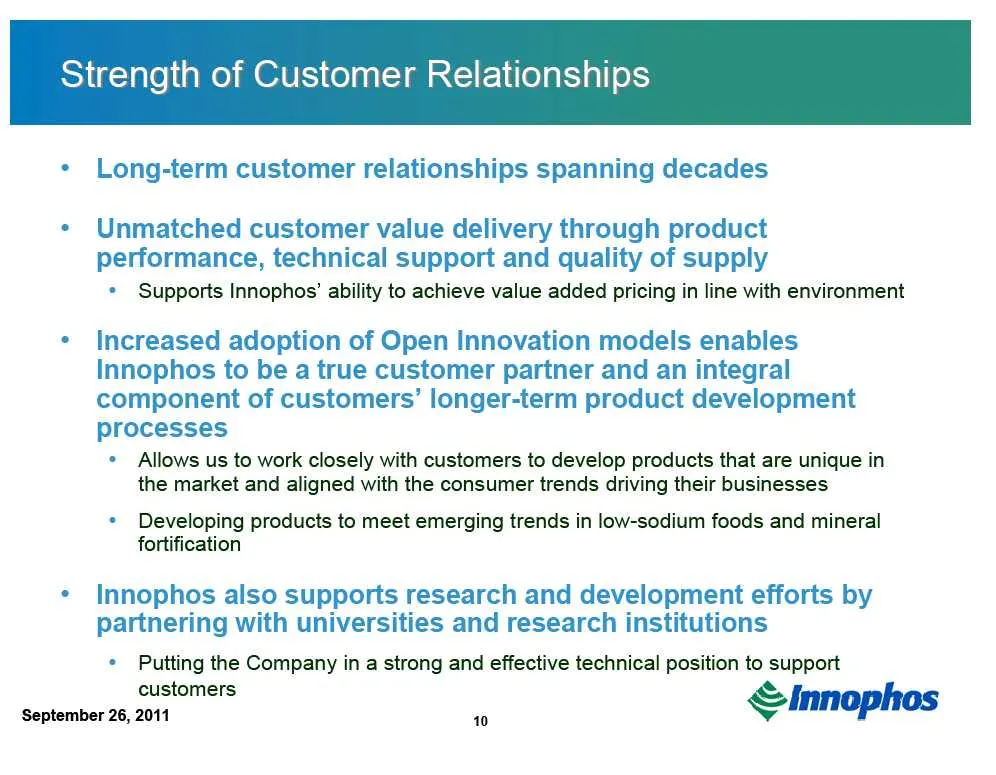
Strength of Customer Relationships * Long-term customer relationships spanning decades ¢ Unmatched customer value delivery through product performance, technical support and quality of supply * Supports Innophos'’ ability to achieve value added pricing in line with environment * Increased adoption o
Slide 11: The Emerging Market Opportunity
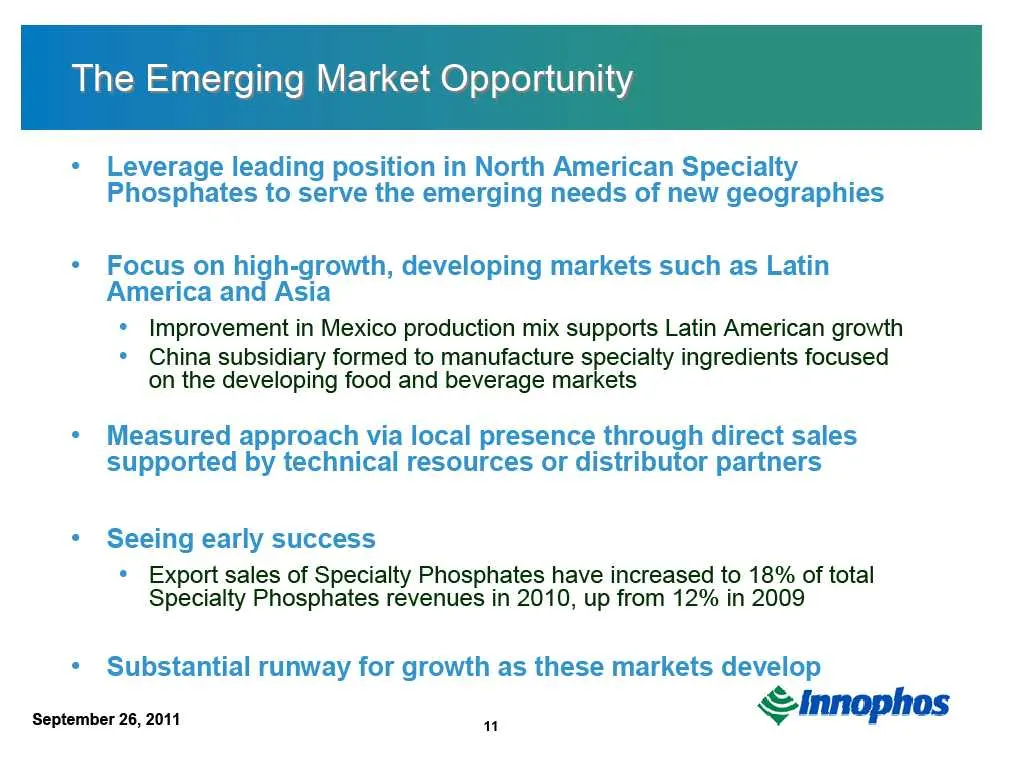
The Emerging Market Opportunity Leverage leading position in North American Specialty Phosphates to serve the emerging needs of new geographies Focus on high-growth, developing markets such as Latin America and Asia * Improvement in Mexico production mix supports Latin American growth * China subsid
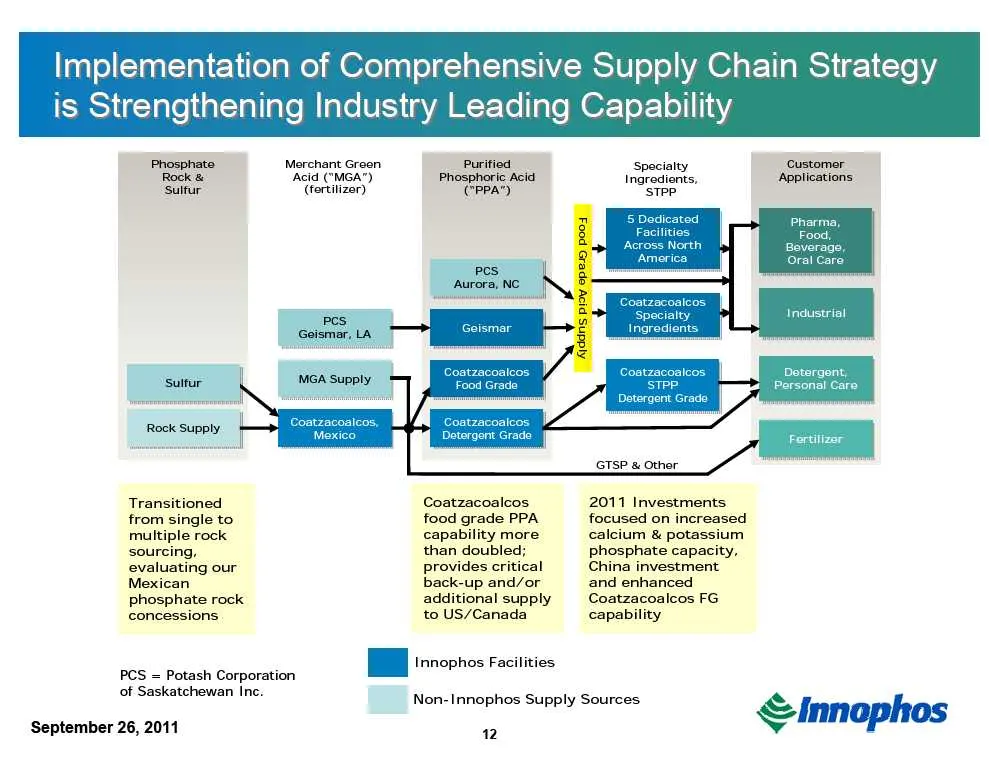
Slide 12: Implementation of Comprehensive Supply Chain Strategy
Implementation of Comprehensive Supply Chain Strategy is Strengthening Industry Leading Capability Merchant Green Acid MGA") (fertilizer) Pharma, Industrial Detergent, Personal Care Fertilizer Coatzacoalcos food grade PPA sourcing, evaluating our additional supply to US/Canada Hi Innophos Facilities
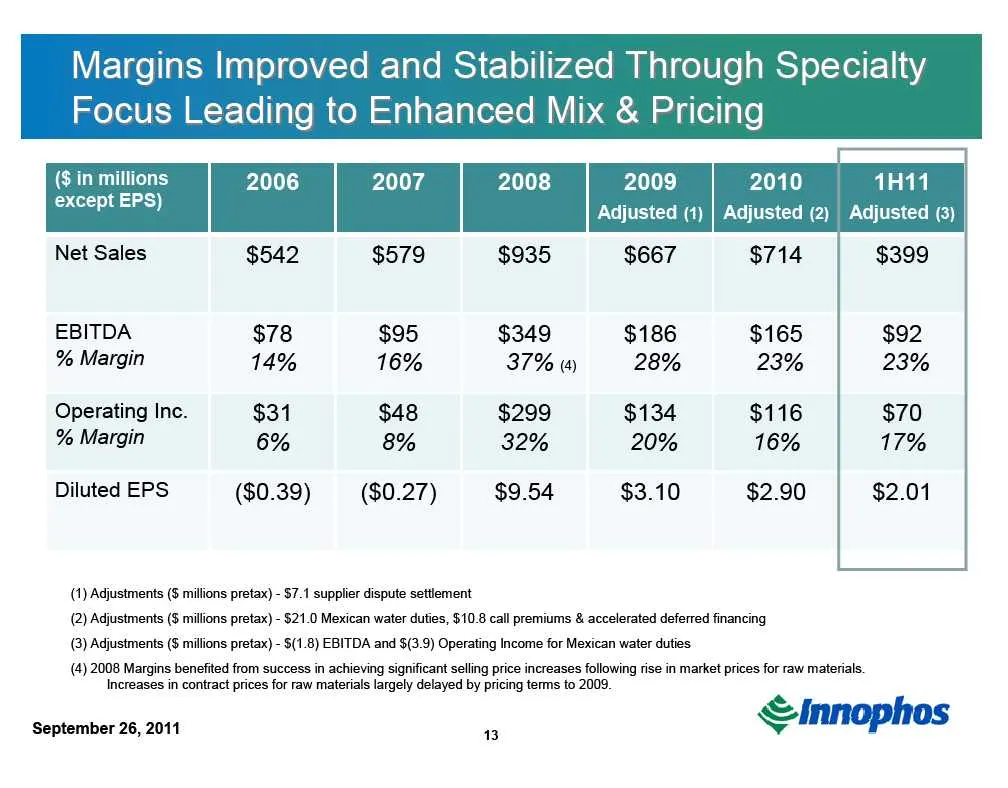
Slide 13: Margins Improved and Stabilized Through Specialty Focus Leading to Enhanced Mix & Pricing
Margins Improved and Stabilized Through Specialty Focus Leading to Enhanced Mix & Pricing ($ in millions 2007 2008 2009 2010 1H11 SxnepLees) Adjusted (1) | Adjusted (2) | Adjusted (3 Net Sales $542 $579 $935 $667 $714 EBITDA $78 $95 $349 $186 $165 % Margin 14% 16% 37% (4) 28% 23% Operating Inc. $31
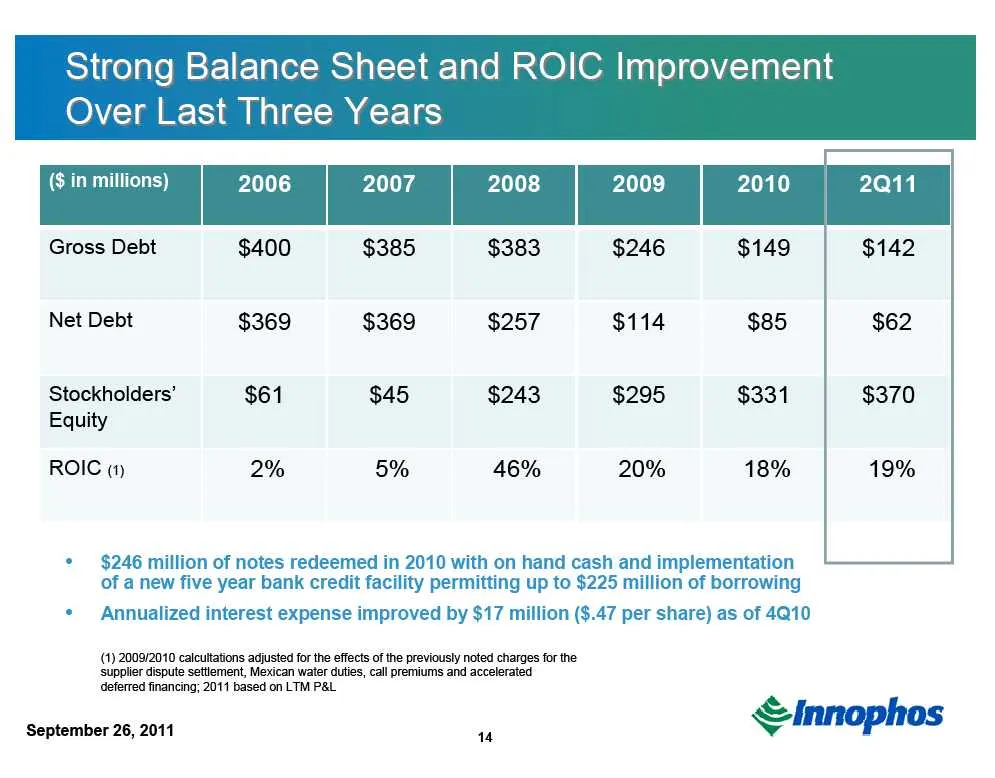
Slide 14: Strong Balance Sheet and ROIC Improvement Over Last Three Years
Strong Balance Sheet and ROIC Improvement Over Last Three Years Gross Debt $400 $385 $383 $246 $149 Net Debt $369 $369 $257 $114 $85 Stockholders’ $61 $45 $243 $295 $331 Equity ROIC (1) 2% 5% 46% 20% 18% * $246 million of notes redeemed in 2010 with on hand cash and implementation of a new five year
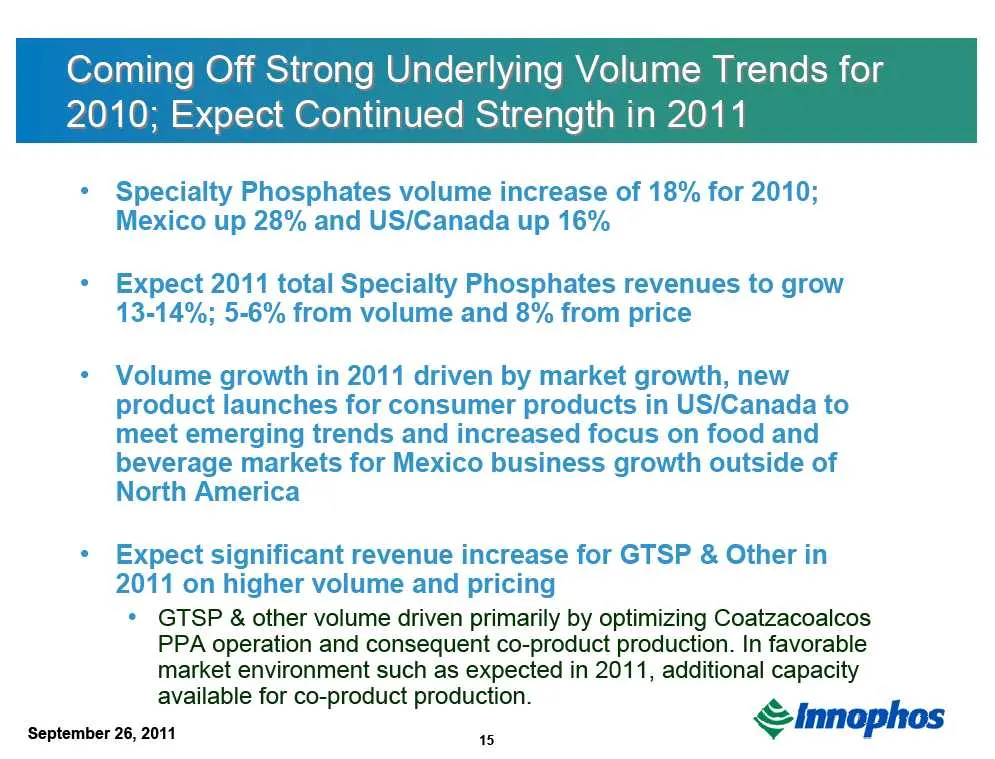
Slide 15: Coming Off Strong Underlying Volume Trends for 2010; Expect Continued Strength in 2011
Coming Off Strong Underlying Volume Trends for 2010; Expect Continued Strength in 2011 * Specialty Phosphates volume increase of 18% for 2010; Mexico up 28% and US/Canada up 16% ¢ Expect 2011 total Specialty Phosphates revenues to grow 13-14%; 5-6% from volume and 8% from price ¢ Volume growth in 20
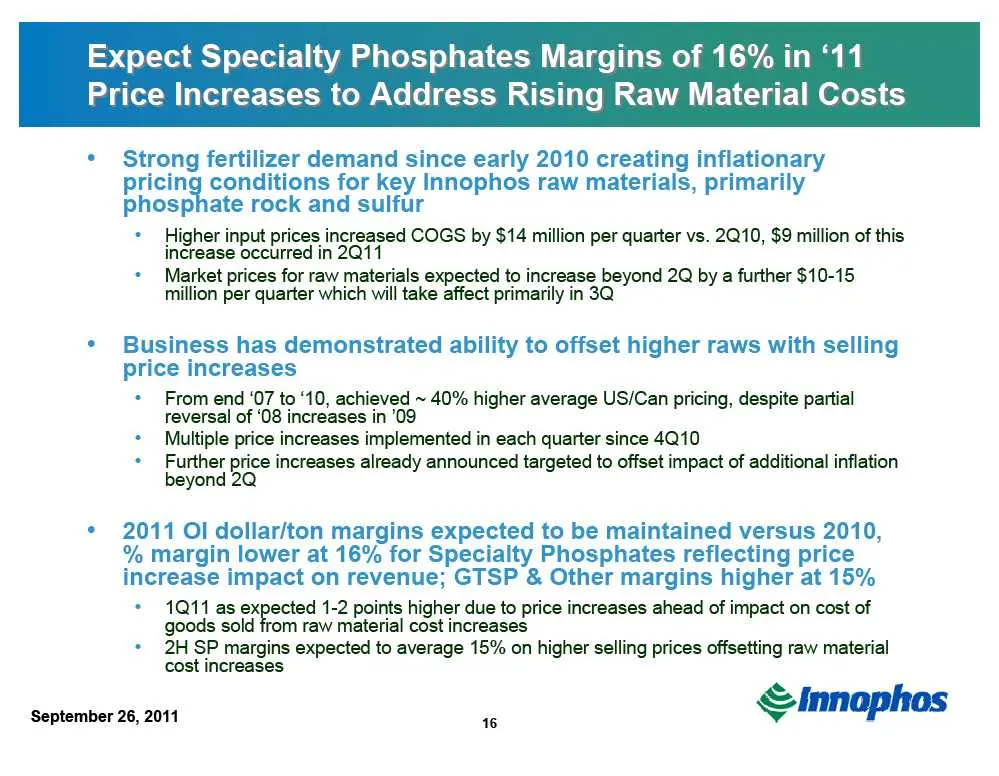
Slide 16: Expect Specialty Phosphates Margins of 16% in '11
Expect Specialty Phosphates Margins of 16% in ‘11 Price Increases to Address Rising Raw Material Costs ¢ Strong fertilizer demand since early 2010 creating inflationary pricing aongious for key Innophos raw materials, primarily phosphate rock and sulfur * Higher input prices increased COGS by $14 mi
Slide 17: Priority for Capital is Growth; Both Internally and Through Appropriate Acquisitions
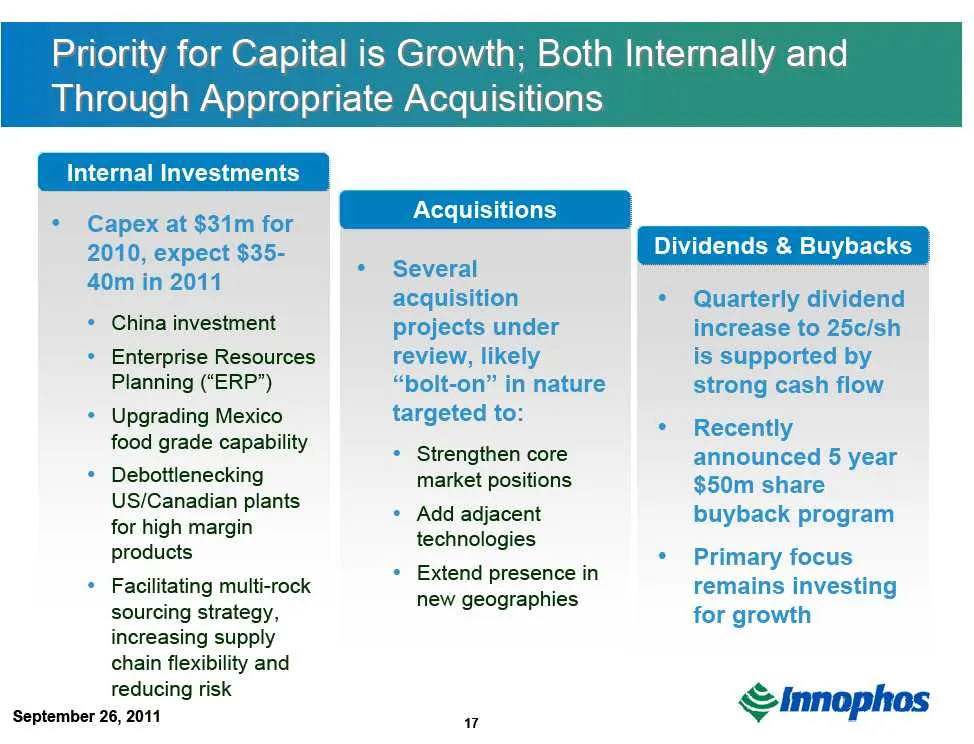
Priority for Capital is Growth; Both Internally and Through Appropriate Acquisitions * Capex at $31m for 2010, expect $35- 40m in 2011 * Several Dividends & Buybacks China investment Enterprise Resources Planning (“ERP”) Upgrading Mexico food grade capability Debottlenecking US/Canadian plants for h
Slide 18: In Summary...
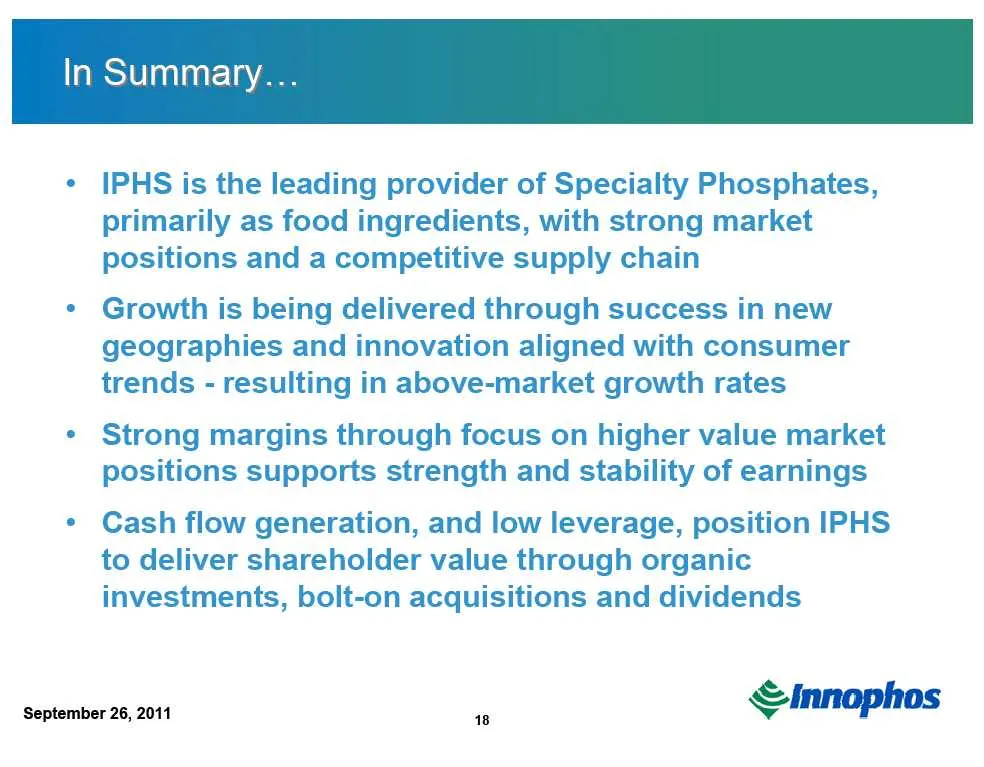
In Summary... ¢ IPHS is the leading provider of Specialty Phosphates, primarily as food ingredients, with strong market positions and a competitive supply chain ¢ Growth is being delivered through success in new geographies and innovation aligned with consumer trends - resulting in above-market grow
Slide 19: Appendix
Appendix september 26,2011 . ©iInnophos
Slide 20: US/Can Volumes Still Strong; Mexico 2Q11 Affected by Production Issues
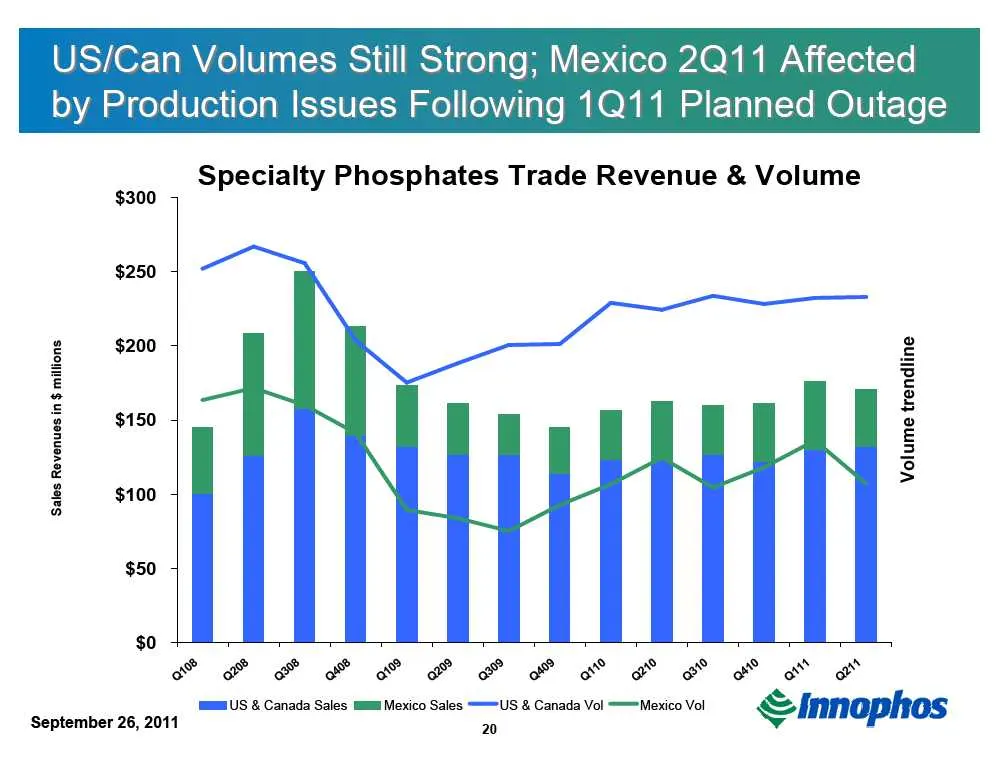
US/Can Volumes Still Stro exico 2Q11 Affected by Production Issues Following 1Q11 Planned Outage is Specialty Phosphates Trade Revenue & Volume $250 4 $200 5 $150 + Volume trendline Sales Revenues in $ millions $100 $50 4 $0 ZF SF FX KF SF KF SK XK oh BF gh of oh lms US & Canada Sales limi Mexico Sa
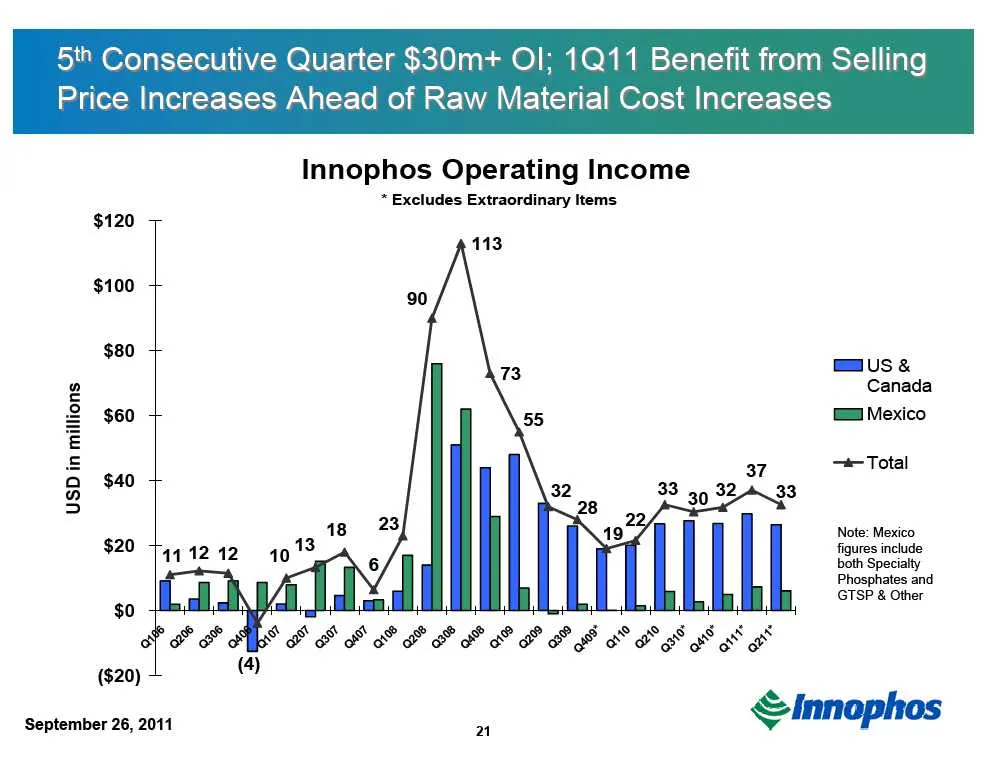
Slide 21: 5th Consecutive Quarter $30m+ OI; 1Q11 Benefit from Selling Price Increases
5th Consecutive Quarter $30m+ Ol; 1Q11 Benefit from Selling Price Increases Ahead of Raw Material Cost Increases Innophos Operating Income * Excludes Extraordinary Items $120 7 $100 + $80 7 meusé 2 Canada 2 $60 + Mexico € £ Total Q $40 + 9 $ =) su 43° 23, Note: Mexico vi fi clude 111212 10 both Spec
Slide 22: Annual Industrials Conference
a = 6 Annual Industrials Conference PPENDIEIMER September 26, 2011
Source: SEC EDGAR · 8-K filed Sep 26, 2011
More decks from Innophos Holdings Inc
 Merger or Acquisition (August 2017)22 slides · Aug 1, 2017
 Investor Day (April 2017)105 slides · Apr 5, 2017
 Seventeenth Annual Institutional Investor Forum (March 2013)18 slides · Mar 18, 2013
 CJS Securities 12th Annual New Ideas For The New Year Conference (January 2012)18 slides · Jan 11, 2012
 Investor Day (November 2011)96 slides · Nov 8, 2011
 March Industrial Investor Conferences 201019 slides · Mar 23, 2010