Innophos — Investor Day (April 2017)
105 slides from Innophos's investor day presentation, Apr 5, 2017
Slide 1: 2017 Investor Day: Revitalized for Growth
2017 INVESTOR DAY New York City | April 5, 2017 REVITALIZED FOR GROWTH Exhibit 99.2
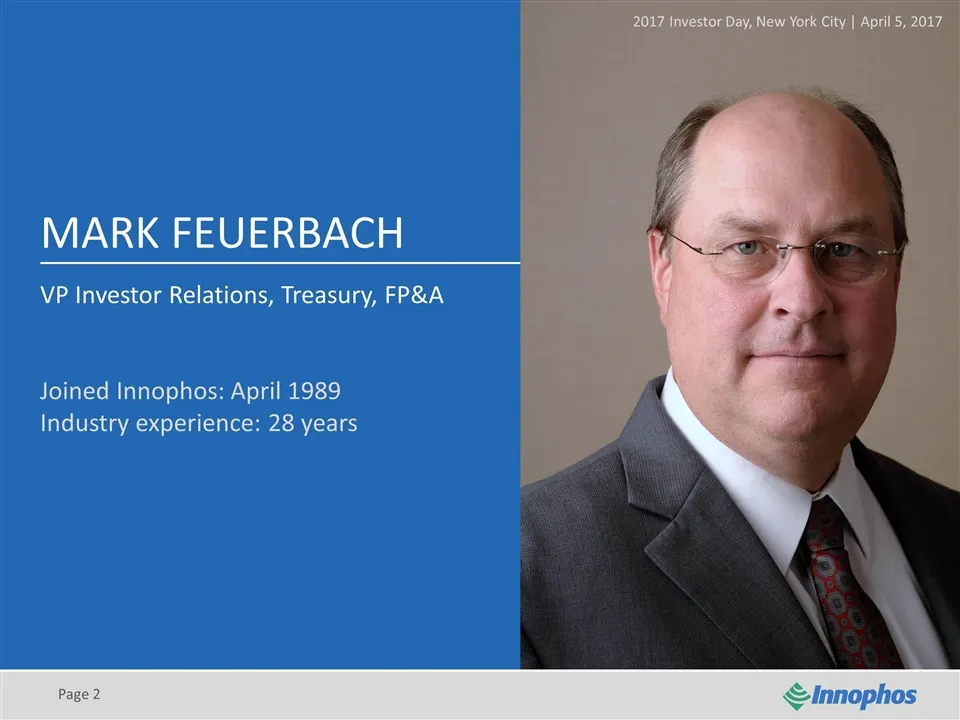
Slide 2: Mark Feuerbach, VP Investor Relations
Page MARK FEUERBACH VP Investor Relations, Treasury, FP&A Joined Innophos: April 1989 Industry experience: 28 years 2017 Investor Day, New York City | April 5, 2017
Slide 3: Safe Harbor
Safe Harbor During the course of this presentation, management may make forward-looking statements regarding financial performance and future events. We will attempt to identify these statements by use of words such as expect, believe, anticipate, intend, and other words that denote future events. Y
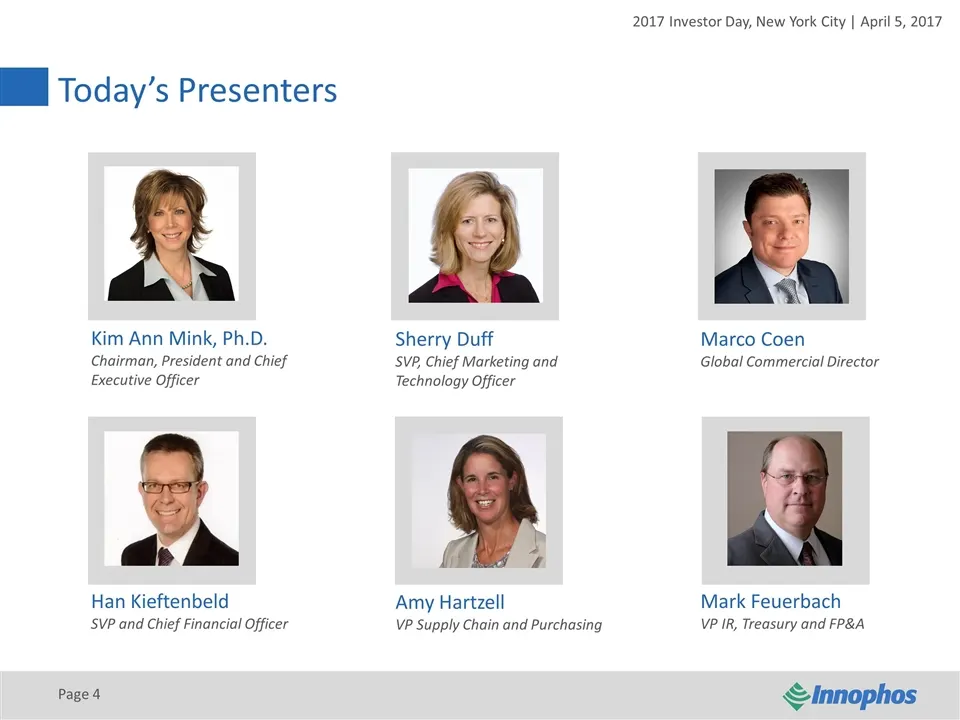
Slide 4: Today's Presenters
Today’s Presenters Page Kim Ann Mink, Ph.D. Chairman, President and Chief Executive Officer Han Kieftenbeld SVP and Chief Financial Officer Sherry Duff SVP, Chief Marketing and Technology Officer Amy Hartzell VP Supply Chain and Purchasing Marco Coen Global Commercial Director Mark Feuerbach VP IR,
Slide 5: Agenda
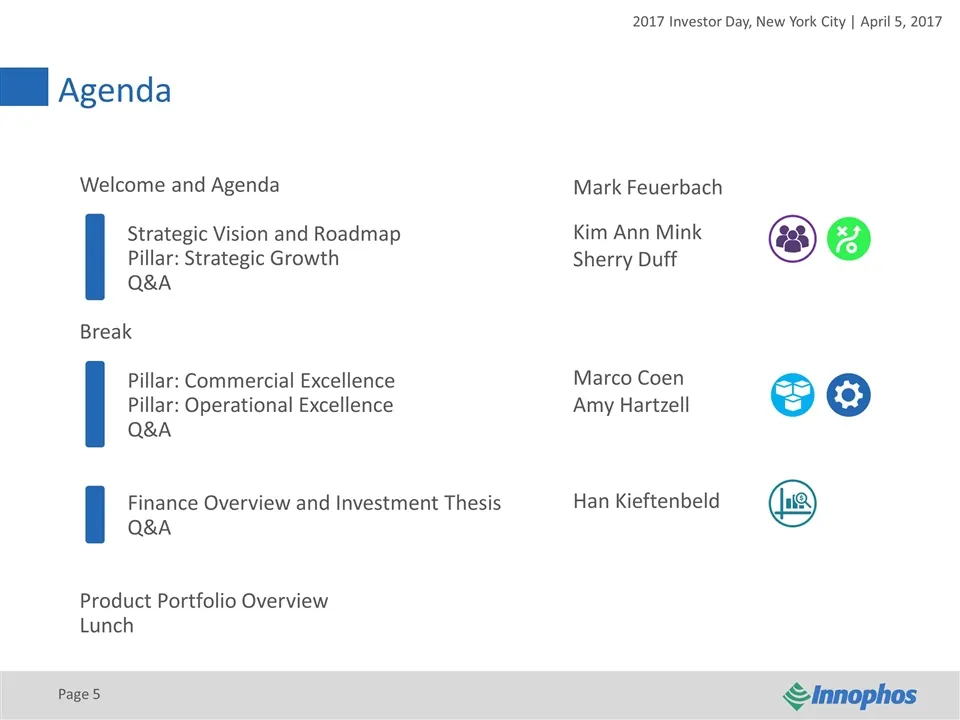
Agenda Page Welcome and Agenda Strategic Vision and Roadmap Pillar: Strategic Growth Q&A Break Pillar: Commercial Excellence Pillar: Operational Excellence Q&A Finance Overview and Investment Thesis Q&A Product Portfolio Overview Lunch Mark Feuerbach Kim Ann Mink Sherry Duff Marco Coen Amy Hartzell
Slide 6: Kim Ann Mink, Chairman, President and CEO
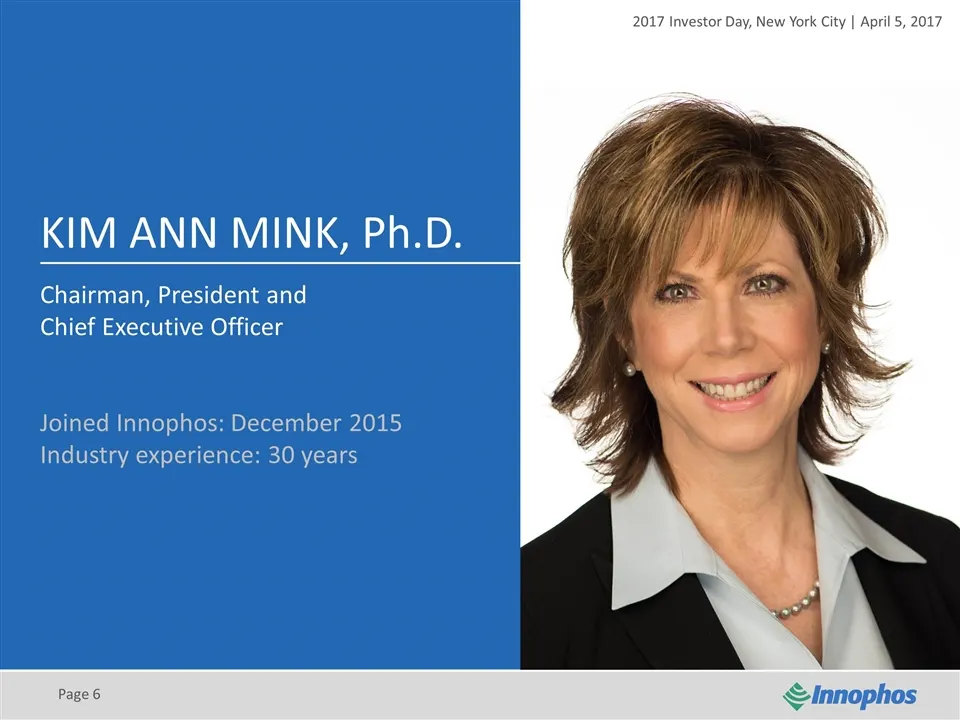
Page KIM ANN MINK, Ph.D. Chairman, President and Chief Executive Officer Joined Innophos: December 2015 Industry experience: 30 years
Slide 7: Vital Ingredients: Our Purpose
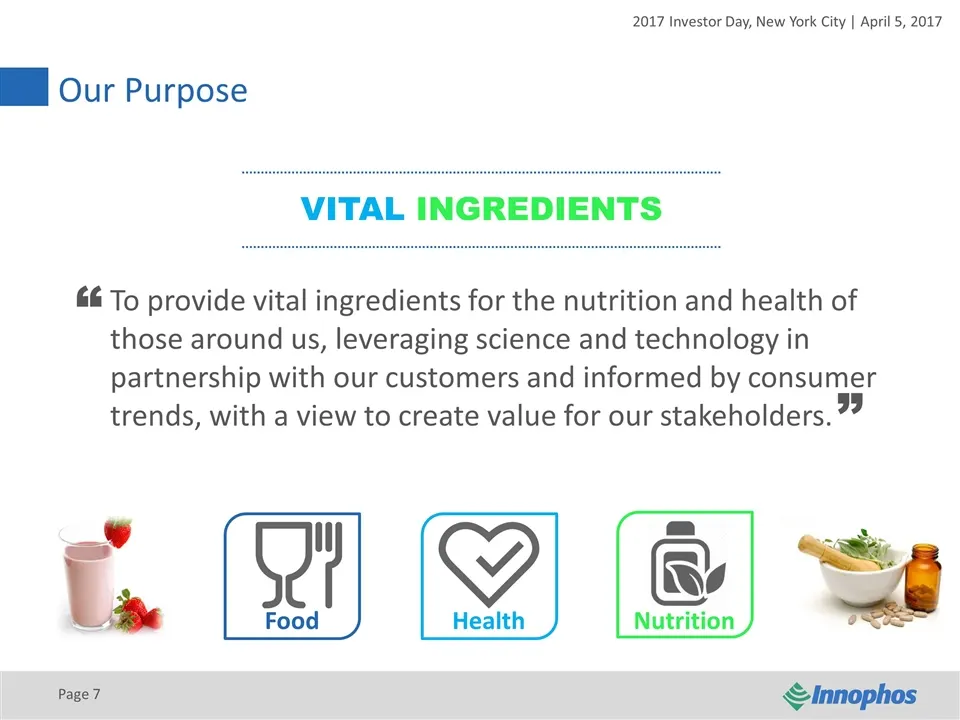
VITAL INGREDIENTS Our Purpose Page To provide vital ingredients for the nutrition and health of those around us, leveraging science and technology in partnership with our customers and informed by consumer trends, with a view to create value for our stakeholders. “ ” Food Health Nutrition
Slide 8: Key Messages
Key Messages Page At Innophos we have a great sense of purpose and focus on what we do best We embrace a diversified, market-facing approach Specialty ingredients solutions into attractive Food, Health and Nutrition end-markets Aligned with megatrends Earnings growth will be both organic and inorgan
Slide 9: Innophos By The Numbers
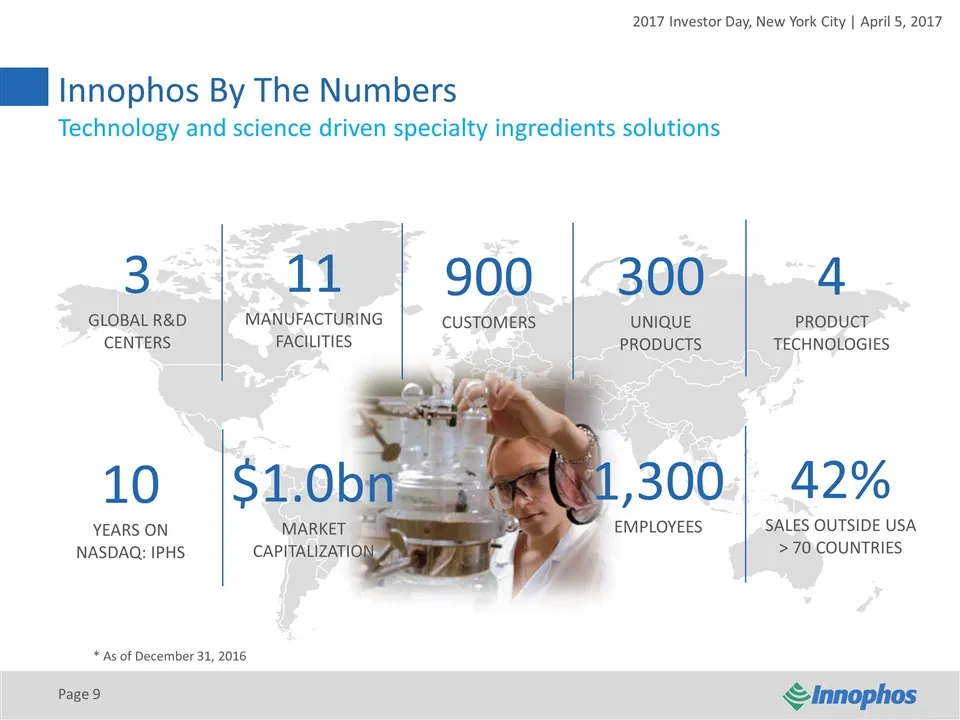
Innophos By The Numbers 3 GLOBAL R&D CENTERS 11 MANUFACTURING FACILITIES Technology and science driven specialty ingredients solutions 900 CUSTOMERS 10 YEARS ON NASDAQ: IPHS 300 UNIQUE PRODUCTS 42% SALES OUTSIDE USA > 70 COUNTRIES 4 PRODUCT TECHNOLOGIES $1.0bn MARKET CAPITALIZATION 1,300 EMPLOYEES P
Slide 10: Innophos Today
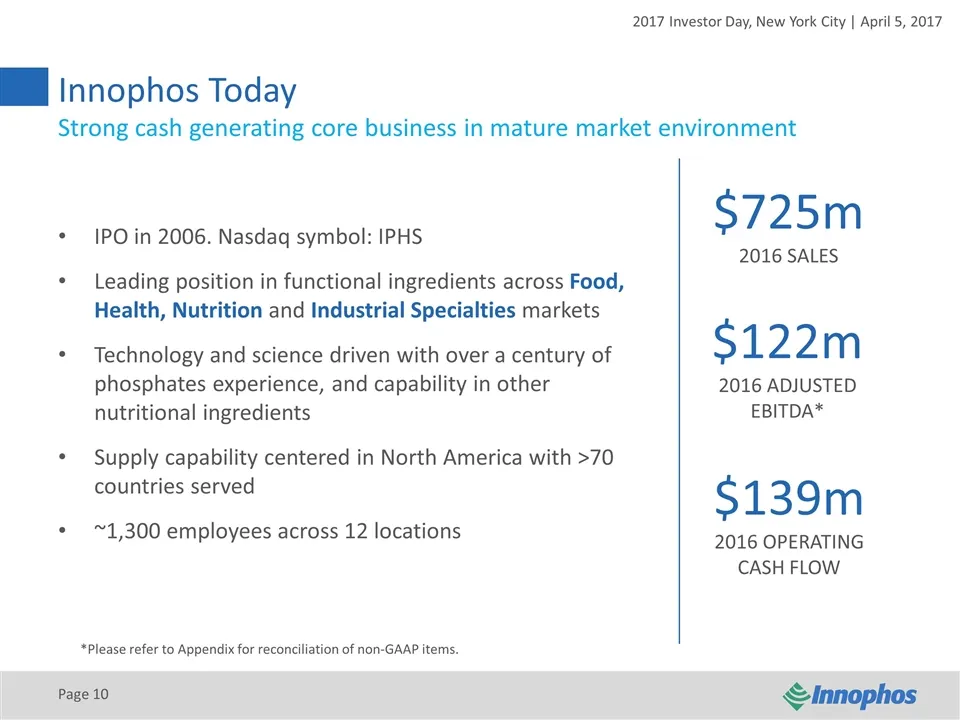
Innophos Today IPO in 2006. Nasdaq symbol: IPHS Leading position in functional ingredients across Food, Health, Nutrition and Industrial Specialties markets Technology and science driven with over a century of phosphates experience, and capability in other nutritional ingredients Supply capability c
Slide 11: Serving Attractive And Resilient End Markets
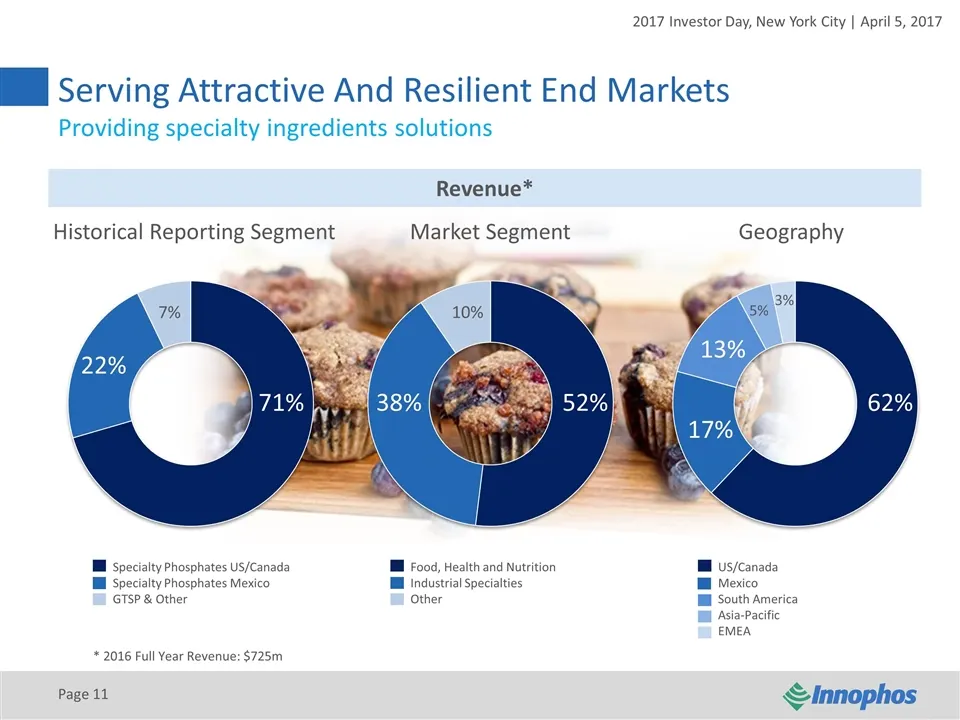
Serving Attractive And Resilient End Markets Page Historical Reporting Segment * 2016 Full Year Revenue: $725m 71% 22% Specialty Phosphates US/Canada Specialty Phosphates Mexico GTSP & Other 7% Food, Health and Nutrition Industrial Specialties Other US/Canada Mexico South America Asia-Pacific EMEA 5
Slide 12: Technology Underpinned Market-Driven Portfolio
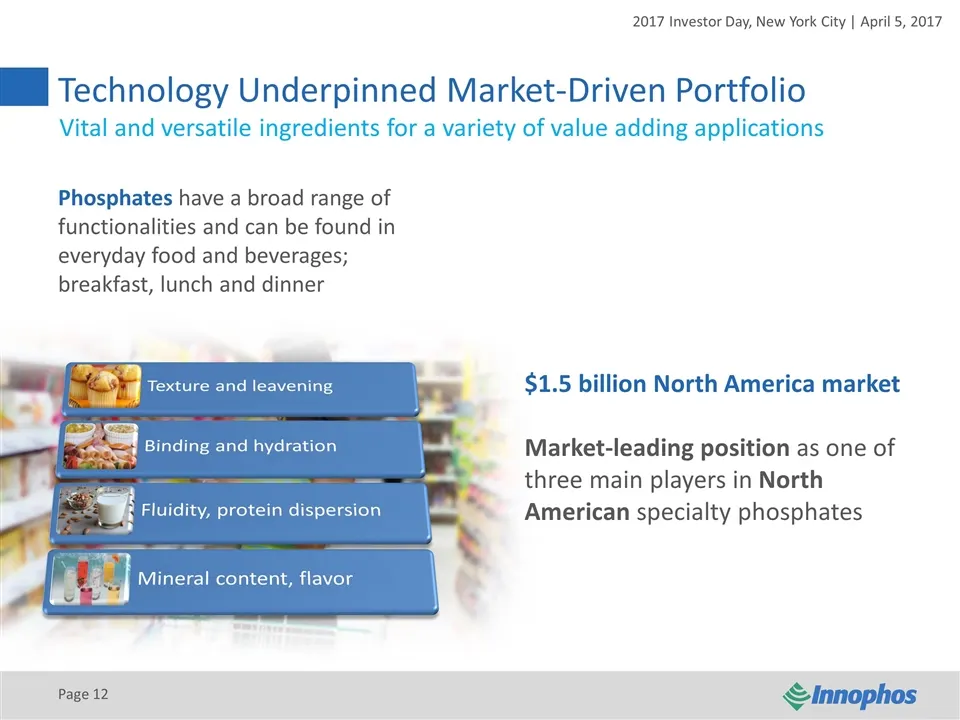
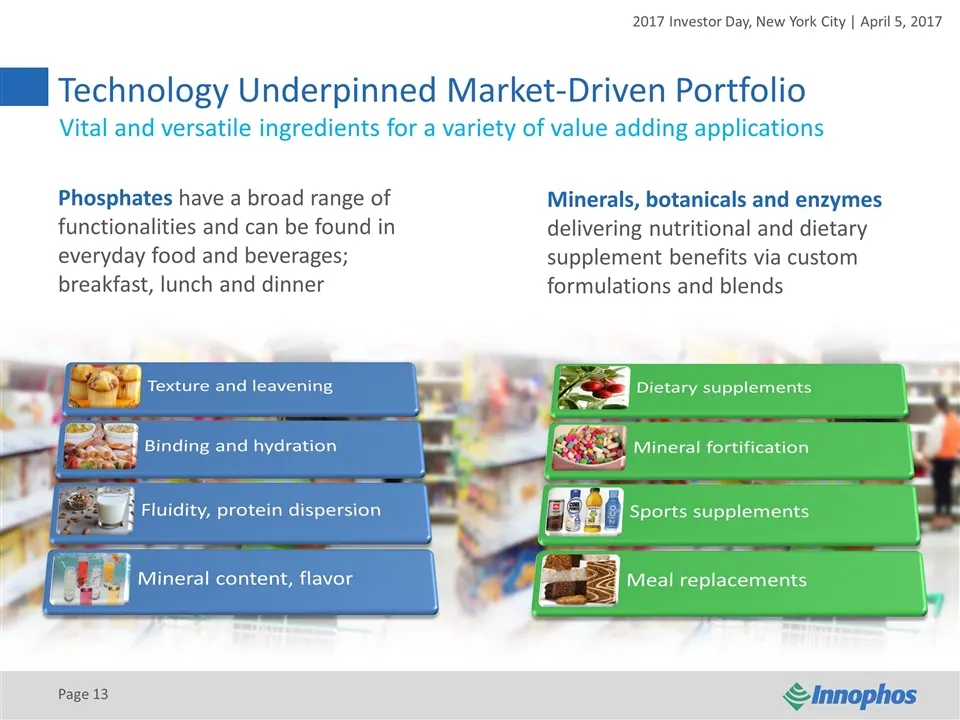
Technology Underpinned Market-Driven Portfolio Phosphates have a broad range of functionalities and can be found in everyday food and beverages; breakfast, lunch and dinner Page Vital and versatile ingredients for a variety of value adding applications $1.5 billion North America market Market-leadin
Slide 13: Technology Underpinned Market-Driven Portfolio
Technology Underpinned Market-Driven Portfolio Phosphates have a broad range of functionalities and can be found in everyday food and beverages; breakfast, lunch and dinner Page Minerals, botanicals and enzymes delivering nutritional and dietary supplement benefits via custom formulations and blends
Slide 14: Delivering On Our Transformation
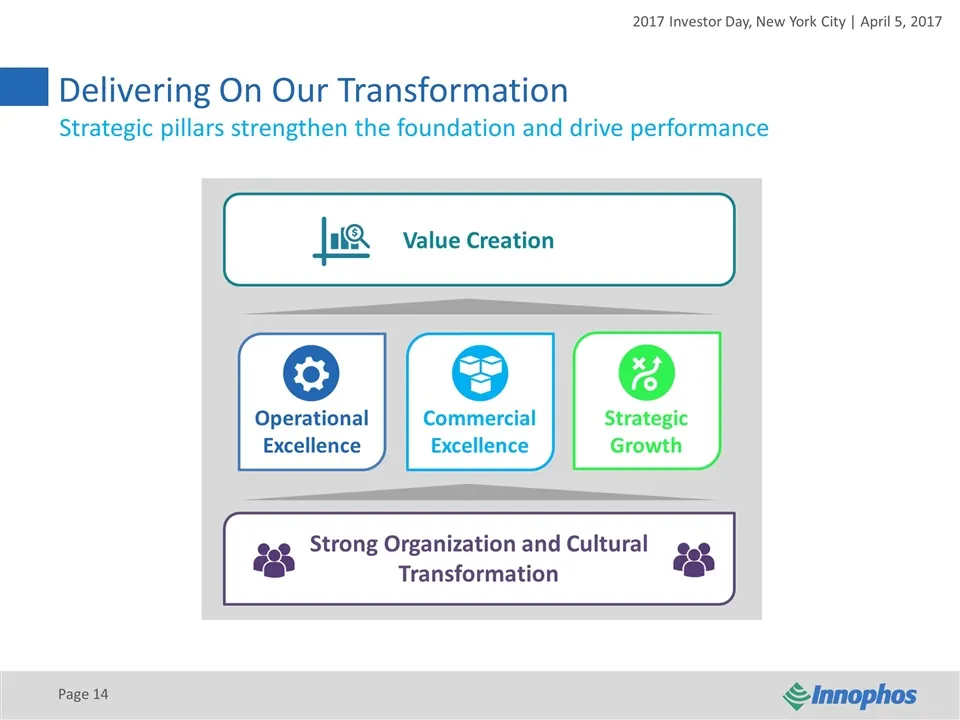
Delivering On Our Transformation Page Strategic pillars strengthen the foundation and drive performance
Slide 15: Scorecard: 2016 Better And Stronger
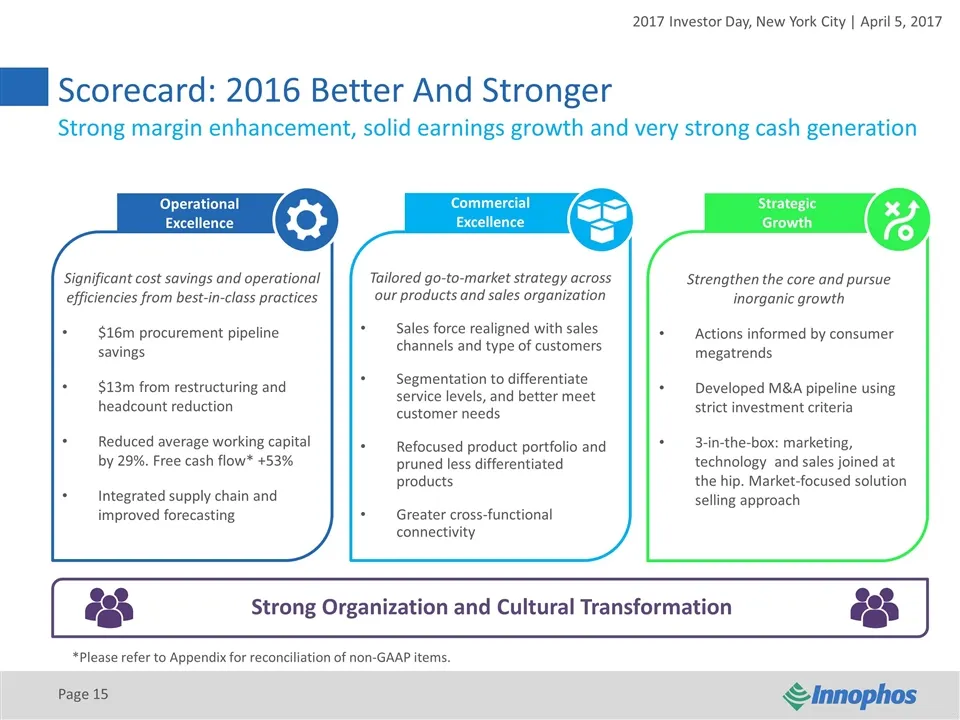
Scorecard: 2016 Better And Stronger Page Operational Excellence Commercial Excellence Strategic Growth Significant cost savings and operational efficiencies from best-in-class practices $16m procurement pipeline savings $13m from restructuring and headcount reduction Reduced average working capital
Slide 16: Strengthening Our Leadership To Drive Change
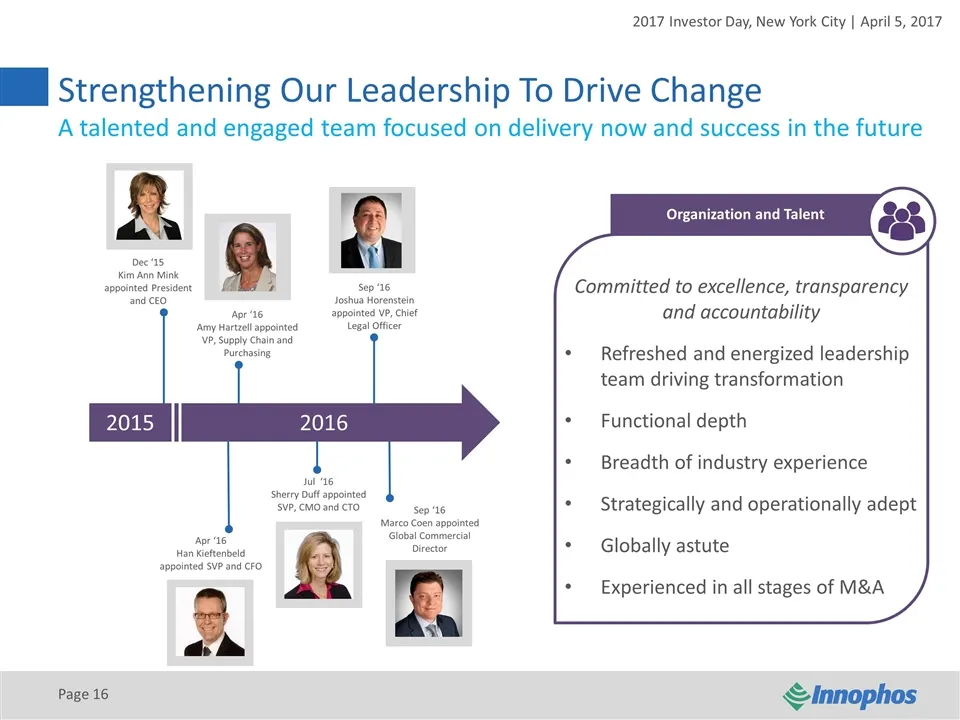
Strengthening Our Leadership To Drive Change Page Organization and Talent A talented and engaged team focused on delivery now and success in the future 2015 2016 Dec ‘15 Kim Ann Mink appointed President and CEO Apr ‘16 Han Kieftenbeld appointed SVP and CFO Apr ‘16 Amy Hartzell appointed VP, Supply C
Slide 17: Organizational And Cultural Transformation
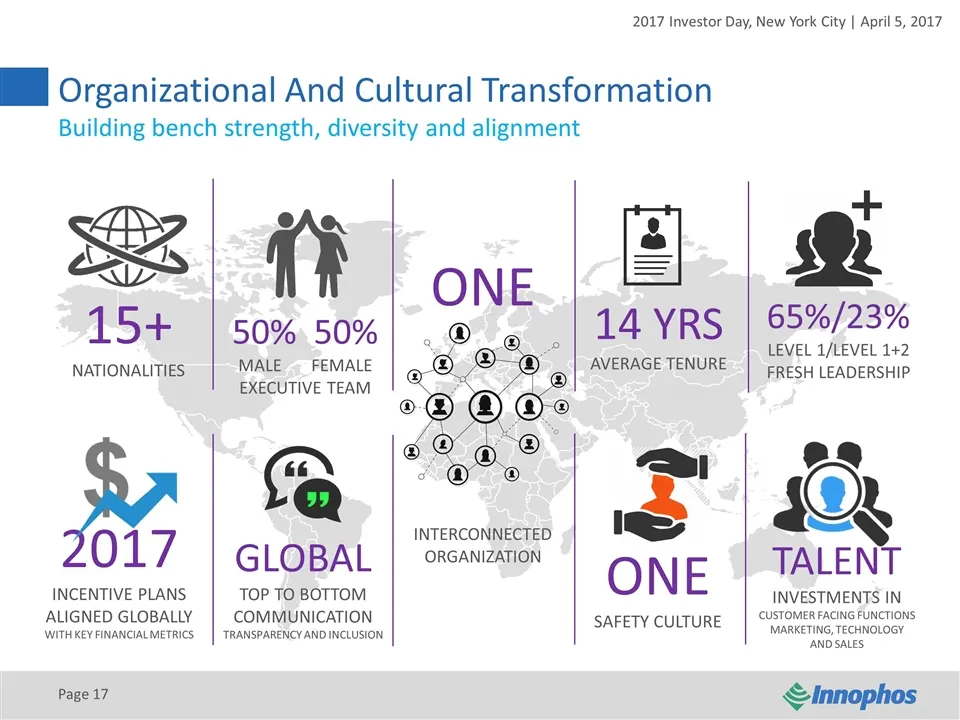
Organizational And Cultural Transformation Page 15+ NATIONALITIES 2017 INCENTIVE PLANS ALIGNED GLOBALLY WITH KEY FINANCIAL METRICS 50% 50% MALE FEMALE EXECUTIVE TEAM ONE SAFETY CULTURE Building bench strength, diversity and alignment TALENT INVESTMENTS IN CUSTOMER FACING FUNCTIONS MARKETING, TECHNOL
Slide 18: Macroeconomic Realities Drive Our Strategy
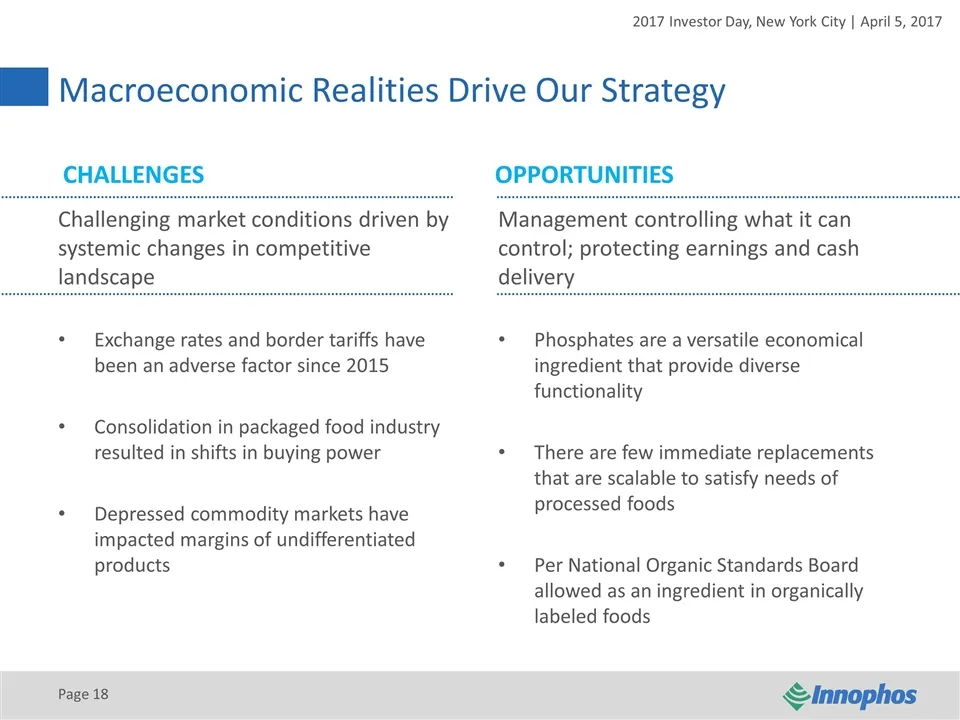
Page Macroeconomic Realities Drive Our Strategy CHALLENGESOPPORTUNITIES Challenging market conditions driven by systemic changes in competitive landscape Exchange rates and border tariffs have been an adverse factor since 2015 Consolidation in packaged food industry resulted in shifts in buying powe
Slide 19: Megatrends Inform Our Direction
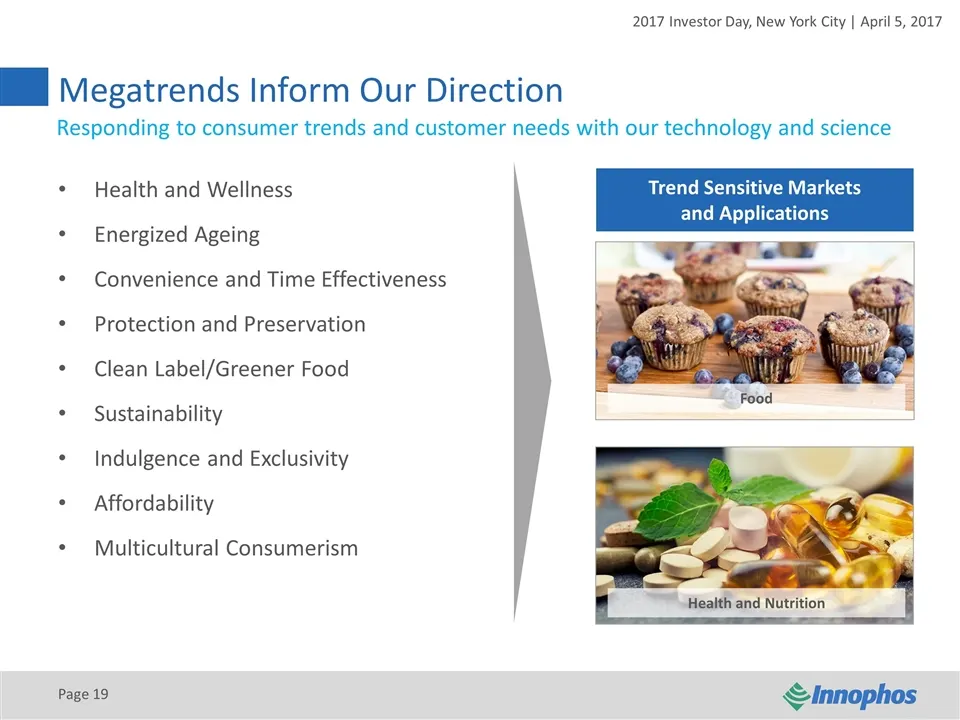
Megatrends Inform Our Direction Health and Wellness Energized Ageing Convenience and Time Effectiveness Protection and Preservation Clean Label/Greener Food Sustainability Indulgence and Exclusivity Affordability Multicultural Consumerism Trend Sensitive Markets and Applications Responding to consum
Slide 20: Focus On What We Do Best
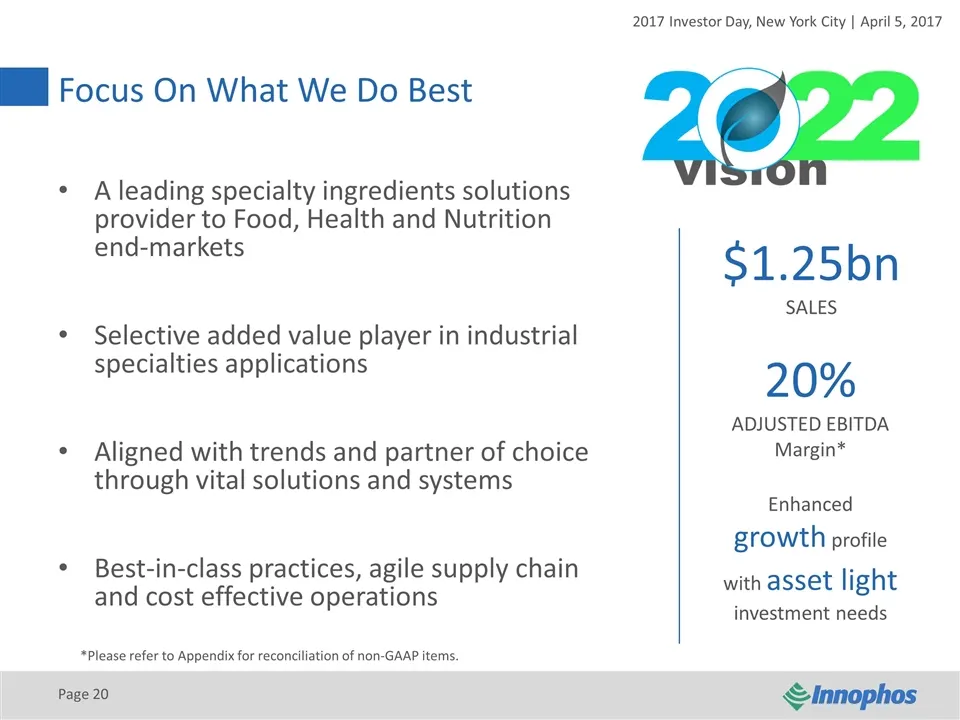
A leading specialty ingredients solutions provider to Food, Health and Nutrition end-markets Selective added value player in industrial specialties applications Aligned with trends and partner of choice through vital solutions and systems Best-in-class practices, agile supply chain and cost effectiv
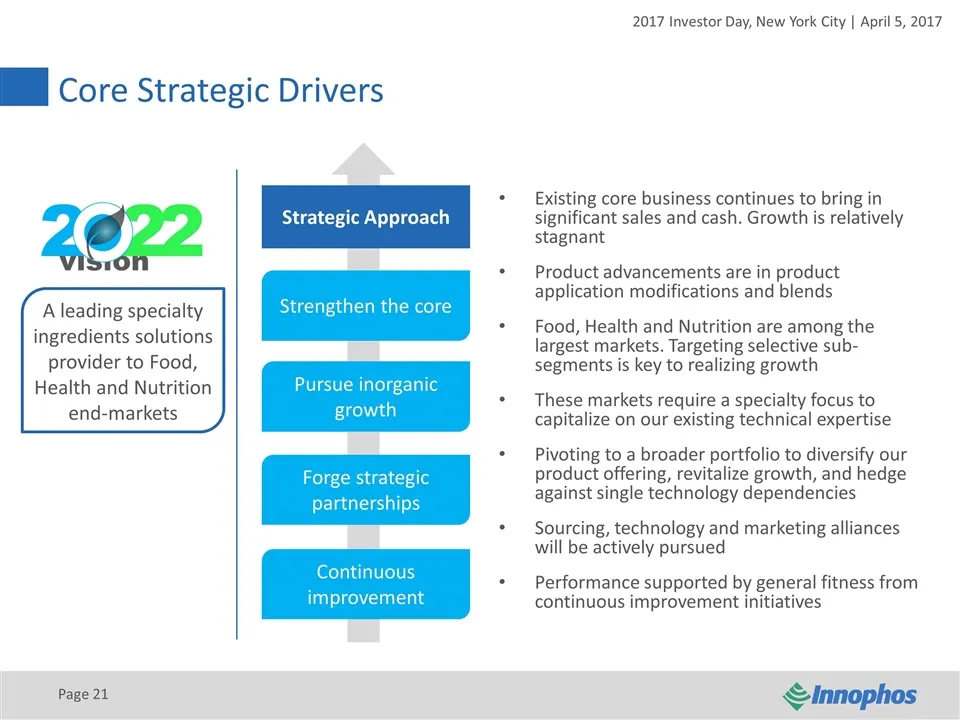
Slide 21: Core Strategic Drivers and Approach
A leading specialty ingredients solutions provider to Food, Health and Nutrition end-markets Page Core Strategic Drivers Strategic Approach Existing core business continues to bring in significant sales and cash. Growth is relatively stagnant Product advancements are in product application modificat
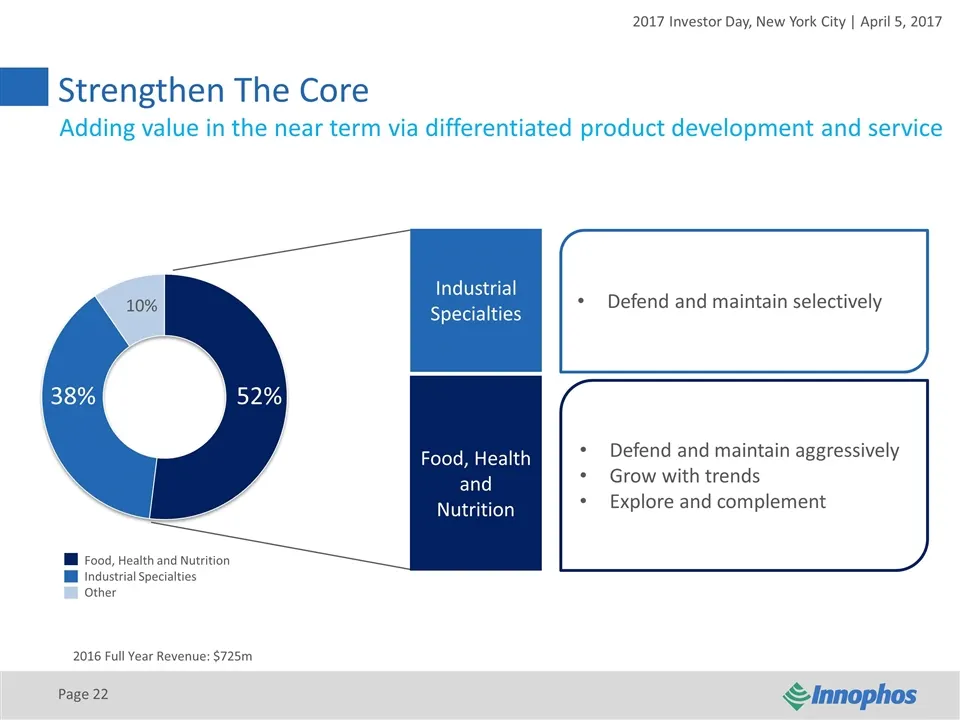
Slide 22: Strengthen The Core
Defend and maintain selectively Strengthen The Core Page Adding value in the near term via differentiated product development and service Food, Health and Nutrition Industrial Specialties Other 52% 38% 10% Food, Health and Nutrition Industrial Specialties 2016 Full Year Revenue: $725m Defend and mai
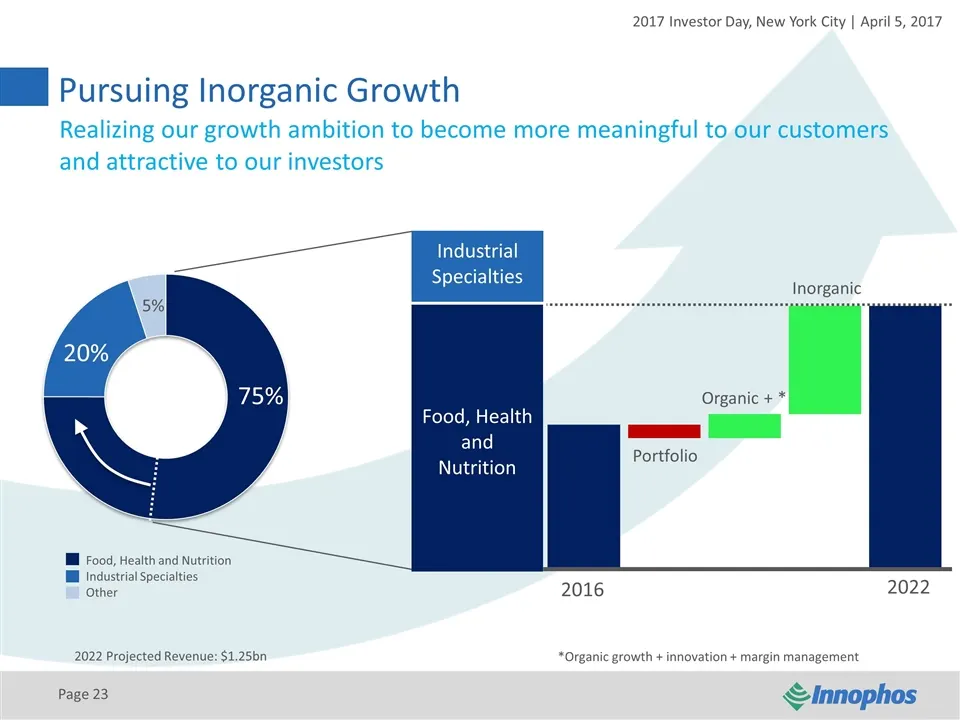
Slide 23: Pursuing Inorganic Growth
Pursuing Inorganic Growth Page Realizing our growth ambition to become more meaningful to our customers and attractive to our investors Food, Health and Nutrition Industrial Specialties Other 75% 20% 5% Food, Health and Nutrition Industrial Specialties 2022 Projected Revenue: $1.25bn Portfolio Inorg
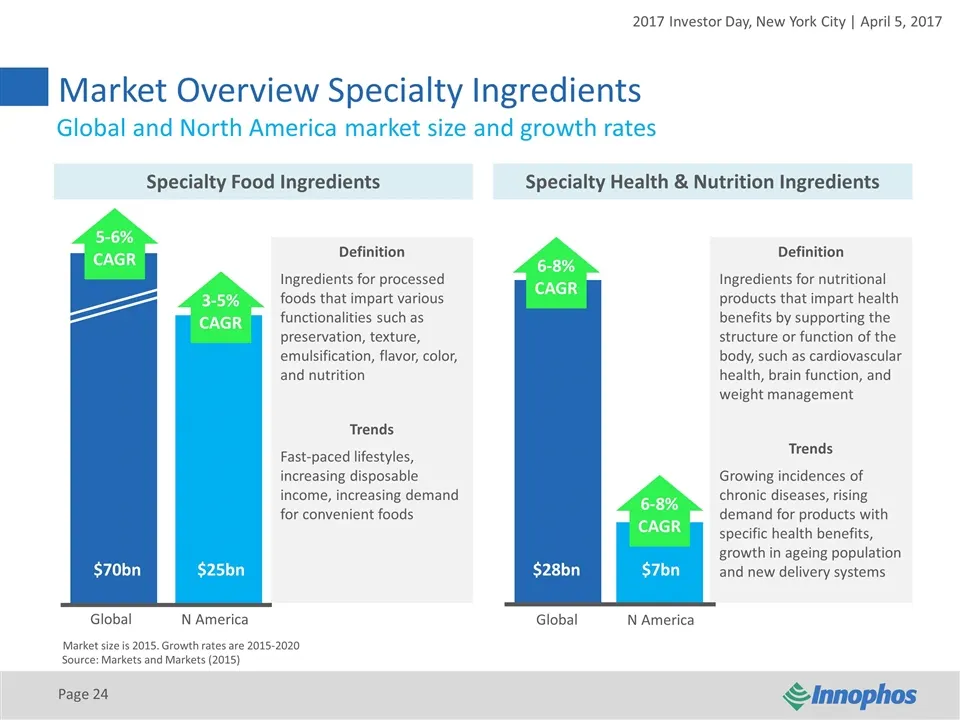
Slide 24: Market Overview Specialty Ingredients
Market Overview Specialty Ingredients Page Specialty Food Ingredients Specialty Health & Nutrition Ingredients Definition Ingredients for processed foods that impart various functionalities such as preservation, texture, emulsification, flavor, color, and nutrition Trends Fast-paced lifestyles, incr
Slide 25: M&A Criteria
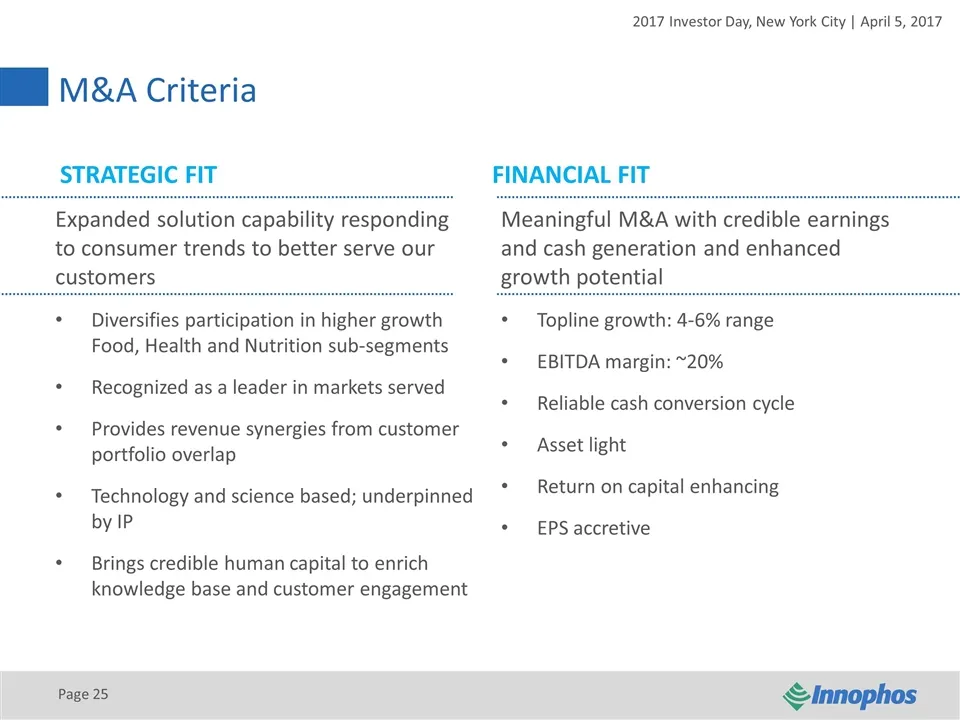
Page M&A Criteria STRATEGIC FITFINANCIAL FIT Expanded solution capability responding to consumer trends to better serve our customers Diversifies participation in higher growth Food, Health and Nutrition sub-segments Recognized as a leader in markets served Provides revenue synergies from customer p
Slide 26: Vital Ingredients Our Purpose
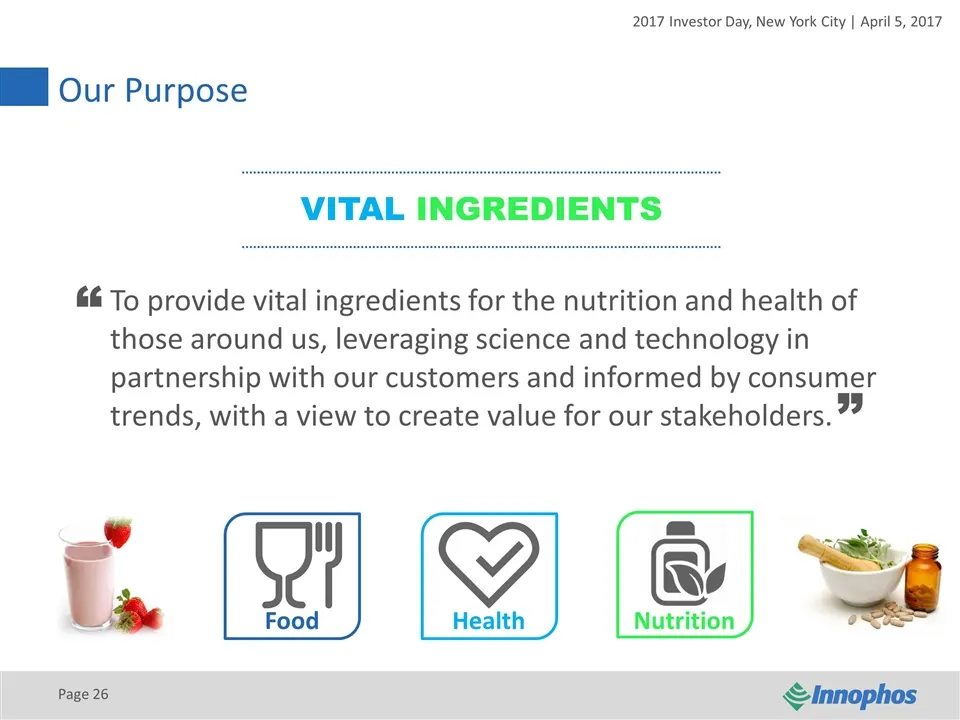
VITAL INGREDIENTS Our Purpose Page To provide vital ingredients for the nutrition and health of those around us, leveraging science and technology in partnership with our customers and informed by consumer trends, with a view to create value for our stakeholders. “ ” Food Health Nutrition

Slide 27: Ready to Realize the Vision
Ready to Realize the Vision REVITALIZED FOR GROWTH Page
Slide 28: Sherry Duff, SVP Chief Marketing and Technology Officer
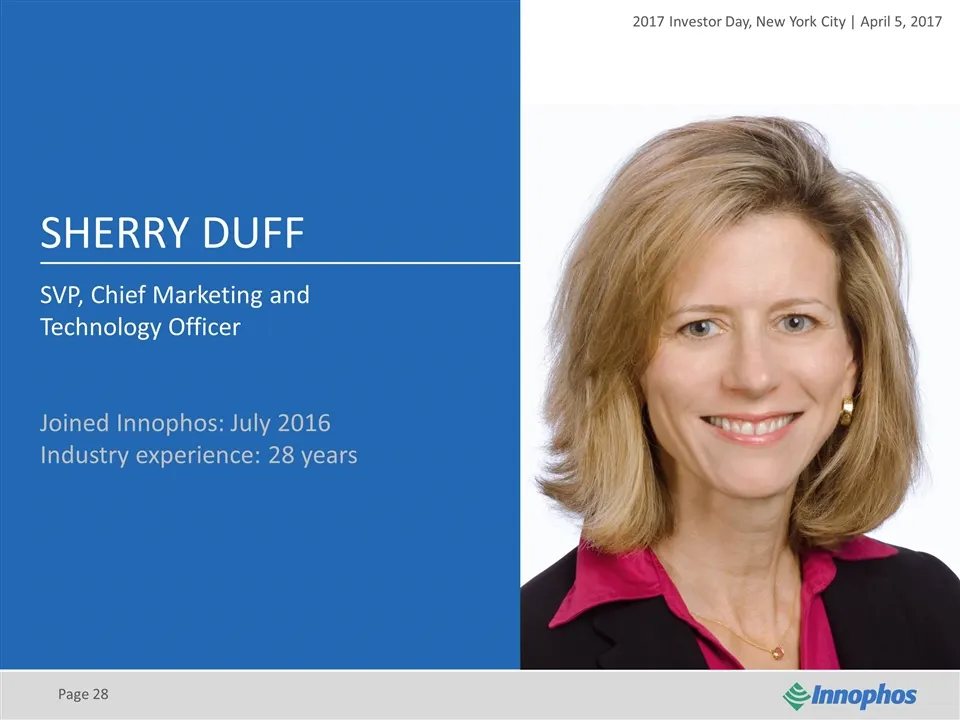
SHERRY DUFF SVP, Chief Marketing and Technology Officer Joined Innophos: July 2016 Industry experience: 28 years Page
Slide 29: Pillar: Strategic Growth
Page 2017 INVESTOR DAY New York City | April 5, 2017 Pillar: Strategic Growth
Slide 30: Key Messages
Key Messages Page #1 or #2 in core product lines serving attractive Food, Health, Nutrition and Industrial end-markets Our principal product technology has broad application, is mature and has limited inherent growth We have commercial relationships with reputable, branded Food, Health and Nutrition
Slide 31: Two Complementary Business Models
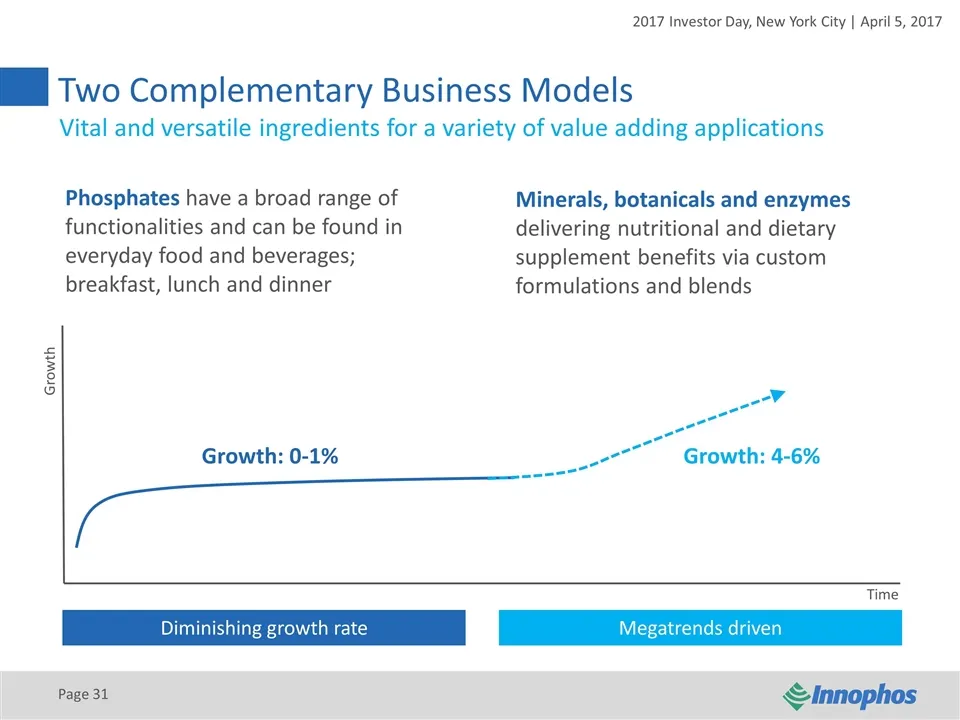
Two Complementary Business Models Phosphates have a broad range of functionalities and can be found in everyday food and beverages; breakfast, lunch and dinner Page Minerals, botanicals and enzymes delivering nutritional and dietary supplement benefits via custom formulations and blends Vital and ve
Slide 32: Our Ingredients Serve A Wide Array of Markets
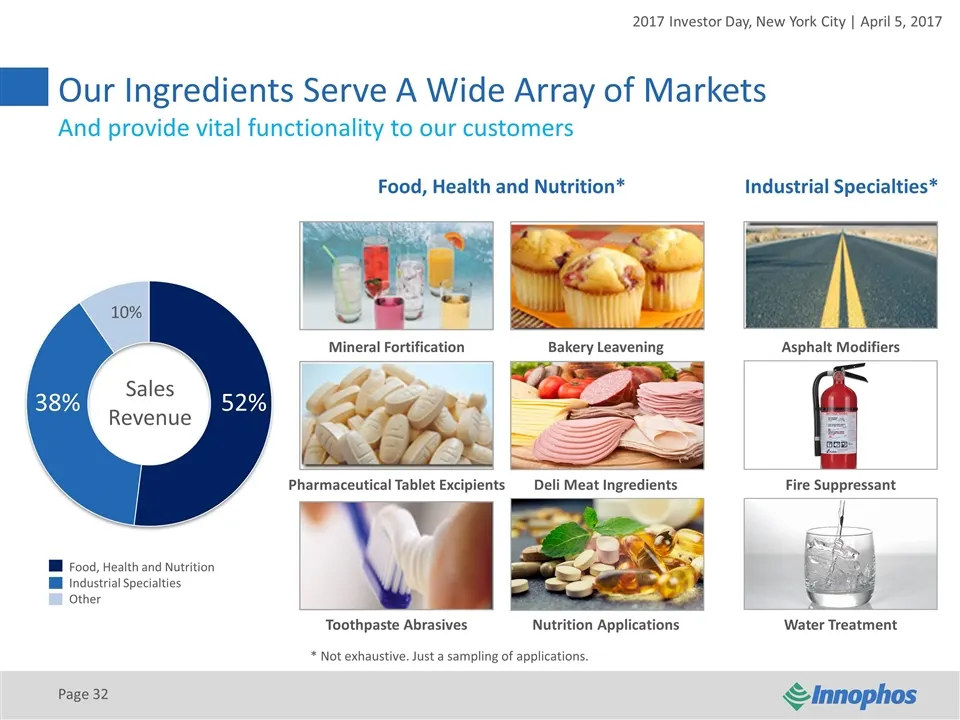
Our Ingredients Serve A Wide Array of Markets Page * Not exhaustive. Just a sampling of applications. Food, Health and Nutrition Industrial Specialties Other 52% 38% 10% Sales Revenue And provide vital functionality to our customers Food, Health and Nutrition* Industrial Specialties* Water Treatment
Slide 33: Signature Ingredients That Offer Nutritional Value
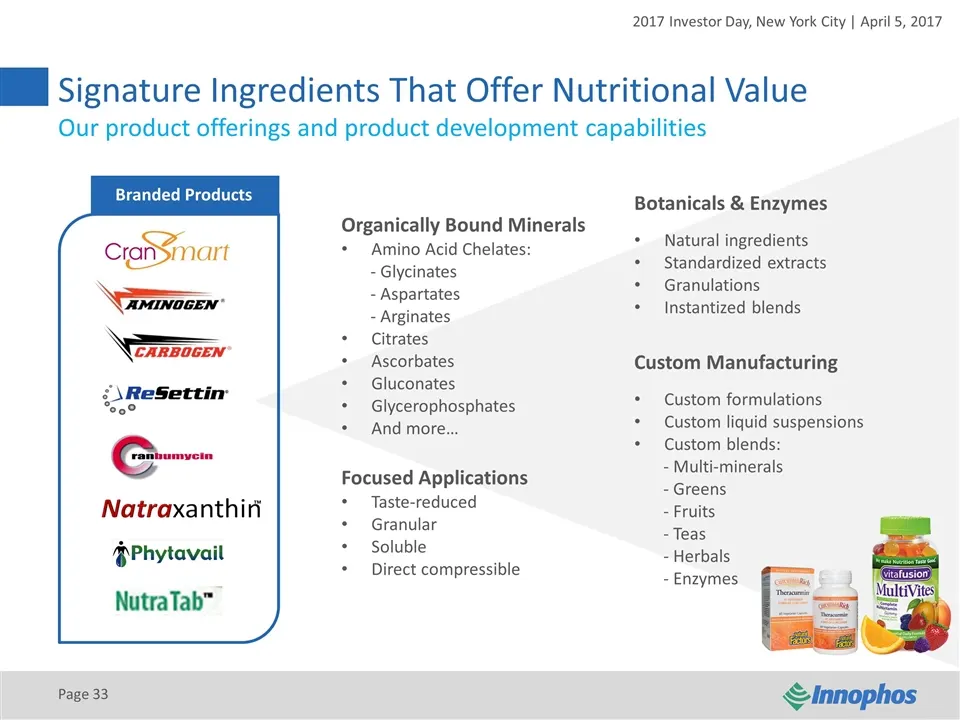
Signature Ingredients That Offer Nutritional Value Page Our product offerings and product development capabilities Branded Products Botanicals & Enzymes Natural ingredients Standardized extracts Granulations Instantized blends Custom Manufacturing Custom formulations Custom liquid suspensions Custom
Slide 34: Serving Attractive And Resilient End Markets
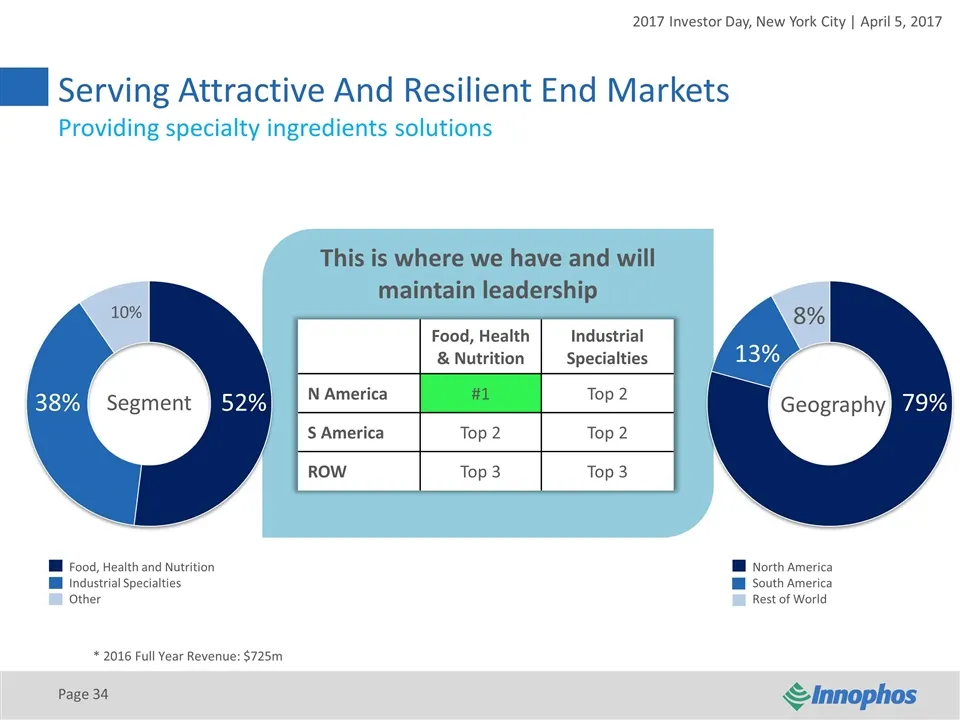
Serving Attractive And Resilient End Markets Page * 2016 Full Year Revenue: $725m Food, Health and Nutrition Industrial Specialties Other North America South America Rest of World 52% 38% 10% 79% 13% 8% Segment Geography Providing specialty ingredients solutions Food, Health & Nutrition Industrial S
Slide 35: Worldwide Competitive Dynamics
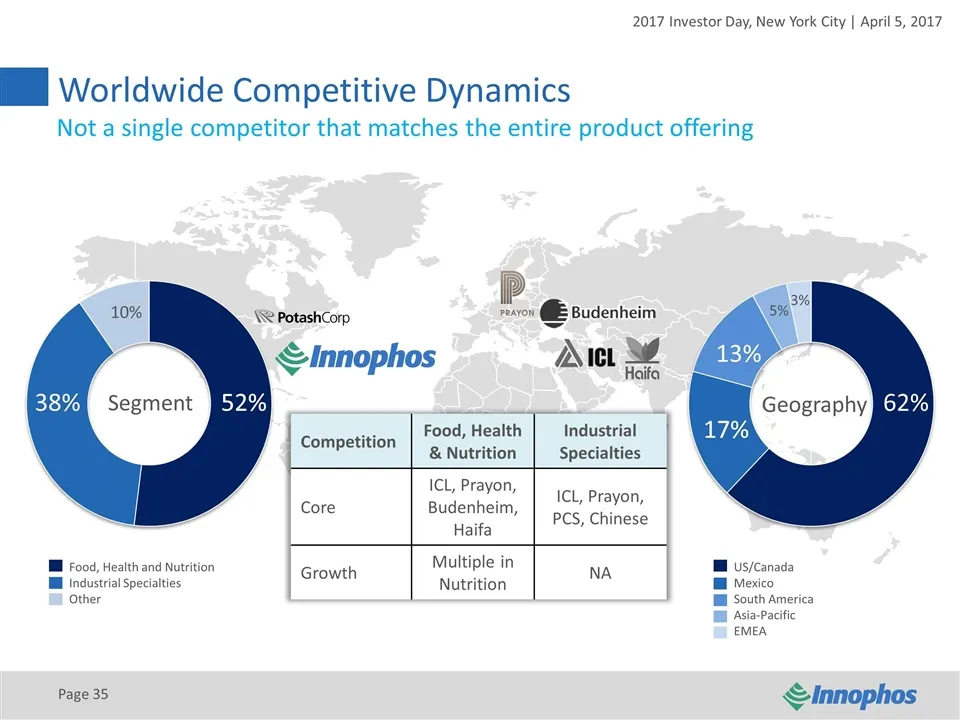
Worldwide Competitive Dynamics Page Not a single competitor that matches the entire product offering Food, Health and Nutrition Industrial Specialties Other US/Canada Mexico South America Asia-Pacific EMEA 52% 38% 10% 62% 13% 5% Segment Geography 3% 17% 52% 17% Competition Food, Health & Nutrition I
Slide 36: Phosphates: A Simple Value-Added Business Model
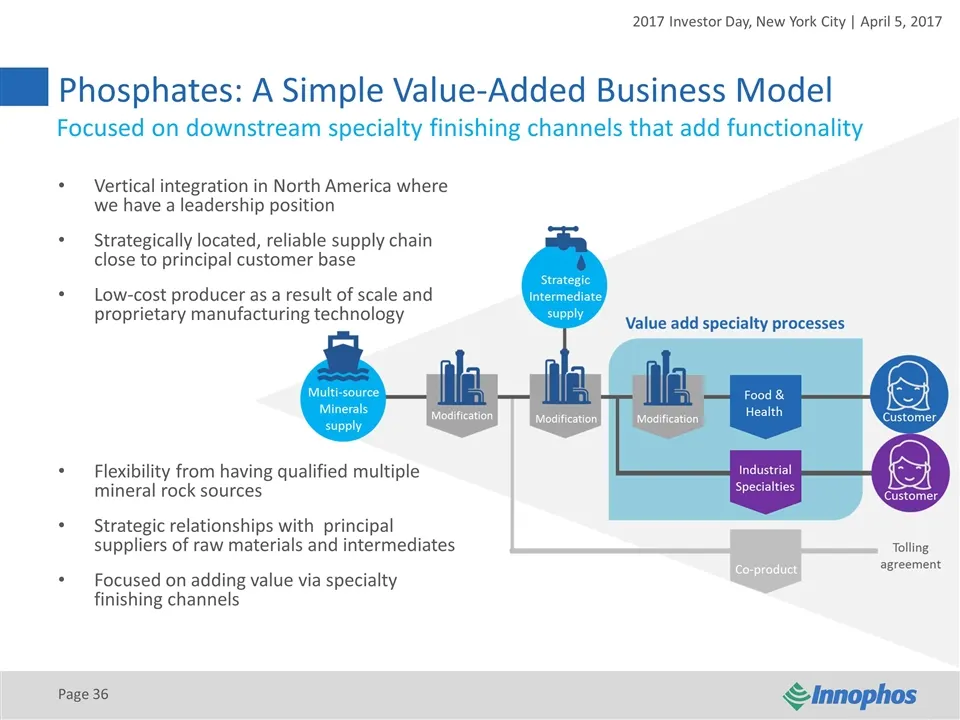
Phosphates: A Simple Value-Added Business Model Page Focused on downstream specialty finishing channels that add functionality Vertical integration in North America where we have a leadership position Strategically located, reliable supply chain close to principal customer base Low-cost producer as
Slide 37: Diverse Leadership In Nutrition Market
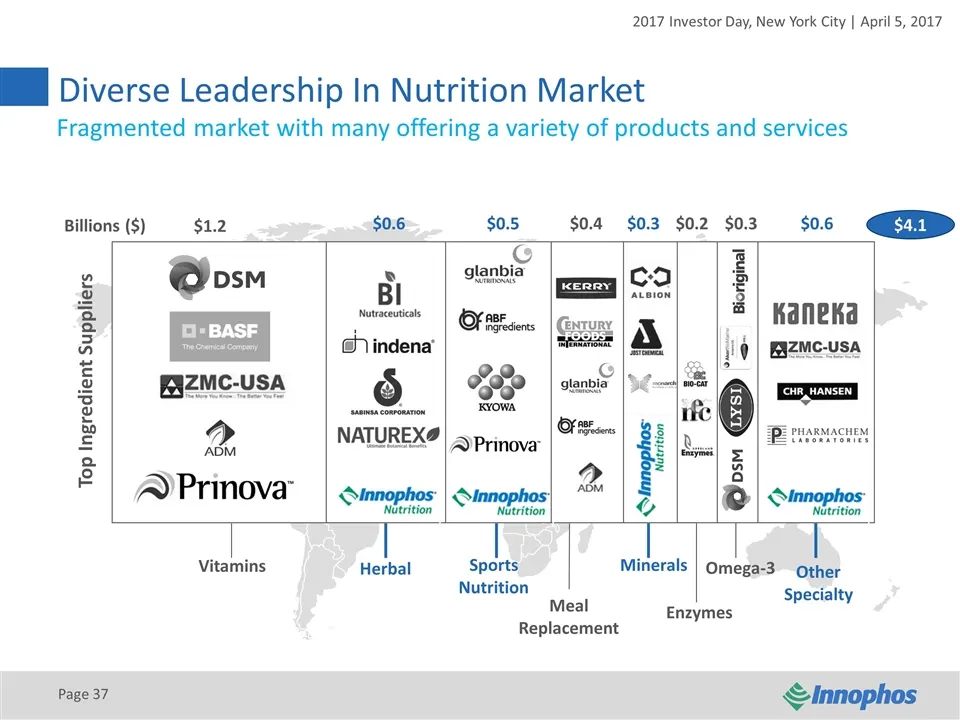
Diverse Leadership In Nutrition Market Page Fragmented market with many offering a variety of products and services 52% 52% $ $ $ $ $ $ $ $ $4.1 Vitamins Herbal Sports Nutrition Meal Replacement Minerals Enzymes Omega-3 Other Specialty Top Ingredient Suppliers Billions ($)
Slide 38: Nutrition: Turnkey Ingredient Solutions
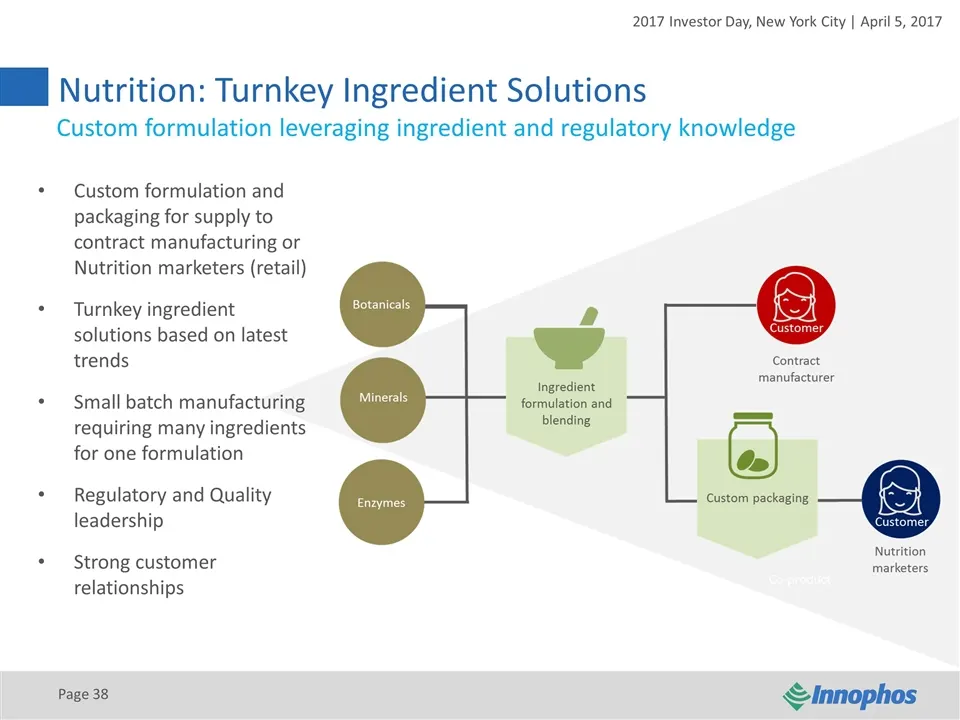
Nutrition: Turnkey Ingredient Solutions Page Custom formulation leveraging ingredient and regulatory knowledge Custom formulation and packaging for supply to contract manufacturing or Nutrition marketers (retail) Turnkey ingredient solutions based on latest trends Small batch manufacturing requiring
Slide 39: A Strong And Diverse Customer Base
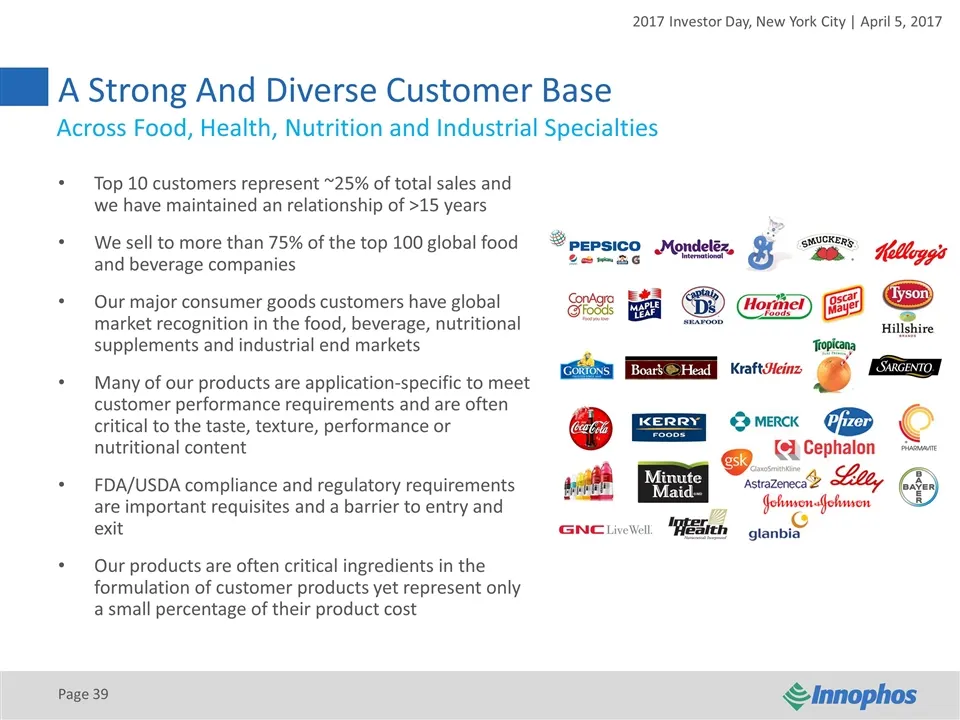
A Strong And Diverse Customer Base Top 10 customers represent ~25% of total sales and we have maintained an relationship of >15 years We sell to more than 75% of the top 100 global food and beverage companies Our major consumer goods customers have global market recognition in the food, beverage, nu
Slide 40: Consumer Trends Translating Into Customer Needs
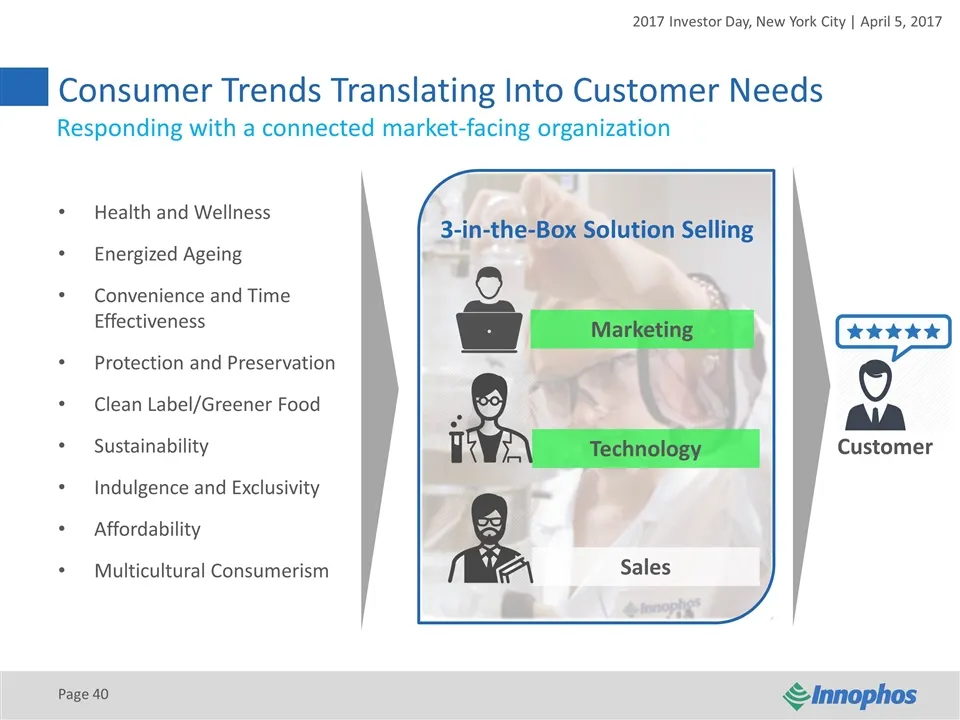
Consumer Trends Translating Into Customer Needs Health and Wellness Energized Ageing Convenience and Time Effectiveness Protection and Preservation Clean Label/Greener Food Sustainability Indulgence and Exclusivity Affordability Multicultural Consumerism Responding with a connected market-facing org
Slide 41: Building Capability For Tomorrow
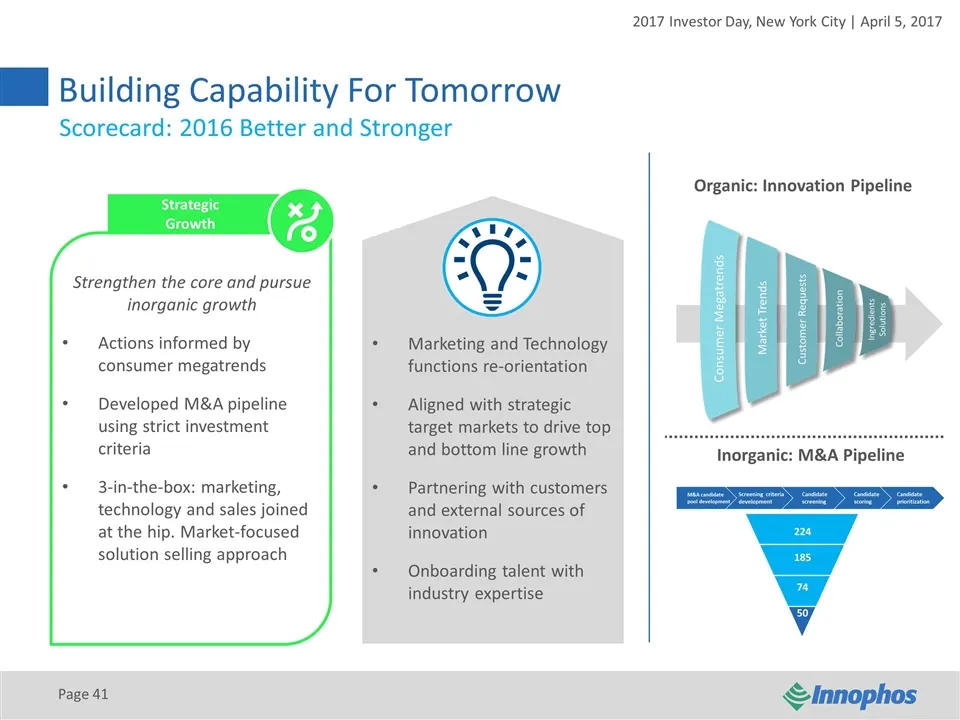
Building Capability For Tomorrow Page Strategic Growth Strengthen the core and pursue inorganic growth Actions informed by consumer megatrends Developed M&A pipeline using strict investment criteria 3-in-the-box: marketing, technology and sales joined at the hip. Market-focused solution selling appr
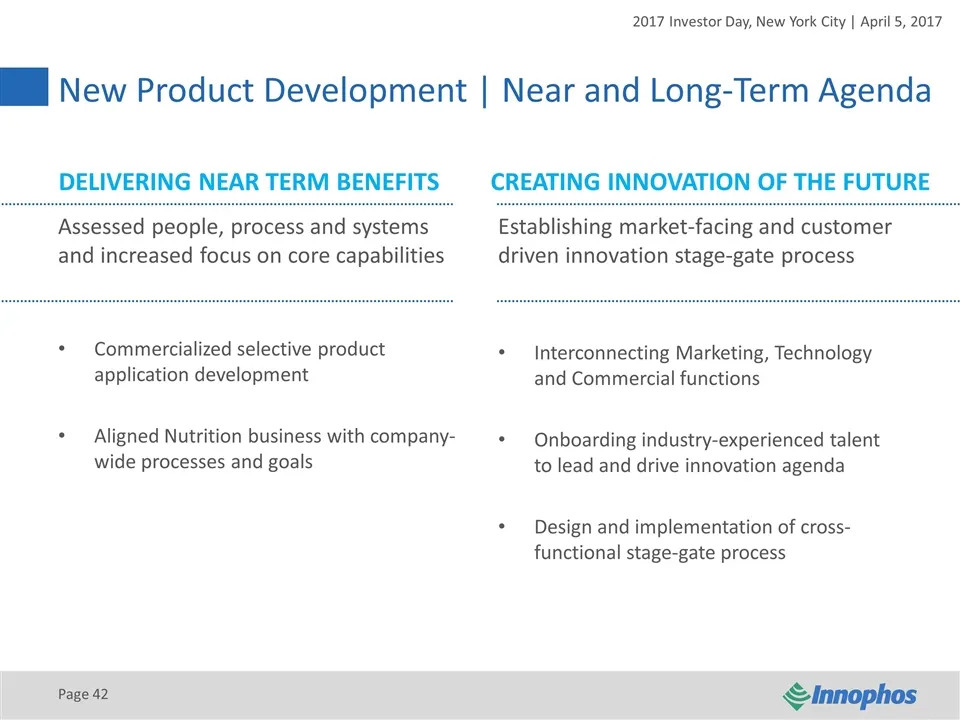
Slide 42: New Product Development Near and Long-Term Agenda
Page New Product Development | Near and Long-Term Agenda DELIVERING NEAR TERM BENEFITSCREATING INNOVATION OF THE FUTURE Assessed people, process and systems and increased focus on core capabilities Commercialized selective product application development Aligned Nutrition business with company-wide
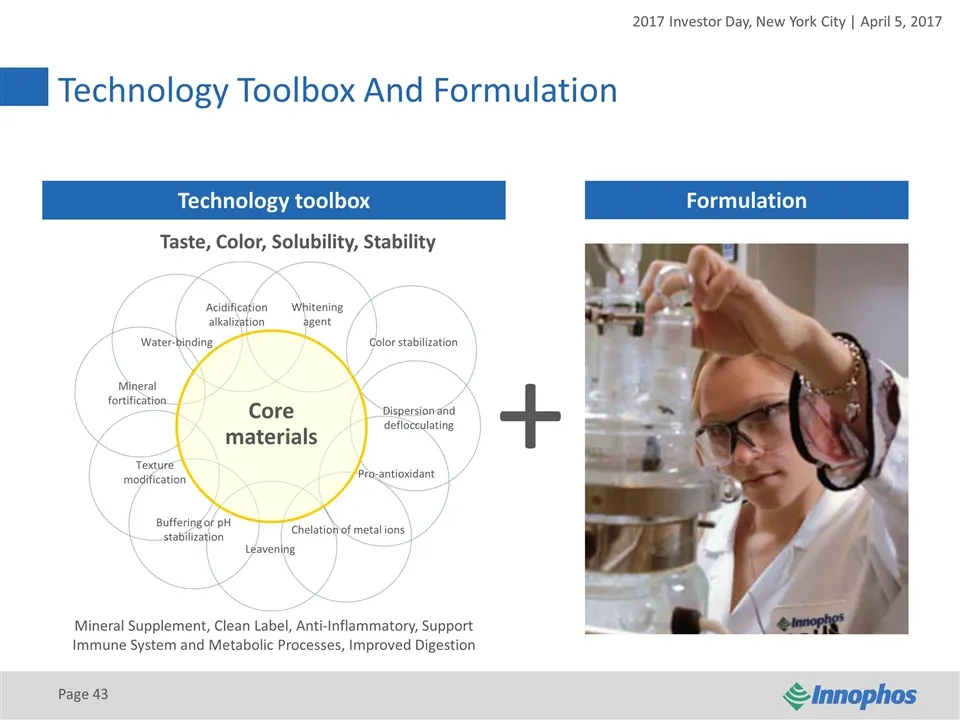
Slide 43: Technology Toolbox And Formulation
Technology Toolbox And Formulation + Technology toolbox Formulation Core materials Page Mineral Supplement, Clean Label, Anti-Inflammatory, Support Immune System and Metabolic Processes, Improved Digestion Taste, Color, Solubility, Stability Mineral fortification Texture modification Buffering or pH
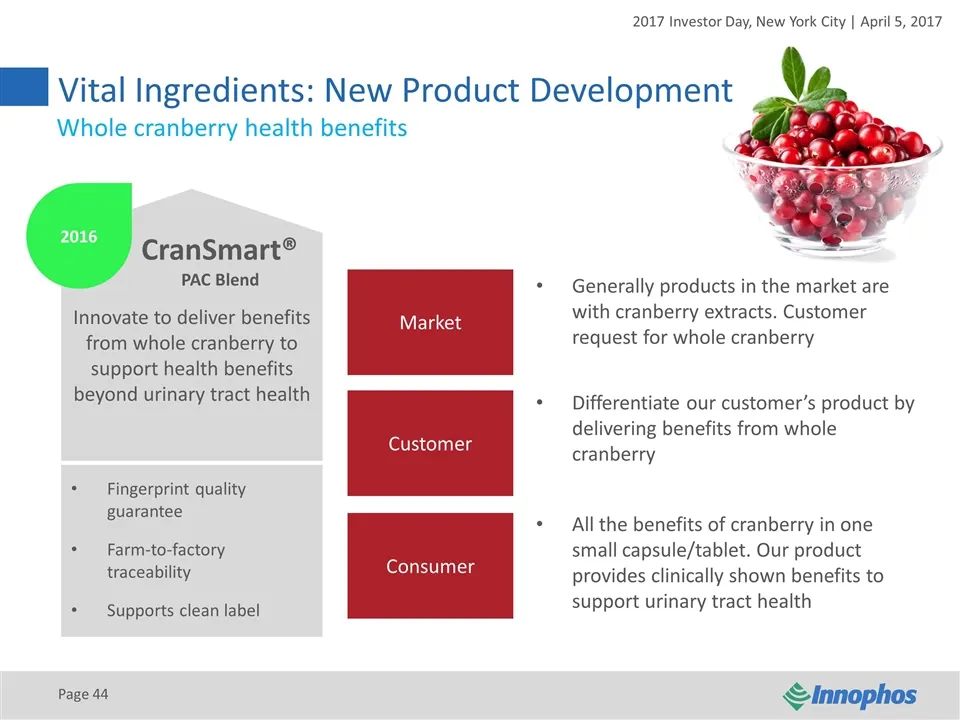
Slide 44: Vital Ingredients: New Product Development
Vital Ingredients: New Product Development Page 2016 CranSmart® PAC Blend Innovate to deliver benefits from whole cranberry to support health benefits beyond urinary tract health Fingerprint quality guarantee Farm-to-factory traceability Supports clean label Generally products in the market are with
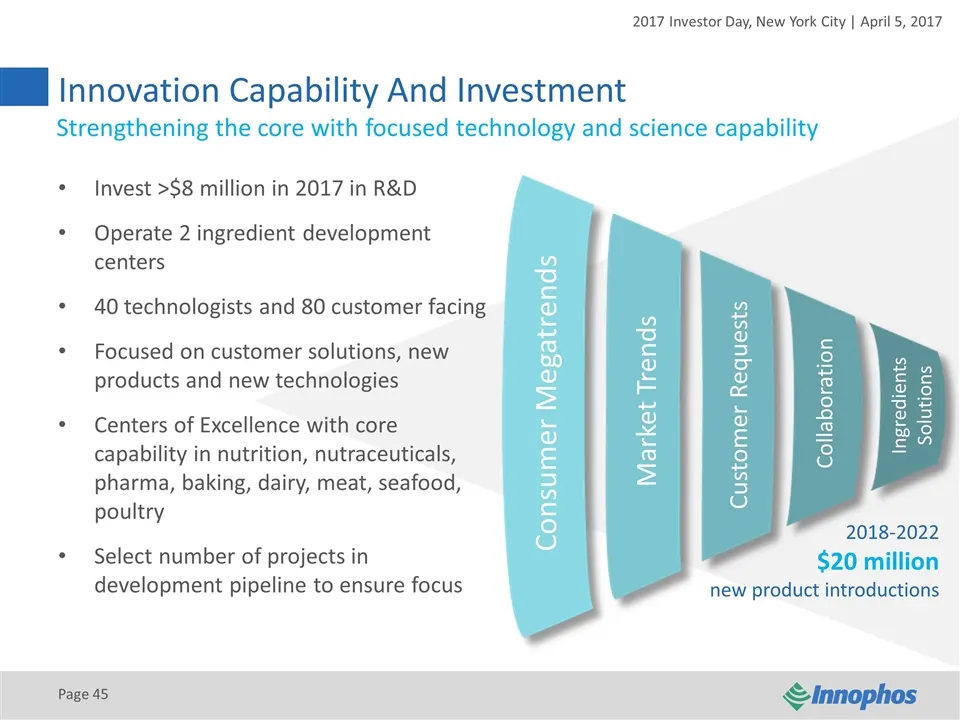
Slide 45: Innovation Capability And Investment
Innovation Capability And Investment Invest >$8 million in 2017 in R&D Operate 2 ingredient development centers 40 technologists and 80 customer facing Focused on customer solutions, new products and new technologies Centers of Excellence with core capability in nutrition, nutraceuticals, pharma, ba
Slide 46: Focused On Markets That Deliver Growth
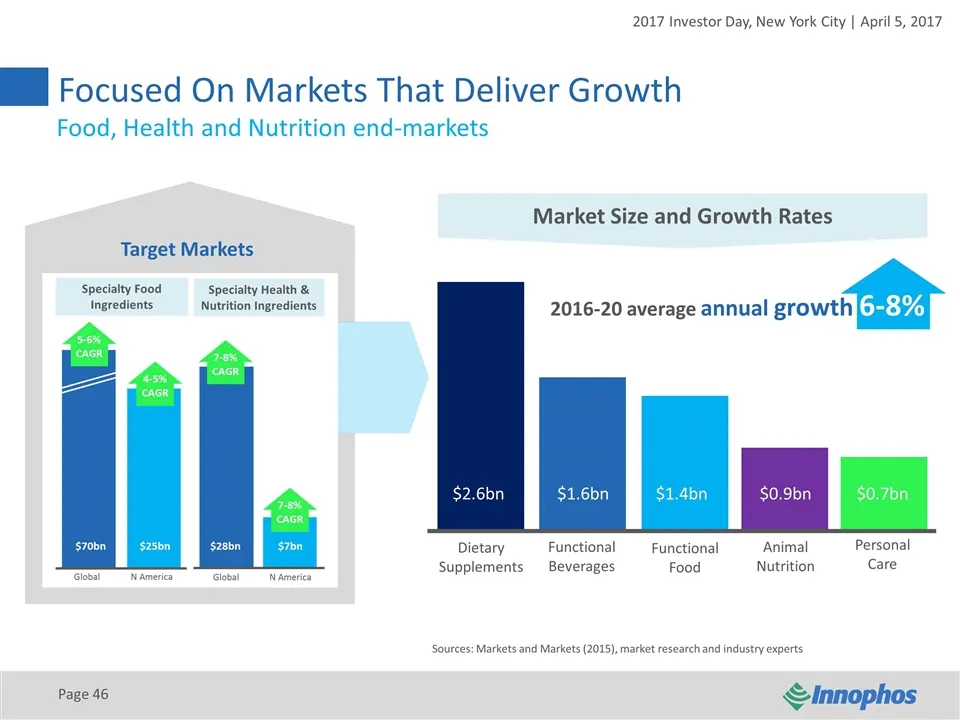
Focused On Markets That Deliver Growth Page Food, Health and Nutrition end-markets Dietary Supplements Functional Food 2016-20 average annual growth 6-8% Functional Beverages Personal Care Target Markets Animal Nutrition $2.6bn $1.6bn $1.4bn $0.9bn $0.7bn Sources: Markets and Markets (2015), market
Slide 47: Accelerate Growth Via Targeted M&A
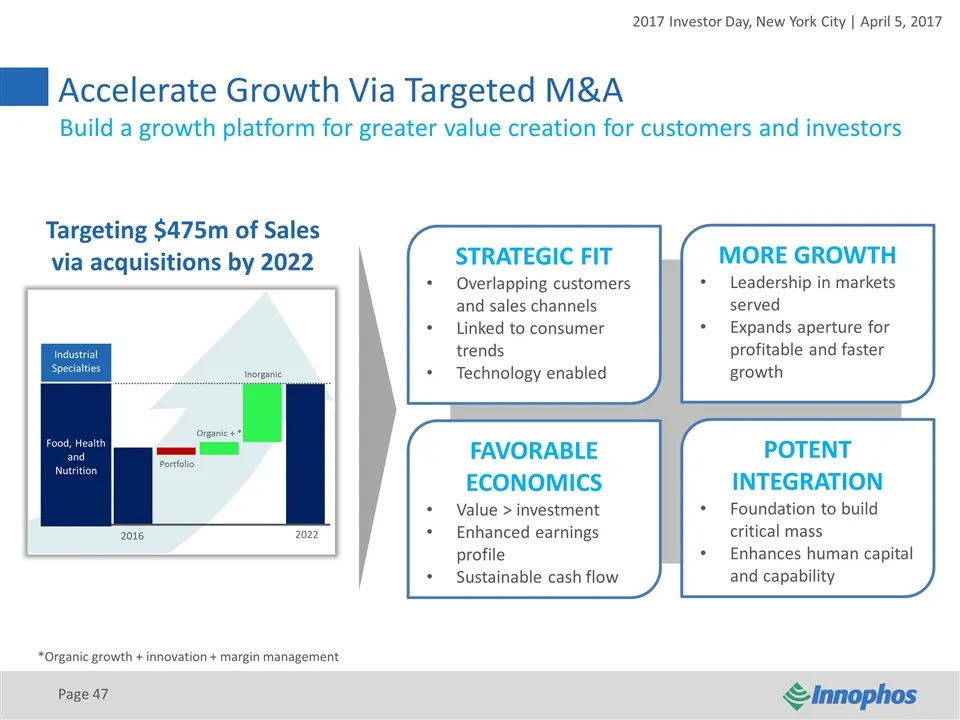
Accelerate Growth Via Targeted M&A Page STRATEGIC FIT Overlapping customers and sales channels Linked to consumer trends Technology enabled MORE GROWTH Leadership in markets served Expands aperture for profitable and faster growth FAVORABLE ECONOMICS Value > investment Enhanced earnings profile Sust
Slide 48: Building A Prioritized M&A Target List
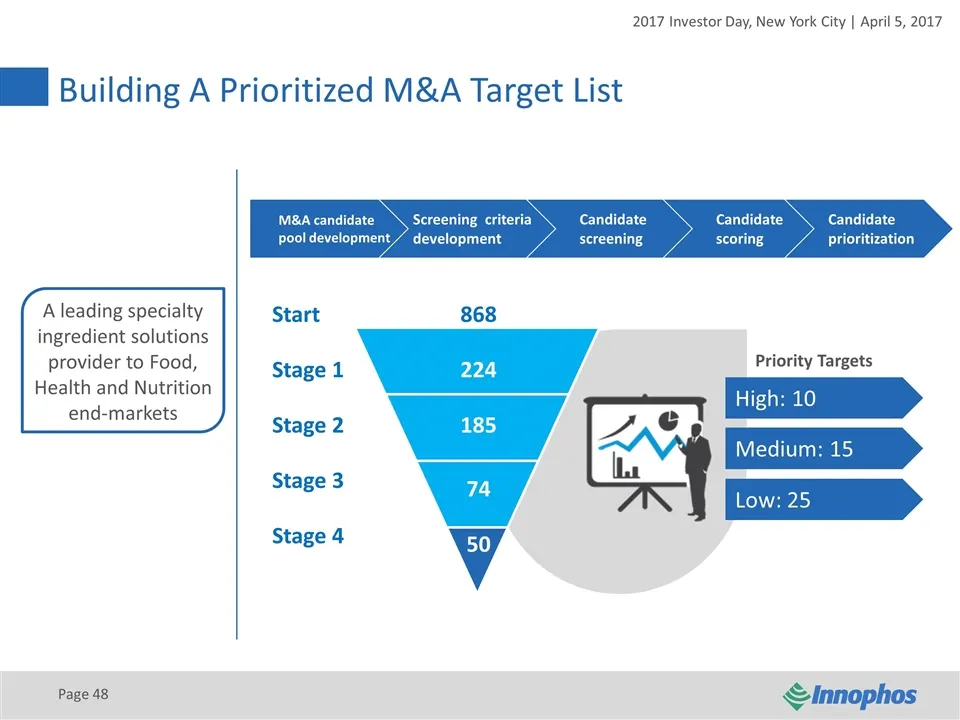
A leading specialty ingredient solutions provider to Food, Health and Nutrition end-markets Page Building A Prioritized M&A Target List M&A candidate pool development Screening criteria development Candidate screening Candidate scoring Candidate prioritization Start 868 Stage 1 224 Stage 2 185 Stage
Slide 49: Organic And Inorganic Growth
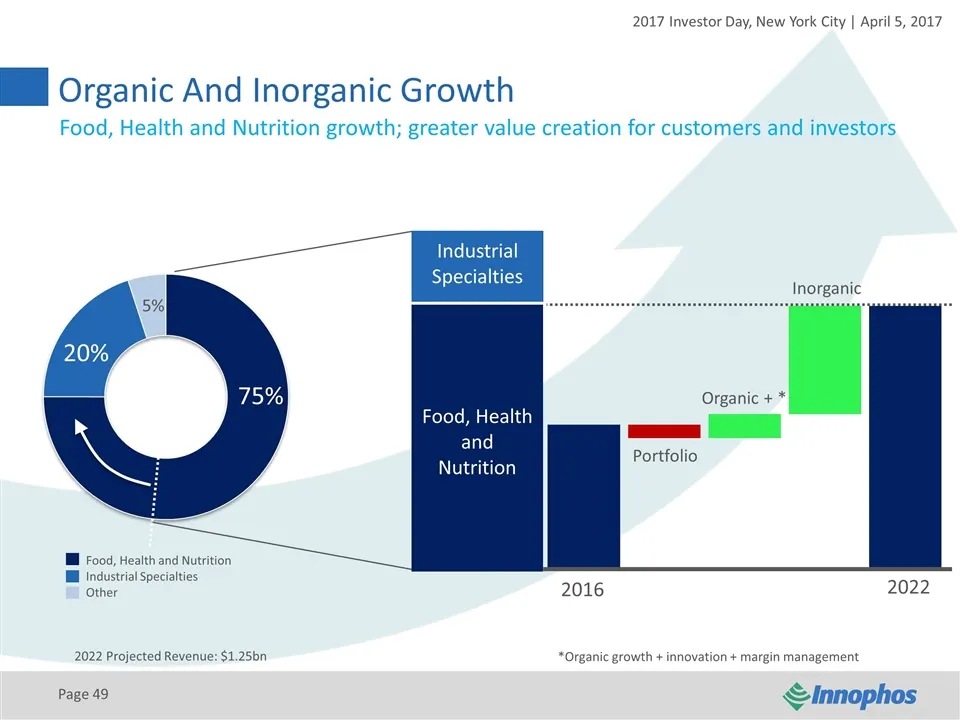
Organic And Inorganic Growth Page Food, Health and Nutrition Industrial Specialties Other 75% 20% 5% Food, Health and Nutrition Industrial Specialties 2022 Projected Revenue: $1.25bn Portfolio Inorganic 2016 2022 Organic + * *Organic growth + innovation + margin management Food, Health and Nutrition
Slide 50: Q&A
2017 INVESTOR DAY New York City | April 5, 2017 Q&A Page
Slide 51: 2017 Investor Day: Revitalized for Growth
2017 INVESTOR DAY New York City | April 5, 2017 REVITALIZED FOR GROWTH
Slide 52: Marco Coen, Global Commercial Director
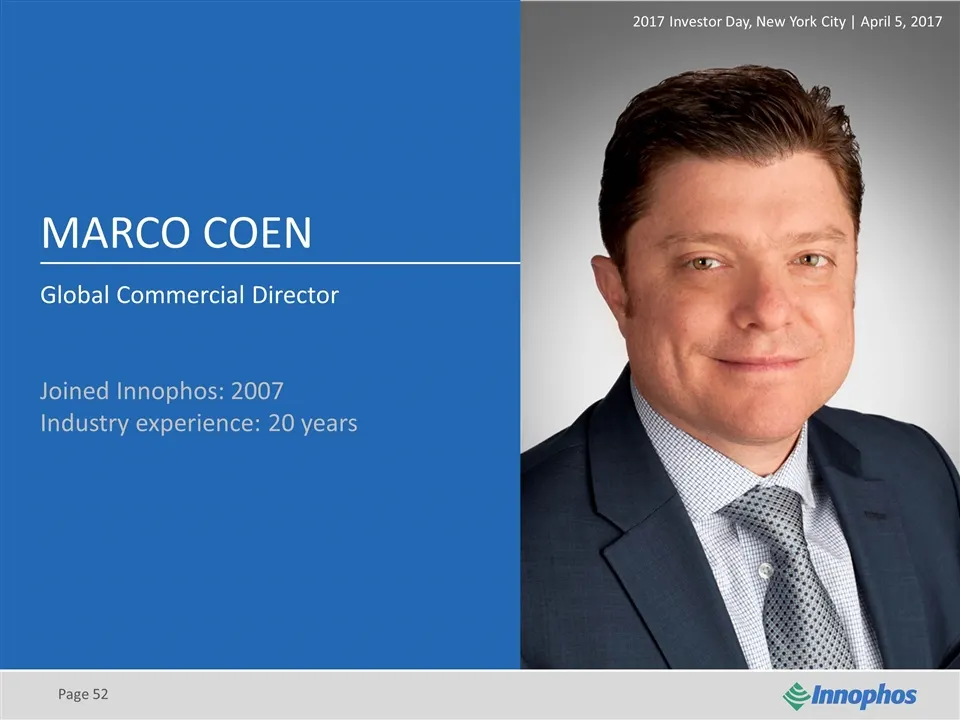
Page Marco’s headshot MARCO COEN Global Commercial Director Joined Innophos: 2007 Industry experience: 20 years 2017 Investor Day, New York City | April 5, 2017
Slide 53: Pillar: Commercial Excellence
Page 2017 INVESTOR DAY New York City | April 5, 2017 Pillar: Commercial Excellence
Slide 54: Key Messages
Key Messages Page Segmentation and margin management are core to the Commercial Excellence agenda We shifted our customer engagement model to be market and sales channel oriented Our 3-in-the-box approach (commercial – marketing - technology) will strengthen our core portfolio We embrace a diversifi
Slide 55: Strengthening The Core Via Market-Facing Alignment
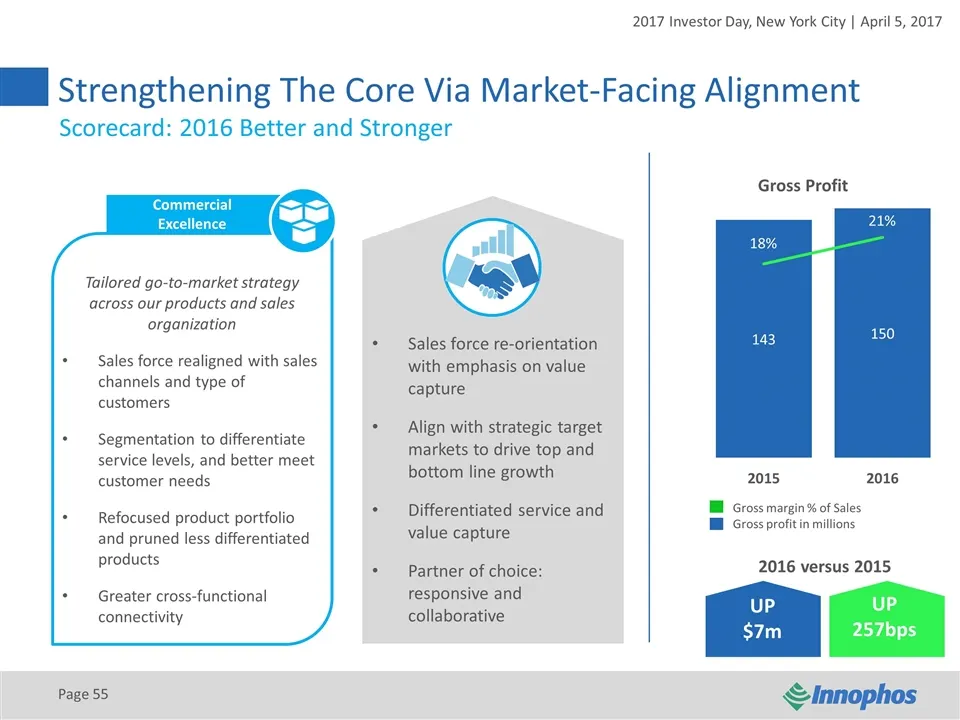
Strengthening The Core Via Market-Facing Alignment Page Commercial Excellence Tailored go-to-market strategy across our products and sales organization Sales force realigned with sales channels and type of customers Segmentation to differentiate service levels, and better meet customer needs Refocus
Slide 56: Segmentation And Customer Facing Approach
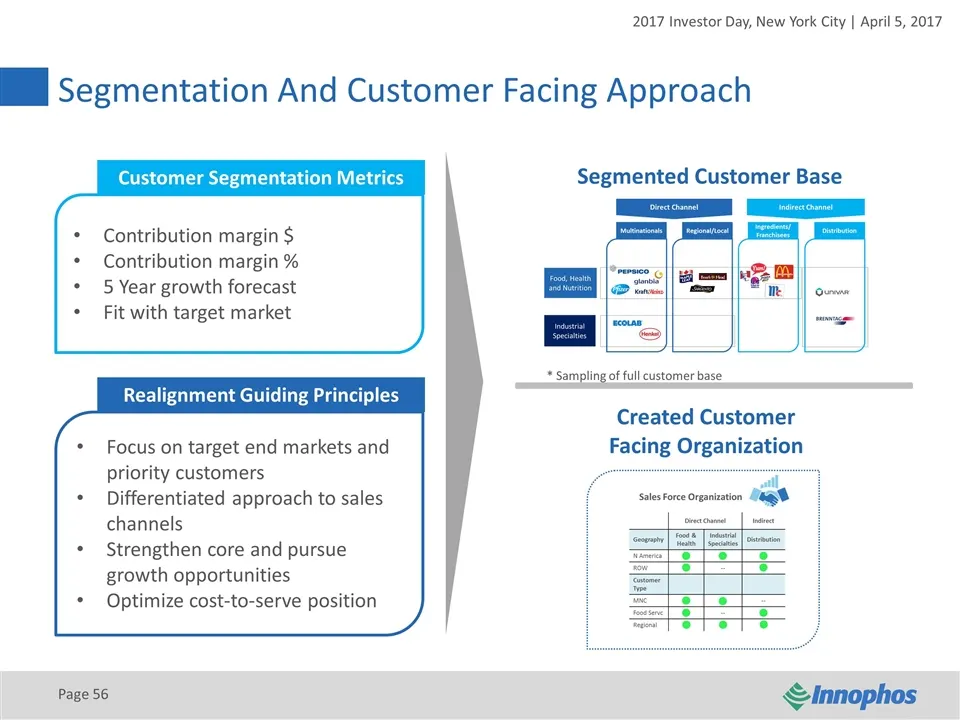
Segmentation And Customer Facing Approach Page Segmented Customer Base Created Customer Facing Organization Focus on target end markets and priority customers Differentiated approach to sales channels Strengthen core and pursue growth opportunities Optimize cost-to-serve position Contribution margin
Slide 57: Segmentation Informed Cost-to-Serve Differentiation
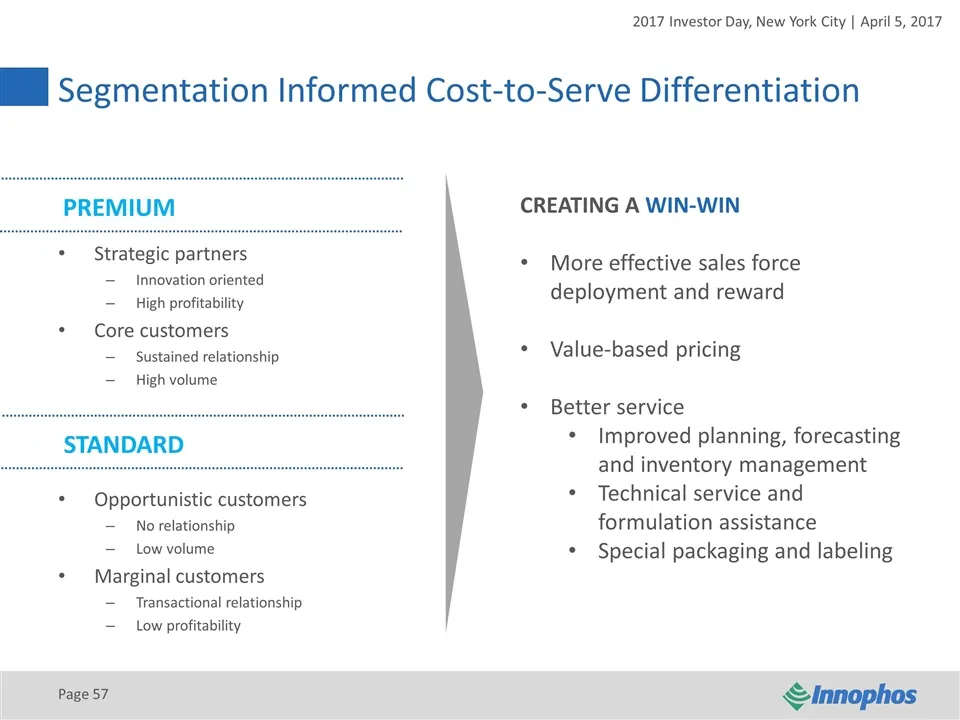
Segmentation Informed Cost-to-Serve Differentiation Page PREMIUM Strategic partners Innovation oriented High profitability Core customers Sustained relationship High volume Opportunistic customers No relationship Low volume Marginal customers Transactional relationship Low profitability STANDARD CRE
Slide 58: Reputable Branded Customers
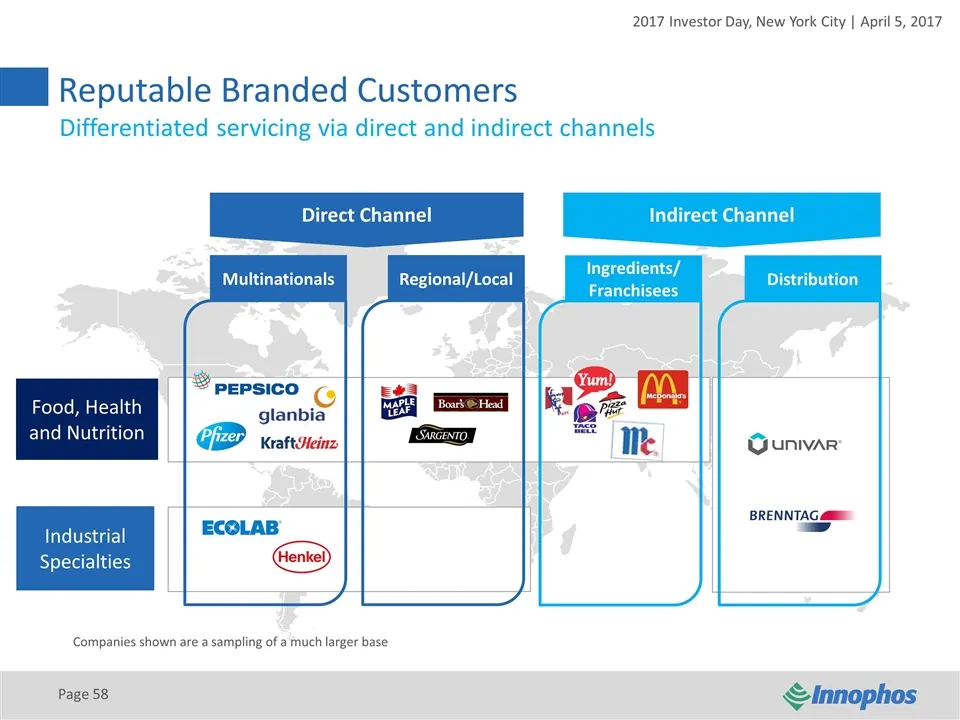
Reputable Branded Customers Page Differentiated servicing via direct and indirect channels Food, Health and Nutrition Industrial Specialties Multinationals Regional/Local Ingredients/ Franchisees Distribution Companies shown are a sampling of a much larger base Direct Channel Indirect Channel
Slide 59: Realigned Market-Facing Organization
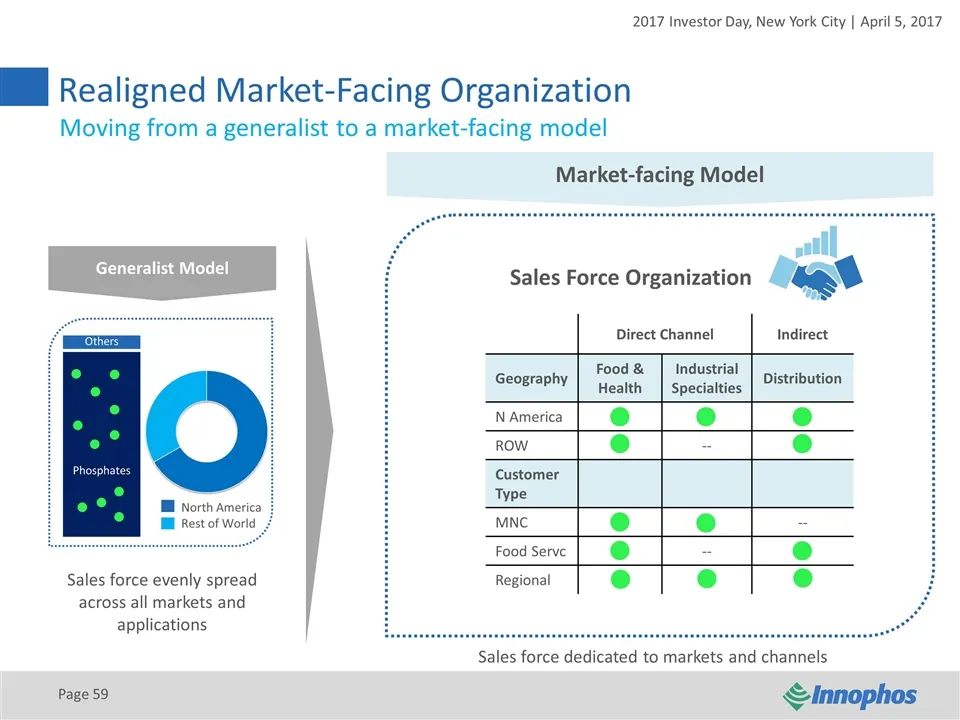
Realigned Market-Facing Organization Page Moving from a generalist to a market-facing model Generalist Model Market-facing Model North America Rest of World Direct Channel Indirect Geography Food & Health Industrial Specialties Distribution N America X X X ROW X -- X Customer Type MNC X X -- Food Se
Slide 60: 3-in-the-Box Cross-Functional Collaboration
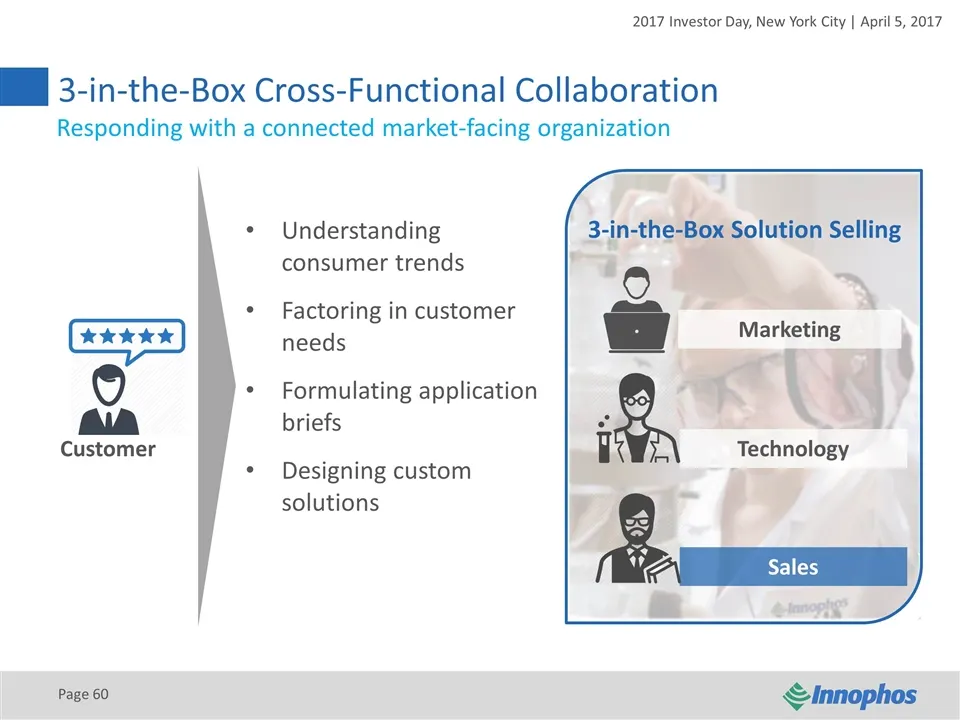
3-in-the-Box Cross-Functional Collaboration Responding with a connected market-facing organization Page Marketing Technology Sales 3-in-the-Box Solution Selling Customer Understanding consumer trends Factoring in customer needs Formulating application briefs Designing custom solutions
Slide 61: Commercial Excellence A Major Pillar In Our Strategy
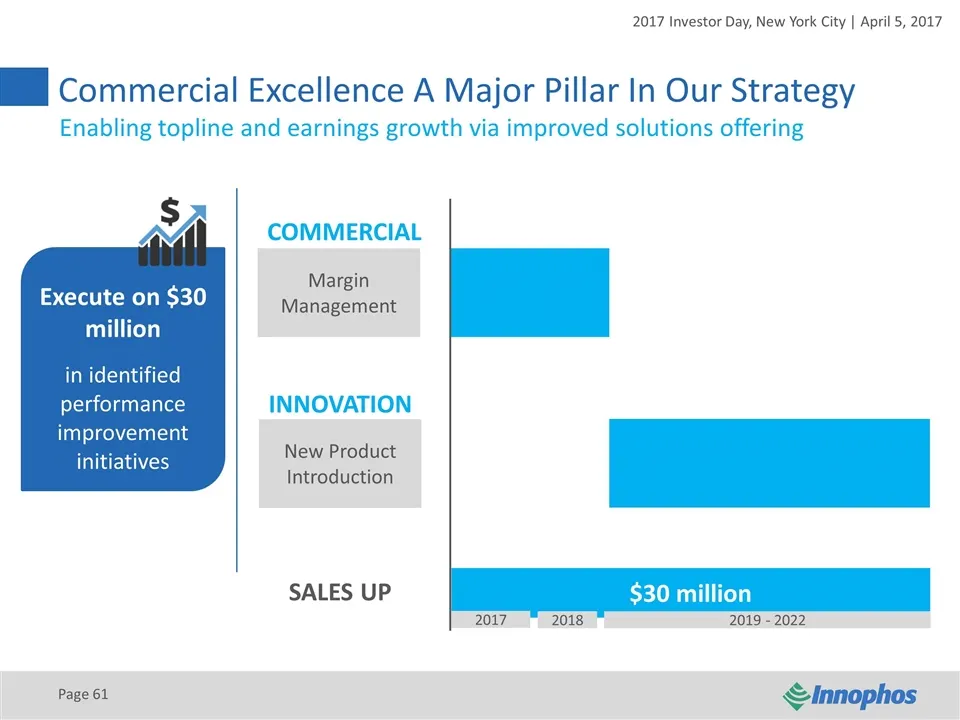
Page Commercial Excellence A Major Pillar In Our Strategy Margin Management Execute on $30 million in identified performance improvement initiatives New Product Introduction INNOVATION $30 million SALES UP Enabling topline and earnings growth via improved solutions offering 2017 2018 2019 - 2022 COM
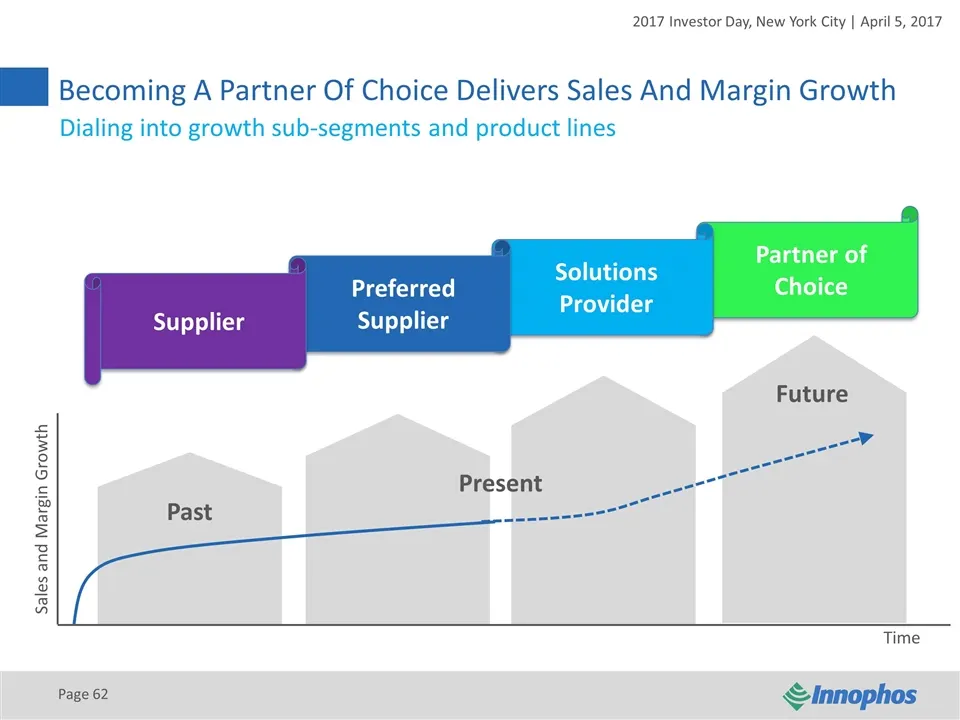
Slide 62: Becoming A Partner Of Choice
Partner of Choice Solutions Provider Preferred Supplier Supplier Becoming A Partner Of Choice Delivers Sales And Margin Growth Page Sales and Margin Growth Time Dialing into growth sub-segments and product lines Future Present Past
Slide 63: Amy Hartzell, VP Supply Chain & Purchasing
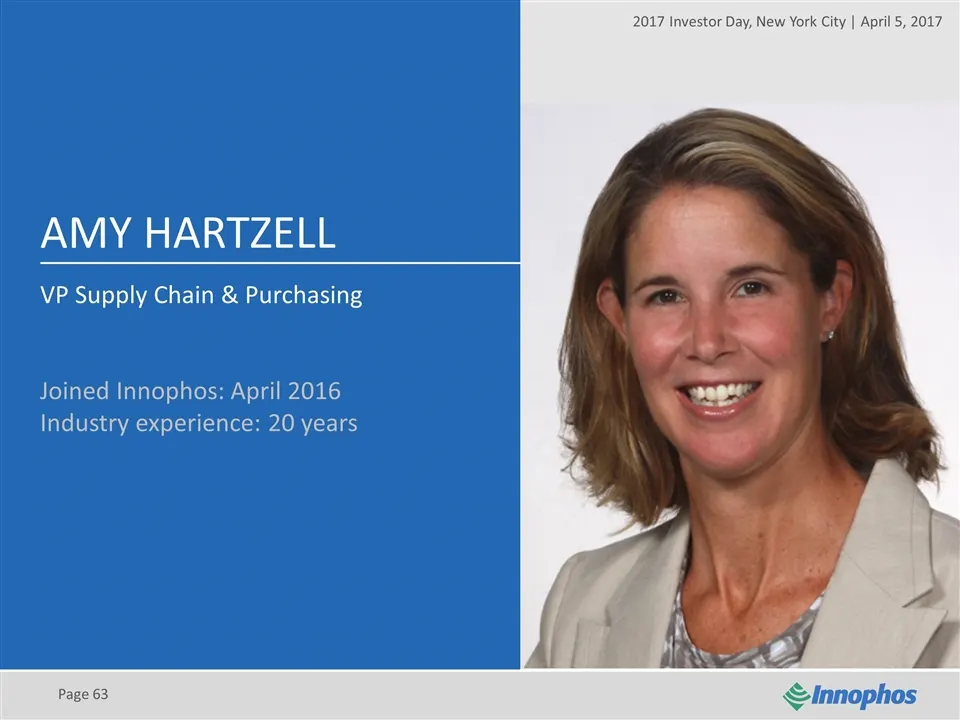
2017 Investor Day, New York City | April 5, 2017 Page AMY HARTZELL VP Supply Chain & Purchasing Joined Innophos: April 2016 Industry experience: 20 years
Slide 64: Pillar: Operational Excellence
Page 2017 INVESTOR DAY New York City | April 5, 2017 Pillar: Operational Excellence
Slide 65: Key Messages
Key Messages Page We delivered significant cost savings and working capital improvements in 2016 and more opportunity remains Organization and cultural transformation is at the heart of our operational excellence agenda Modern practices and alignment in accountability are driving sustainable improve
Slide 66: Executed Two Complementary Parallel Tracks
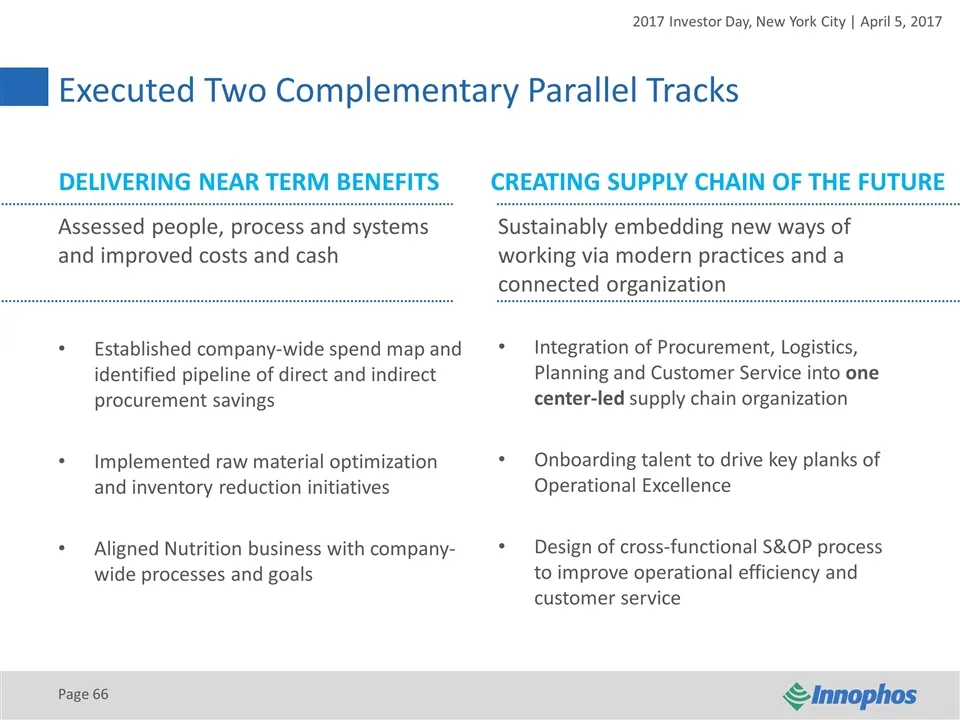
Page Executed Two Complementary Parallel Tracks DELIVERING NEAR TERM BENEFITSCREATING SUPPLY CHAIN OF THE FUTURE Assessed people, process and systems and improved costs and cash Established company-wide spend map and identified pipeline of direct and indirect procurement savings Implemented raw mate
Slide 67: Delivering Near Term Cost And Cash Benefits
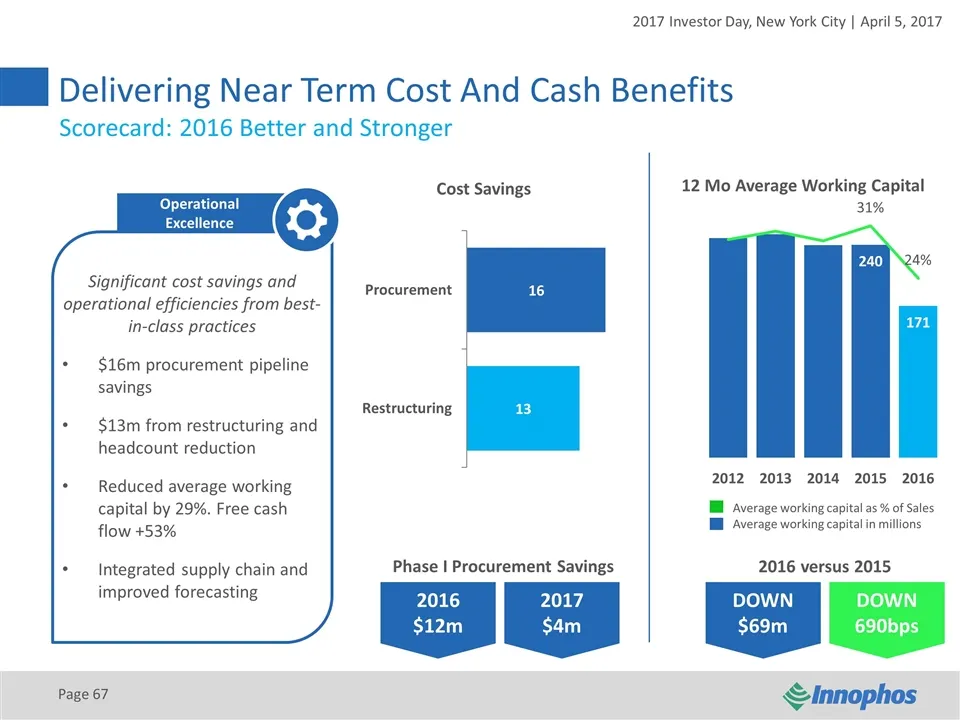
Delivering Near Term Cost And Cash Benefits Page Operational Excellence Significant cost savings and operational efficiencies from best-in-class practices $16m procurement pipeline savings $13m from restructuring and headcount reduction Reduced average working capital by 29%. Free cash flow +53% Int
Slide 68: Creating Supply Chain Of The Future
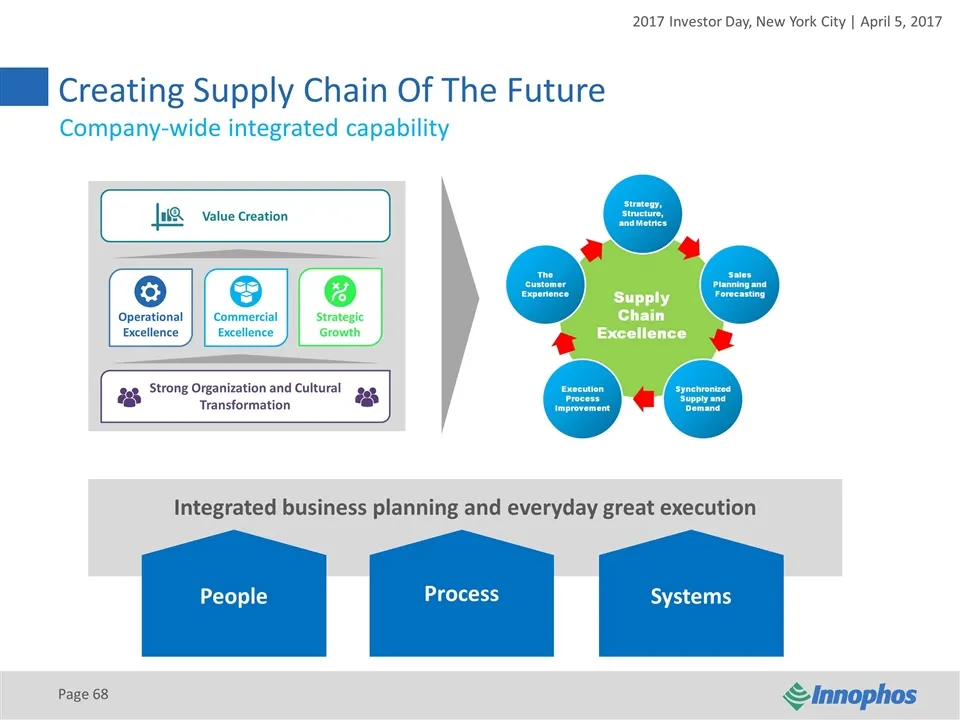
Creating Supply Chain Of The Future Page Company-wide integrated capability People Process Systems Integrated business planning and everyday great execution
Slide 69: Supporting All Pillars Of Our Strategic Roadmap
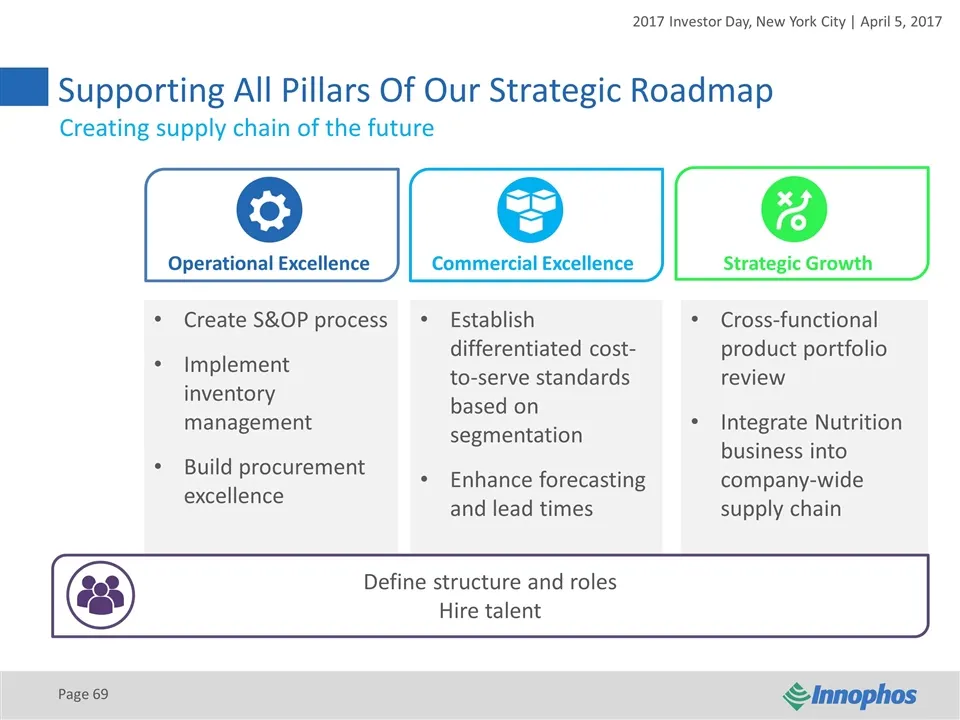
Supporting All Pillars Of Our Strategic Roadmap Page Operational Excellence Commercial Excellence Strategic Growth Create S&OP process Implement inventory management Build procurement excellence Establish differentiated cost-to-serve standards based on segmentation Enhance forecasting and lead times
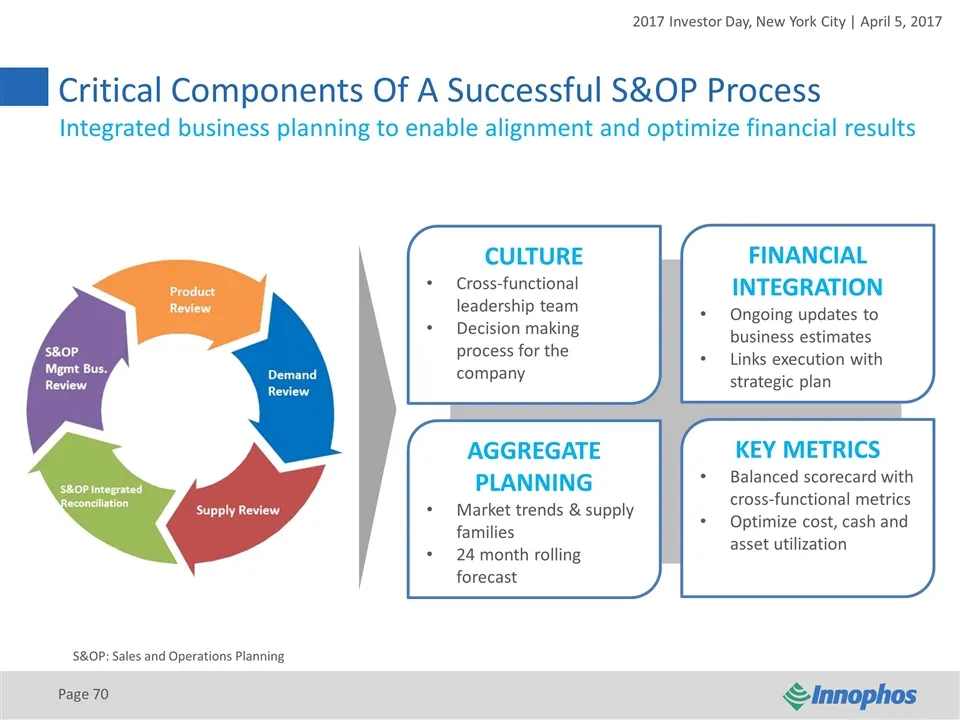
Slide 70: Critical Components Of A Successful S&OP Process
Page Critical Components Of A Successful S&OP Process Integrated business planning to enable alignment and optimize financial results CULTURE Cross-functional leadership team Decision making process for the company FINANCIAL INTEGRATION Ongoing updates to business estimates Links execution with stra
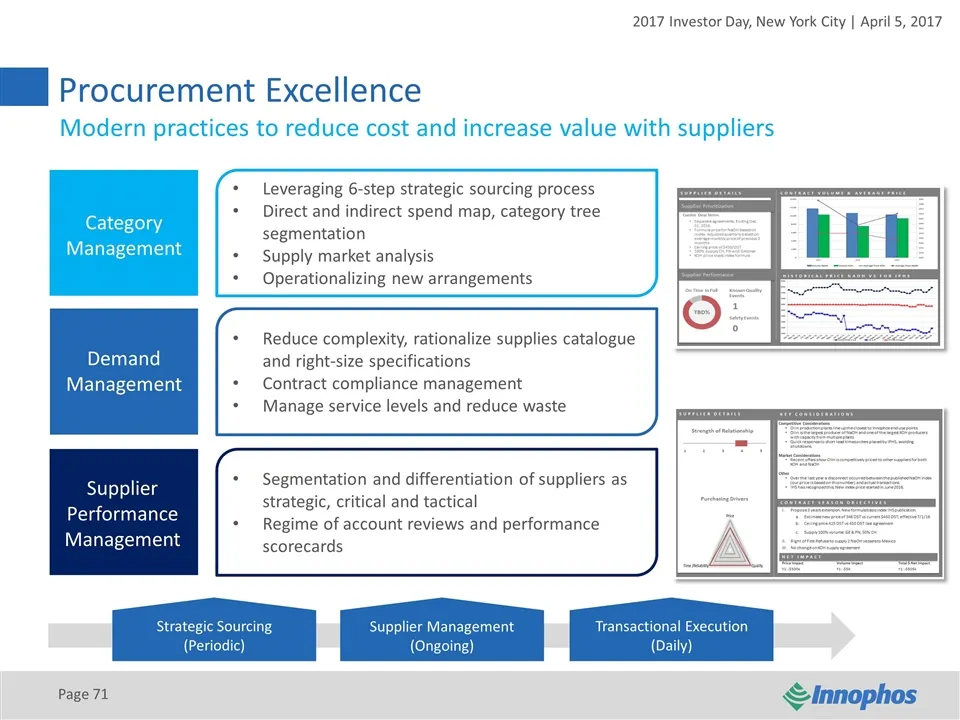
Slide 71: Procurement Excellence
Procurement Excellence Page Modern practices to reduce cost and increase value with suppliers Supplier Performance Management Demand Management Leveraging 6-step strategic sourcing process Direct and indirect spend map, category tree segmentation Supply market analysis Operationalizing new arrangeme
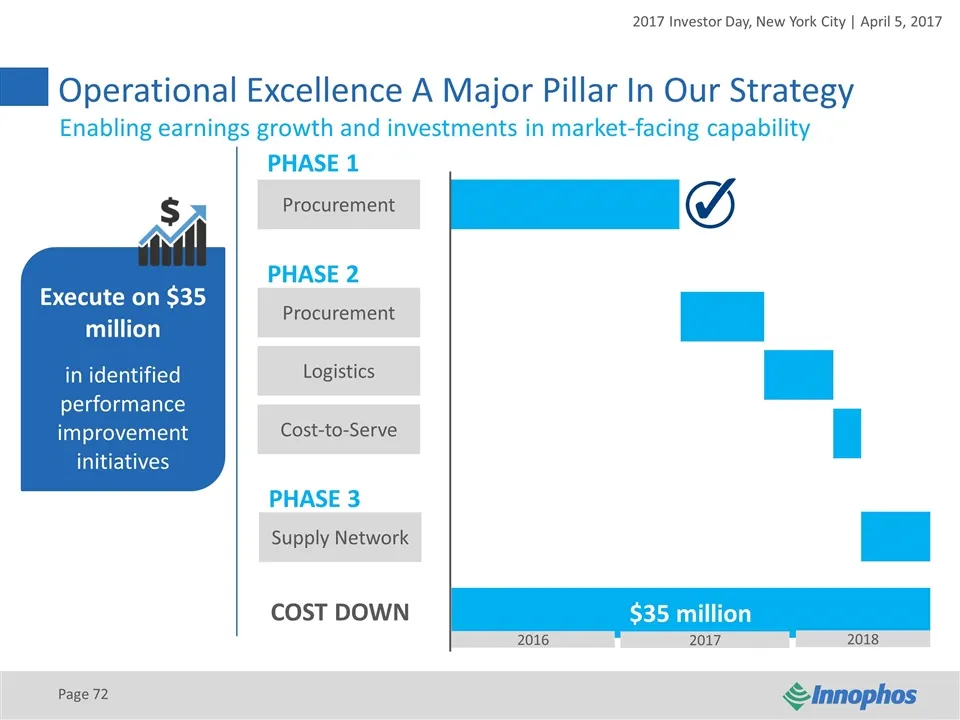
Slide 72: Operational Excellence A Major Pillar In Our Strategy
Page Operational Excellence A Major Pillar In Our Strategy Procurement Procurement Logistics Cost-to-Serve Execute on $35 million in identified performance improvement initiatives PHASE 1 PHASE 2 Supply Network PHASE 3 $35 million COST DOWN Enabling earnings growth and investments in market-facing c
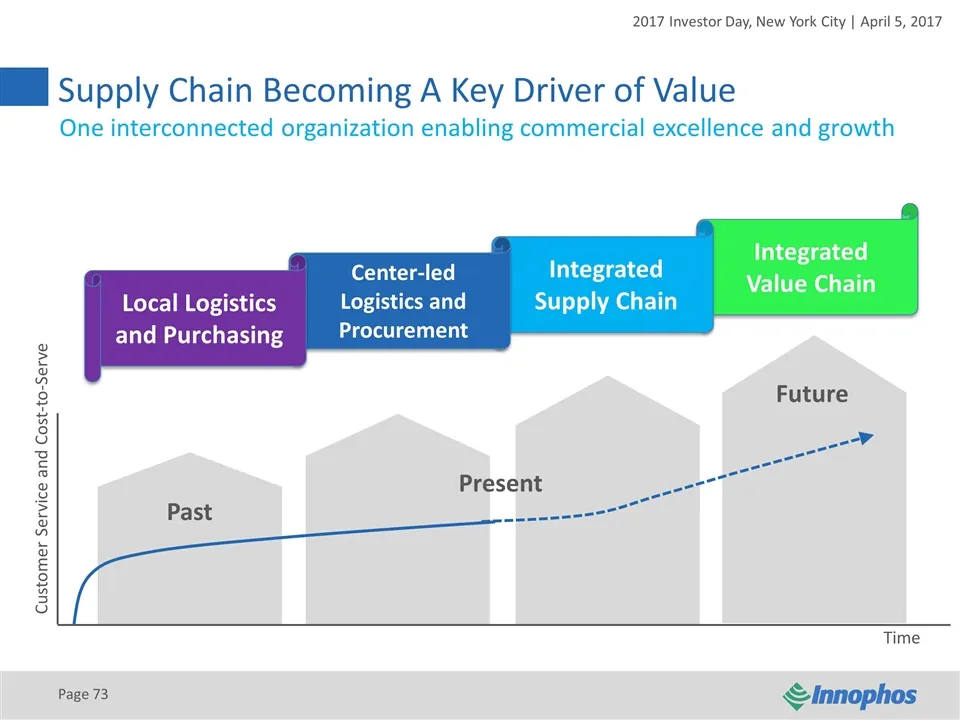
Slide 73: Supply Chain Becoming A Key Driver of Value
Integrated Value Chain Integrated Supply Chain Center-led Logistics and Procurement Local Logistics and Purchasing Supply Chain Becoming A Key Driver of Value Page Customer Service and Cost-to-Serve Time One interconnected organization enabling commercial excellence and growth Future Present Past
Slide 74: Q&A
2017 INVESTOR DAY New York City | April 5, 2017 Q&A Page
Slide 75: Han Kieftenbeld, SVP and Chief Financial Officer
2017 Investor Day, New York City | April 5, 2017 Page HAN KIEFTENBELD SVP and Chief Financial Officer Joined Innophos: April 2016 Industry experience: 29 years
Slide 76: We Have The Ingredients For Sustained Value Creation
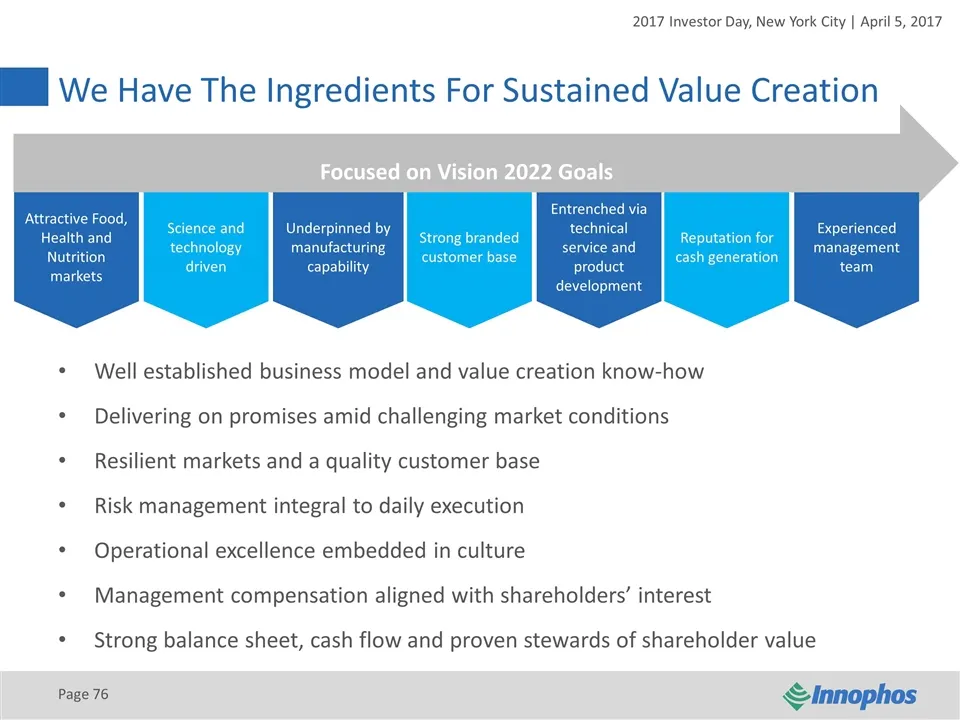
We Have The Ingredients For Sustained Value Creation Page Science and technology driven Attractive Food, Health and Nutrition markets Underpinned by manufacturing capability Entrenched via technical service and product development Strong branded customer base Reputation for cash generation Experienc
Slide 77: Solid Cash Generation Supports Strong Shareholder Returns
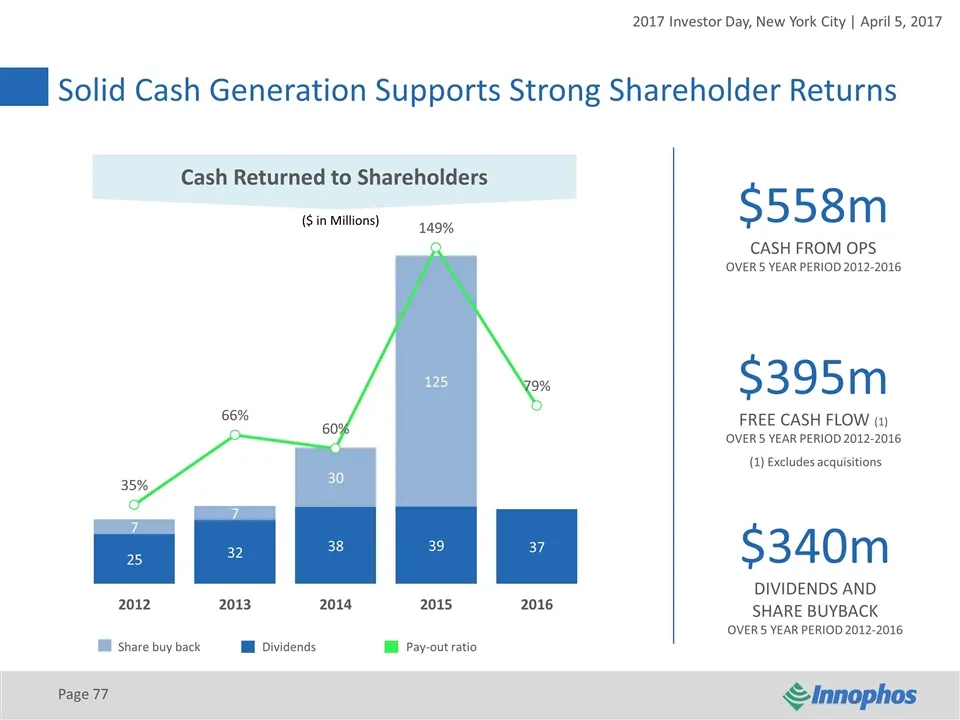
Solid Cash Generation Supports Strong Shareholder Returns Page 12 $395m FREE CASH FLOW (1) OVER 5 YEAR PERIOD 2012-2016 $340m DIVIDENDS AND SHARE BUYBACK OVER 5 YEAR PERIOD 2012-2016 Share buy backDividendsPay-out ratio (1) Excludes acquisitions $558m CASH FROM OPS OVER 5 YEAR PERIOD 2012-2016 Cash
Slide 78: Long-Term Shareholder Value Creation In A Variety of Market Conditions
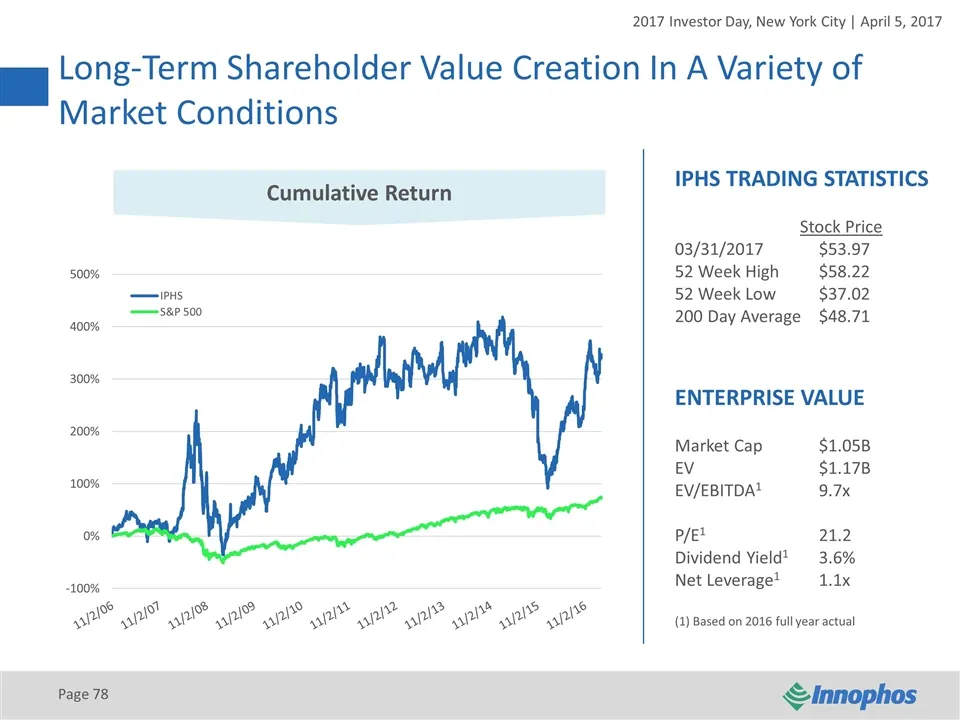
Long-Term Shareholder Value Creation In A Variety of Market Conditions Page Cumulative Return IPHS TRADING STATISTICS Stock Price 03/31/2017$53.97 52 Week High$58.22 52 Week Low$37.02 200 Day Average$48.71 ENTERPRISE VALUE Market Cap$1.05B EV$1.17B EV/EBITDA19.7x P/E121.2 Dividend Yield13.6% Net Lev
Slide 79: Macroeconomic Realities Inform Our Actions
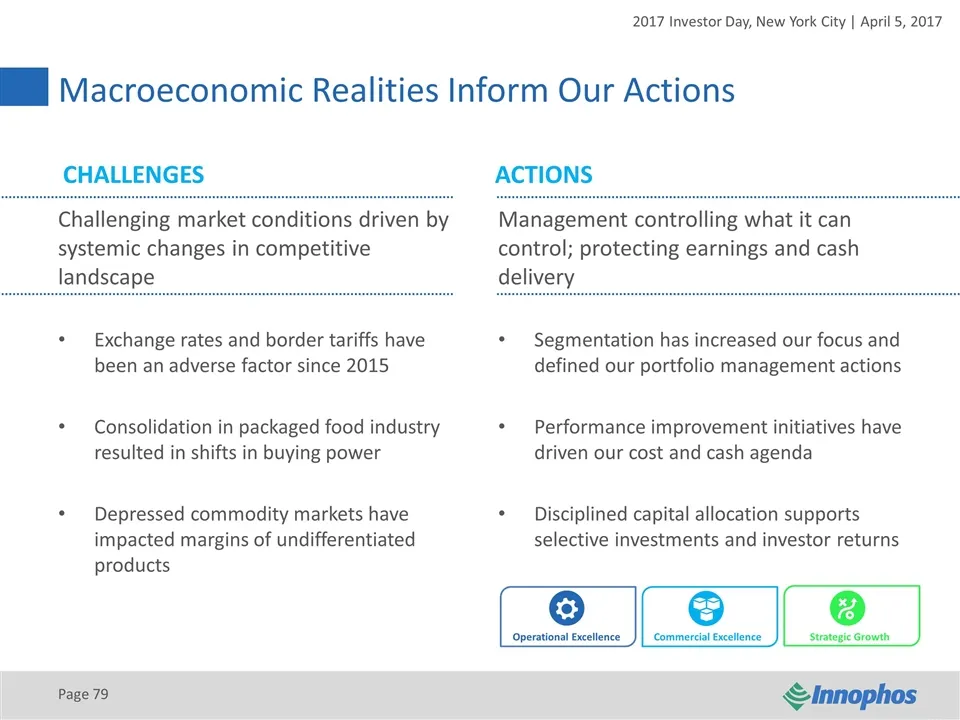
Page Macroeconomic Realities Inform Our Actions CHALLENGESACTIONS Challenging market conditions driven by systemic changes in competitive landscape Exchange rates and border tariffs have been an adverse factor since 2015 Consolidation in packaged food industry resulted in shifts in buying power Depr
Slide 80: Scorecard: 2016 Better And Stronger
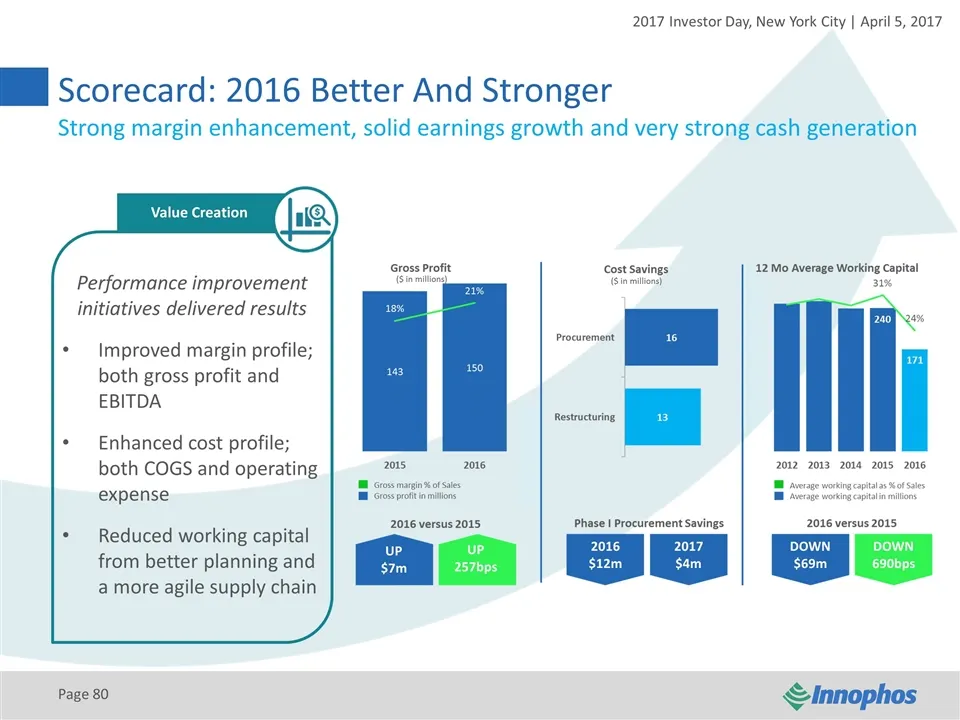
Page Scorecard: 2016 Better And Stronger Strong margin enhancement, solid earnings growth and very strong cash generation Value Creation Performance improvement initiatives delivered results Improved margin profile; both gross profit and EBITDA Enhanced cost profile; both COGS and operating expense
Slide 81: Growth Across Key Metrics Despite Topline Pressure
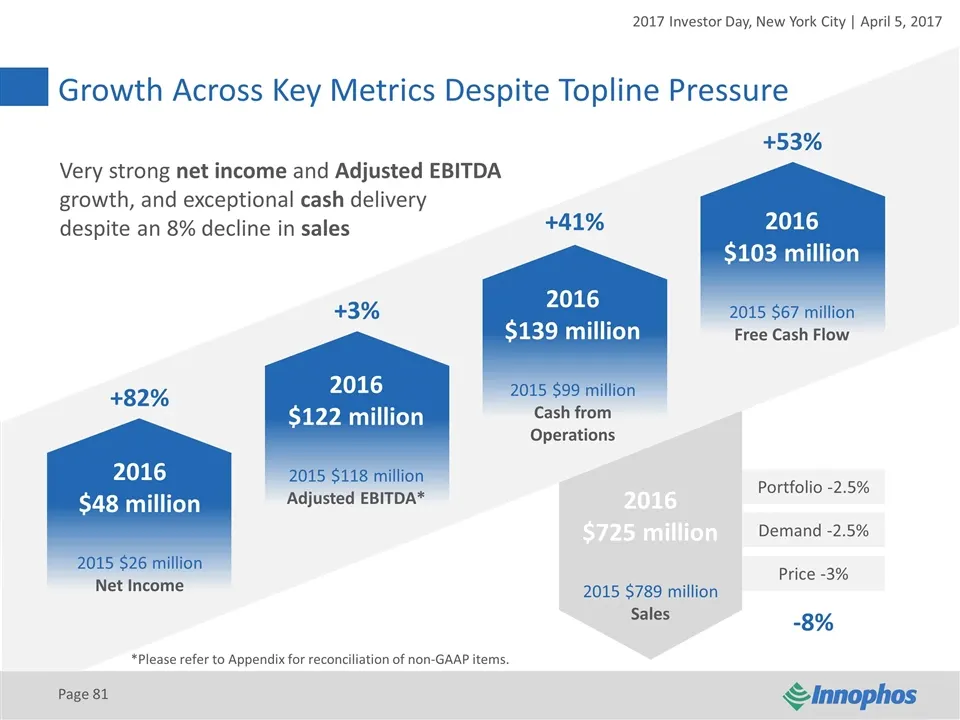
Growth Across Key Metrics Despite Topline Pressure Page 2016 $48 million 2015 $26 million Net Income 2016 $122 million 2015 $118 million Adjusted EBITDA* 2016 $139 million 2015 $99 million Cash from Operations 2016 $103 million 2015 $67 million Free Cash Flow +82% +3% +41% +53% Very strong net incom
Slide 82: Building On Success Of 2016
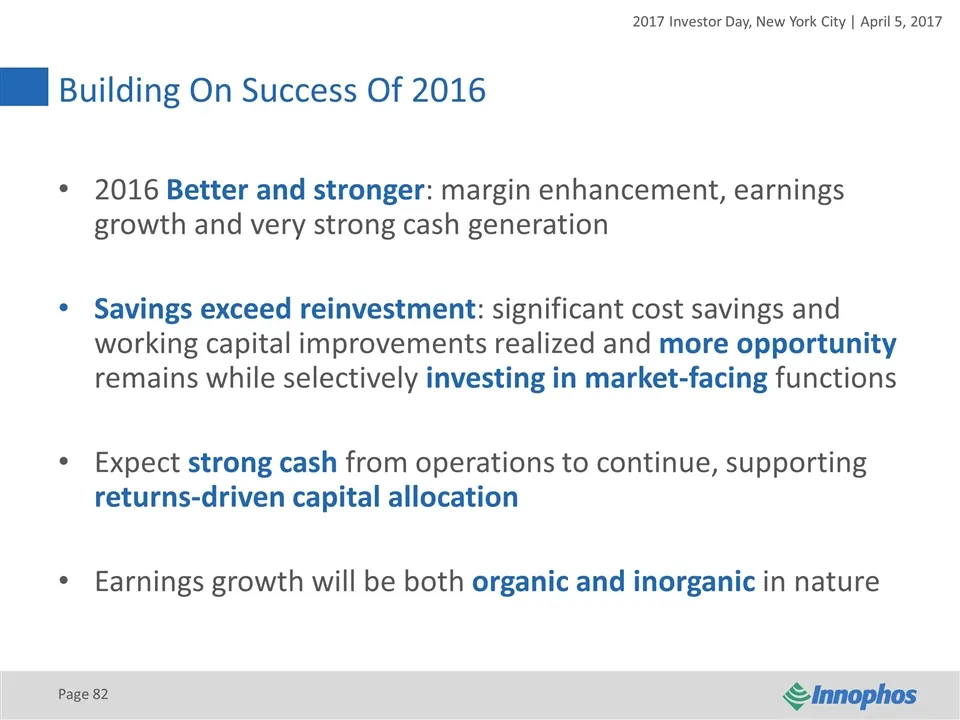
Building On Success Of 2016 Page 2016 Better and stronger: margin enhancement, earnings growth and very strong cash generation Savings exceed reinvestment: significant cost savings and working capital improvements realized and more opportunity remains while selectively investing in market-facing fun
Slide 83: 2017 Outlook
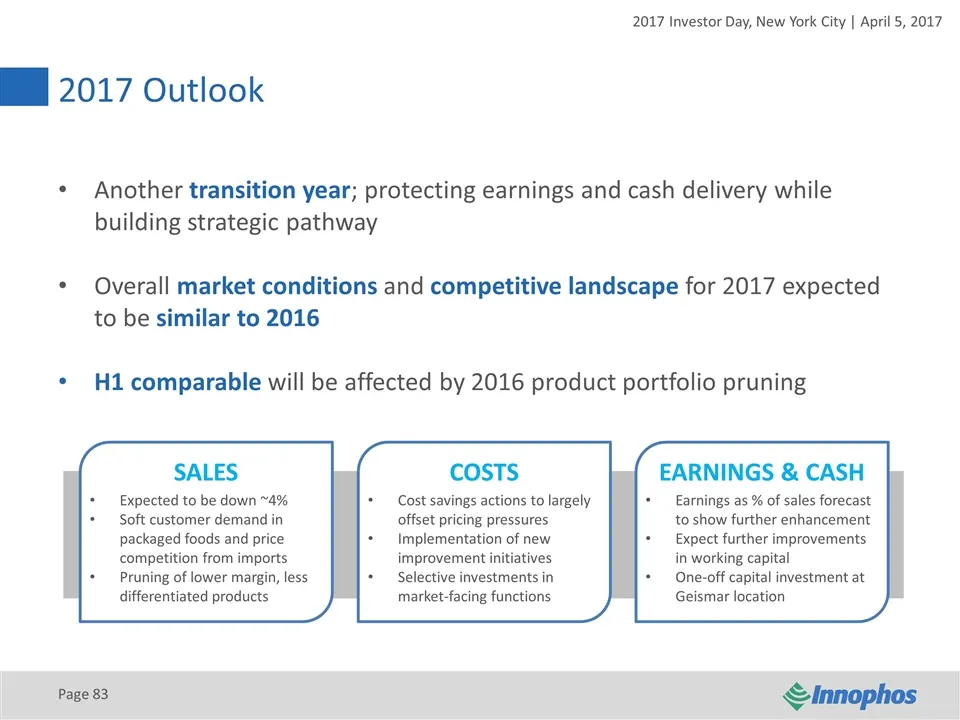
2017 Outlook Page SALES COSTS EARNINGS & CASH Expected to be down ~4% Soft customer demand in packaged foods and price competition from imports Pruning of lower margin, less differentiated products Cost savings actions to largely offset pricing pressures Implementation of new improvement initiatives
Slide 84: Q1 2017 Guidance
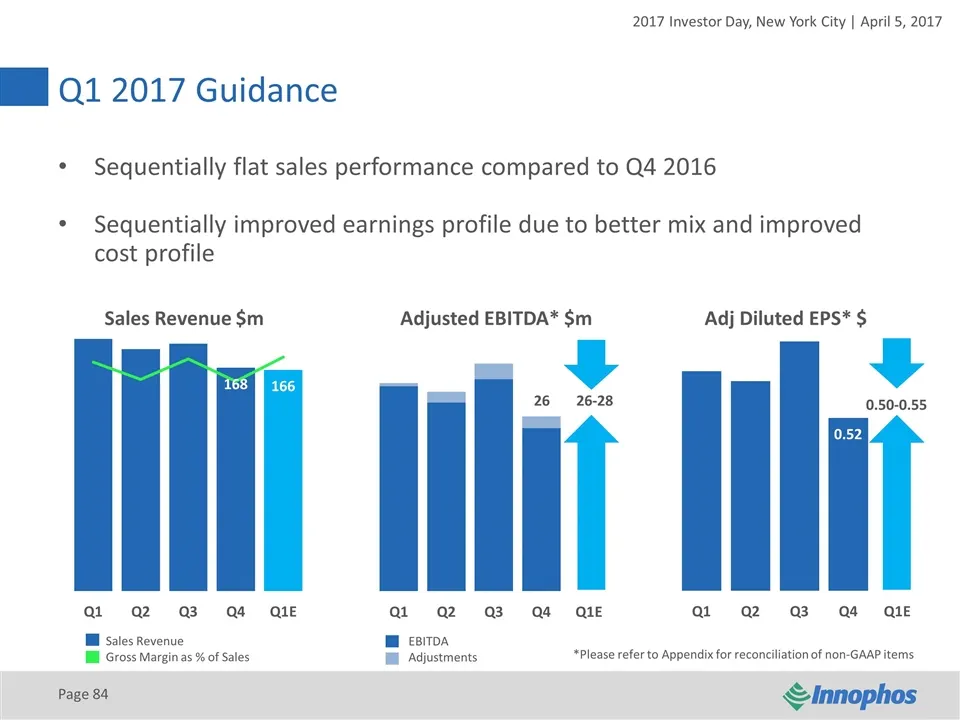
Q1 2017 Guidance Page Sales Revenue Gross Margin as % of Sales EBITDA Adjustments Sequentially flat sales performance compared to Q4 2016 Sequentially improved earnings profile due to better mix and improved cost profile 26 26-28 0.50-0.55 Sales Revenue $m Adjusted EBITDA* $m Adj Diluted EPS* $ *Ple
Slide 85: Launch Of New Reporting Segments
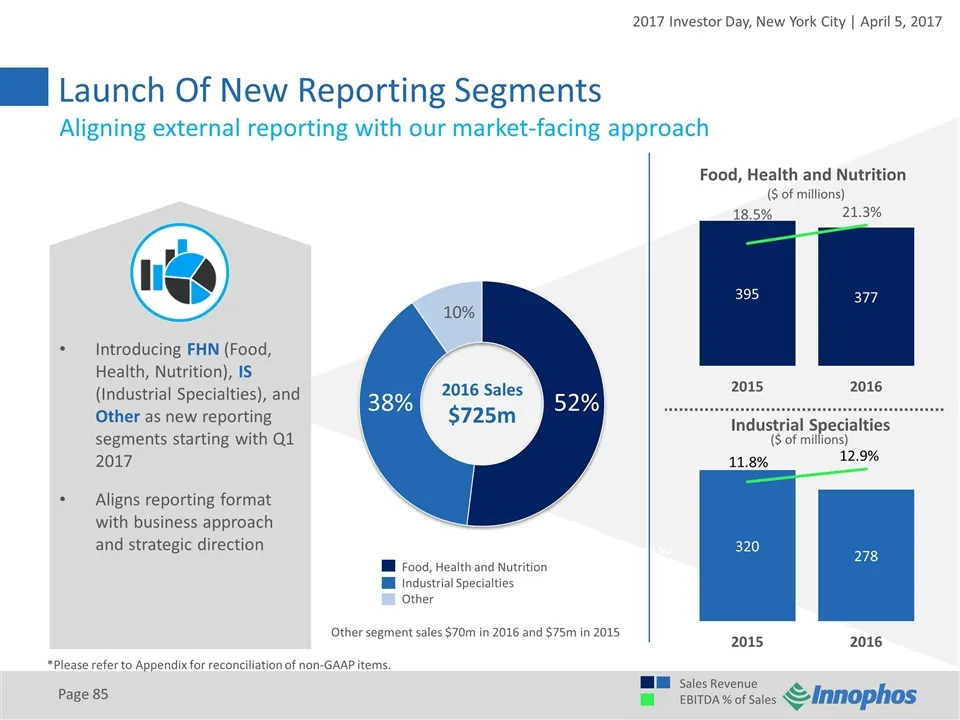
Page Introducing FHN (Food, Health, Nutrition), IS (Industrial Specialties), and Other as new reporting segments starting with Q1 2017 Aligns reporting format with business approach and strategic direction Food, Health and Nutrition Industrial Specialties Launch Of New Reporting Segments Aligning ex
Slide 86: Launch of New Reporting Segments: Correlation to Former Segments
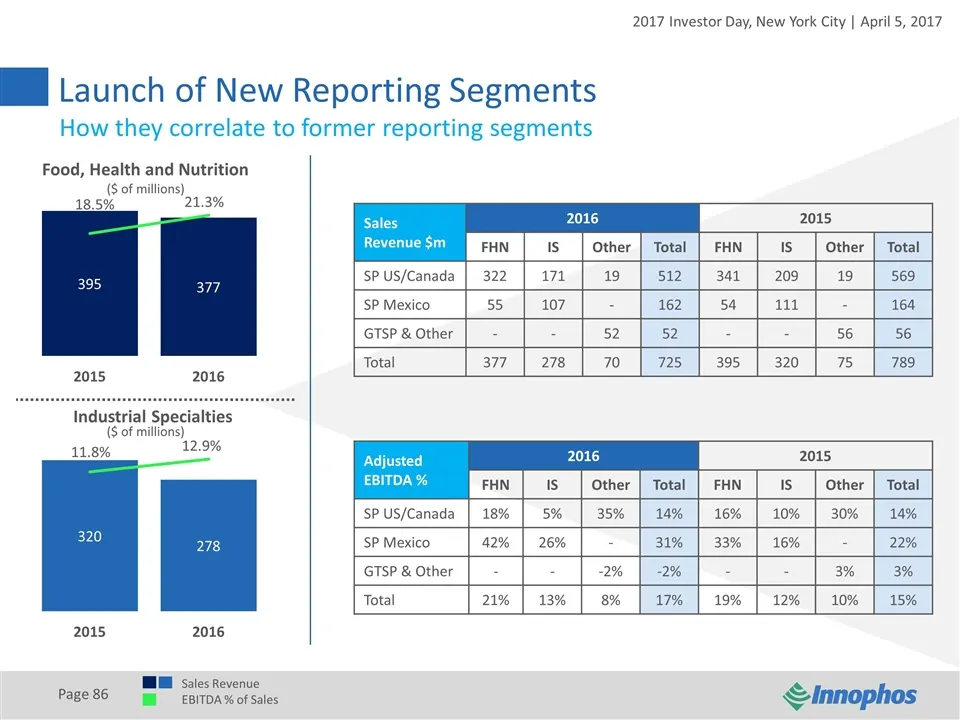
Page Launch of New Reporting Segments How they correlate to former reporting segments Food, Health and Nutrition Industrial Specialties Sales Revenue $m 2016 2015 FHN IS Other Total FHN IS Other Total SP US/Canada 322 171 19 512 341 209 19 569 SP Mexico 55 107 - 162 54 111 - 164 GTSP & Other - - 52
Slide 87: Strategic Position By Segment
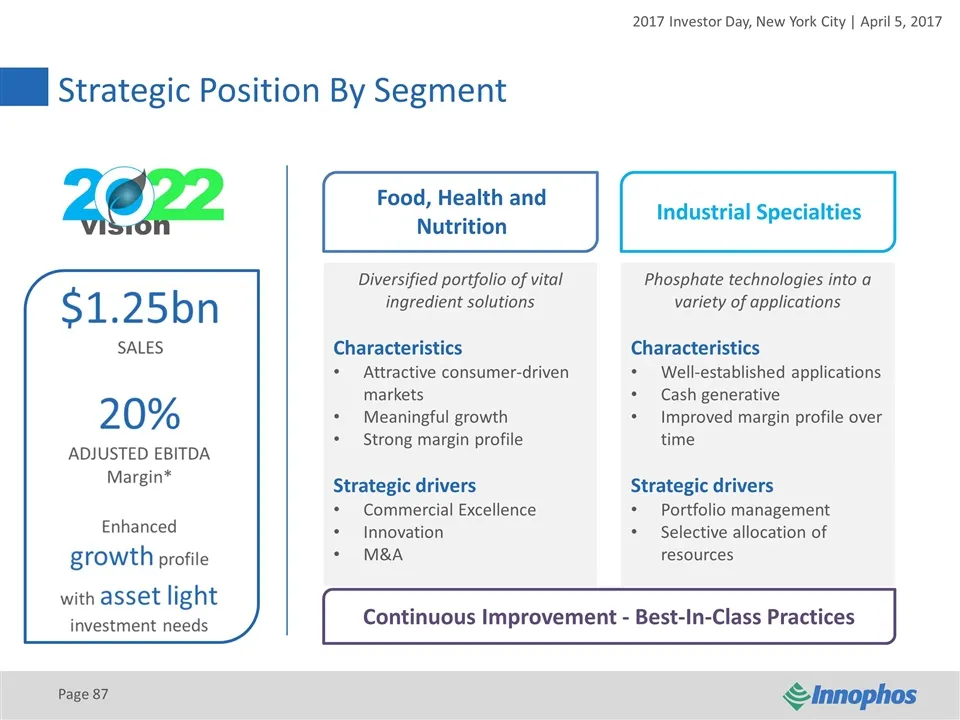
Page Strategic Position By Segment Diversified portfolio of vital ingredient solutions Characteristics Attractive consumer-driven markets Meaningful growth Strong margin profile Strategic drivers Commercial Excellence Innovation M&A Phosphate technologies into a variety of applications Characteristi
Slide 88: Strong Contributions From Excellence Initiatives
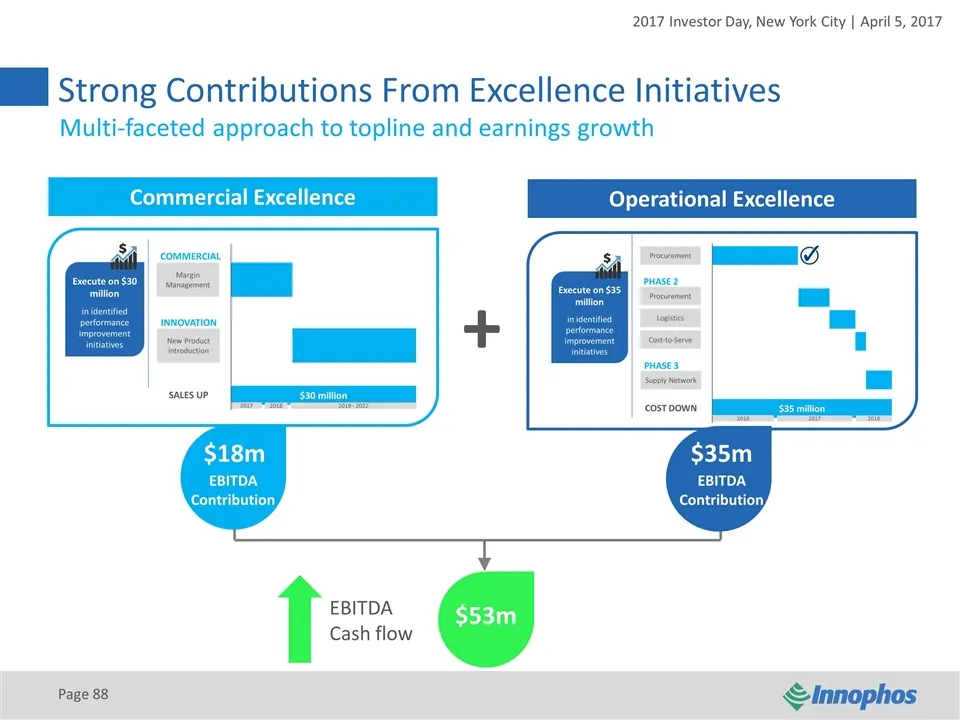
Strong Contributions From Excellence Initiatives Page Commercial Excellence Operational Excellence $35m $18m $53m EBITDA Cash flow + Multi-faceted approach to topline and earnings growth EBITDA Contribution EBITDA Contribution
Slide 89: Transforming The Growth Profile Of The Company
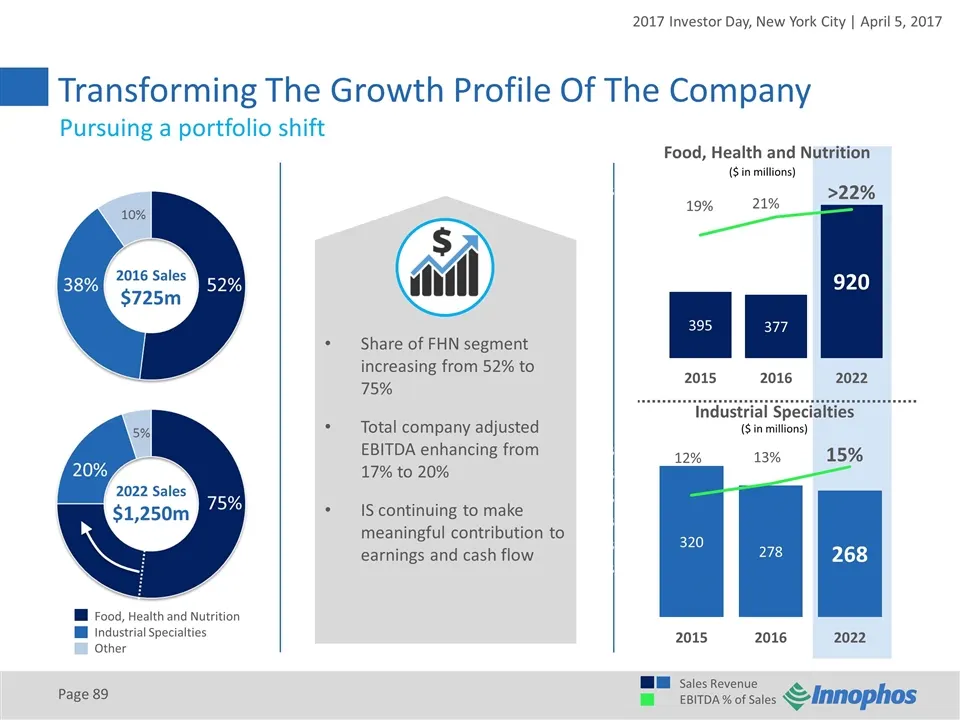
Transforming The Growth Profile Of The Company Page Food, Health and Nutrition Industrial Specialties Other 2016 Sales $725m 2022 Sales $1,250m Food, Health and Nutrition Industrial Specialties Share of FHN segment increasing from 52% to 75% Total company adjusted EBITDA enhancing from 17% to 20% IS
Slide 90: Food, Health And Nutrition
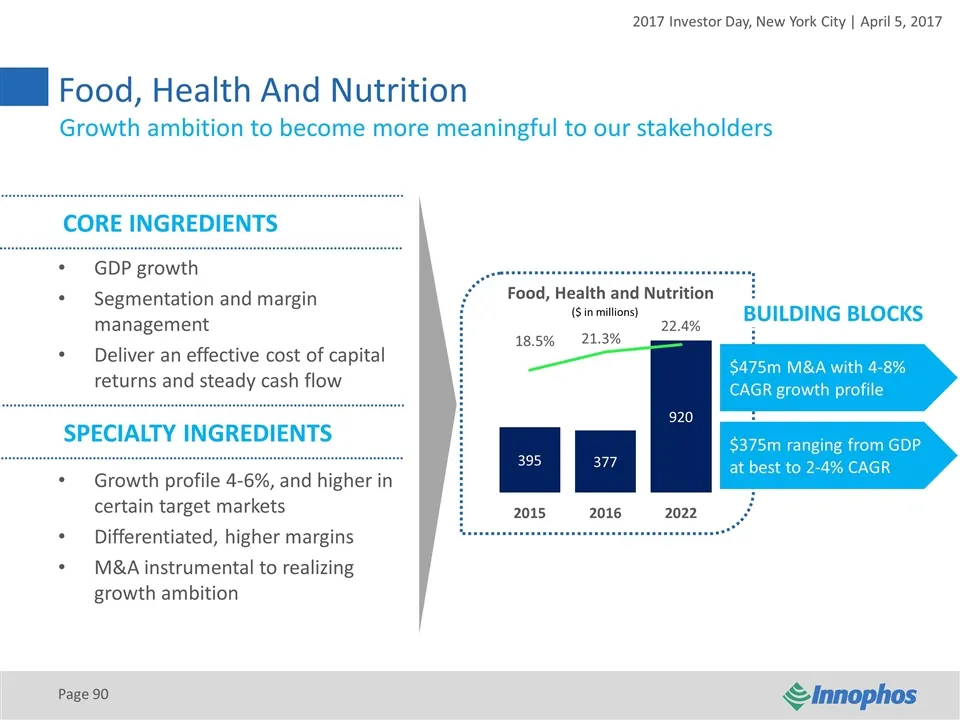
Food, Health And Nutrition Page Food, Health and Nutrition CORE INGREDIENTS GDP growth Segmentation and margin management Deliver an effective cost of capital returns and steady cash flow Growth profile 4-6%, and higher in certain target markets Differentiated, higher margins M&A instrumental to rea
Slide 91: Committed To Meaningful Growth Via M&A
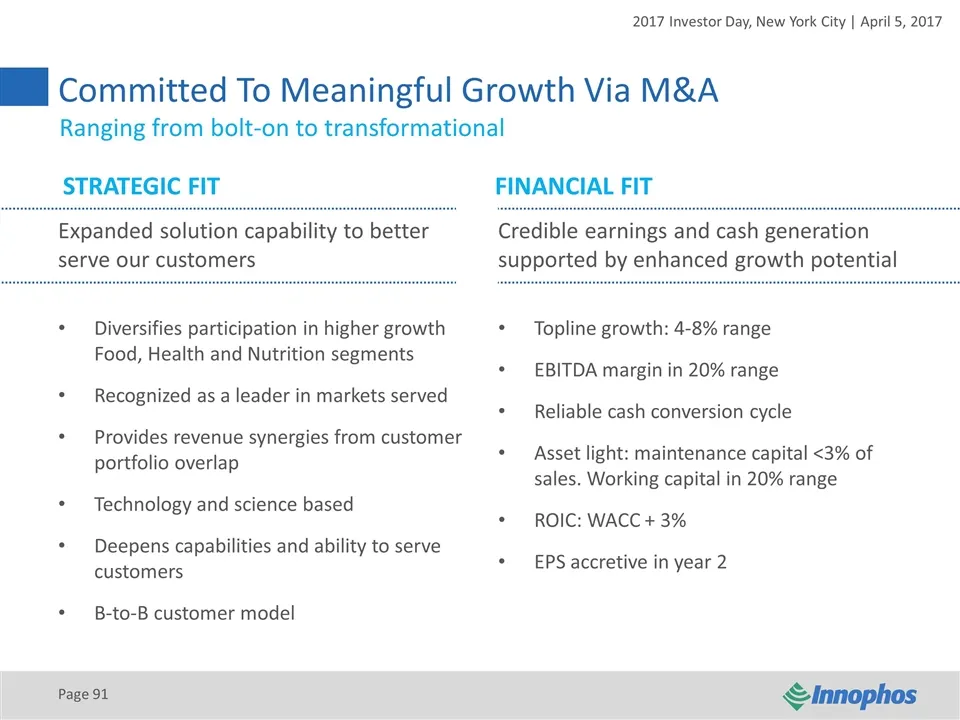
Committed To Meaningful Growth Via M&A Page STRATEGIC FITFINANCIAL FIT Expanded solution capability to better serve our customers Diversifies participation in higher growth Food, Health and Nutrition segments Recognized as a leader in markets served Provides revenue synergies from customer portfolio
Slide 92: Multi-Faceted Approach To Meaningful Growth
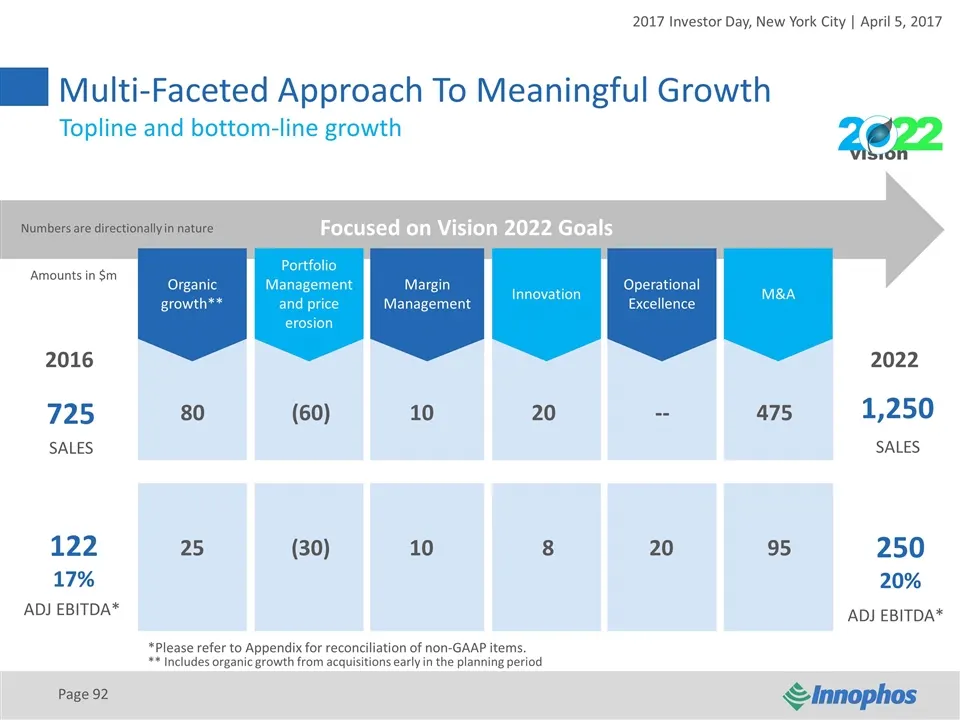
Multi-Faceted Approach To Meaningful Growth Page Portfolio Management and price erosion Organic growth** Margin Management Operational Excellence Innovation M&A Focused on Vision 2022 Goals 80(60) 1020 -- 475 25(30) 10 8 20 95 2016 2022 725 1,250 122 17% 250 20% Amounts in $m SALES ADJ EBITDA* SALES
Slide 93: Capital Allocation Priorities
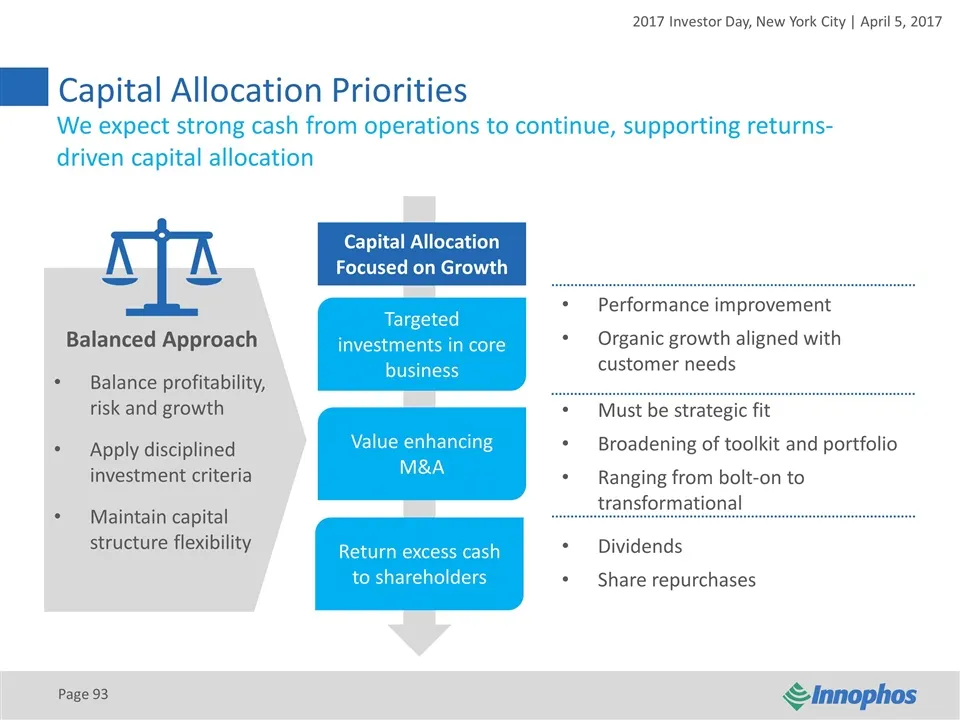
Capital Allocation Priorities Page Performance improvement Organic growth aligned with customer needs Must be strategic fit Broadening of toolkit and portfolio Ranging from bolt-on to transformational Dividends Share repurchases We expect strong cash from operations to continue, supporting returns-d
Slide 94: Attractive Long-Term Targets
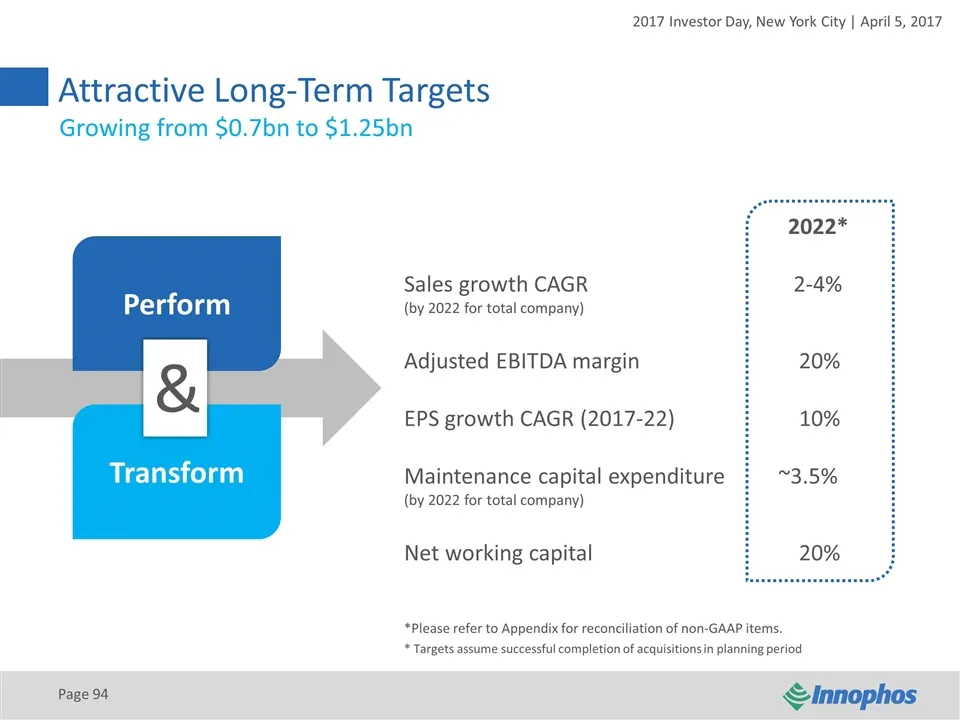
Attractive Long-Term Targets Page Perform Transform & 2022* Sales growth CAGR 2-4% (by 2022 for total company) Adjusted EBITDA margin 20% EPS growth CAGR (2017-22) 10% Maintenance capital expenditure ~3.5% (by 2022 for total company) Net working capital 20% * Targets assume successful completion of
Slide 95: Summary
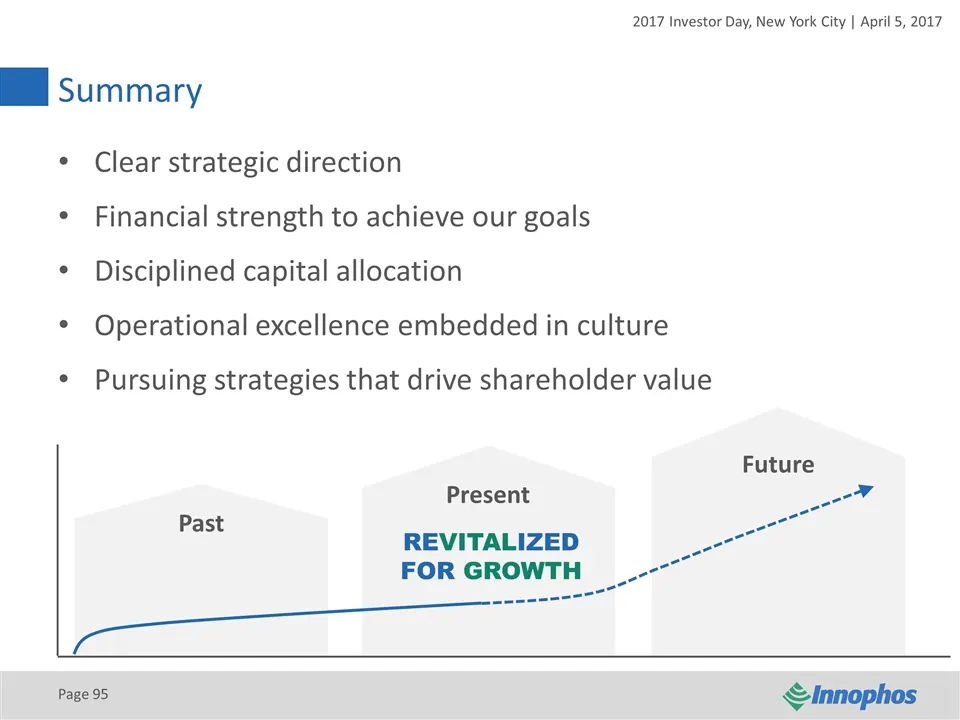
Summary Page Future Present Past Clear strategic direction Financial strength to achieve our goals Disciplined capital allocation Operational excellence embedded in culture Pursuing strategies that drive shareholder value REVITALIZED FOR GROWTH
Slide 96: Q&A
2017 INVESTOR DAY New York City | April 5, 2017 Q&A Page

Slide 97: Closing Comments
©Innophos MI Closing Comments Page 97
Slide 98: Strategic Evolution of Innophos
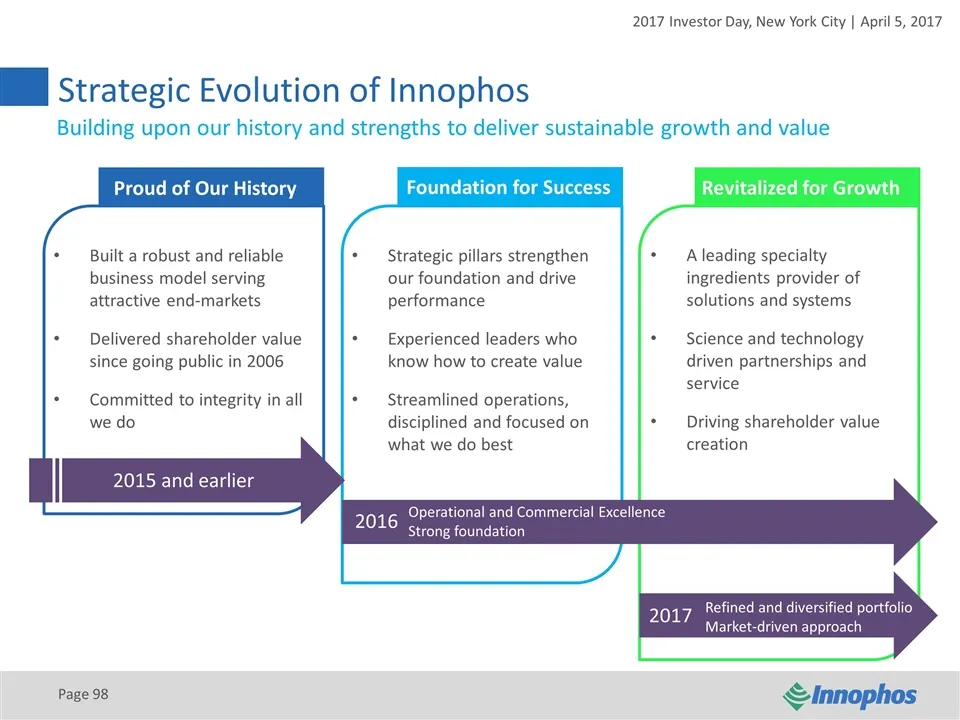
Strategic Evolution of Innophos Page Proud of Our History Foundation for Success Revitalized for Growth Built a robust and reliable business model serving attractive end-markets Delivered shareholder value since going public in 2006 Committed to integrity in all we do Strategic pillars strengthen ou
Slide 99: Sustainable leadership position in specialty functional ingredients markets
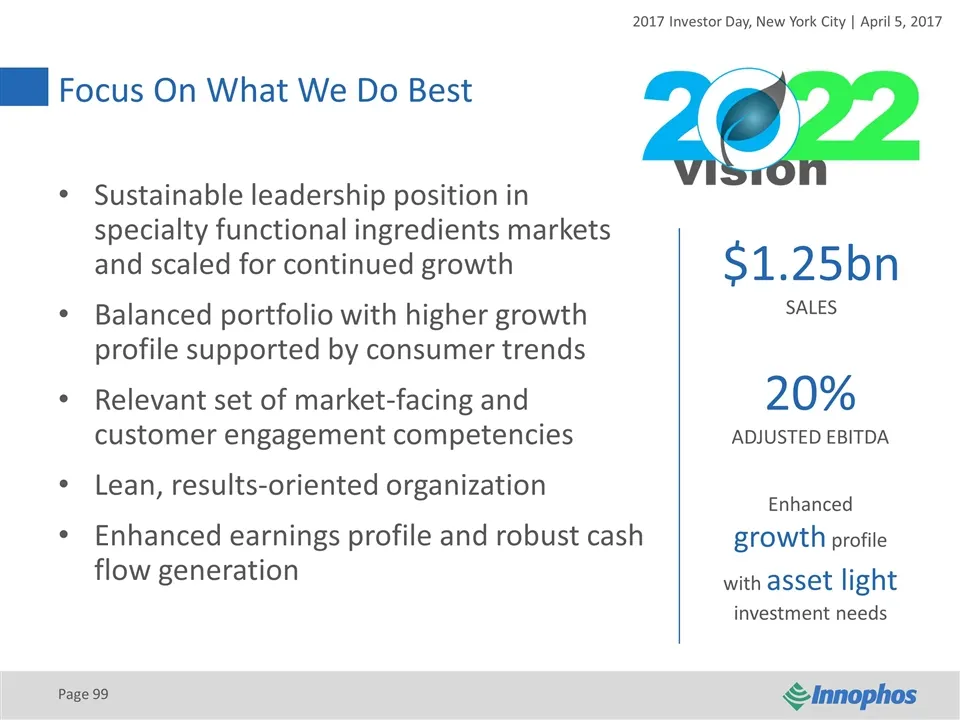
Sustainable leadership position in specialty functional ingredients markets and scaled for continued growth Balanced portfolio with higher growth profile supported by consumer trends Relevant set of market-facing and customer engagement competencies Lean, results-oriented organization Enhanced earni
Slide 100: 2017 Investor Day
2017 INVESTOR DAY New York City | April 5, 2017 Page
Slide 101: Appendix
2017 INVESTOR DAY New York City | April 5, 2017 Appendix Page
Slide 102: Non-GAAP Reconciliations
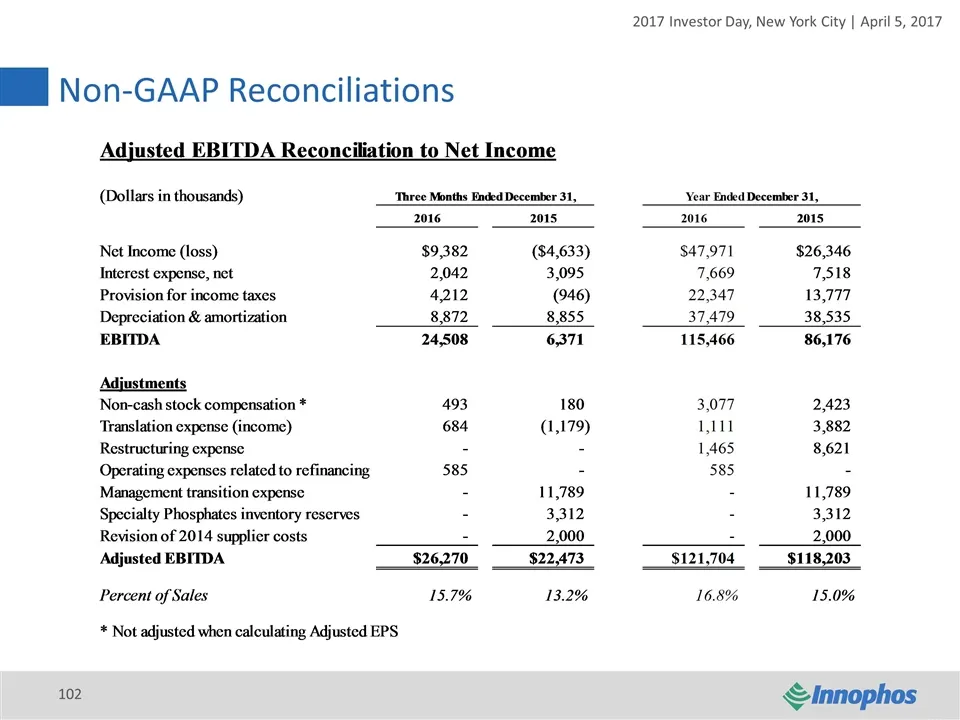
2017 Investor Day, New York City | April 5, 2017 BB Non-GAAP Reconciliations justed EBITDA Reconciliation to Net Income 2016 2015 2016 2015 Net Income (loss) $9,382 ($4,633) $47,971 $26,346 Interest expense, net 2,042 3,095 7,669 7518 Provision for income taxes 4212 (946) 22,347 13,777 Depreciati iz
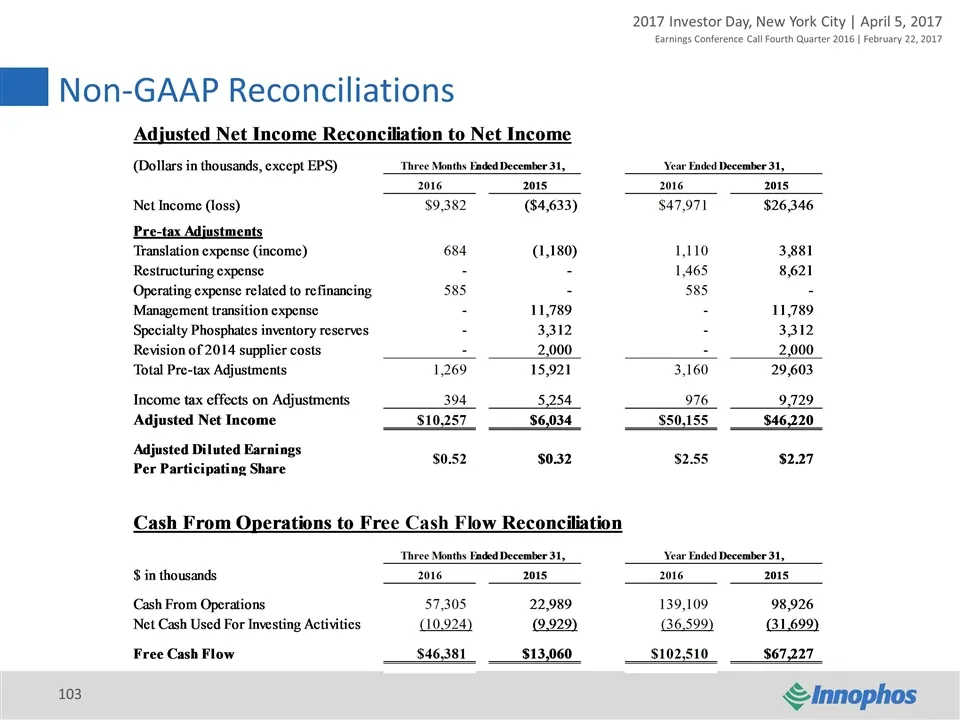
Slide 103: Non-GAAP Reconciliations
Non-GAAP Reconciliations Earnings Conference Call Fourth Quarter 2016 | February 22, 2017
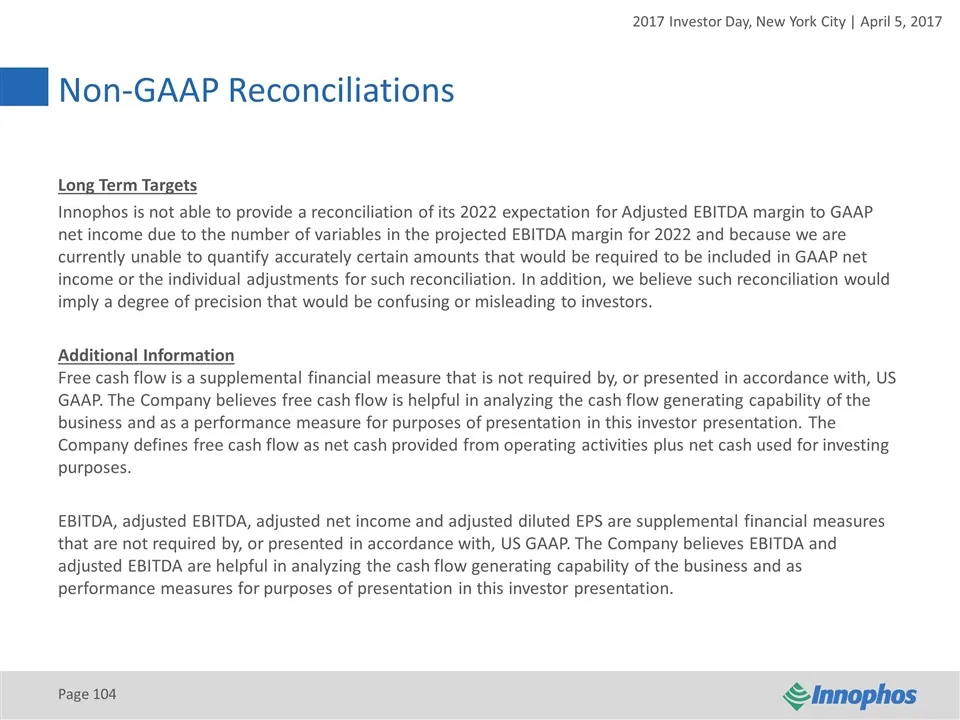
Slide 104: Non-GAAP Reconciliations Long Term Targets
Non-GAAP Reconciliations Long Term Targets Innophos is not able to provide a reconciliation of its 2022 expectation for Adjusted EBITDA margin to GAAP net income due to the number of variables in the projected EBITDA margin for 2022 and because we are currently unable to quantify accurately certain
Slide 105: About The Company
ABOUT THE COMPANY Innophos (NASDAQ: IPHS) is a leading international producer of specialty ingredient solutions that deliver far-reaching, versatile benefits for the food, health, nutrition and industrial markets. We leverage our expertise in the science and technology of blending and formulating ph
Source: SEC EDGAR · 8-K filed Apr 5, 2017
More decks from Innophos Holdings Inc
 Merger or Acquisition (August 2017)22 slides · Aug 1, 2017
 Seventeenth Annual Institutional Investor Forum (March 2013)18 slides · Mar 18, 2013
 CJS Securities 12th Annual New Ideas For The New Year Conference (January 2012)18 slides · Jan 11, 2012
 Investor Day (November 2011)96 slides · Nov 8, 2011
 Annual Industrials Conference 201122 slides · Sep 26, 2011
 March Industrial Investor Conferences 201019 slides · Mar 23, 2010