MainSource Financial Group Inc
MainSource Financial — Shareholder Meeting (May 2017)
67 slides from MainSource Financial's shareholder meeting presentation, May 3, 2017
Slide 1: Welcome 2017 Annual Meeting of Shareholders
Welcome 2017 Annual Meeting of Shareholders Archie M. Brown, Jr., Chairman
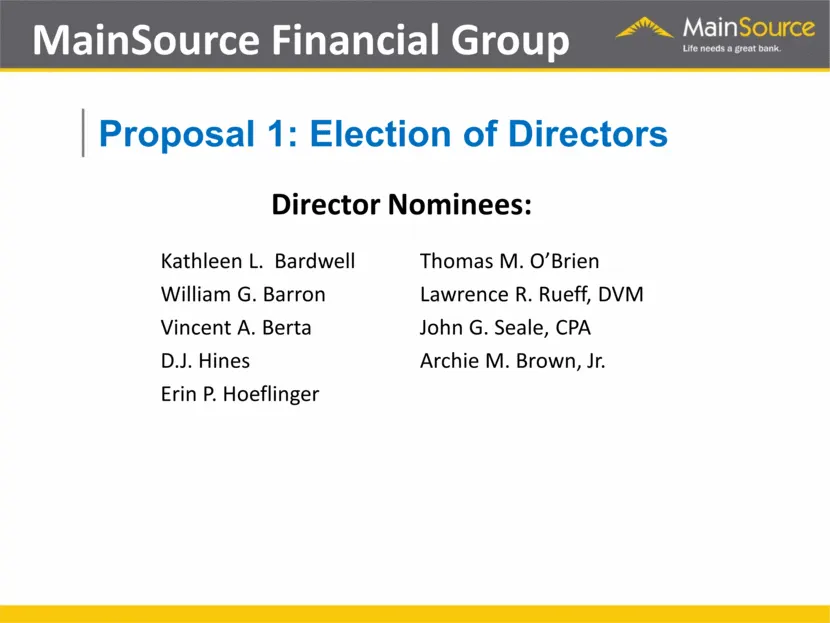
Slide 2: Proposal 1: Election of Directors
Kathleen L. Bardwell William G. Barron Vincent A. Berta D.J. Hines Erin P. Hoeflinger MainSource Financial Group Proposal 1: Election of Directors Thomas M. O’Brien Lawrence R. Rueff, DVM John G. Seale, CPA Archie M. Brown, Jr. Director Nominees:
Slide 3: Advisory Vote on Executive Compensation Policies and Procedures
Advisory Vote on Executive Compensation Policies and Procedures
Slide 4: Proposal 2: Advisory Vote on Executive Compensation
Advisory Vote on Executive Compensation “Say on Pay” proposal Vote is advisory in nature – not binding MSFG Executive Compensation Committee believes its practices are conservative, but will take shareholder vote into consideration in its compensation programs. Proposal 2:
Slide 5: Ratification of Independent Auditors
Ratification of Independent Auditors
Slide 6: Proposal 3: Ratification of Independent Auditors
Ratification of Independent Auditors Ratification of Crowe Horwath LLP as the Company’s independent public accounting firm. Proposal 3:
Slide 7: Proposal 3: Ratification of Crowe Horwath LLP
| Proposal 3: + Ratification of Crowe Horwath LLP as the Company’s independent public accounting firm.
Slide 8: Executive Officers
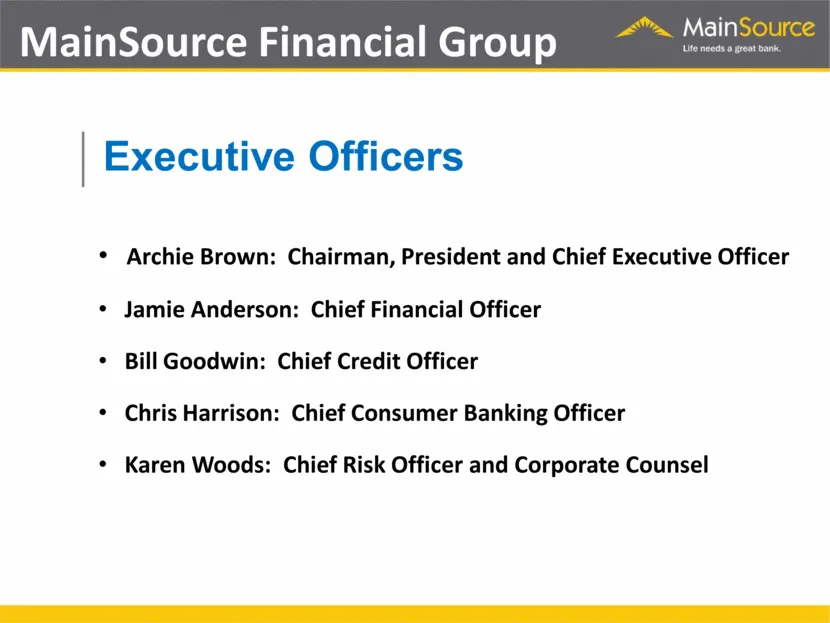
MainSource Financial Group Archie Brown: Chairman, President and Chief Executive Officer Jamie Anderson: Chief Financial Officer Bill Goodwin: Chief Credit Officer Chris Harrison: Chief Consumer Banking Officer Karen Woods: Chief Risk Officer and Corporate Counsel Executive Officers
Slide 9: Executive Officers
MainSource Financial Group Executive Officers ¢ Archie Brown: Chairman, President and Chief Executive Officer + Jamie Anderson: Chief Financial Officer * Bill Goodwin: Chief Credit Officer * Chris Harrison: Chief Consumer Banking Officer * Karen Woods: Chief Risk Officer and Corporate Counsel
Slide 10: Official Business Meeting Concluded
Official Business Meeting Concluded
Slide 11: 2016 Financial Performance
2016 Financial Performance Jamie Anderson Chief Financial Officer
Slide 12: Disclosure Regarding Forward Looking Statements
Disclosure Regarding Forward Looking Statements This presentation may include comments or information that constitute forward-looking statements (within the meaning of the Private Securities Litigation Reform Act of 1995) based on current expectations that involve a number of risks and uncertainties
Slide 13: 2016 Accomplishments
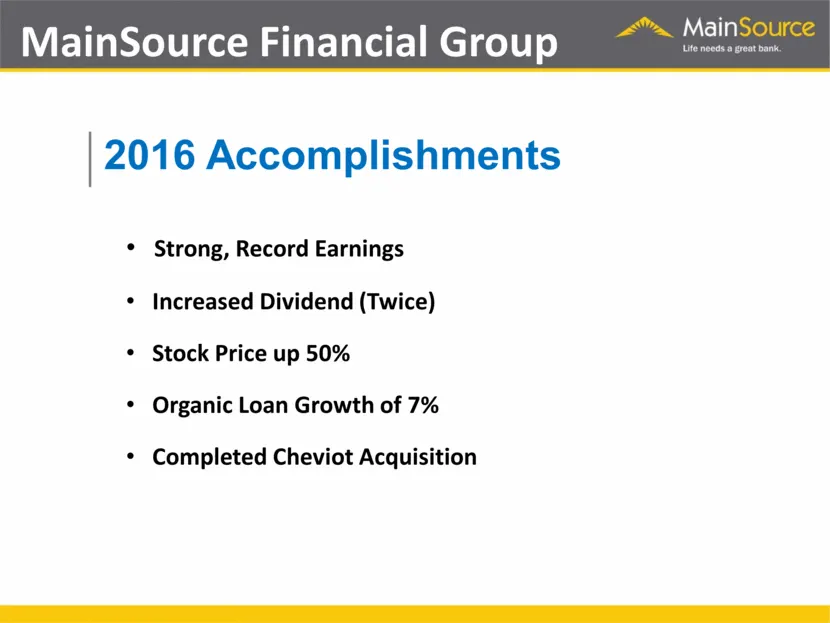
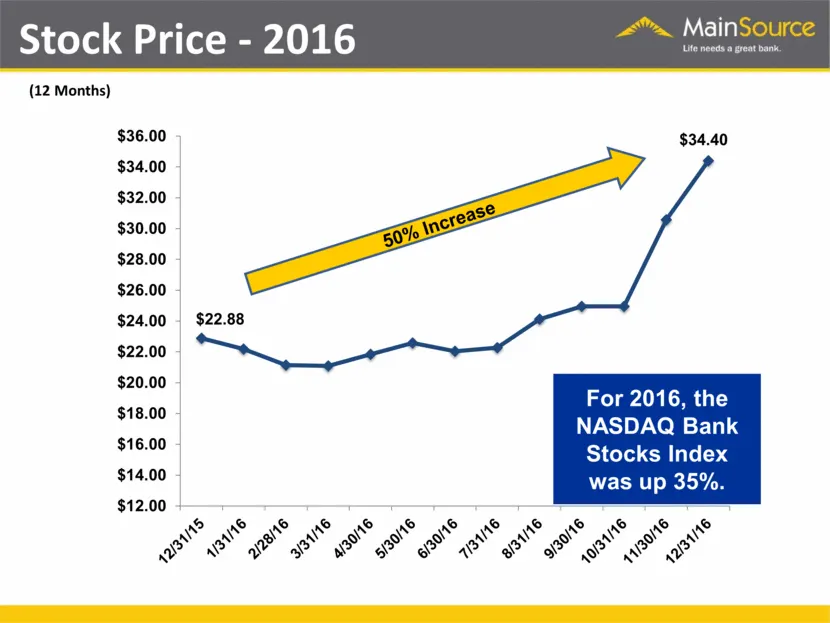
MainSource Financial Group Strong, Record Earnings Increased Dividend (Twice) Stock Price up 50% Organic Loan Growth of 7% Completed Cheviot Acquisition 2016 Accomplishments
Slide 14: 2016 Accomplishments
MainSource Financial Group 2016 Accomplishments * Strong, Record Earnings * Increased Dividend (Twice) * Stock Price up 50% * Organic Loan Growth of 7% * Completed Cheviot Acquisition
Slide 15: Total Assets
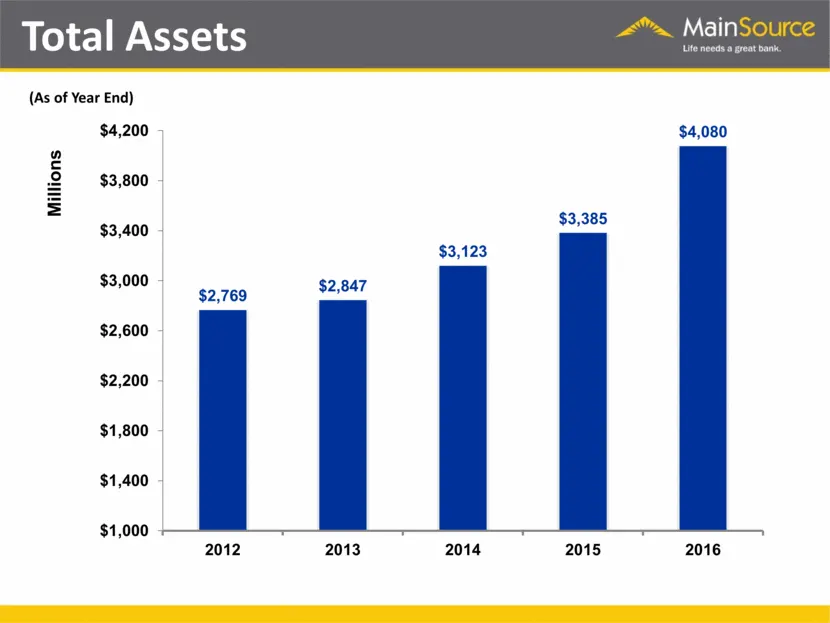
Total Assets (As of Year End) $ 2,769 $2,847 $3,123 $3,385 $4,080 $1,000 $1,400 $1,800 $2,200 $2,600 $3,000 $3,400 $3,800 $4,200 2012 2013 2014 2015 2016 Millions
Slide 16: Total Loans
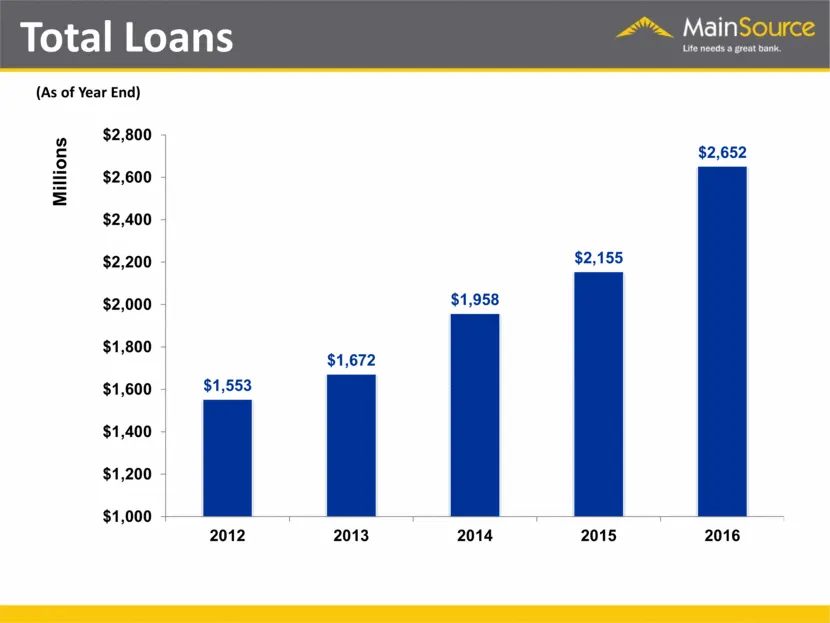
Total Loans (As of Year End) $1,553 $1,672 $1,958 $2,155 $2,652 $1,000 $1,200 $1,400 $1,600 $1,800 $2,000 $2,200 $2,400 $2,600 $2,800 2012 2013 2014 2015 2016 Millions
Slide 17: Mortgage Loans Serviced
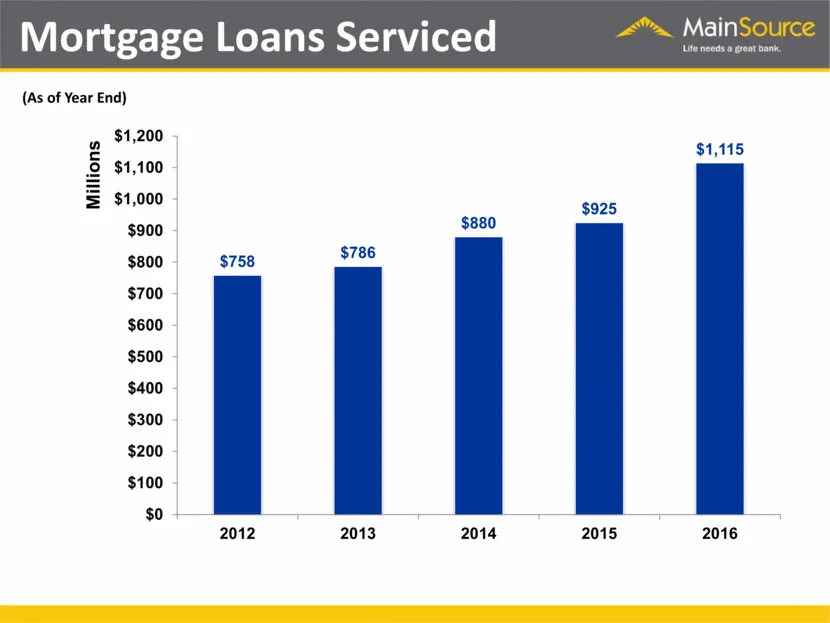
Mortgage Loans Serviced (As of Year End) $758 $786 $880 $925 $1,115 $0 $100 $200 $300 $400 $500 $600 $700 $800 $900 $1,000 $1,100 $1,200 2012 2013 2014 2015 2016 Millions
Slide 18: Total Deposits
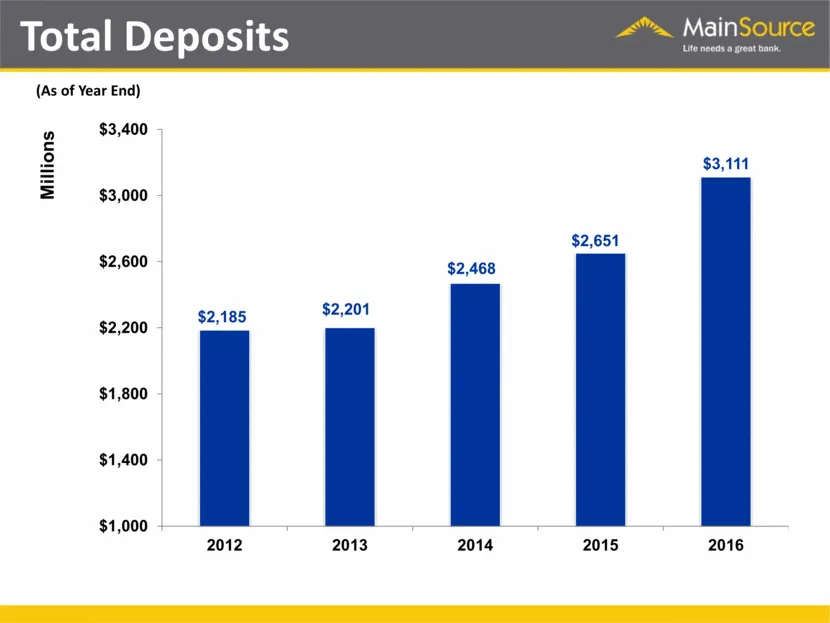
Total Deposits (As of Year End) $3,111 $2,185 $2,201 $2,468 $2,651 $1,000 $1,400 $1,800 $2,200 $2,600 $3,000 $3,400 2012 2013 2014 2015 2016 Millions
Slide 19: Total Deposits - Mix
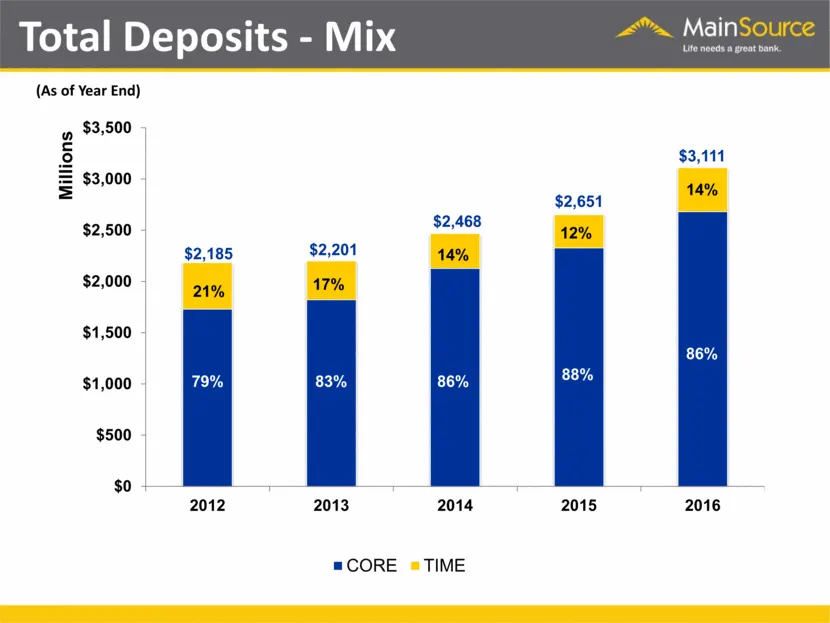
Total Deposits - Mix (As of Year End) 14% 21% 17% 14% $2,651 $3,111 $2,185 $2,201 $2,468 $0 $500 $1,000 $1,500 $2,000 $2,500 $3,000 $3,500 2012 2013 2014 2015 2016 Millions CORE TIME 86% 79% 83% 86% 88% 12%
Slide 20: Non-interest Bearing DDA
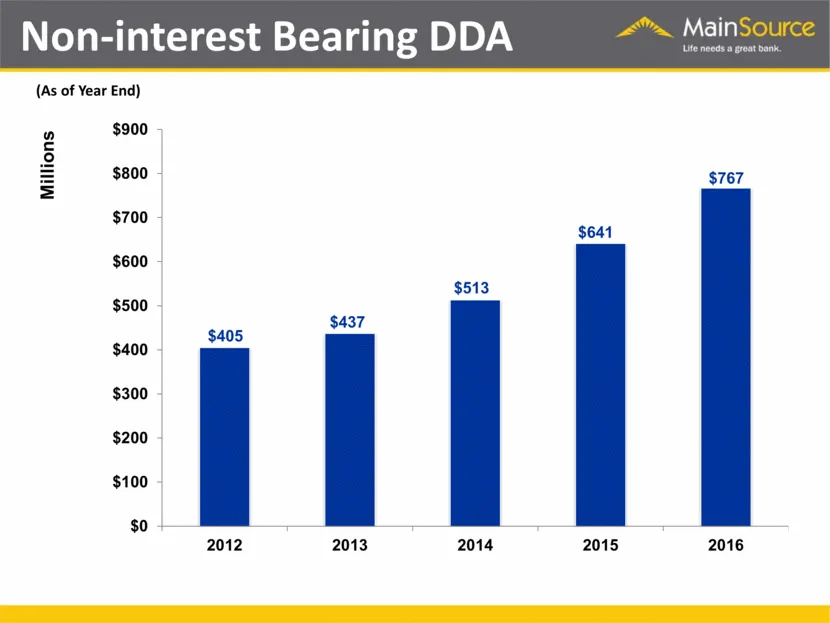
Non-interest Bearing DDA (As of Year End) $767 $405 $437 $513 $641 $0 $100 $200 $300 $400 $500 $600 $700 $800 $900 2012 2013 2014 2015 2016 Millions
Slide 21: Strong Regulatory Capital
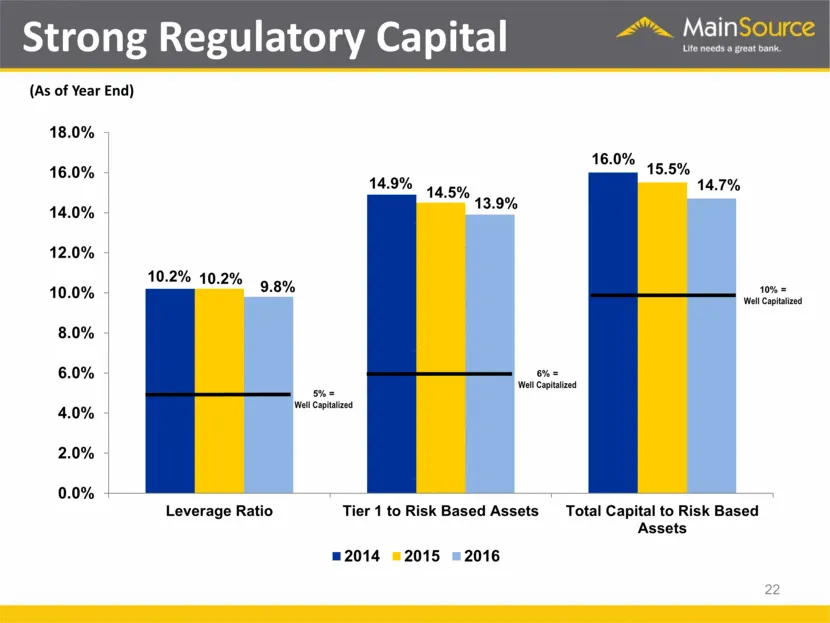
5% = Well Capitalized 6% = Well Capitalized 10% = Well Capitalized Strong Regulatory Capital 22 (As of Year End) 10.2% 14.9% 16.0% 10.2% 14.5% 15.5% 9.8% 13.9% 14.7% 0.0% 2.0% 4.0% 6.0% 8.0% 10.0% 12.0% 14.0% 16.0% 18.0% Leverage Ratio Tier 1 to Risk Based Assets Total Capital to Risk Based Assets 2
Slide 22: Tangible Book Value per Share
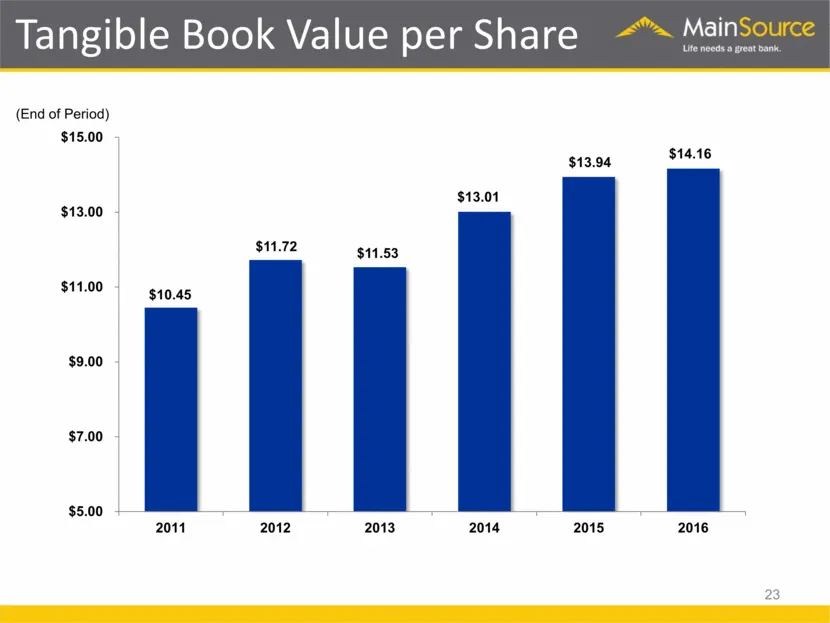
Tangible Book Value per Share 23 (End of Period)
Slide 23: Tangible Book Value per Share
Tangible Book Value per Share ~~ Mainsource (End of Period) $15.00 $13.94 siti $ $13.01 13.00 CUE $11.53 Mi) $10.45 $9.00 $7.00 $5.00 2011 2012 2013 2014 2015 2016
Slide 24: Net Operating Income
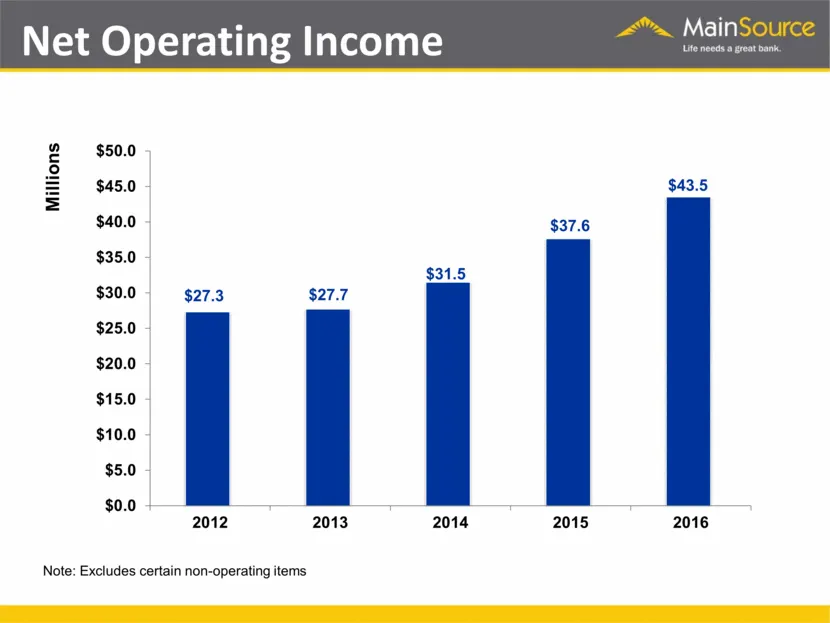
Net Operating Income Note: Excludes certain non-operating items $31.5 $37.6 $43.5 $27.3 $27.7 $0.0 $5.0 $10.0 $15.0 $20.0 $25.0 $30.0 $35.0 $40.0 $45.0 $50.0 2012 2013 2014 2015 2016 Millions
Slide 25: Operating Earnings Per Share
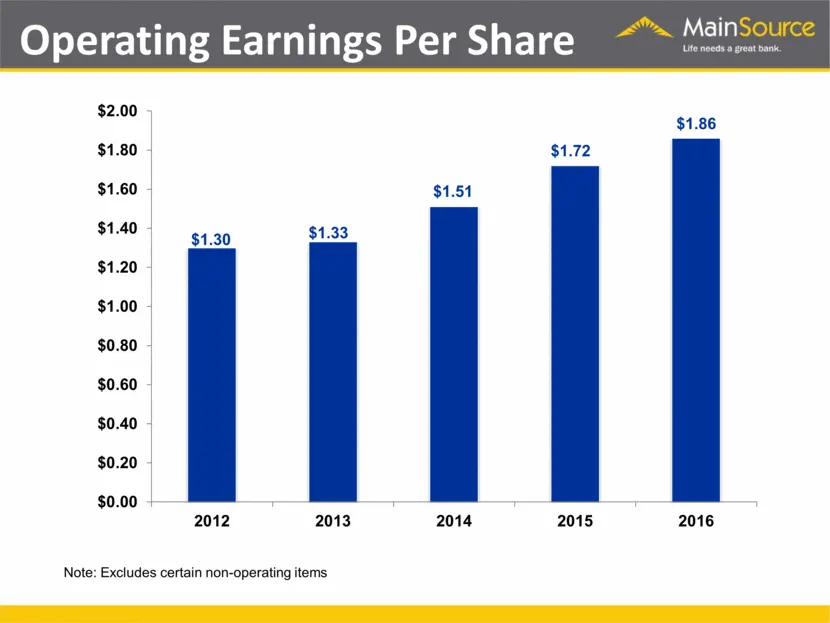
Operating Earnings Per Share Note: Excludes certain non-operating items
Slide 26: Non Performing Loans
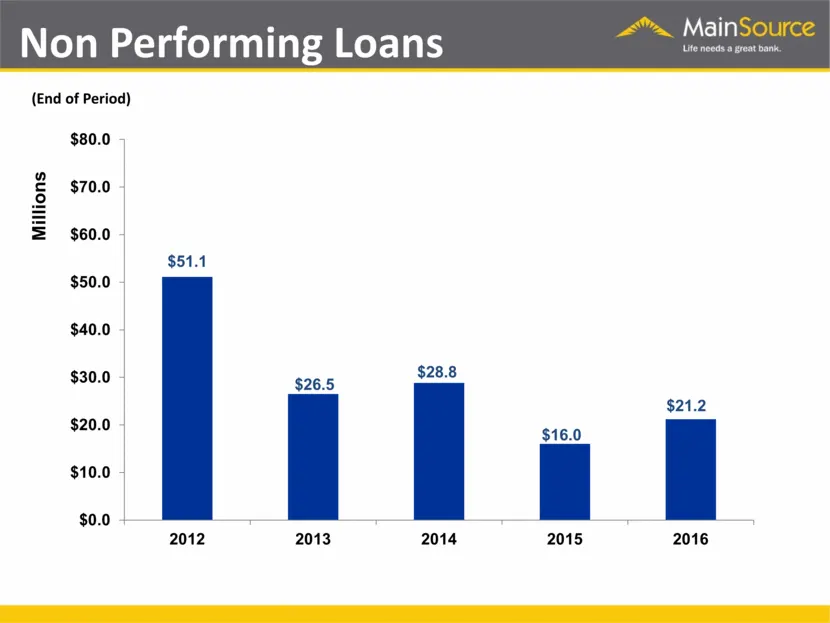
Non Performing Loans Millions (End of Period)
Slide 27: Non Performing Loans
n Performi (End of Period) $80.0 5 $70.0 © $60.0 | $50.0 — $40.0 — $30.0 — $20.0 — $10.0 $0.0 +
Slide 28: New Non-Accrual Loans
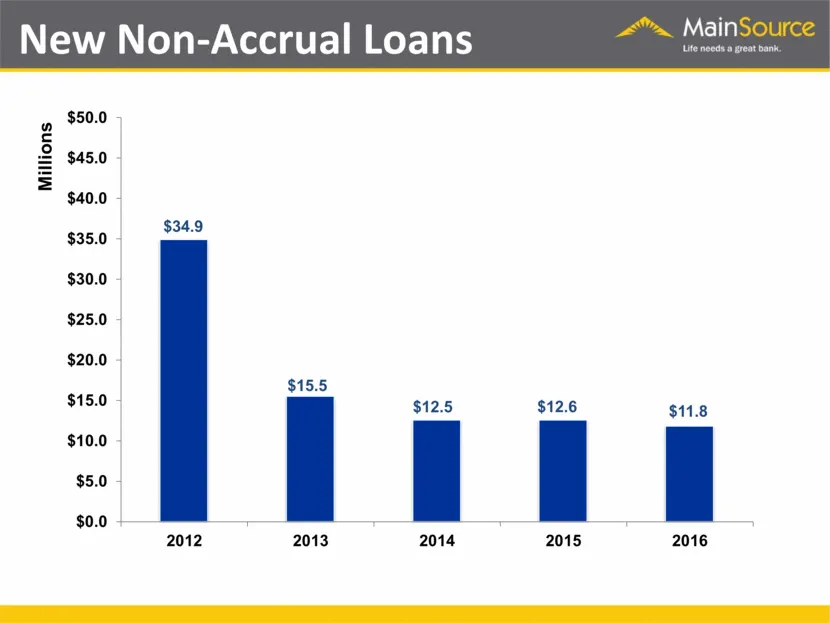
ew Non-Accrual Loans $50.0 5 $45.0 Millions $40.0 — $35.0 $34.9 $30.0 $25.0 $20.0 $15.0 © $10.0 $5.0 $0.0 2012 2013 2014 2015 2016
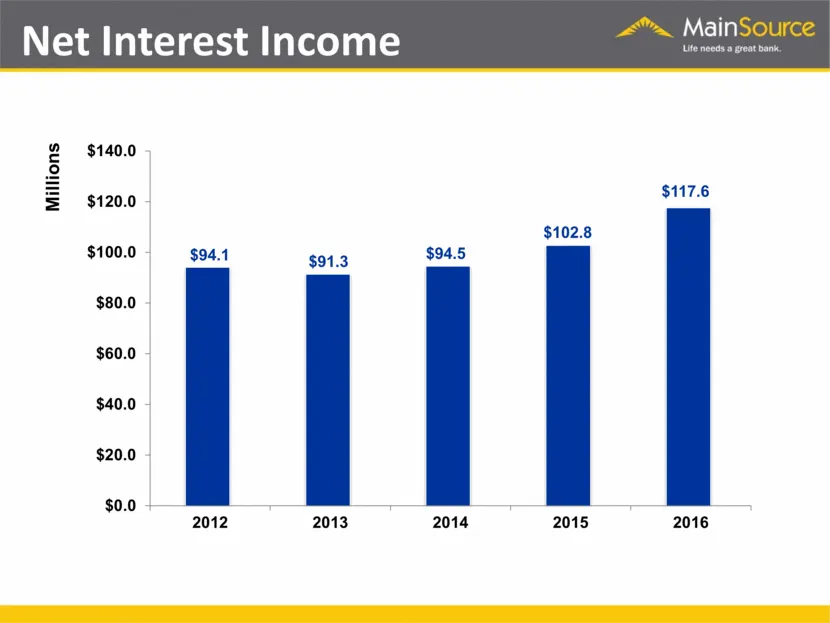
Slide 29: Net Interest Income
Net Interest Income $94.5 $102.8 $117.6 $94.1 $91.3 $0.0 $20.0 $40.0 $60.0 $80.0 $100.0 $120.0 $140.0 2012 2013 2014 2015 2016 Millions
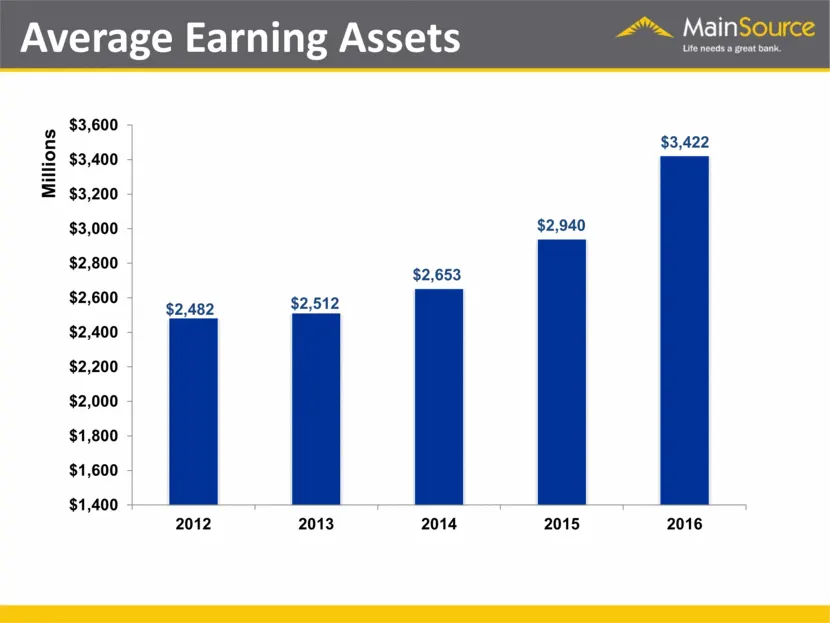
Slide 30: Average Earning Assets
Average Earning Assets Millions
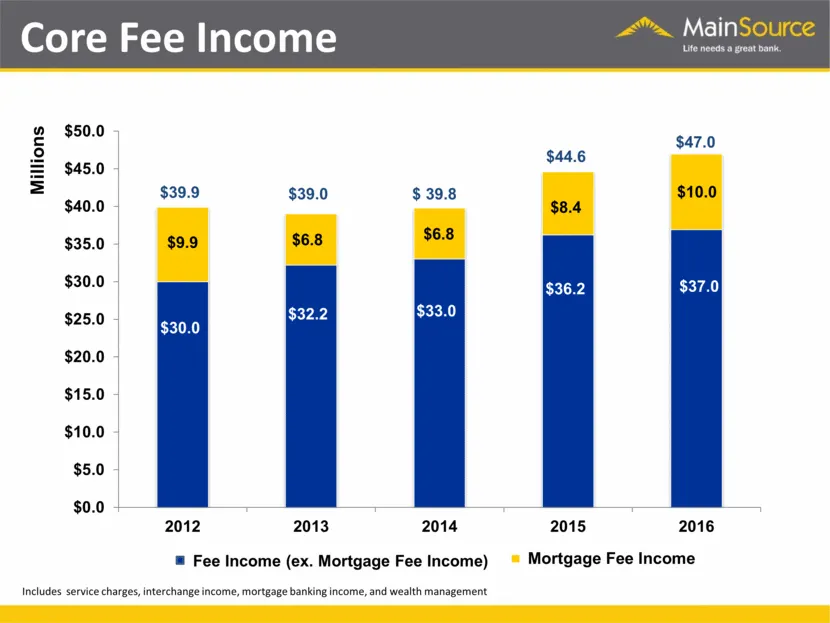
Slide 31: Core Fee Income
Core Fee Income Includes service charges, interchange income, mortgage banking income, and wealth management $8.4 $9.9 $6.8 $37.0 $30.0 $32.2
Slide 32: Stable Operating Expenses
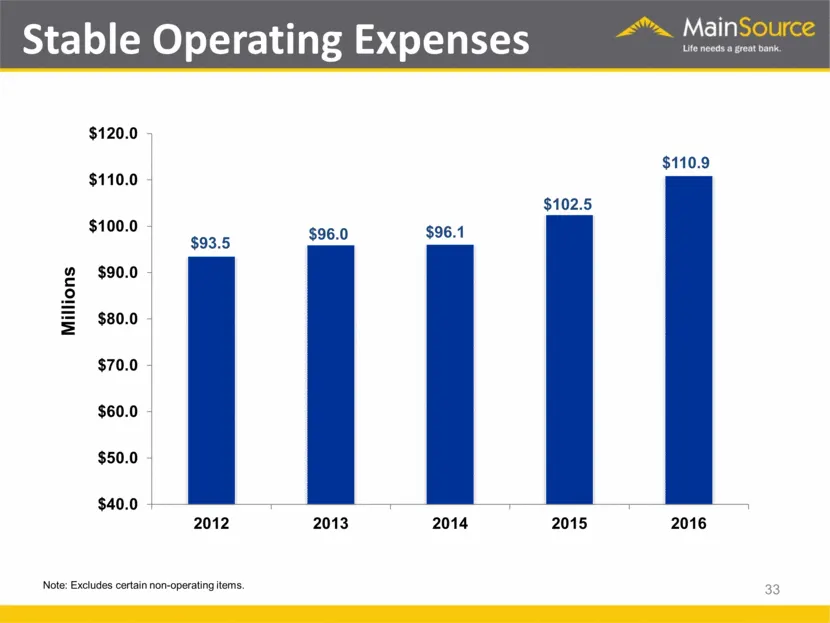
Stable Operating Expenses Millions 33 Note: Excludes certain non-operating items.
Slide 33: Stable Operating Expenses as a % of Average Assets
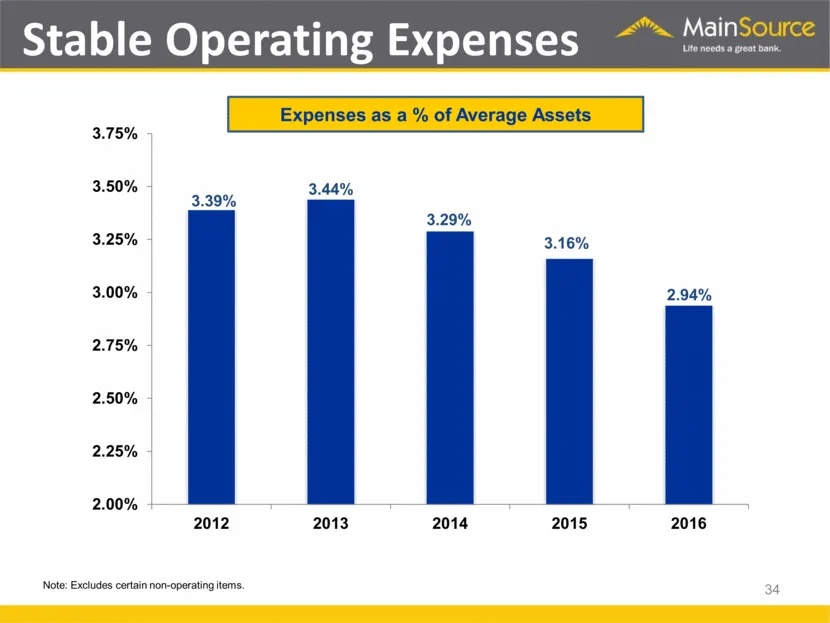
Stable Operating Expenses 34 Expenses as a % of Average Assets Note: Excludes certain non-operating items.
Slide 34: MainSource Financial Group NASDAQ Stock Symbol MSFG
MainSource Financial Group NASDAQ Stock Symbol MSFG
Slide 35: MainSource Financial Group NASDAQ Stock Symbol MSFG
MainSource Financial Group NASDAQ Stock Symbol MSFG
Slide 36: Stock Price - 2016
Stock Price - 2016 50% Increase For 2016, the NASDAQ Bank Stocks Index was up 35%. (12 Months)
Slide 37: Post-Election Increase in Financial Stocks – Why?
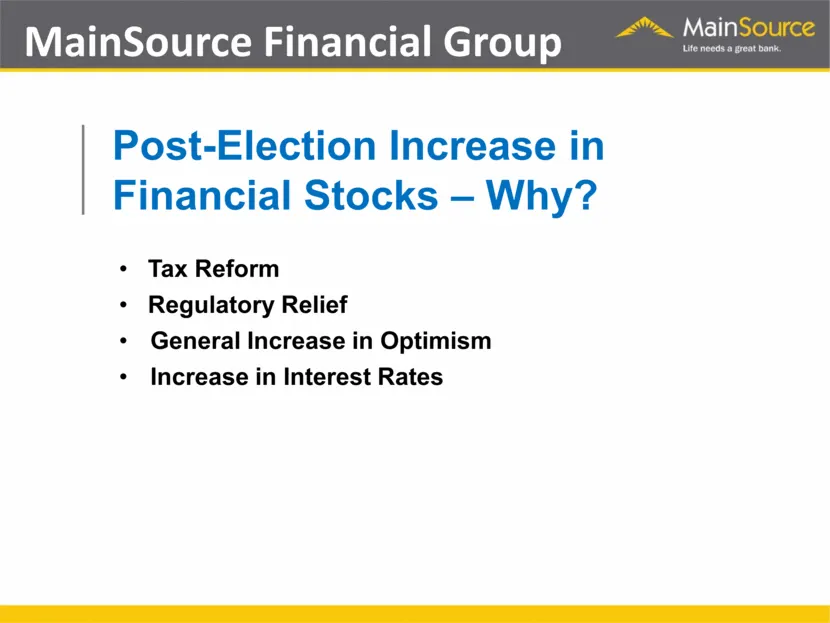
MainSource Financial Group Post-Election Increase in Financial Stocks – Why? Tax Reform Regulatory Relief General Increase in Optimism Increase in Interest Rates
Slide 38: Stock Performance – MSFG vs. NASDAQ Bank Index
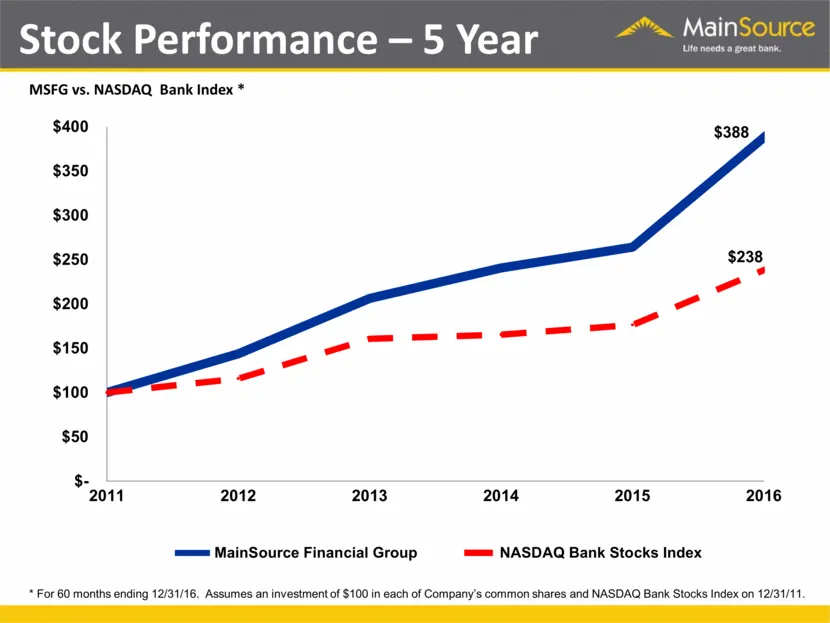
Stock Performance – 5 Year MSFG vs. NASDAQ Bank Index * * For 60 months ending 12/31/16. Assumes an investment of $100 in each of Company’s common shares and NASDAQ Bank Stocks Index on 12/31/11.
Slide 39: Regional Stock Performance
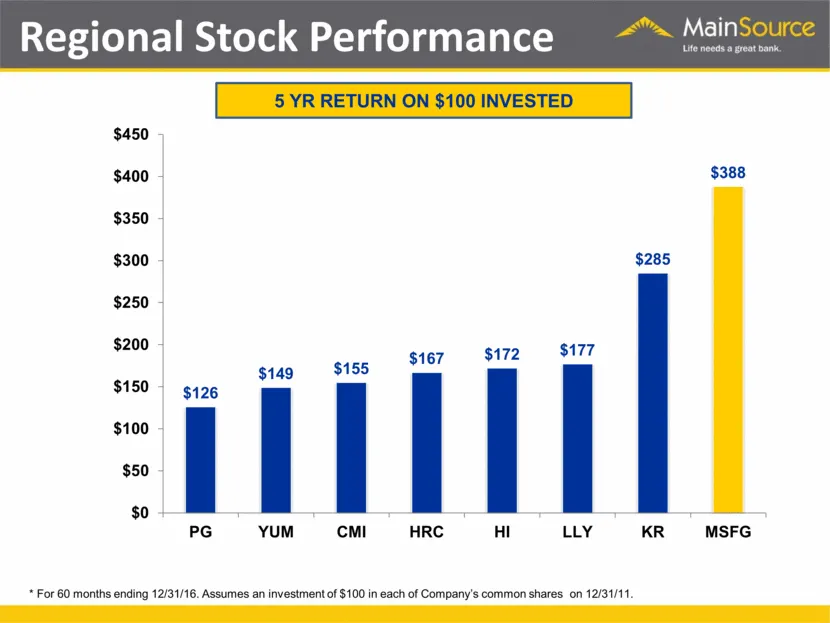
Regional Stock Performance * For 60 months ending 12/31/16. Assumes an investment of $100 in each of Company’s common shares on 12/31/11. 5 YR RETURN ON $100 INVESTED $126 $149 $155 $167 $172 $177 $285 $388 $0 $50 $100 $150 $200 $250 $300 $350 $400 $450 PG YUM CMI HRC HI LLY KR MSFG
Slide 40: Regional Stock Performance
Regional Stock Pe $450 $400 $388 $350 $300 $285 $250 $200 gir 8172.17 $149 $155 $150 s476 $100 $50 $0 PG = =YUM CMI HRC HI LLY KR -MSFG * For 60 months ending 12/31/16. Assumes an investment of $100 in each of Company's common shares on 12/31/11
Slide 41: First Quarter 2017 Operating Highlights
MainSource Financial Group First Quarter 2017 Operating Highlights Earnings of $12.1 million $0.49 EPS vs. consensus of $0.45 Excellent Credit Quality Metrics Strong Capital Ratios Improvement in Net Interest Margin
Slide 42: 2017 Outlook
2017 Outlook Archie M. Brown, Jr. Chief Executive Officer
Slide 43: Growth in GDP
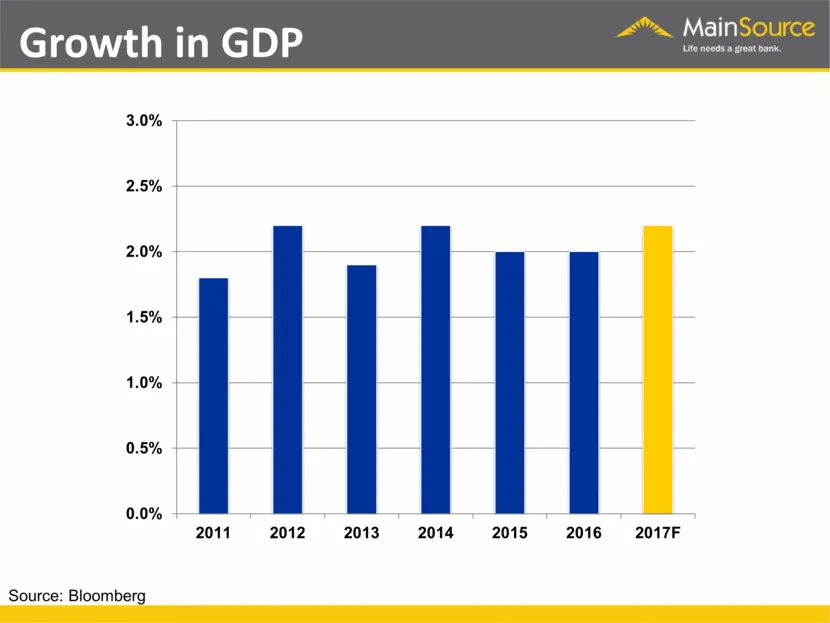
Growth in GDP Source: Bloomberg
Slide 44: Growth in GDP
3.0% 9 2.5% — 2.0% | 1.5% — 1.0% — 0.5% | 0.0% | r 2011 2012 2013 2014 2015 2016 2017F Source: Bloomberg
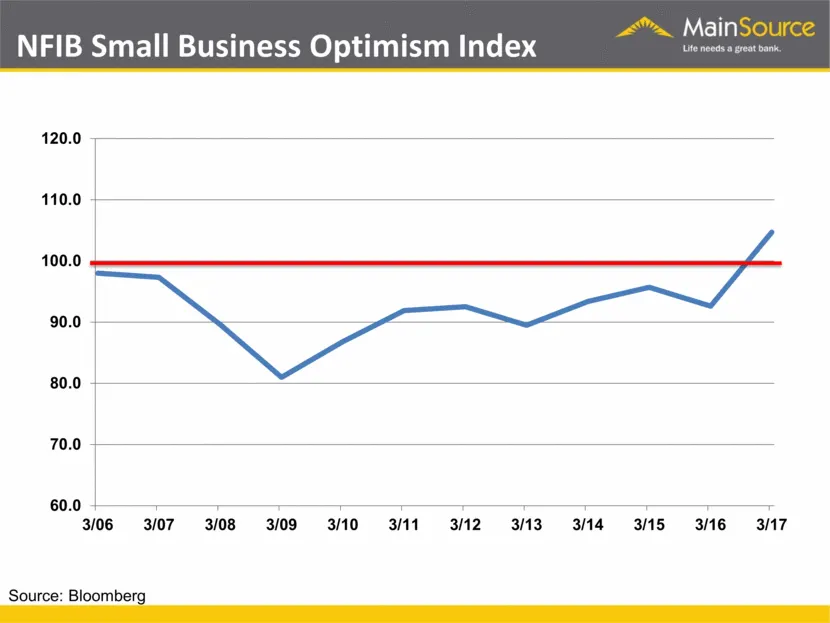
Slide 45: NFIB Small Business Optimism Index
NFIB Small Business Optimism Index Source: Bloomberg
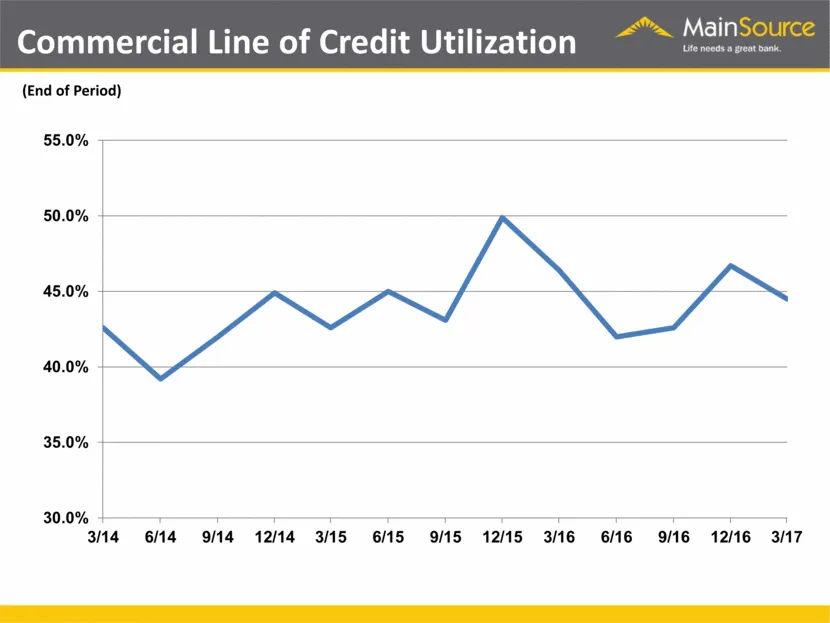
Slide 46: Commercial Line of Credit Utilization
Commercial Line of Credit Utilization (End of Period)
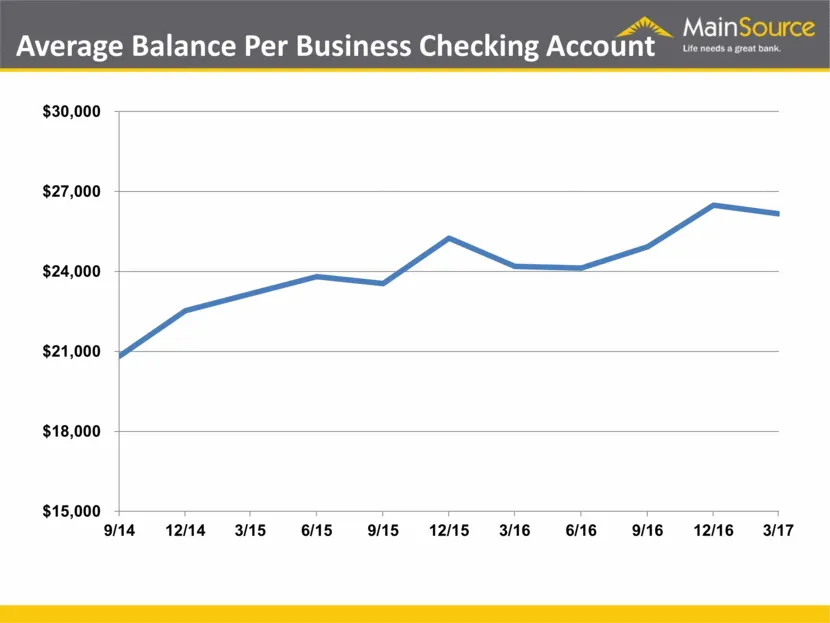
Slide 47: Average Balance Per Business Checking Account
Average Balance Per Business Checking Account $15,000 $18,000 $21,000 $24,000 $27,000 $30,000 9/14 12/14 3/15 6/15 9/15 12/15 3/16 6/16 9/16 12/16 3/17
Slide 48: Total Loans
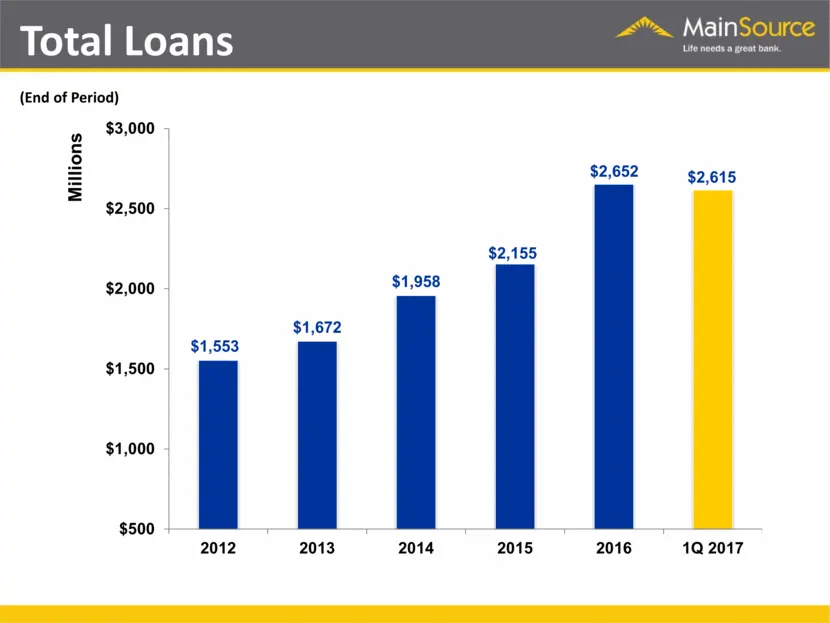
Total Loans (End of Period) $ 1,553 $1,672 $1,958 $2,652 $2,155 $2,615 $500 $1,000 $1,500 $2,000 $2,500 $3,000 2012 2013 2014 2015 2016 1Q 2017 Millions
Slide 49: Total Loans
(End of Period) Millions $3,000 $2,500 $2,000 $1,500 $1,000 $500 tal Loans $2,155 $1,958 $1,672 $1,553 ' 2012 2013 2014 2015 “A $2,652 2016 ~ MainSource Ute needs great bank $2,615 1Q 2017
Slide 50: Strategy for Growth
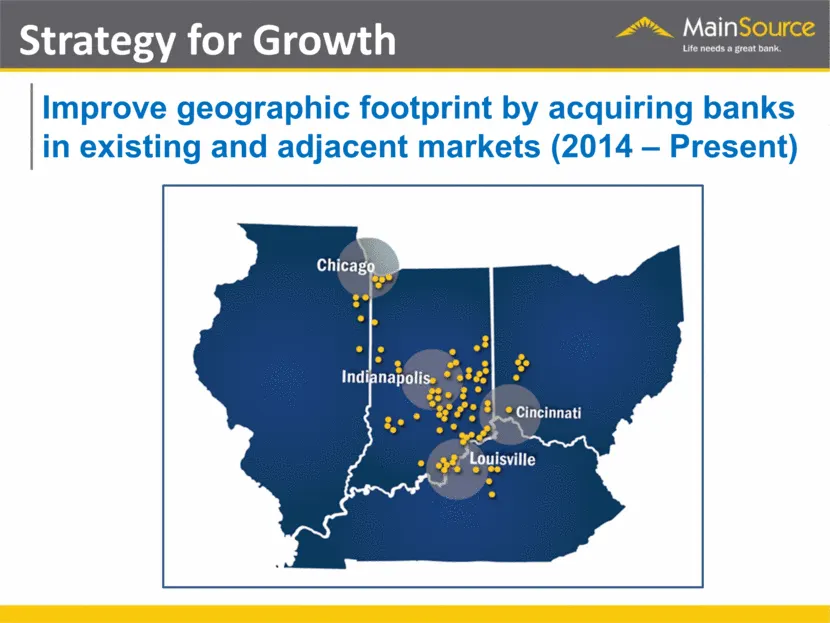
Improve geographic footprint by acquiring banks in existing and adjacent markets (2014 – Present) Strategy for Growth
Slide 51: Merger & Acquisition - Industry Trends
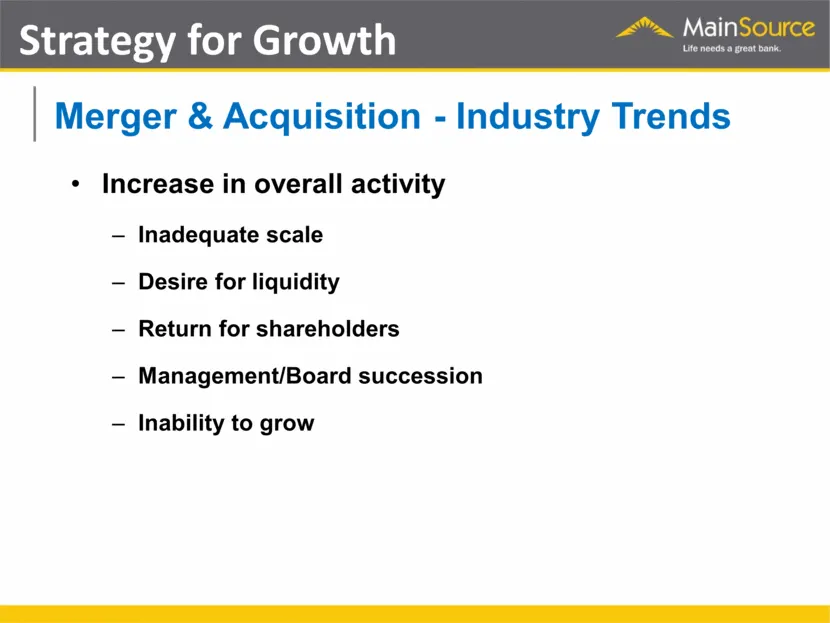
Merger & Acquisition - Industry Trends Increase in overall activity Inadequate scale Desire for liquidity Return for shareholders Management/Board succession Inability to grow Strategy for Growth
Slide 52: Merger & Acquisition Strategy
Merger & Acquisition Strategy Geographic fit Financially attractive Accretive to earnings Efficient use of capital Reasonable size Similar culture Leverages MainSource brand and capabilities Strategy for Growth
Slide 53: MBT Bancorp Merger
MBT Bancorp Merger Date – October 2014 $231mm Assets Six Branches Cincinnati, OH – Dearborn Co., IN Strategy for Growth
Slide 54: Cheviot Financial Corp. Merger
Strategy for Growth Cheviot Financial Corp. Merger Date - May 2016 $570mm Assets Twelve Branches Cincinnati, OH
Slide 55: FCB Bancorp, Inc. Merger
Strategy for Growth FCB Bancorp, Inc. Merger Date – April 30, 2017 $524mm Assets Seven Branches Louisville, KY
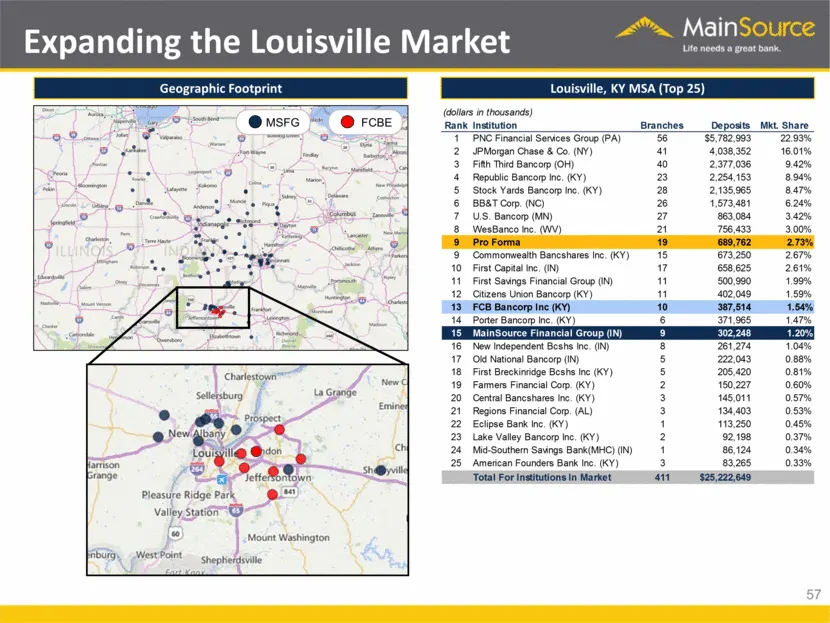
Slide 56: Geographic Footprint: Expanding the Louisville Market
Geographic Footprint Expanding the Louisville Market 57 Louisville, KY MSA (Top 25) MSFG FCBE (dollars in thousands) Rank Institution Branches Deposits Mkt. Share 1 PNC Financial Services Group (PA) 56 $5,782,993 22.93% 2 JPMorgan Chase & Co. (NY) 41 4,038,352 16.01% 3 Fifth Third Bancorp (OH) 40 2,
Slide 57: Strategic Rationale
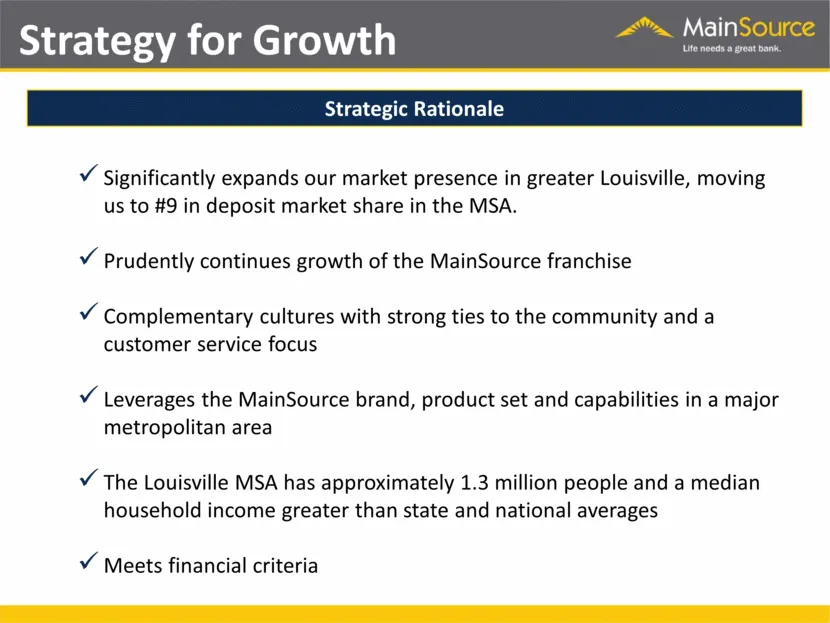
Strategy for Growth Significantly expands our market presence in greater Louisville, moving us to #9 in deposit market share in the MSA. Prudently continues growth of the MainSource franchise Complementary cultures with strong ties to the community and a customer service focus Leverages the MainSour
Slide 58: Geographic Footprint – Changes
Geographic Footprint – Changes Strategy for Growth
Slide 59: Common Dividend
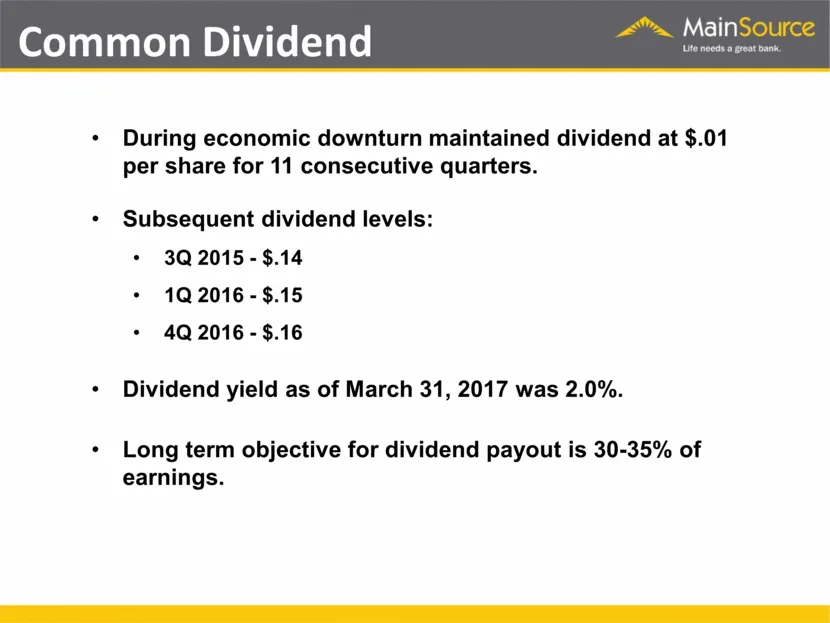
Common Dividend (As of 4.14.11) During economic downturn maintained dividend at $.01 per share for 11 consecutive quarters. Subsequent dividend levels: 3Q 2015 - $.14 1Q 2016 - $.15 4Q 2016 - $.16 Dividend yield as of March 31, 2017 was 2.0%. Long term objective for dividend payout is 30-35% of earn
Slide 60: Key factors considered when assessing the dividend
Key factors considered when assessing the dividend Outlook on Earnings Credit Quality Level of Capital Overall Economic Environment Common Dividend (As of 4.14.11)
Slide 61: Common Dividend
Common Dividend Key factors considered when assessing the dividend * Outlook on Earnings + Credit Quality « Level of Capital * Overall Economic Environment
Slide 62: 2017 Strategic Priorities
MainSource Financial Group (As of 4.14.11) 2017 Strategic Priorities Revenue & Loan Growth Successfully Integrate FCB Expense Control Maintain Credit Quality Branch Rationalization and Positioning
Slide 63: 2017 Strategic Priorities
Main MainSource Financial Group 2017 Strategic Priorities + Revenue & Loan Growth + Successfully Integrate FCB ¢ Expense Control + Maintain Credit Quality ¢ Branch Rationalization and Positioning
Slide 64: Questions
Questions
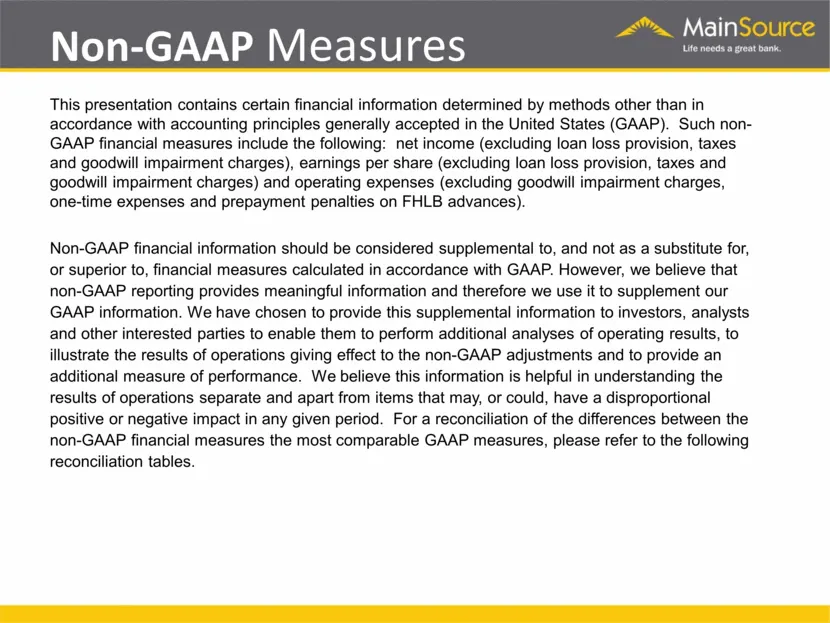
Slide 65: Non-GAAP Measures
Non-GAAP Measures This presentation contains certain financial information determined by methods other than in accordance with accounting principles generally accepted in the United States (GAAP). Such non-GAAP financial measures include the following: net income (excluding loan loss provision, taxe
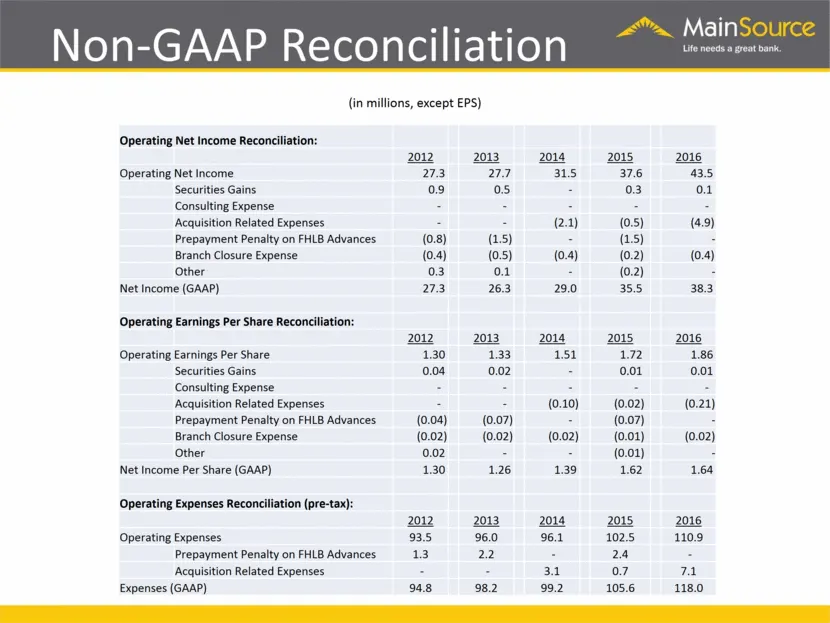
Slide 66: Non-GAAP Reconciliation
Non-GAAP Reconciliation (in millions, except EPS) Operating Net Income Reconciliation: 2012 2013 2014 2015 2016 Operating Net Income 27.3 27.7 31.5 37.6 43.5 Securities Gains 0.9 0.5 - 0.3 0.1 Consulting Expense - - - - - Acquisition Related Expenses - - (2.1) (0.5) (4.9) Prepayment Penalty on FHLB
Slide 67: Non-GAAP Reconciliation
Main Non-GAAP Reconciliation verge {in millions, except EPS) Operating Net Income Reconciliation: 201220132014 2015 2016 Operating Net Income 273 27 315 37.6 a5 Securities Gains. 09 Os : 03 on Consulting Expense > : = 3 = ‘Acquisition Related Expenses - Es (2a) (0.5) (49) Prepayment Penalty on FHLB
Source: SEC EDGAR · 8-K filed May 3, 2017
More decks from MainSource Financial Group Inc
 Merger or Acquisition (October 2017)25 slides · Oct 31, 2017
 Merger or Acquisition (July 2017)23 slides · Jul 31, 2017
 Merger or Acquisition (July 2017)19 slides · Jul 26, 2017
 Merger or Acquisition (December 2016)7 slides · Dec 19, 2016
 Investor Presentation (September 2016)34 slides · Sep 22, 2016
 Shareholder Meeting (April 2015)86 slides · Apr 30, 2015