MainSource Financial Group Inc
MainSource Financial — Shareholder Meeting (April 2015)
86 slides from MainSource Financial's shareholder meeting presentation, Apr 30, 2015
Slide 1: Welcome 2015 Annual Meeting of Shareholders
Welcome 2015 Annual Meeting of Shareholders Archie M. Brown, Jr., Chairman
Slide 2: Introduction of Director Nominees
Introduction of Director Nominees Charles J. Thayer
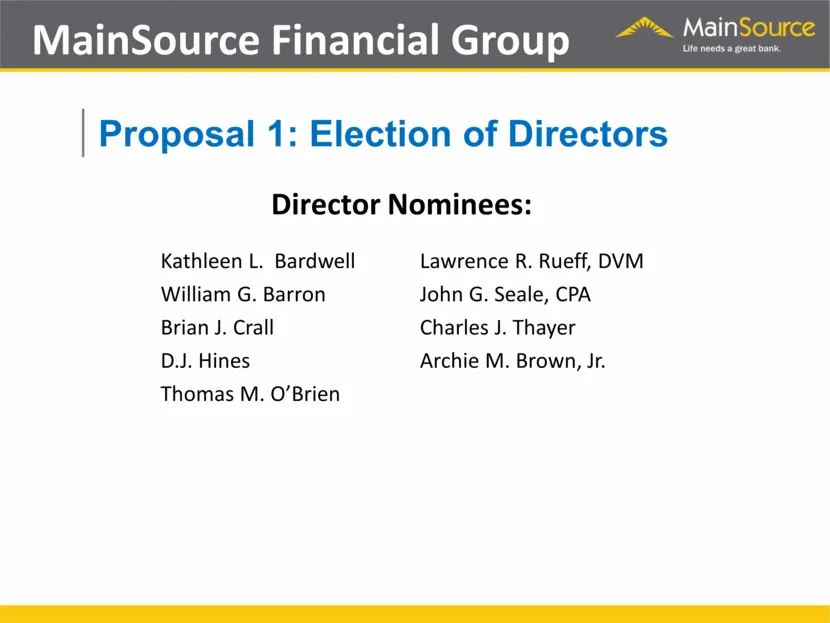
Slide 3: Proposal 1: Election of Directors
Kathleen L. Bardwell William G. Barron Brian J. Crall D.J. Hines Thomas M. O’Brien MainSource Financial Group Proposal 1: Election of Directors Lawrence R. Rueff, DVM John G. Seale, CPA Charles J. Thayer Archie M. Brown, Jr. Director Nominees:
Slide 4: Vote on 2015 Stock Incentive Plan
Vote on 2015 Stock Incentive Plan
Slide 5: Proposal 2: Approve 2015 Stock Incentive Plan
Vote on 2015 Stock Incentive Plan Proposal 2: Approve 2015 Stock Incentive Plan
Slide 6: Advisory Vote on Executive Compensation Policies and Procedures
Advisory Vote on Executive Compensation Policies and Procedures
Slide 7: Proposal 3: Advisory Vote on Executive Compensation
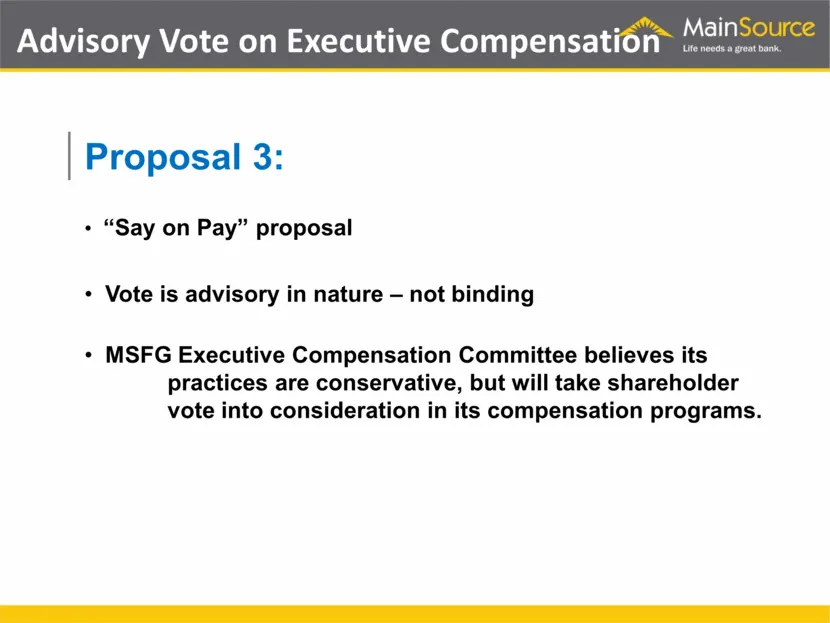
Advisory Vote on Executive Compensation “Say on Pay” proposal Vote is advisory in nature – not binding MSFG Executive Compensation Committee believes its practices are conservative, but will take shareholder vote into consideration in its compensation programs. Proposal 3:
Slide 8: Ratification of Independent Auditors
Ratification of Independent Auditors
Slide 9: Proposal 4: Ratification of Independent Auditors
Ratification of Independent Auditors Ratification of Crowe Horwath LLP as the Company’s independent public accounting firm. Proposal 4:
Slide 10: Introductions
Introductions
Slide 11: Executive Officers
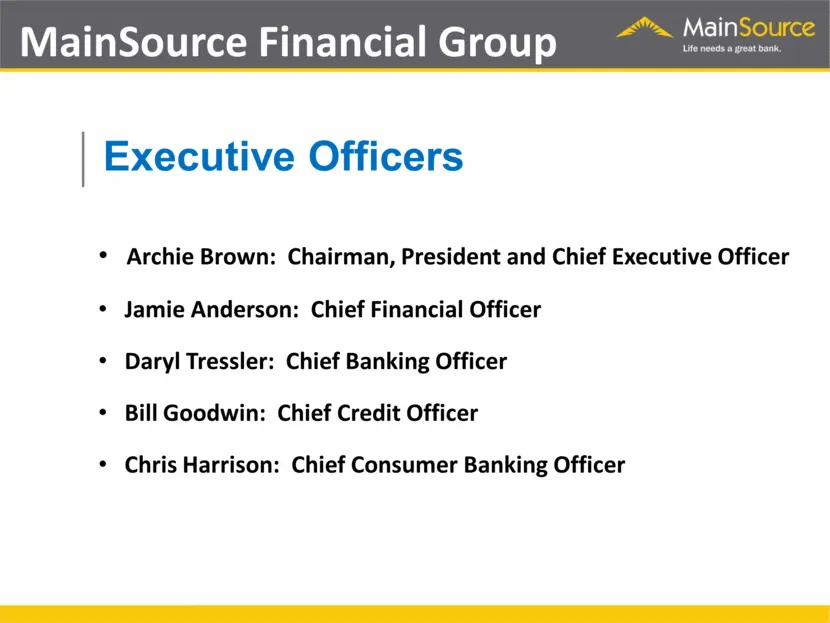
MainSource Financial Group Archie Brown: Chairman, President and Chief Executive Officer Jamie Anderson: Chief Financial Officer Daryl Tressler: Chief Banking Officer Bill Goodwin: Chief Credit Officer Chris Harrison: Chief Consumer Banking Officer Executive Officers
Slide 12: Results of Shareholder Vote
Results of Shareholder Vote
Slide 13: Official Business Meeting Concluded
Official Business Meeting Concluded
Slide 14: Recognition of Phil Frantz
Recognition of Phil Frantz
Slide 15: 2014 Financial Performance
2014 Financial Performance Jamie Anderson Chief Financial Officer
Slide 16: Disclosure Regarding Forward Looking Statements
Disclosure Regarding Forward Looking Statements This presentation may include comments or information that constitute forward-looking statements (within the meaning of the Private Securities Litigation Reform Act of 1995) based on current expectations that involve a number of risks and uncertainties
Slide 17: 2014 Accomplishments
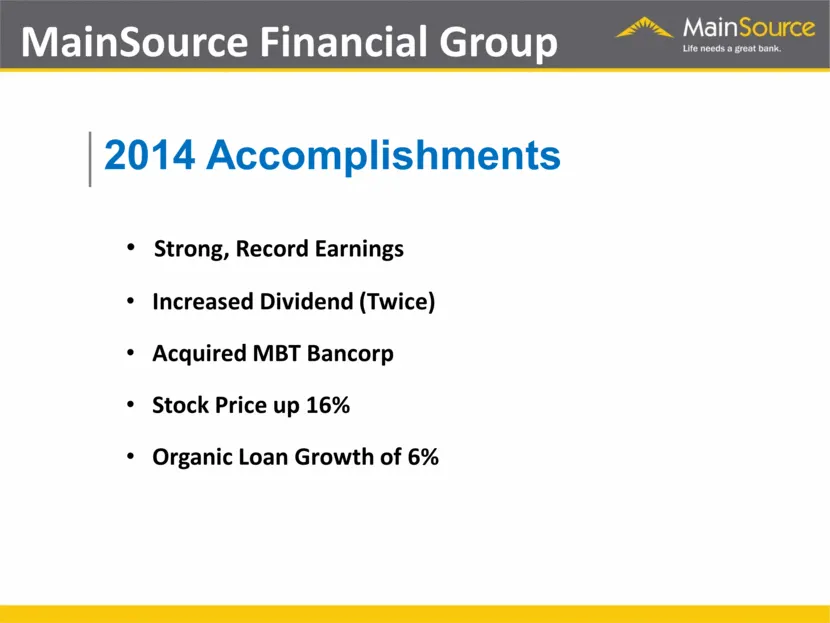
MainSource Financial Group Strong, Record Earnings Increased Dividend (Twice) Acquired MBT Bancorp Stock Price up 16% Organic Loan Growth of 6% 2014 Accomplishments
Slide 18: 2014 Balance Sheet
2014 Balance Sheet
Slide 19: Total Assets
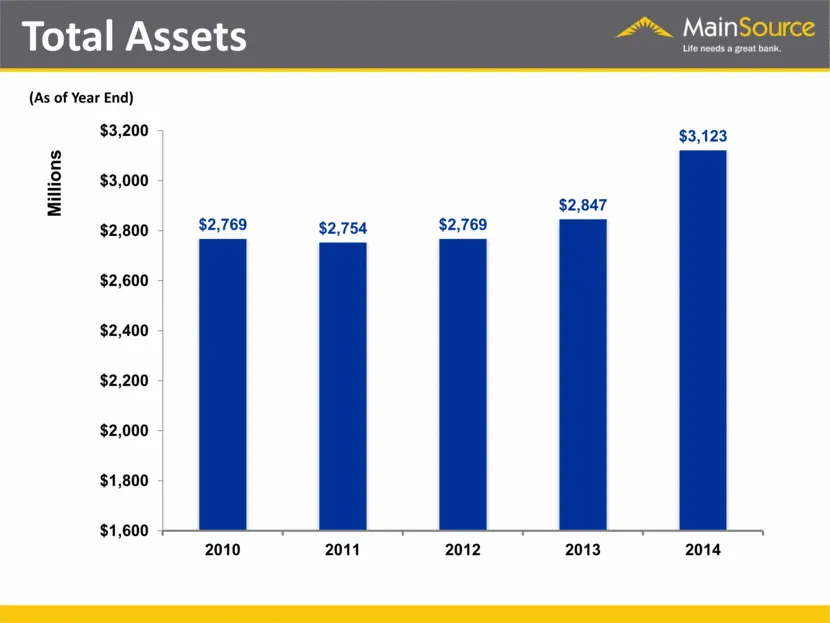
Total Assets (As of Year End) $ 2,769 $2,754 $2,769 $2,847 $3,123 $1,600 $1,800 $2,000 $2,200 $2,400 $2,600 $2,800 $3,000 $3,200 2010 2011 2012 2013 2014 Millions
Slide 20: Total Loans
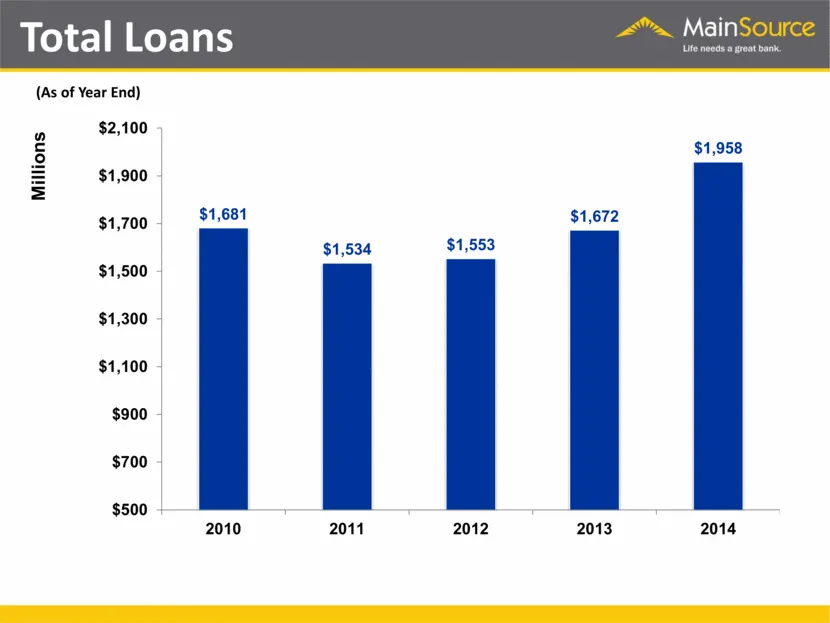
Total Loans (As of Year End) $1,681 $1,534 $1,553 $1,672 $1,958 $500 $700 $900 $1,100 $1,300 $1,500 $1,700 $1,900 $2,100 2010 2011 2012 2013 2014 Millions
Slide 21: Mortgage Loans Serviced
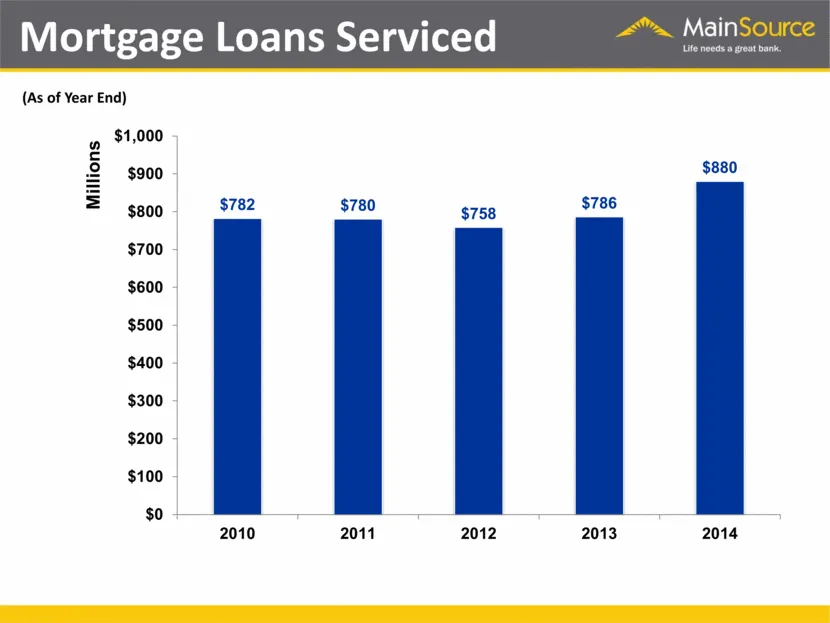
Mortgage Loans Serviced (As of Year End) $782 $780 $758 $786 $880 $0 $100 $200 $300 $400 $500 $600 $700 $800 $900 $1,000 2010 2011 2012 2013 2014 Millions
Slide 22: Total Deposits
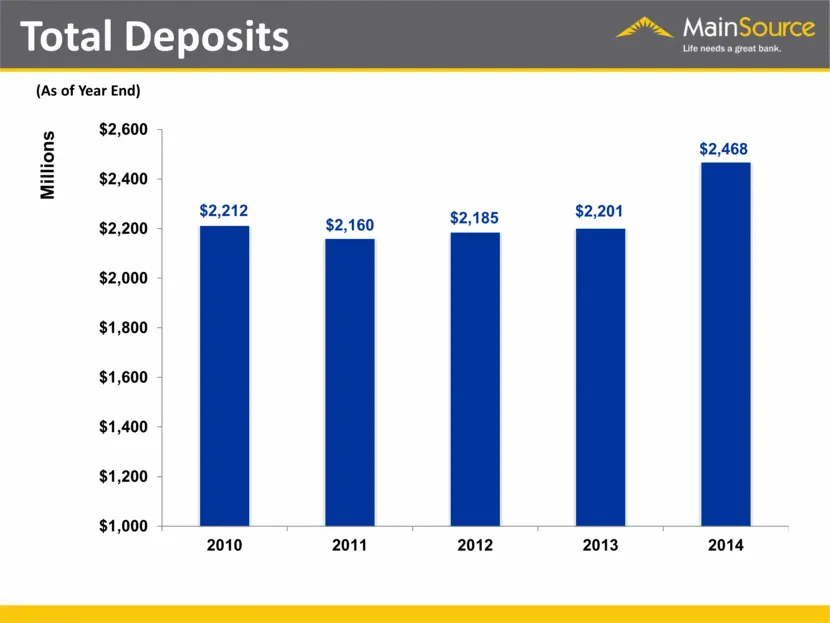
Total Deposits (As of Year End) $2,212 $2,160 $2,185 $2,201 $2,468 $1,000 $1,200 $1,400 $1,600 $1,800 $2,000 $2,200 $2,400 $2,600 2010 2011 2012 2013 2014 Millions
Slide 23: Total Deposits - Mix
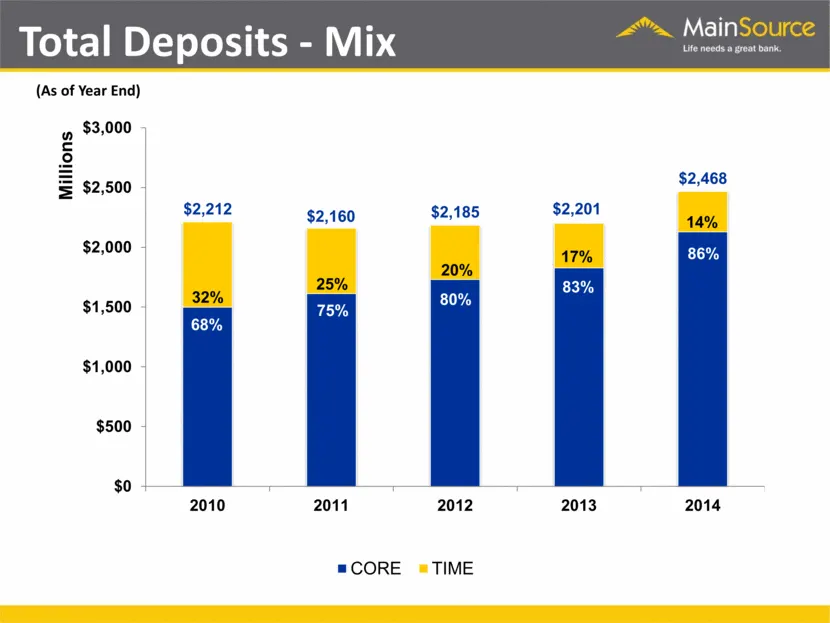
Total Deposits - Mix (As of Year End) 32% 25% 20% 17% $2,212 $2,160 $2,185 $2,201 $2,468 $0 $500 $1,000 $1,500 $2,000 $2,500 $3,000 2010 2011 2012 2013 2014 Millions CORE TIME 68% 75% 80% 83% 86% 14%
Slide 24: Strong Regulatory Capital
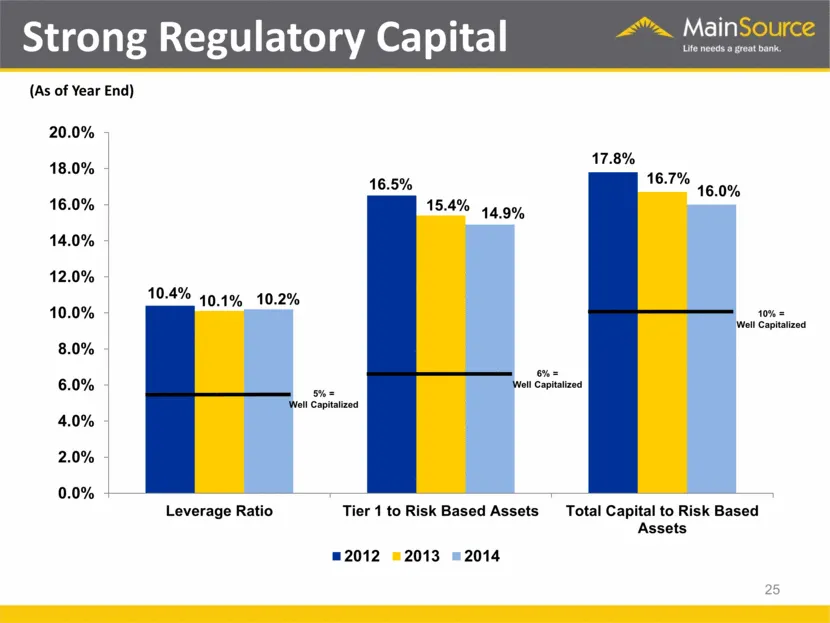
5% = Well Capitalized 6% = Well Capitalized 10% = Well Capitalized Strong Regulatory Capital 25 (As of Year End) 10.4% 16.5% 17.8% 10.1% 15.4% 16.7% 10.2% 14.9% 16.0% 0.0% 2.0% 4.0% 6.0% 8.0% 10.0% 12.0% 14.0% 16.0% 18.0% 20.0% Leverage Ratio Tier 1 to Risk Based Assets Total Capital to Risk Based A
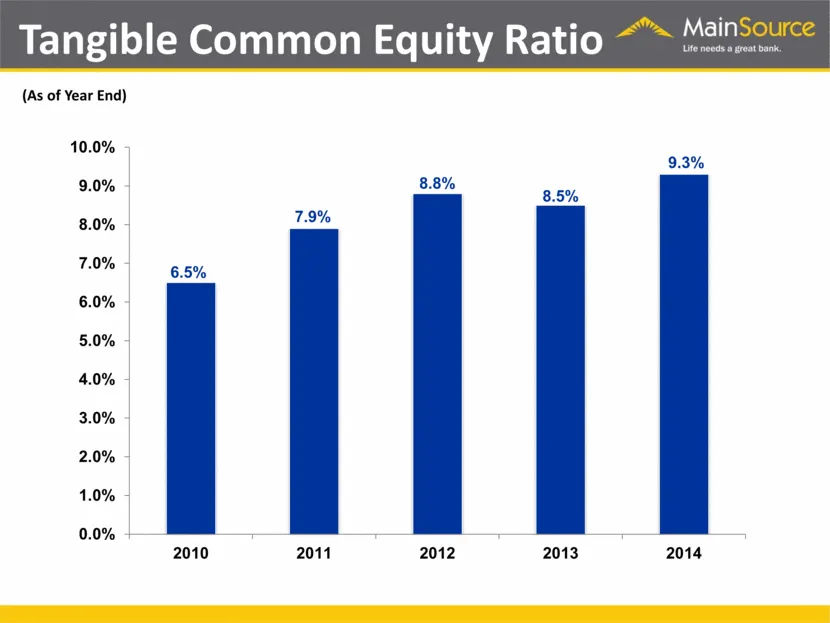
Slide 25: Tangible Common Equity Ratio
Tangible Common Equity Ratio (As of Year End)
Slide 26: 2014 Operating Results
2014 Operating Results
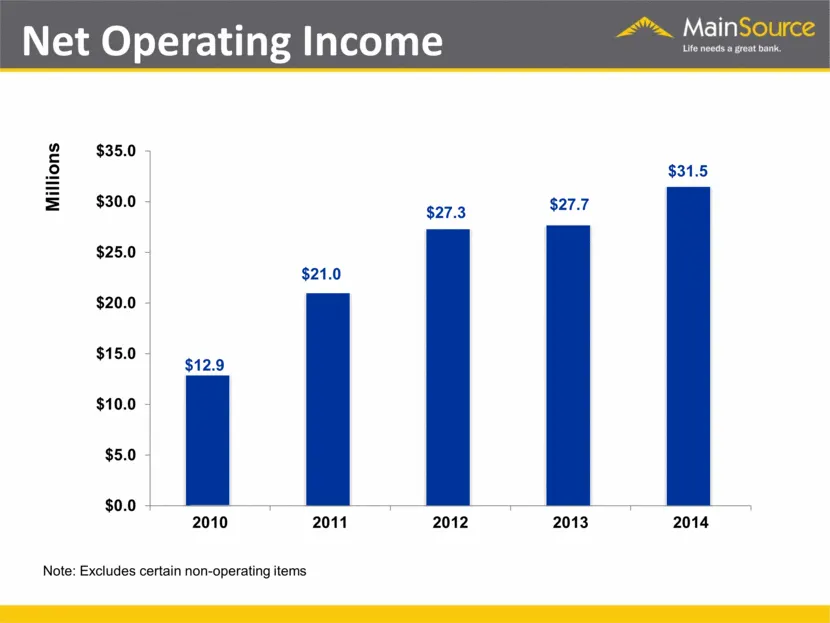
Slide 27: Net Operating Income
Net Operating Income Note: Excludes certain non-operating items $31.5 $12.9 $21.0 $27.3 $27.7 $0.0 $5.0 $10.0 $15.0 $20.0 $25.0 $30.0 $35.0 2010 2011 2012 2013 2014 Millions
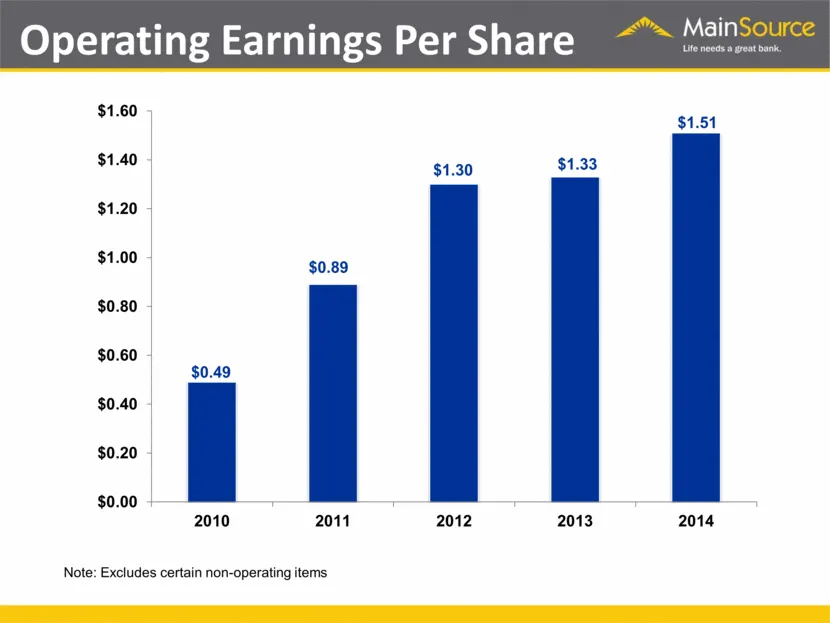
Slide 28: Operating Earnings Per Share
Operating Earnings Per Share Note: Excludes certain non-operating items
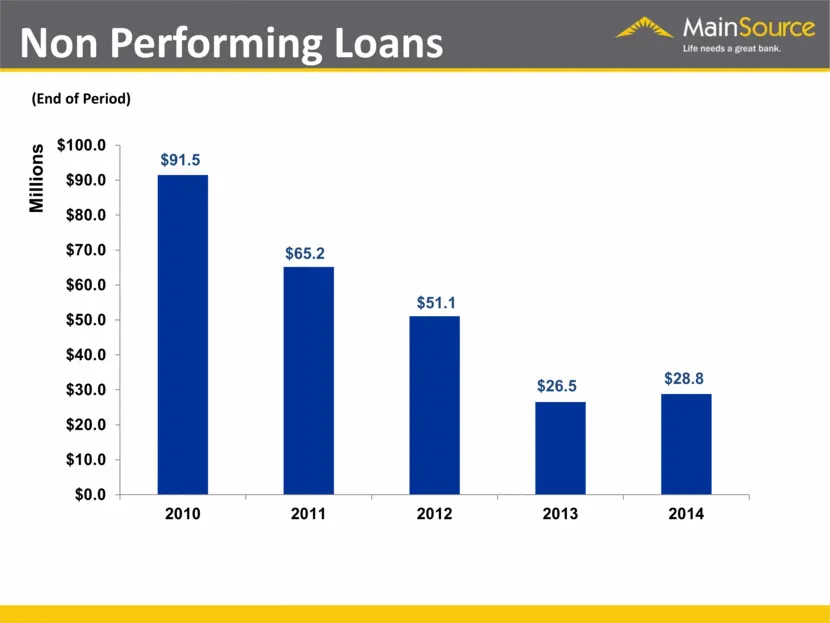
Slide 29: Non Performing Loans
Non Performing Loans Millions (End of Period)
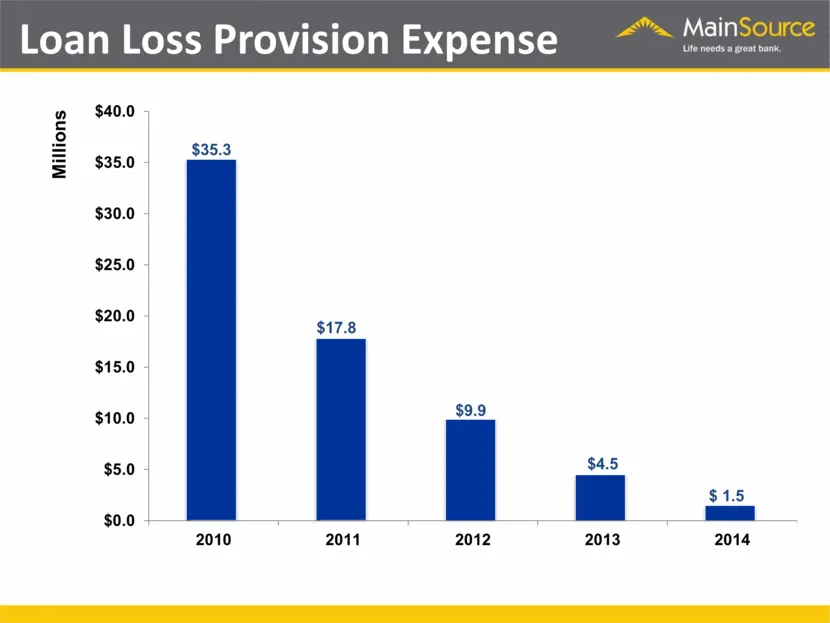
Slide 30: Loan Loss Provision Expense
an Loss Provision Expense a < cl = $40.0 5 $35.3 $35.0 - $30.0 - $25.0 $20.0 $17.8 $15.0 $10.0 $5.0 © $0.0 = 2010 2011
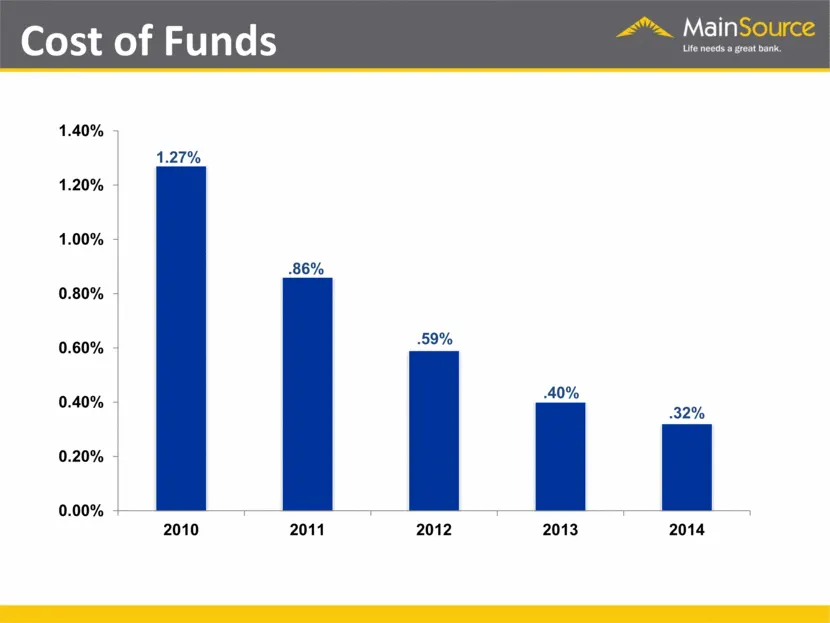
Slide 31: Cost of Funds
Cost of Funds 1.40% 1.27% 1.20% 1.00% 86% 0.80% 0.60% 59% 40% 0.40% 32% 0.00% 2010 2011 2012 2013 2014
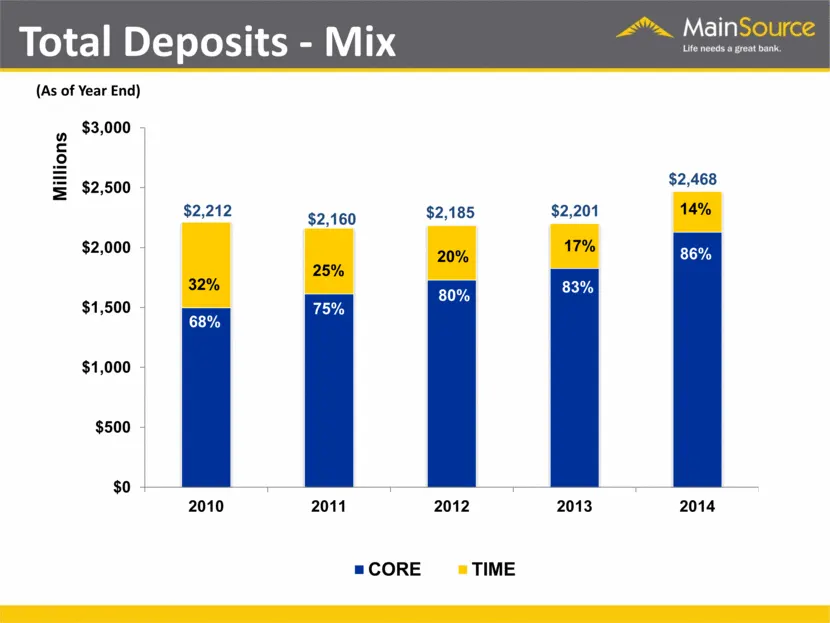
Slide 32: Total Deposits - Mix
Total Deposits - Mix (As of Year End) 14% 32% 25% 20% 17% $2,468 $2,212 $2,160 $2,185 $2,201 $0 $500 $1,000 $1,500 $2,000 $2,500 $3,000 2010 2011 2012 2013 2014 Millions CORE TIME 86% 68% 75% 80% 83%
Slide 33: Core Fee Income
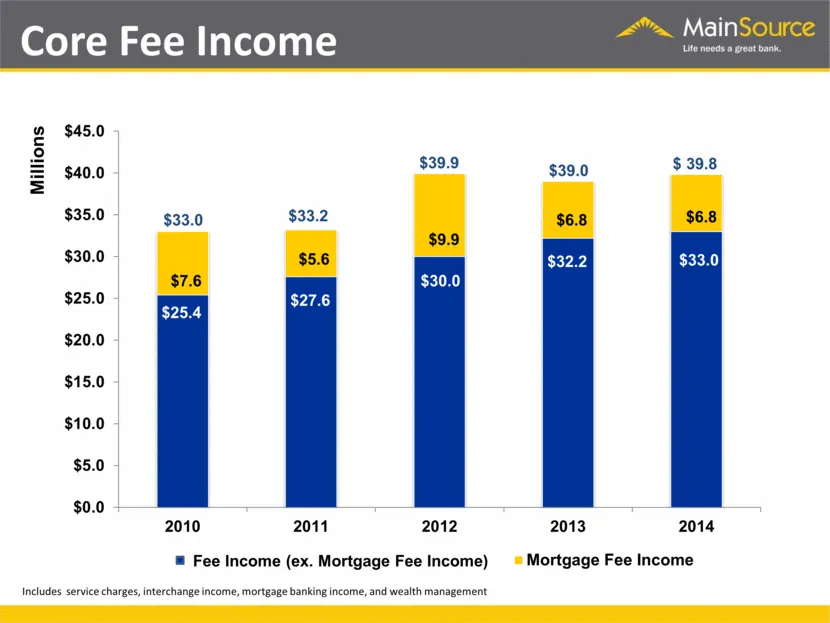
Core Fee Income Includes service charges, interchange income, mortgage banking income, and wealth management $7.6 $9.9 $6.8 $27.6 $30.0 $32.2
Slide 34: Stable Operating Expenses
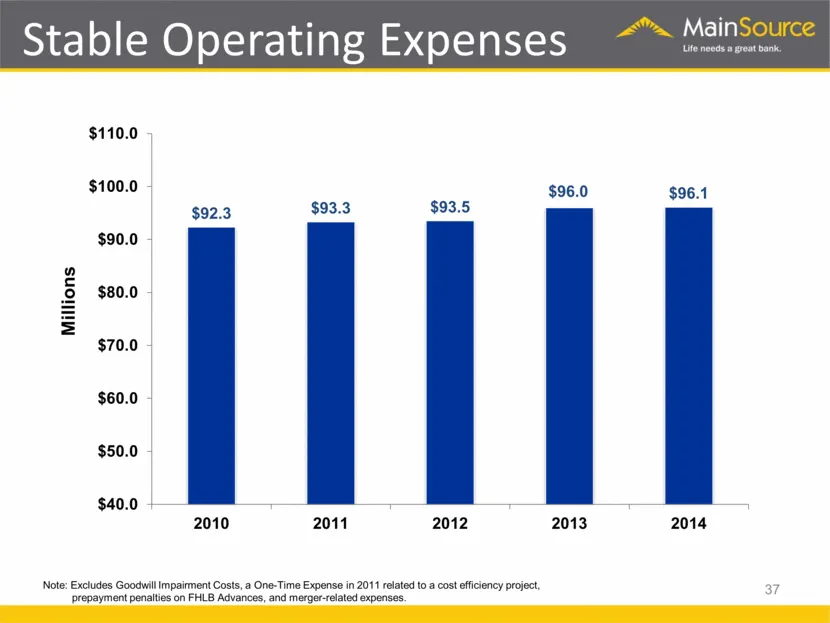
Stable Operating Expenses Millions 37 Note: Excludes Goodwill Impairment Costs, a One-Time Expense in 2011 related to a cost efficiency project, prepayment penalties on FHLB Advances, and merger-related expenses.
Slide 35: MainSource Financial Group NASDAQ Stock Symbol MSFG
MainSource Financial Group NASDAQ Stock Symbol MSFG
Slide 36: 2014 Stock Performance
2014 Stock Performance
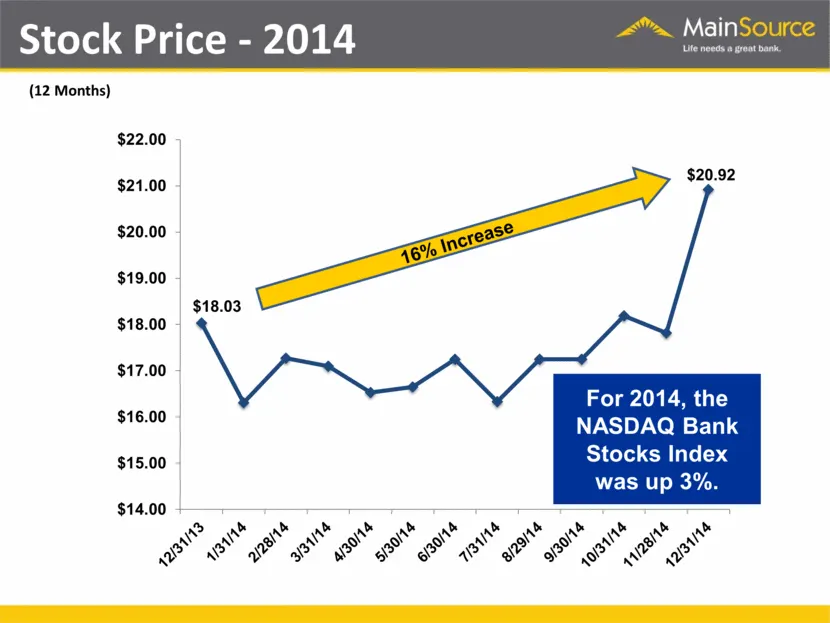
Slide 37: Stock Price - 2014
Stock Price - 2014 16% Increase For 2014, the NASDAQ Bank Stocks Index was up 3%. (12 Months)
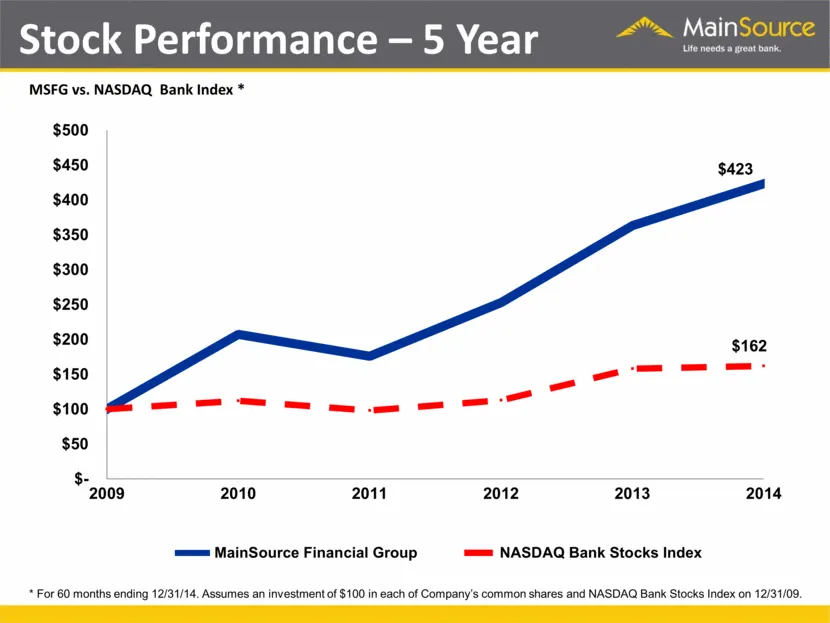
Slide 38: Stock Performance - MSFG vs. NASDAQ Bank Index
Stock Performance – 5 Year MSFG vs. NASDAQ Bank Index * * For 60 months ending 12/31/14. Assumes an investment of $100 in each of Company’s common shares and NASDAQ Bank Stocks Index on 12/31/09.
Slide 39: First Quarter 2015
First Quarter 2015
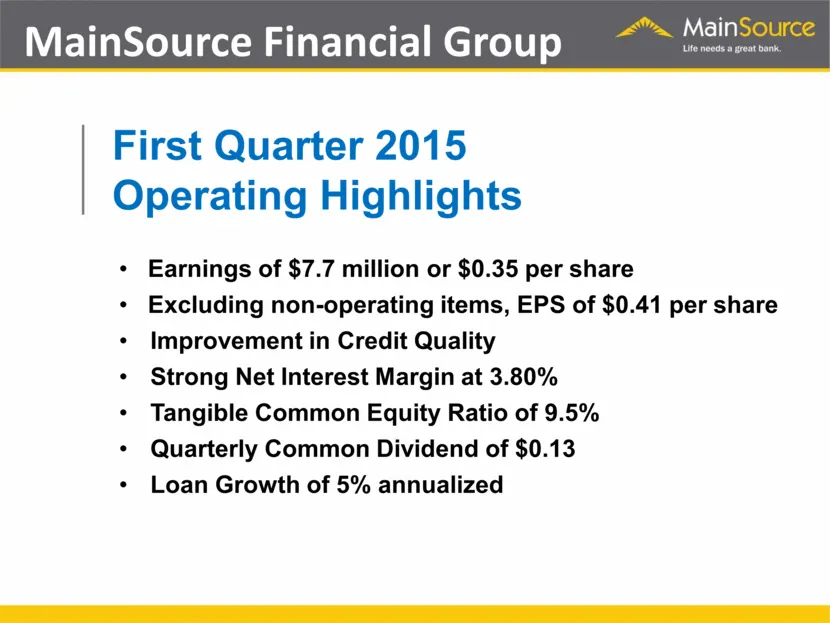
Slide 40: First Quarter 2015 Operating Highlights
MainSource Financial Group First Quarter 2015 Operating Highlights Earnings of $7.7 million or $0.35 per share Excluding non-operating items, EPS of $0.41 per share Improvement in Credit Quality Strong Net Interest Margin at 3.80% Tangible Common Equity Ratio of 9.5% Quarterly Common Dividend of $0.
Slide 41: 2015 Outlook
2015 Outlook Archie M. Brown, Jr.
Slide 42: Growth in GDP
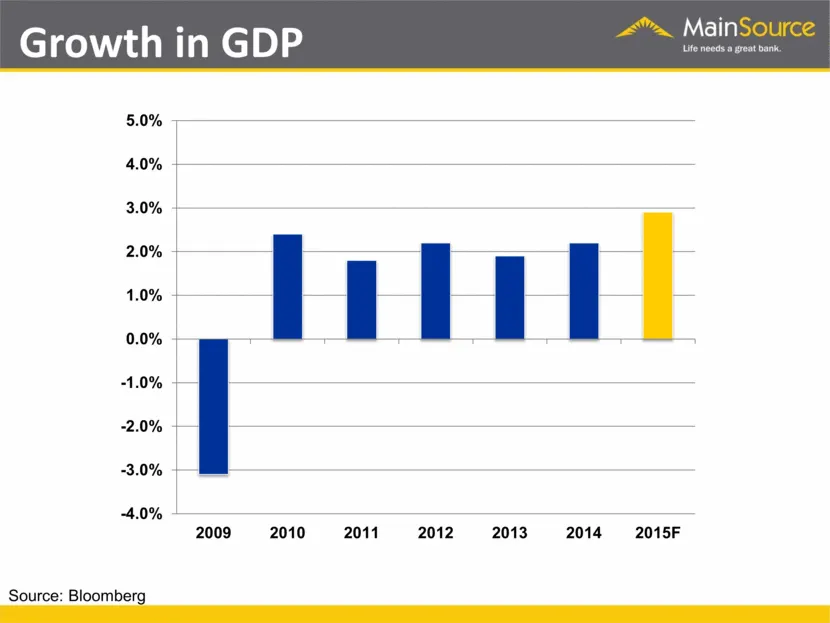
Growth in GDP Source: Bloomberg
Slide 43: NFIB Small Business Optimism Index
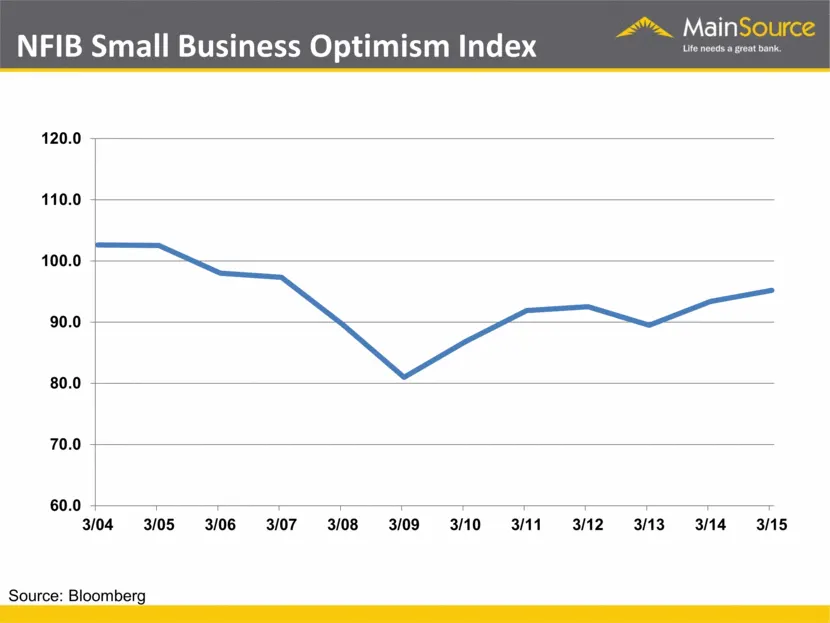
NFIB Small Business Optimism Index Source: Bloomberg
Slide 44: Commercial Line of Credit Utilization
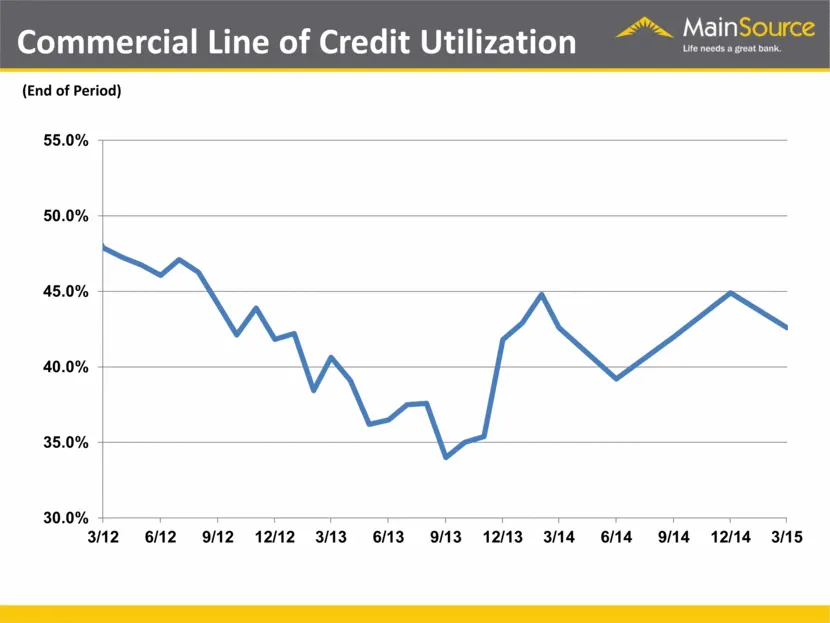
Commercial Line of Credit Utilization (End of Period)
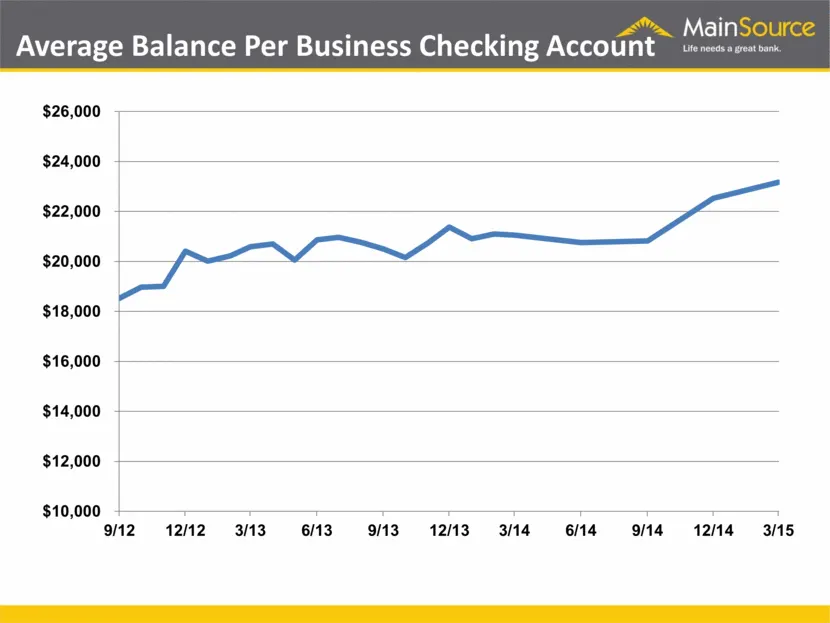
Slide 45: Average Balance Per Business Checking Account
Average Balance Per Business Checking Account $10,000 $12,000 $14,000 $16,000 $18,000 $20,000 $22,000 $24,000 $26,000 9/12 12/12 3/13 6/13 9/13 12/13 3/14 6/14 9/14 12/14 3/15
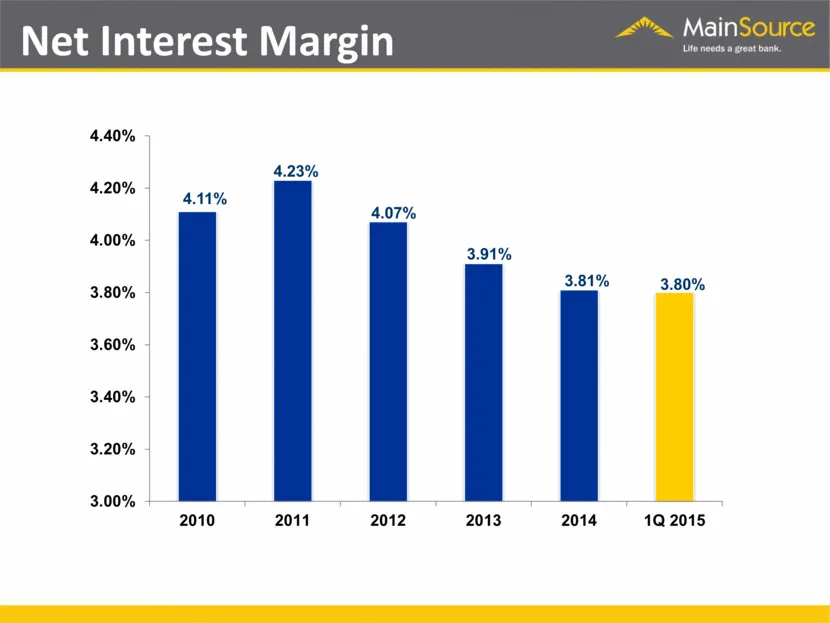
Slide 46: Net Interest Margin
Net Interest Margin 4.07% 3.91% 3.81% 3.80% 4.40% 4.20% 4.00% 3.80% 3.60% 3.40% 3.20% 3.00% 411% 2010 2011 2012 2013 2014 1Q 2015
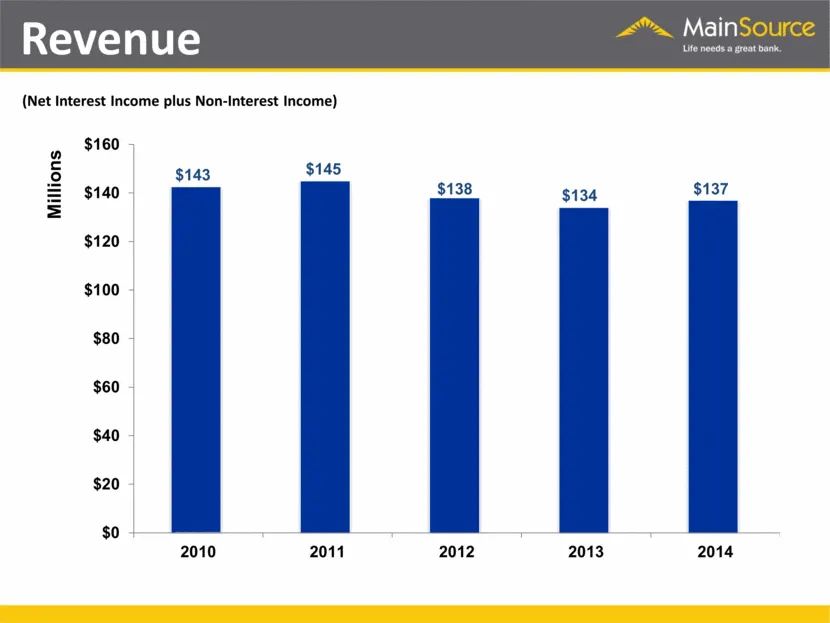
Slide 47: Revenue (Net Interest Income plus Non-Interest Income)
Revenue (Net Interest Income plus Non-Interest Income)
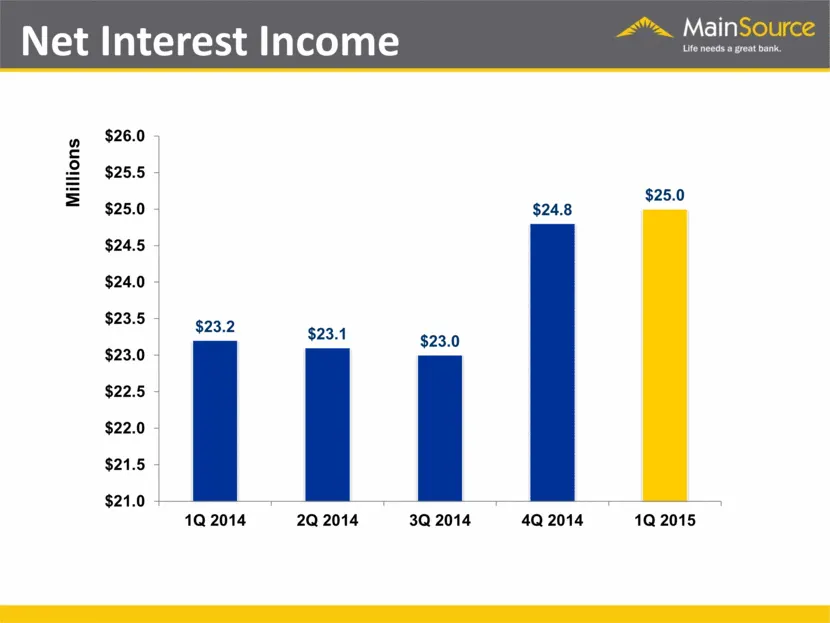
Slide 48: Net Interest Income
Net Interest Income $26.0 $25.5 $25.0 $25.0 $24.8 $24.5 $24.0 $23.5 $23.2 ez30 $23.1 $23.0 $22.5 $22.0 $24.5 $21.0 1Q 2014 2Q 2014 3Q 2014 4Q 2014 1Q 2015 Millions
Slide 49: Total Deposits - Mix
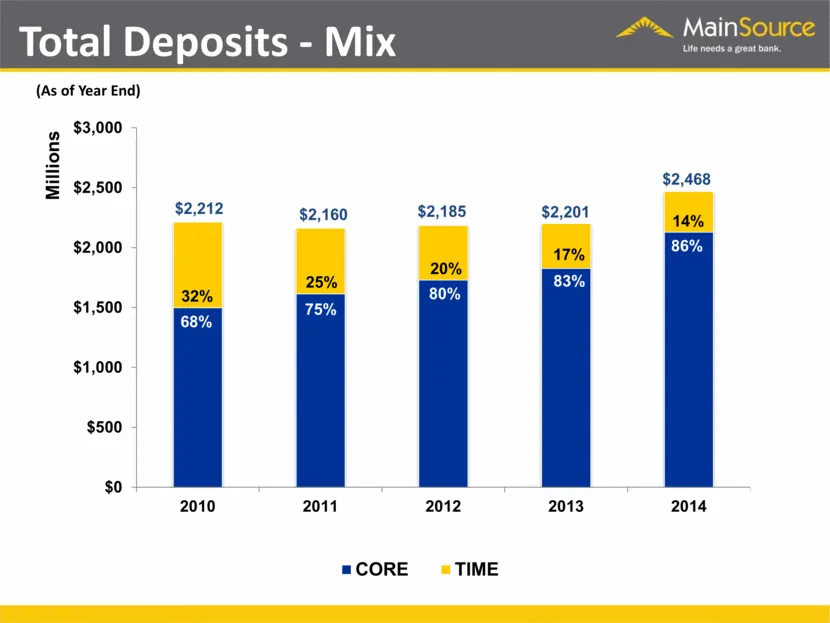
Total Deposits - Mix (As of Year End) 14% 32% 25% 20% 17% $2,468 $2,212 $2,160 $2,185 $2,201 $0 $500 $1,000 $1,500 $2,000 $2,500 $3,000 2010 2011 2012 2013 2014 Millions CORE TIME 86% 68% 75% 80% 83%
Slide 50: Total Loans (End of Period)
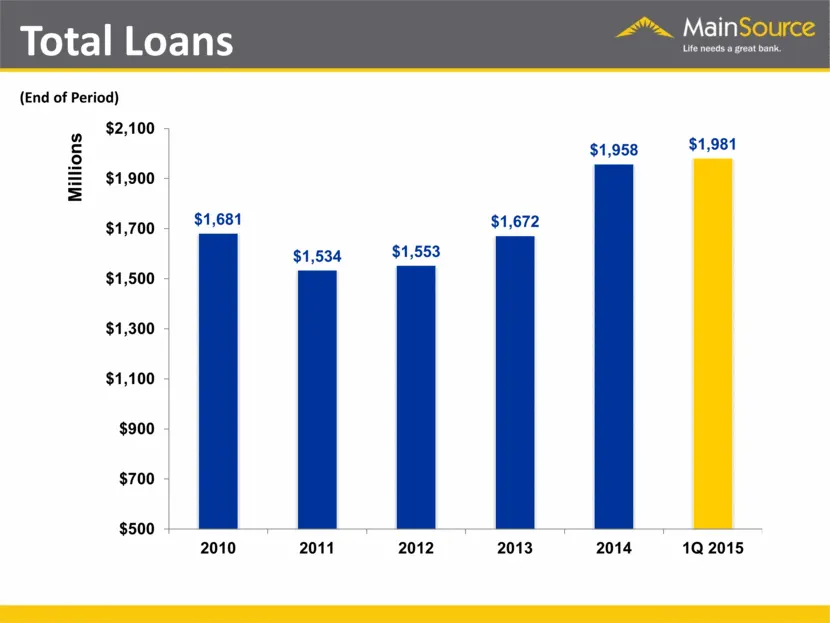
Total Loans (End of Period) $ 1,681 $1,534 $1,553 $ 1,672 $ 1,958 $ 1,981 $500 $700 $900 $1,100 $1,300 $1,500 $1,700 $1,900 $2,100 2010 2011 2012 2013 2014 1Q 2015 Millions
Slide 51: Trends in Lending: Loan Composition
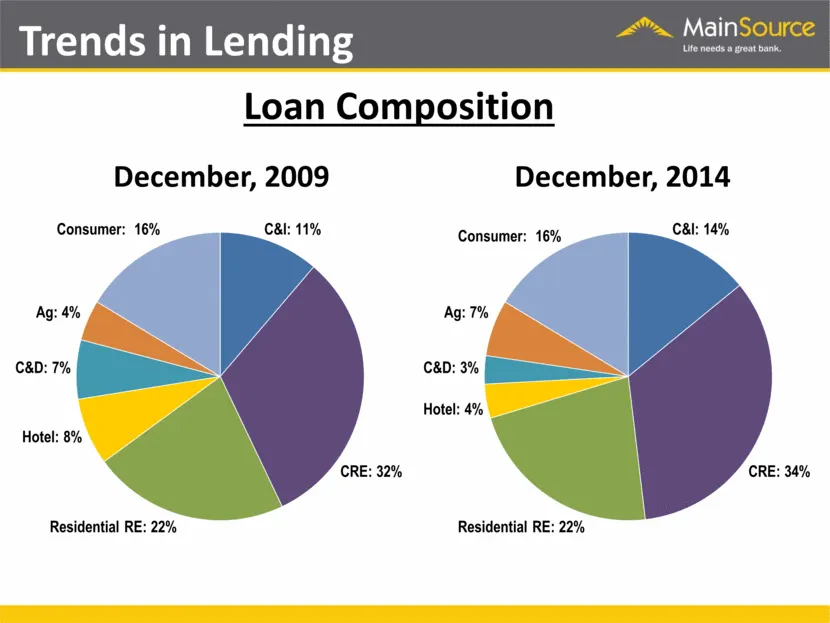
Trends in Lending Loan Composition December, 2009 December, 2014 C&I: 11% CRE: 32% Residential RE: 22% Hotel: 8% C&D: 7% Ag: 4% Consumer: 16% C&I: 14% CRE: 34% Residential RE: 22% Hotel: 4% C&D: 3% Ag: 7% Consumer: 16%
Slide 52: Core Fee Income
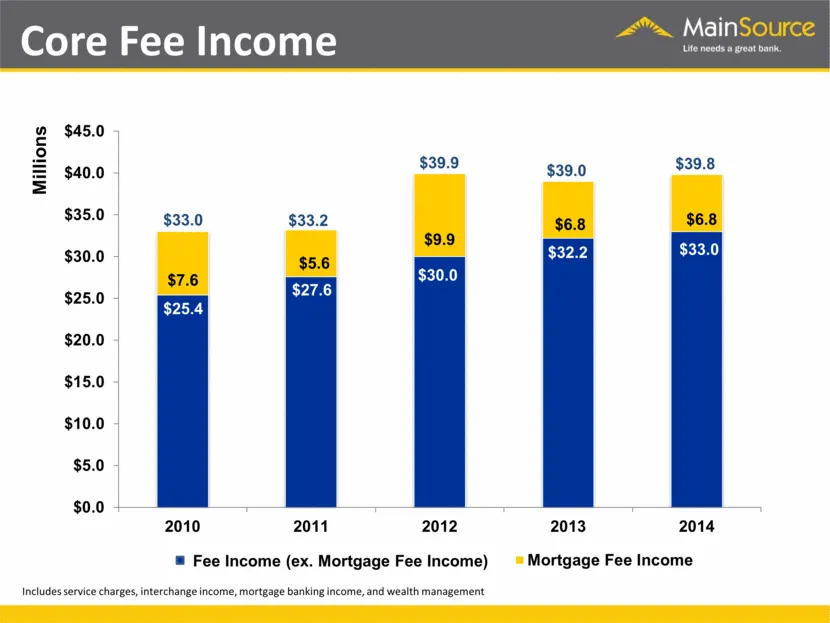
Core Fee Income Includes service charges, interchange income, mortgage banking income, and wealth management $7.6 $9.9 $6.8 $27.6 $30.0 $32.2
Slide 53: Strategy for Growth
Strategy for Growth
Slide 54: Enter new, higher growth markets
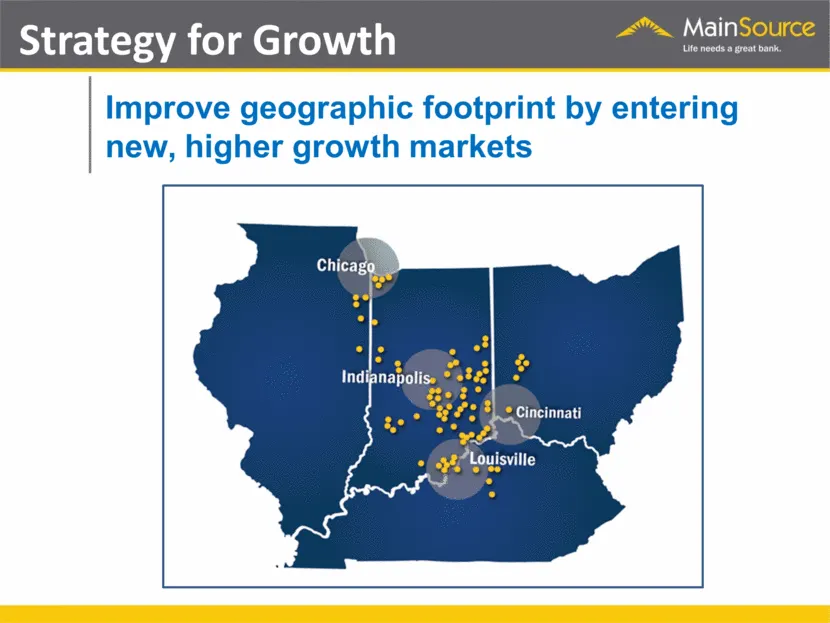
Improve geographic footprint by entering new, higher growth markets Strategy for Growth
Slide 55: Strategic Expansion
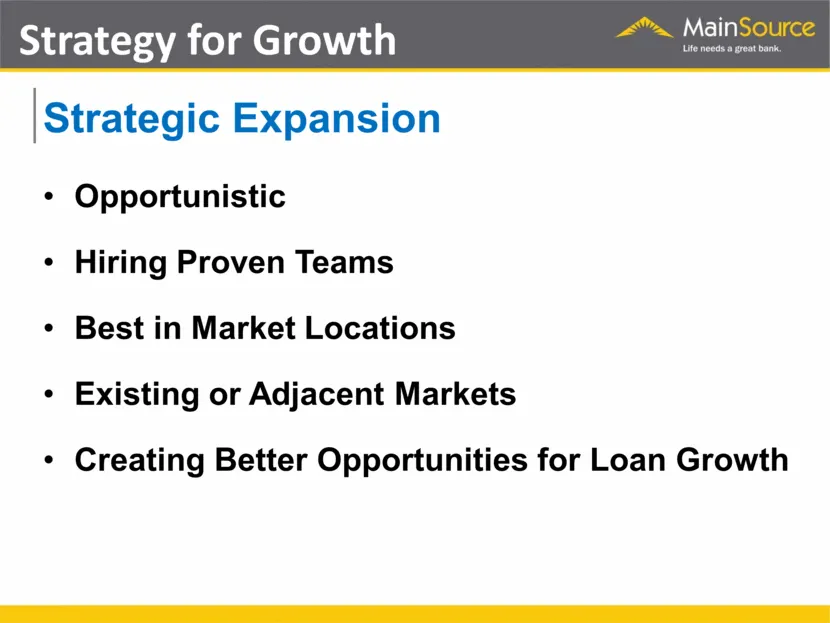
Strategic Expansion Strategy for Growth Opportunistic Hiring Proven Teams Best in Market Locations Existing or Adjacent Markets Creating Better Opportunities for Loan Growth
Slide 56: Entered New Markets
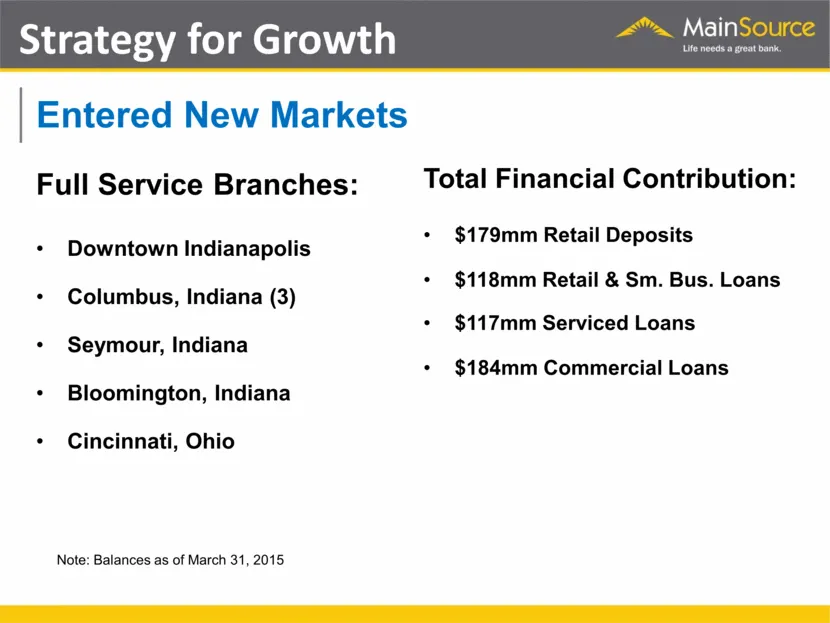
Entered New Markets Full Service Branches: Downtown Indianapolis Columbus, Indiana (3) Seymour, Indiana Bloomington, Indiana Cincinnati, Ohio Strategy for Growth Total Financial Contribution: $179mm Retail Deposits $118mm Retail & Sm. Bus. Loans $117mm Serviced Loans $184mm Commercial Loans Note: Ba
Slide 57: Louisville, Kentucky
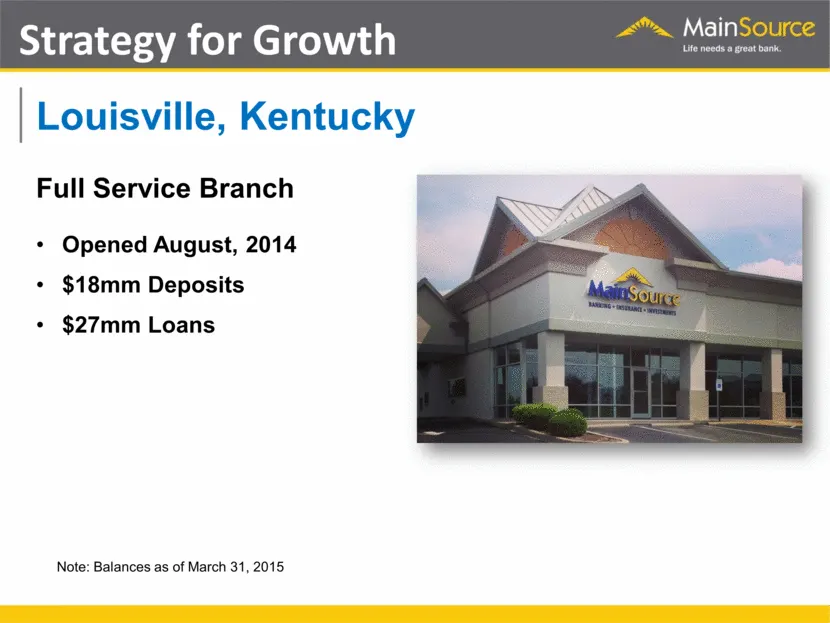
Louisville, Kentucky Full Service Branch Opened August, 2014 $18mm Deposits $27mm Loans Strategy for Growth Note: Balances as of March 31, 2015
Slide 58: Indianapolis, Indiana
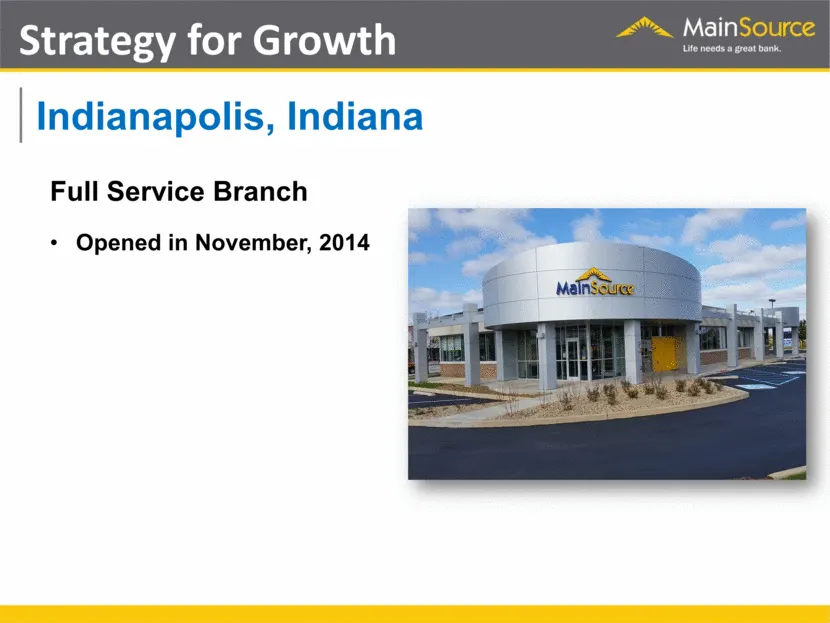
Indianapolis, Indiana Strategy for Growth Full Service Branch Opened in November, 2014
Slide 59: Bloomington, Indiana
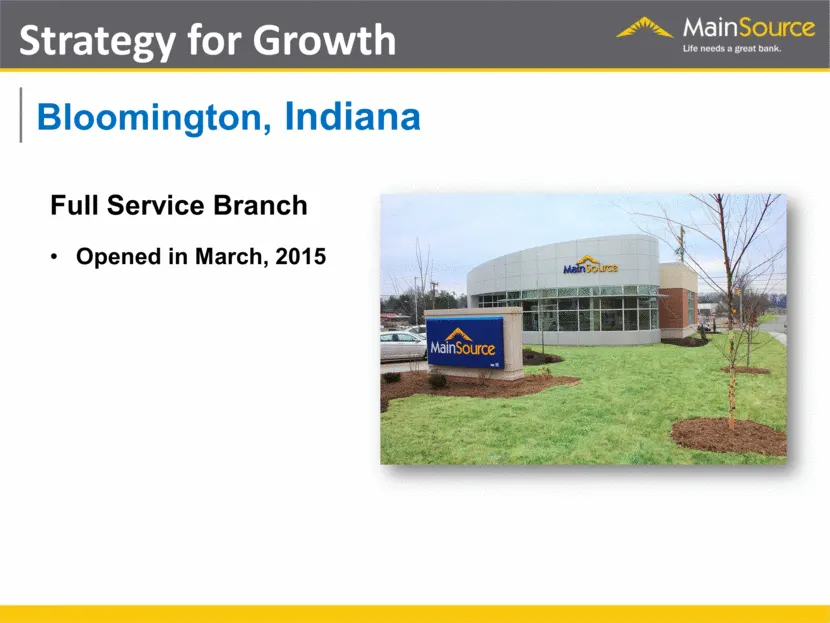
Bloomington, Indiana Strategy for Growth Full Service Branch Opened in March, 2015
Slide 60: Acquiring banks in existing and adjacent markets
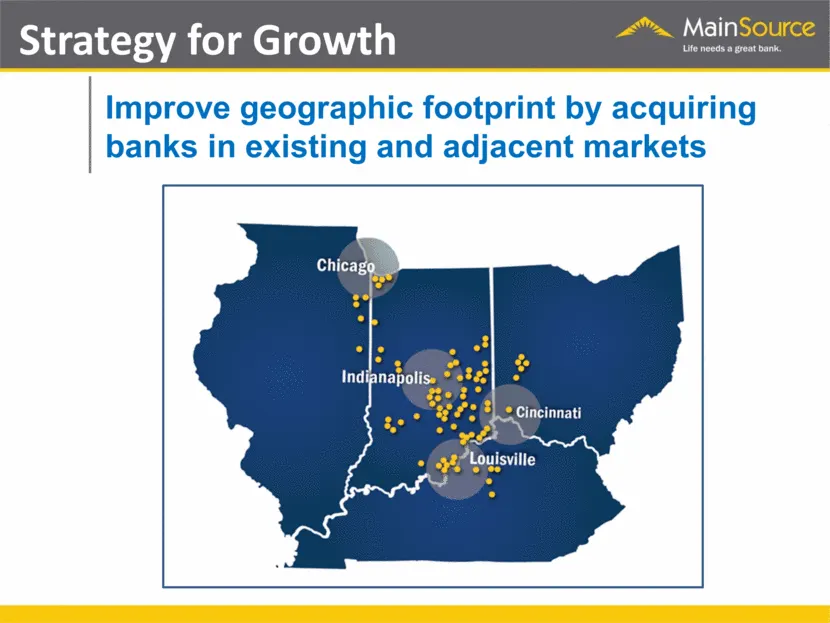
Improve geographic footprint by acquiring banks in existing and adjacent markets Strategy for Growth
Slide 61: Merger & Acquisition Strategy
Merger & Acquisition Strategy Geographic fit Financially attractive Accretive to earnings Efficient use of capital Reasonable size Similar culture Leverages MainSource brand and capabilities Strategy for Growth
Slide 62: MBT Bancorp Merger
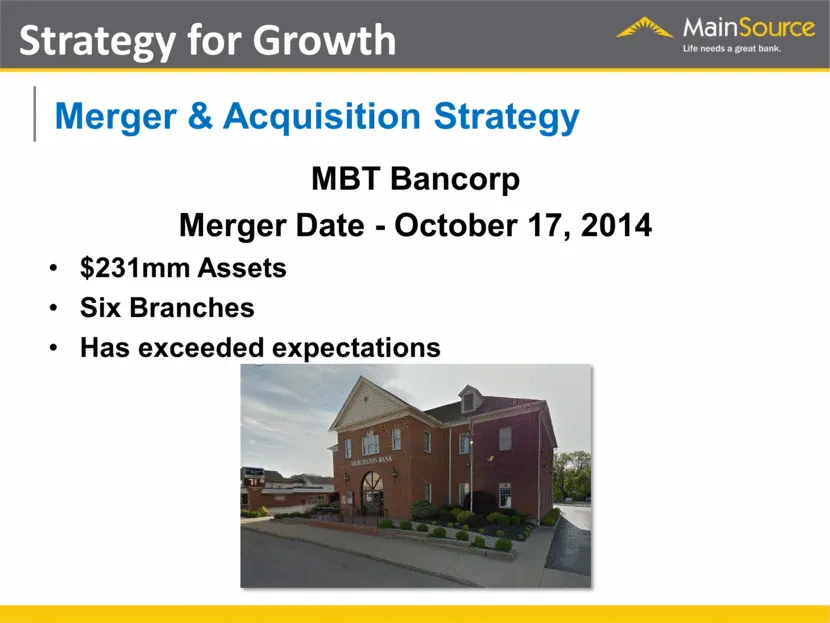
Merger & Acquisition Strategy MBT Bancorp Merger Date - October 17, 2014 $231mm Assets Six Branches Has exceeded expectations Strategy for Growth
Slide 63: Acquiring branches in existing and adjacent markets
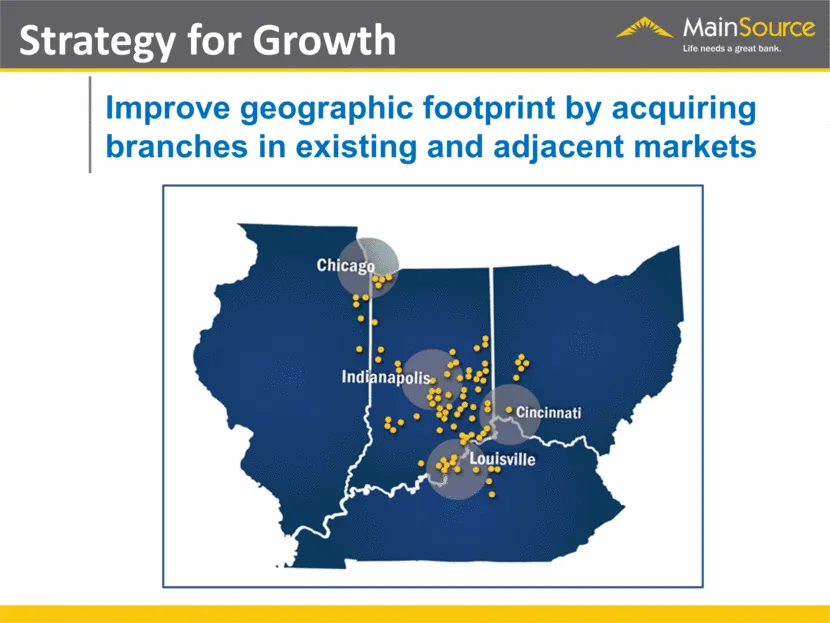
Improve geographic footprint by acquiring branches in existing and adjacent markets Strategy for Growth
Slide 64: Branch Purchases 2009 - 2013
Branch Purchases 2009 - 2013 Frankfort, KY Lawrenceburg, KY Shelbyville , KY Hope, IN Greensburg, IN Strategy for Growth
Slide 65: Branch Purchase January 30, 2015
Branch Purchase January 30, 2015 MainSource announced agreement to acquire Old National Bank branches in: Portland, Richmond, Brownstown and Batesville, Indiana and Union City, Ohio Anticipated Purchase Date – August 2015 (Subject to regulatory approvals and customary closing conditions) Strategy fo
Slide 66: ONB Branch Acquisitions
ONB Branch Acquisitions $120 Million in Deposits and $45 Million in Loans Strengthens our footprints in Jay, Wayne, Jackson, and Ripley Counties in Indiana Darke County, Ohio location supports current Wayne County, Ohio presence Meets our financial thresholds related to earnings and capital Compleme
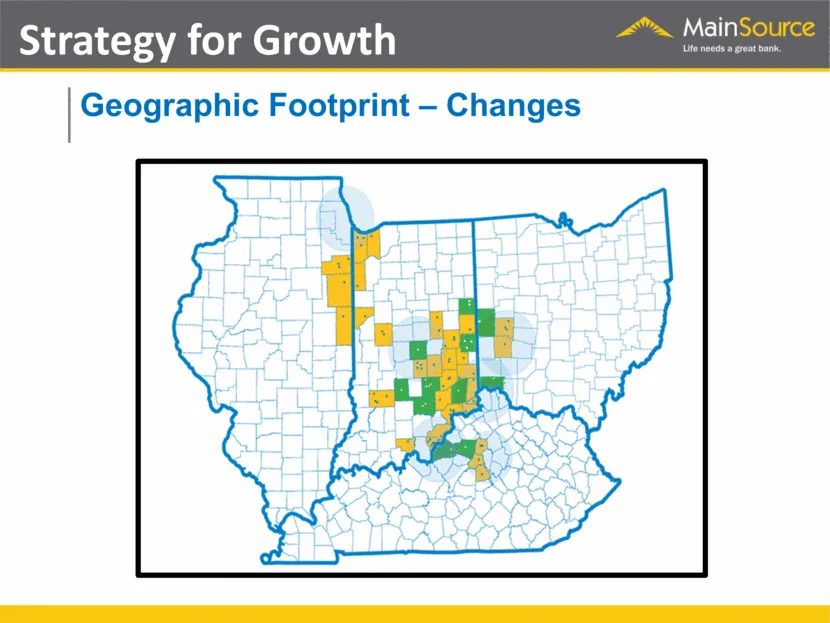
Slide 67: Geographic Footprint - Changes
Geographic Footprint – Changes Strategy for Growth
Slide 68: Expenses
Expenses
Slide 69: Stable Operating Expenses
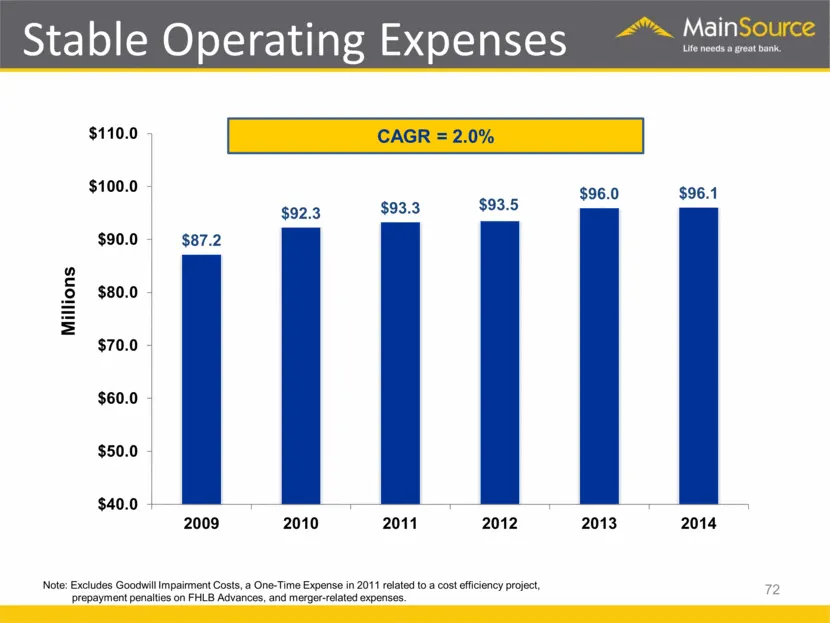
Stable Operating Expenses Millions 72 CAGR = 2.0% Note: Excludes Goodwill Impairment Costs, a One-Time Expense in 2011 related to a cost efficiency project, prepayment penalties on FHLB Advances, and merger-related expenses.
Slide 70: Credit Quality
Credit Quality
Slide 71: Non Performing Loans
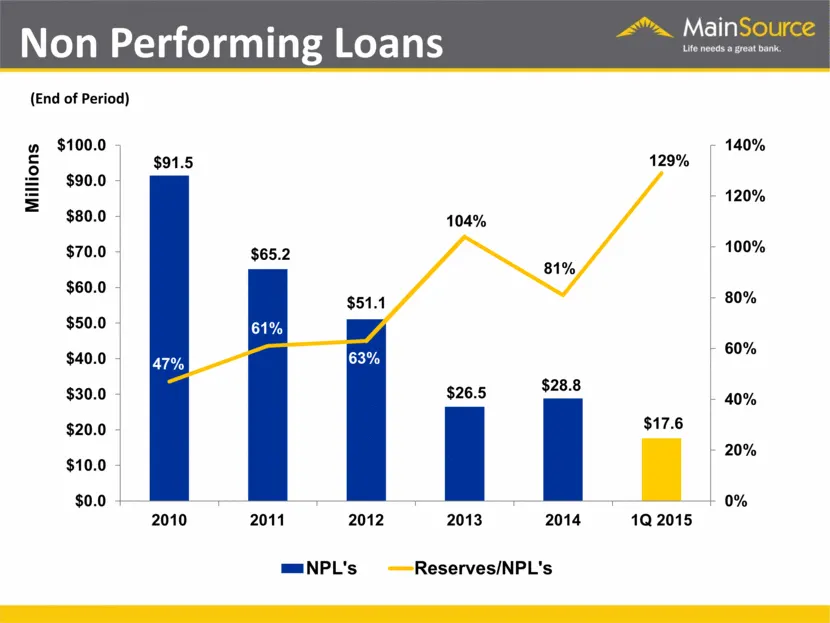
Non Performing Loans Millions (End of Period)
Slide 72: Capital
Capital
Slide 73: Strong Regulatory Capital
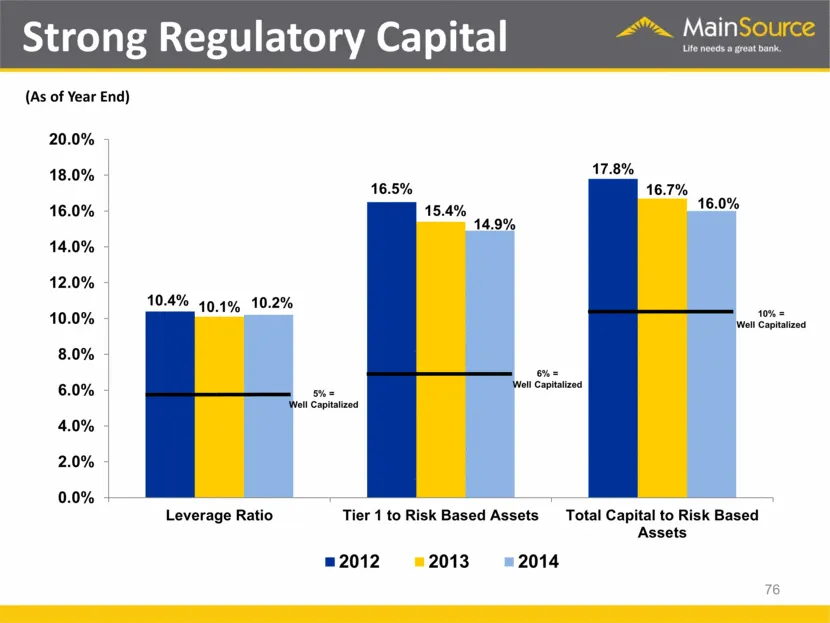
5% = Well Capitalized 6% = Well Capitalized 10% = Well Capitalized Strong Regulatory Capital 76 (As of Year End) 10.4% 16.5% 17.8% 10.1% 15.4% 16.7% 10.2% 14.9% 16.0% 0.0% 2.0% 4.0% 6.0% 8.0% 10.0% 12.0% 14.0% 16.0% 18.0% 20.0% Leverage Ratio Tier 1 to Risk Based Assets Total Capital to Risk Based A
Slide 74: Tangible Common Equity Ratio
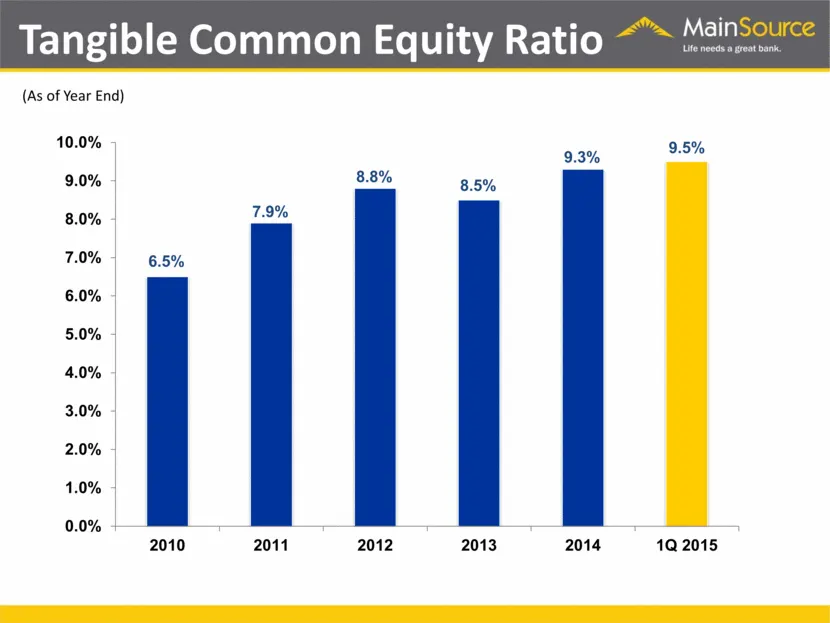
Tangible Common Equity Ratio (As of Year End)
Slide 75: Common Dividend
Common Dividend
Slide 76: Common Dividend
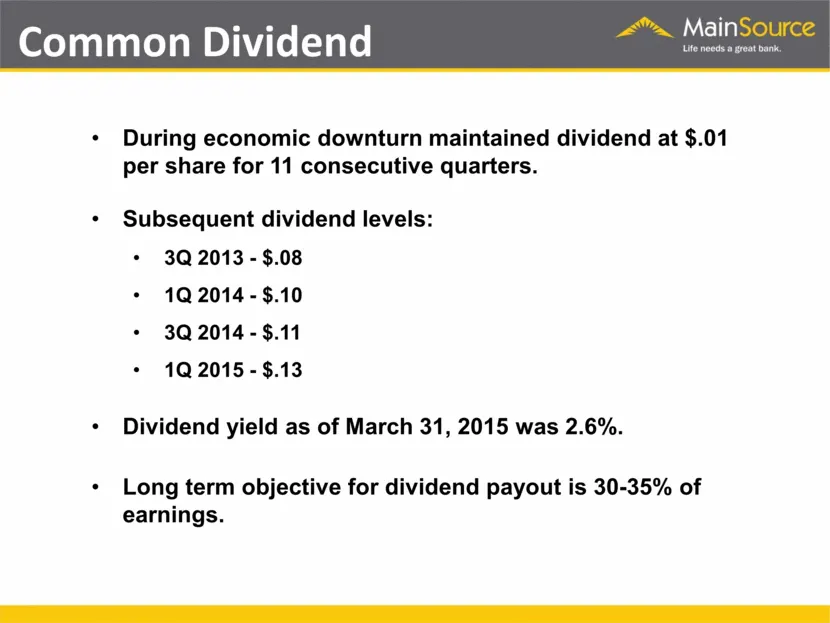
Common Dividend (As of 4.14.11) During economic downturn maintained dividend at $.01 per share for 11 consecutive quarters. Subsequent dividend levels: 3Q 2013 - $.08 1Q 2014 - $.10 3Q 2014 - $.11 1Q 2015 - $.13 Dividend yield as of March 31, 2015 was 2.6%. Long term objective for dividend payout is
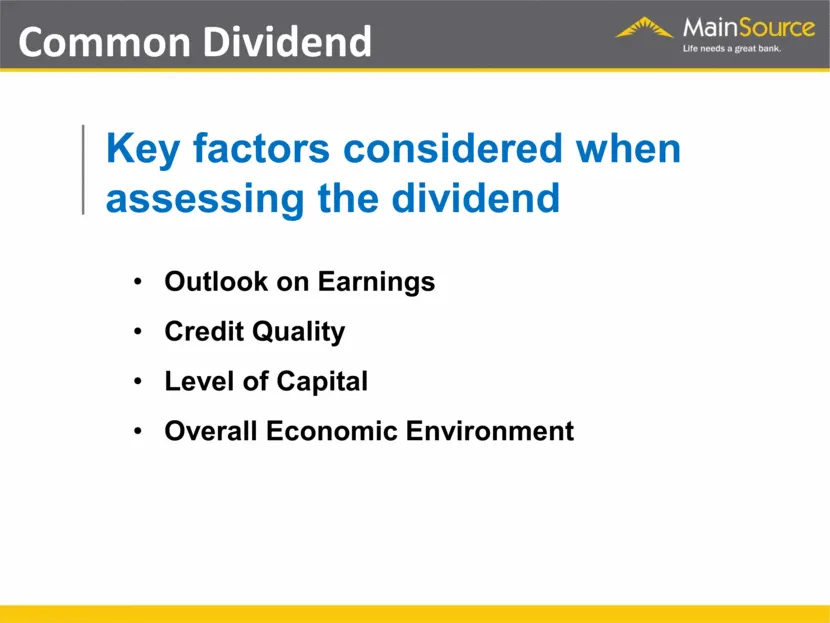
Slide 77: Key factors considered when assessing the dividend
Key factors considered when assessing the dividend Outlook on Earnings Credit Quality Level of Capital Overall Economic Environment Common Dividend (As of 4.14.11)
Slide 78: Stock Repurchase Program
Stock Repurchase Program
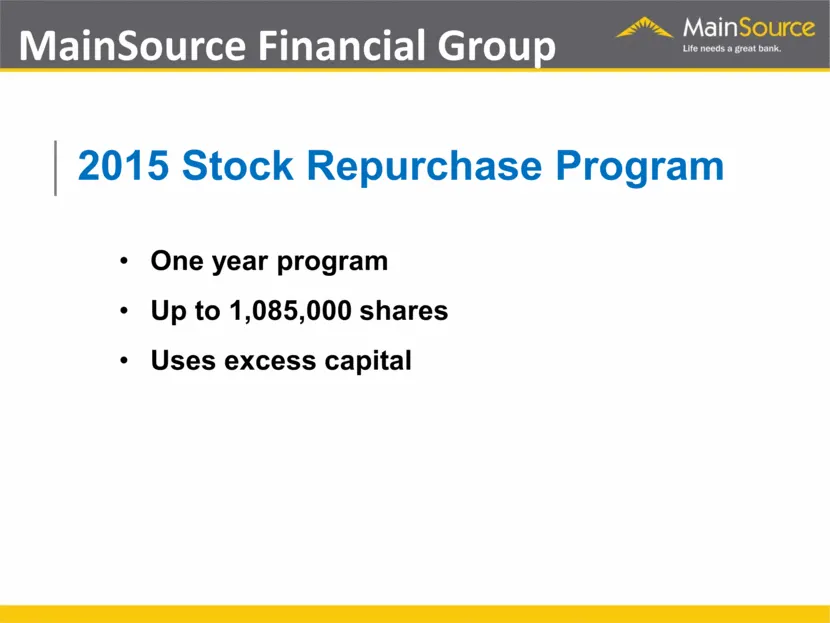
Slide 79: 2015 Stock Repurchase Program
MainSource Financial Group (As of 4.14.11) 2015 Stock Repurchase Program One year program Up to 1,085,000 shares Uses excess capital
Slide 80: 2015 Strategic Priorities
2015 Strategic Priorities
Slide 81: 2015 Strategic Priorities
MainSource Financial Group (As of 4.14.11) 2015 Strategic Priorities Revenue Growth Successfully execute expansion strategies Loan Growth Expense Control Maintain Credit Quality Invest in New Technologies
Slide 82: Mobile banking
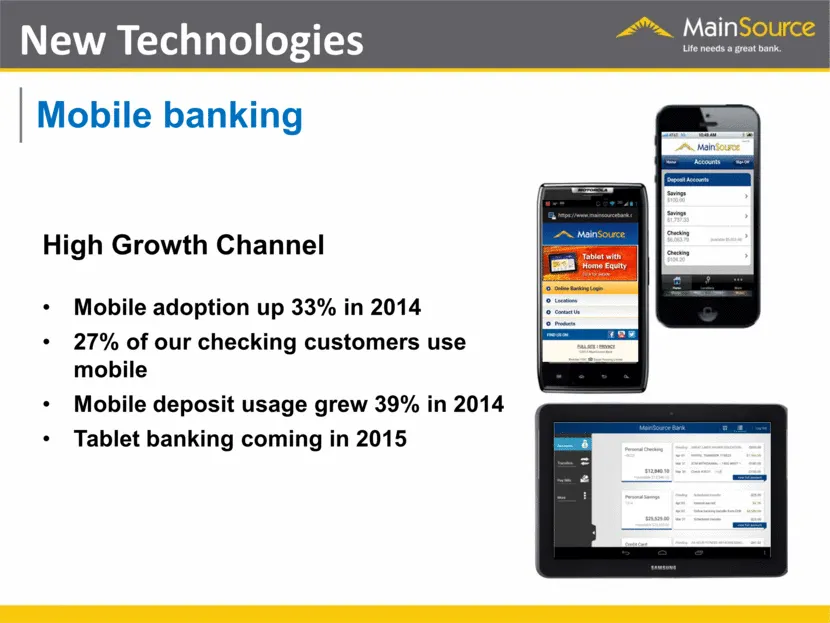
Mobile banking High Growth Channel Mobile adoption up 33% in 2014 27% of our checking customers use mobile Mobile deposit usage grew 39% in 2014 Tablet banking coming in 2015 New Technologies
Slide 83: MainSource Access Teller Video Assisted Banking
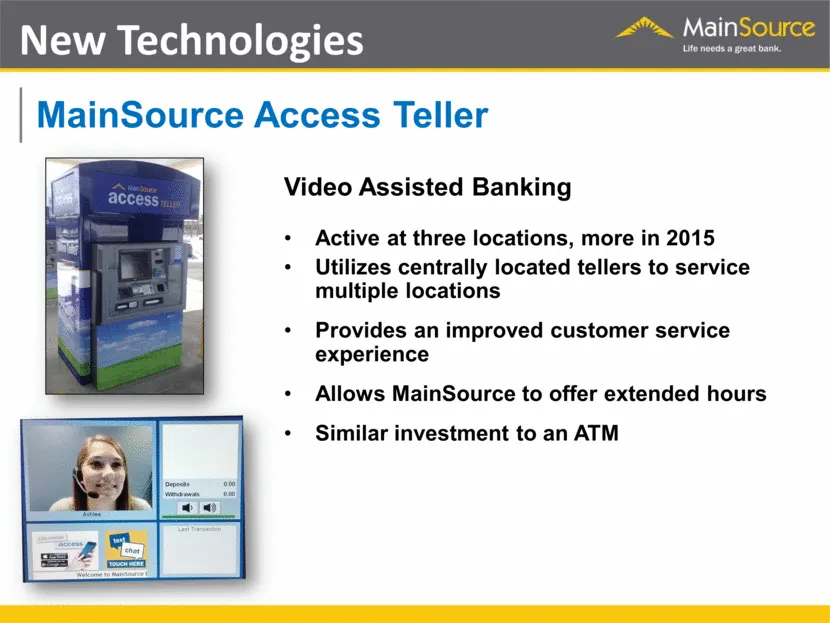
MainSource Access Teller Video Assisted Banking Active at three locations, more in 2015 Utilizes centrally located tellers to service multiple locations Provides an improved customer service experience Allows MainSource to offer extended hours Similar investment to an ATM New Technologies
Slide 84: Debit Card Services
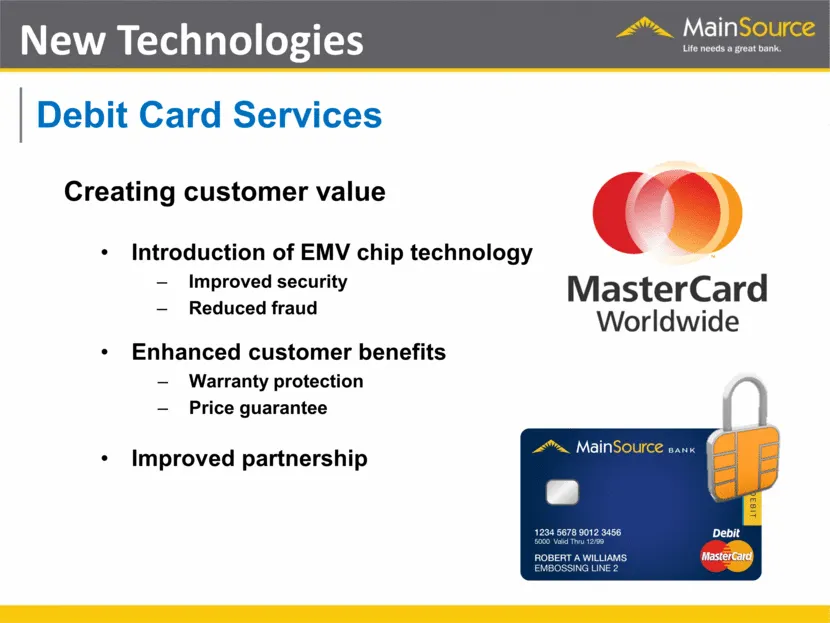
Debit Card Services Creating customer value Introduction of EMV chip technology Improved security Reduced fraud Enhanced customer benefits Warranty protection Price guarantee Improved partnership New Technologies
Slide 85: Questions
Questions
Slide 86: Non-GAAP Reconciliation
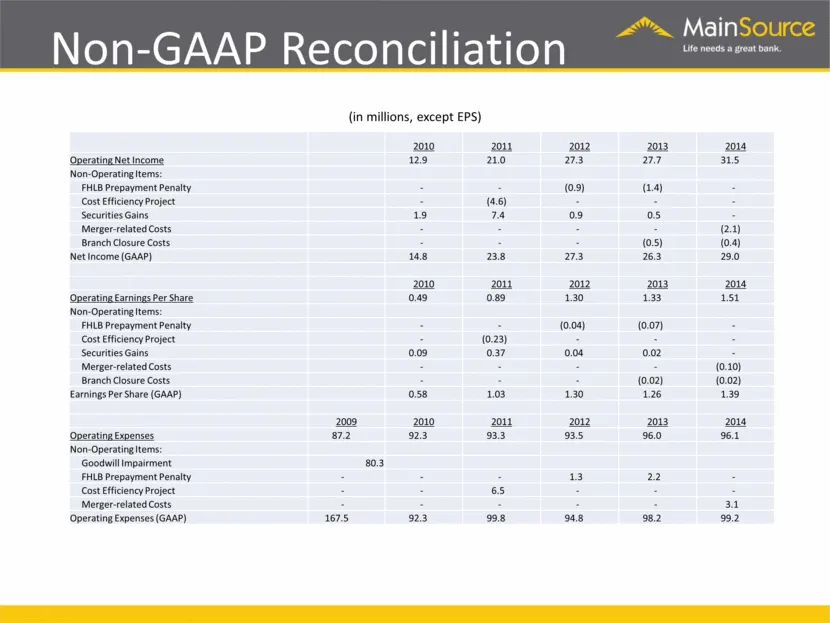
Non-GAAP Reconciliation (in millions, except EPS) 2010 2011 2012 2013 2014 Operating Net Income 12.9 21.0 27.3 27.7 31.5 Non-Operating Items: FHLB Prepayment Penalty - - (0.9) (1.4) - Cost Efficiency Project - (4.6) - - - Securities Gains 1.9 7.4 0.9 0.5 - Merger-related Costs - - - - (2.1) Branch C
Source: SEC EDGAR · 8-K filed Apr 30, 2015
More decks from MainSource Financial Group Inc
 Merger or Acquisition (October 2017)25 slides · Oct 31, 2017
 Merger or Acquisition (July 2017)23 slides · Jul 31, 2017
 Merger or Acquisition (July 2017)19 slides · Jul 26, 2017
 Shareholder Meeting (May 2017)67 slides · May 3, 2017
 Merger or Acquisition (December 2016)7 slides · Dec 19, 2016
 Investor Presentation (September 2016)34 slides · Sep 22, 2016