Earthstone Energy — Investor Presentation (April 2019)
26 slides from Earthstone Energy's investor presentation, Apr 4, 2019
Slide 1: Investor Presentation April 4, 2019
Exhibit 99.1 Investor Presentation April 4, 2019 1
Slide 2: Disclaimer: Forward-Looking Statements
Disclaimer Forward-Looking Statements This presentation contains forward-looking statements within the meaning of Section 27A of the Securities Act of 1933, as amended (the “Securities Act”), and Section 21E of the Securities Exchange Act of 1934, as amended (the “Exchange Act”). Statements that are
Slide 3: Investment Highlights
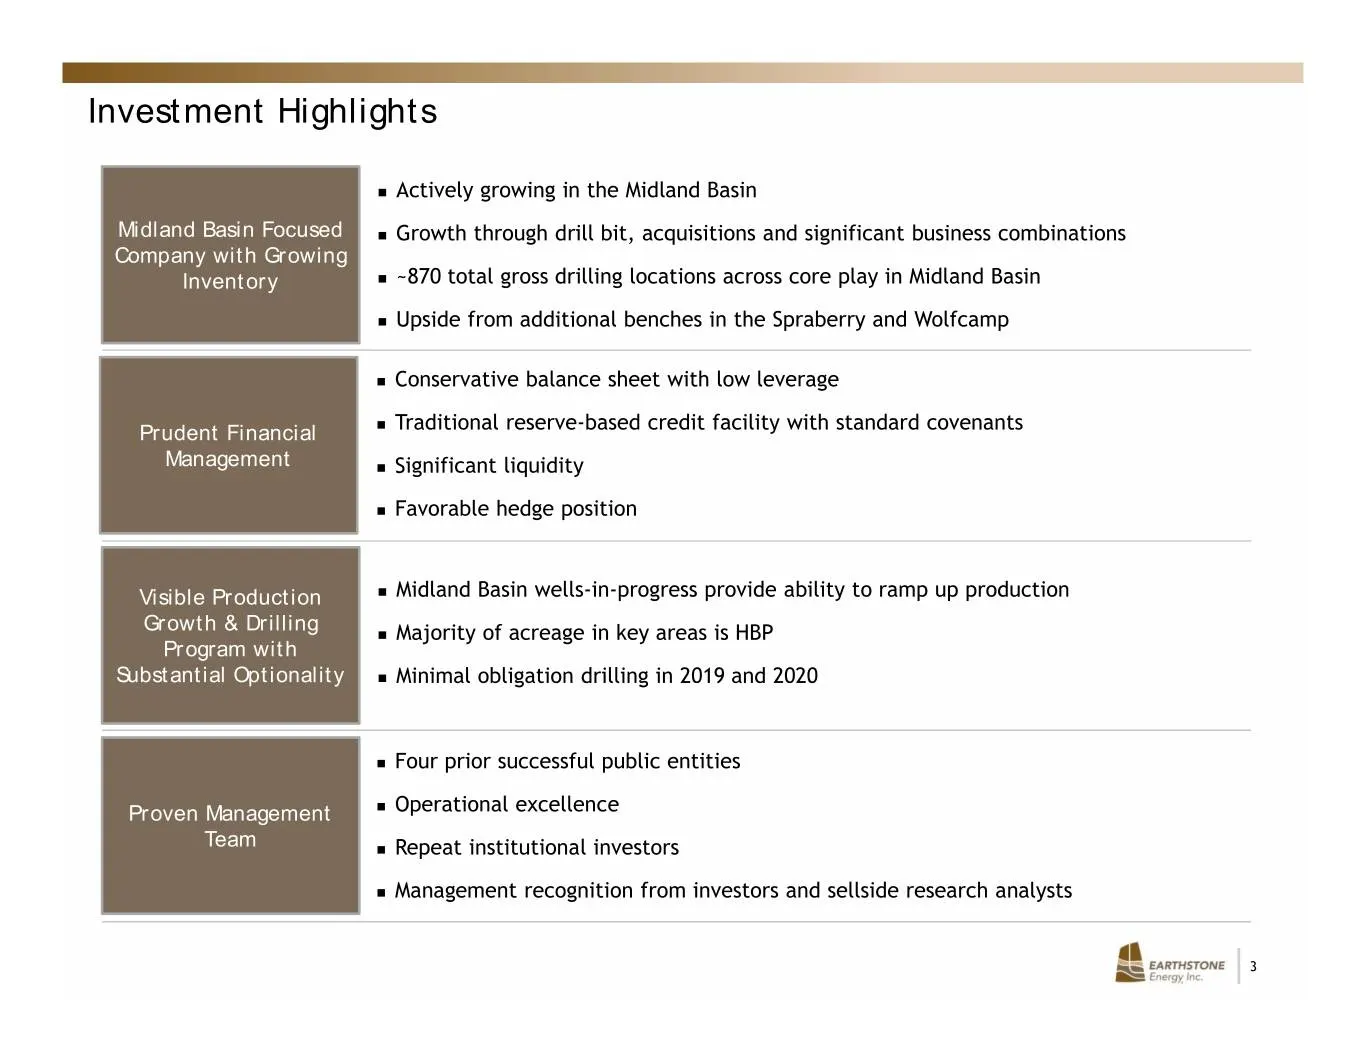
Investment Highlights Actively growing in the Midland Basin Midland Basin Focused Growth through drill bit, acquisitions and significant business combinations Company with Growing Inventory ~870 total gross drilling locations across core play in Midland Basin Upside from additional benches i
Slide 4: Proven Leadership and Track Record of Value Creation
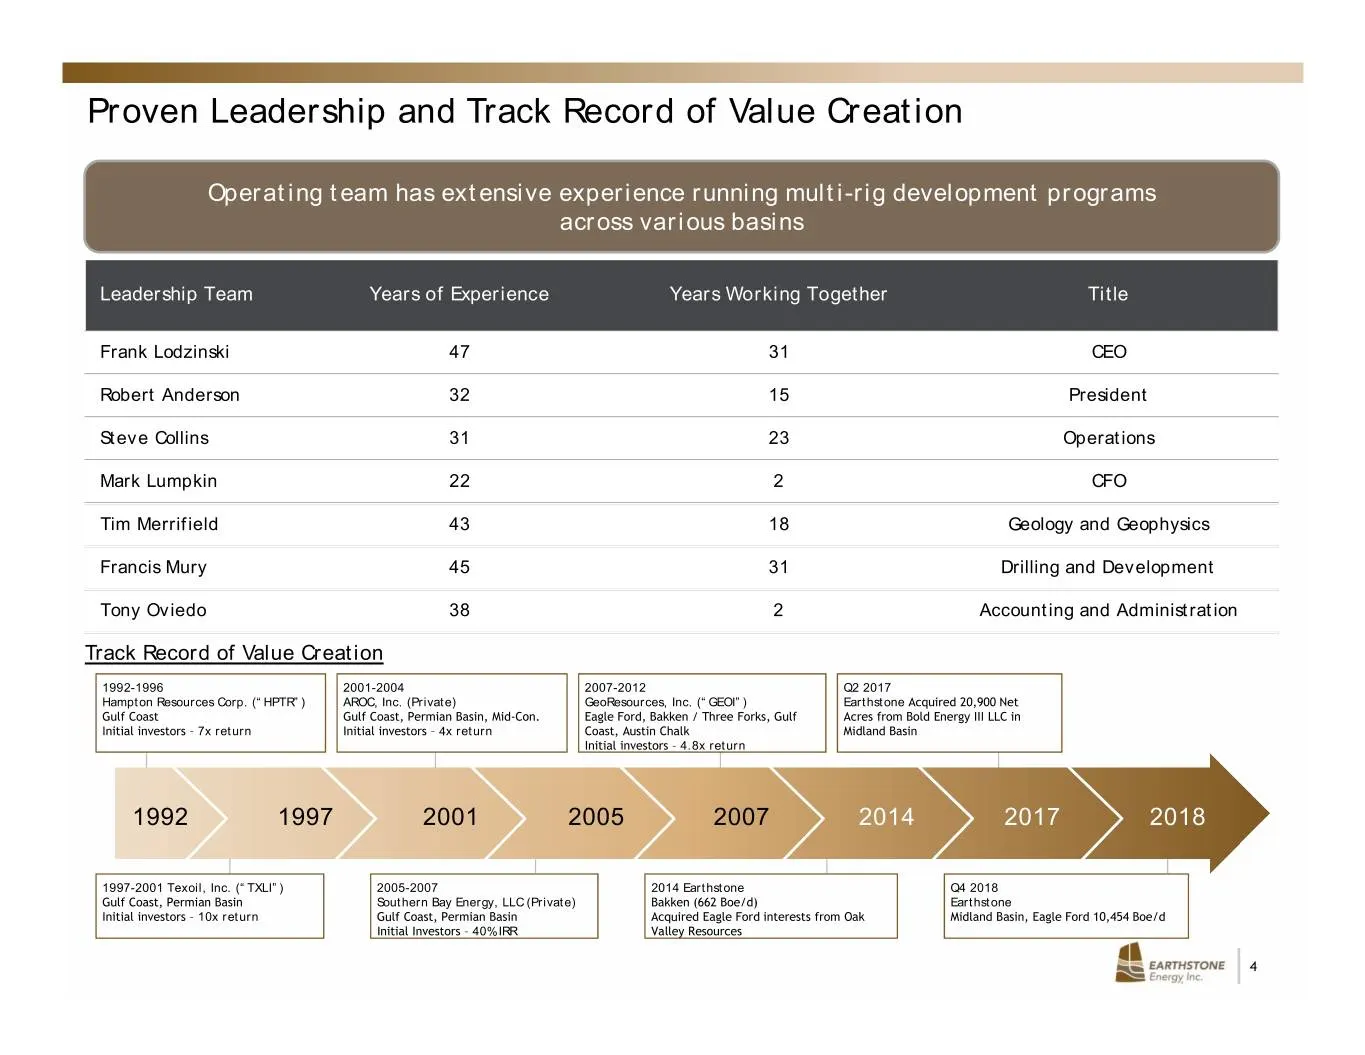
Proven Leadership and Track Record of Value Creation Operating team has extensive experience running multi-rig development programs across various basins Leadership Team Years of Experience Years Working Together Title Frank Lodzinski 47 31 CEO Robert Anderson 32 15 President Steve Collins 31 23 Ope
Slide 5: Midland Basin Growth Story
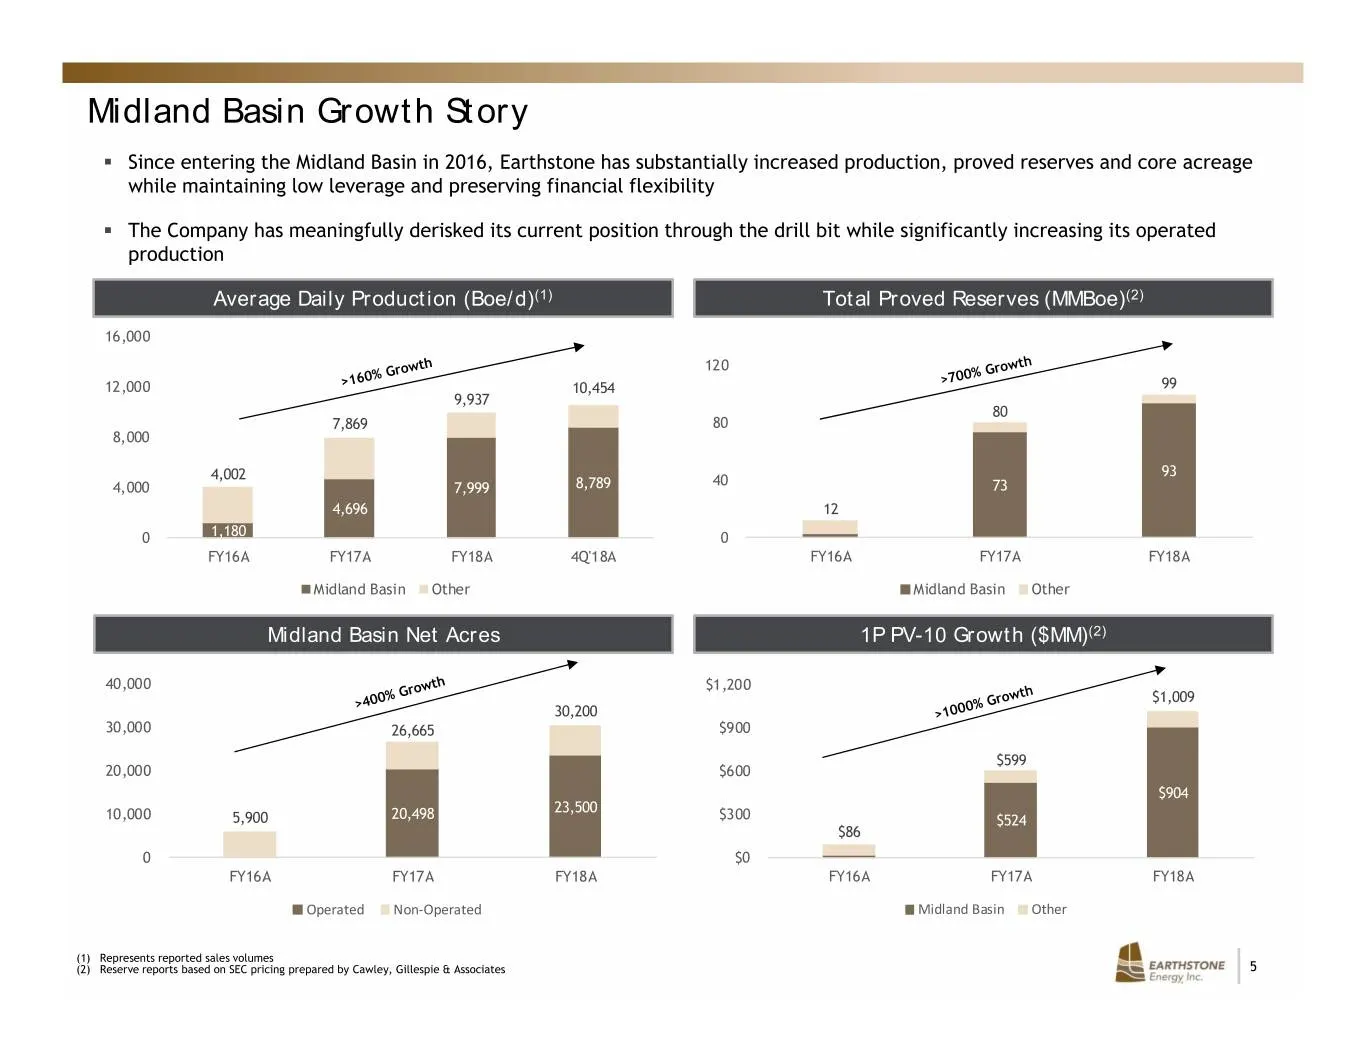
Midland Basin Growth Story . Since entering the Midland Basin in 2016, Earthstone has substantially increased production, proved reserves and core acreage while maintaining low leverage and preserving financial flexibility . The Company has meaningfully derisked its current position through the dril
Slide 6: Consistent Growth and Margin Expansion While Maintaining a Strong Balance Sheet
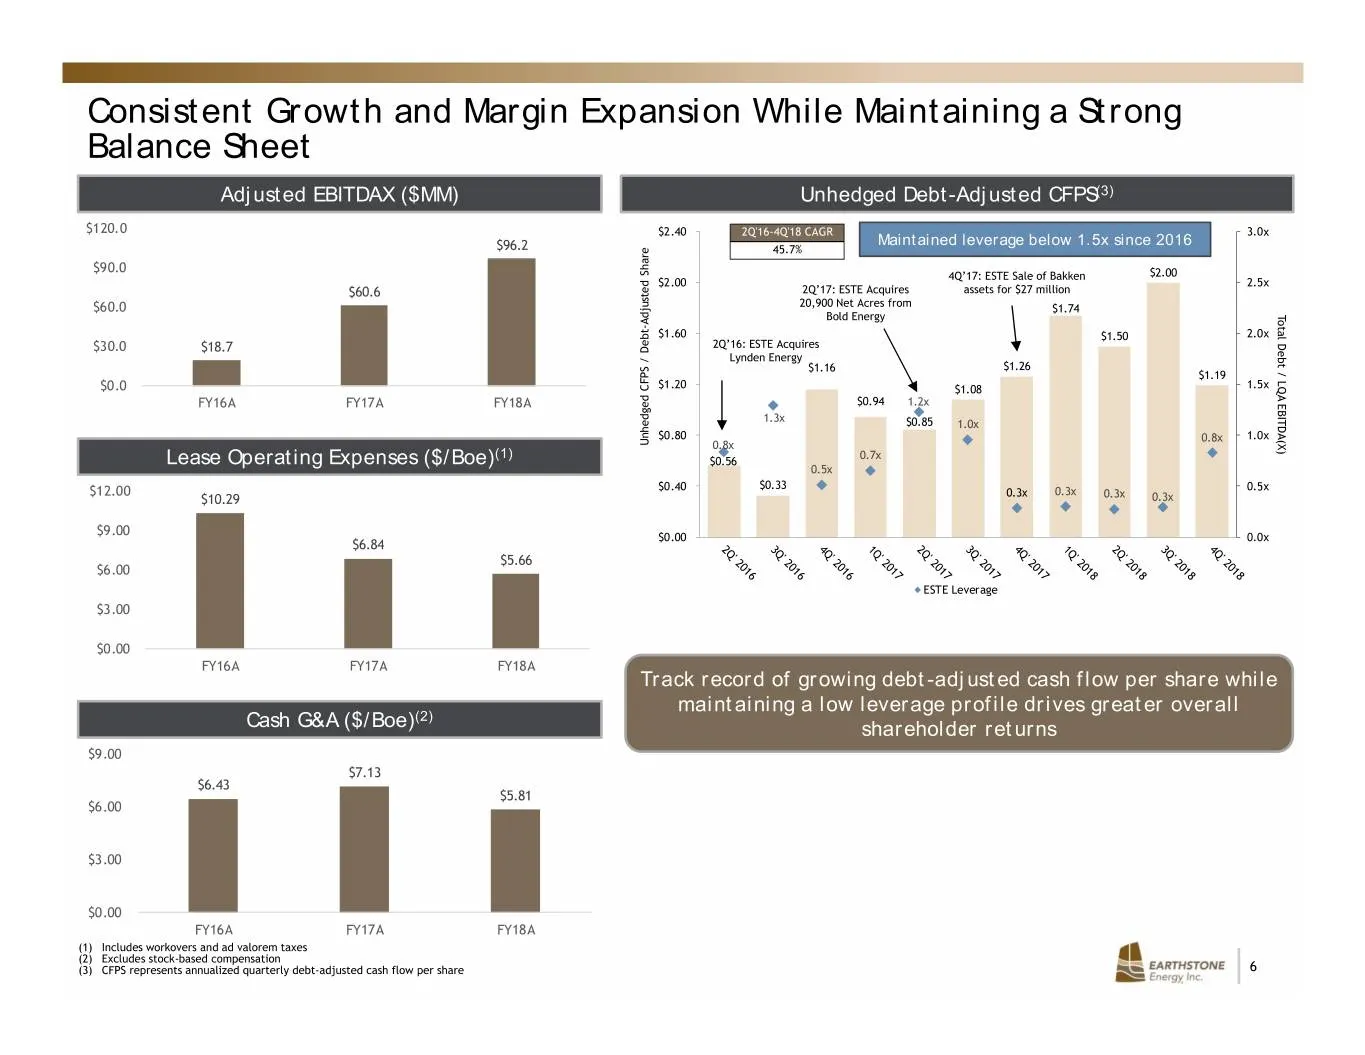
Consistent Growth and Margin Expansion While Maintaining a Strong Balance Sheet Adjusted EBITDAX ($MM) Unhedged Debt-Adjusted CFPS(3) $120.0 $2.40 2Q'16-4Q'18 CAGR 3.0x Maintained leverage below 1.5x since 2016 $96.2 45.7% $90.0 4Q’17: ESTE Sale of Bakken $2.00 $2.00 2.5x $60.6 2Q’17: ESTE Acquires
Slide 7: Company Overview
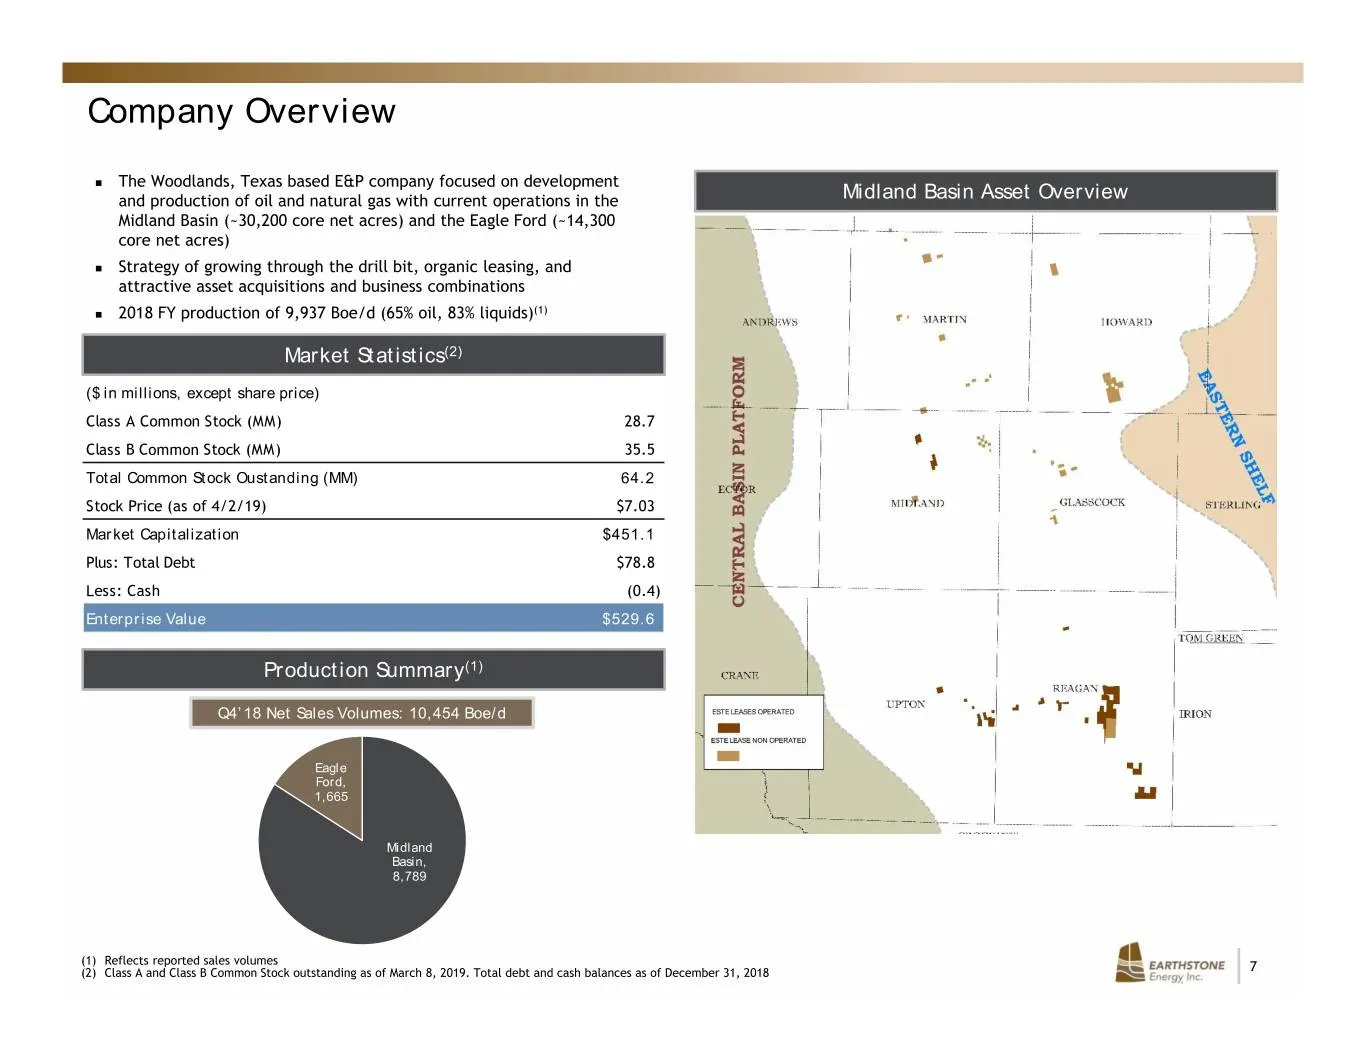
Company Overview The Woodlands, Texas based E&P company focused on development and production of oil and natural gas with current operations in the Midland Basin Asset Overview Midland Basin (~30,200 core net acres) and the Eagle Ford (~14,300 core net acres) Strategy of growing through the dril
Slide 8: Earthstone by the Numbers: Increased Size, Scale and Core Inventory
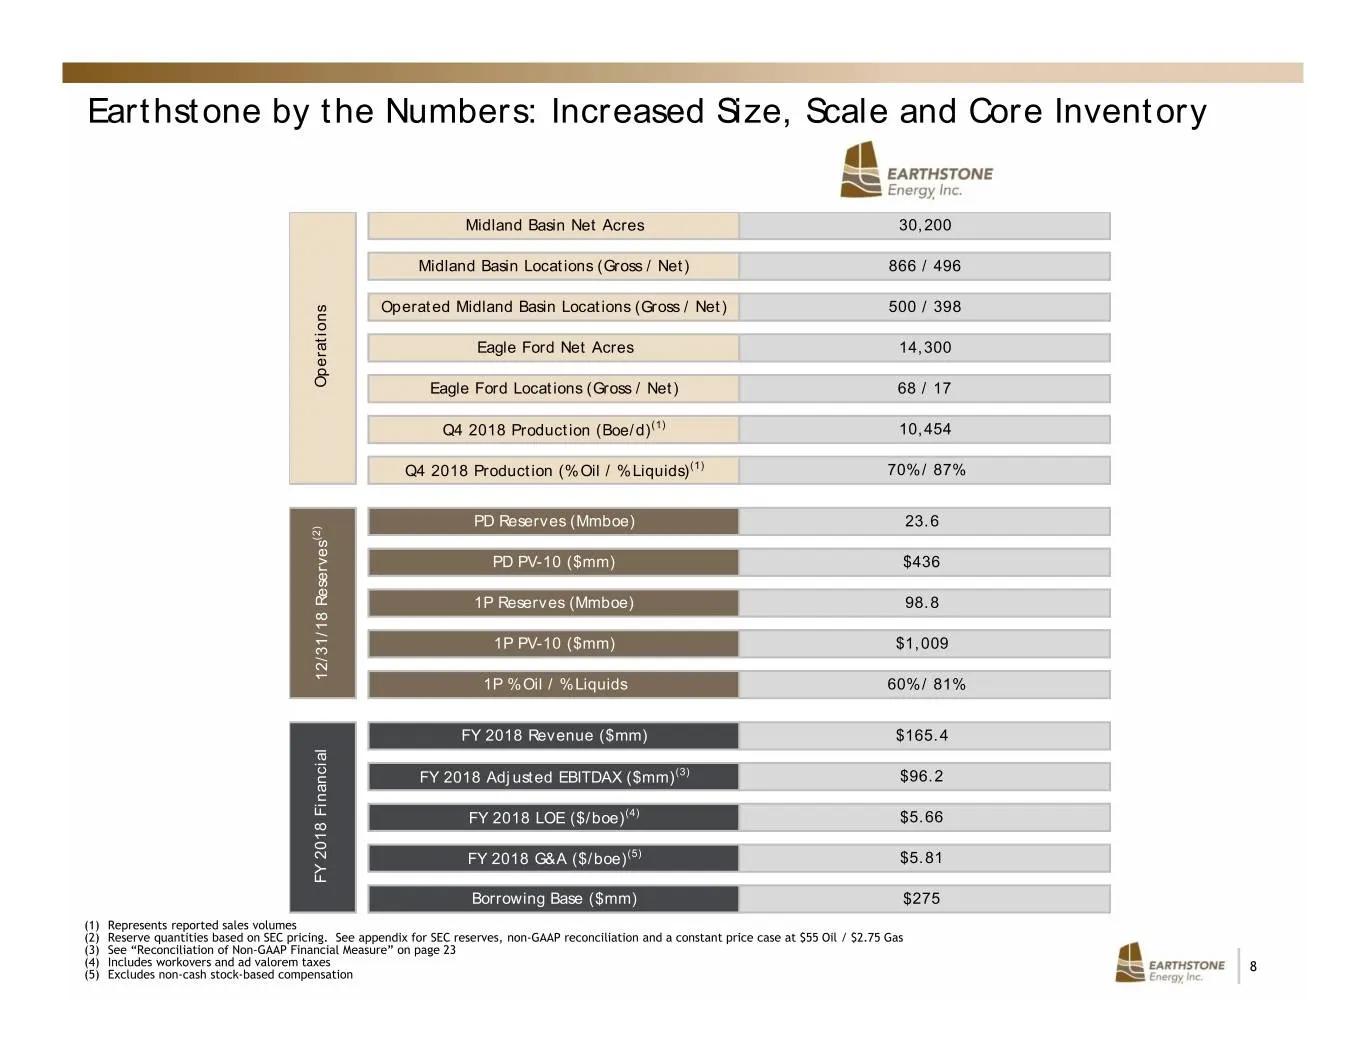
Earthstone by the Numbers: Increased Size, Scale and Core Inventory Midland Basin Net Acres 30,200 Midland Basin Locations (Gross / Net) 866 / 496 Operated Midland Basin Locations (Gross / Net) 500 / 398 Eagle Ford Net Acres 14,300 Operations Eagle Ford Locations (Gross / Net) 68 / 17 Q4 2018 Produc
Slide 9: Areas of Operations
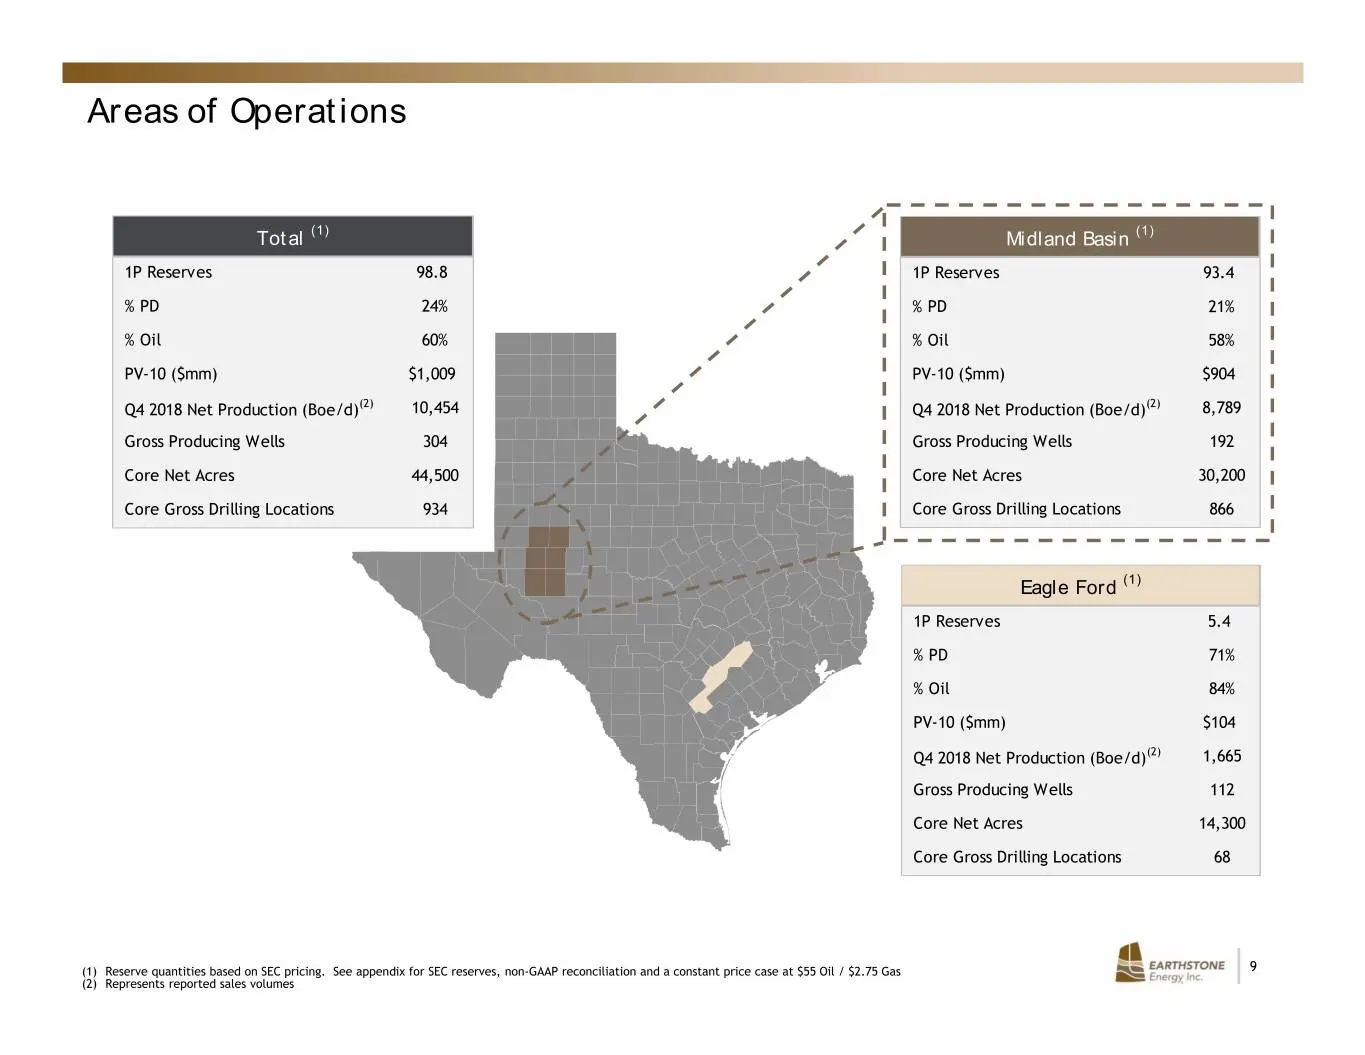
Areas of Operations Total (1) Midland Basin (1) 1P Reserves 98.8 1P Reserves 93.4 % PD 24% % PD 21% % Oil 60% % Oil 58% PV-10 ($mm) $1,009 PV-10 ($mm) $904 Q4 2018 Net Production (Boe/d)(2) 10,454 Q4 2018 Net Production (Boe/d)(2) 8,789 Gross Producing Wells 304 Gross Producing Wells 192 Core Net Ac
Slide 10: Continuous Focus on Operational Improvement
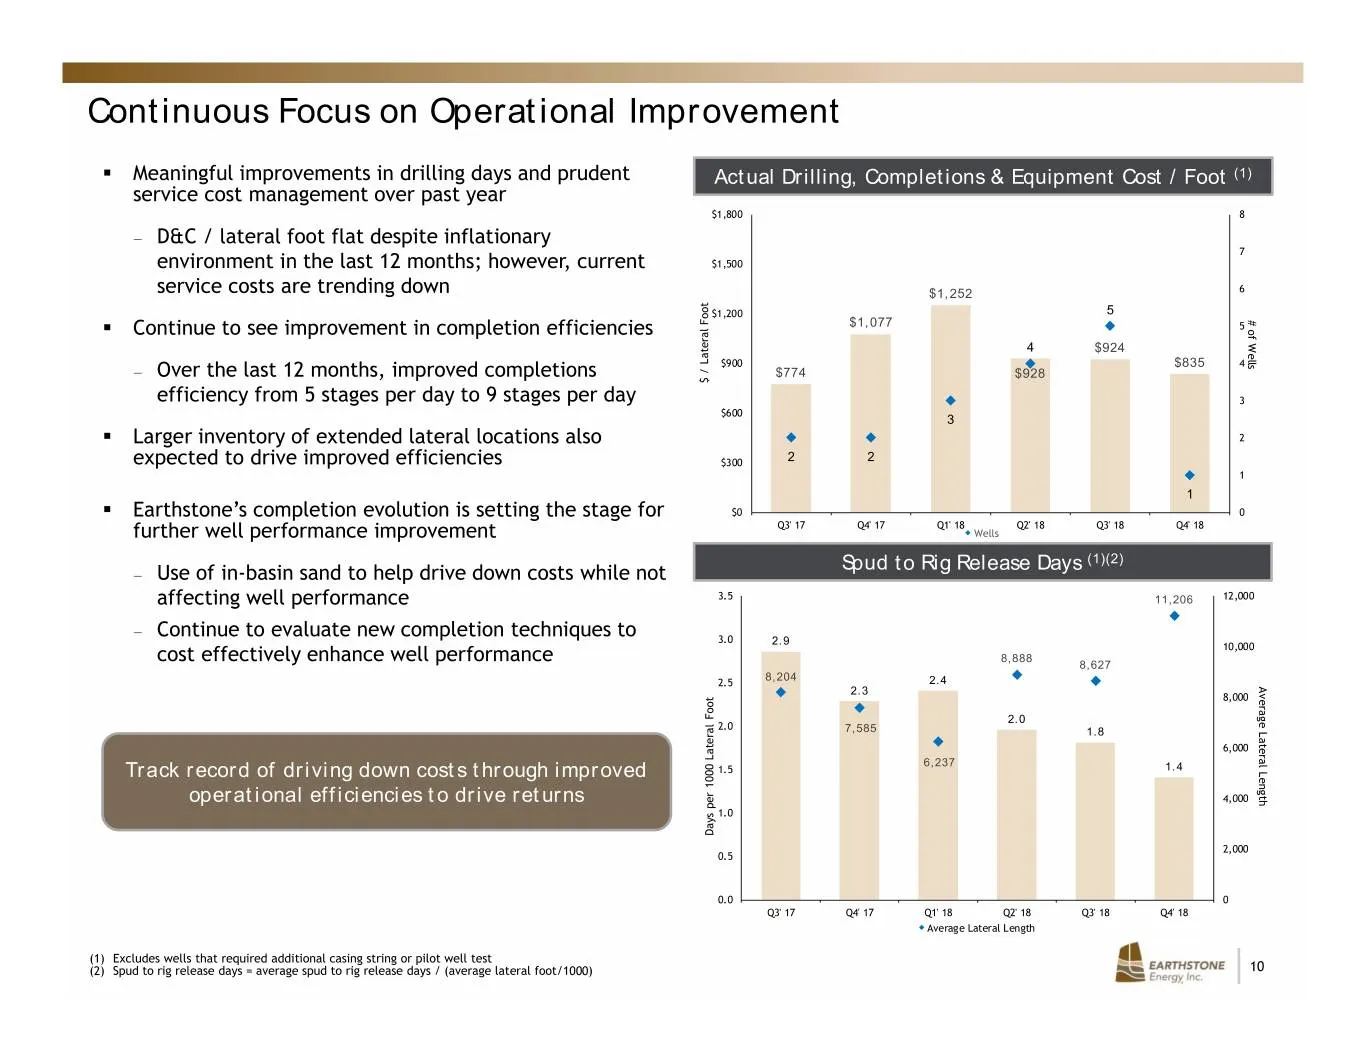
Continuous Focus on Operational Improvement . Meaningful improvements in drilling days and prudent Actual Drilling, Completions & Equipment Cost / Foot (1) service cost management over past year $1,800 8 ― D&C / lateral foot flat despite inflationary 7 environment in the last 12 months; however, cur
Slide 11: Asset Overview
Asset Overview EARTHSTONE | " Energy, inc
Slide 12: Significant Position in the Midland Basin
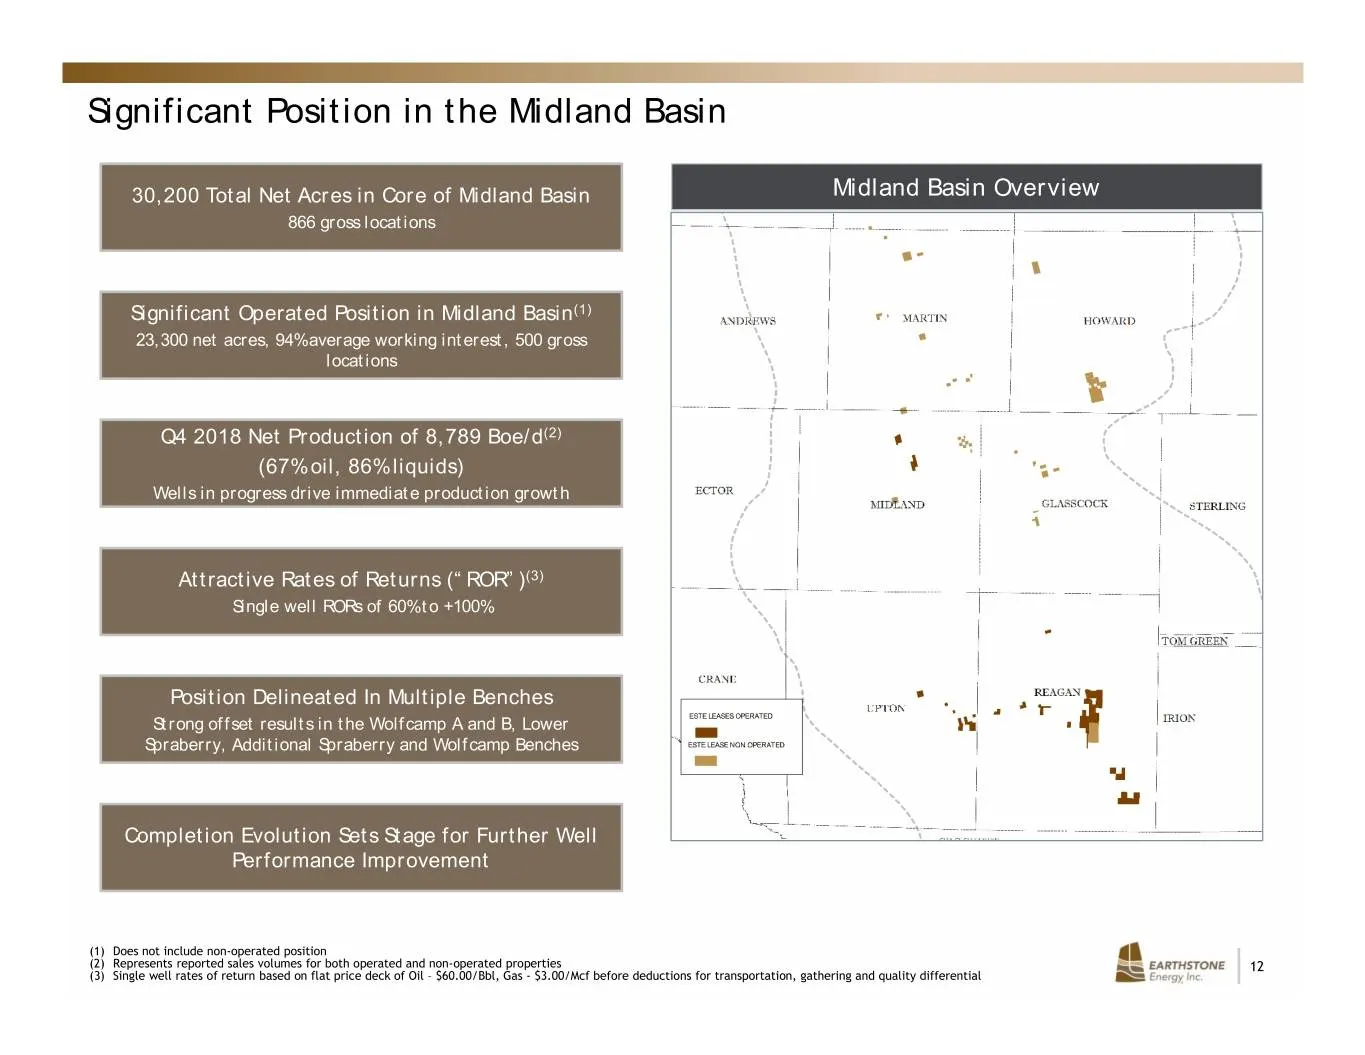
Significant Position in the Midland Basin 30,200 Total Net Acres in Core of Midland Basin Midland Basin Overview 866 gross locations Significant Operated Position in Midland Basin(1) 23,300 net acres, 94% average working interest, 500 gross locations Q4 2018 Net Production of 8,789 Boe/d(2) (67% oil
Slide 13: High Quality Pay Across Multiple Zones
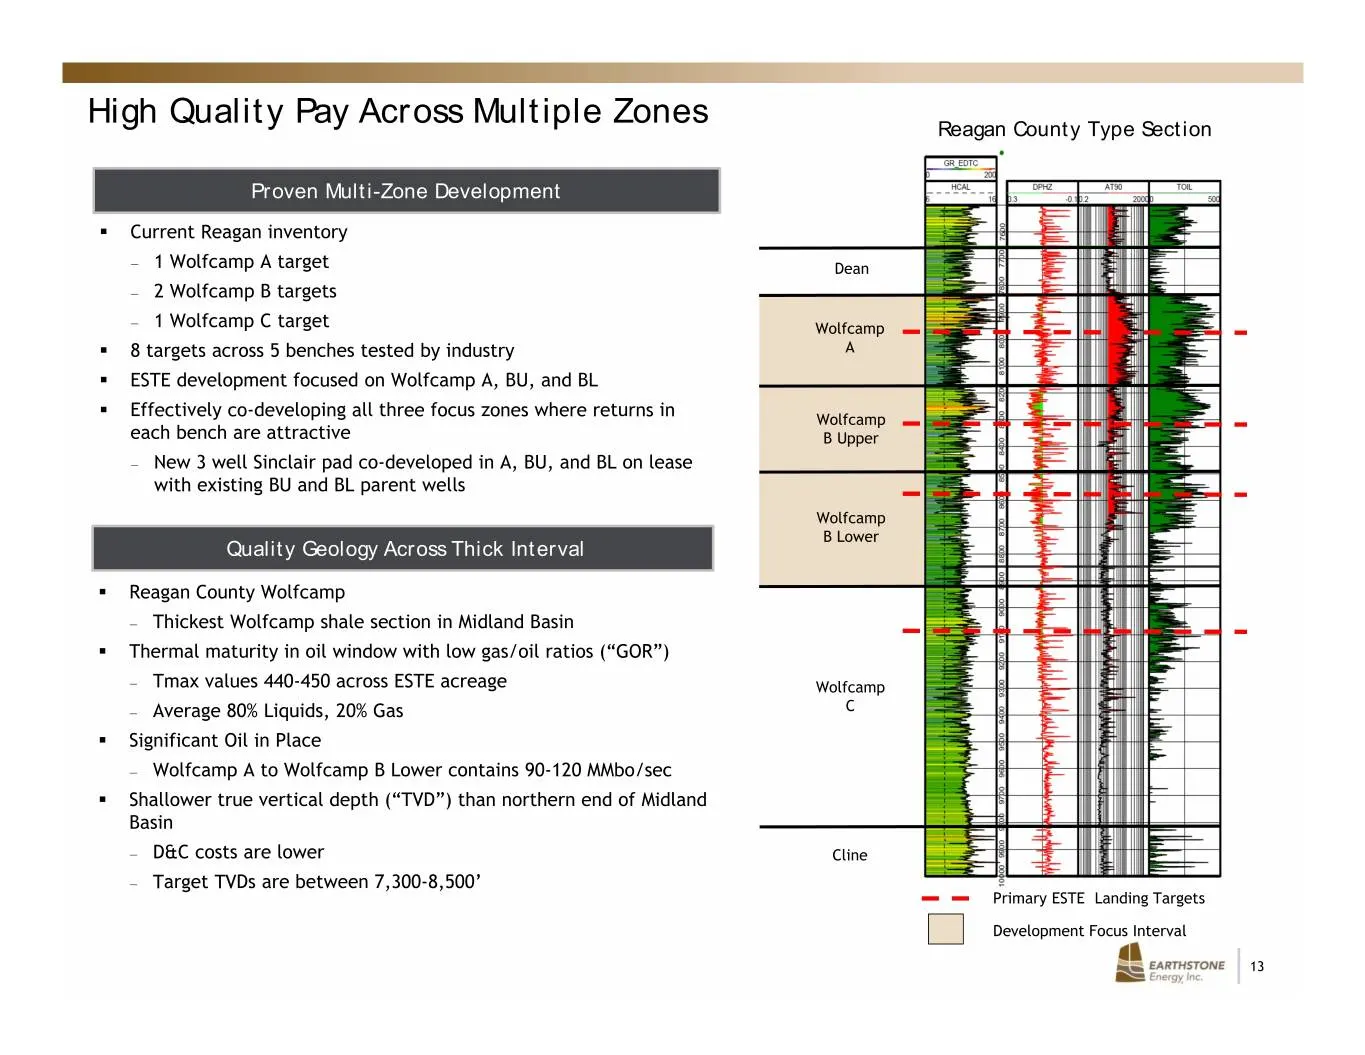
High Quality Pay Across Multiple Zones Reagan County Type Section Proven Multi-Zone Development . Current Reagan inventory ― 1 Wolfcamp A target Dean ― 2 Wolfcamp B targets ― 1 Wolfcamp C target Wolfcamp . 8 targets across 5 benches tested by industry A . ESTE development focused on Wolfcamp A, BU,
Slide 14: Recent Southern Midland Basin Results
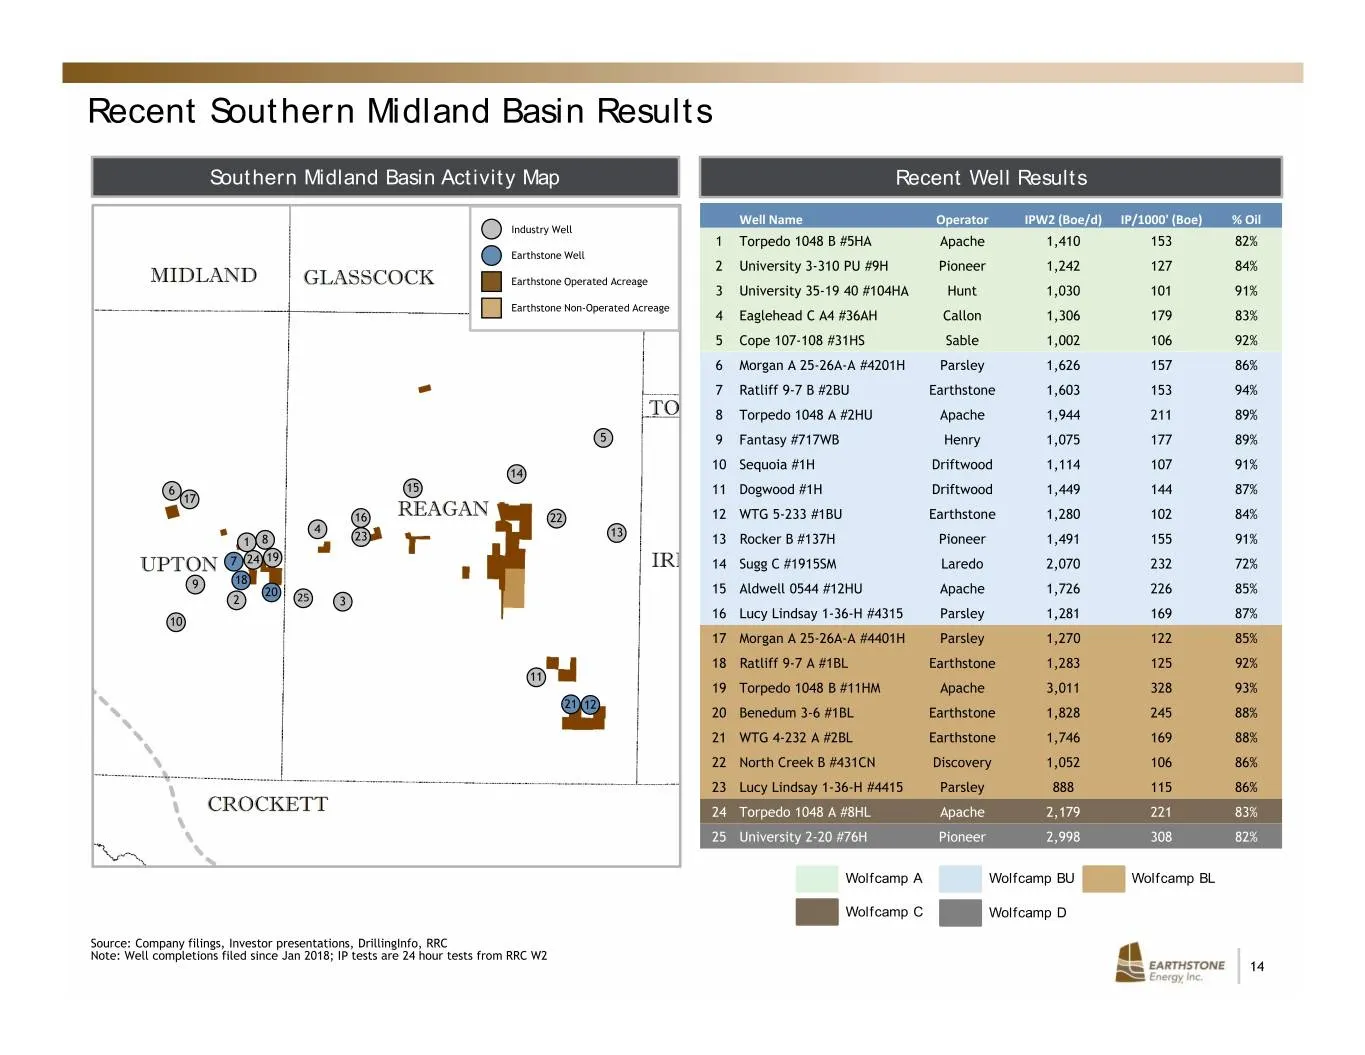
Recent Southern Midland Basin Results Southern Midland Basin Activity Map Recent Well Results Well Name Operator IPW2 (Boe/d) IP/1000' (Boe) % Oil Industry Well 1 Torpedo 1048 B #5HA Apache 1,410 153 82% Earthstone Well 2 University 3-310 PU #9H Pioneer 1,242 127 84% Earthstone Operated Acreage 3 Un
Slide 15: Differentiated, Balanced Inventory in Midland Basin
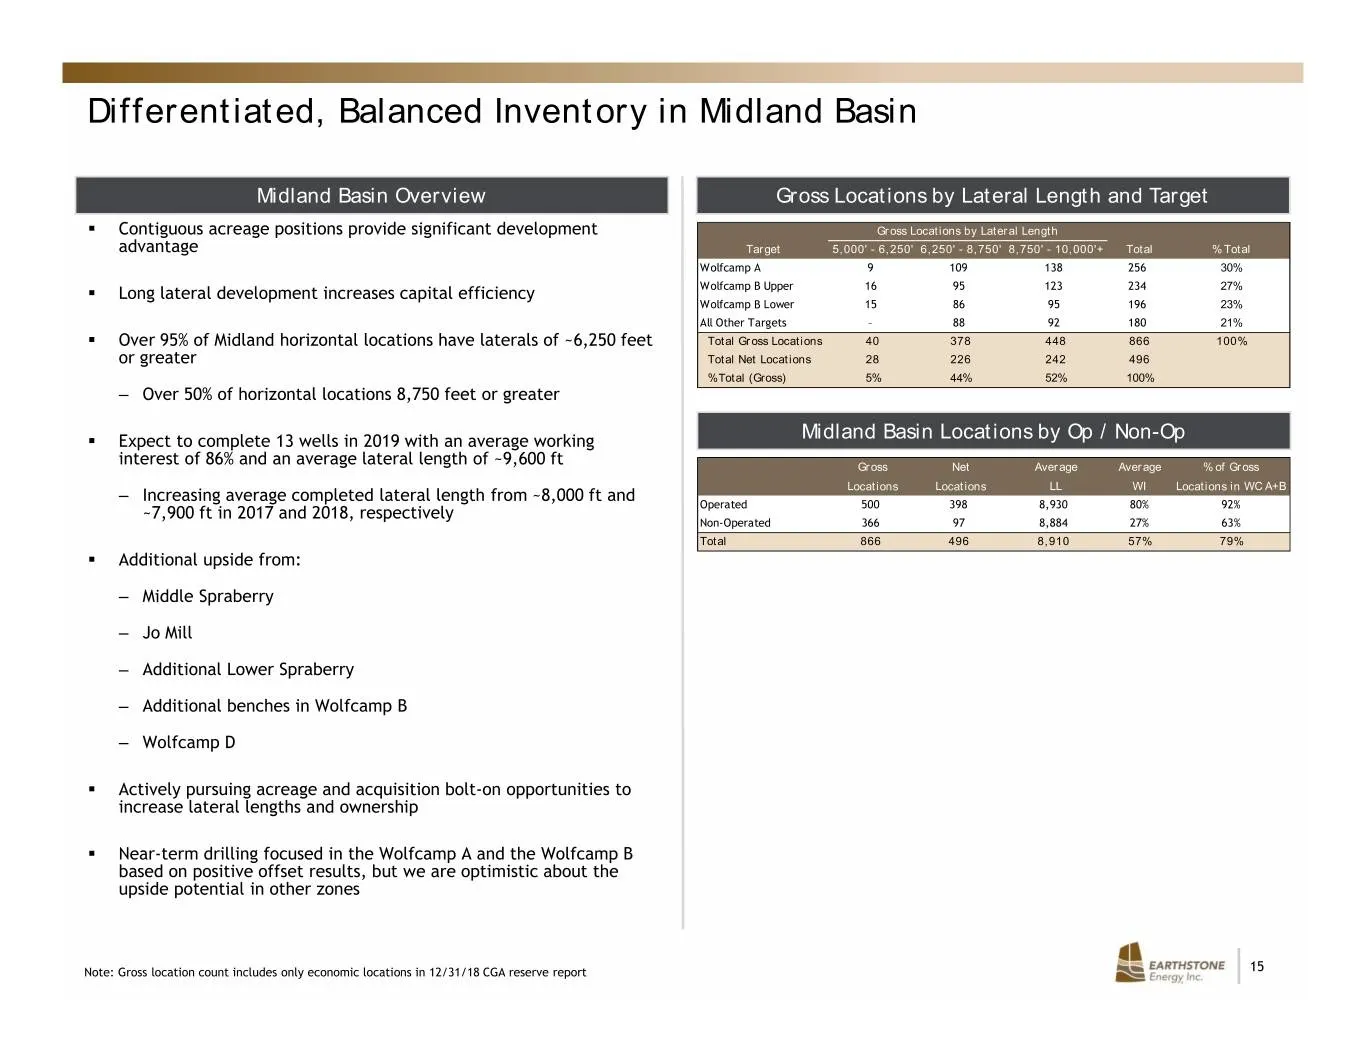
Differentiated, Balanced Inventory in Midland Basin Midland Basin Overview Gross Locations by Lateral Length and Target . Contiguous acreage positions provide significant development Gross Locations by Lateral Length advantage Target 5,000' - 6,250' 6,250' - 8,750' 8,750' - 10,000'+ Total % Total Wo
Slide 16: Midland Basin Performance Review
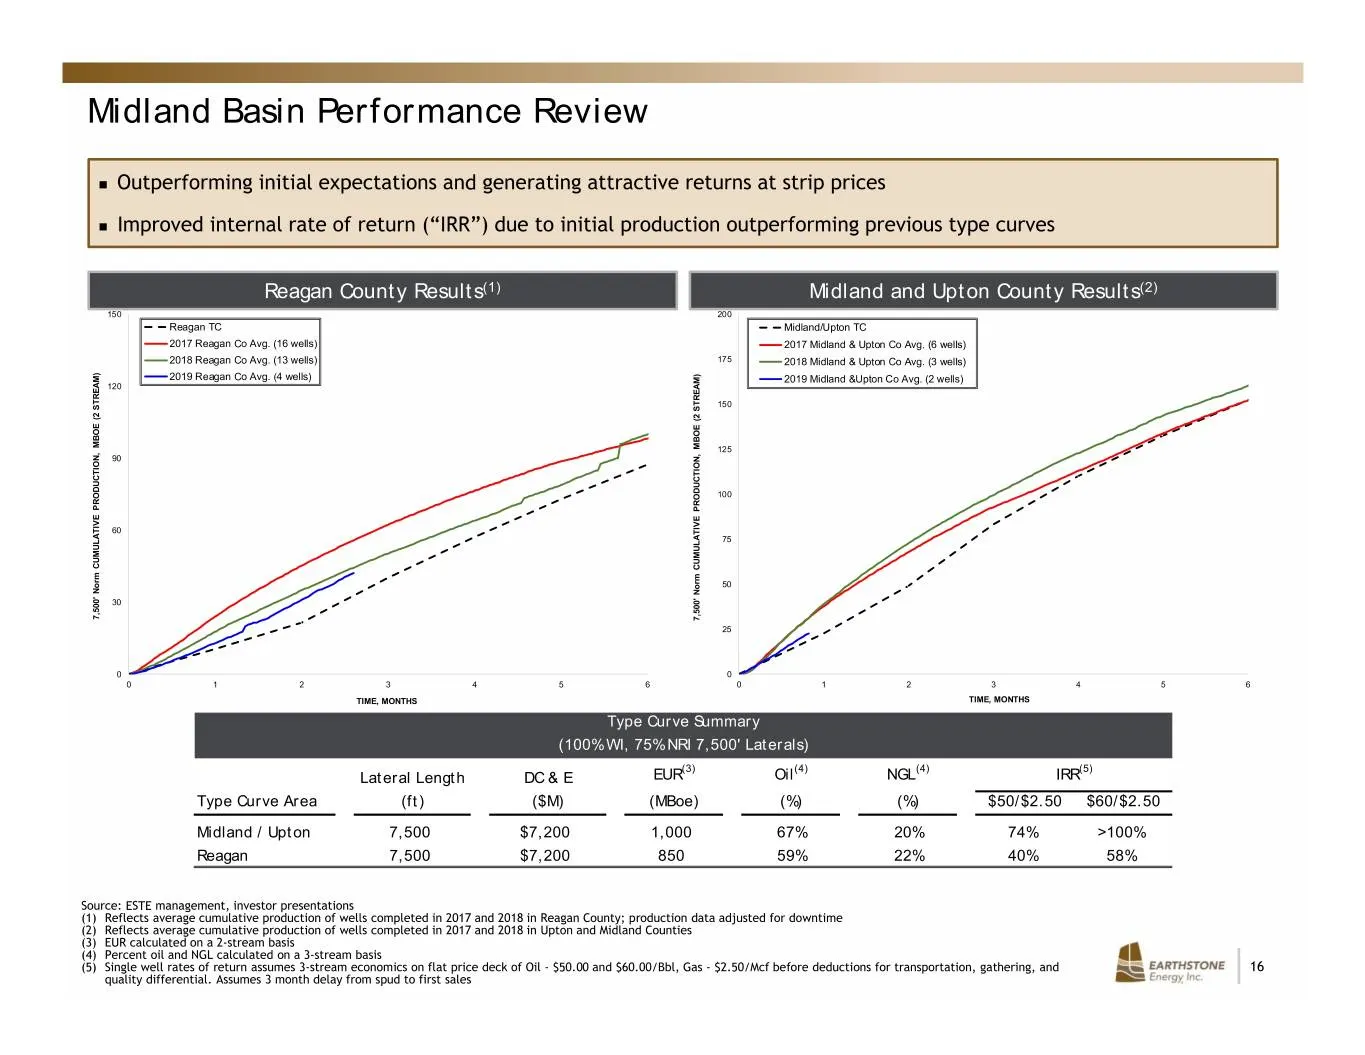
Midland Basin Performance Review Outperforming initial expectations and generating attractive returns at strip prices Improved internal rate of return (“IRR”) due to initial production outperforming previous type curves Reagan County Results(1) Midland and Upton County Results(2) 150 200 Reagan
Slide 17: Acreage Trade – Central Reagan County
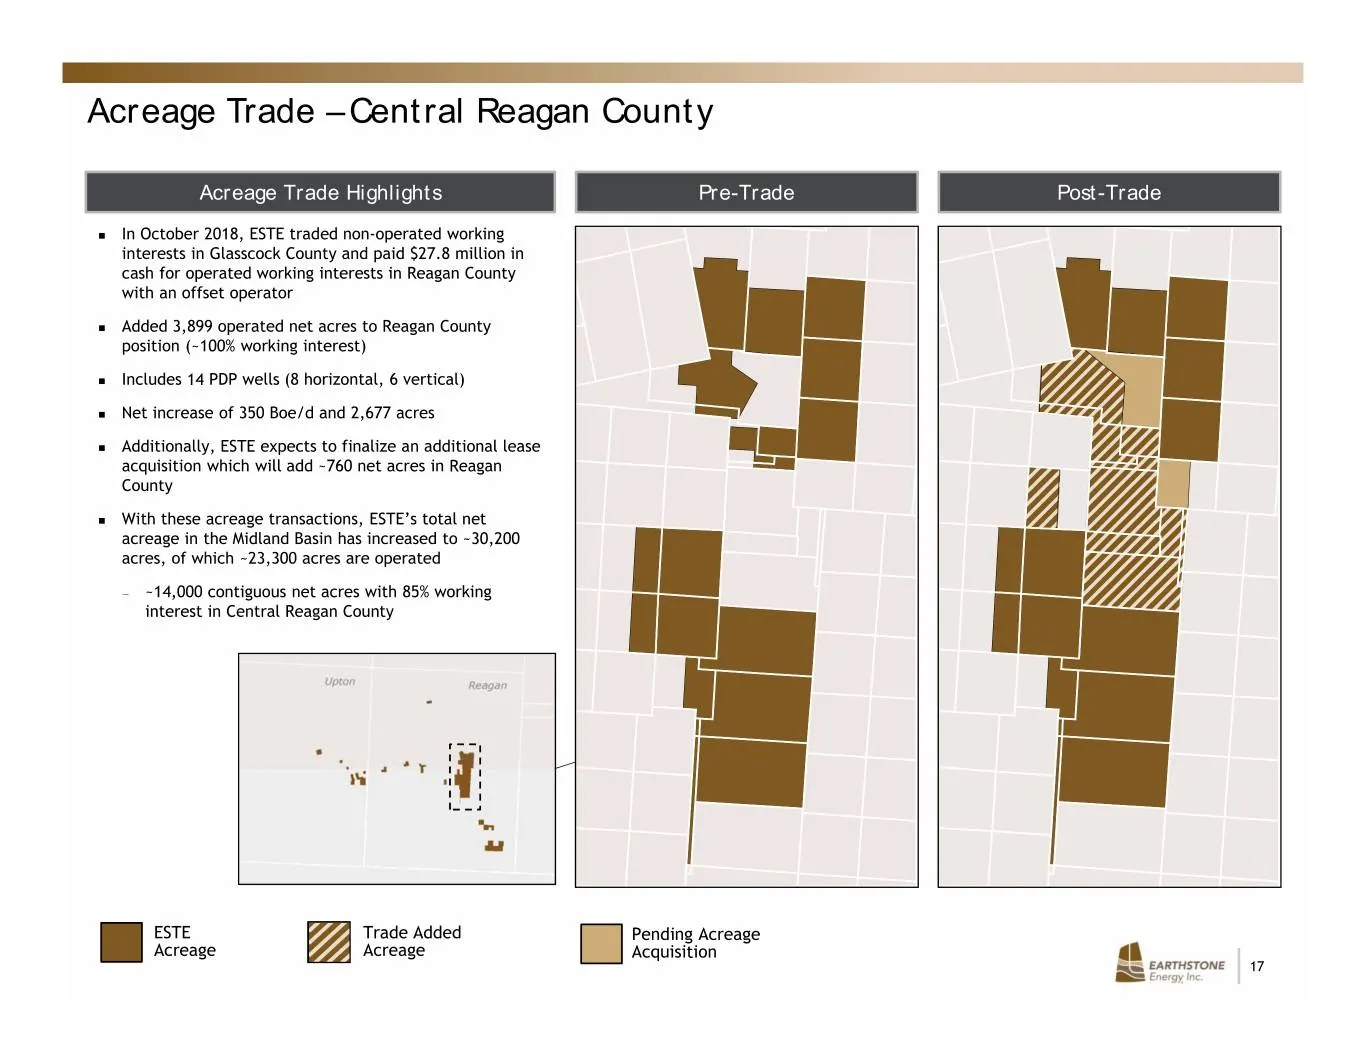
Acreage Trade – Central Reagan County Acreage Trade Highlights Pre-Trade Post-Trade In October 2018, ESTE traded non-operated working interests in Glasscock County and paid $27.8 million in cash for operated working interests in Reagan County with an offset operator Added 3,899 operated net acre
Slide 18: Eagle Ford Asset Overview
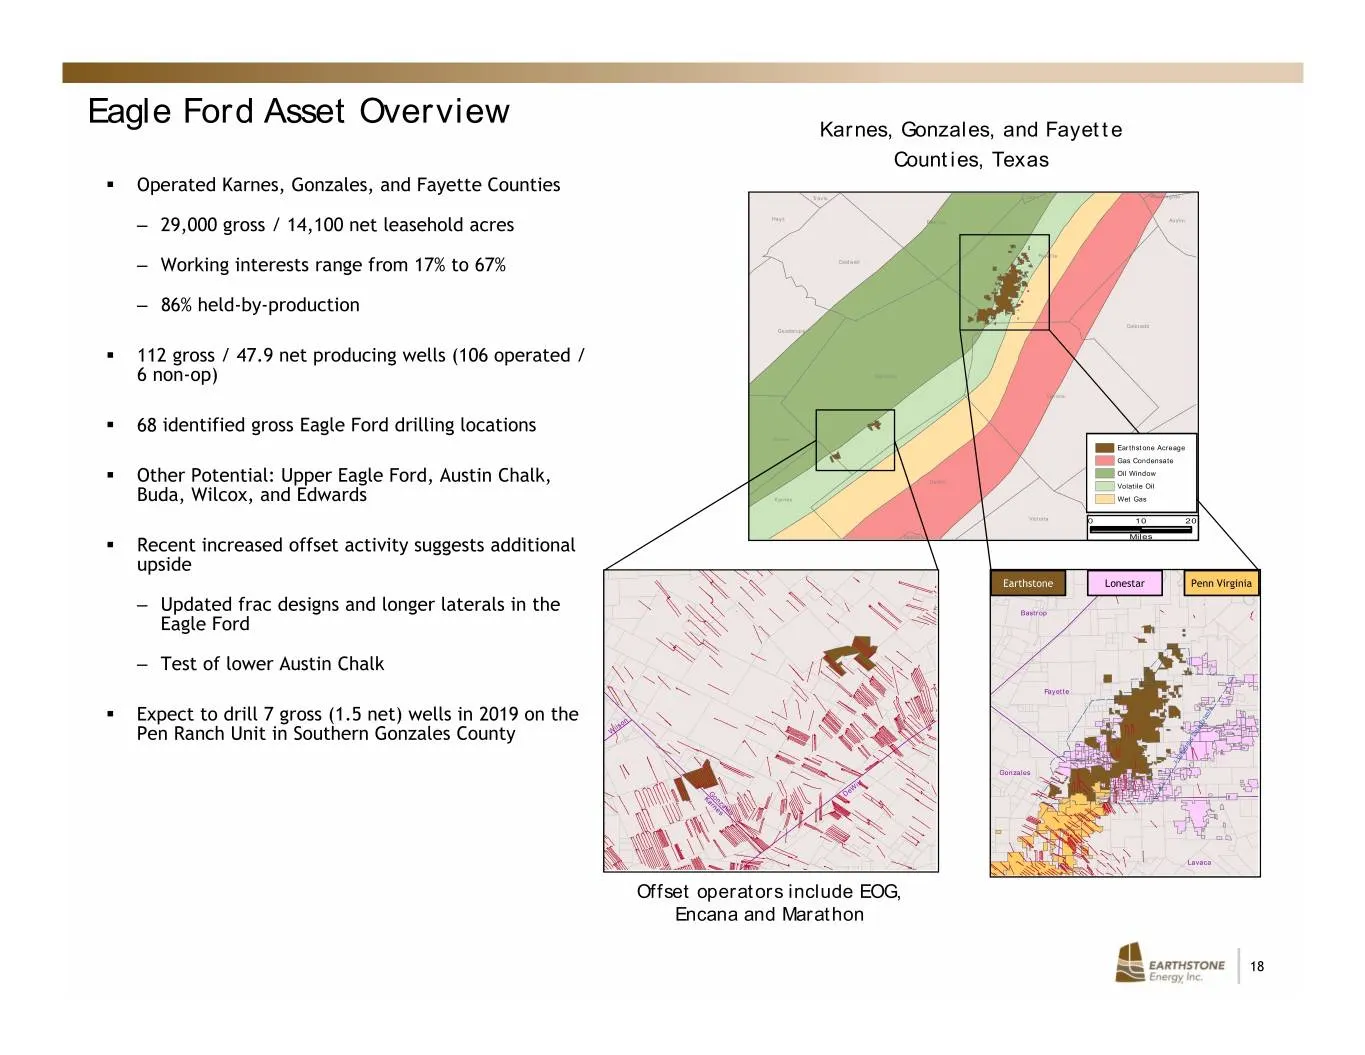
Eagle Ford Asset Overview Karnes, Gonzales, and Fayette Counties, Texas . Operated Karnes, Gonzales, and Fayette Counties Tr av is Lee Washington Hays – 29,000 gross / 14,100 net leasehold acres Bastrop Austin Fa yet te – Working interests range from 17% to 67% Caldwell – 86% held-by-production Colo

Slide 19: Financial Overview
Financial Overview EARTHSTONE | 19 Energy, inc
Slide 20: Capital Budget, Guidance and Liquidity
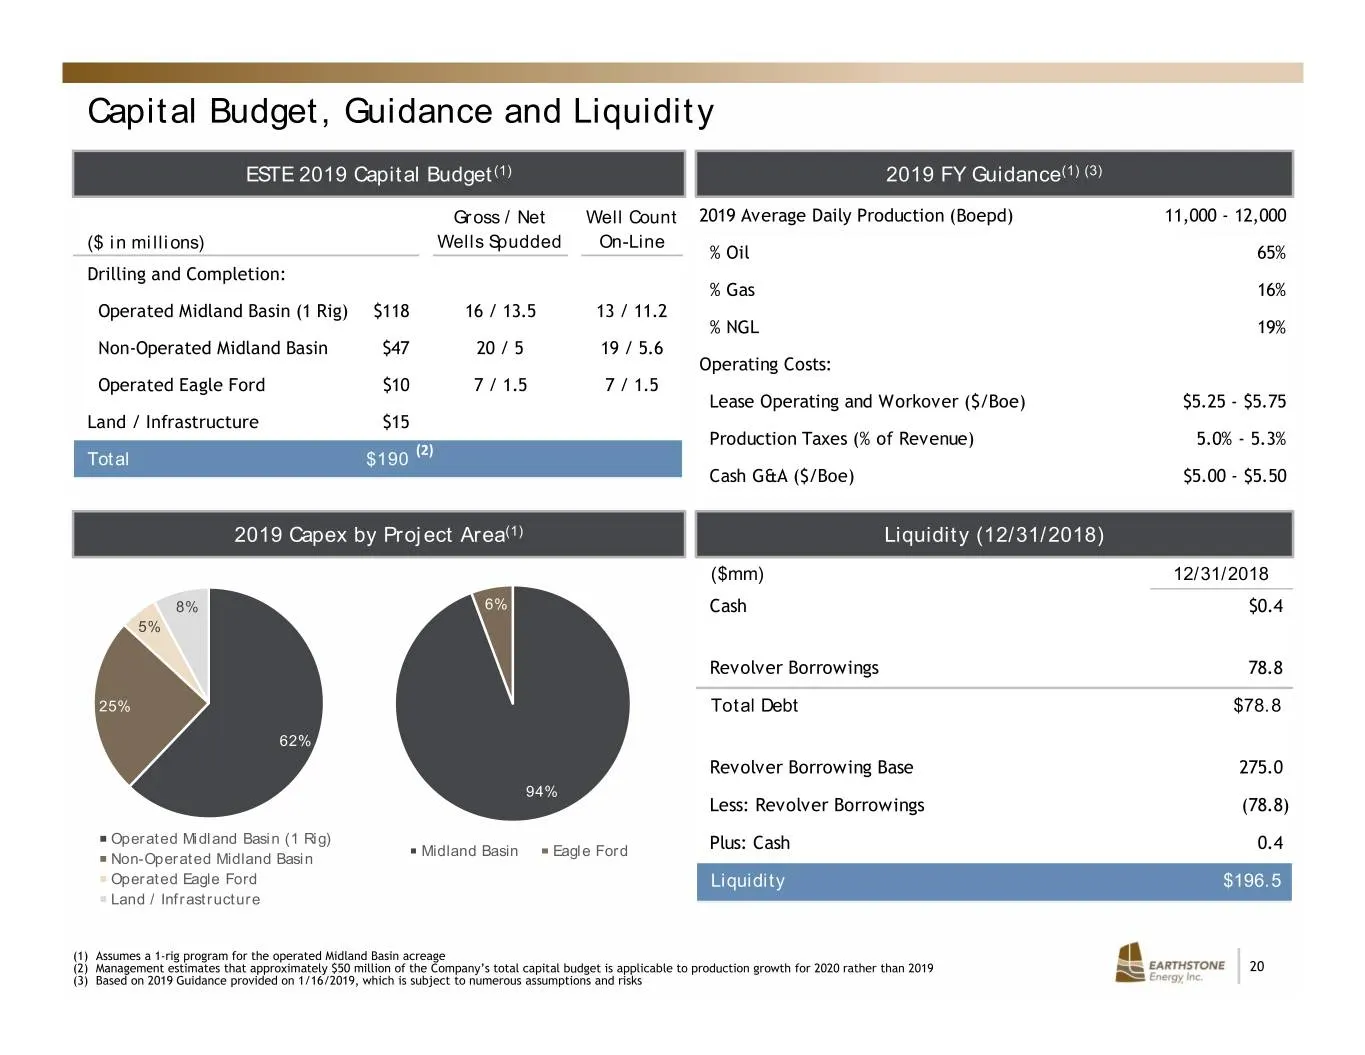
Capital Budget, Guidance and Liquidity ESTE 2019 Capital Budget(1) 2019 FY Guidance(1) (3) Gross / Net Well Count 2019 Average Daily Production (Boepd) 11,000 - 12,000 ($ in millions) Wells Spudded On-Line % Oil 65% Drilling and Completion: % Gas 16% Operated Midland Basin (1 Rig) $118 16 / 13.5 13
Slide 21: Hedge Book Summary
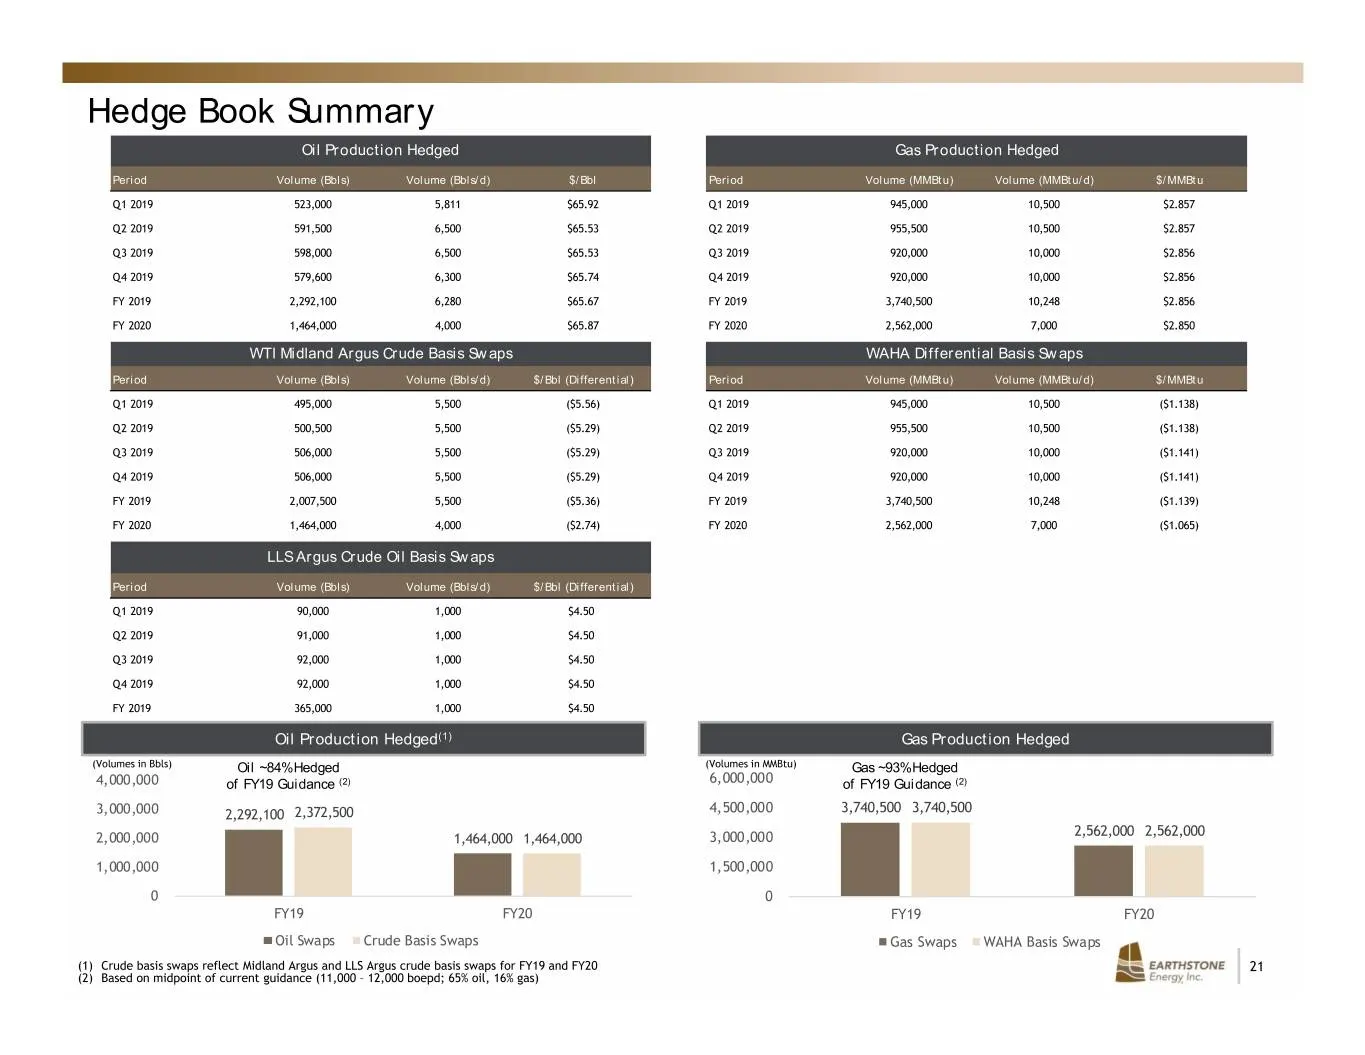
Hedge Book Summary Oil Production Hedged Gas Production Hedged Period Volume (Bbls) Volume (Bbls/d) $/Bbl Period Volume (MMBtu) Volume (MMBtu/d) $/MMBtu Q1 2019 523,000 5,811 $65.92 Q1 2019 945,000 10,500 $2.857 Q2 2019 591,500 6,500 $65.53 Q2 2019 955,500 10,500 $2.857 Q3 2019 598,000 6,500 $65.53
Slide 22: Analyst Coverage
Analyst Coverage Firm Analyst Contact Info Alliance Global Partners Joel Musante / 203-349-4782 / jmusante@allianceg.com Baird Joseph Allman / 646-557-3209 / jdallman@rwbaird.com Coker Palmer David Beard / 631-725-8810 / beard@cokerpalmer.com Imperial Capital Jason Wangler / 713-892-5603 / jwangler@
Slide 23: Contact Information
Contact Information Mark Lumpkin, Jr. EVP, Chief Financial Officer Scott Thelander Vice President of Finance Corporate Offices Houston 1400 Woodloch Forest Drive | Suite 300 | The Woodlands, TX 77380 | (281) 298-4246 Midland 600 N. Marienfeld | Suite 1000 | Midland, TX 79701 | (432) 686-1100 Website
Slide 24: Reconciliation of Non-GAAP Financial Measure
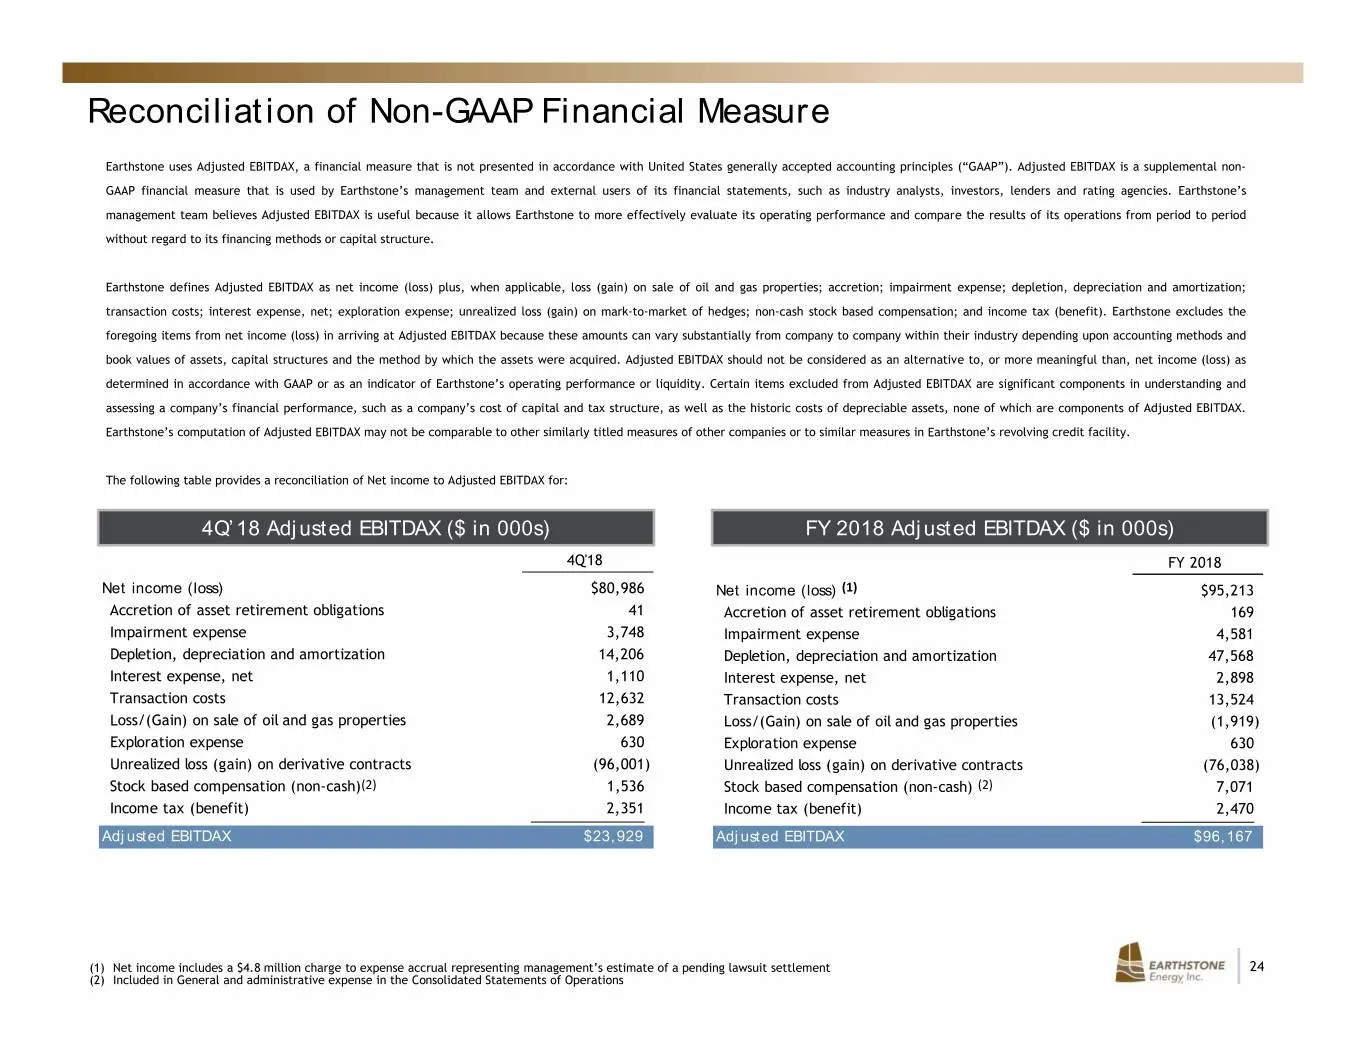
Reconciliation of Non-GAAP Financial Measure Earthstone uses Adjusted EBITDAX, a financial measure that is not presented in accordance with United States generally accepted accounting principles (“GAAP”). Adjusted EBITDAX is a supplemental non- GAAP financial measure that is used by Earthstone’s man
Slide 25: Reserves Summary
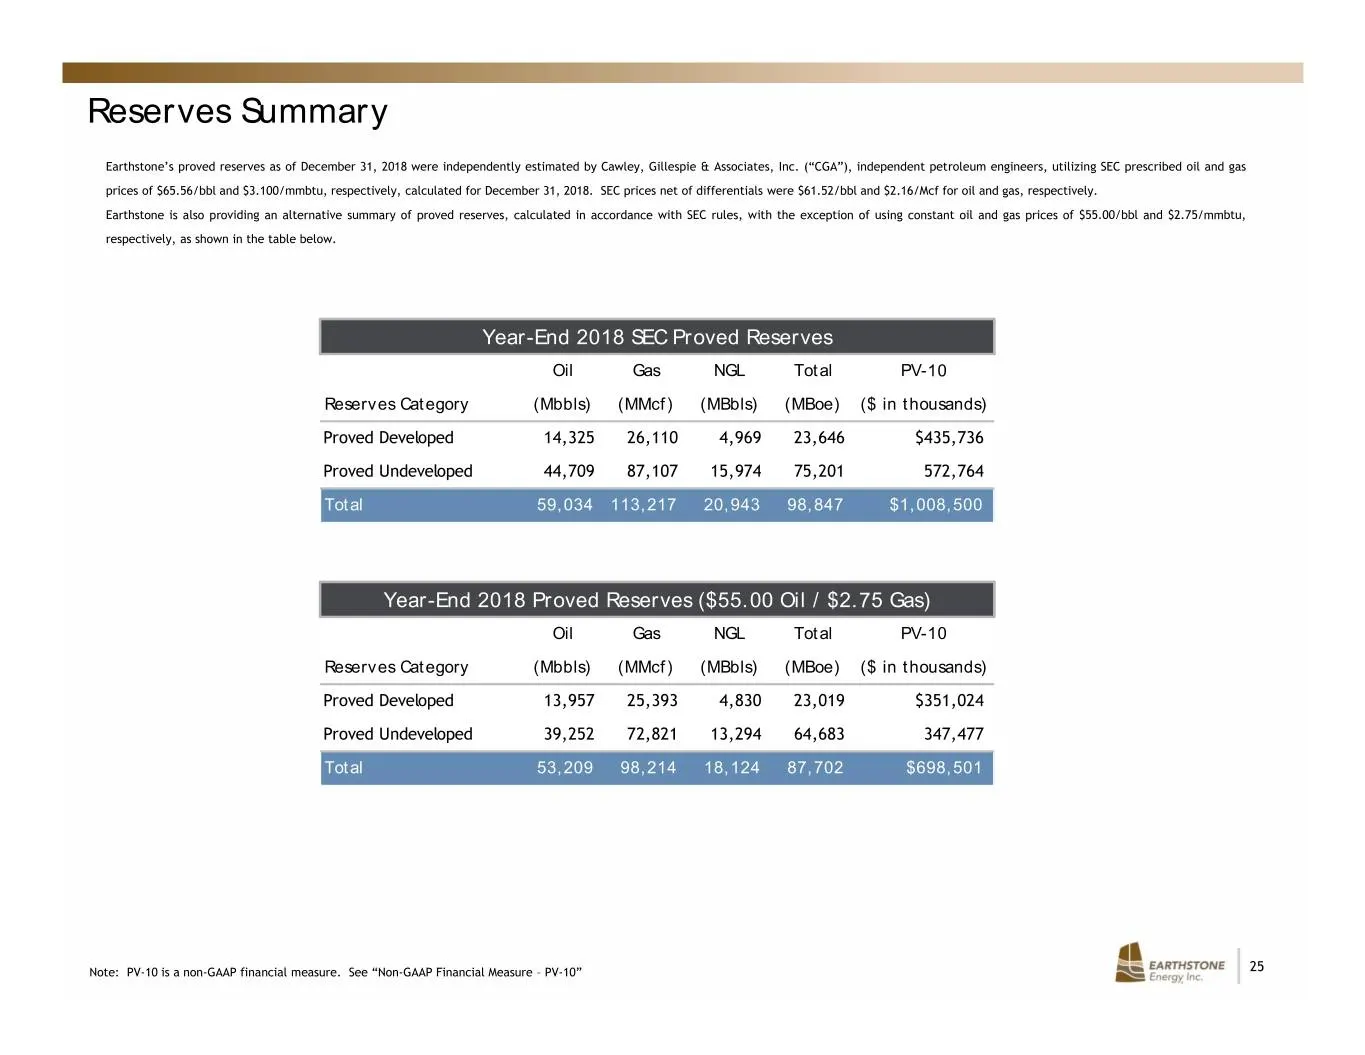
Reserves Summary Earthstone’s proved reserves as of December 31, 2018 were independently estimated by Cawley, Gillespie & Associates, Inc. (“CGA”), independent petroleum engineers, utilizing SEC prescribed oil and gas prices of $65.56/bbl and $3.100/mmbtu, respectively, calculated for December 31, 2
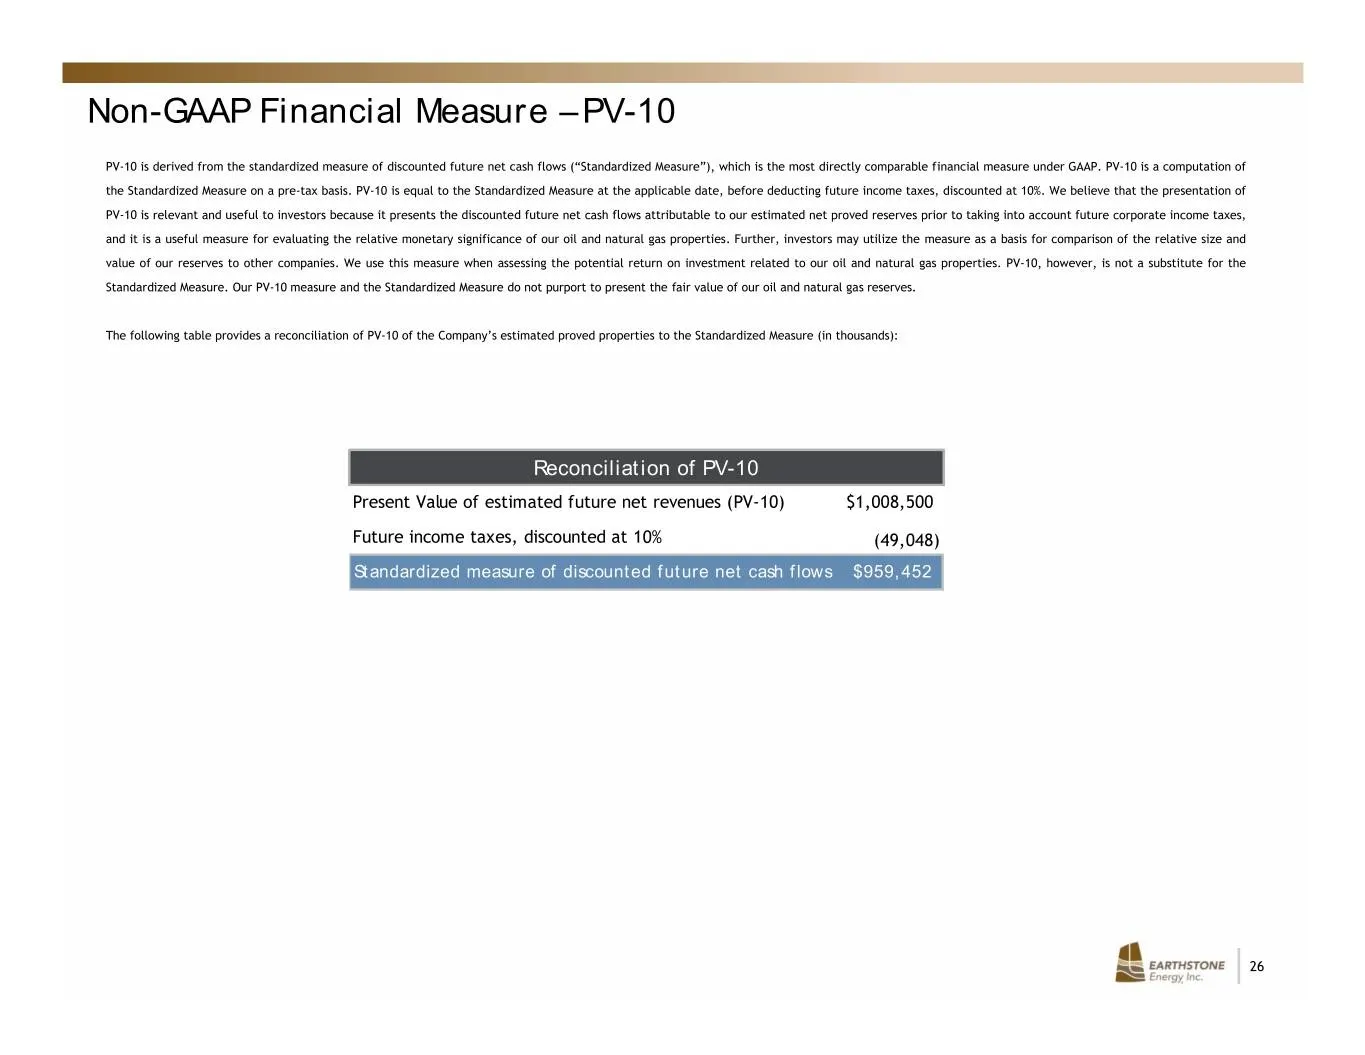
Slide 26: Non-GAAP Financial Measure – PV-10
Non-GAAP Financial Measure – PV-10 PV-10 is derived from the standardized measure of discounted future net cash flows (“Standardized Measure”), which is the most directly comparable financial measure under GAAP. PV-10 is a computation of the Standardized Measure on a pre-tax basis. PV-10 is equal to
Source: SEC EDGAR · 8-K filed Apr 4, 2019
More decks from Earthstone Energy Inc
 Merger or Acquisition (August 2023)20 slides · Aug 23, 2023
 EnerCom Denver 202332 slides · Aug 14, 2023
 Q2 2023 Earnings Presentation25 slides · Aug 2, 2023
 Investor Presentation (June 2023)29 slides · Jun 20, 2023
 Merger or Acquisition (June 2023)16 slides · Jun 16, 2023
 Q1 2023 Earnings Presentation33 slides · May 3, 2023