USA Compression Partners, LP · NYSE:USAC
USA Compression Partners, LP — Citi Natural Resources Conference 2025
20 slides from USA Compression Partners, LP's conference presentation, August 2025
Slide 1: USA Compression Partners, LP Investor Presentation
USA Compression Partners, LP Investor Presentation Citi Natural Resources Conference August 2025
Slide 2: Forward-Looking Statements and Disclaimer
Forward-Looking Statements and Disclaimer Forward Looking Statements This presentation contains forward-looking statements related to the operations of the Partnership that are based on management’s current expectations, estimates, and projections about its operations. You can identify many of these
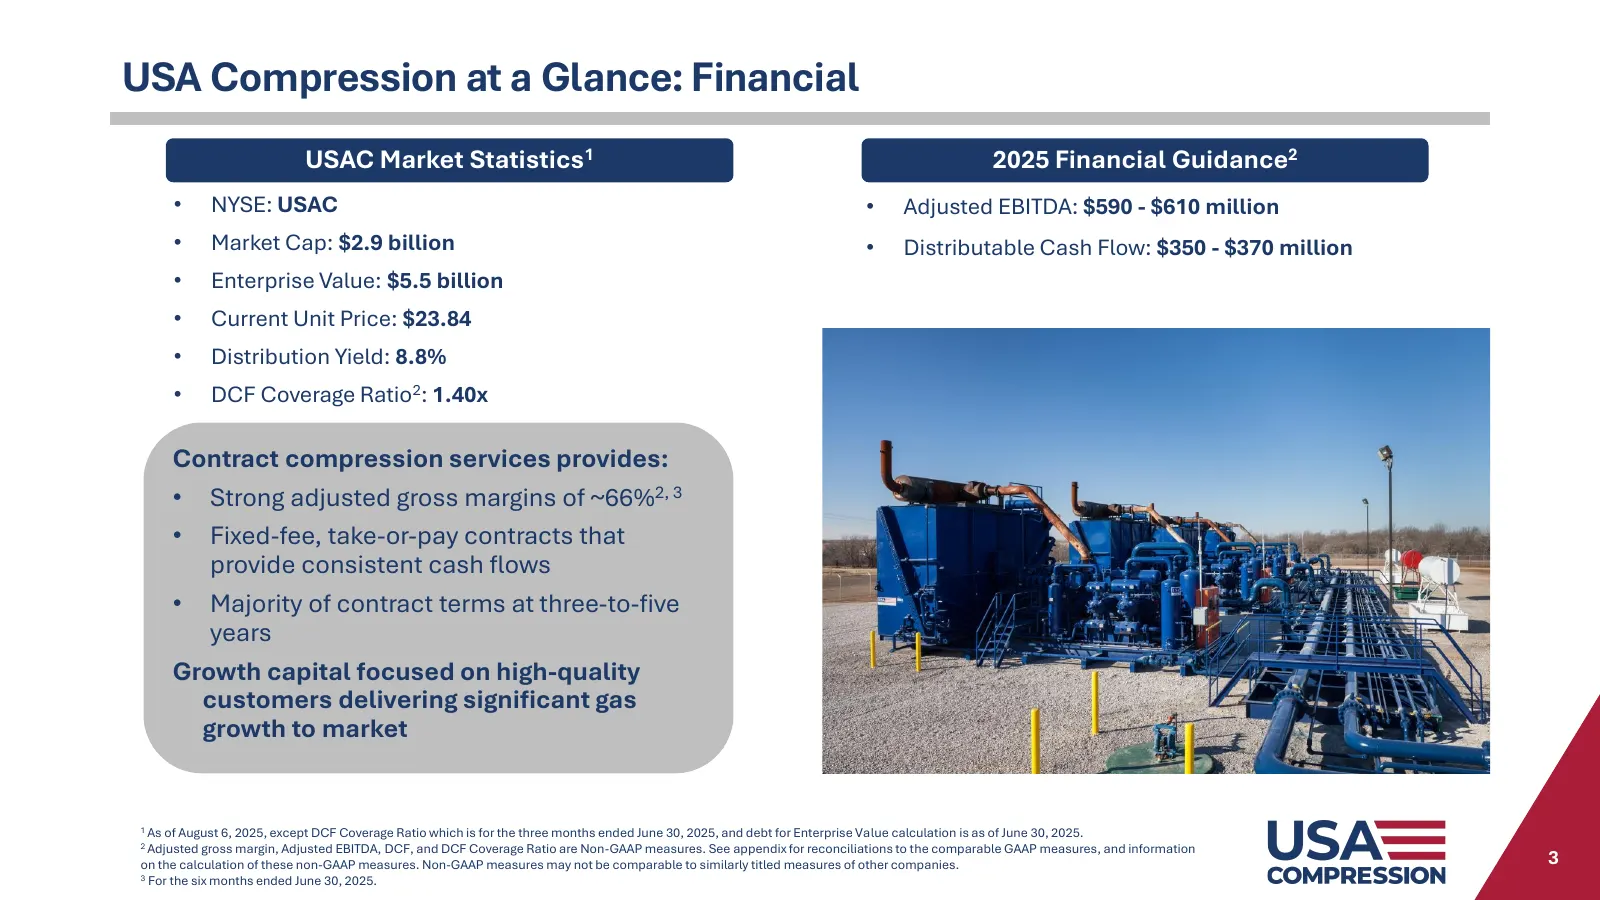
Slide 3: USA Compression at a Glance: Financial
USA Compression at a Glance: Financial USAC Market Statistics1 2025 Financial Guidance2 • NYSE: USAC • Adjusted EBITDA: $590 - $610 million • Market Cap: $2.9 billion • Distributable Cash Flow: $350 - $370 million • Enterprise Value: $5.5 billion • Current Unit Price: $23.84 • Distribution Yield: 8.
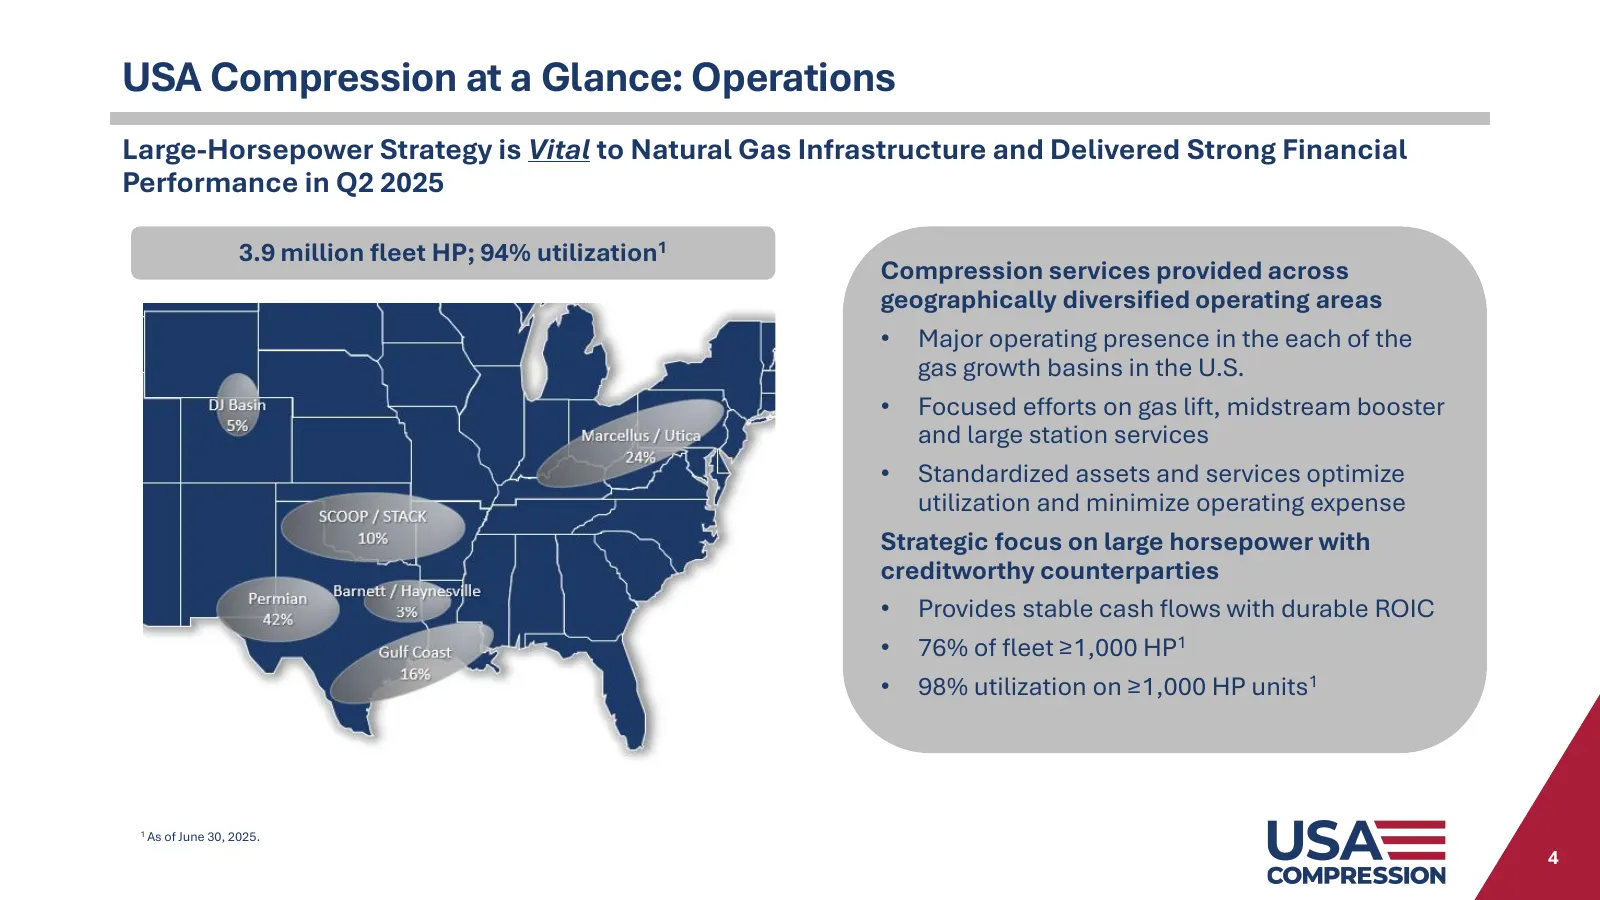
Slide 4: USA Compression at a Glance: Operations
USA Compression at a Glance: Operations Large-Horsepower Strategy is Vital to Natural Gas Infrastructure and Delivered Strong Financial Performance in Q2 2025 3.9 million fleet HP; 94% utilization1 Compression services provided across geographically diversified operating areas • Major operating pres
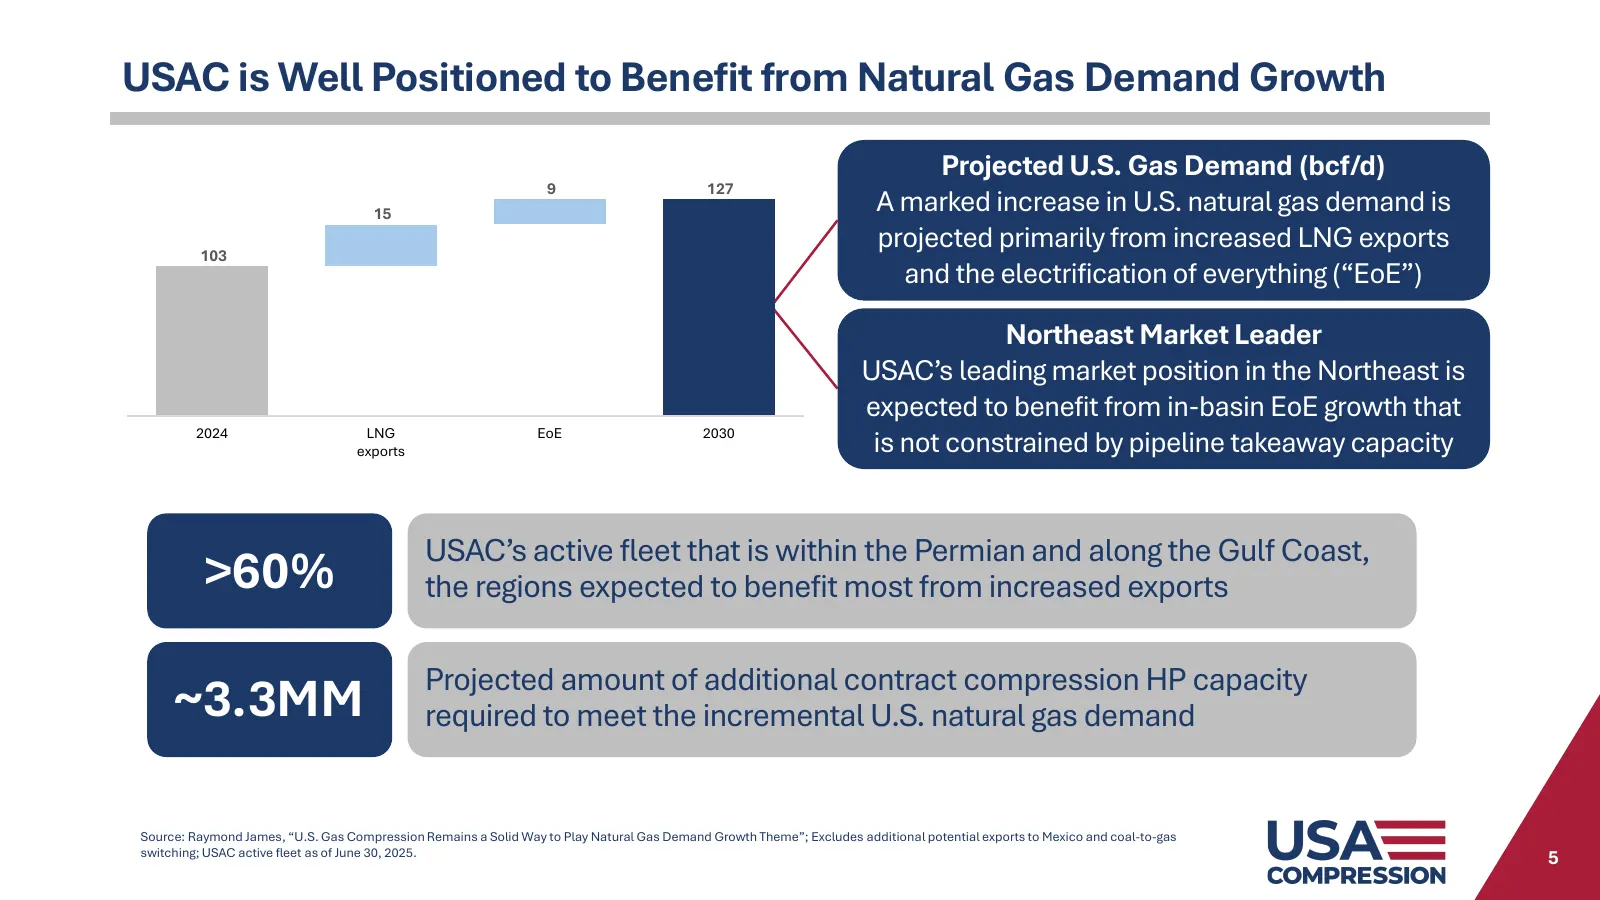
Slide 5: USAC is Well Positioned to Benefit from Natural Gas Demand Growth
USAC is Well Positioned to Benefit from Natural Gas Demand Growth Projected U.S. Gas Demand (bcf/d) 9 127 15 A marked increase in U.S. natural gas demand is 103 projected primarily from increased LNG exports and the electrification of everything (“EoE”) Northeast Market Leader USAC’s leading market
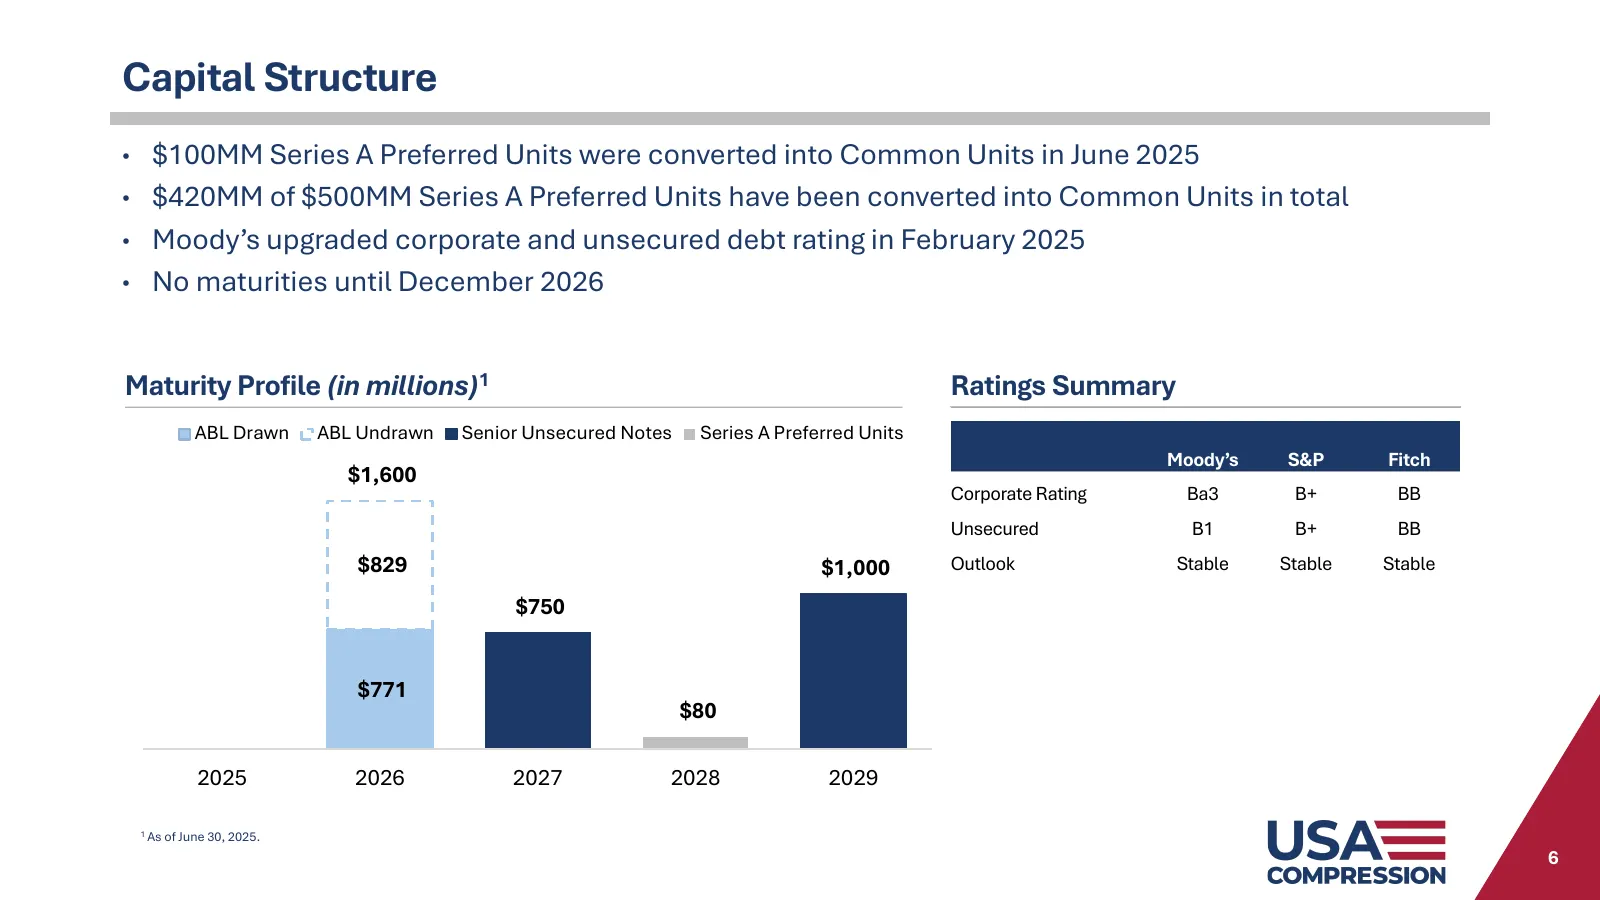
Slide 6: Capital Structure
Capital Structure • $100MM Series A Preferred Units were converted into Common Units in June 2025 • $420MM of $500MM Series A Preferred Units have been converted into Common Units in total • Moody’s upgraded corporate and unsecured debt rating in February 2025 • No maturities until December 2026 Mat
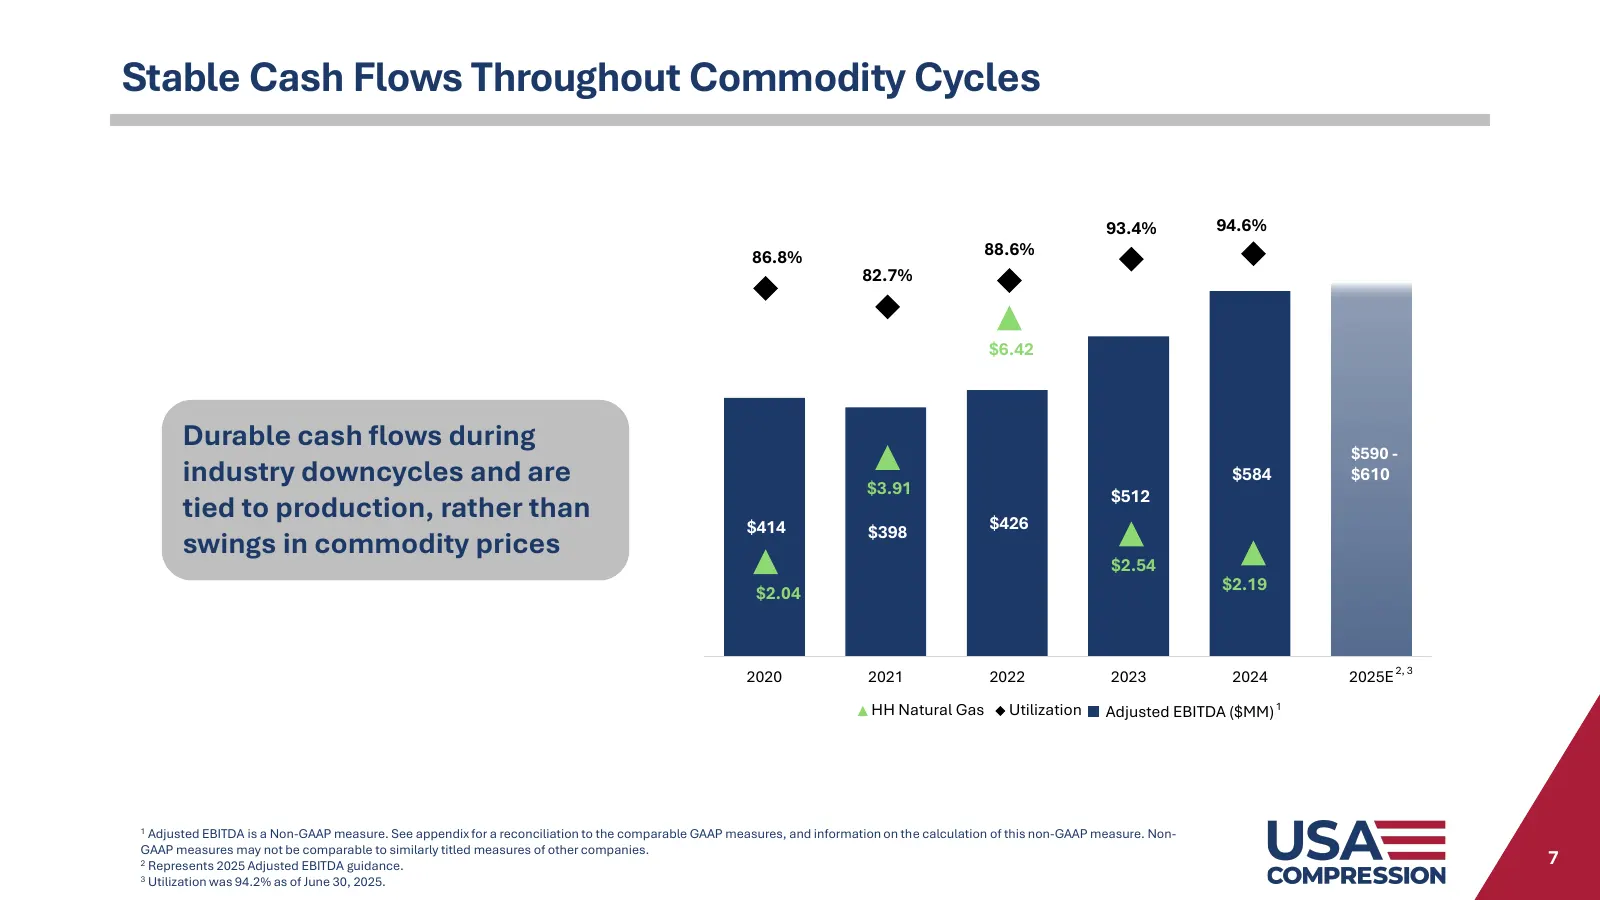
Slide 7: Stable Cash Flows Throughout Commodity Cycles
Stable Cash Flows Throughout Commodity Cycles 93.4% 94.6% 86.8% 88.6% 82.7% $6.42 Durable cash flows during $590 - industry downcycles and are $3.91 $584 $610 $512 tied to production, rather than $426 $414 $398 swings in commodity prices $2.54 $2.04 $2.19 2, 3 2020 2021 2022 2023 2024 2025E HH Natur
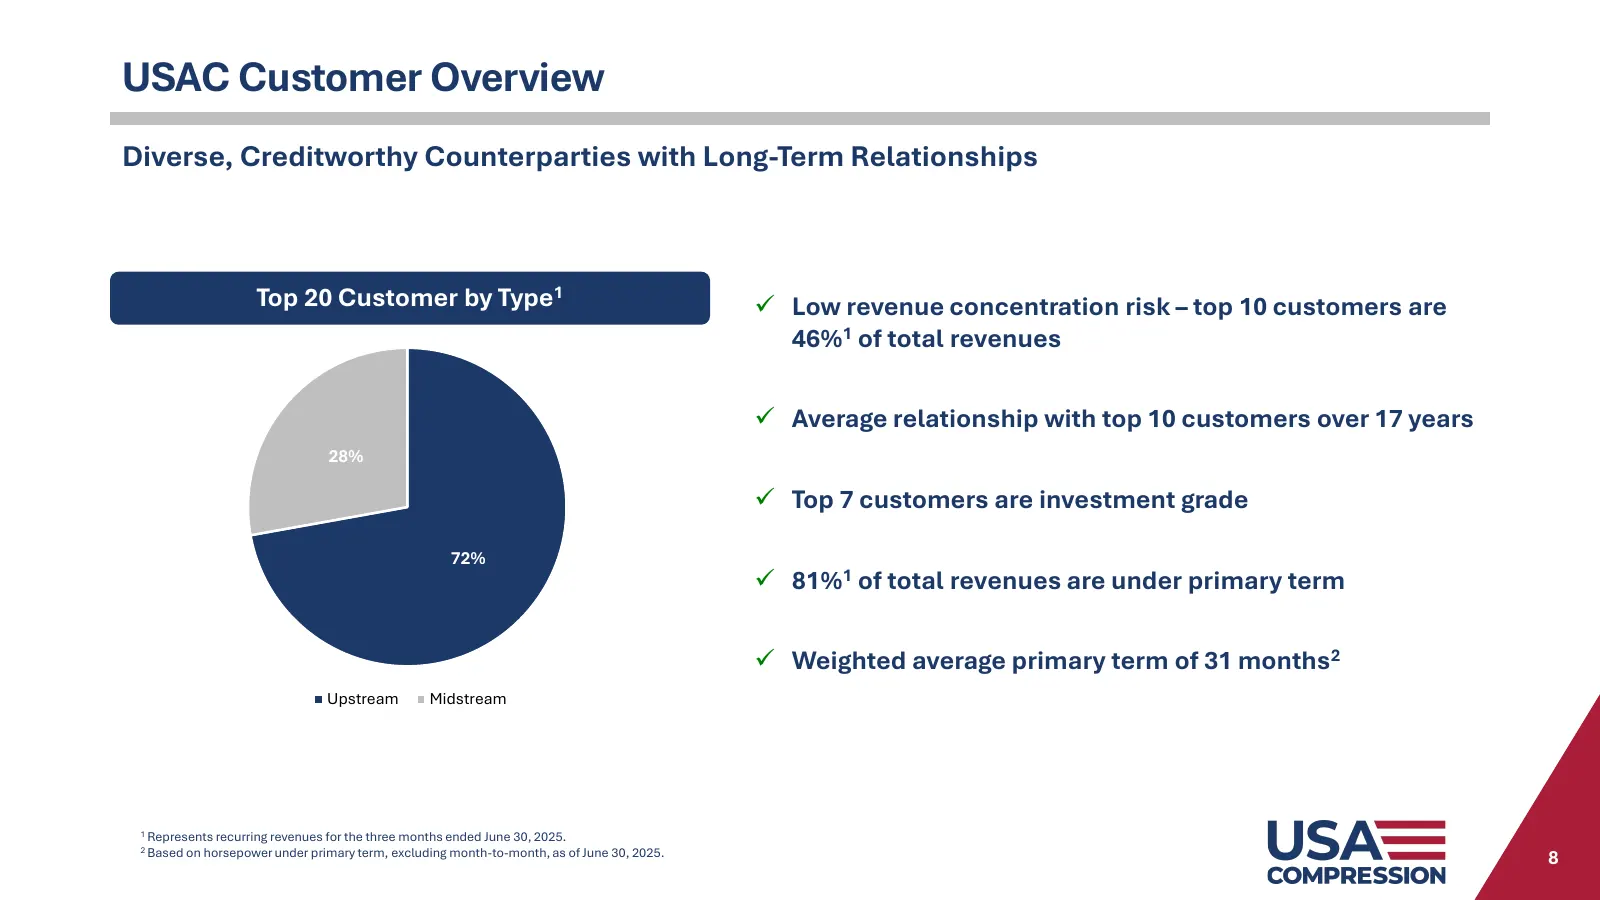
Slide 8: USAC Customer Overview
USAC Customer Overview Diverse, Creditworthy Counterparties with Long-Term Relationships Top 20 Customer by Type1 ✓ Low revenue concentration risk – top 10 customers are 46%1 of total revenues ✓ Average relationship with top 10 customers over 17 years 28% ✓ Top 7 customers are investment grade 72% ✓
Slide 9: USAC's Asset Base Supports Reduced Credit and Equity Risk
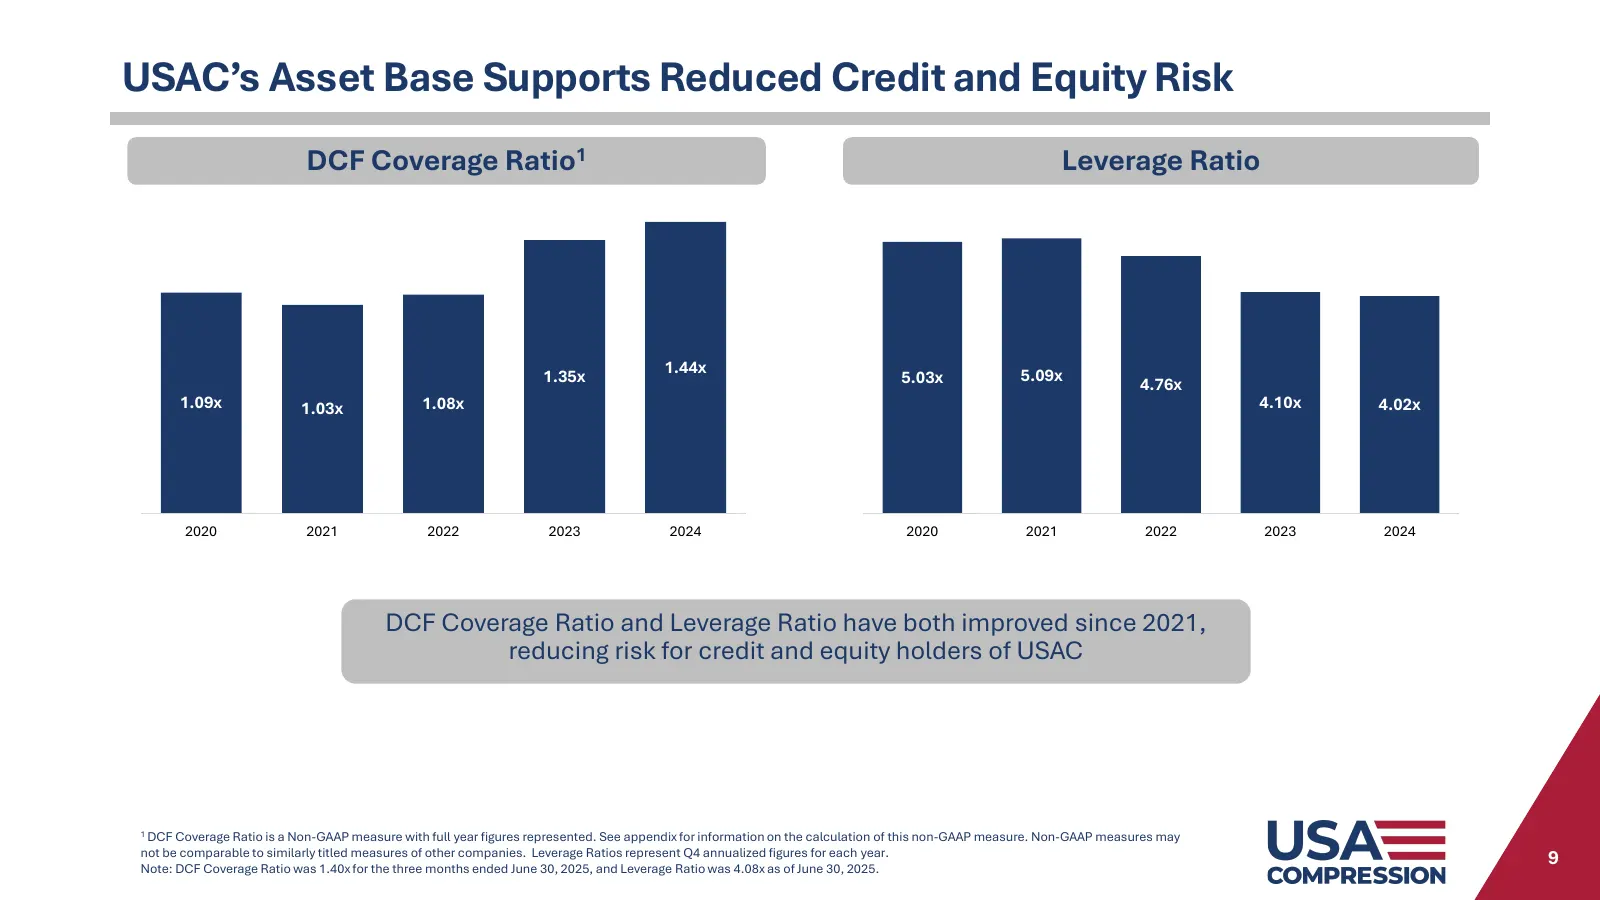
USAC’s Asset Base Supports Reduced Credit and Equity Risk DCF Coverage Ratio1 Leverage Ratio 1.44x 5.09x 1.35x 5.03x 4.76x 1.09x 1.03x 1.08x 4.10x 4.02x 2020 2021 2022 2023 2024 2020 2021 2022 2023 2024 DCF Coverage Ratio and Leverage Ratio have both improved since 2021, reducing risk for credit and
Slide 10: History of Strong and Consistent Returns to Unitholders
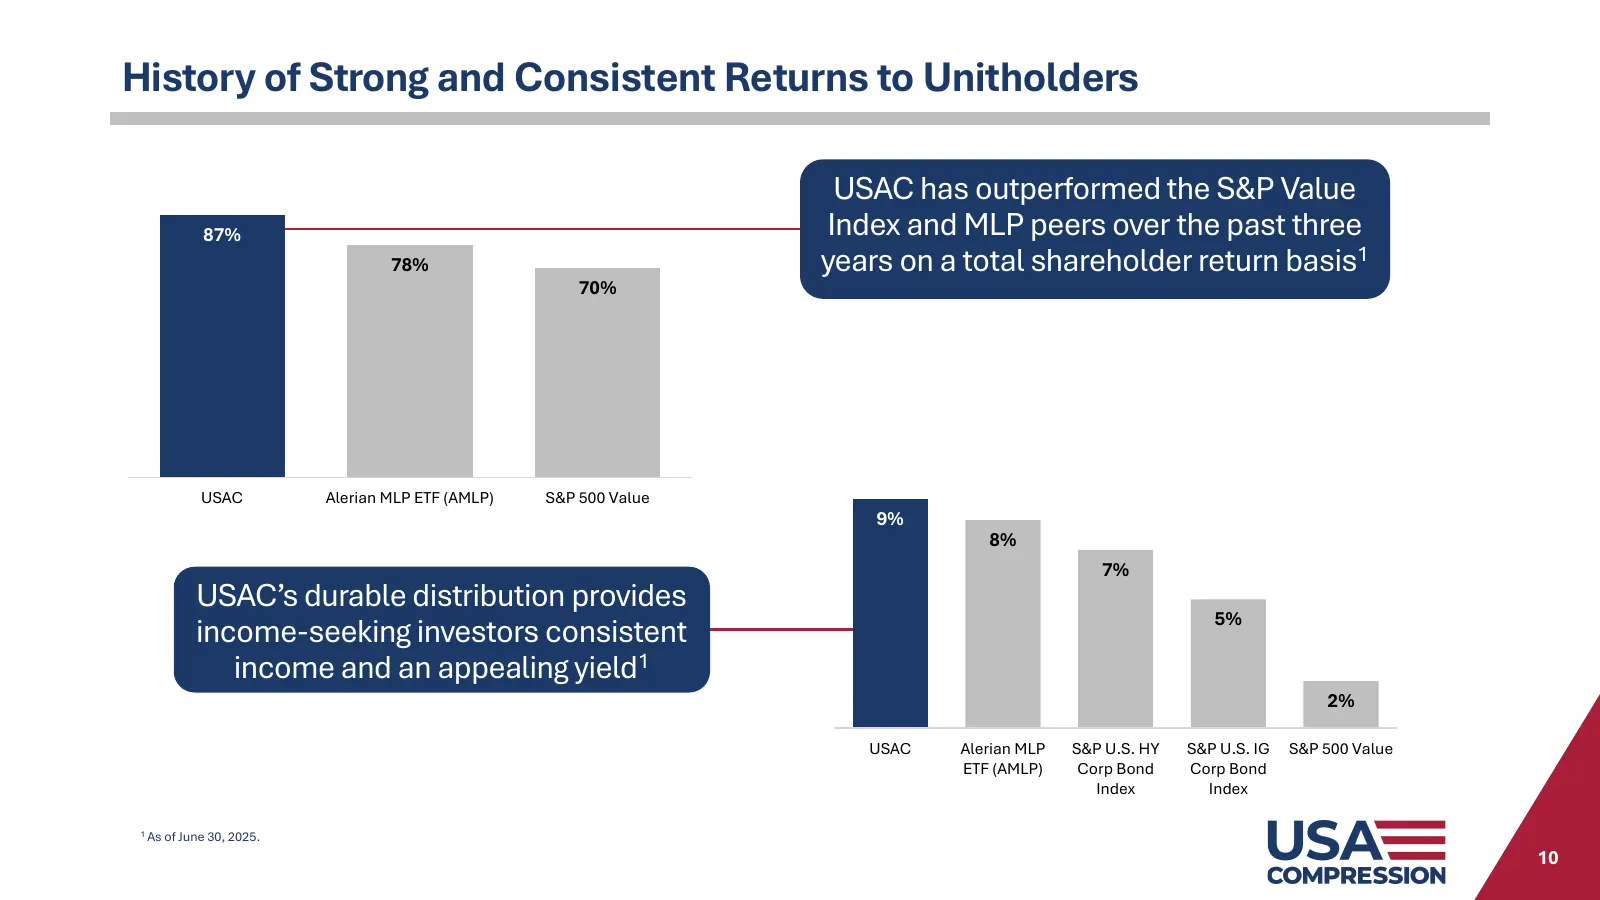
History of Strong and Consistent Returns to Unitholders USAC has outperformed the S&P Value 87% Index and MLP peers over the past three 78% years on a total shareholder return basis1 70% USAC Alerian MLP ETF (AMLP) S&P 500 Value 9% 8% 7% USAC’s durable distribution provides 5% income-seeking investo
Slide 11: Preferred Unitholder Partial Conversions of Preferred Units
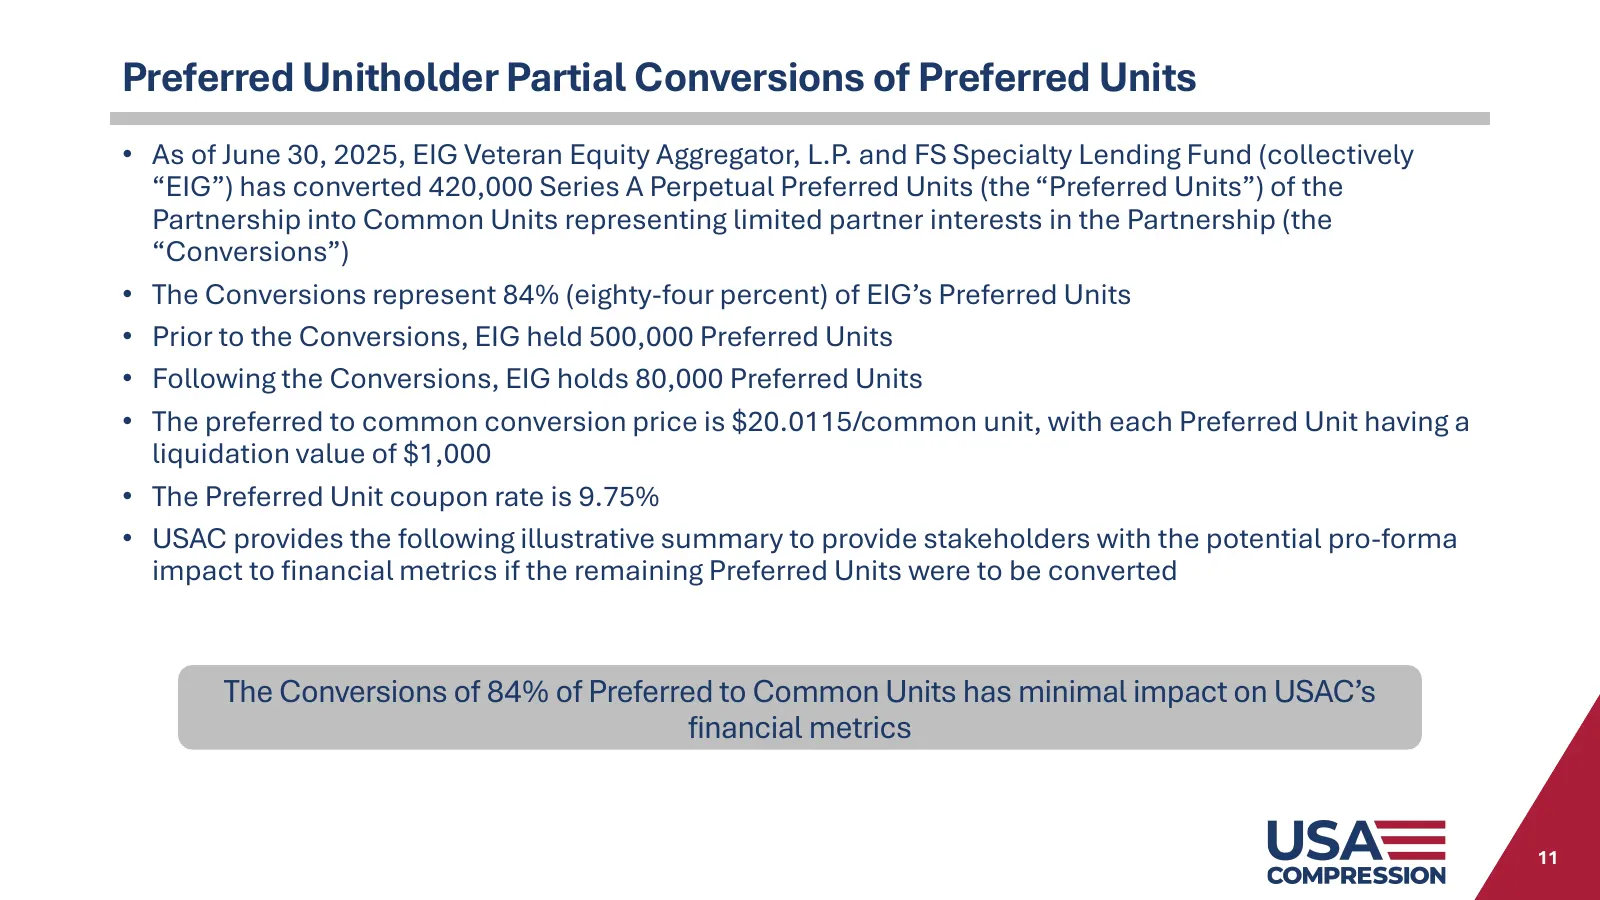
Preferred Unitholder Partial Conversions of Preferred Units • As of June 30, 2025, EIG Veteran Equity Aggregator, L.P. and FS Specialty Lending Fund (collectively “EIG”) has converted 420,000 Series A Perpetual Preferred Units (the “Preferred Units”) of the Partnership into Common Units representing
Slide 12: Illustrative Example of Potential Preferred Unit Conversions
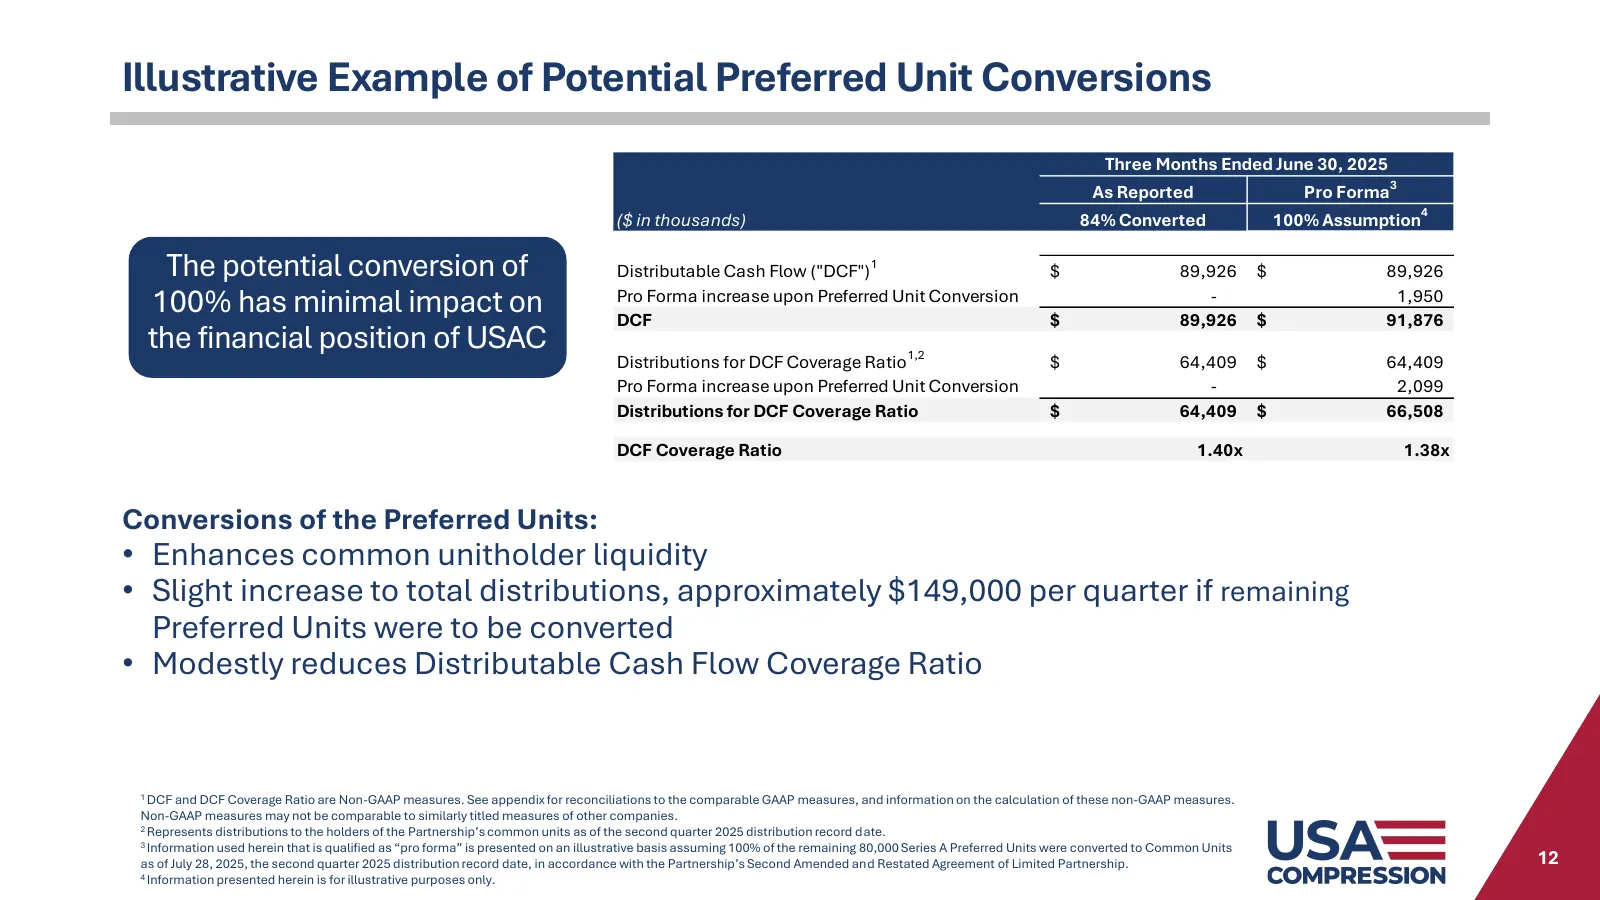
Illustrative Example of Potential Preferred Unit Conversions Three Months Ended June 30, 2025 3 As Reported Pro Forma 4 ($ in thousands) 84% Converted 100% Assumption The potential conversion of Distributable Cash Flow ("DCF") 1 $ 89,926 $ 89,926 100% has minimal impact on Pro Forma increase upon Pr
Slide 13: Appendix
Appendix 13
Slide 14: Second Quarter 2025 Highlights
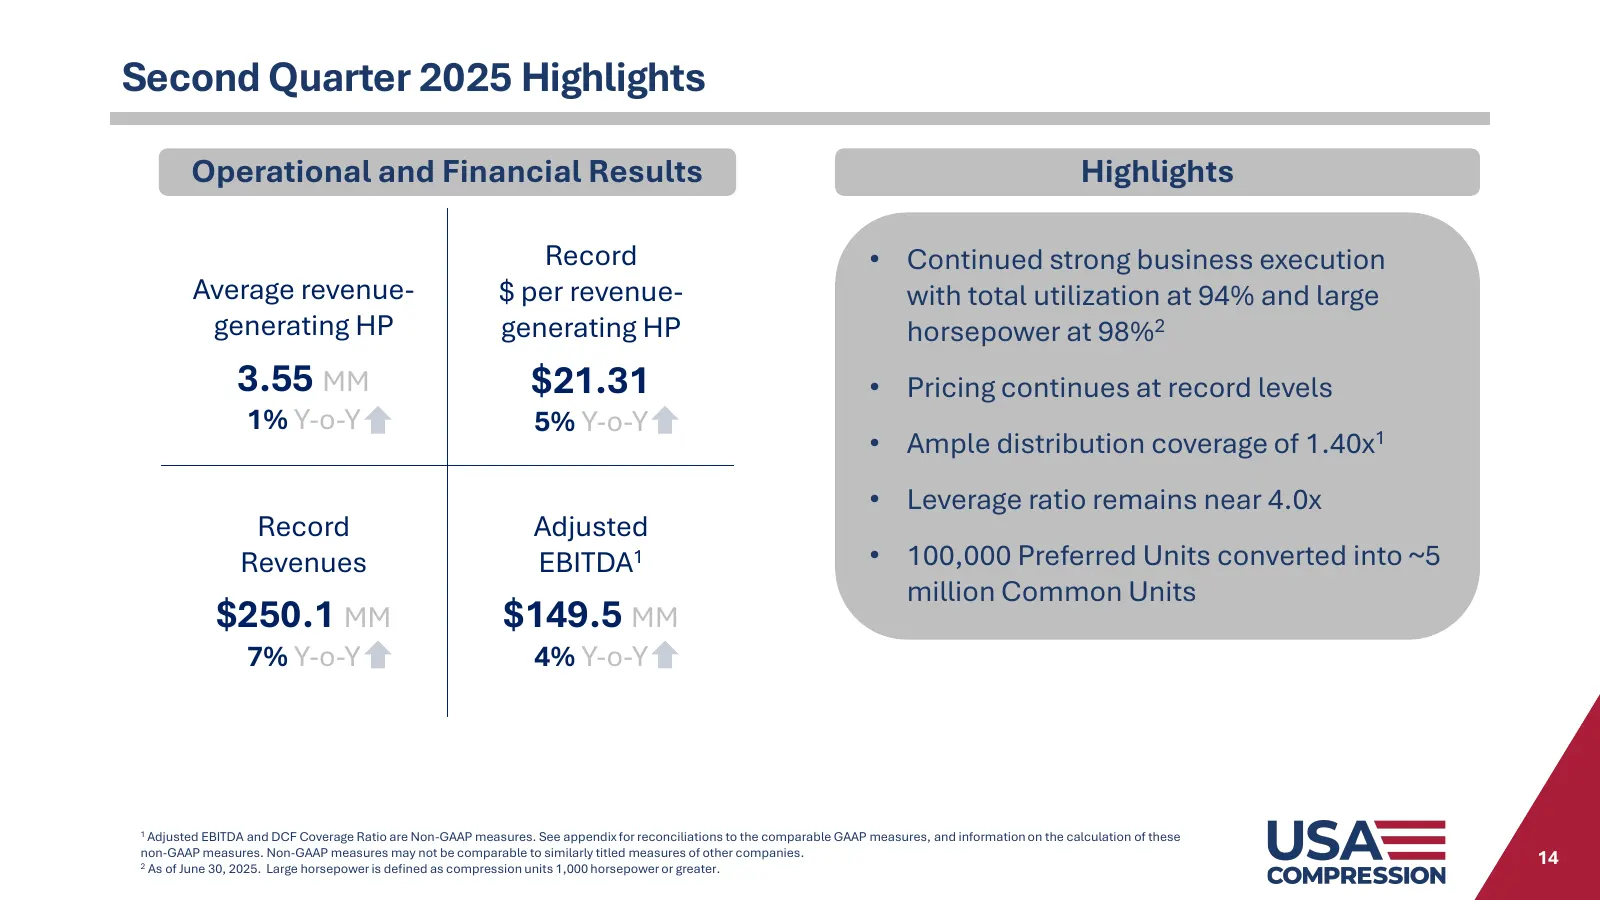
Second Quarter 2025 Highlights Operational and Financial Results Highlights Record • Continued strong business execution Average revenue- $ per revenue- with total utilization at 94% and large generating HP generating HP horsepower at 98%2 3.55 MM $21.31 • Pricing continues at record levels 1% Y-o-Y
Slide 15: Operational and Financial Performance
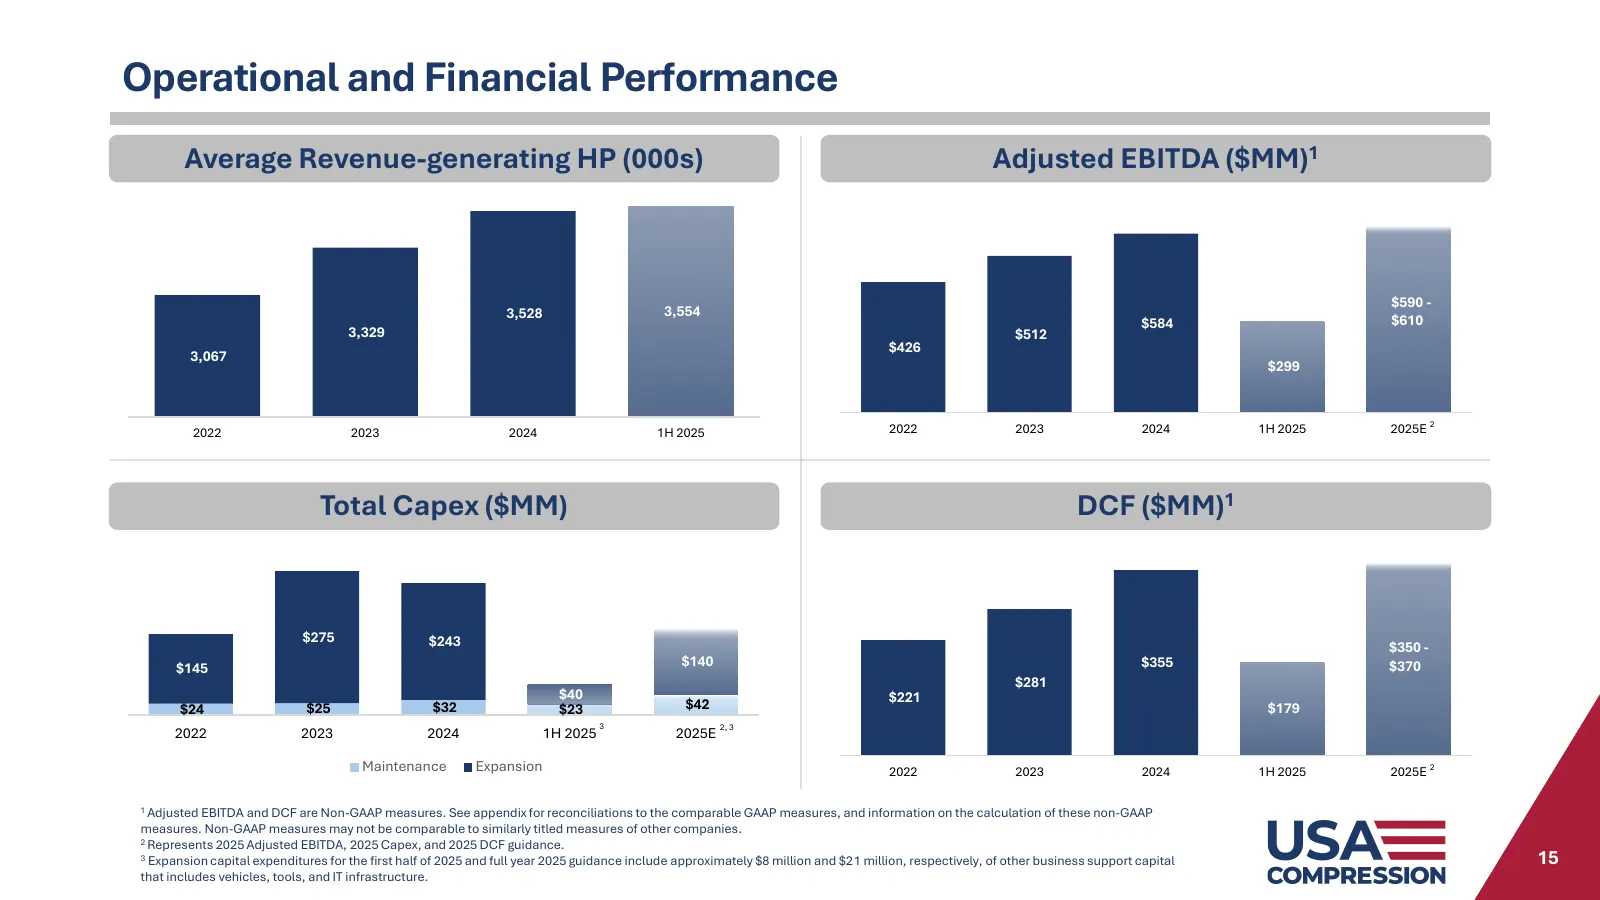
Operational and Financial Performance Average Revenue-generating HP (000s) Adjusted EBITDA ($MM)1 $590 - 3,528 3,554 $584 $610 3,329 $512 $426 3,067 $299 2022 2023 2024 1H 2025 2022 2023 2024 1H 2025 2025E 2 Total Capex ($MM) DCF ($MM)1 $275 $243 $350 - $140 $355 $370 $145 $281 $40 $221 $24 $25 $32
Slide 16: Ownership Structure and Energy Transfer Relationship
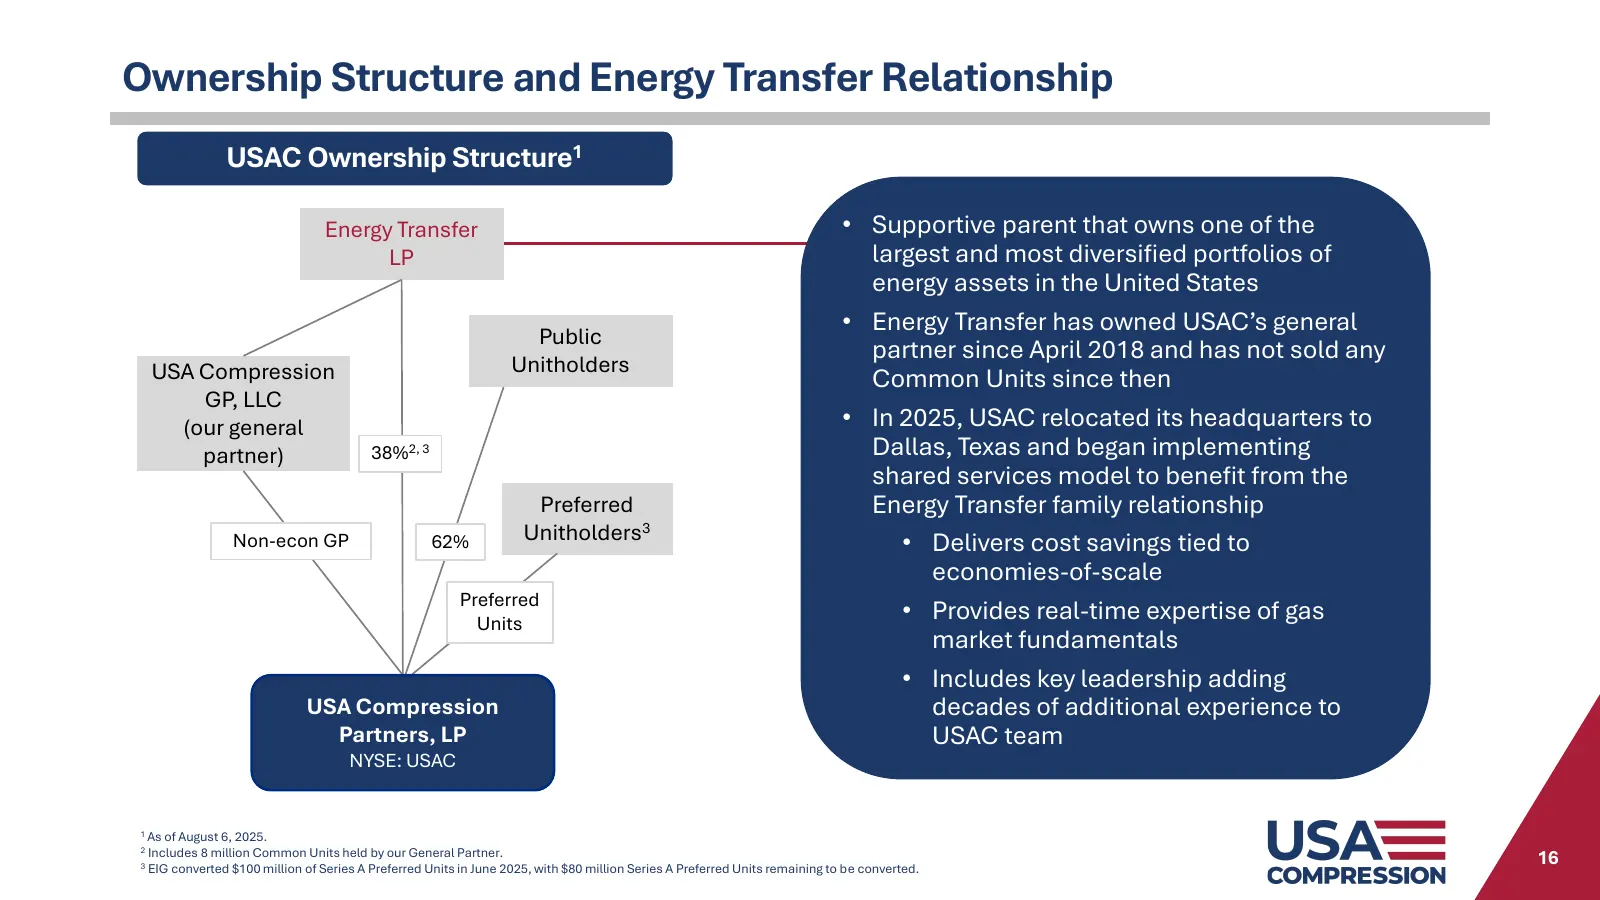
Ownership Structure and Energy Transfer Relationship USAC Ownership Structure1 Energy Transfer • Supportive parent that owns one of the LP largest and most diversified portfolios of energy assets in the United States • Energy Transfer has owned USAC’s general Public partner since April 2018 and has
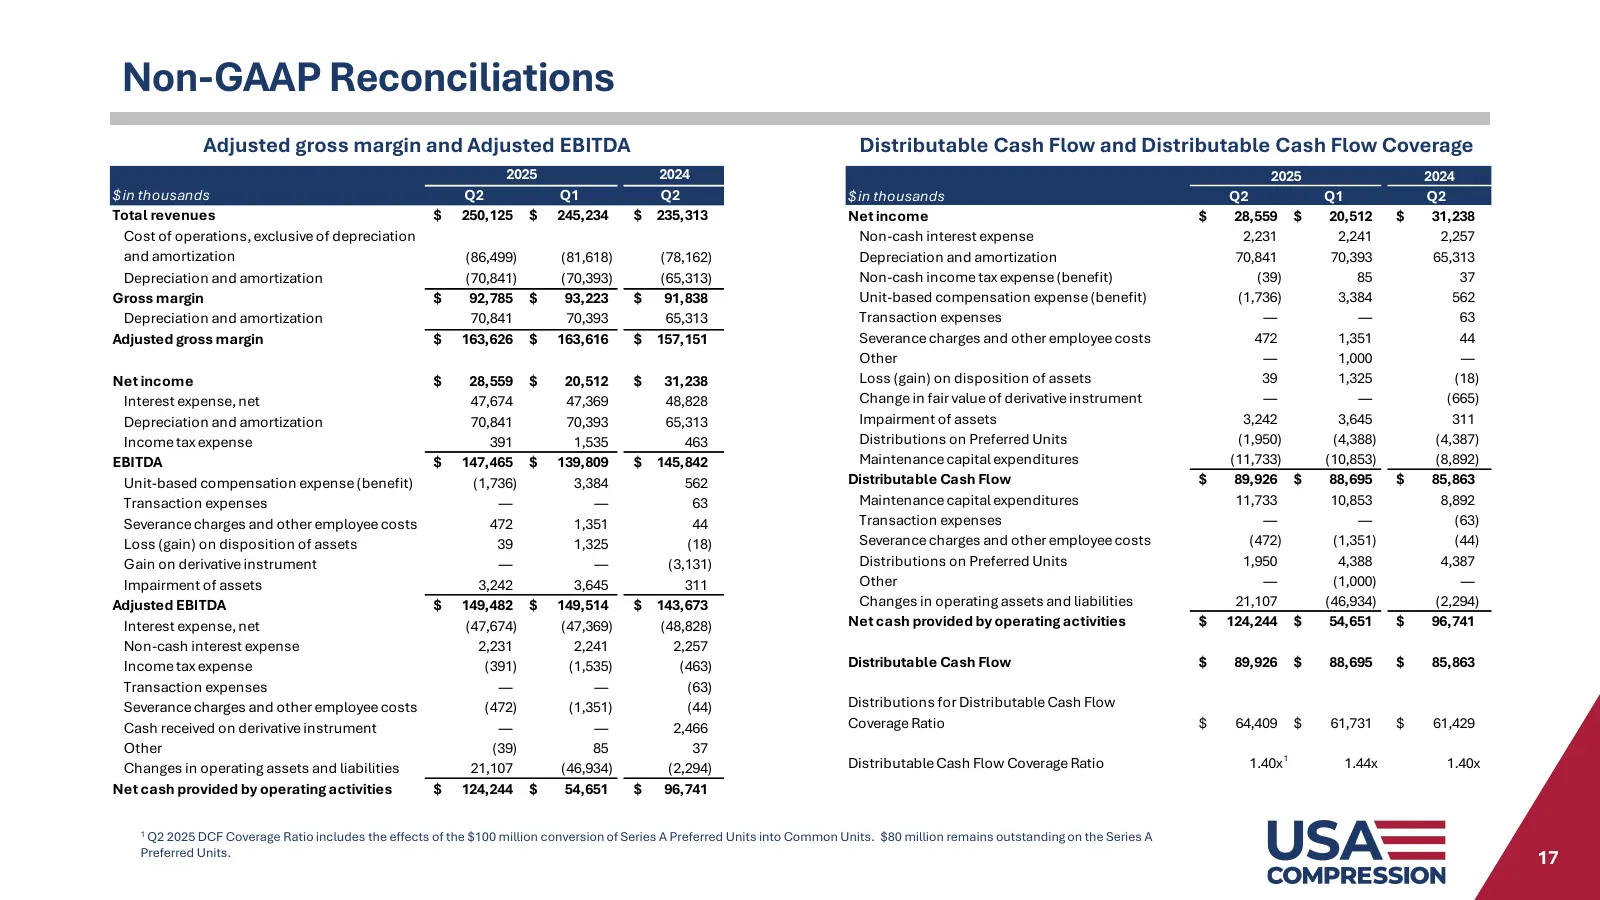
Slide 17: Non-GAAP Reconciliations
Non-GAAP Reconciliations Adjusted gross margin and Adjusted EBITDA Distributable Cash Flow and Distributable Cash Flow Coverage 2025 2024 2025 2024 $ in thousands Q2 Q1 Q2 $ in thousands Q2 Q1 Q2 Total revenues $ 250,125 $ 245,234 $ 235,313 Net income $ 28,559 $ 20,512 $ 31,238 Cost of operations, e
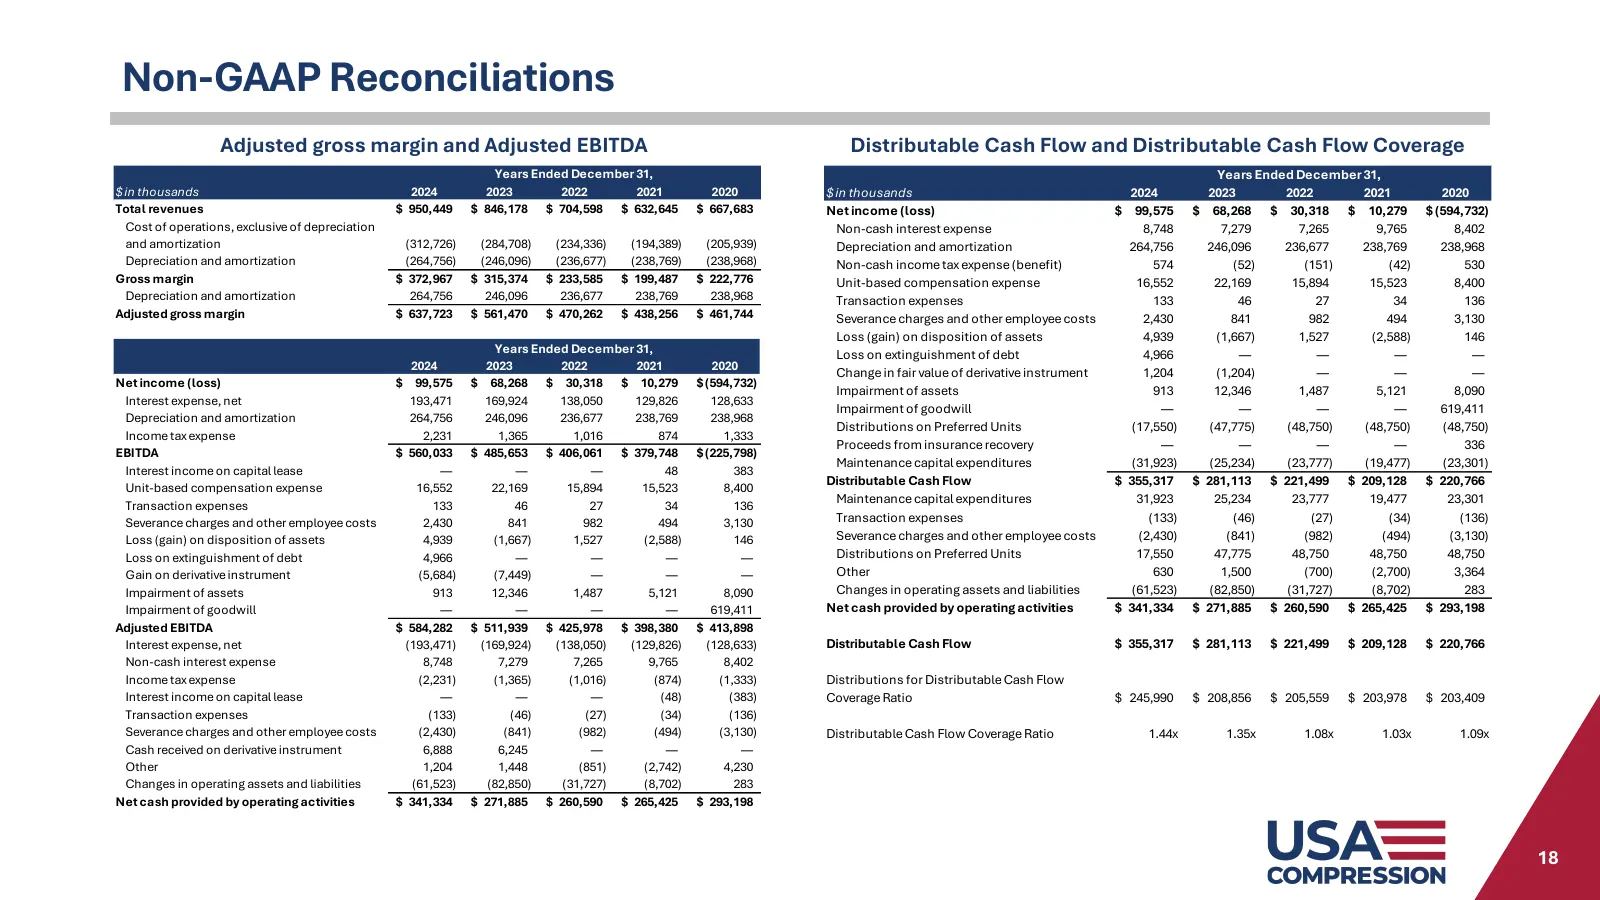
Slide 18: Non-GAAP Reconciliations
Non-GAAP Reconciliations Adjusted gross margin and Adjusted EBITDA Distributable Cash Flow and Distributable Cash Flow Coverage Years Ended December 31, Years Ended December 31, $ in thousands 2024 2023 2022 2021 2020 $ in thousands 2024 2023 2022 2021 2020 Total revenues $ 950,449 $ 846,178 $ 704,5
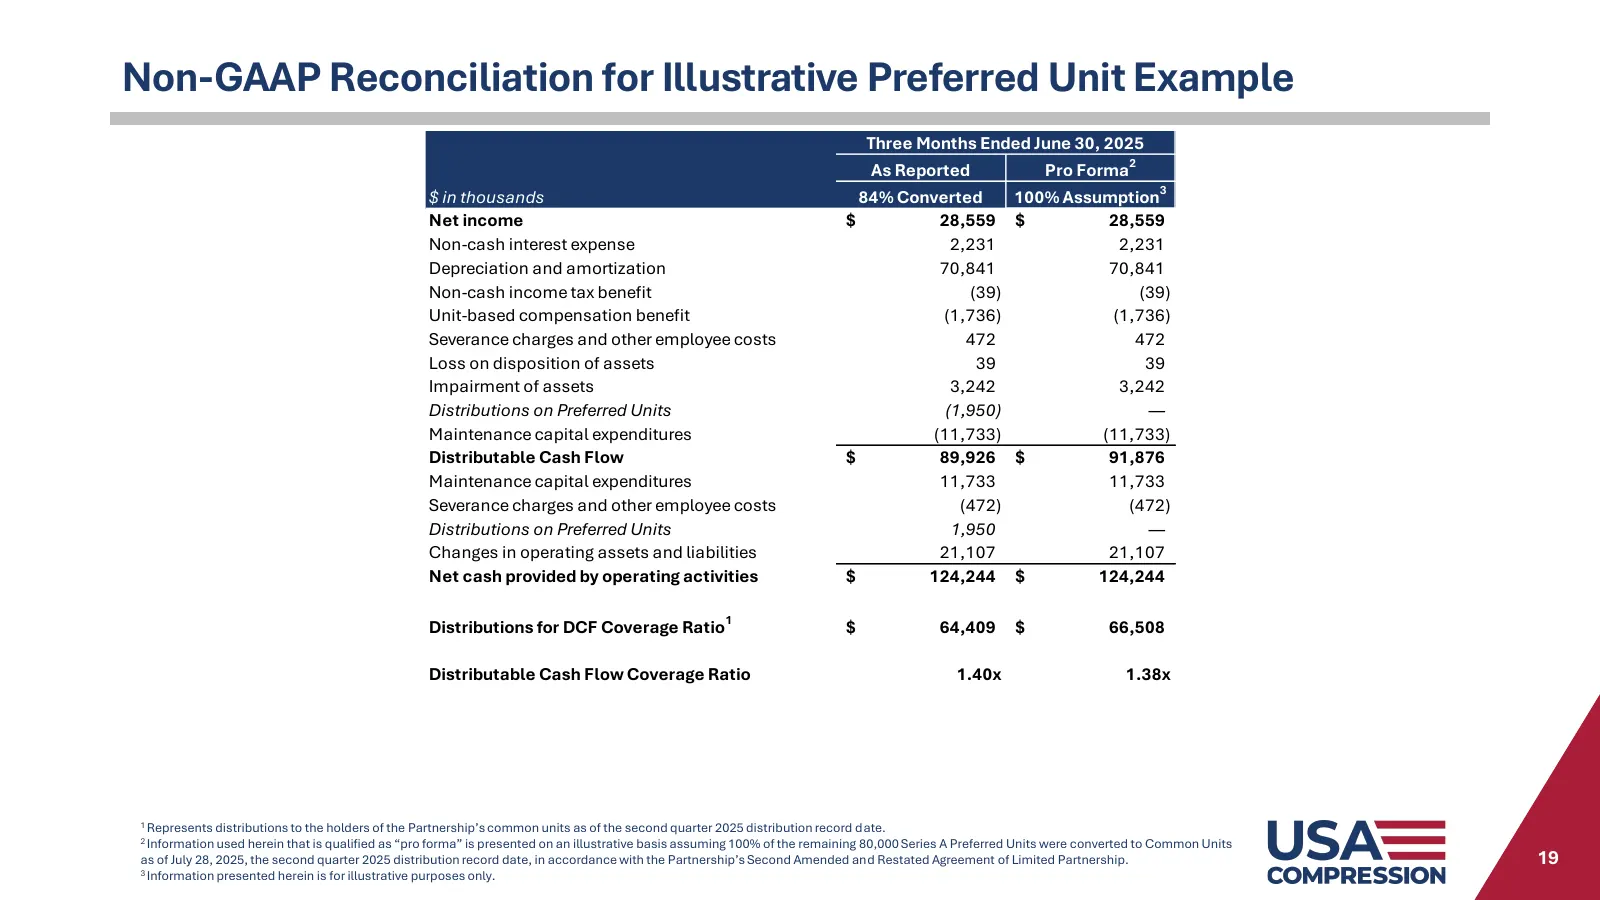
Slide 19: Non-GAAP Reconciliation for Illustrative Preferred Unit Example
Non-GAAP Reconciliation for Illustrative Preferred Unit Example Three Months Ended June 30, 2025 2 As Reported Pro Forma 3 $ in thousands 84% Converted 100% Assumption Net income $ 28,559 $ 28,559 Non-cash interest expense 2,231 2,231 Depreciation and amortization 70,841 70,841 Non-cash income tax b
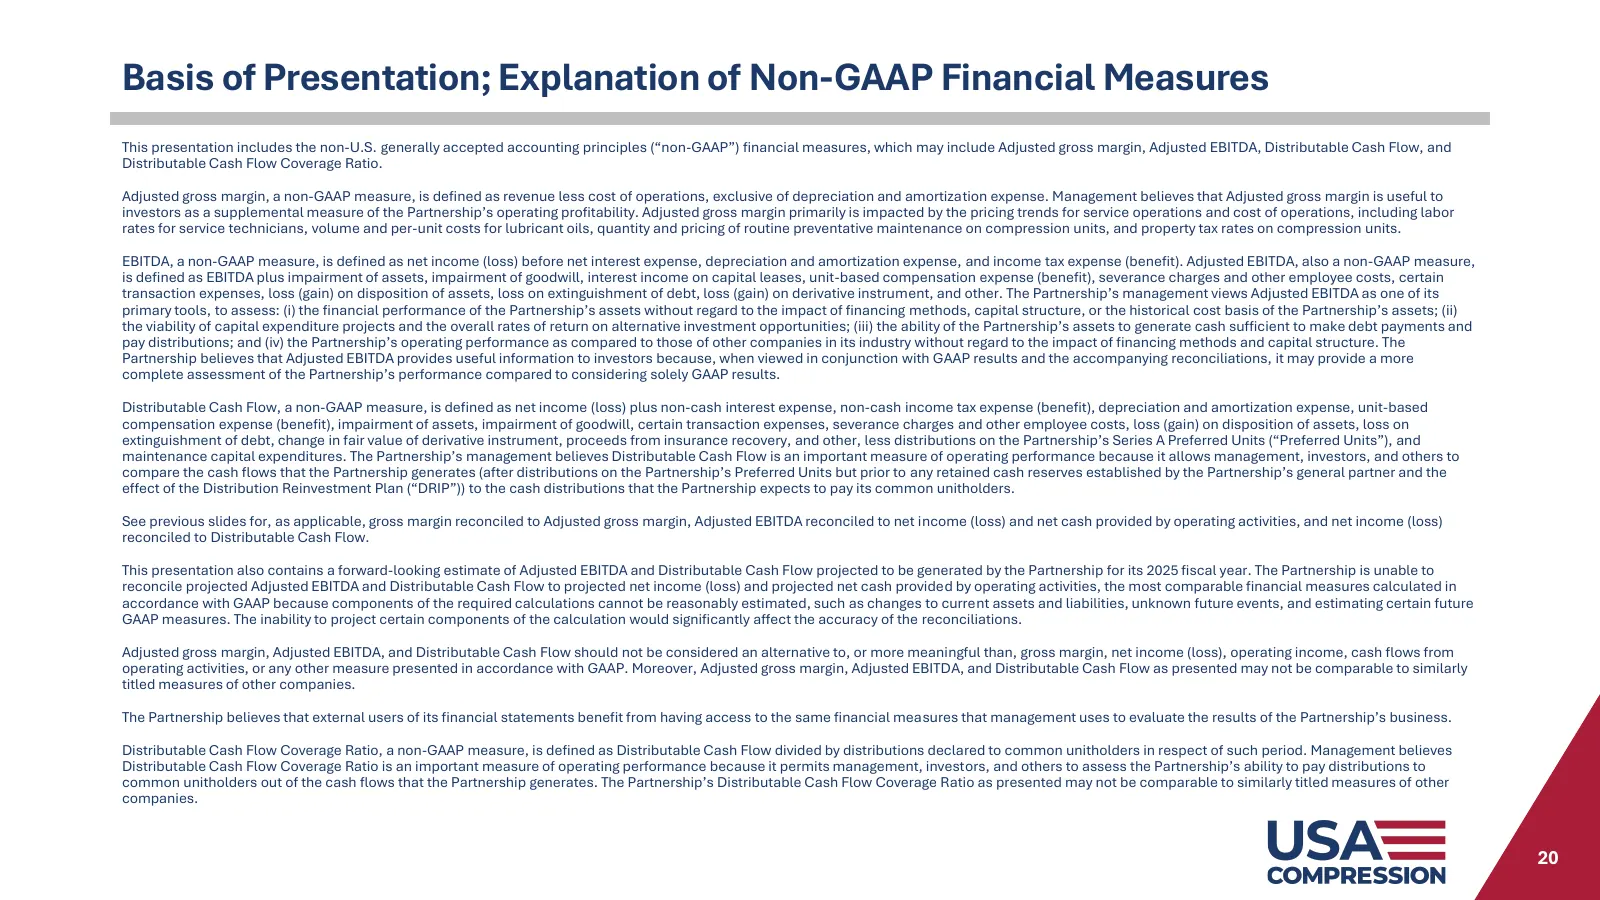
Slide 20: Basis of Presentation; Explanation of Non-GAAP Financial Measures
Basis of Presentation; Explanation of Non-GAAP Financial Measures This presentation includes the non-U.S. generally accepted accounting principles (“non-GAAP”) financial measures, which may include Adjusted gross margin, Adjusted EBITDA, Distributable Cash Flow, and Distributable Cash Flow Coverage
Source: company website
More decks from USA Compression Partners, LP
 Q3 2026 Earnings Presentation11 slides · Nov 3, 2026
 Q2 2026 Earnings Presentation11 slides · Aug 4, 2026
 Citi 2026 Natural Resources Conference20 slides · August 2026
 RBC Global Energy, Power and Infrastructure Conference 202620 slides · June 2026
 Q1 2026 Earnings Presentation11 slides · May 5, 2026
 J.P. Morgan Global Leveraged Finance Conference 202619 slides · Mar 2, 2026