Octodec Investments Limited · JSE:OCT
Octodec Investments — H1 2016 Earnings Presentation
42 slides from Octodec Investments's earnings presentation, Feb 29, 2016
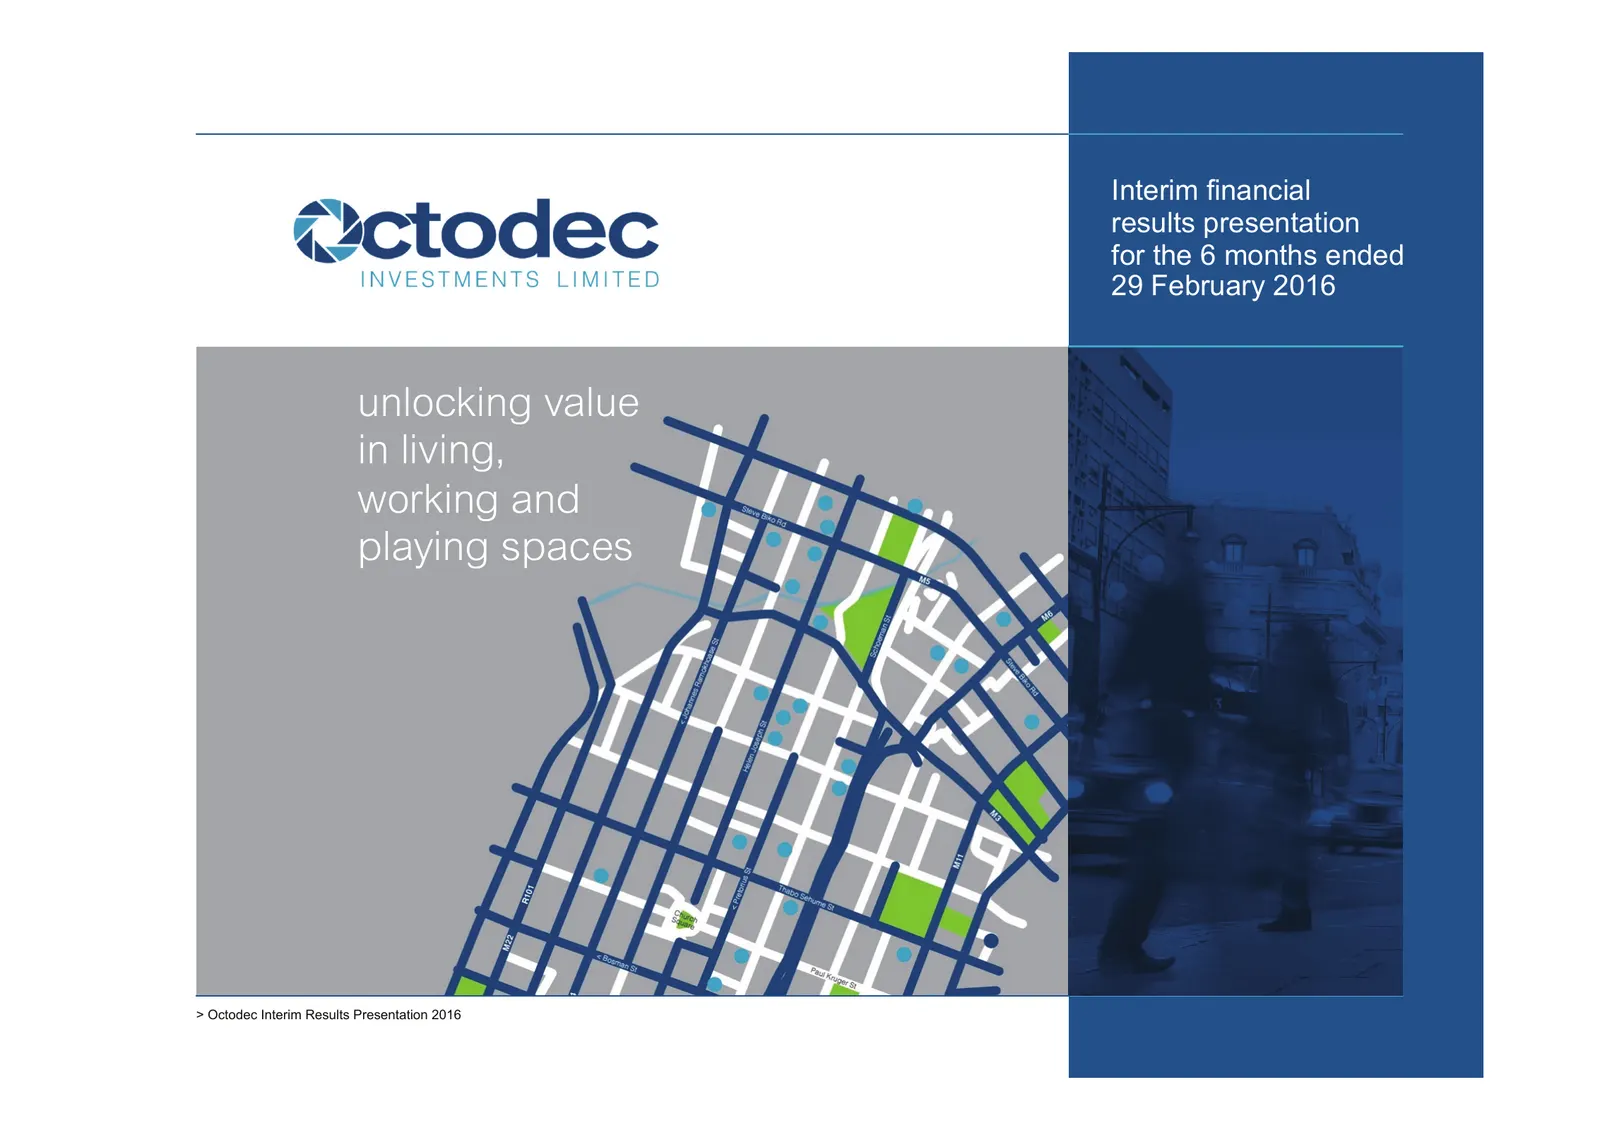
Slide 1: Interim financial results presentation for the 6 months ended 29 February 2016
>1 Interim financial results presentation for the 6 months ended 29 February 2016 unlocking value in living, working and playing spaces > Octodec Interim Results Presentation 2016
Slide 2: Agenda
>2 > agenda Overview 01 Our property 02 portfolio Our results 03 Outlook 04 Questions and 05 answers Contact details 06 > Octodec Interim Results Presentation 2016
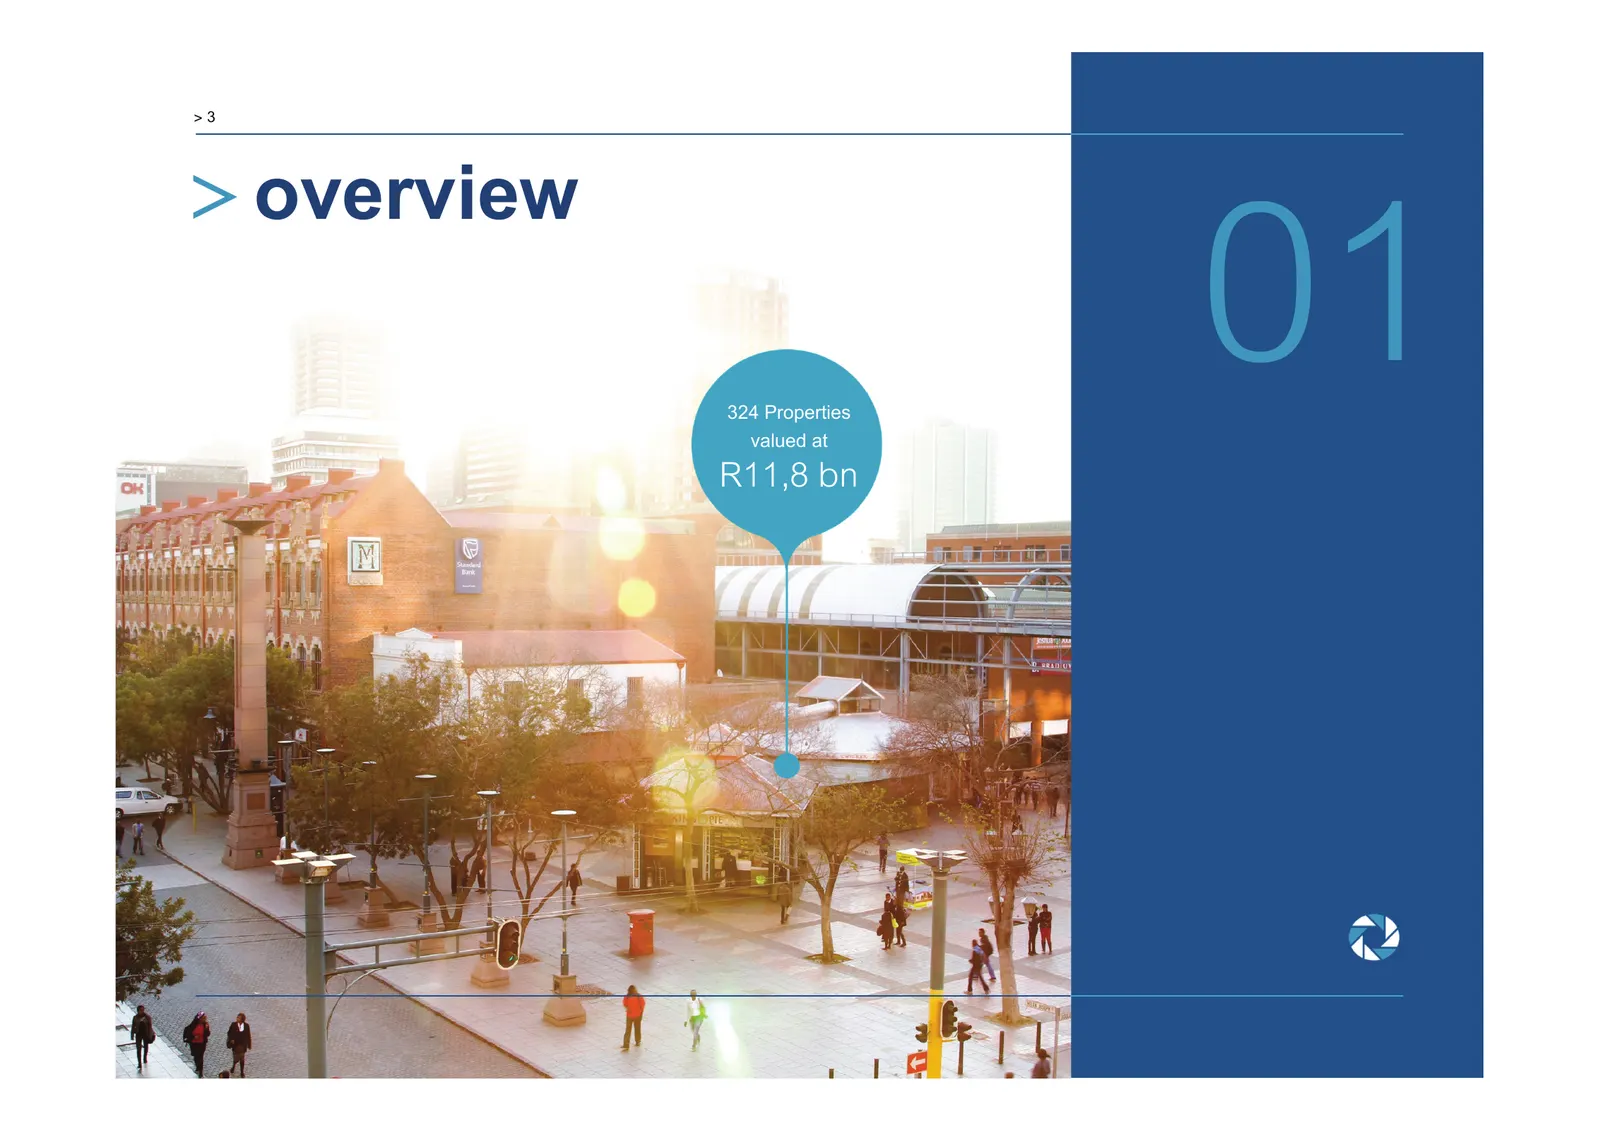
Slide 3: Overview: 324 properties valued at R11,8 bn
>3 > overview 324 Properties valued at 01 R11,8 bn
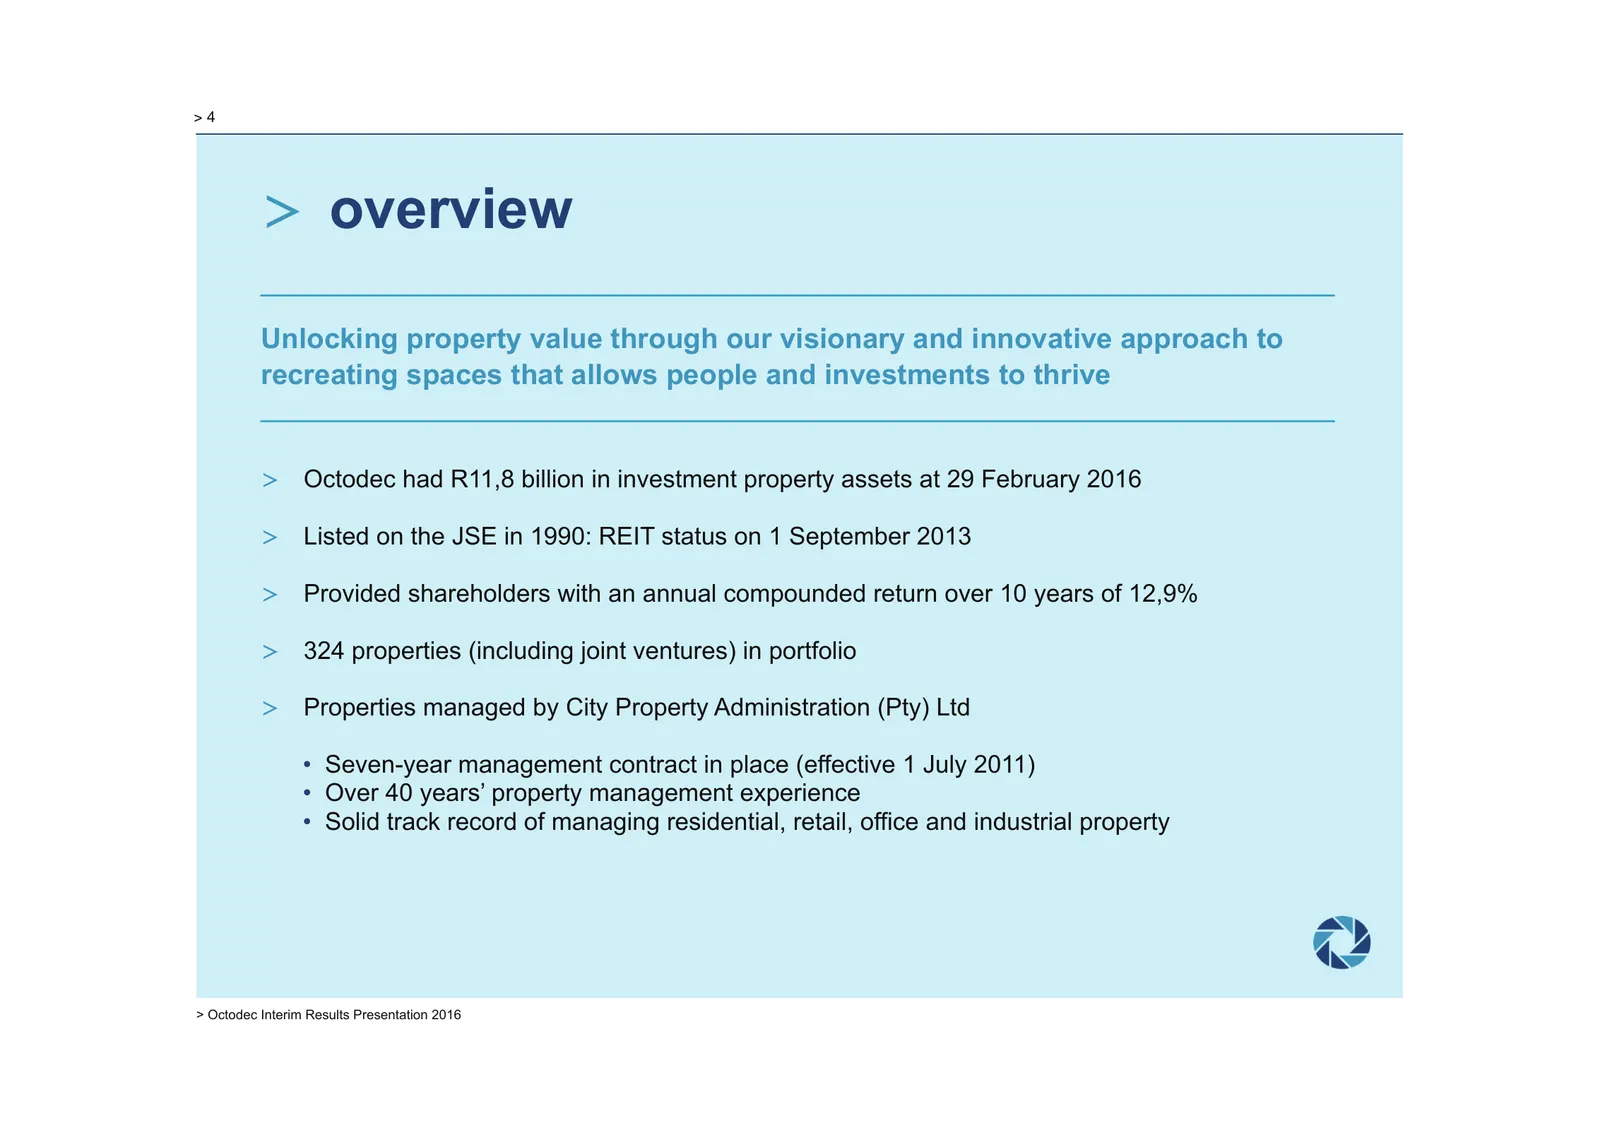
Slide 4: Overview
>4 > overview Unlocking property value through our visionary and innovative approach to recreating spaces that allows people and investments to thrive > Octodec had R11,8 billion in investment property assets at 29 February 2016 > Listed on the JSE in 1990: REIT status on 1 September 2013 > Provided
Slide 5: Our strategy
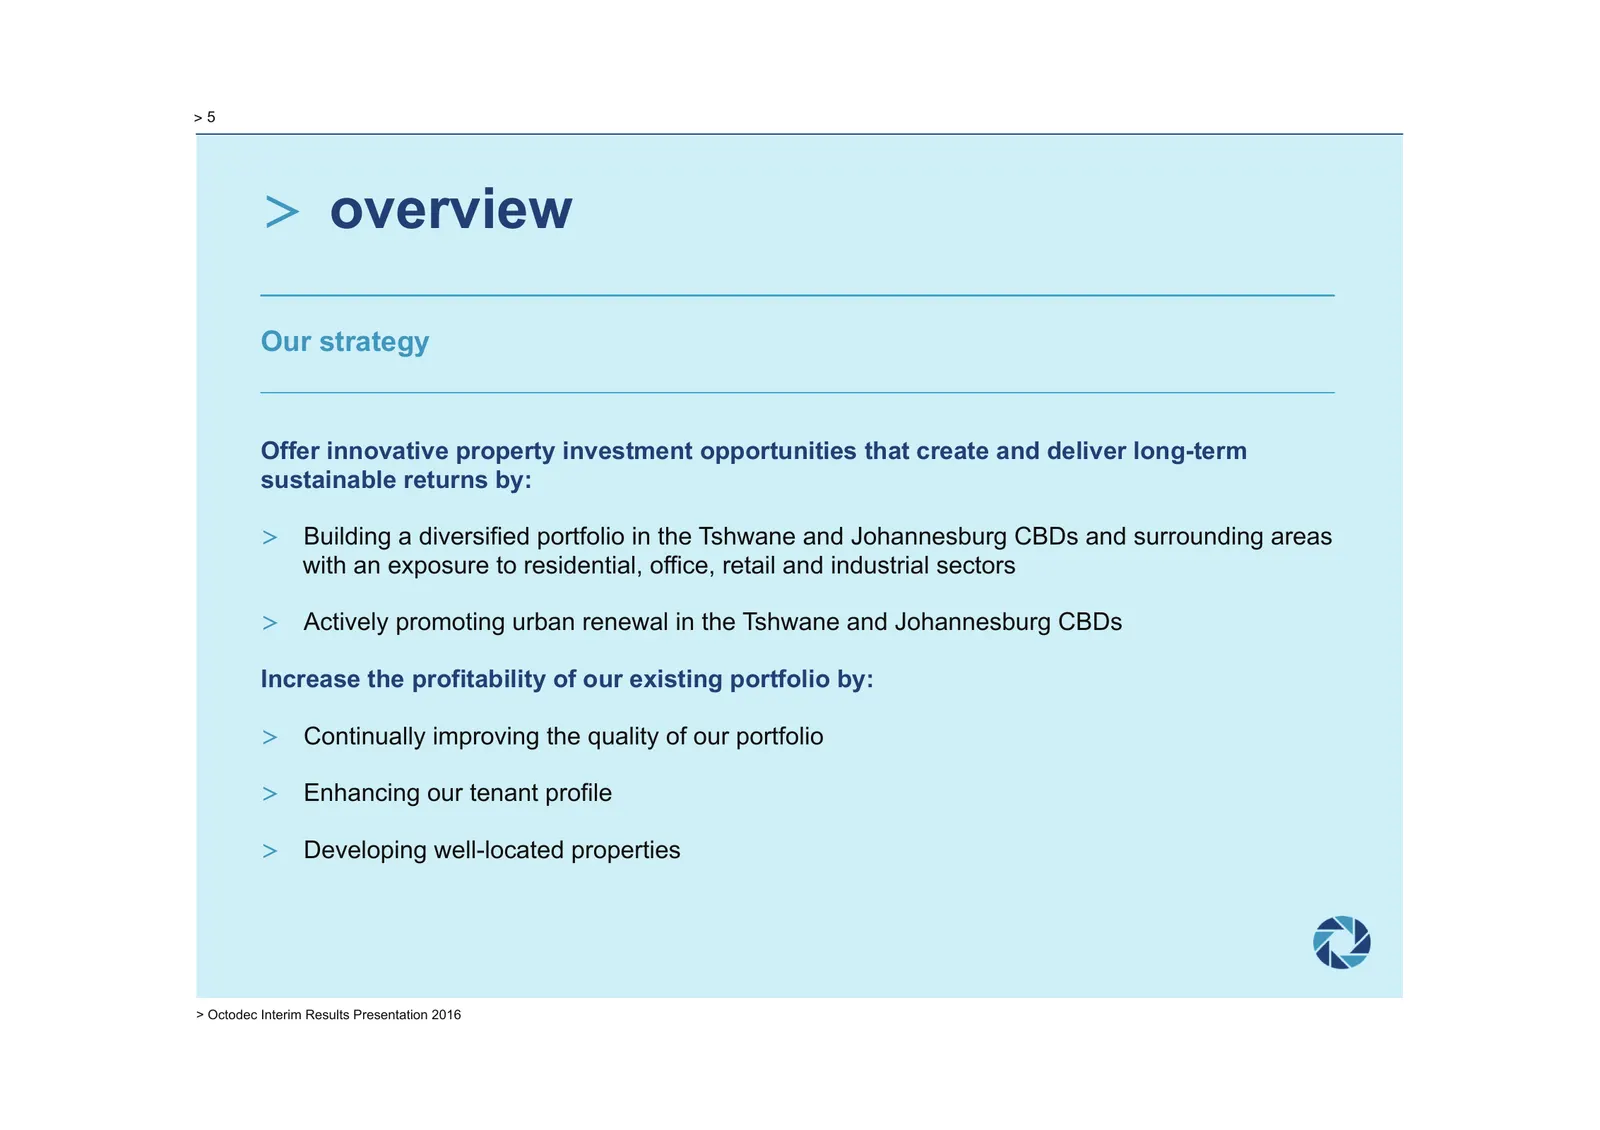
>5 > overview Our strategy Offer innovative property investment opportunities that create and deliver long-term sustainable returns by: > Building a diversified portfolio in the Tshwane and Johannesburg CBDs and surrounding areas with an exposure to residential, office, retail and industrial sectors
Slide 6: Our strategy (continued)
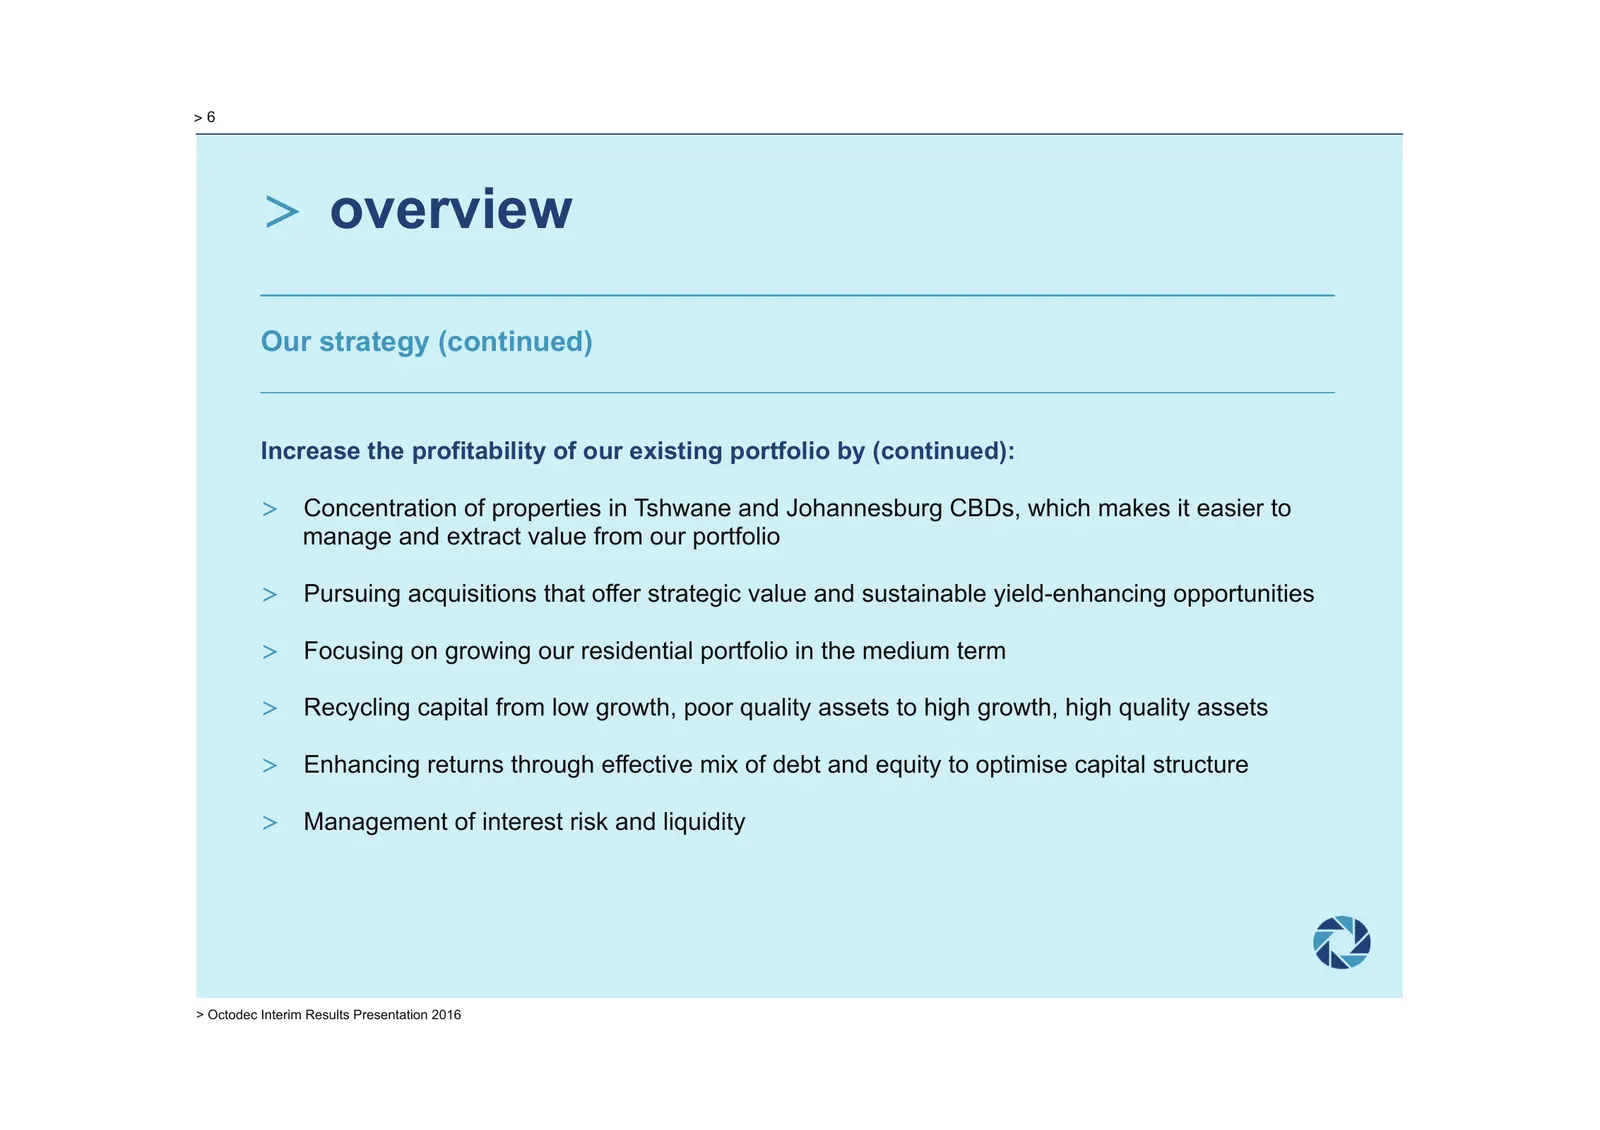
>6 > overview Our strategy (continued) Increase the profitability of our existing portfolio by (continued): > Concentration of properties in Tshwane and Johannesburg CBDs, which makes it easier to manage and extract value from our portfolio > Pursuing acquisitions that offer strategic value and sust
Slide 7: Corporate structure
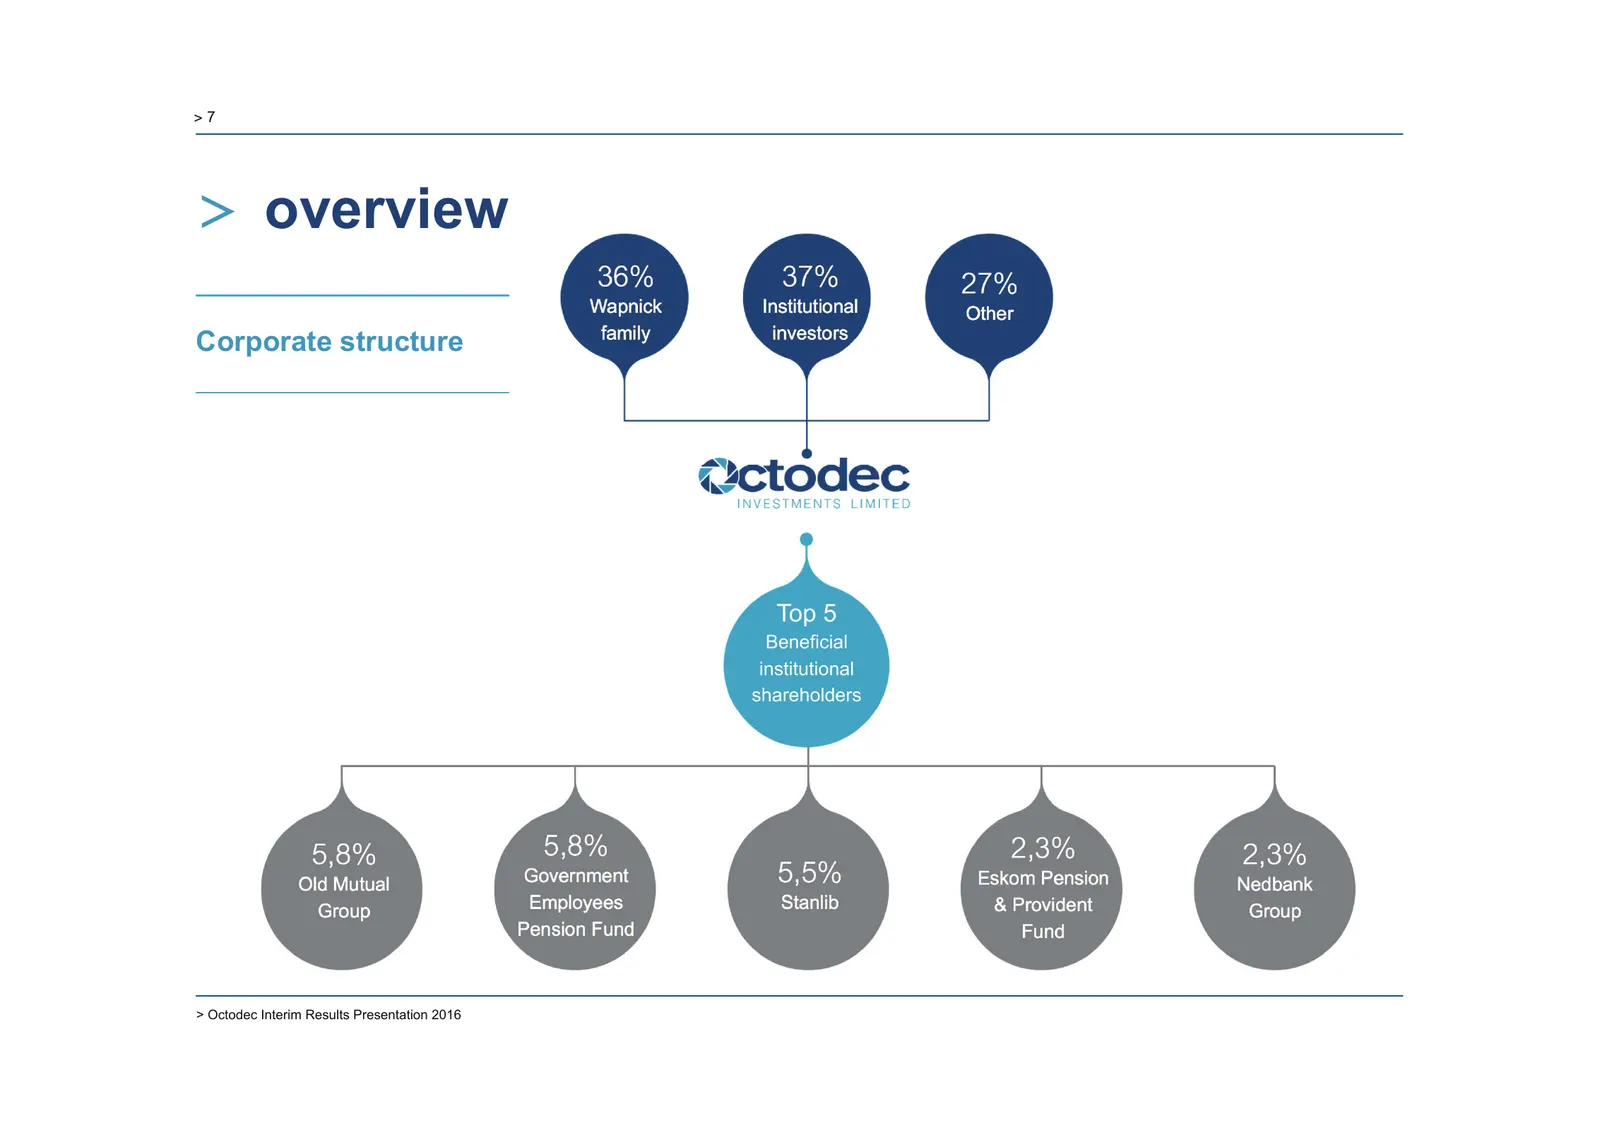
>7 > overview 36% 37% 27% Wapnick Institutional Other family investors Corporate structure Top 5 Beneficial institutional shareholders 5,8% 5,8% 2,3% 2,3% Old Mutual Government 5,5% Eskom Pension Nedbank Group Employees Stanlib & Provident Group Pension Fund Fund > Octodec Interim Results Presentati
Slide 8: Overview of Tshwane CBD
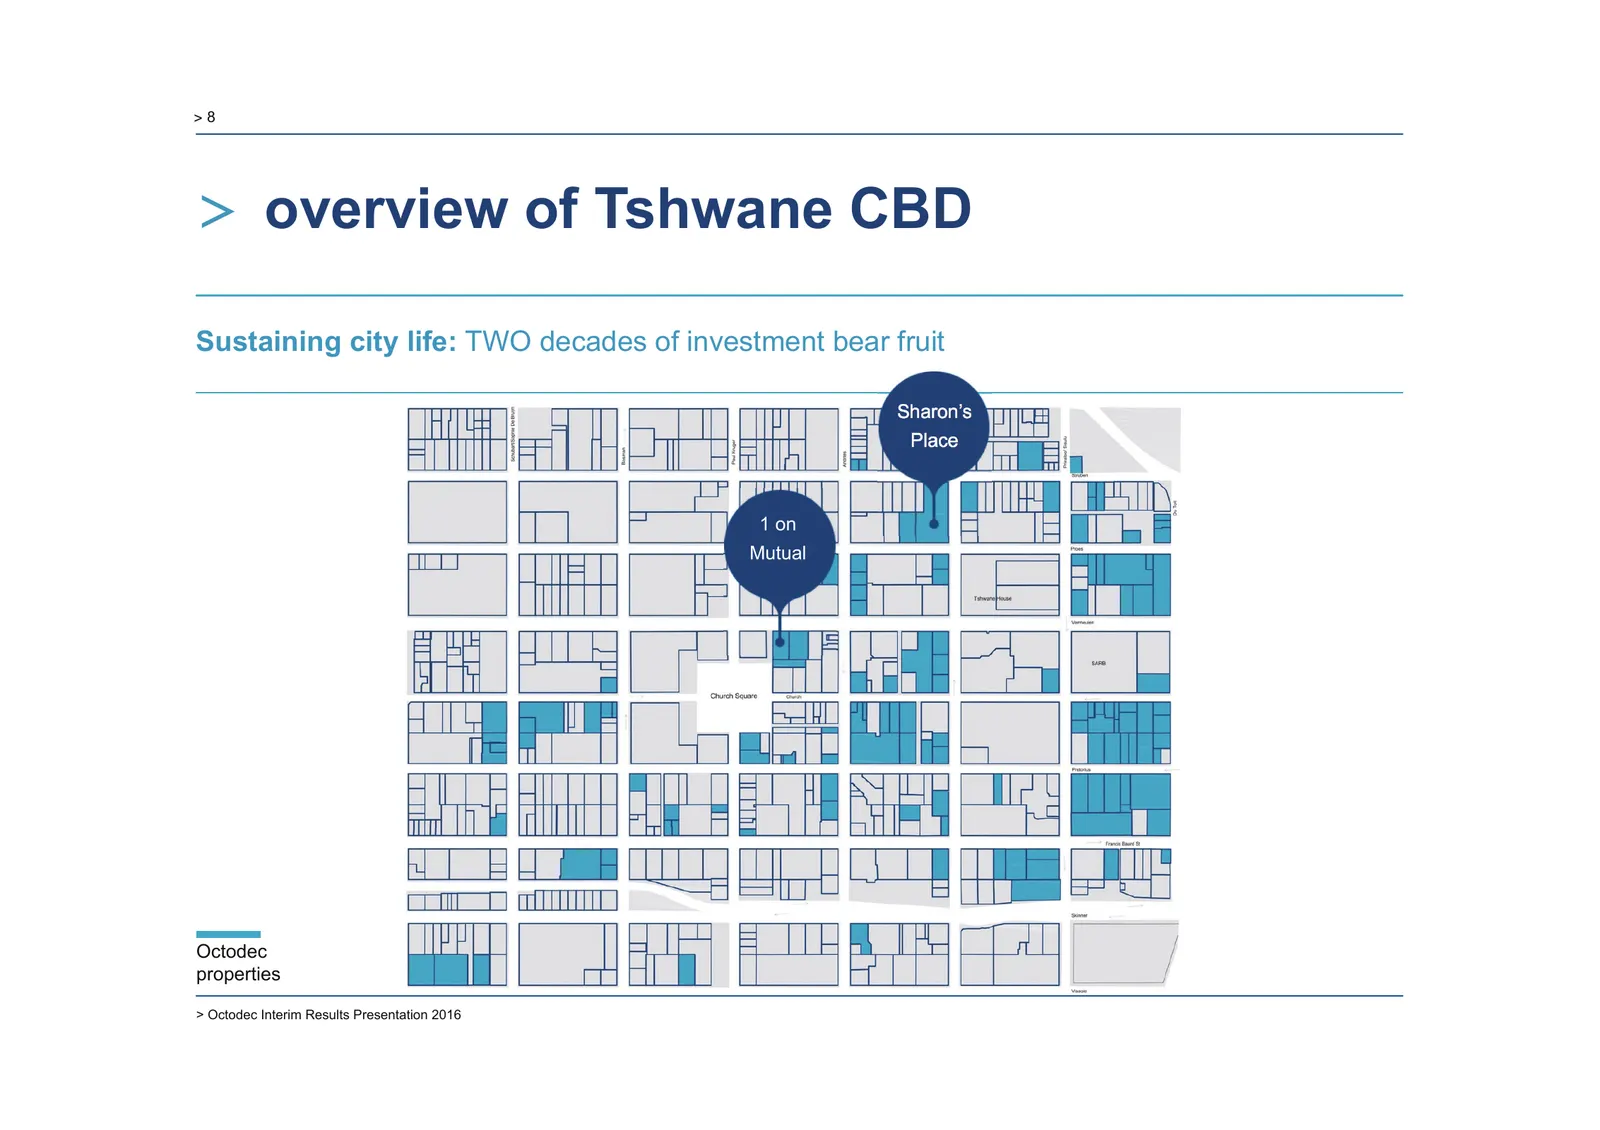
>8 > overview of Tshwane CBD Sustaining city life: TWO decades of investment bear fruit Sharon’s Place 1 on Mutual Octodec properties > Octodec Interim Results Presentation 2016
Slide 9: Overview of Johannesburg CBD
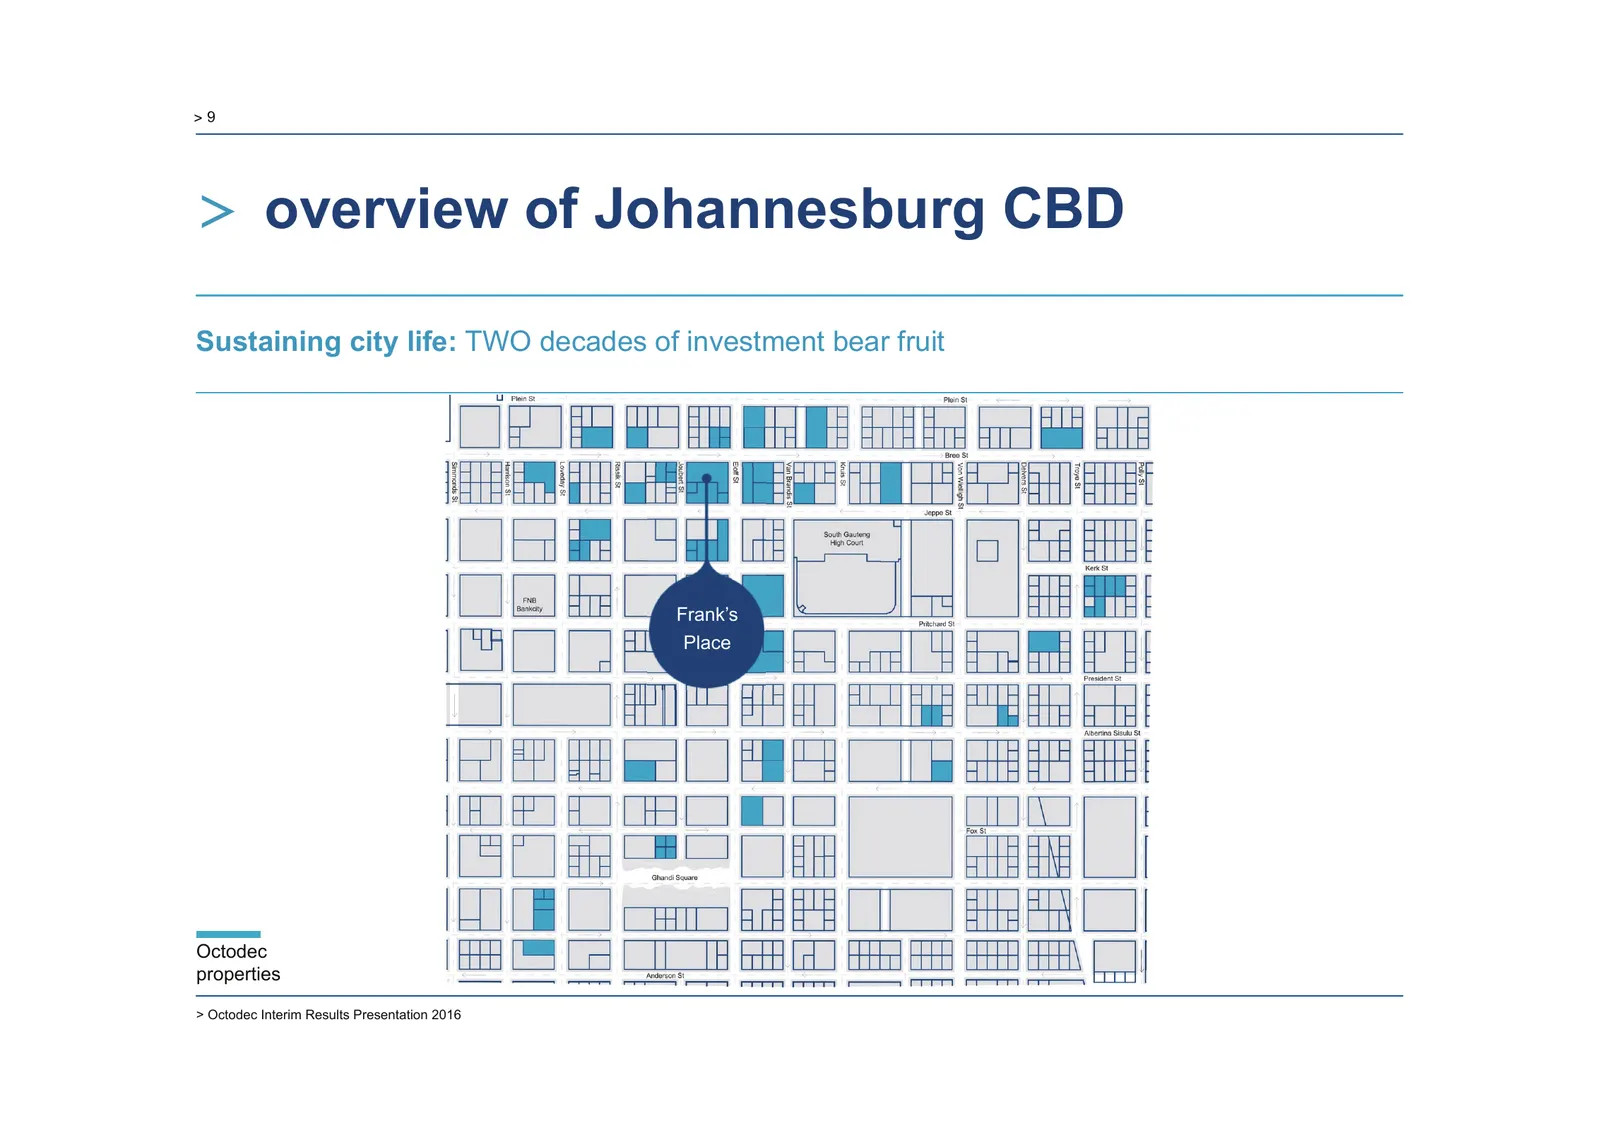
>9 > overview of Johannesburg CBD Sustaining city life: TWO decades of investment bear fruit Frank’s Place Octodec properties > Octodec Interim Results Presentation 2016
Slide 10: Our property portfolio
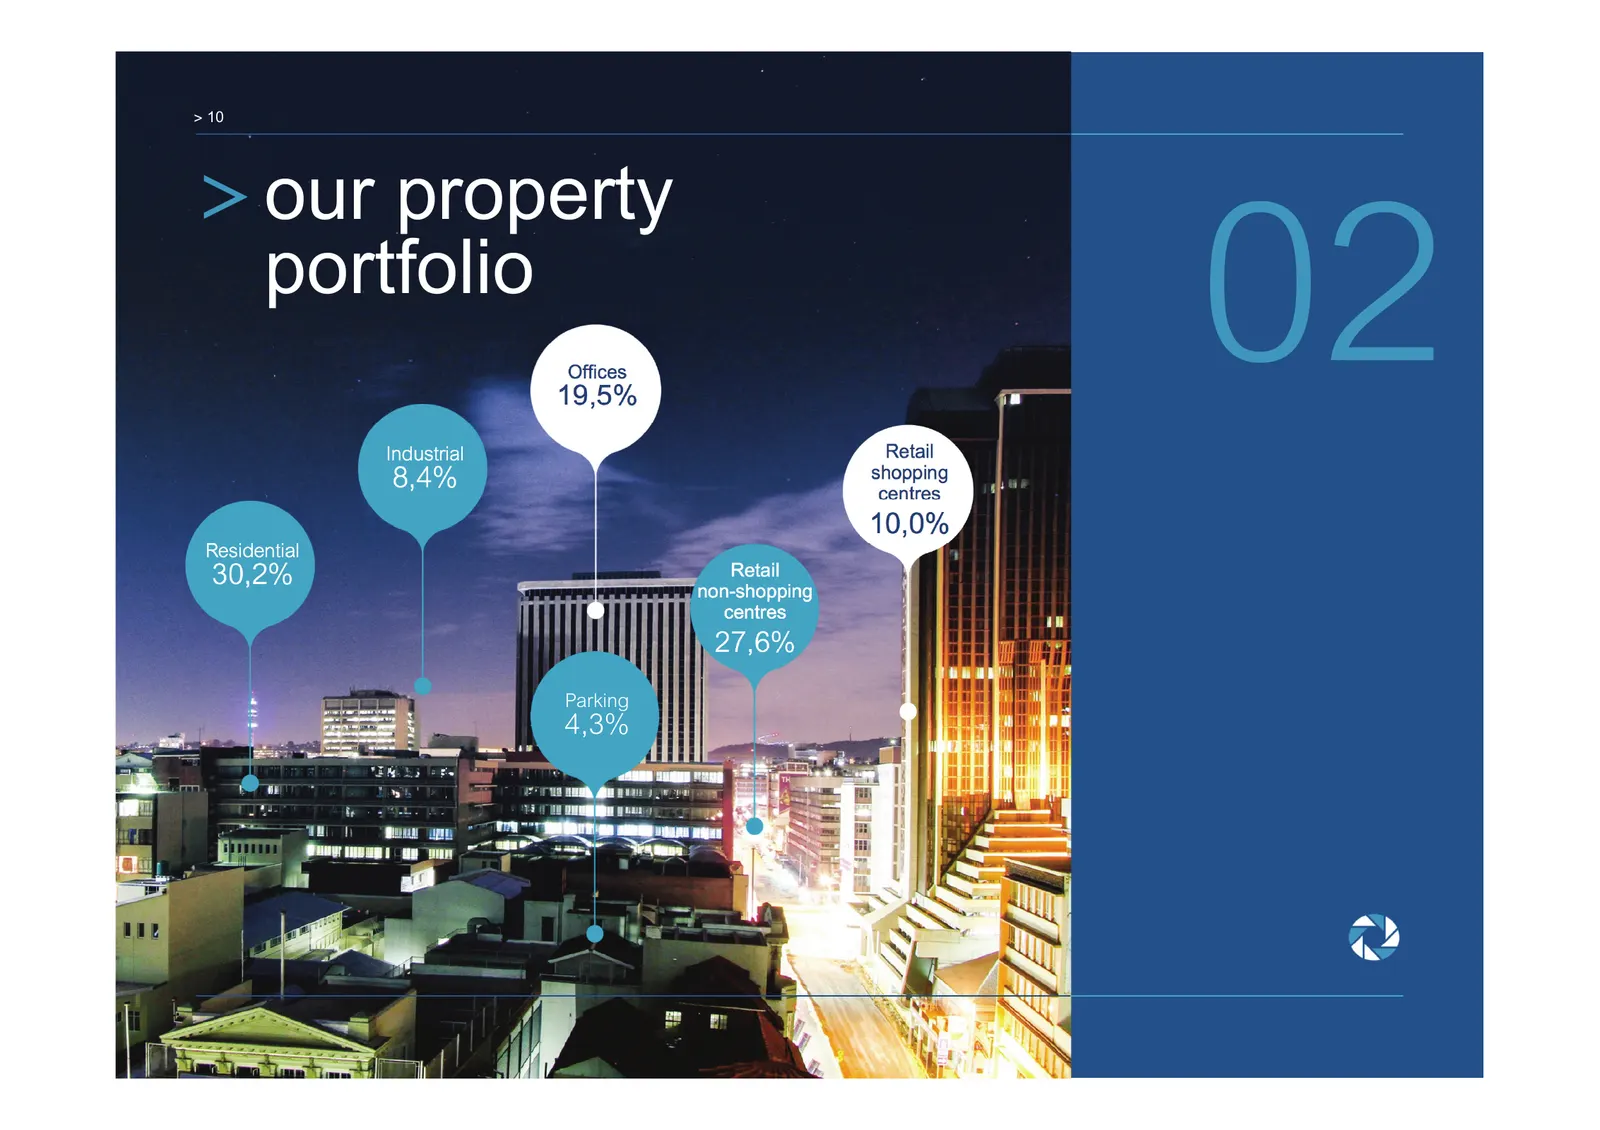
> 10 > our property portfolio Industrial Offices 19,5% Retail 02 8,4% shopping centres 10,0% Residential 30,2% Retail non-shopping centres 27,6% Parking 4,3%
Slide 11: Geographical analysis of rental income
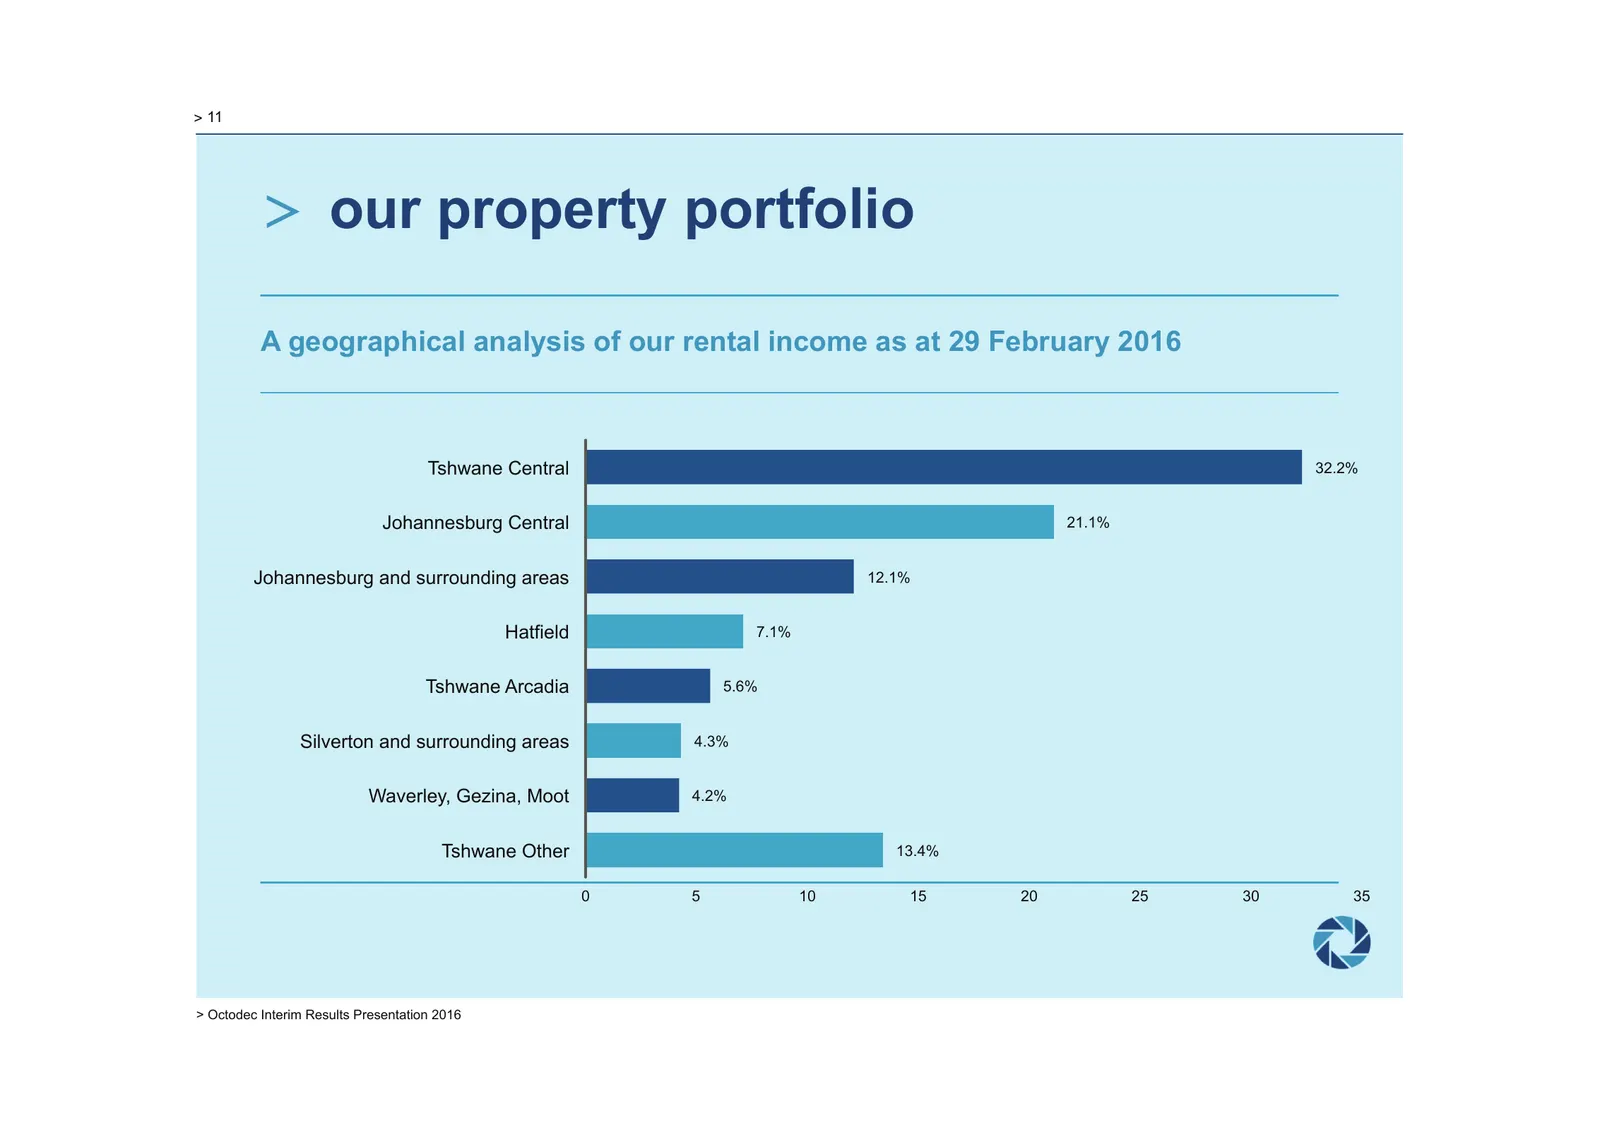
> 11 > our property portfolio A geographical analysis of our rental income as at 29 February 2016 Tshwane Central 32.2% Johannesburg Central 21.1% Johannesburg and surrounding areas 12.1% Hatfield 7.1% Tshwane Arcadia 5.6% Silverton and surrounding areas 4.3% Waverley, Gezina, Moot 4.2% Tshwane Othe
Slide 12: Our investment property portfolio
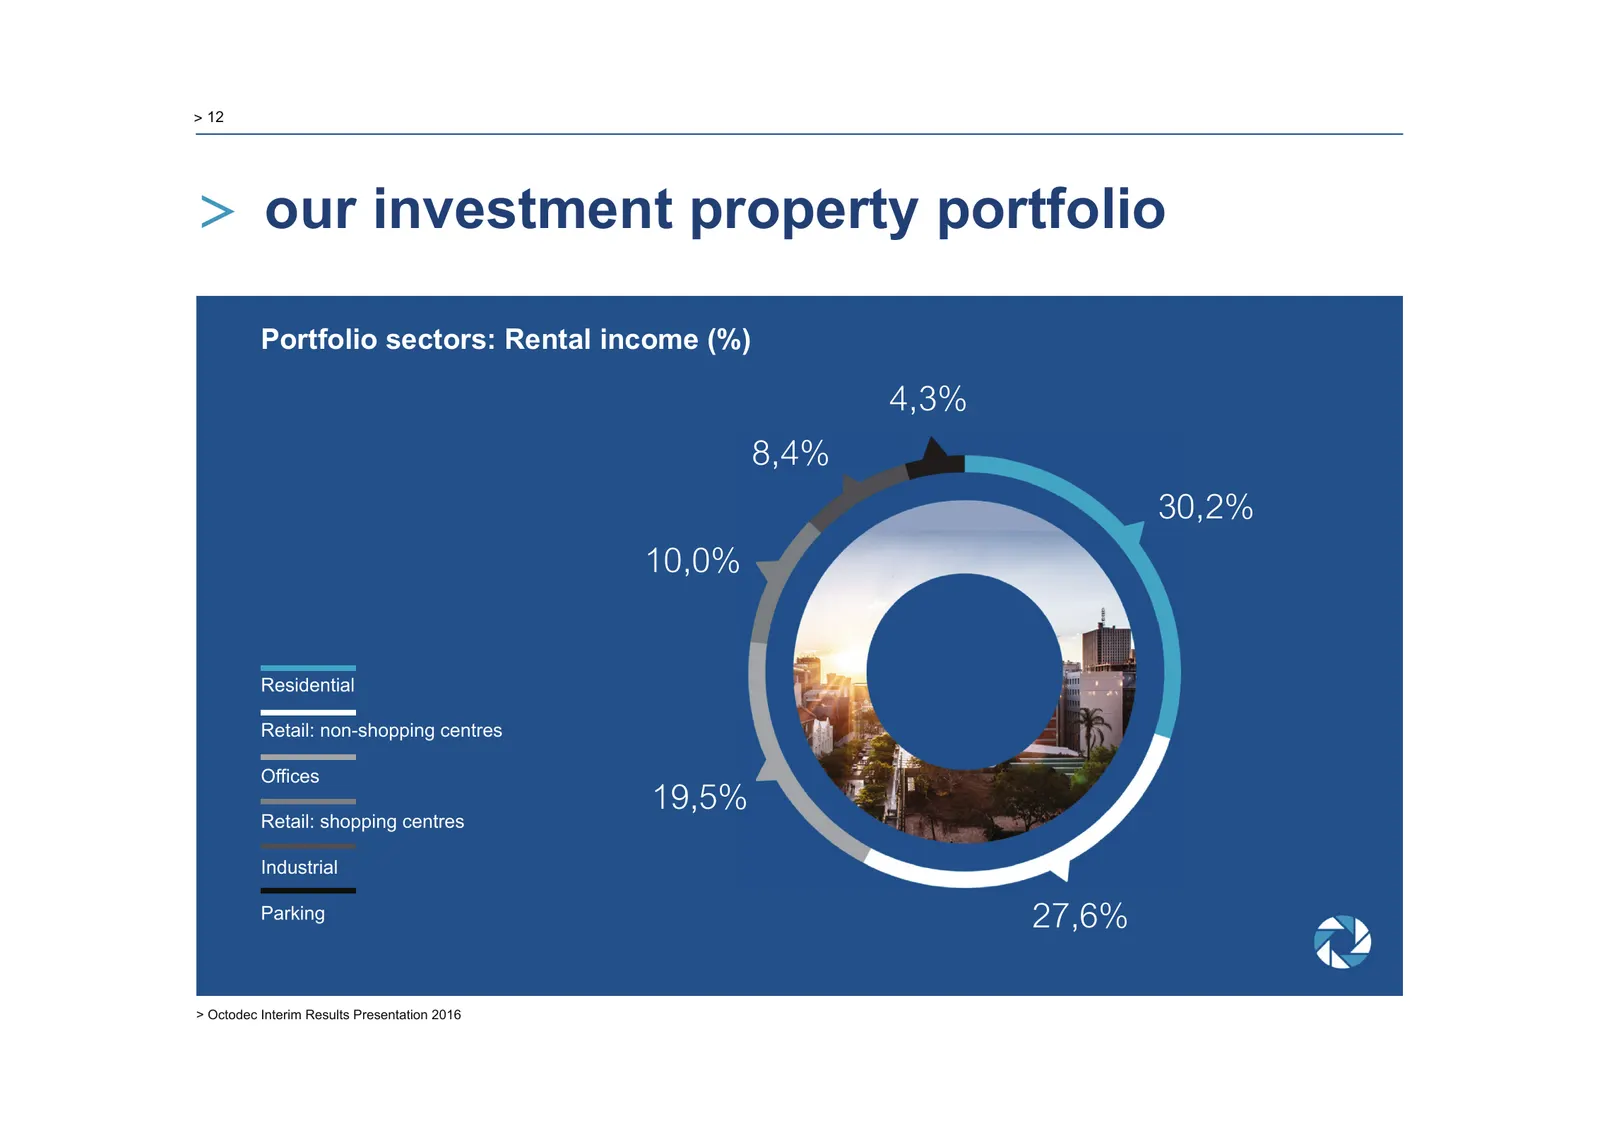
> 12 > our investment property portfolio Portfolio sectors: Rental income (%) 4,3% 8,4% 30,2% 10,0% Residential Retail: non-shopping centres Offices 19,5% Retail: shopping centres Industrial Parking 27,6% > Octodec Interim Results Presentation 2016
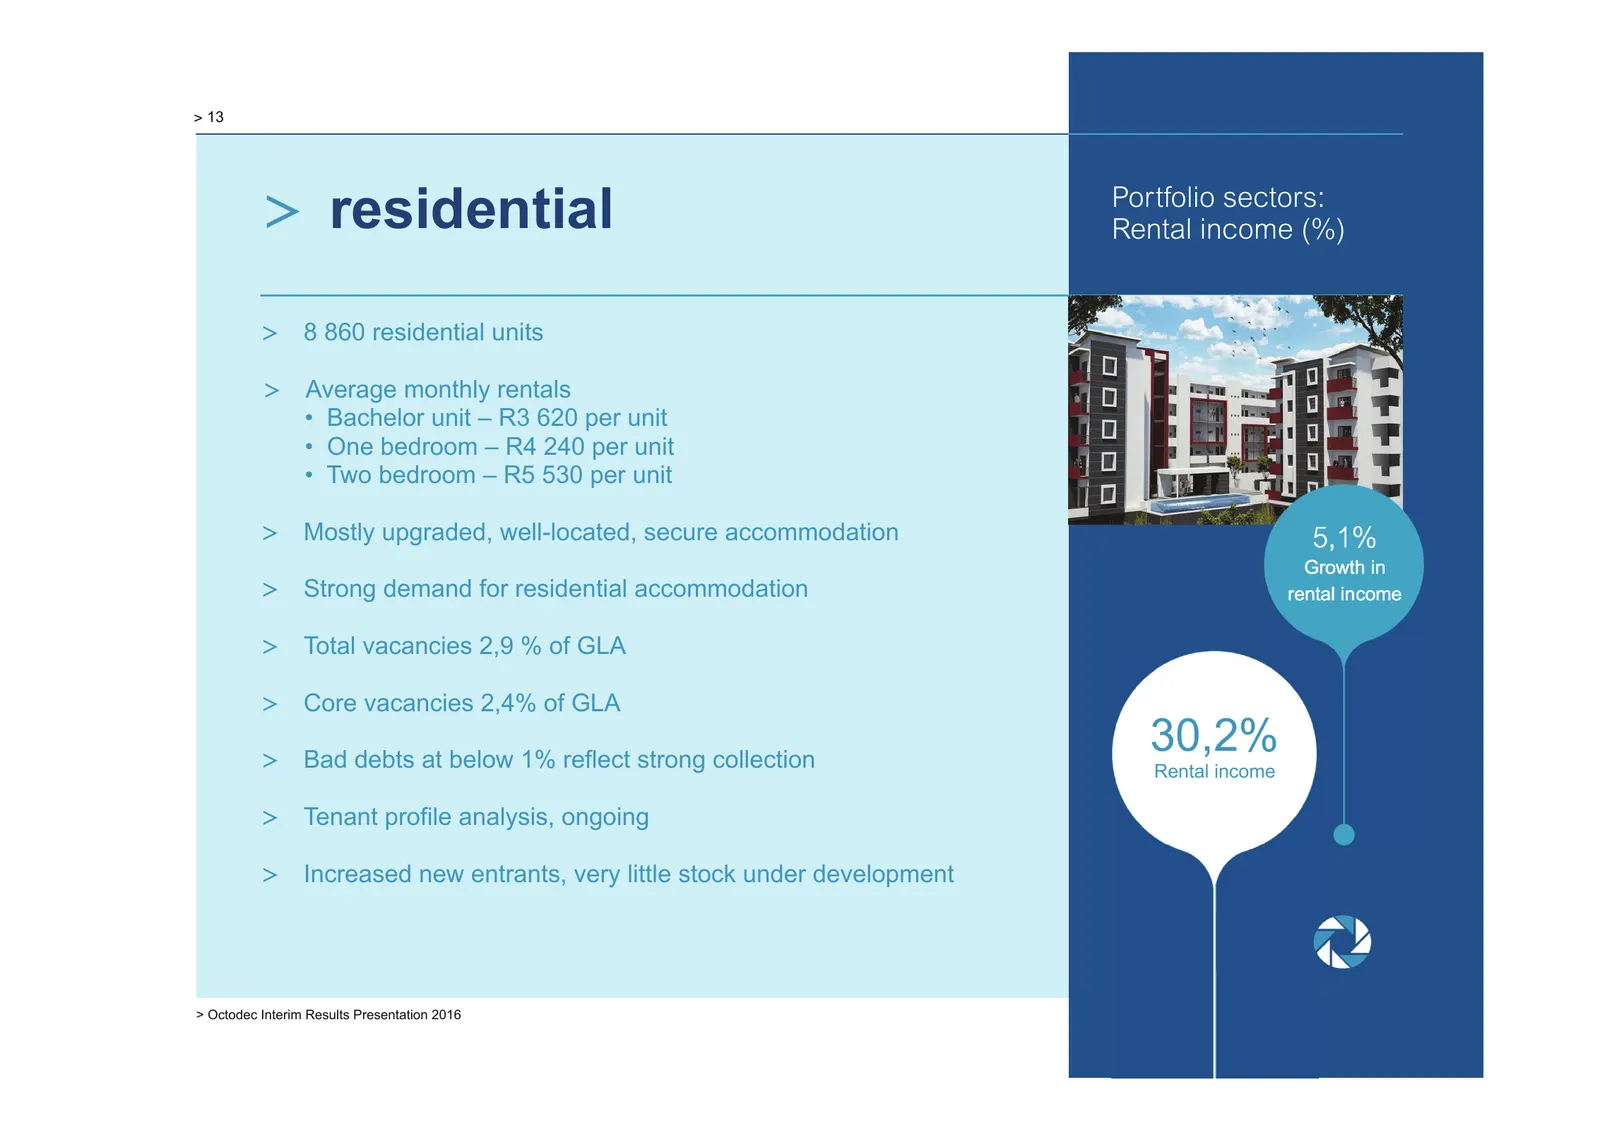
Slide 13: Residential
> 13 > residential Portfolio sectors: Rental income (%) > 8 860 residential units > Average monthly rentals • Bachelor unit – R3 620 per unit • One bedroom – R4 240 per unit • Two bedroom – R5 530 per unit > Mostly upgraded, well-located, secure accommodation 5,1% Growth in > Strong demand for resid
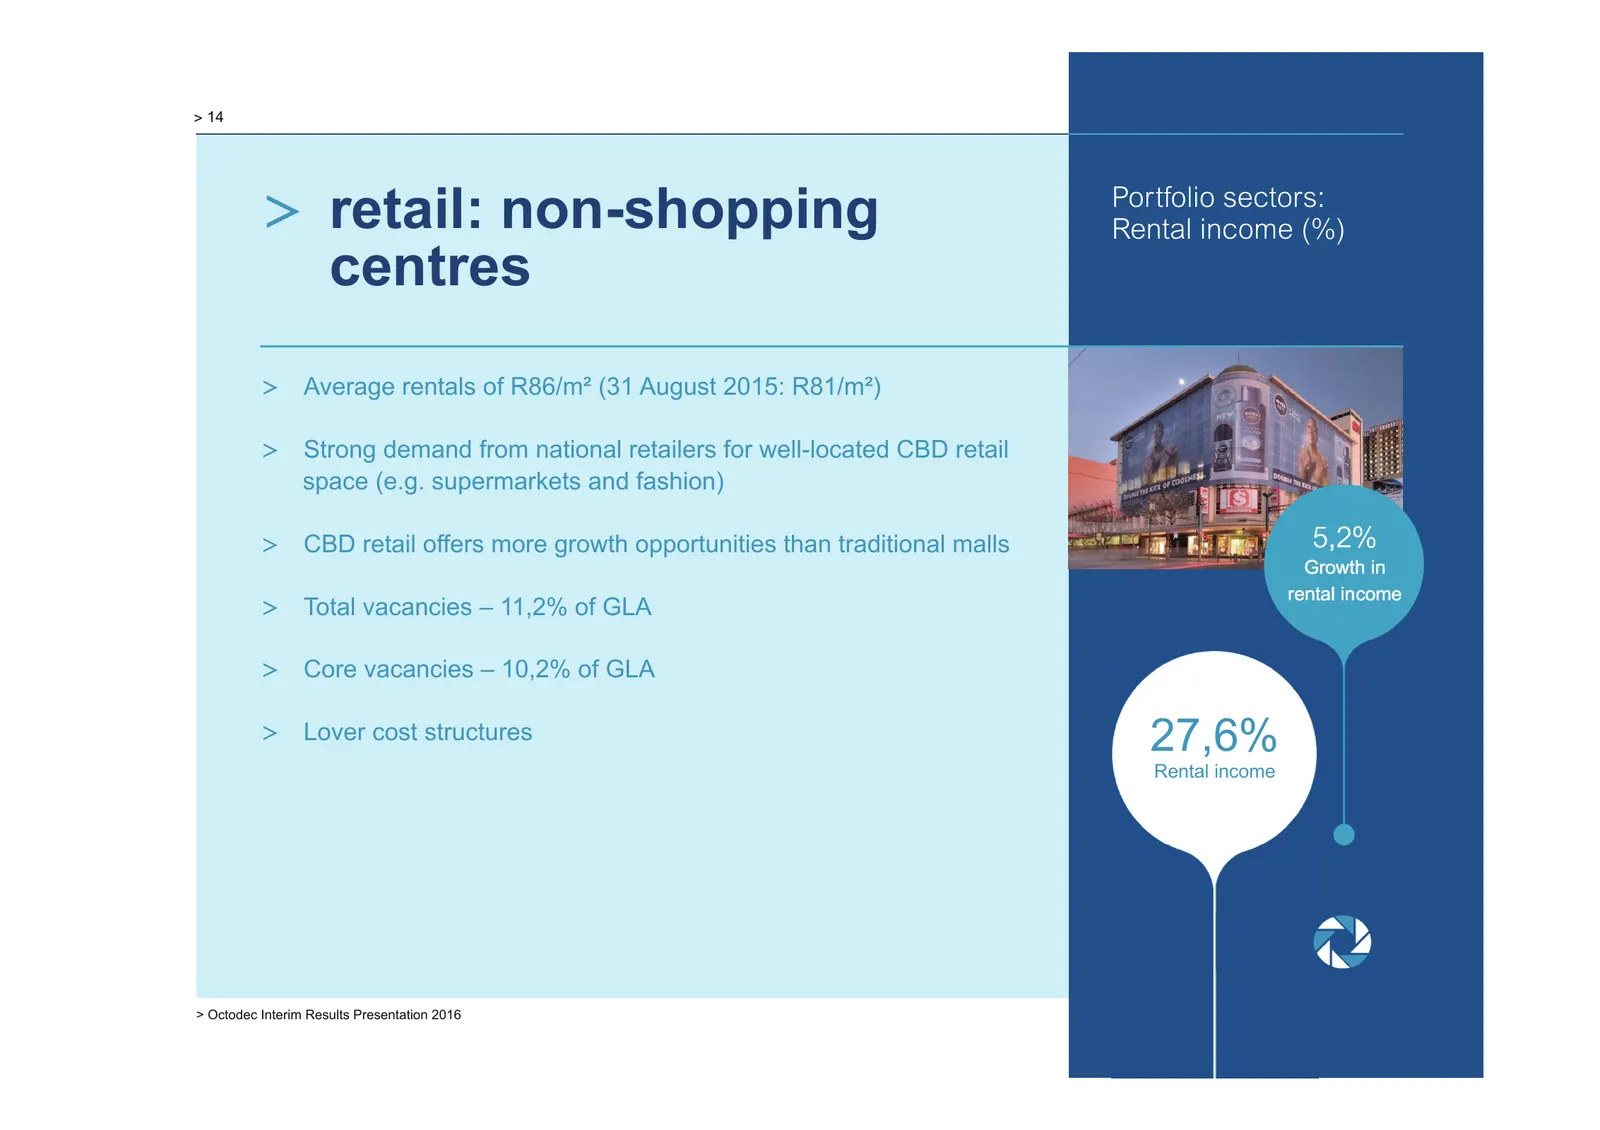
Slide 14: Retail: non-shopping centres
> 14 > retail: non-shopping Portfolio sectors: Rental income (%) centres > Average rentals of R86/m² (31 August 2015: R81/m²) > Strong demand from national retailers for well-located CBD retail space (e.g. supermarkets and fashion) > CBD retail offers more growth opportunities than traditional malls
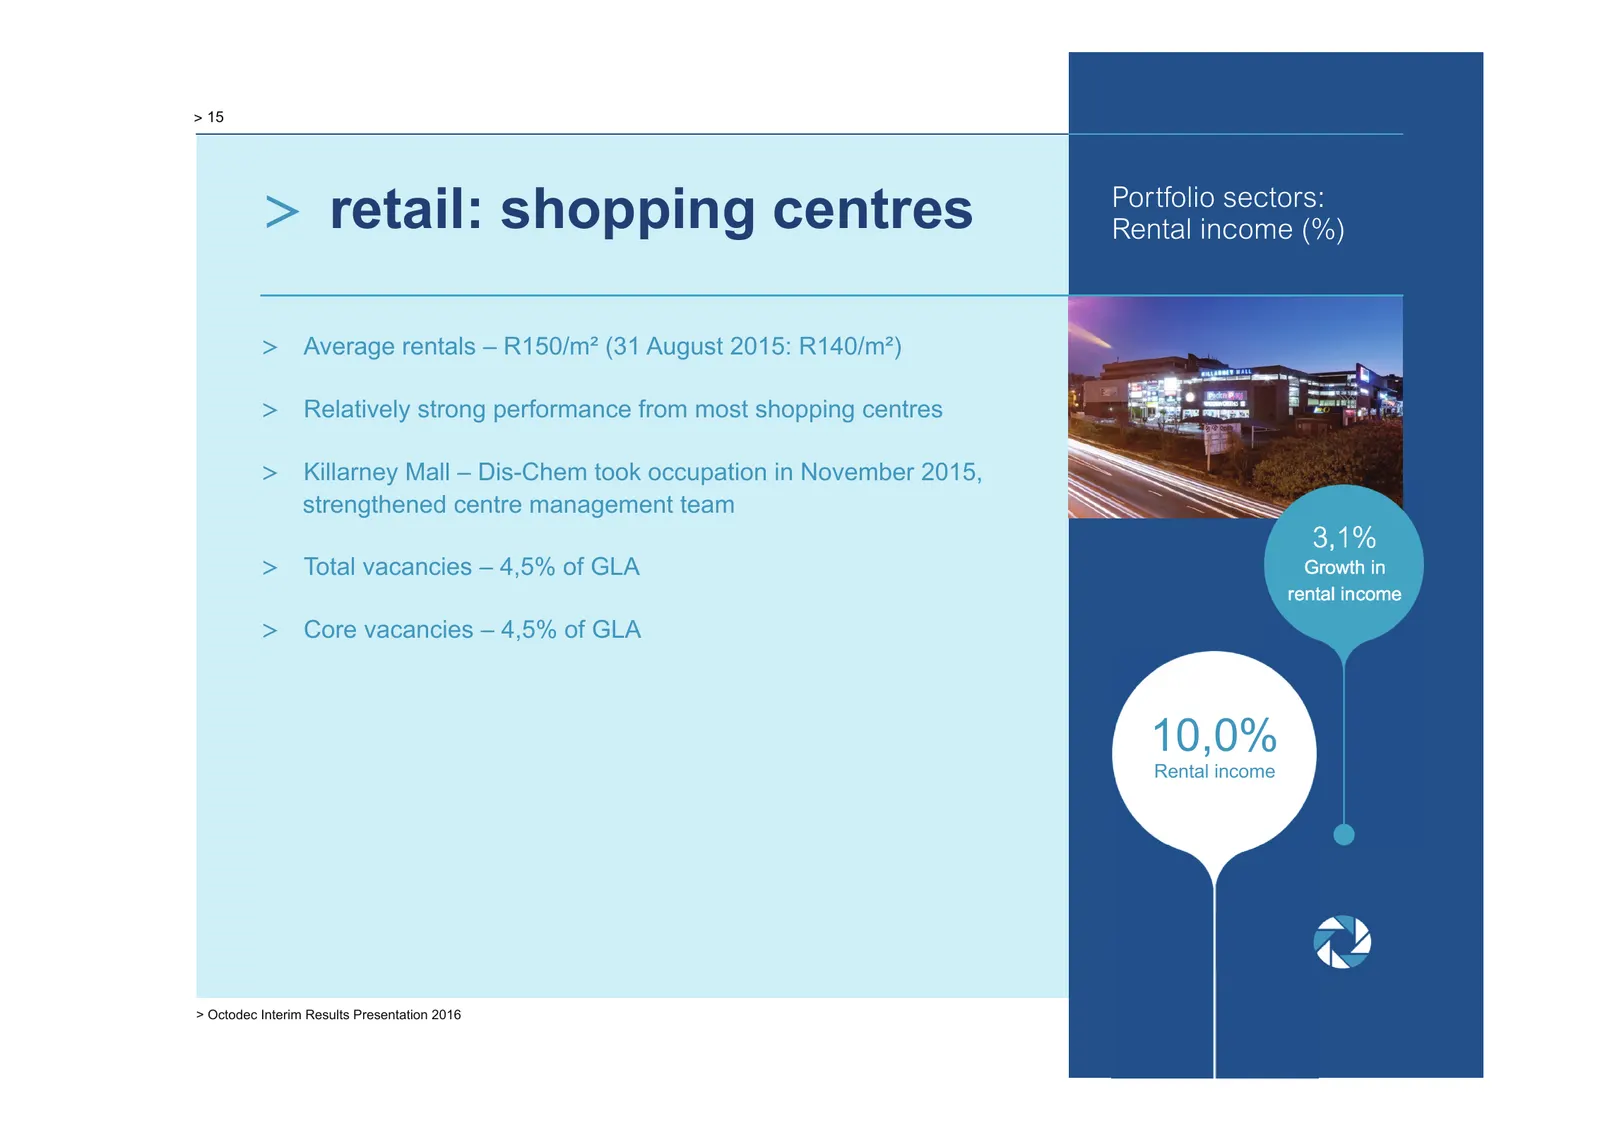
Slide 15: Retail: shopping centres
> 15 > retail: shopping centres Portfolio sectors: Rental income (%) > Average rentals – R150/m² (31 August 2015: R140/m²) > Relatively strong performance from most shopping centres > Killarney Mall – Dis-Chem took occupation in November 2015, strengthened centre management team 3,1% > Total vacanci
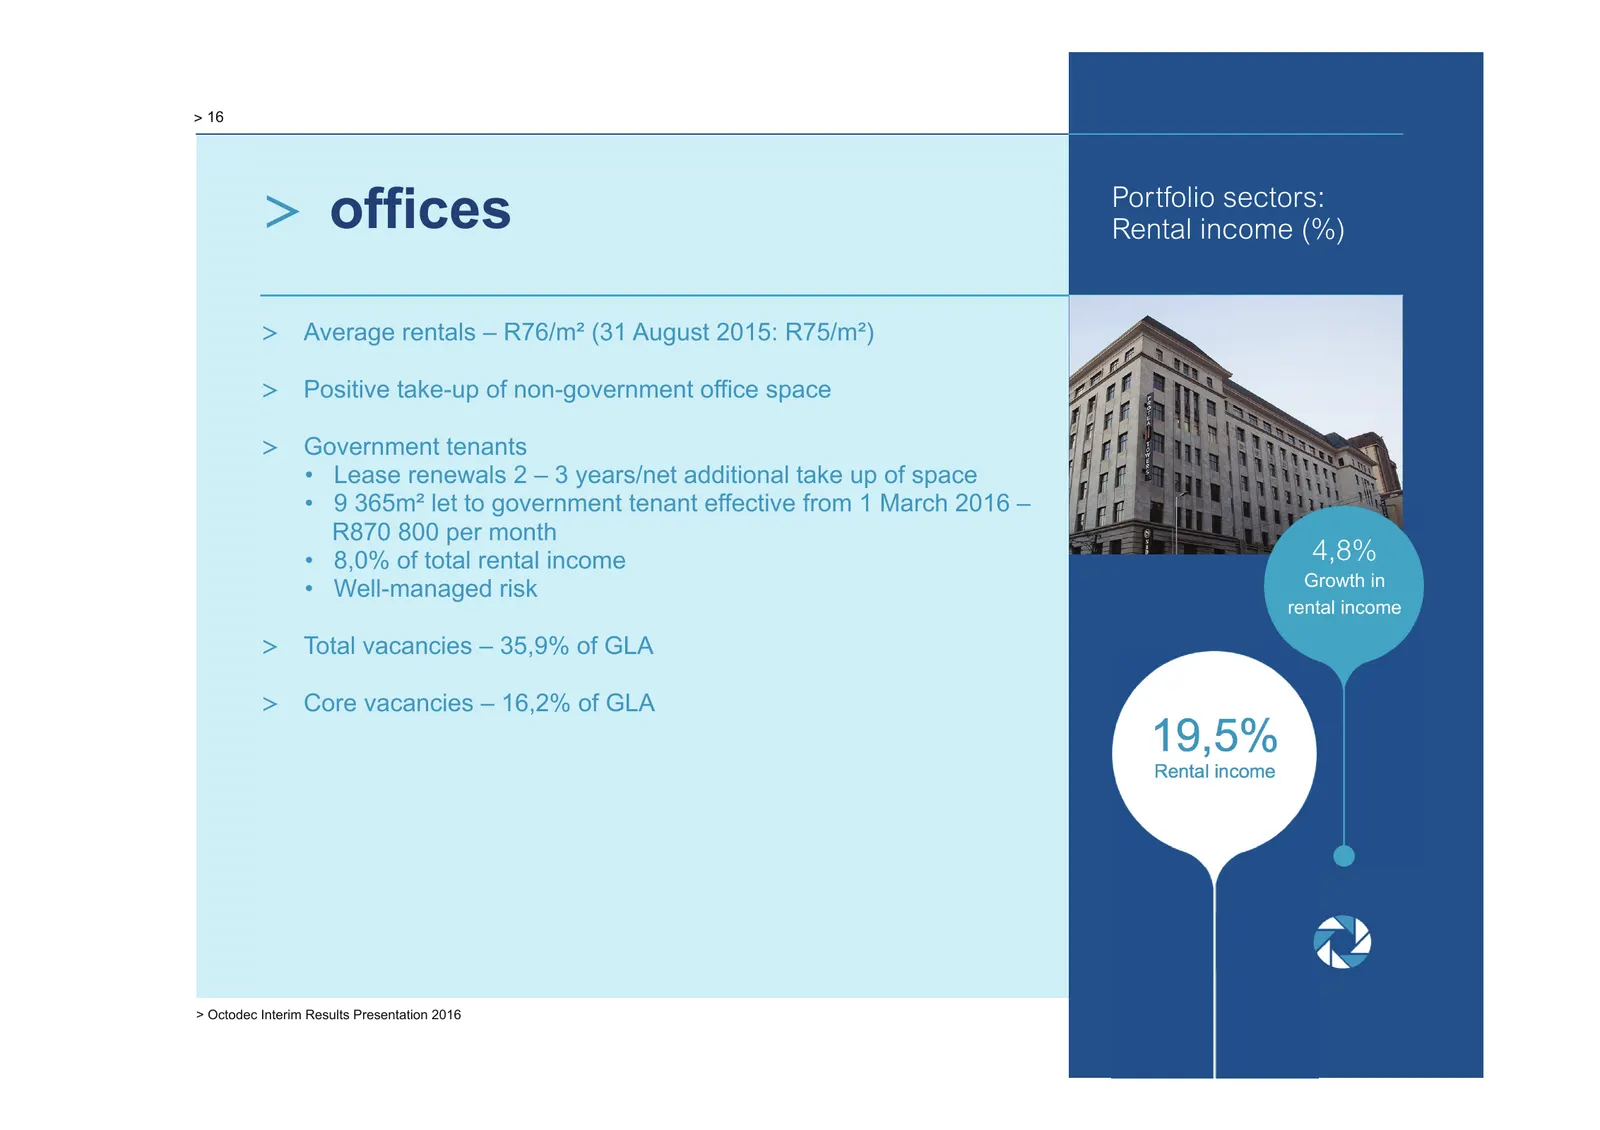
Slide 16: Offices
> 16 > offices Portfolio sectors: Rental income (%) > Average rentals – R76/m² (31 August 2015: R75/m²) > Positive take-up of non-government office space > Government tenants • Lease renewals 2 – 3 years/net additional take up of space • 9 365m² let to government tenant effective from 1 March 2016 –
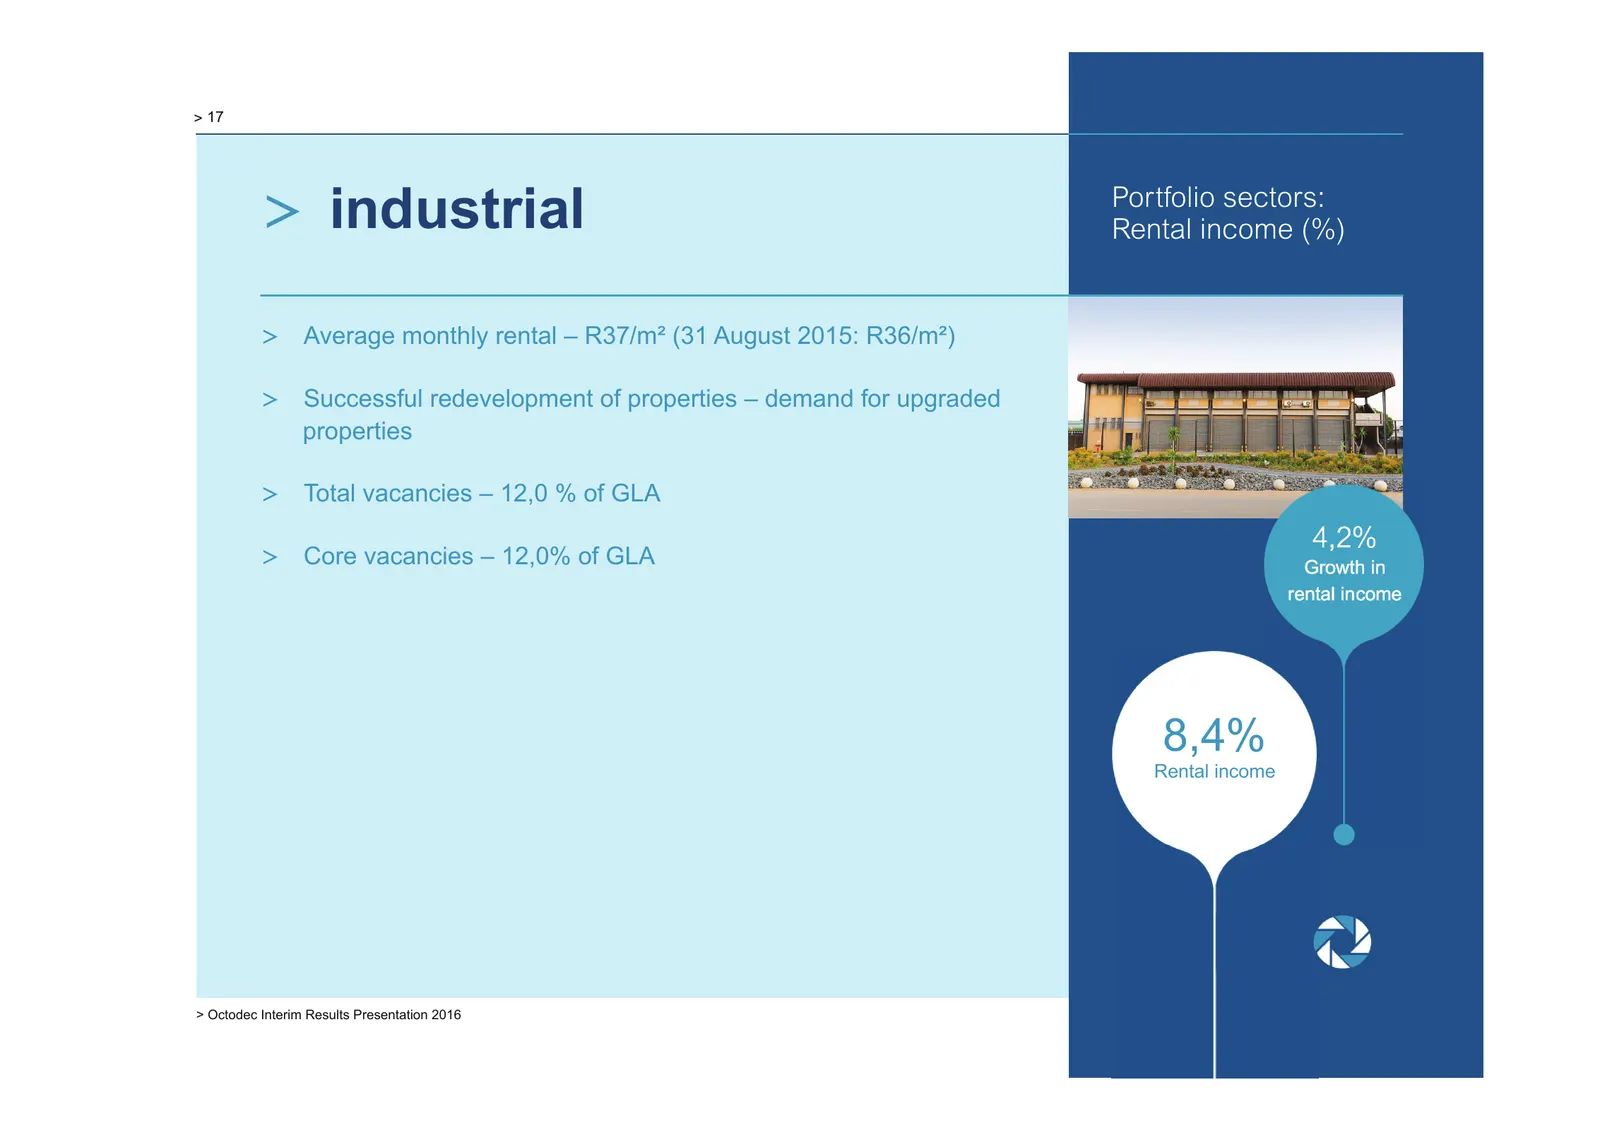
Slide 17: Industrial
> 17 > industrial Portfolio sectors: Rental income (%) > Average monthly rental – R37/m² (31 August 2015: R36/m²) > Successful redevelopment of properties – demand for upgraded properties > Total vacancies – 12,0 % of GLA 4,2% > Core vacancies – 12,0% of GLA Growth in rental income 8,4% Rental incom
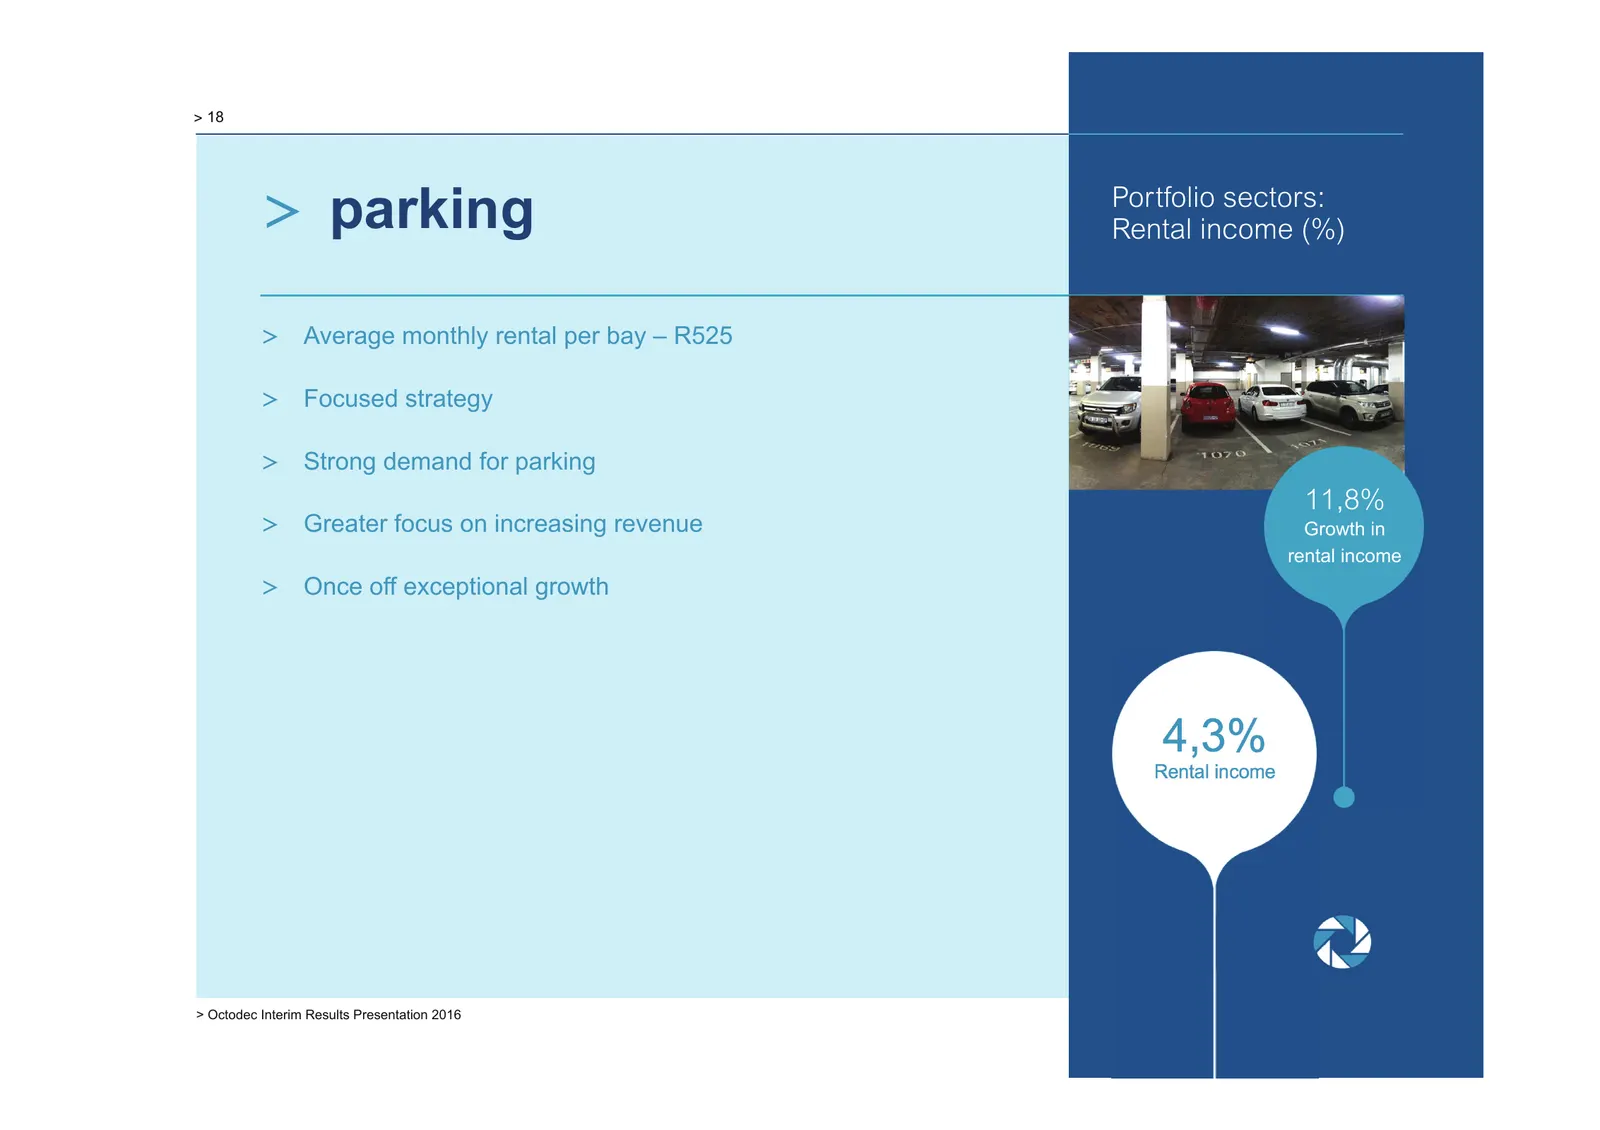
Slide 18: Parking
> 18 > parking Portfolio sectors: Rental income (%) > Average monthly rental per bay – R525 > Focused strategy > Strong demand for parking 11,8% > Greater focus on increasing revenue Growth in rental income > Once off exceptional growth 4,3% Rental income > Octodec Interim Results Presentation 2016
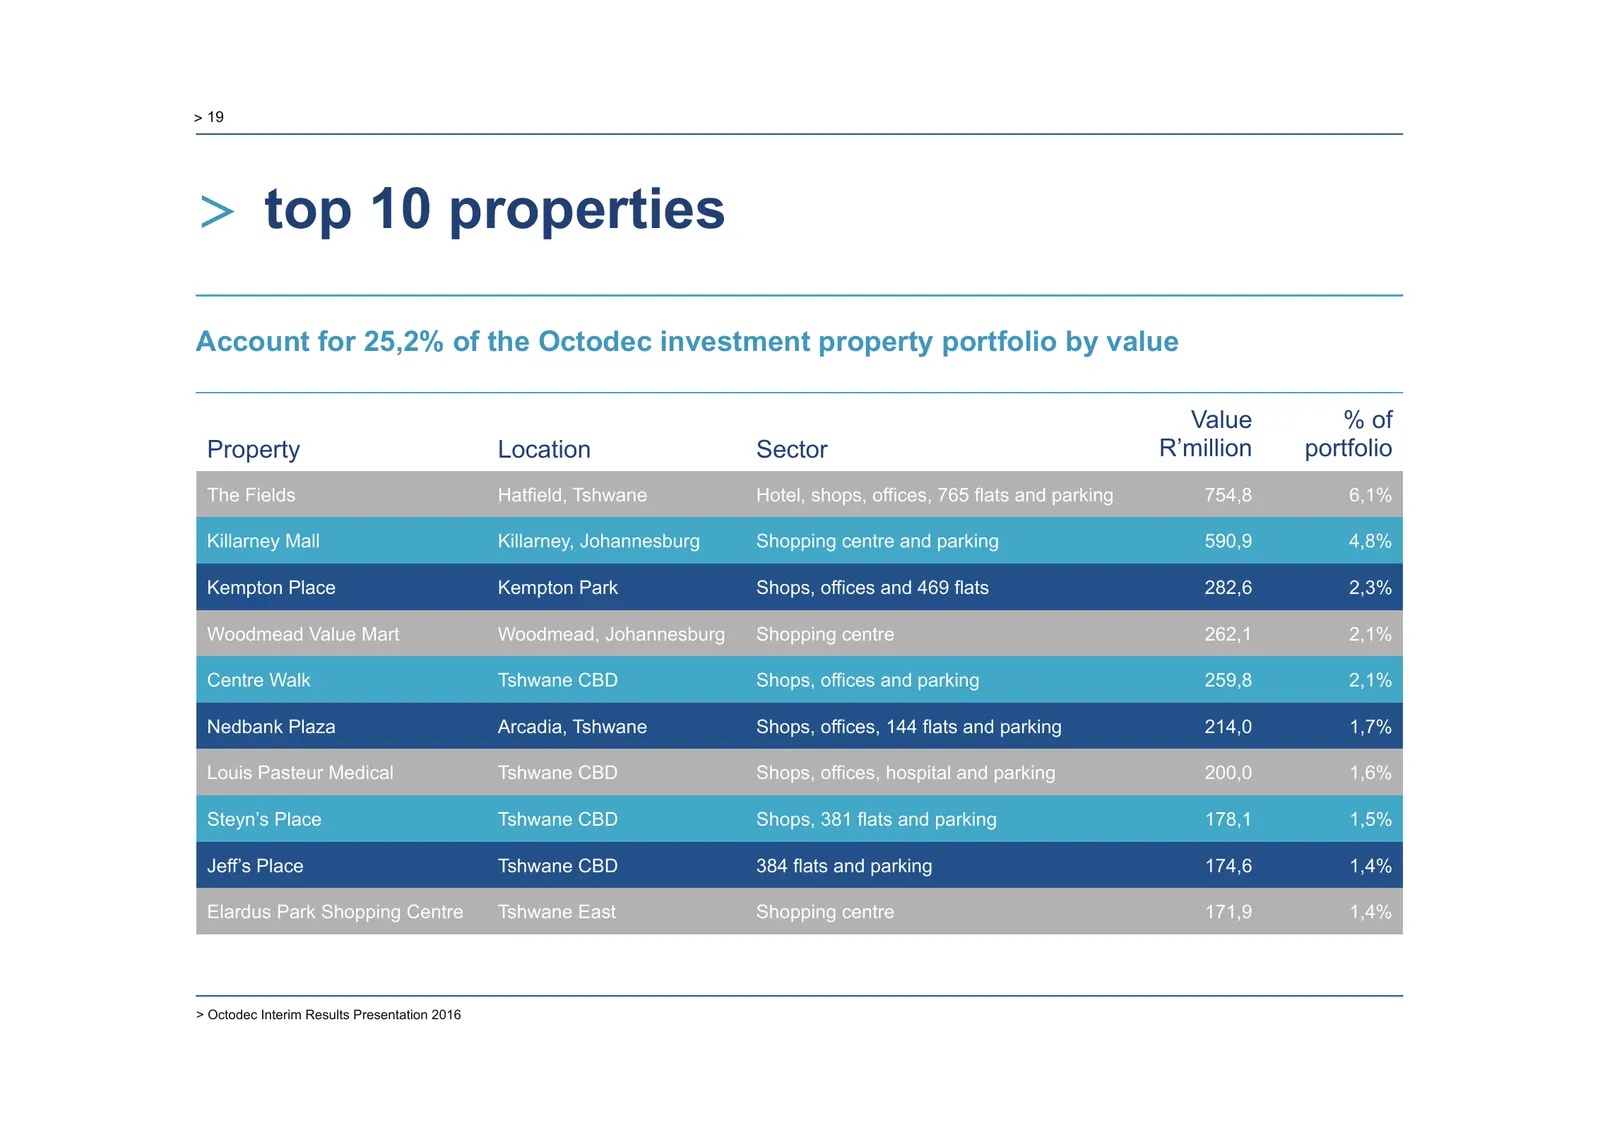
Slide 19: Top 10 properties
> 19 > top 10 properties Account for 25,2% of the Octodec investment property portfolio by value Value % of Property Location Sector R’million portfolio The Fields Hatfield, Tshwane Hotel, shops, offices, 765 flats and parking 754,8 6,1% Killarney Mall Killarney, Johannesburg Shopping centre and par
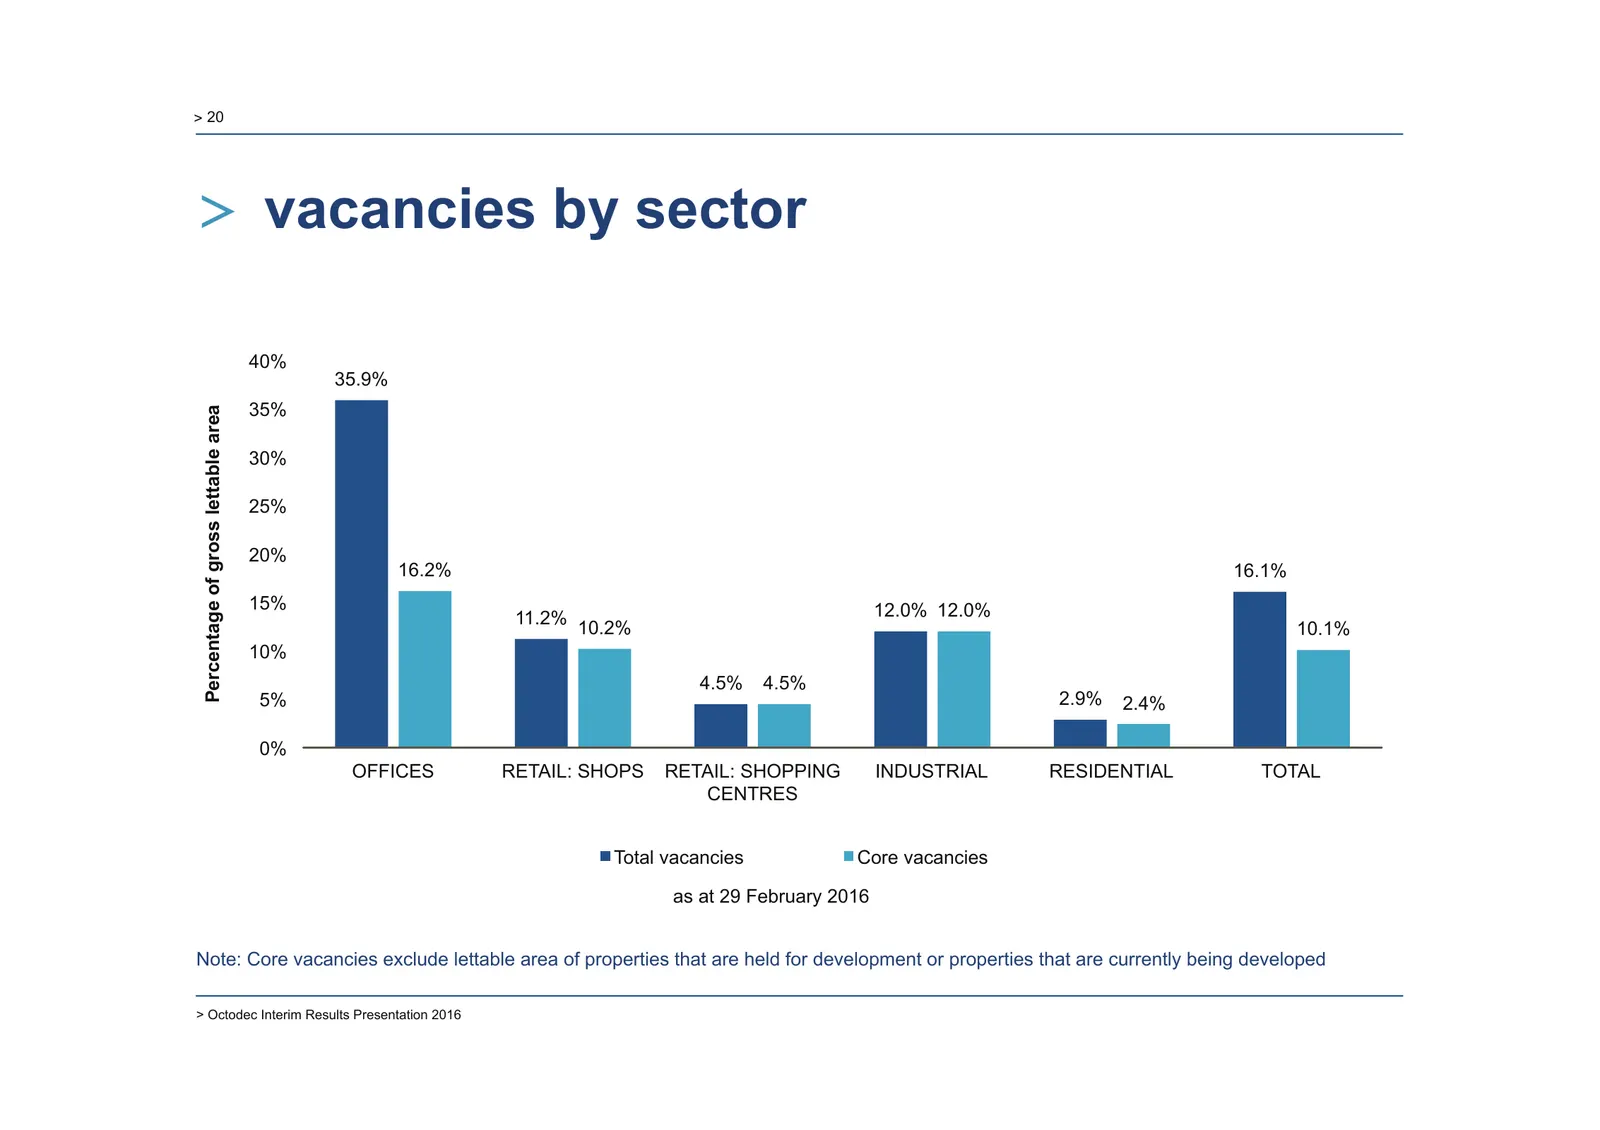
Slide 20: Vacancies by sector
> 20 > vacancies by sector 40% 35.9% 35% Percentage of gross lettable area 30% 25% 20% 16.2% 16.1% 15% 12.0% 12.0% 11.2% 10.2% 10.1% 10% 4.5% 4.5% 5% 2.9% 2.4% 0% OFFICES RETAIL: SHOPS RETAIL: SHOPPING INDUSTRIAL RESIDENTIAL TOTAL CENTRES Total vacancies Core vacancies as at 29 February 2016 Note: C
Slide 21: Vacancies
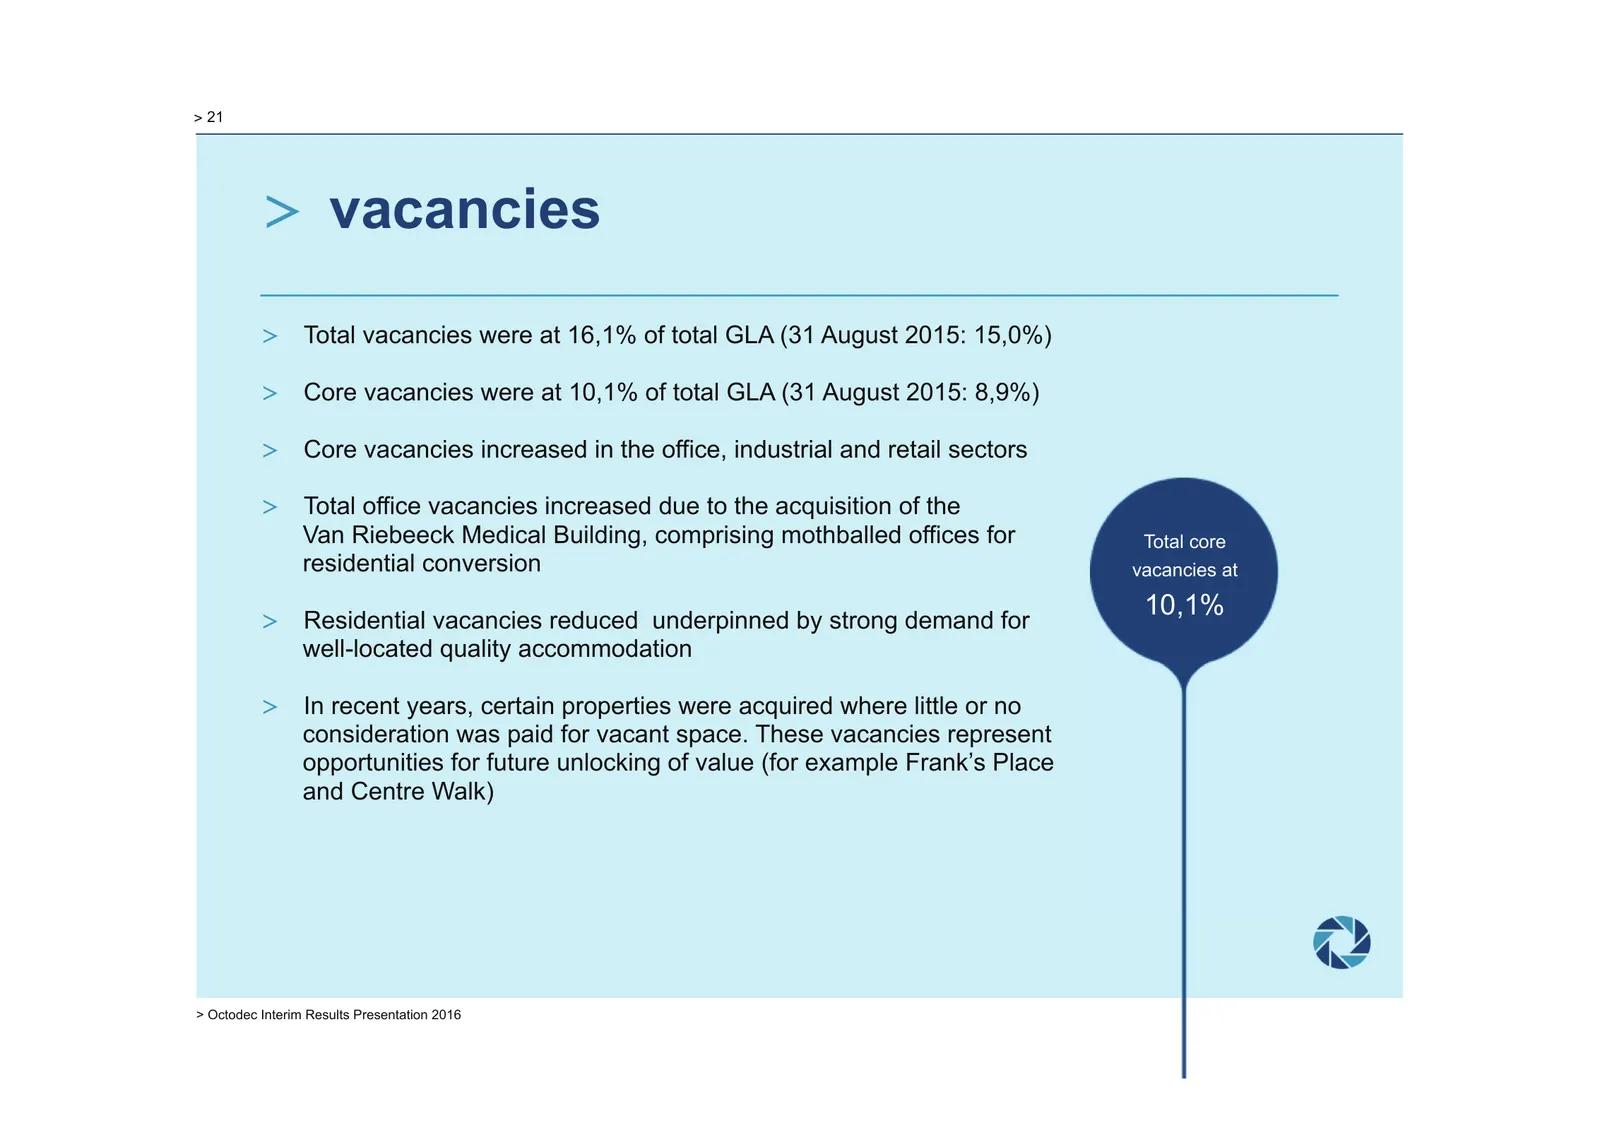
> 21 > vacancies > Total vacancies were at 16,1% of total GLA (31 August 2015: 15,0%) > Core vacancies were at 10,1% of total GLA (31 August 2015: 8,9%) > Core vacancies increased in the office, industrial and retail sectors > Total office vacancies increased due to the acquisition of the Van Riebee
Slide 22: Lease expiry profile
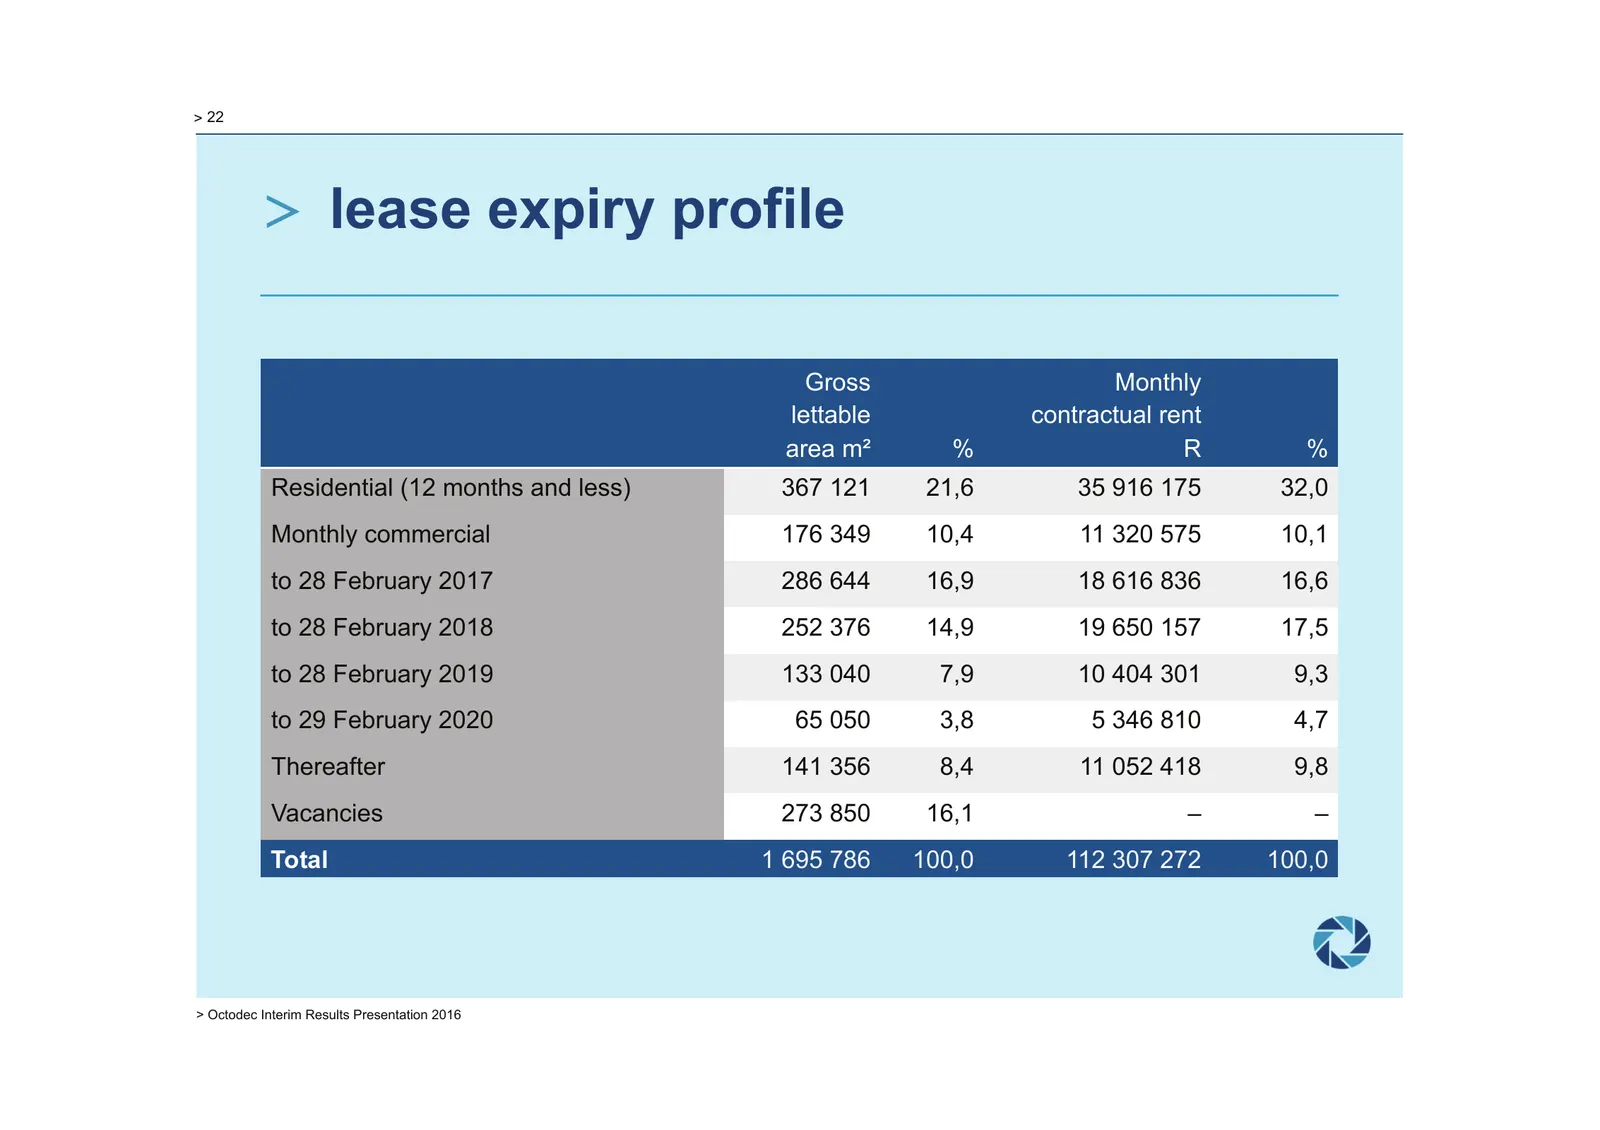
> 22 > lease expiry profile Gross Monthly lettable contractual rent area m² % R % Residential (12 months and less) 367 121 21,6 35 916 175 32,0 Monthly commercial 176 349 10,4 11 320 575 10,1 to 28 February 2017 286 644 16,9 18 616 836 16,6 to 28 February 2018 252 376 14,9 19 650 157 17,5 to 28 Febr
Slide 23: Lease expiry profile
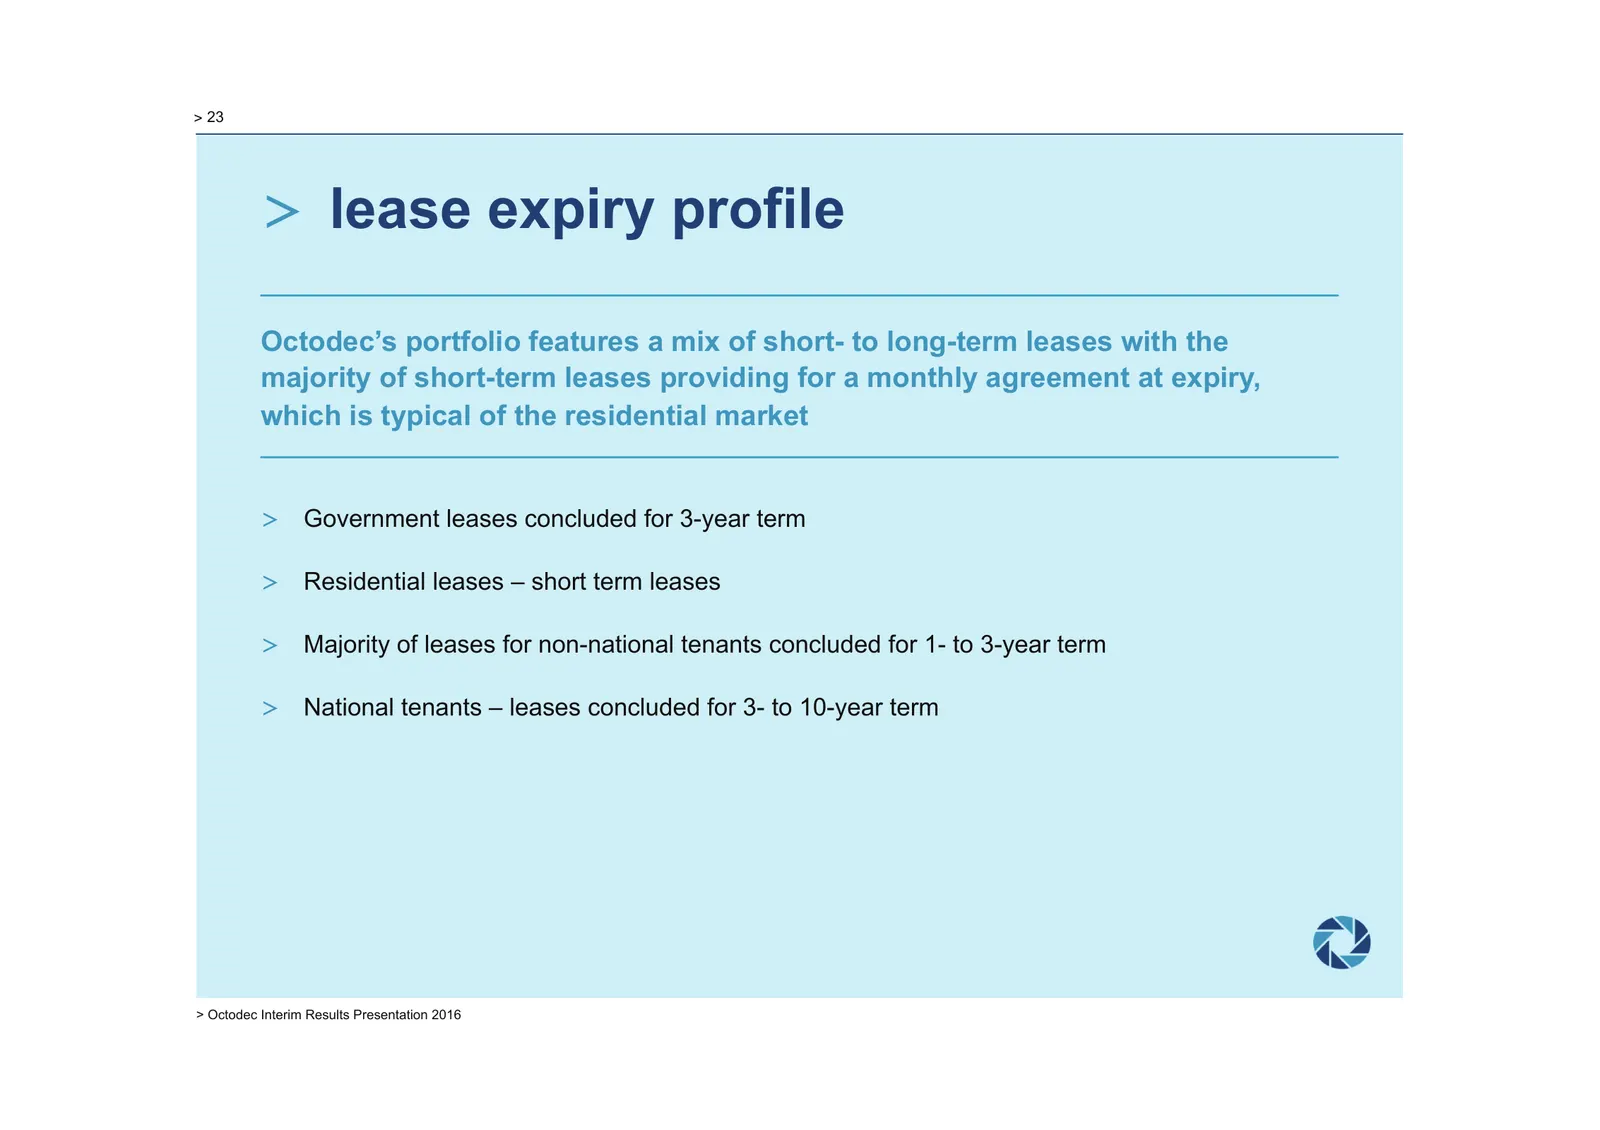
> 23 > lease expiry profile Octodec’s portfolio features a mix of short- to long-term leases with the majority of short-term leases providing for a monthly agreement at expiry, which is typical of the residential market > Government leases concluded for 3-year term > Residential leases – short term
Slide 24: Recent acquisitions
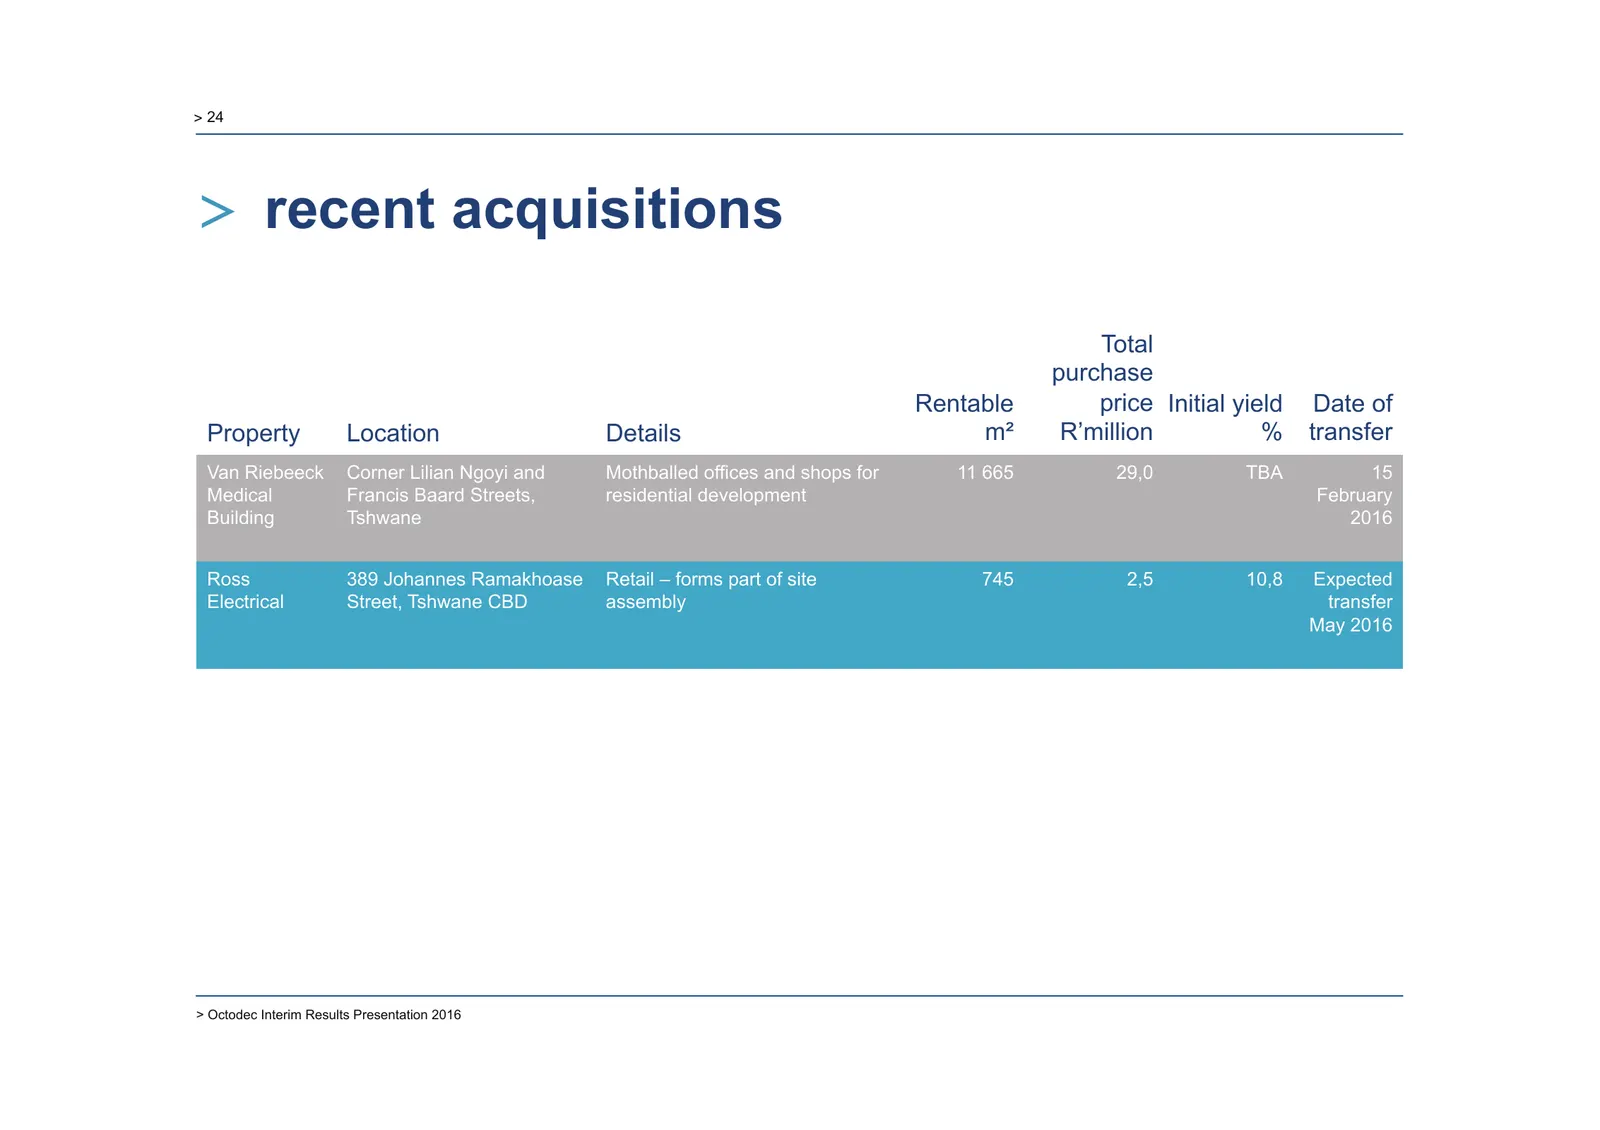
> 24 > recent acquisitions Total purchase Rentable price Initial yield Date of Property Location Details m² R’million % transfer Van Riebeeck Corner Lilian Ngoyi and Mothballed offices and shops for 11 665 29,0 TBA 15 Medical Francis Baard Streets, residential development February Building Tshwane 2
Slide 25: Recent sales
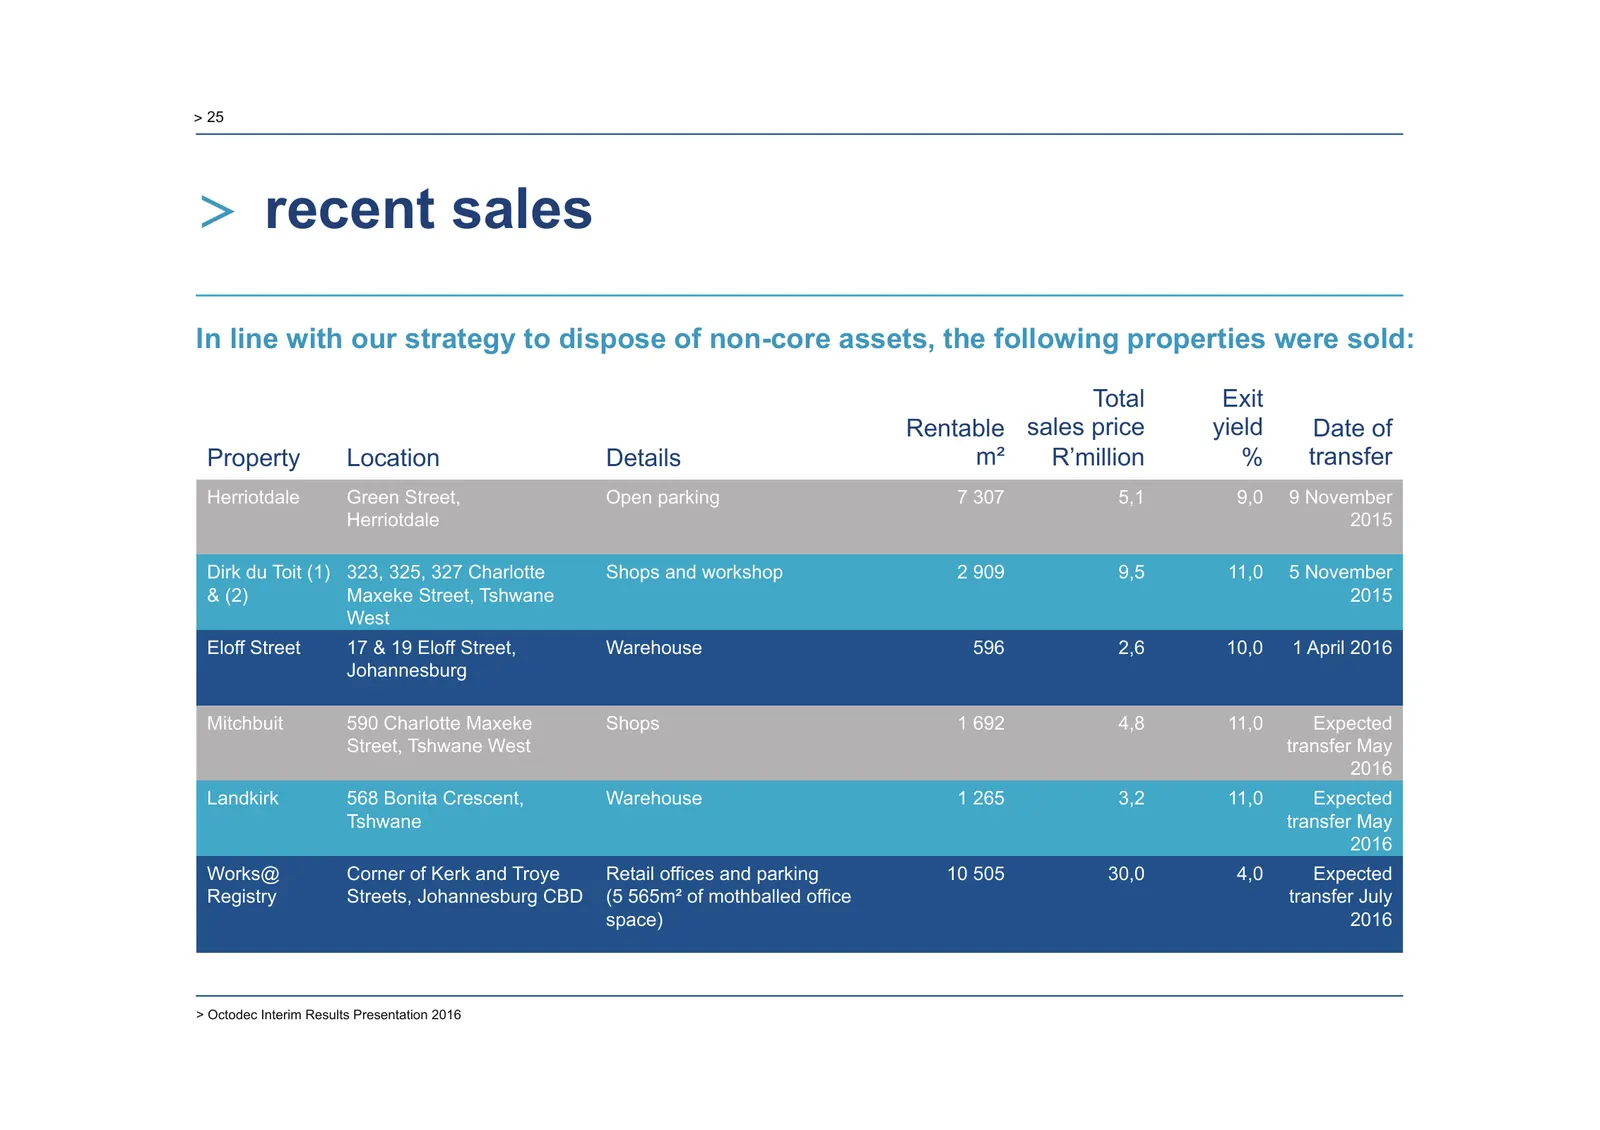
> 25 > recent sales In line with our strategy to dispose of non-core assets, the following properties were sold: Total Exit Rentable sales price yield Date of Property Location Details m² R’million % transfer Herriotdale Green Street, Open parking 7 307 5,1 9,0 9 November Herriotdale 2015 Dirk du To
Slide 26: Developments during the period
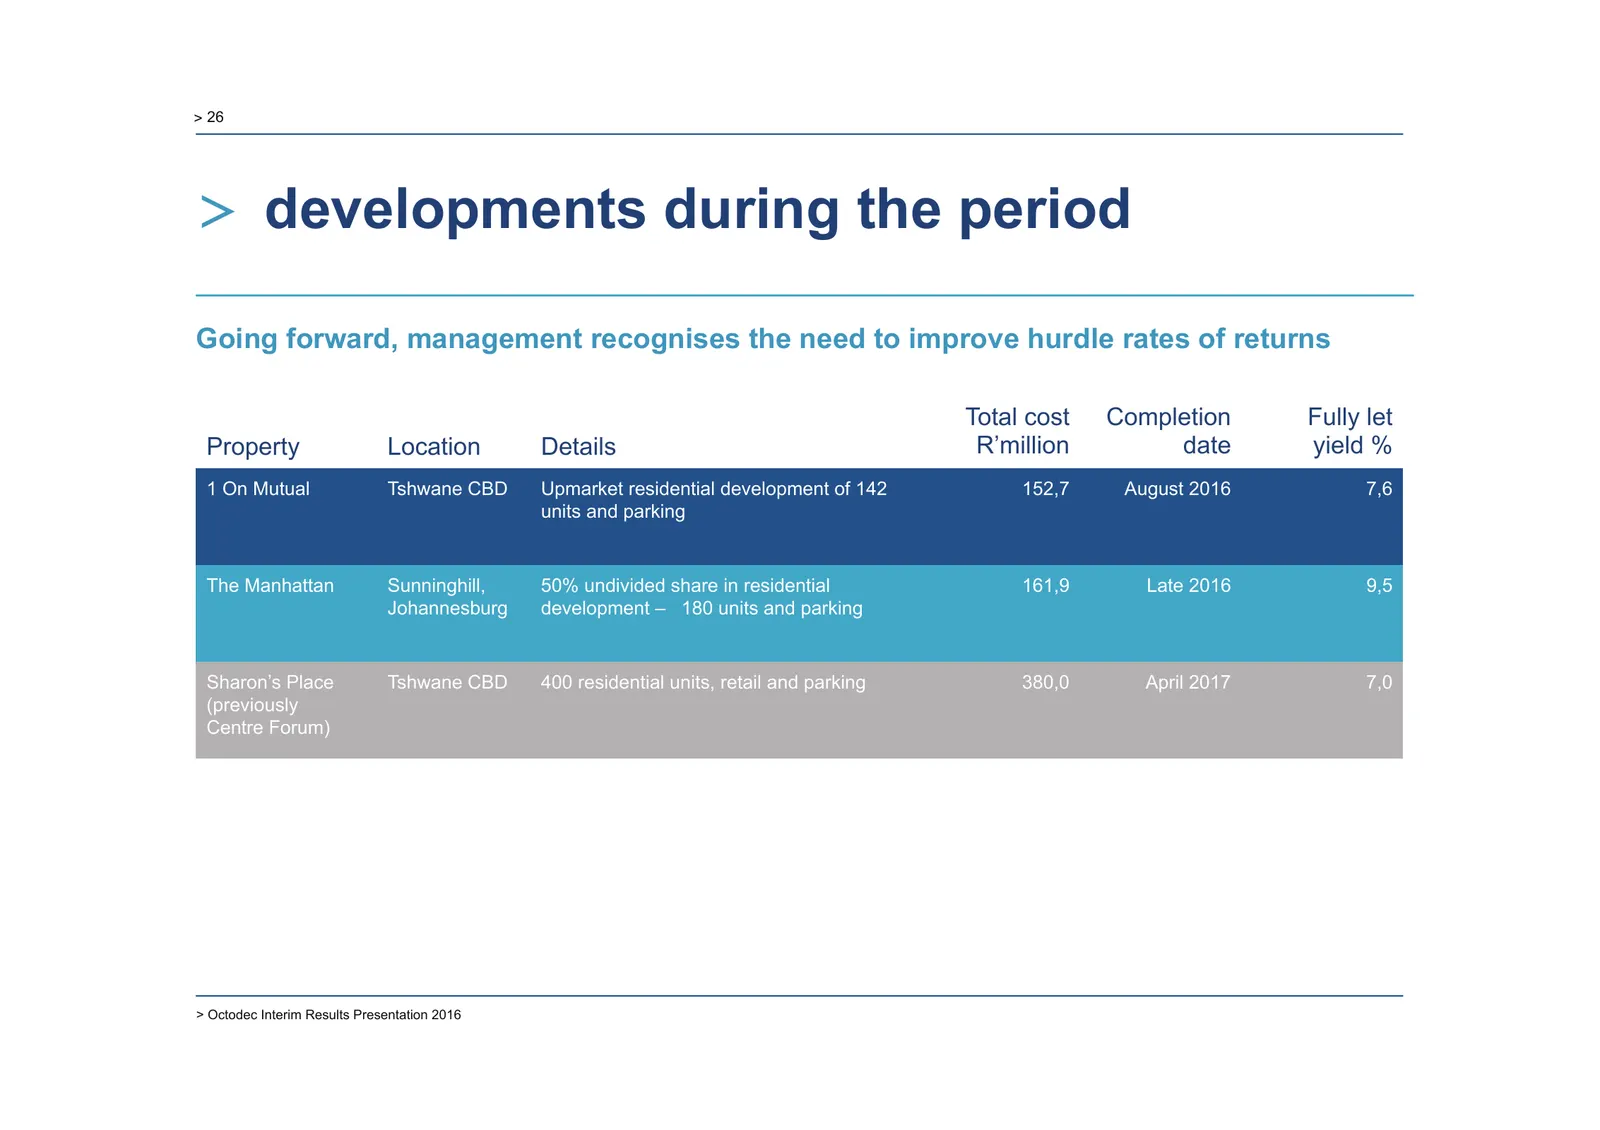
> 26 > developments during the period Going forward, management recognises the need to improve hurdle rates of returns Total cost Completion Fully let Property Location Details R’million date yield % 1 On Mutual Tshwane CBD Upmarket residential development of 142 152,7 August 2016 7,6 units and park
Slide 27: 1 on Mutual
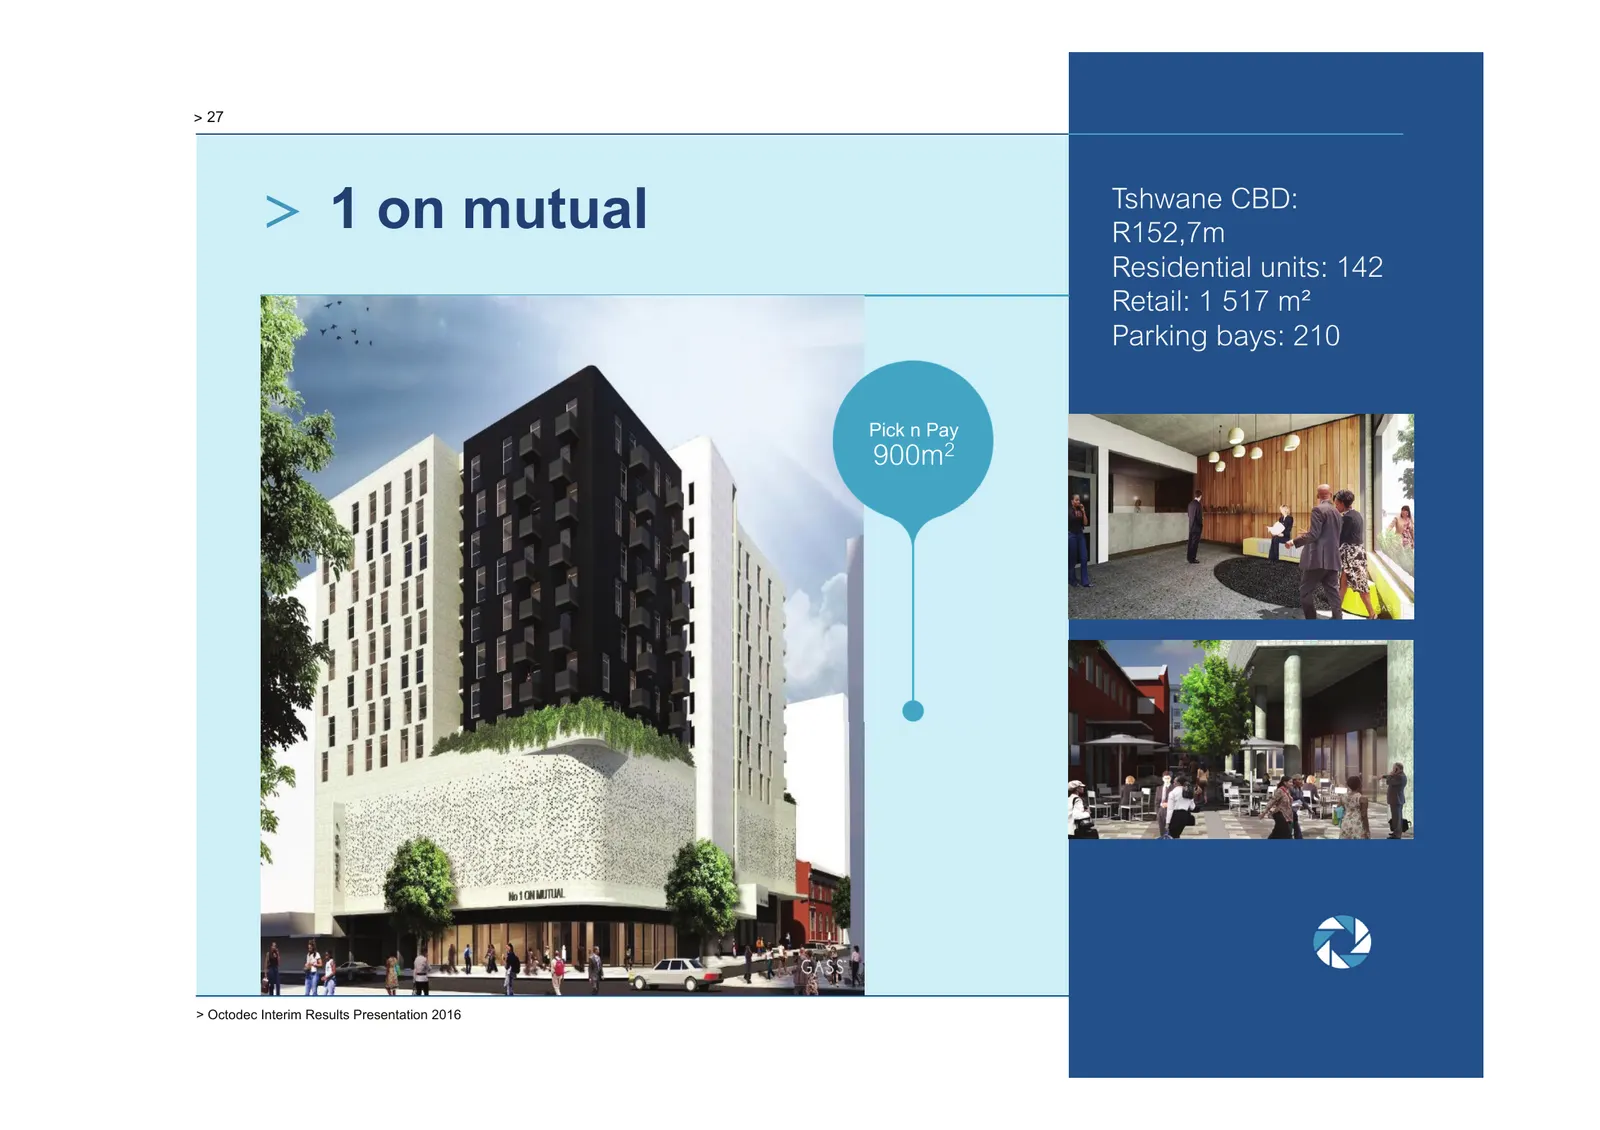
> 27 > 1 on mutual Tshwane CBD: R152,7m Residential units: 142 Retail: 1 517 m² Parking bays: 210 Pick n Pay 900m2 > Octodec Interim Results Presentation 2016
Slide 28: Sharon's Place (Centre Forum)
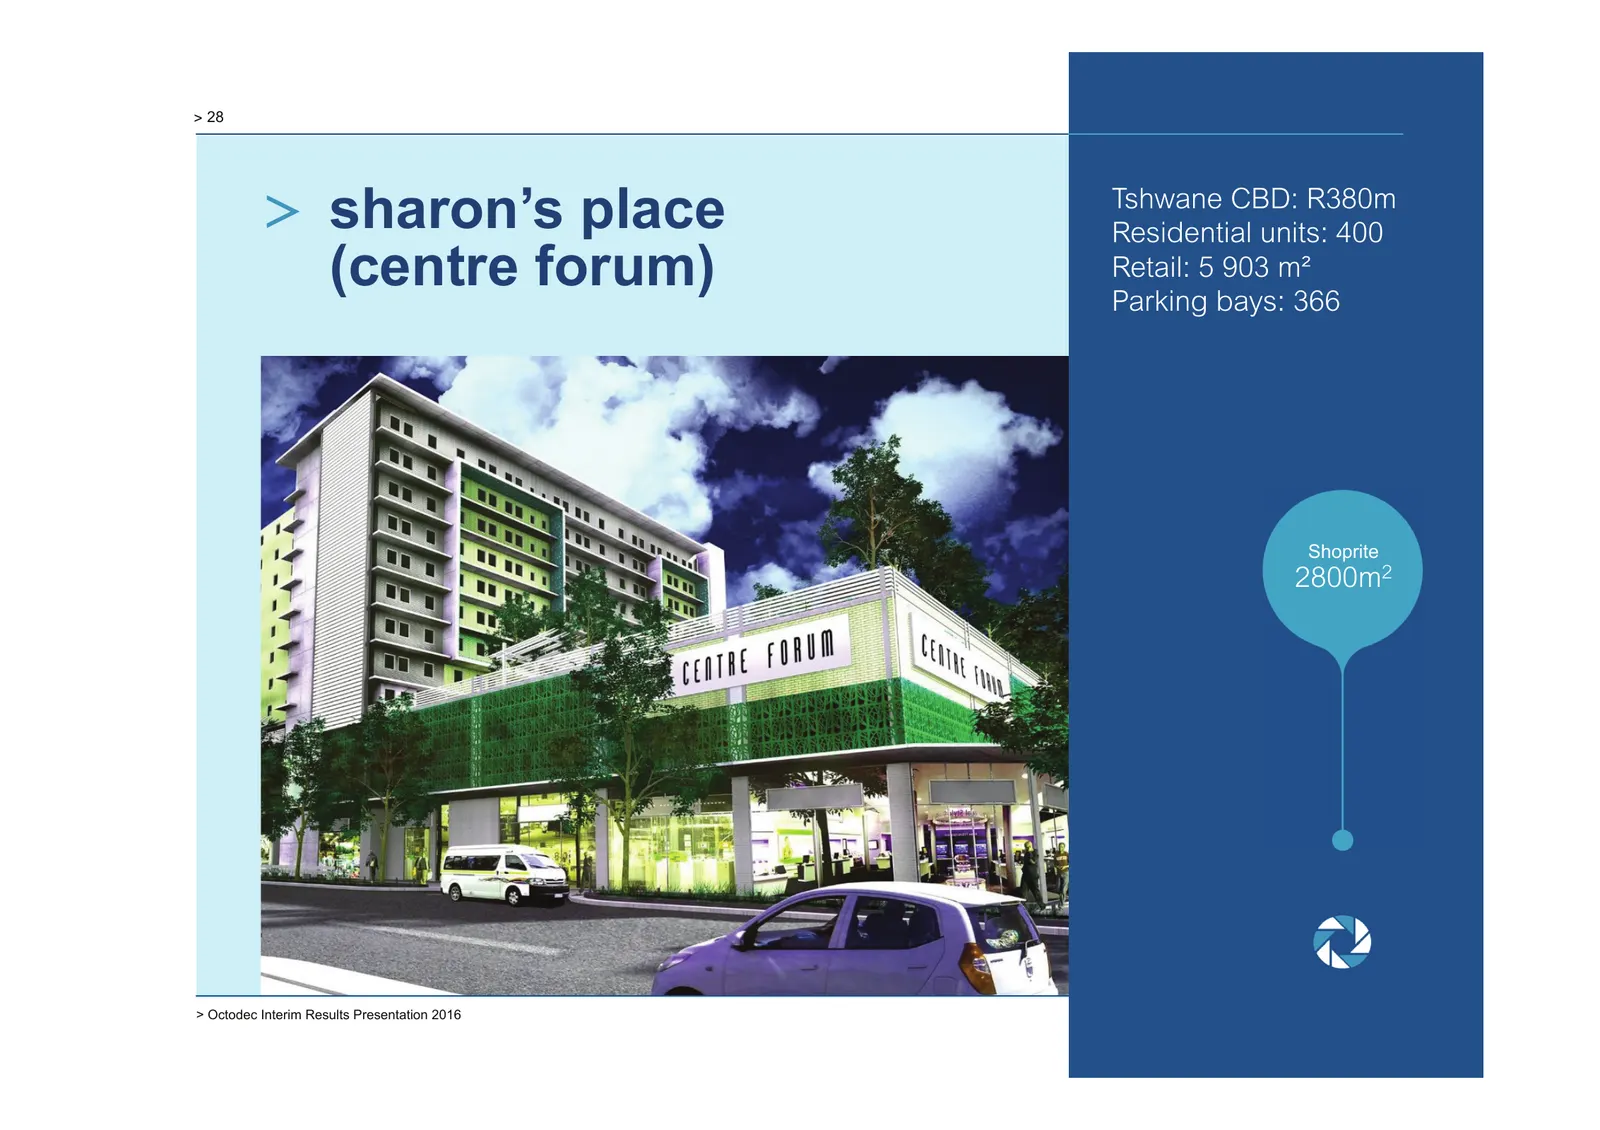
> 28 > sharon’s place Tshwane CBD: R380m Residential units: 400 (centre forum) Retail: 5 903 m² Parking bays: 366 Shoprite 2800m2 > Octodec Interim Results Presentation 2016
Slide 29: Our results
> 29 > our results 03
Slide 30: Measuring our performance: Achievements
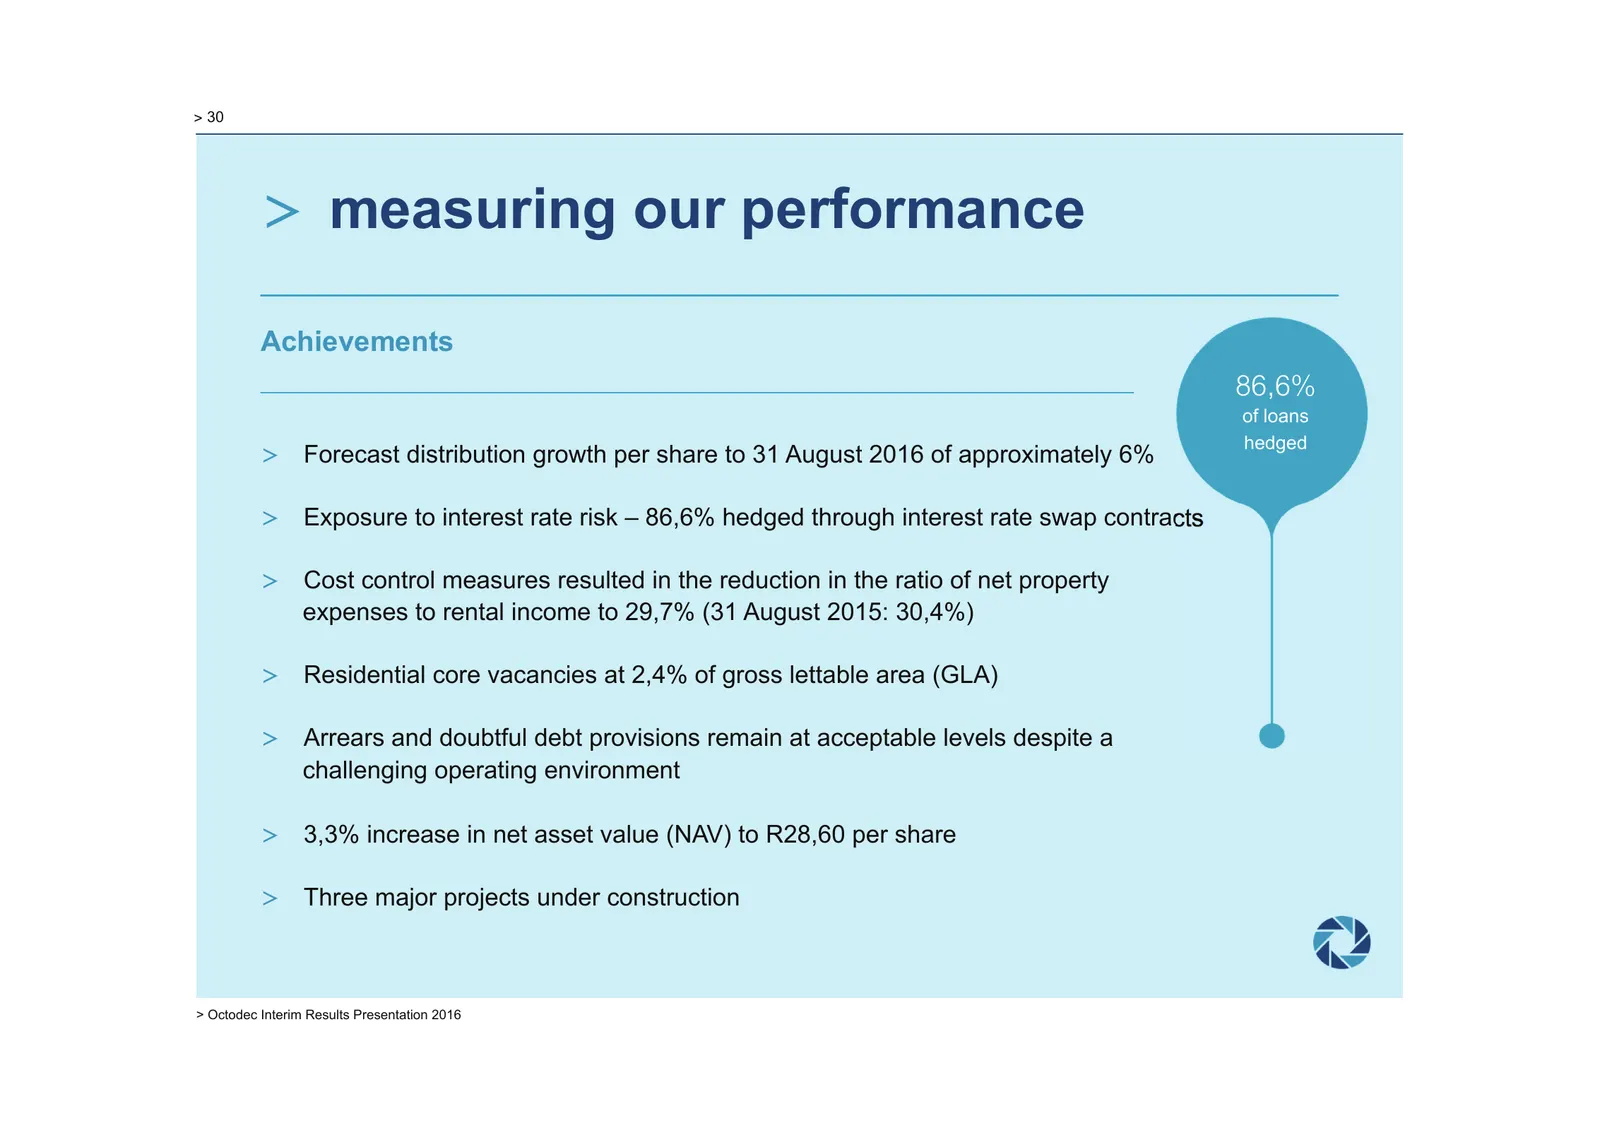
> 30 > measuring our performance Achievements 86,6% of loans hedged > Forecast distribution growth per share to 31 August 2016 of approximately 6% > Exposure to interest rate risk – 86,6% hedged through interest rate swap contracts > Cost control measures resulted in the reduction in the ratio of ne
Slide 31: Measuring our performance: Challenges
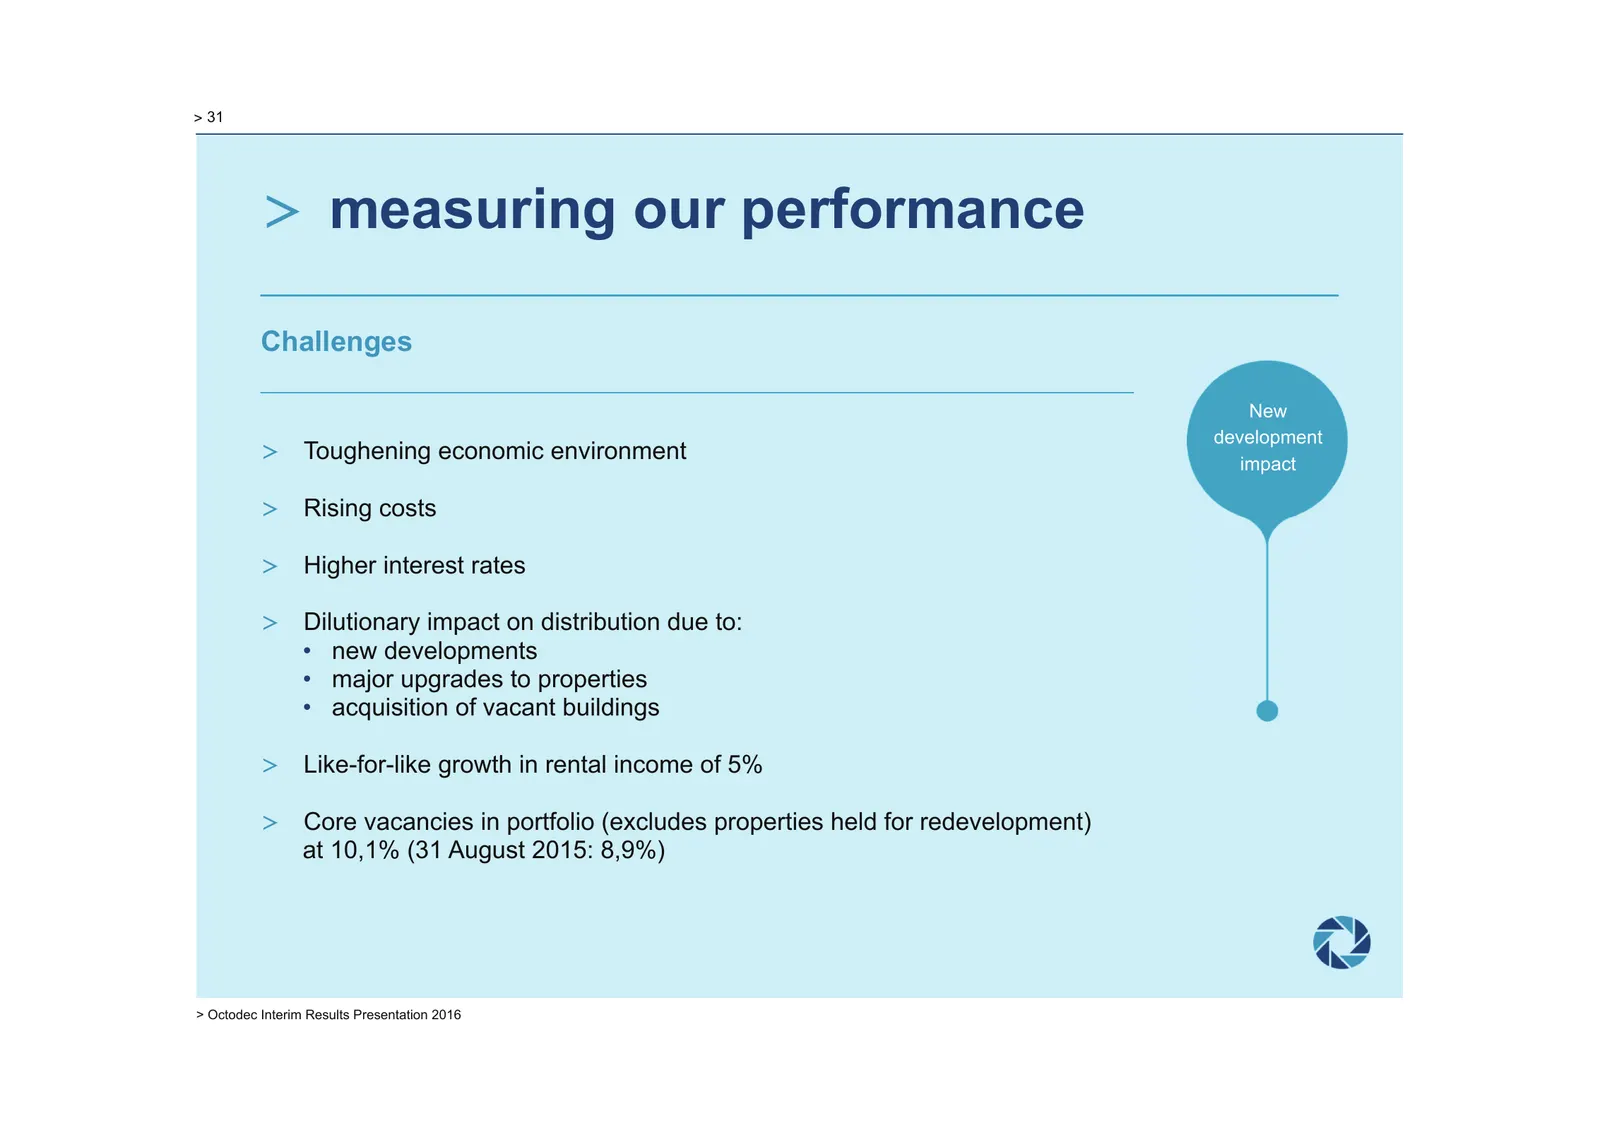
> 31 > measuring our performance Challenges New development > Toughening economic environment impact > Rising costs > Higher interest rates > Dilutionary impact on distribution due to: • new developments • major upgrades to properties • acquisition of vacant buildings > Like-for-like growth in renta
Slide 32: Growth in distribution
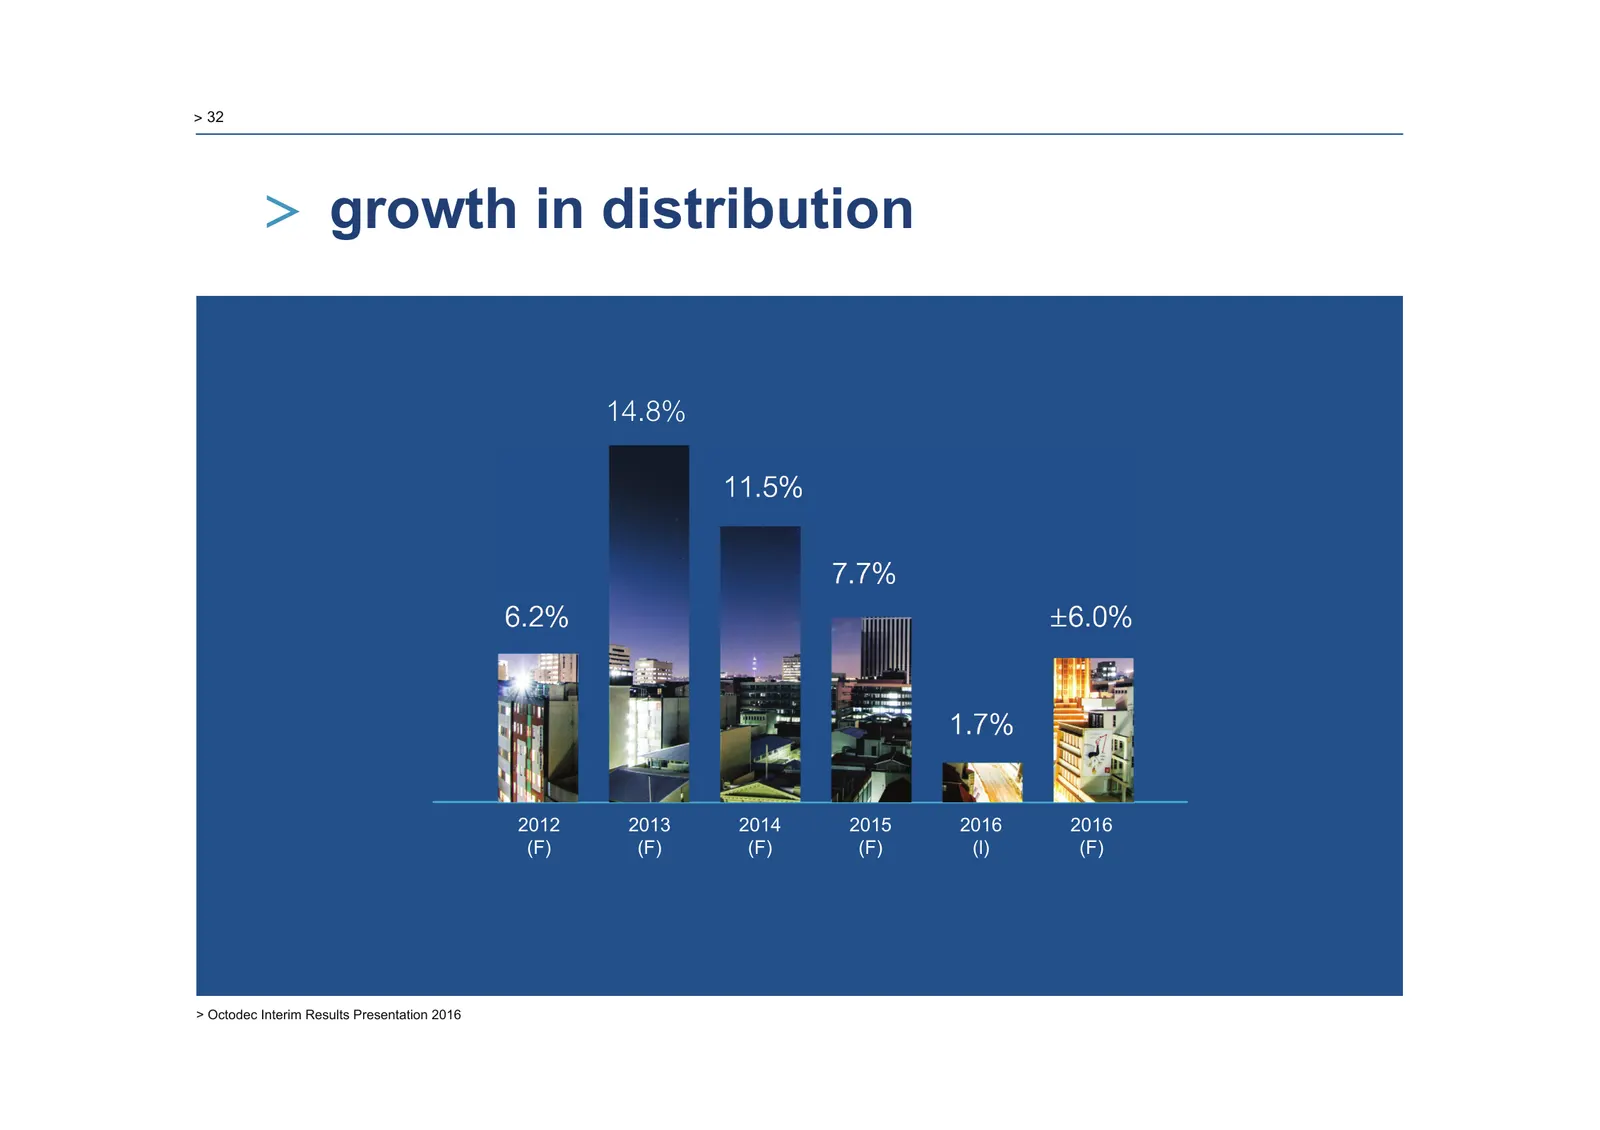
> 32 > growth in distribution 14.8% 11.5% 7.7% 6.2% ±6.0% 1.7% 2012 2013 2014 2015 2016 2016 (F) (F) (F) (F) (l) (F) > Octodec Interim Results Presentation 2016
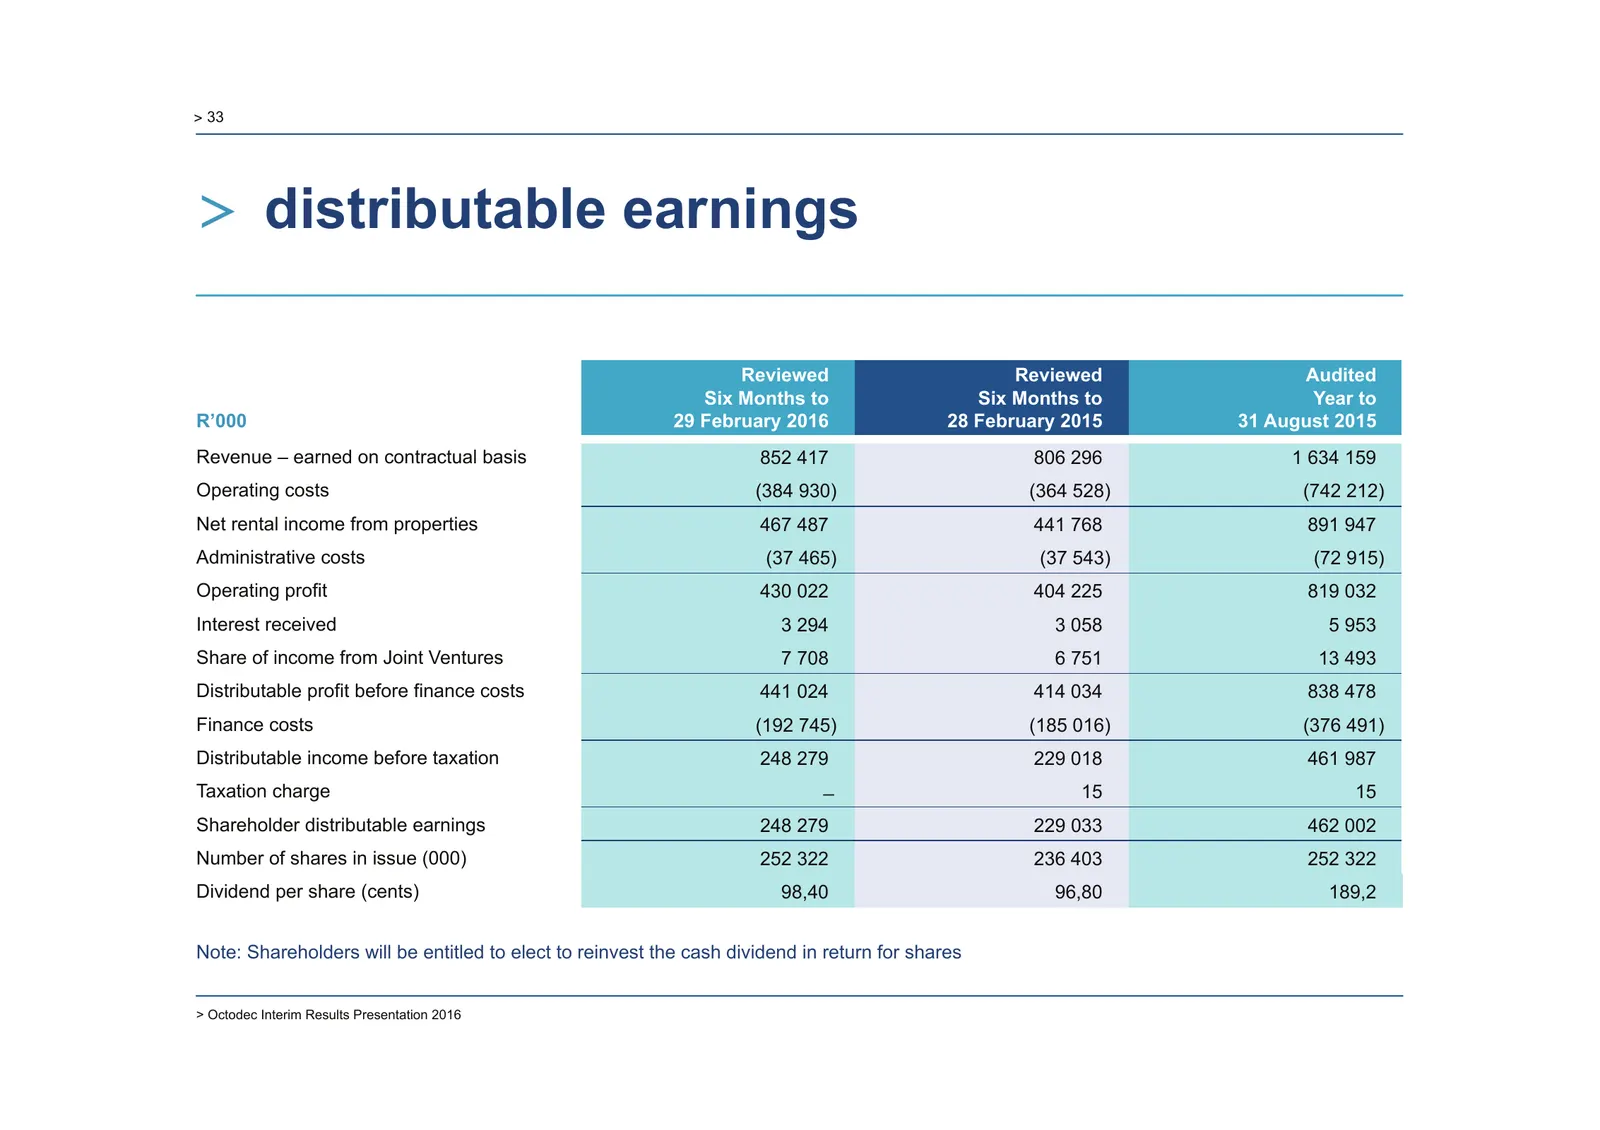
Slide 33: Distributable earnings
> 33 > distributable earnings Reviewed Reviewed Audited Six Months to Six Months to Year to R’000 29 February 2016 28 February 2015 31 August 2015 Revenue – earned on contractual basis 852 417 806 296 1 634 159 Operating costs (384 930) (364 528) (742 212) Net rental income from properties 467 487 4
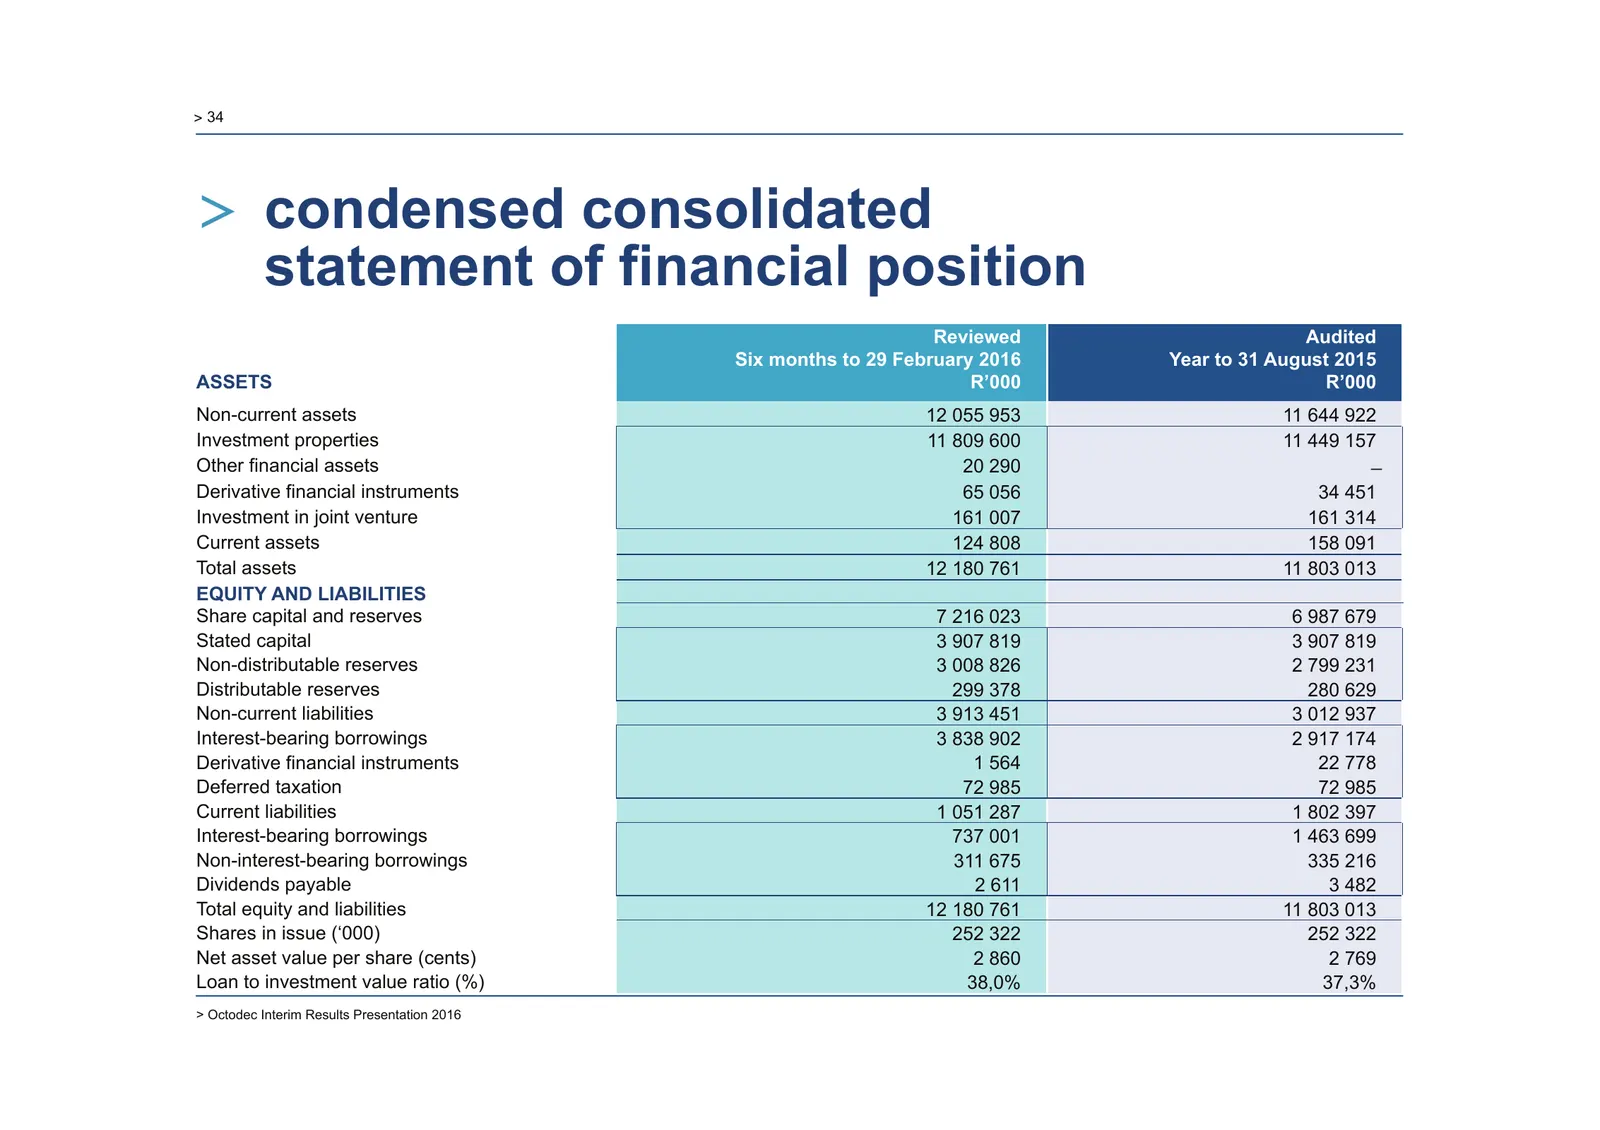
Slide 34: Condensed consolidated statement of financial position
> 34 > condensed consolidated statement of financial position Reviewed Audited Six months to 29 February 2016 Year to 31 August 2015 ASSETS R’000 R’000 Non-current assets 12 055 953 11 644 922 Investment properties 11 809 600 11 449 157 Other financial assets 20 290 ̶ Derivative financial instrument
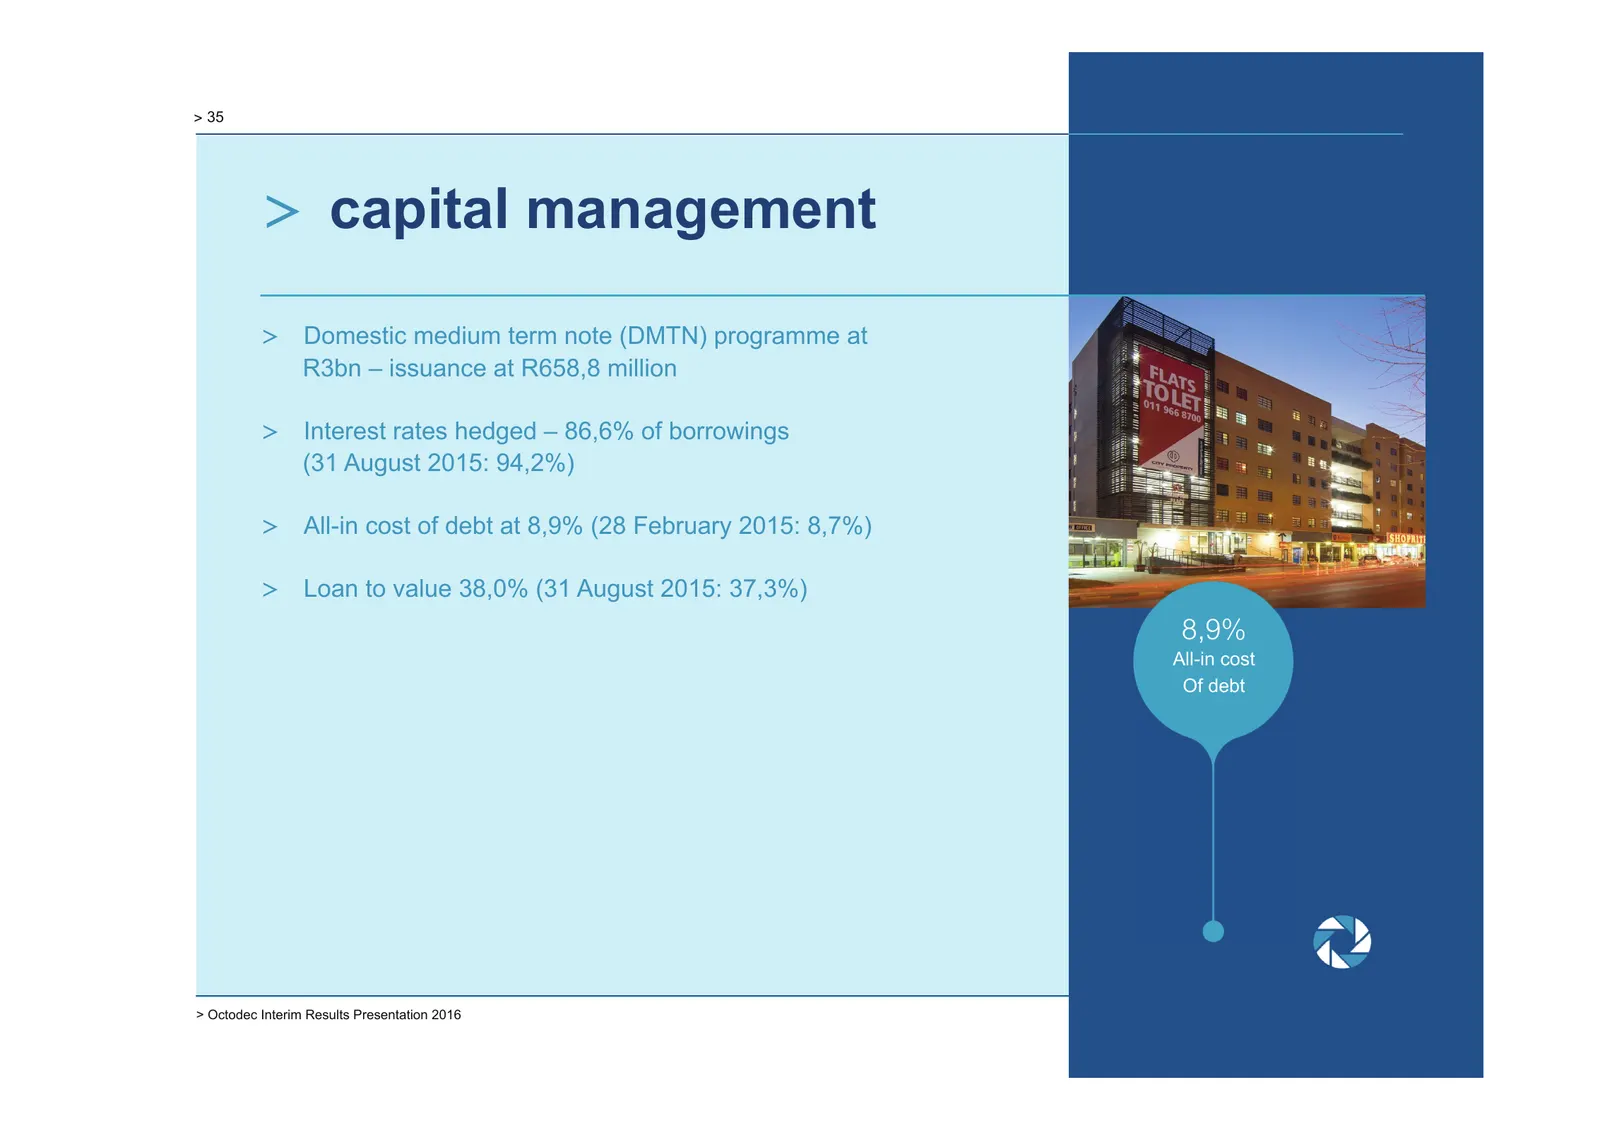
Slide 35: Capital management
> 35 > capital management > Domestic medium term note (DMTN) programme at R3bn – issuance at R658,8 million > Interest rates hedged – 86,6% of borrowings (31 August 2015: 94,2%) > All-in cost of debt at 8,9% (28 February 2015: 8,7%) > Loan to value 38,0% (31 August 2015: 37,3%) 8,9% All-in cost Of d
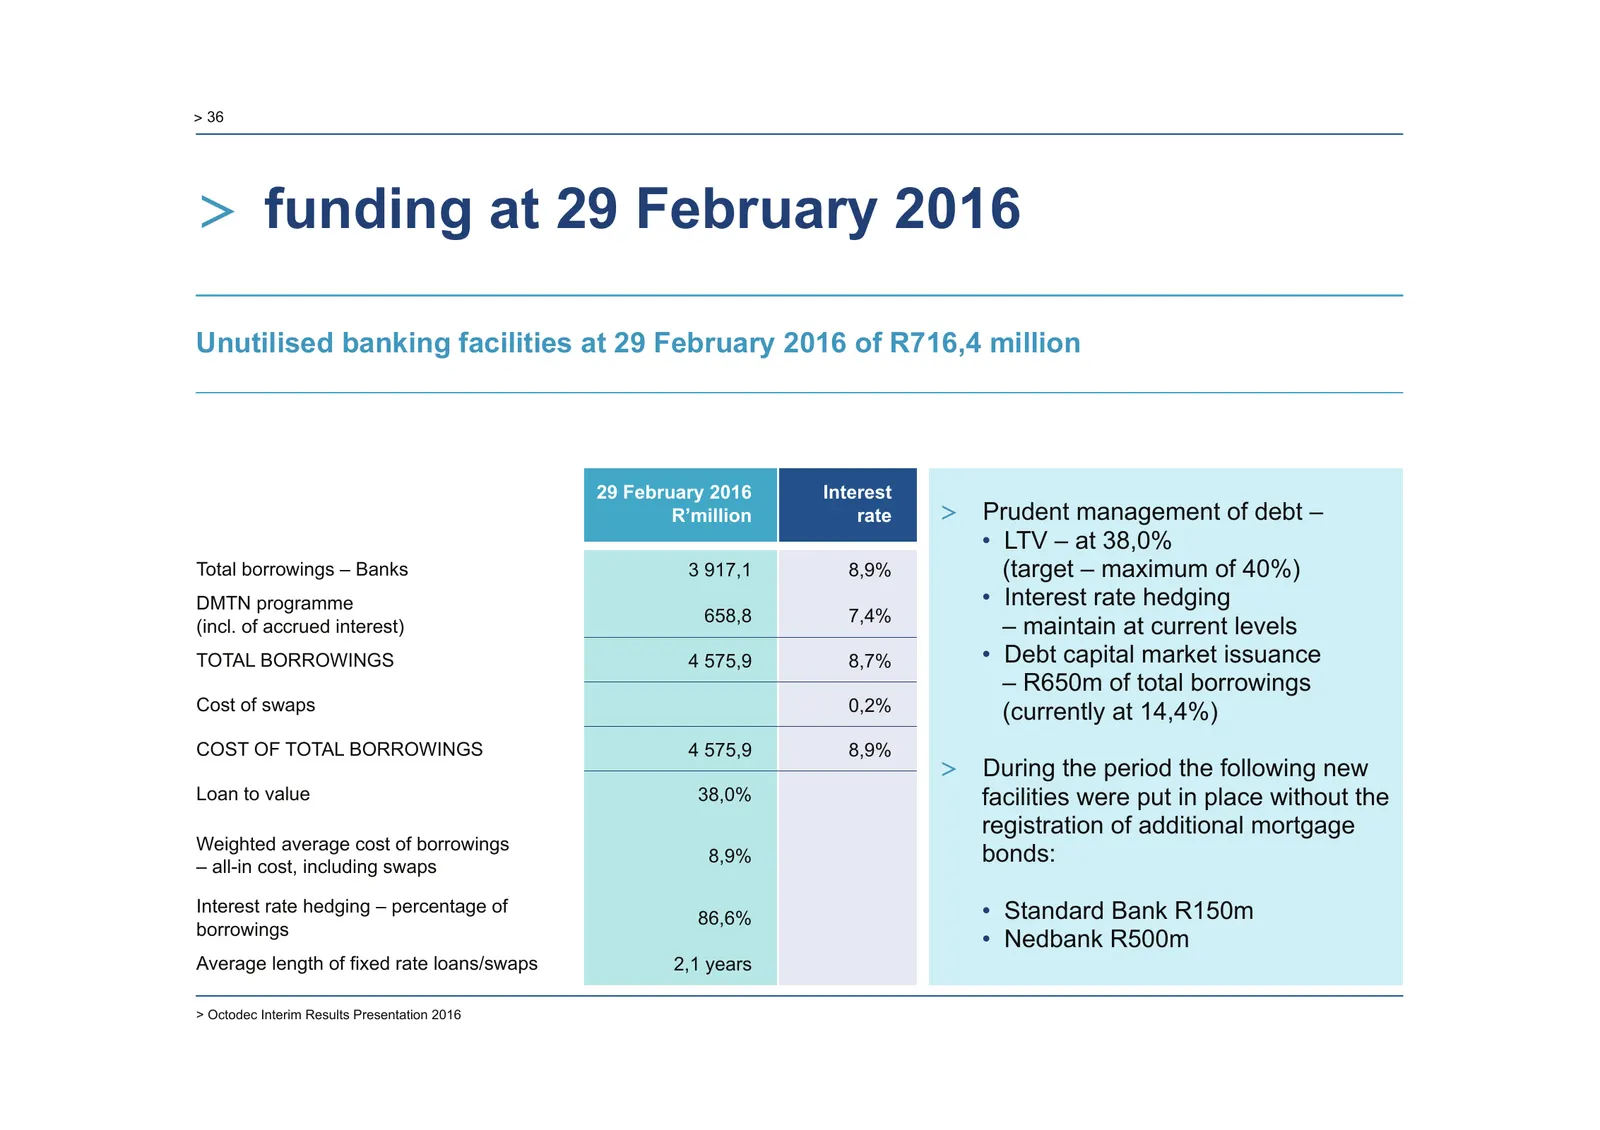
Slide 36: Funding at 29 February 2016
> 36 > funding at 29 February 2016 Unutilised banking facilities at 29 February 2016 of R716,4 million 29 February 2016 Interest R’million rate > Prudent management of debt – • LTV – at 38,0% Total borrowings – Banks 3 917,1 8,9% (target – maximum of 40%) DMTN programme • Interest rate hedging 658,8
Slide 37: Debt maturity profile
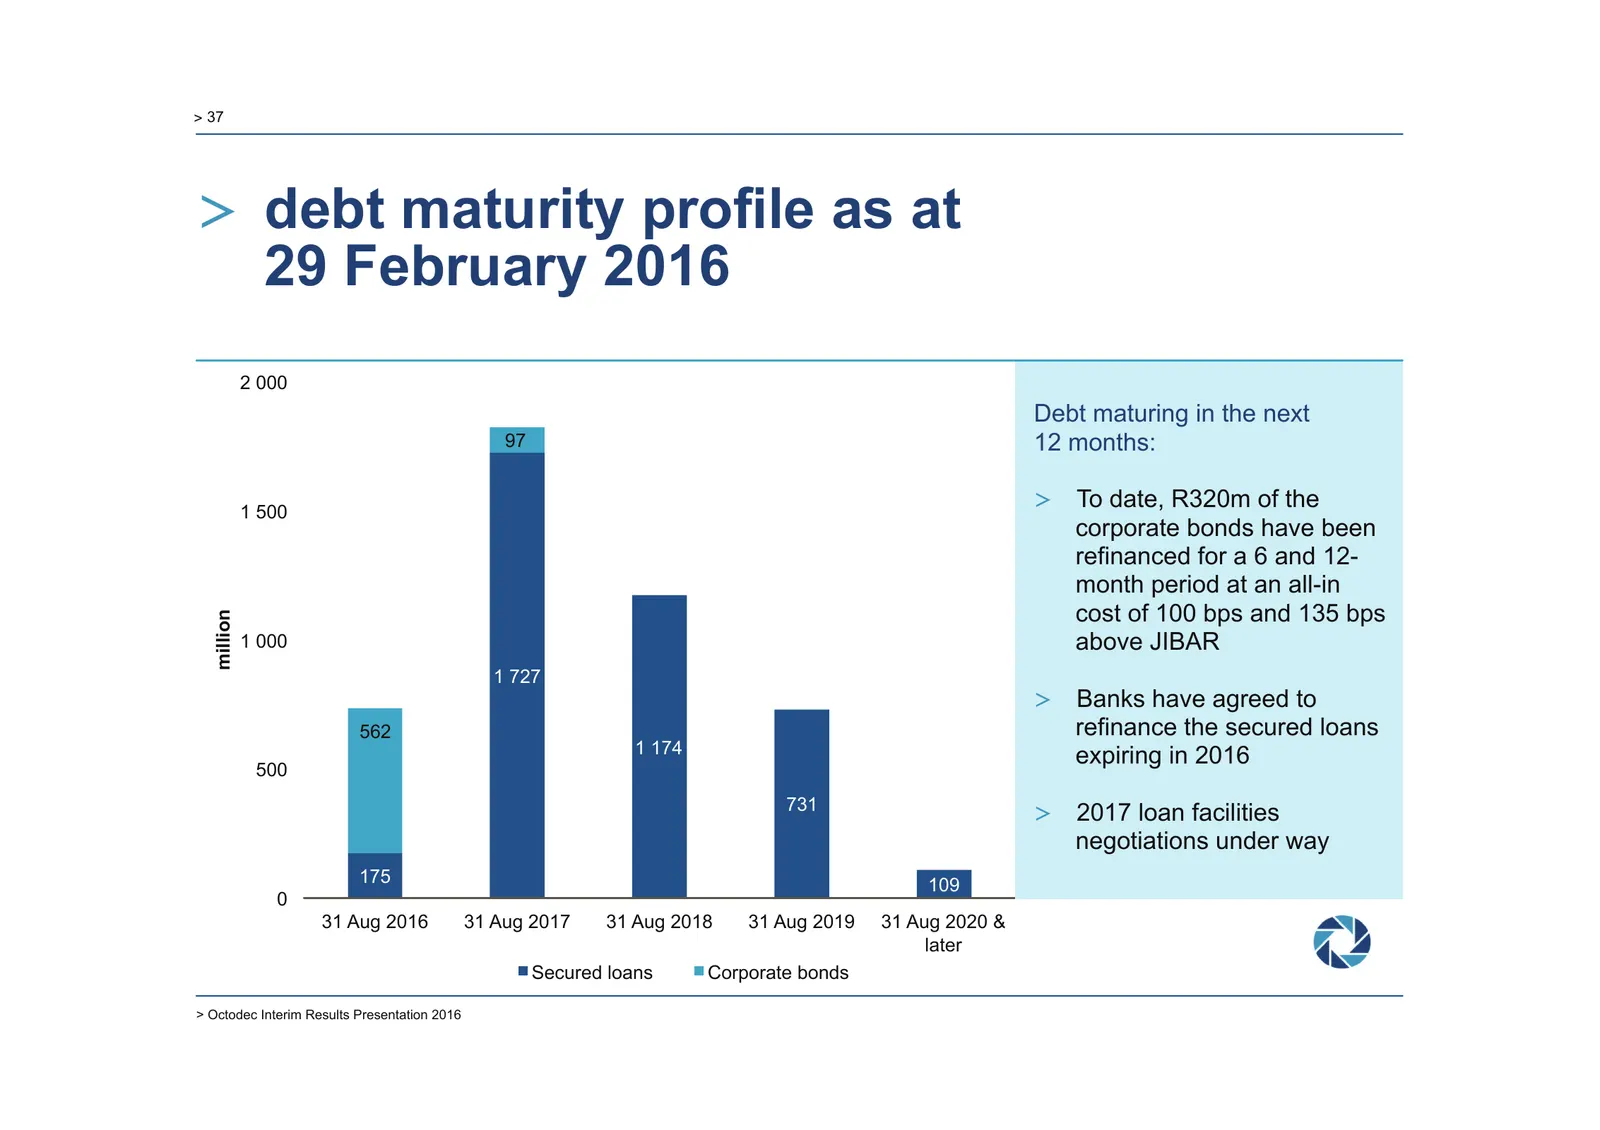
> 37 > debt maturity profile as at 29 February 2016 2 000 Debt maturing in the next 97 12 months: 1 500 > To date, R320m of the corporate bonds have been refinanced for a 6 and 12- month period at an all-in cost of 100 bps and 135 bps million 1 000 above JIBAR 1 727 > Banks have agreed to 562 refina

Slide 38: Outlook
> 38 > outlook 04 > Octodec Interim Results Presentation 2016
Slide 39: Outlook
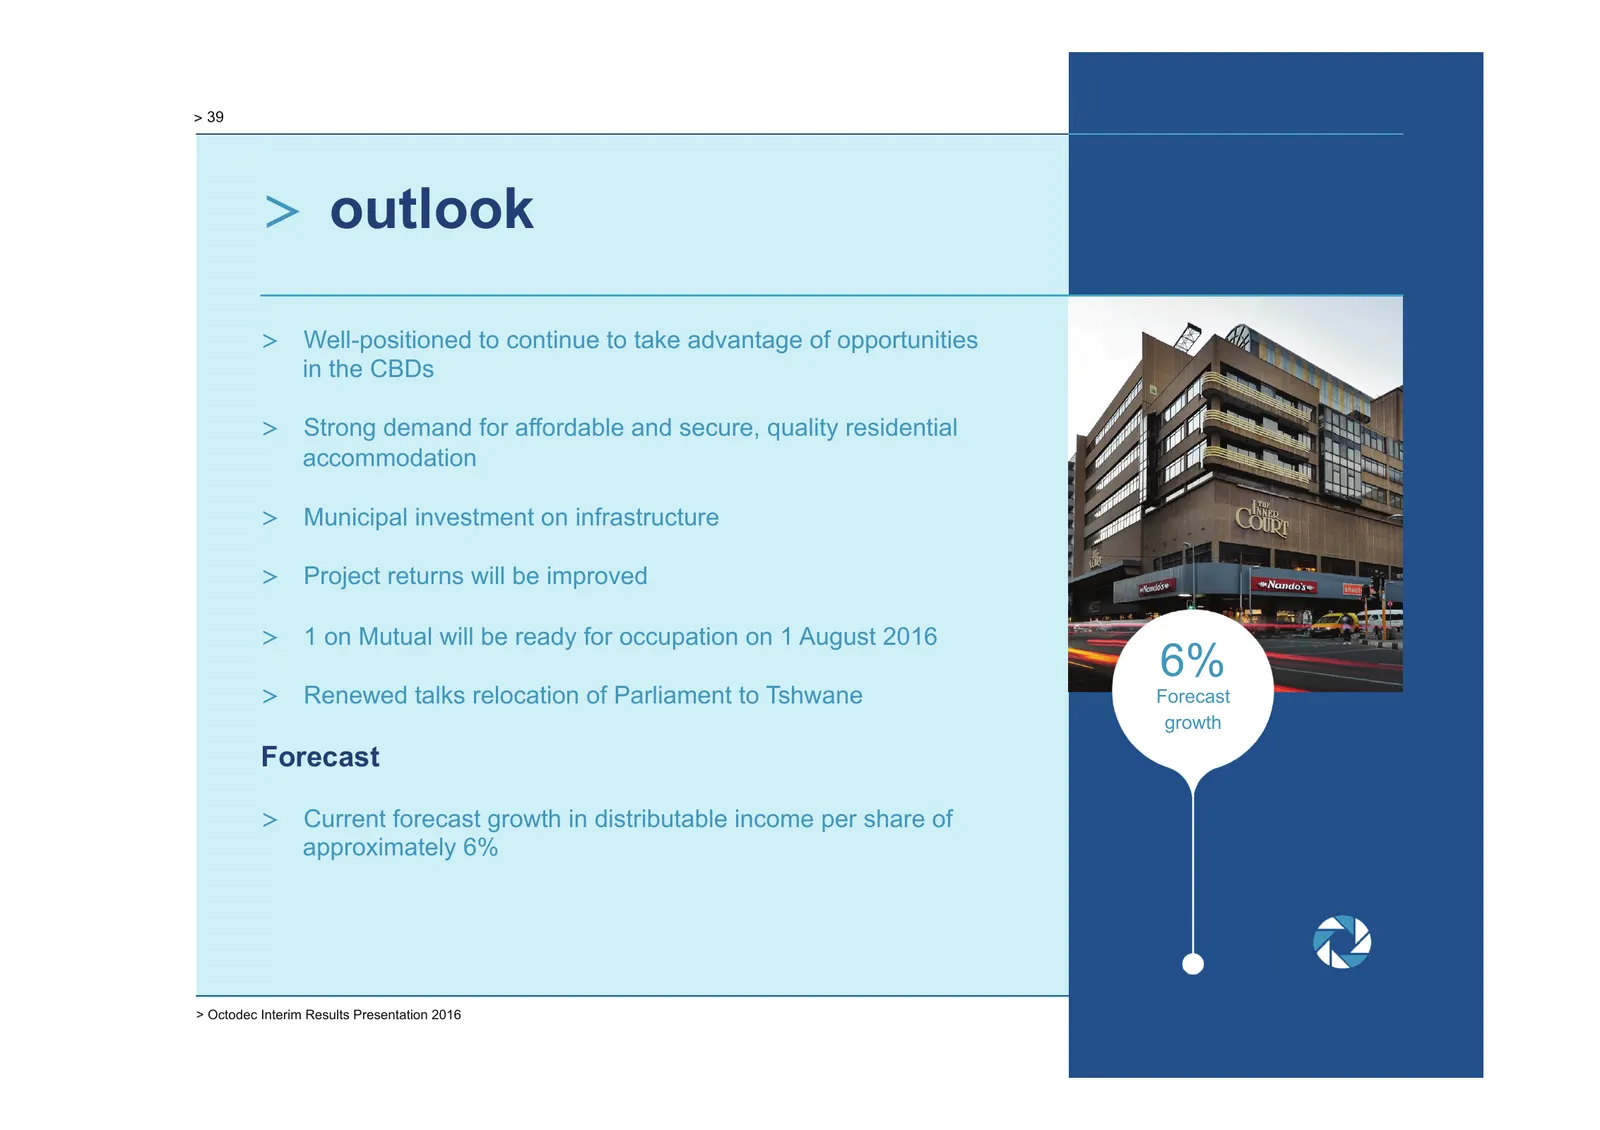
> 39 > outlook > Well-positioned to continue to take advantage of opportunities in the CBDs > Strong demand for affordable and secure, quality residential accommodation > Municipal investment on infrastructure > Project returns will be improved > 1 on Mutual will be ready for occupation on 1 August
Slide 40: Outlook
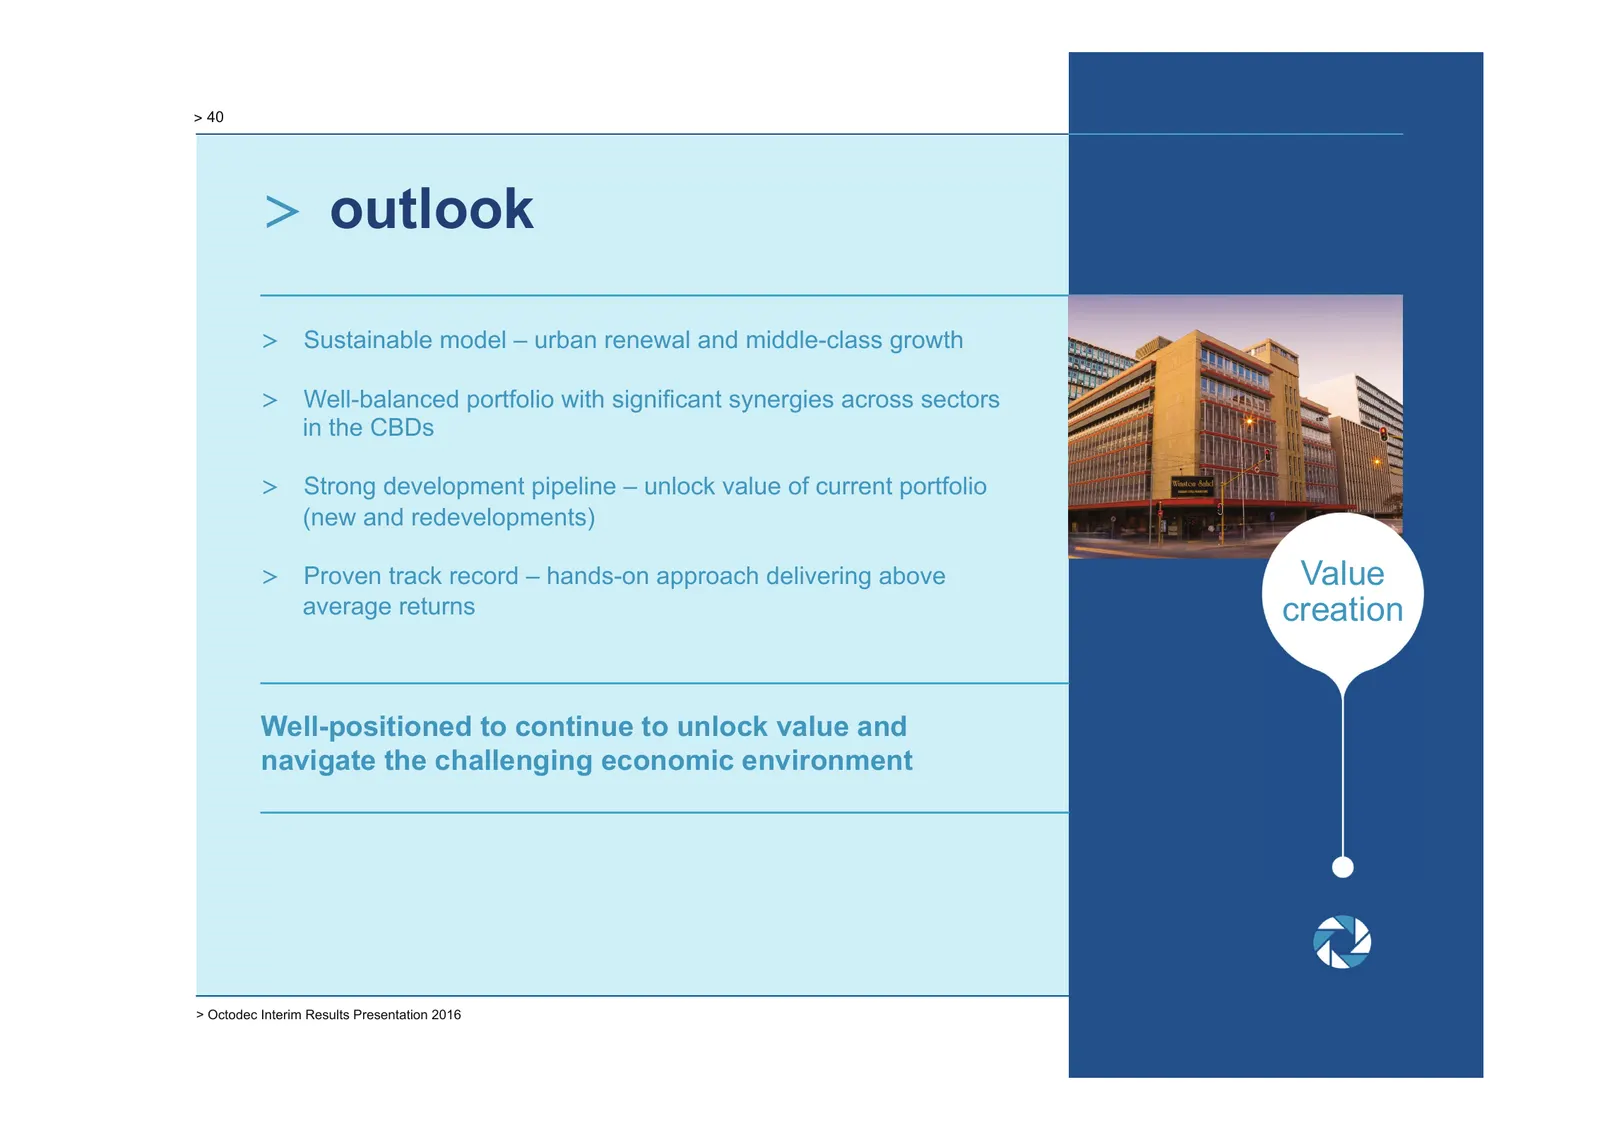
> 40 > outlook > Sustainable model – urban renewal and middle-class growth > Well-balanced portfolio with significant synergies across sectors in the CBDs > Strong development pipeline – unlock value of current portfolio (new and redevelopments) > Proven track record – hands-on approach delivering a
Slide 41: Q&A
> 41 > q&a 05 > Octodec Interim Results Presentation 2016
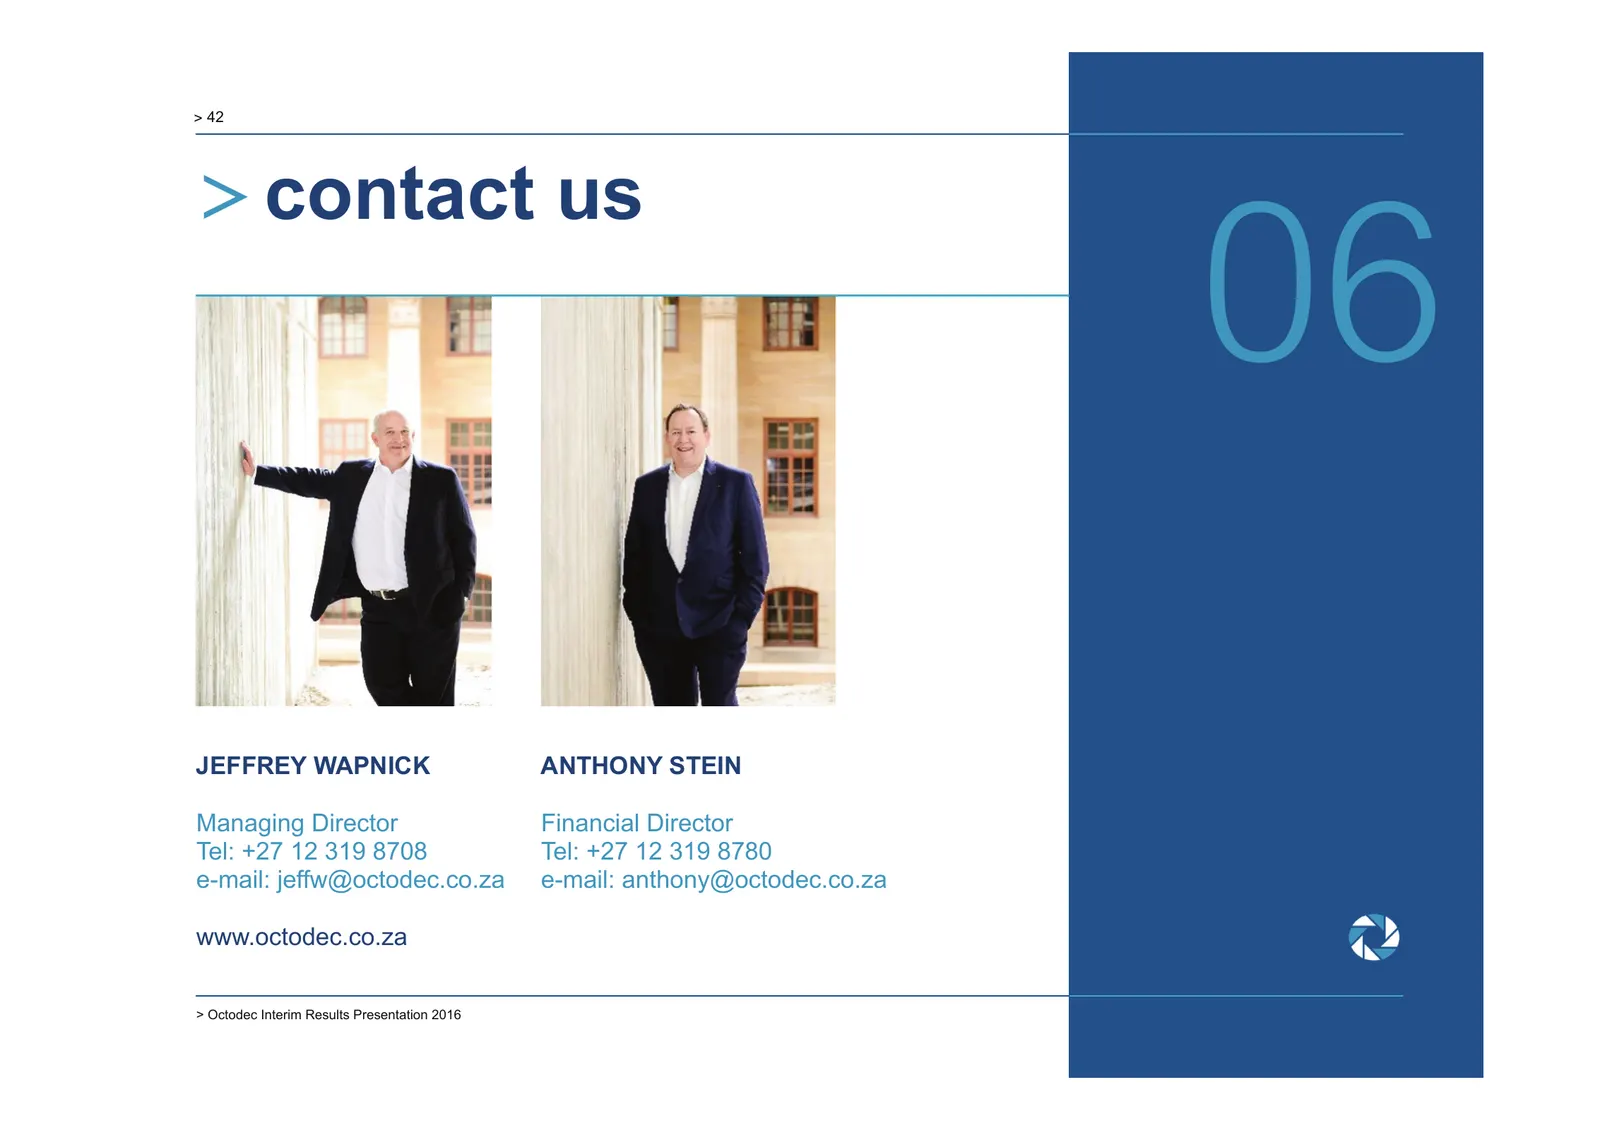
Slide 42: Contact us
> 42 > contact us 06 JEFFREY WAPNICK ANTHONY STEIN Managing Director Financial Director Tel: +27 12 319 8708 Tel: +27 12 319 8780 e-mail: jeffw@octodec.co.za e-mail: anthony@octodec.co.za www.octodec.co.za > Octodec Interim Results Presentation 2016
Source: Internet Archive copy of octodec.co.za
More decks from Octodec Investments Limited
 H1 2026 Earnings Presentation58 slides · May 2026
 FY2025 Earnings Presentation57 slides · November 2025
 HY2025 Earnings Presentation40 slides · May 2025
 H1 2025 Earnings Presentation40 slides · May 2025
 H1 2025 Earnings Presentation14 slides · February 2025
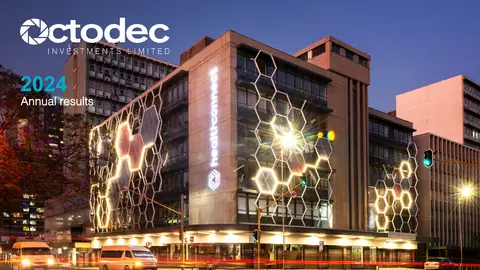 FY2024 Earnings Presentation45 slides · Nov 25, 2024