Bryn Mawr Bank — Q4 2019 Earnings Presentation
36 slides from Bryn Mawr Bank's earnings presentation, Feb 12, 2020
Slide 1: Bryn Mawr Bank Corporation 4th Quarter 2019 Presentation
BRYN MAWR BANK CORPORATION 4th Quarter 2019 Presentation 1
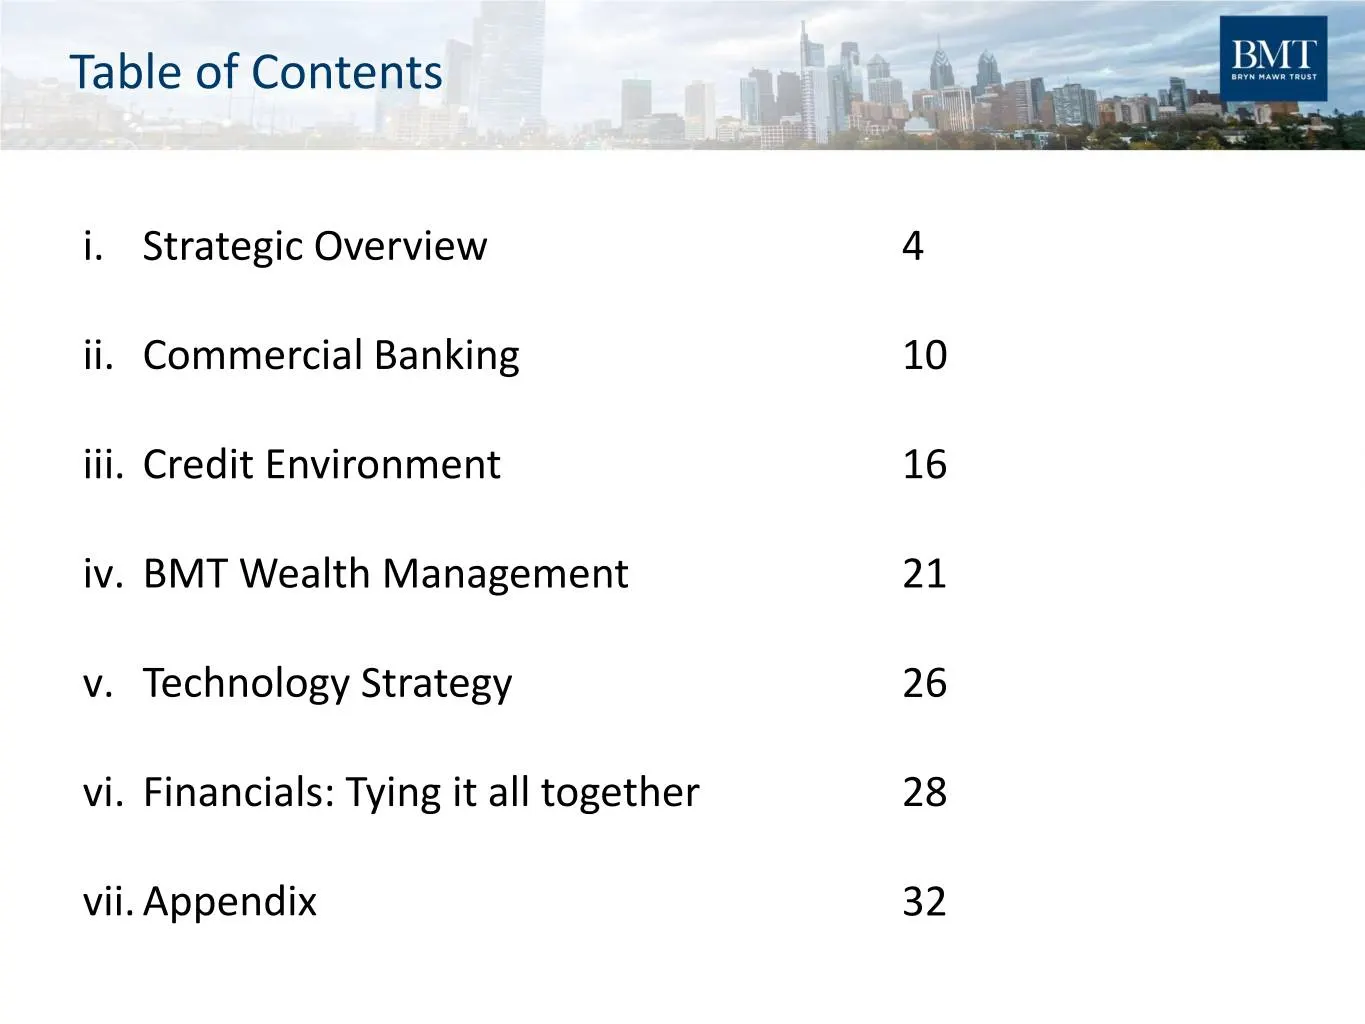
Slide 2: Table of Contents
Table of Contents i. Strategic Overview 4 ii. Commercial Banking 10 iii. Credit Environment 16 iv. BMT Wealth Management 21 v. Technology Strategy 26 vi. Financials: Tying it all together 28 vii. Appendix 32 2
Slide 3: Forward Looking Statement
Forward Looking Statement The statements contained herein that are not historical facts are forward-looking statements based on management’s current expectations and beliefs concerning future developments and their potential effects on the Bryn Mawr Bank Corp. (the “Corporation") including, without

Slide 4: Strategic Overview
Strategic Overview
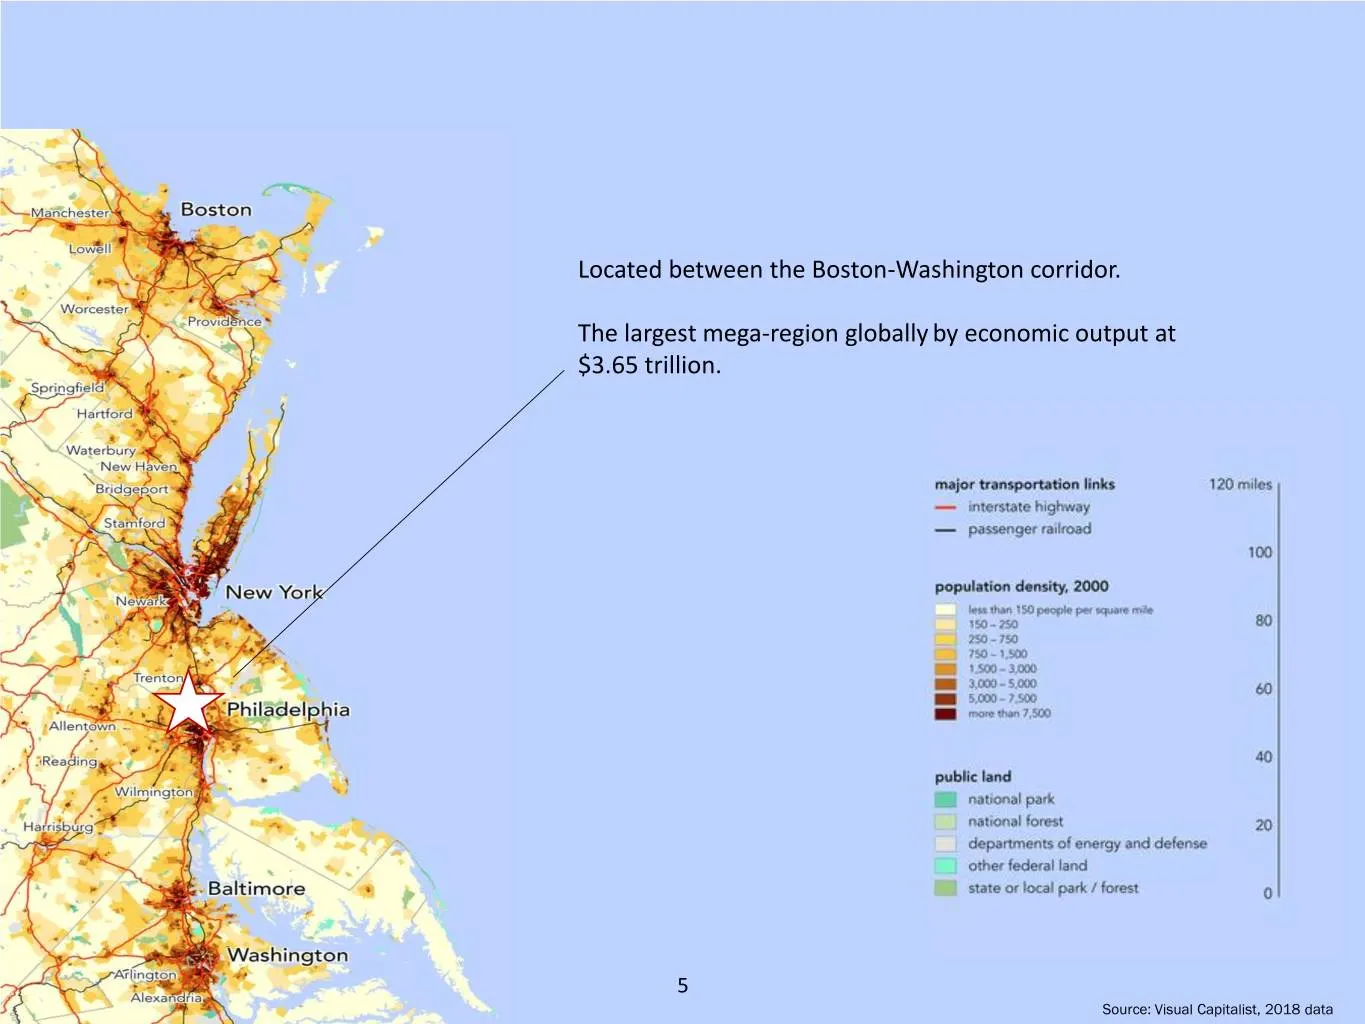
Slide 5: Located between the Boston-Washington corridor
Located between the Boston-Washington corridor. The largest mega-region globally by economic output at $3.65 trillion. 5 Source: Visual Capitalist, 2018 data
Slide 6: Differentiating through One BMT
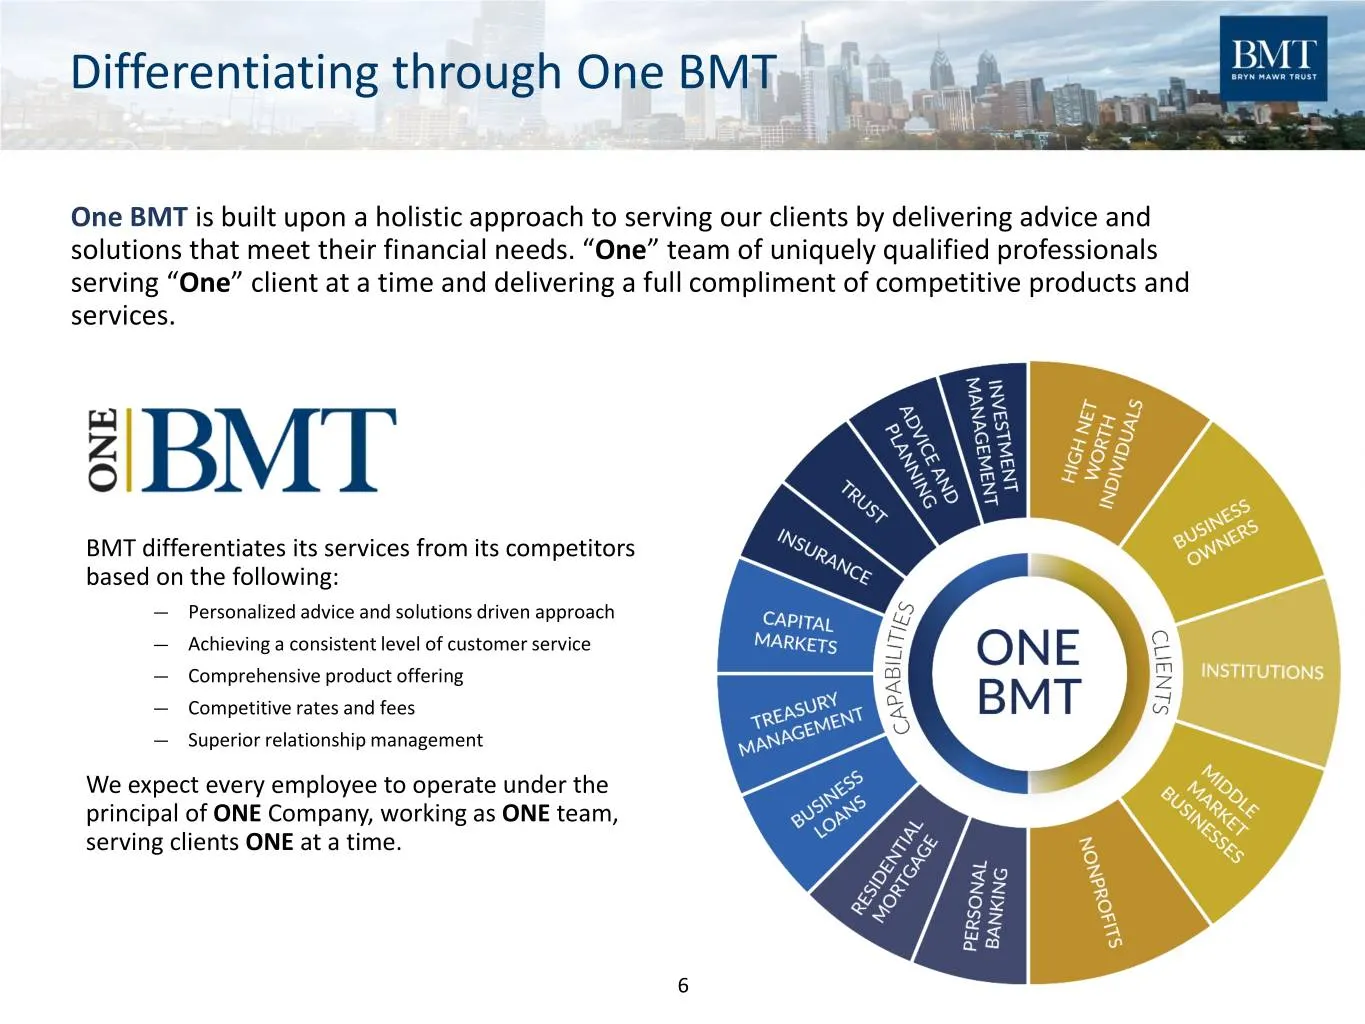
Differentiating through One BMT One BMT is built upon a holistic approach to serving our clients by delivering advice and solutions that meet their financial needs. “One” team of uniquely qualified professionals serving “One” client at a time and delivering a full compliment of competitive products
Slide 7: Key Strategic Initiatives
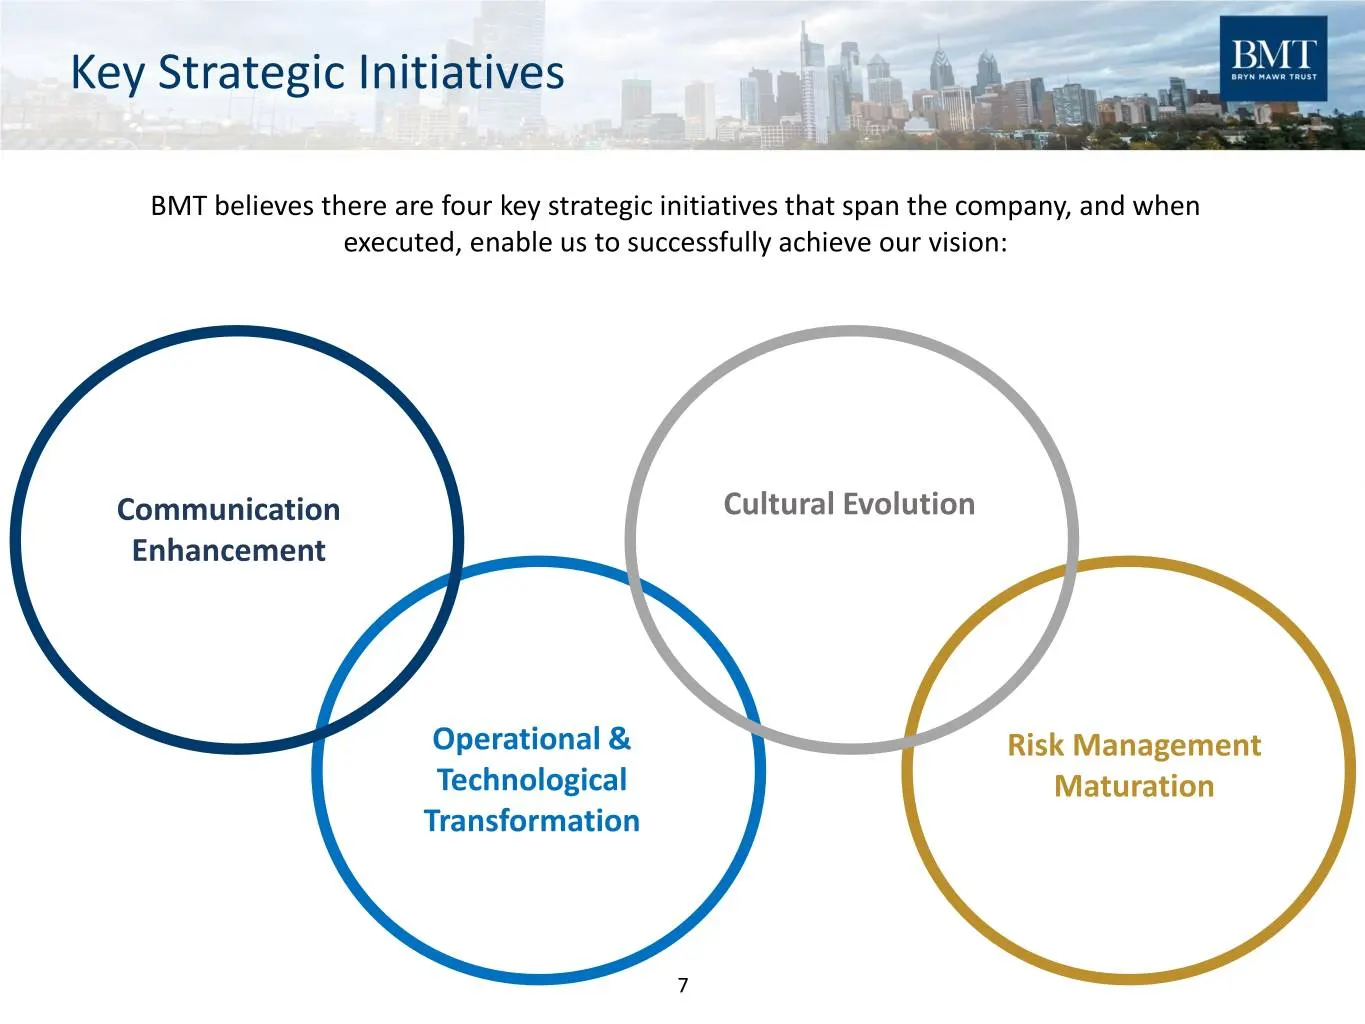
Key Strategic Initiatives BMT believes there are four key strategic initiatives that span the company, and when executed, enable us to successfully achieve our vision: Communication Cultural Evolution Enhancement Operational & Risk Management Technological Maturation Transformation 7
Slide 8: Cultural Evolution & Corporate Social Responsibility
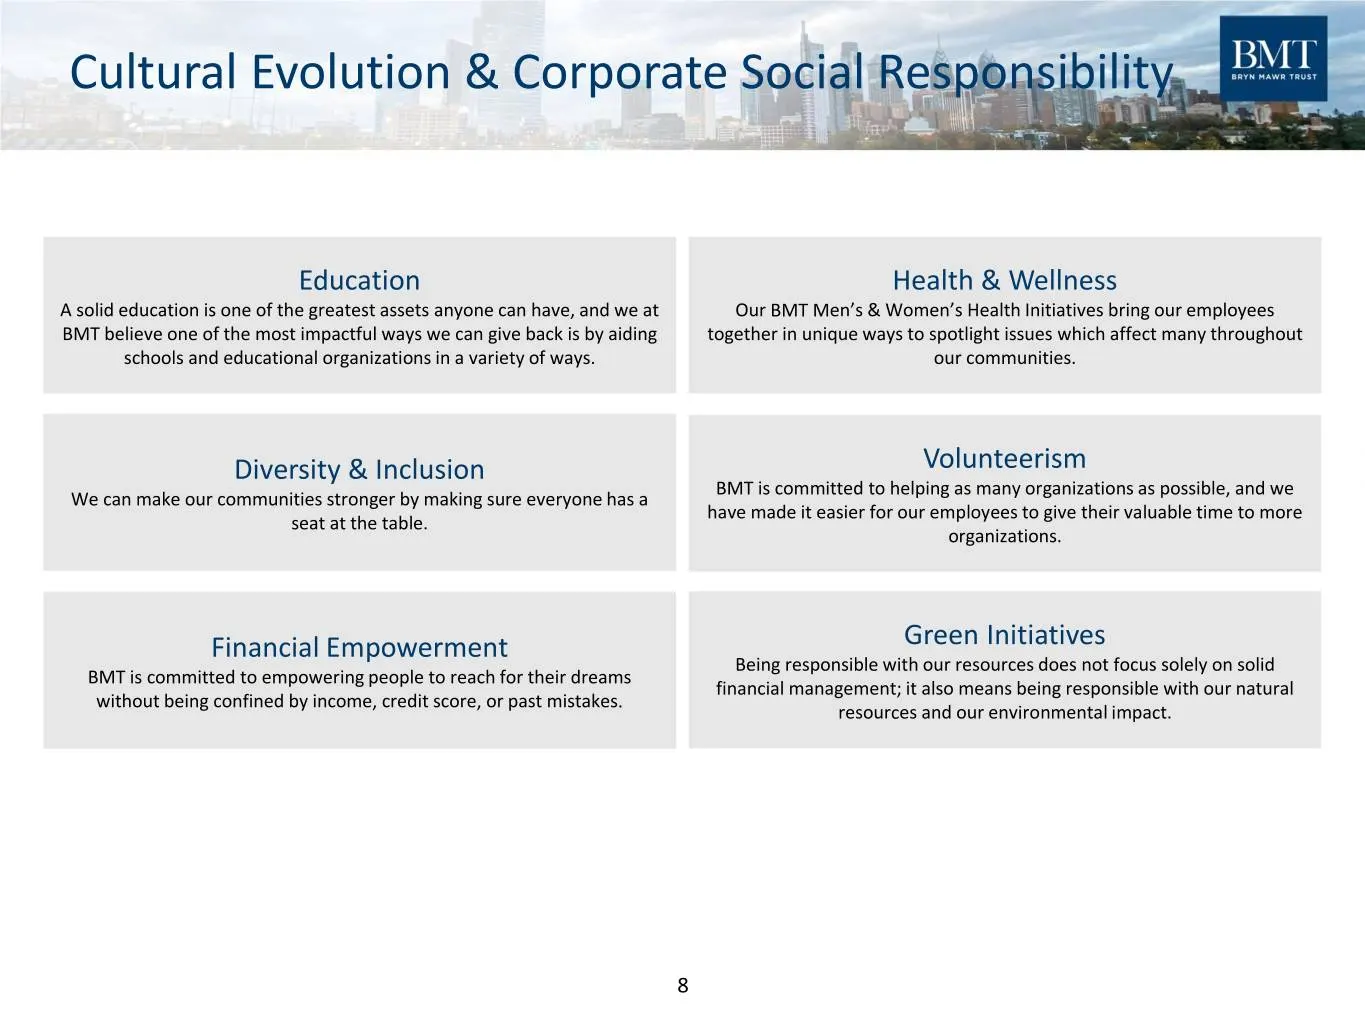
Cultural Evolution & Corporate Social Responsibility Education Health & Wellness A solid education is one of the greatest assets anyone can have, and we at Our BMT Men’s & Women’s Health Initiatives bring our employees BMT believe one of the most impactful ways we can give back is by aiding together
Slide 9: Investment in Talent
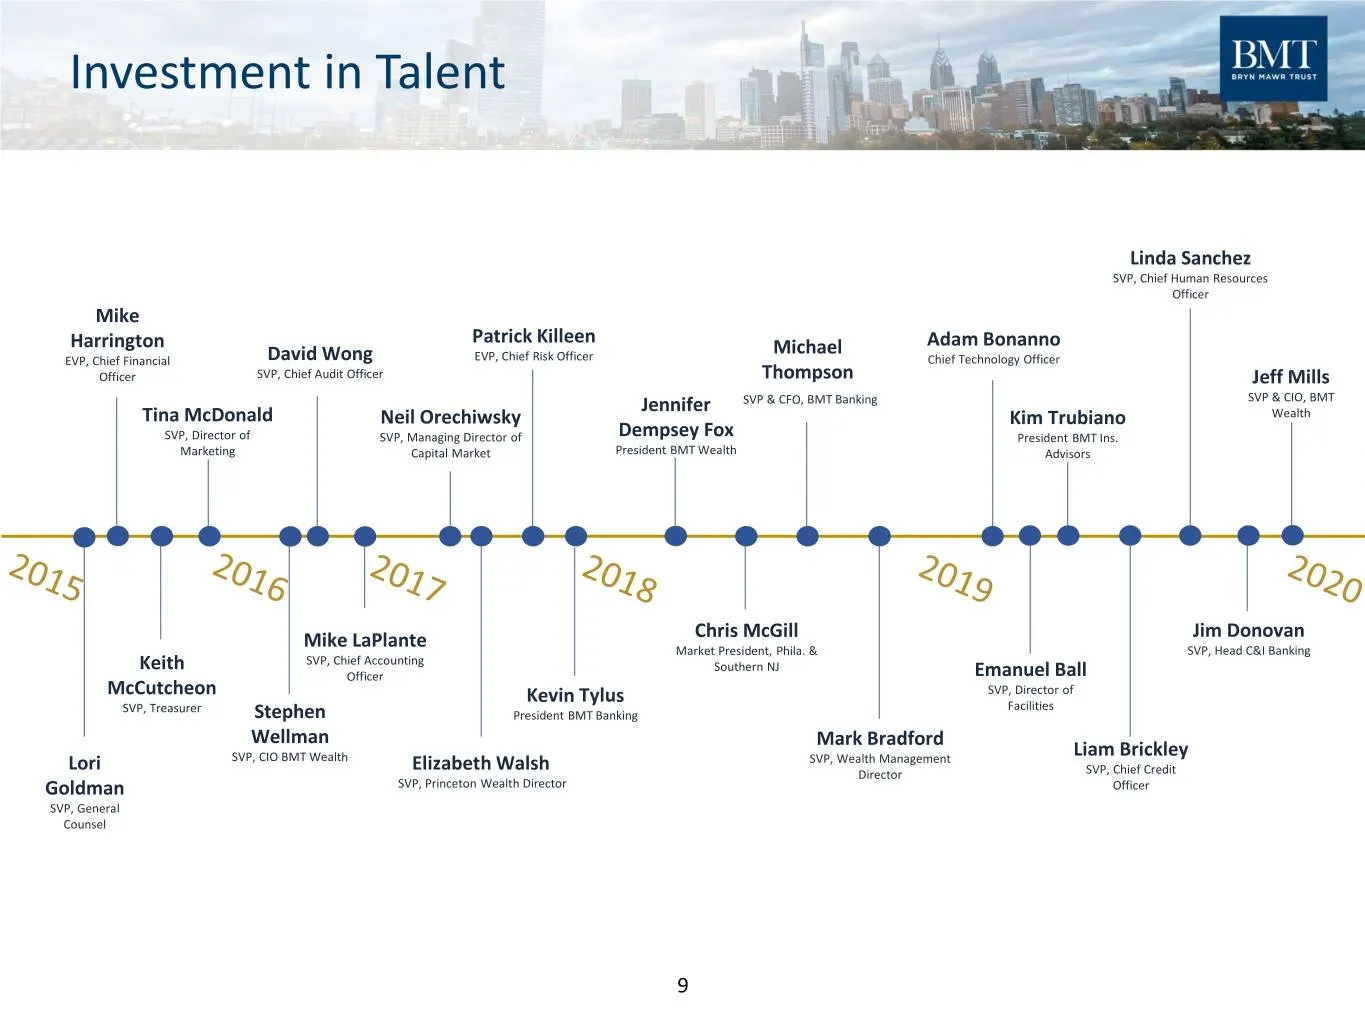
Investment in Talent Linda Sanchez SVP, Chief Human Resources Officer Mike Patrick Killeen Harrington Michael Adam Bonanno EVP, Chief Financial David Wong EVP, Chief Risk Officer Chief Technology Officer Officer SVP, Chief Audit Officer Thompson Jeff Mills Jennifer SVP & CFO, BMT Banking SVP & CIO,

Slide 10: Banking
Banking eo Fi “BRYN | AWR TRUST WerOWn Radu vu Shane
Slide 11: Banking Initiatives and Strategic Focus
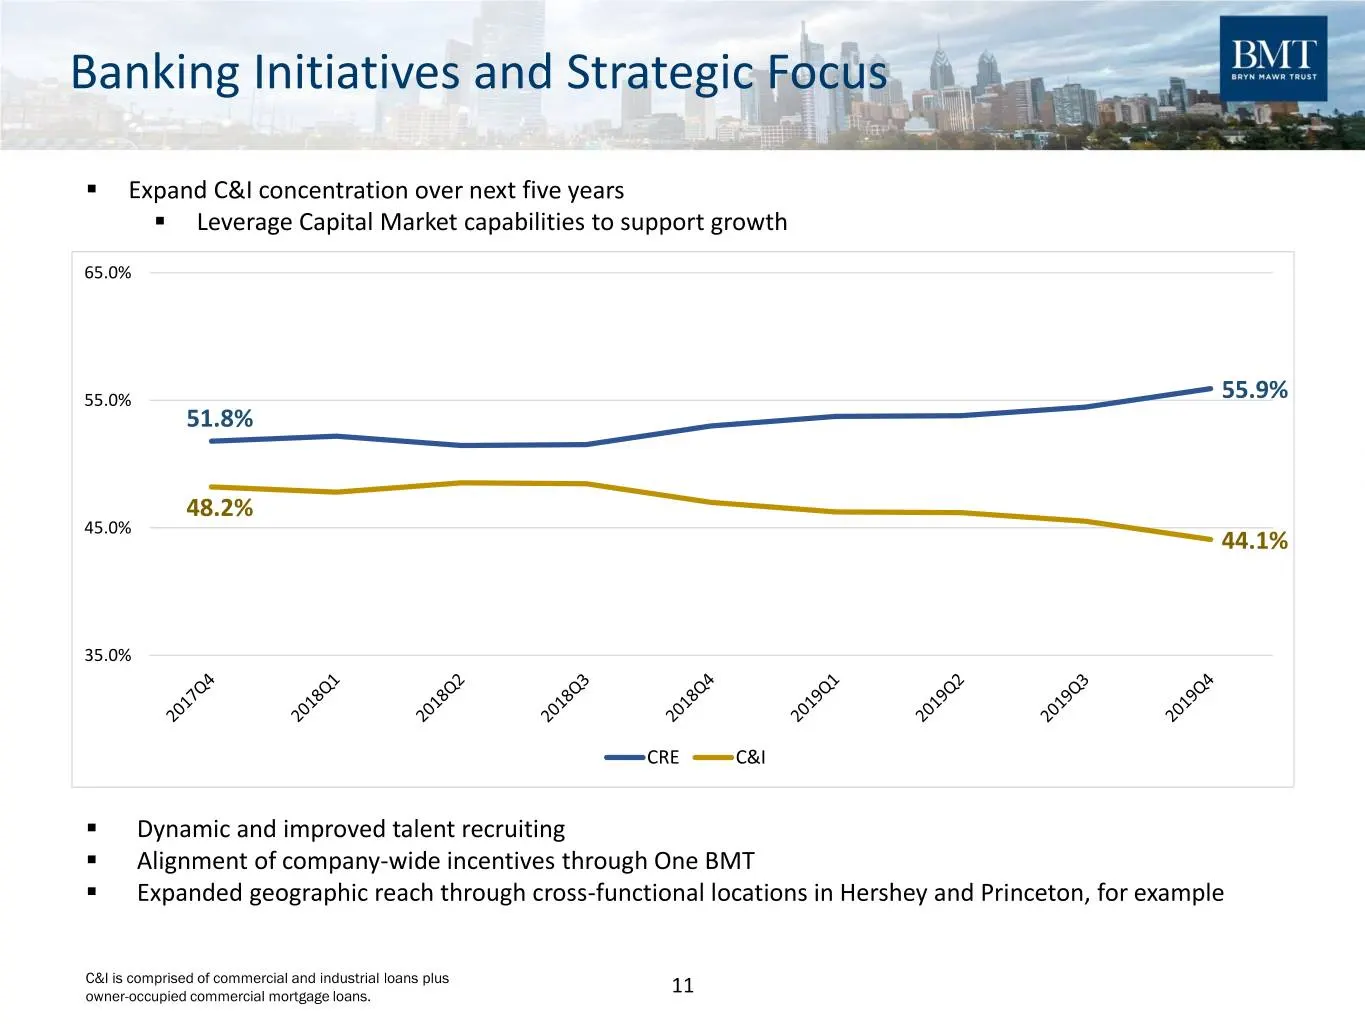
Banking Initiatives and Strategic Focus ▪ Expand C&I concentration over next five years ▪ Leverage Capital Market capabilities to support growth 65.0% 55.0% 55.9% 51.8% 48.2% 45.0% 44.1% 35.0% CRE C&I ▪ Dynamic and improved talent recruiting ▪ Alignment of company-wide incentives through One BMT ▪ E
Slide 12: Market Opportunities
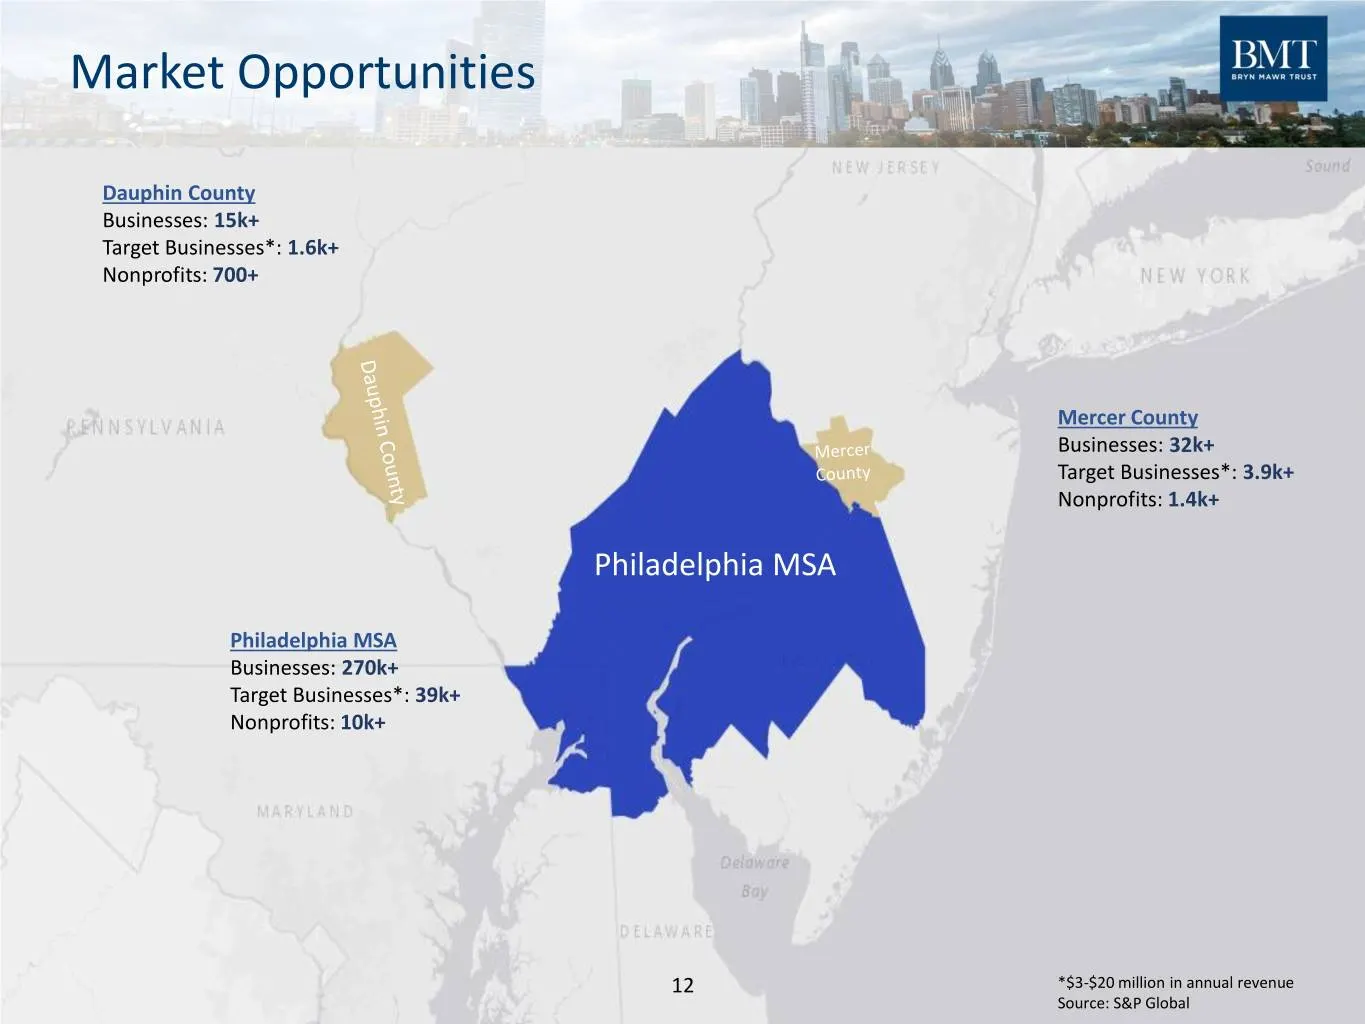
Market Opportunities Dauphin County Businesses: 15k+ Target Businesses*: 1.6k+ Nonprofits: 700+ Mercer County Businesses: 32k+ Target Businesses*: 3.9k+ Nonprofits: 1.4k+ Philadelphia MSA Philadelphia MSA Businesses: 270k+ Target Businesses*: 39k+ Nonprofits: 10k+ 12 *$3-$20 million in annual revenu
Slide 13: C&I Opportunities in Key Segments
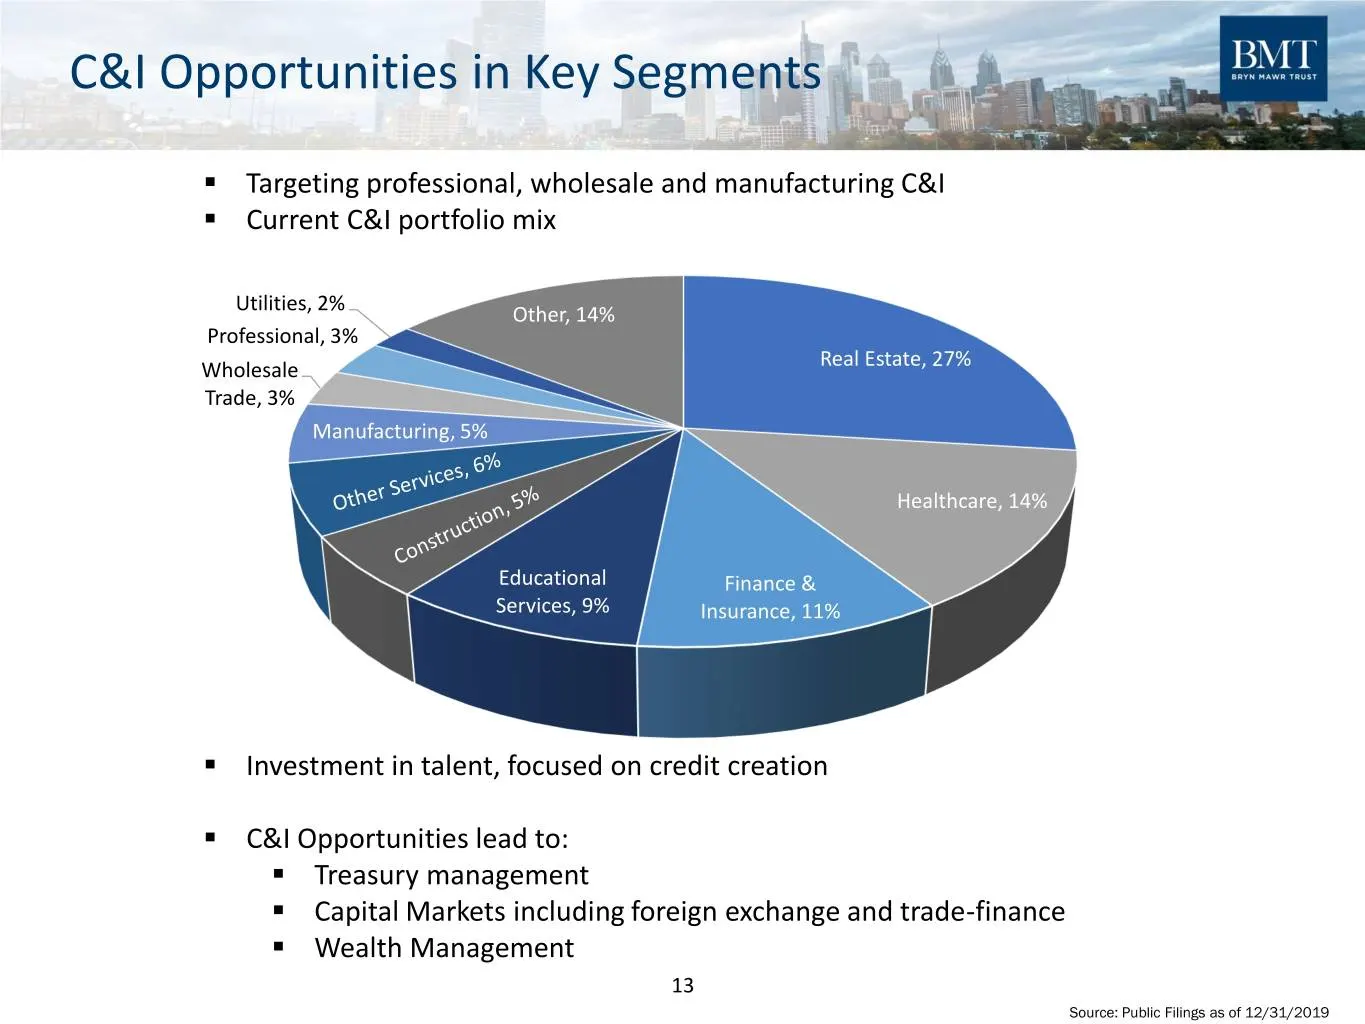
C&I Opportunities in Key Segments ▪ Targeting professional, wholesale and manufacturing C&I ▪ Current C&I portfolio mix Utilities, 2% Other, 14% Professional, 3% Real Estate, 27% Wholesale Trade, 3% Manufacturing, 5% Healthcare, 14% Educational Finance & Services, 9% Insurance, 11% ▪ Investment in t
Slide 14: Funding Our Growth
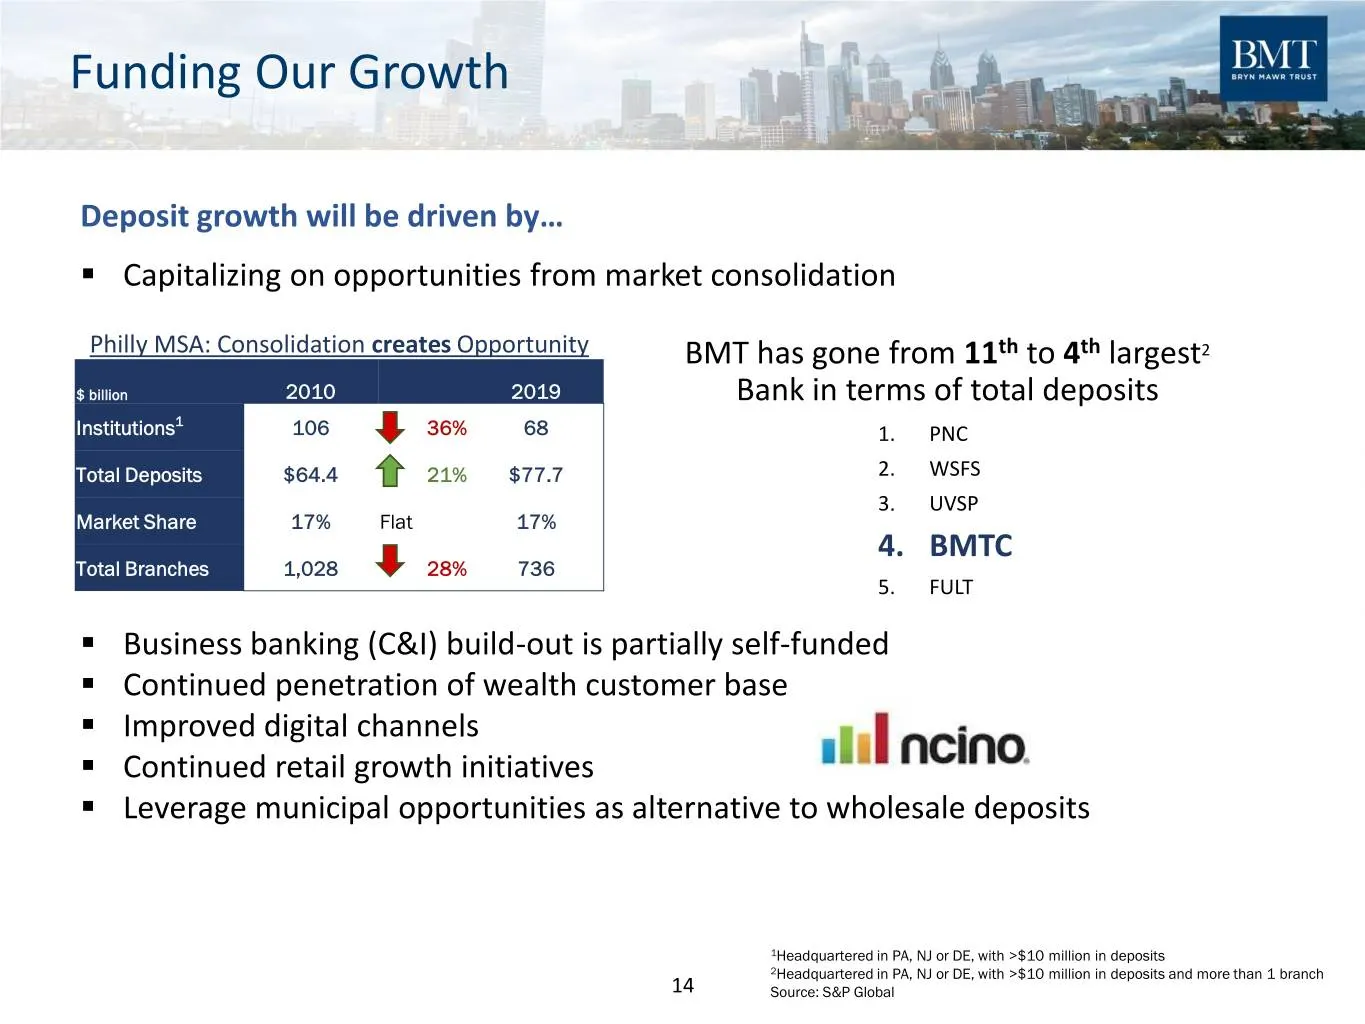
Funding Our Growth Deposit growth will be driven by… ▪ Capitalizing on opportunities from market consolidation Philly MSA: Consolidation creates Opportunity BMT has gone from 11th to 4th largest2 $ billion 2010 2019 Bank in terms of total deposits 1 Institutions 106 36% 68 1. PNC Total Deposits $64.
Slide 15: About BMT Capital Markets
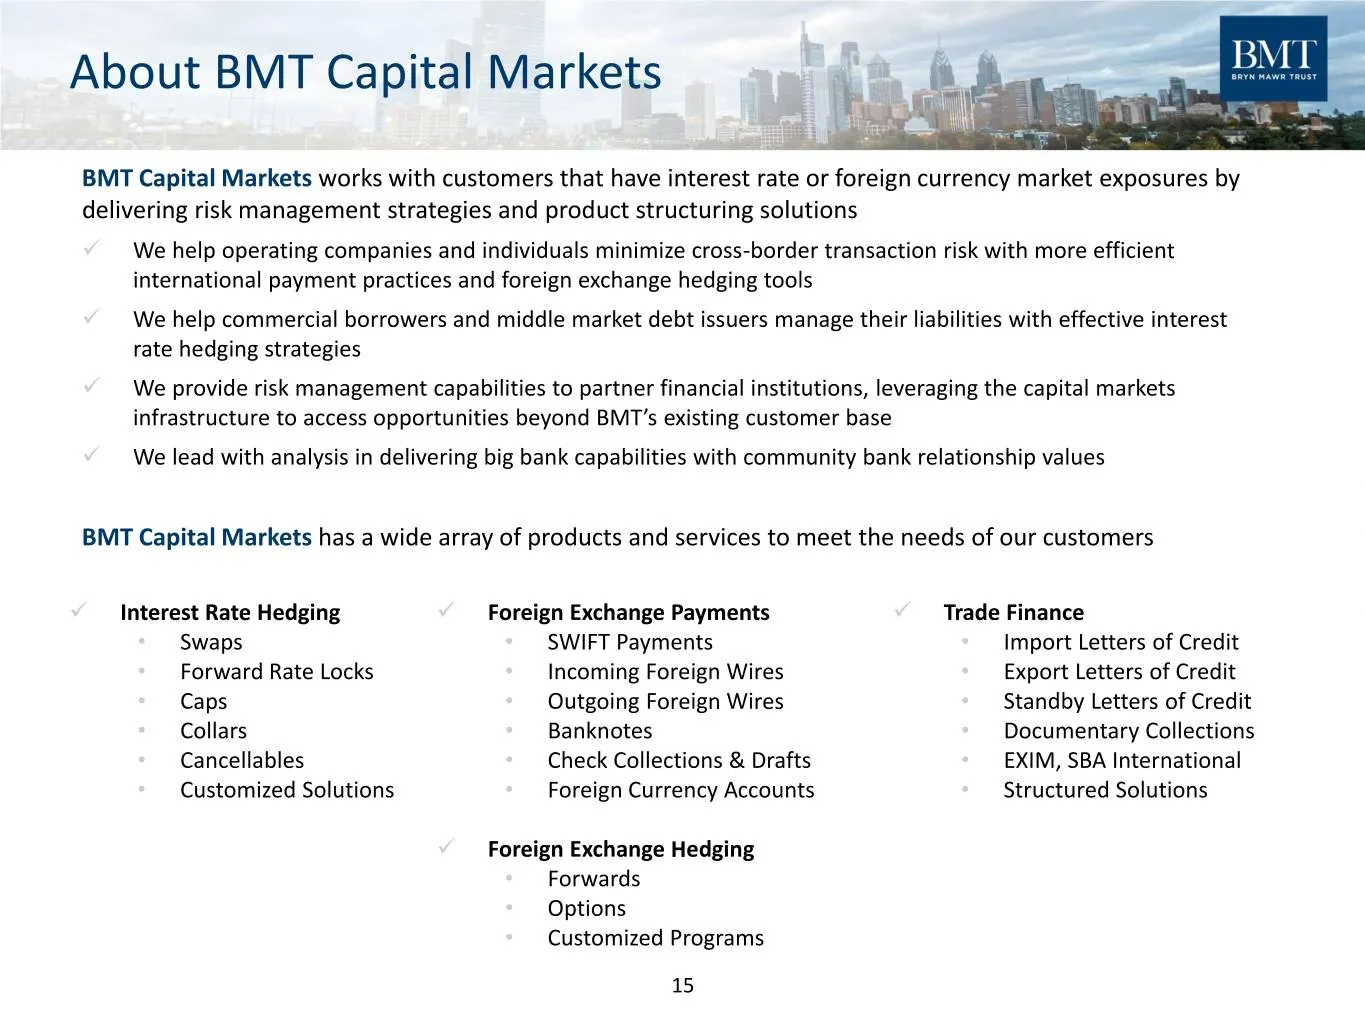
About BMT Capital Markets BMT Capital Markets works with customers that have interest rate or foreign currency market exposures by delivering risk management strategies and product structuring solutions ✓ We help operating companies and individuals minimize cross-border transaction risk with more ef
Slide 16: Credit Management
Credit Management eo Fi “BRYN | AWR TRUST WerOWn Radu vu Shane
Slide 17: Credit Management: A track record of consistency (Loan Growth)
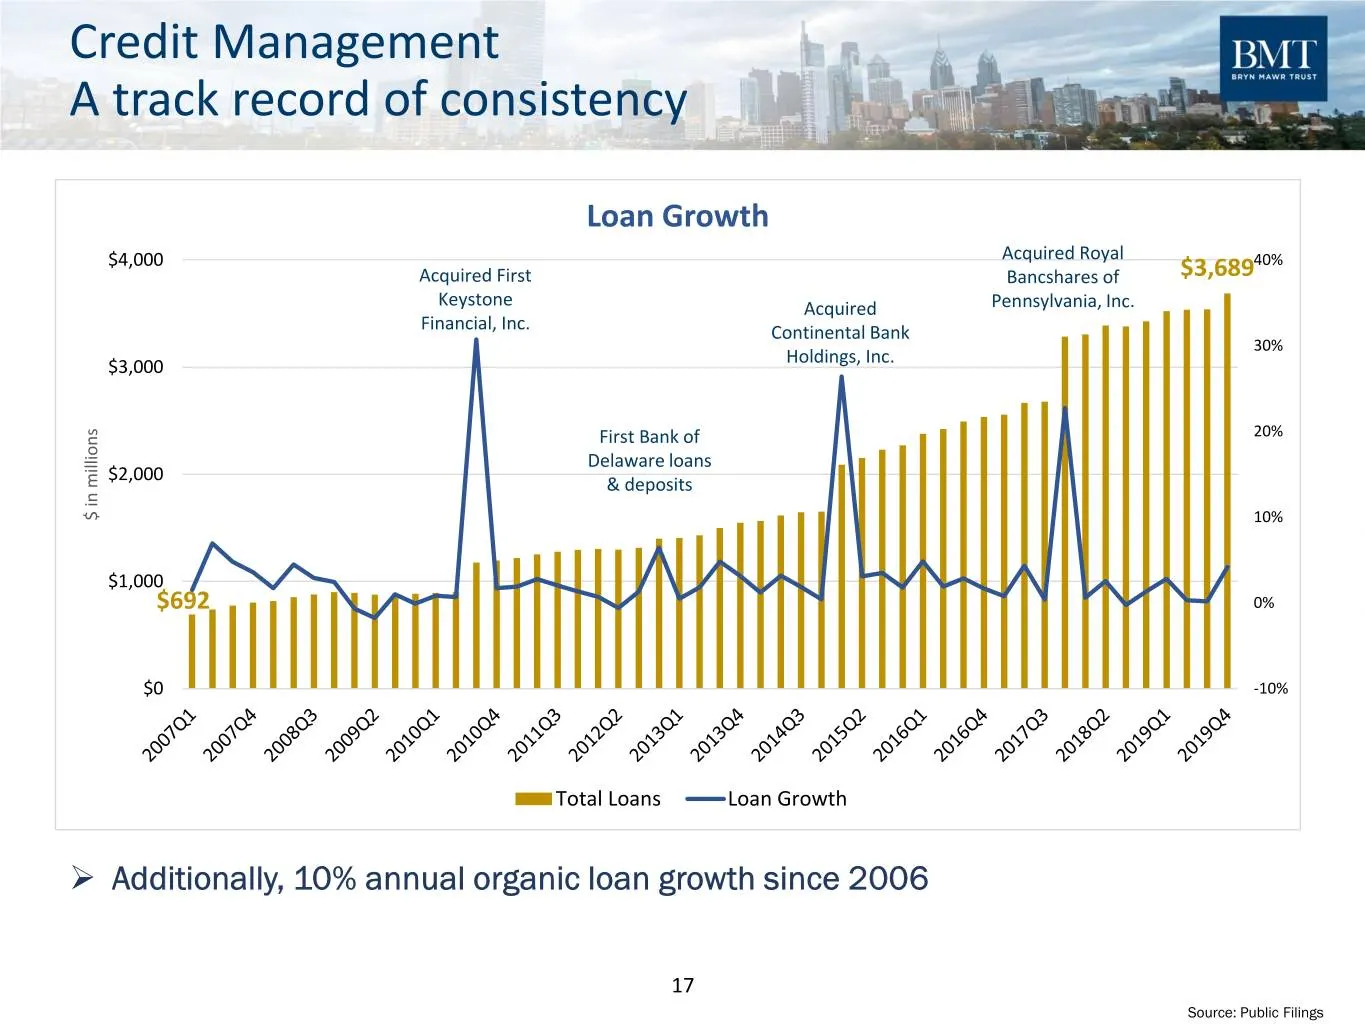
Credit Management A track record of consistency Loan Growth $4,000 Acquired Royal 40% Acquired First Bancshares of $3,689 Keystone Acquired Pennsylvania, Inc. Financial, Inc. Continental Bank 30% Holdings, Inc. $3,000 First Bank of 20% Delaware loans $2,000 & deposits $ in $ millions 10% $1,000 $692
Slide 18: Credit Management: NPLs / Total Loans
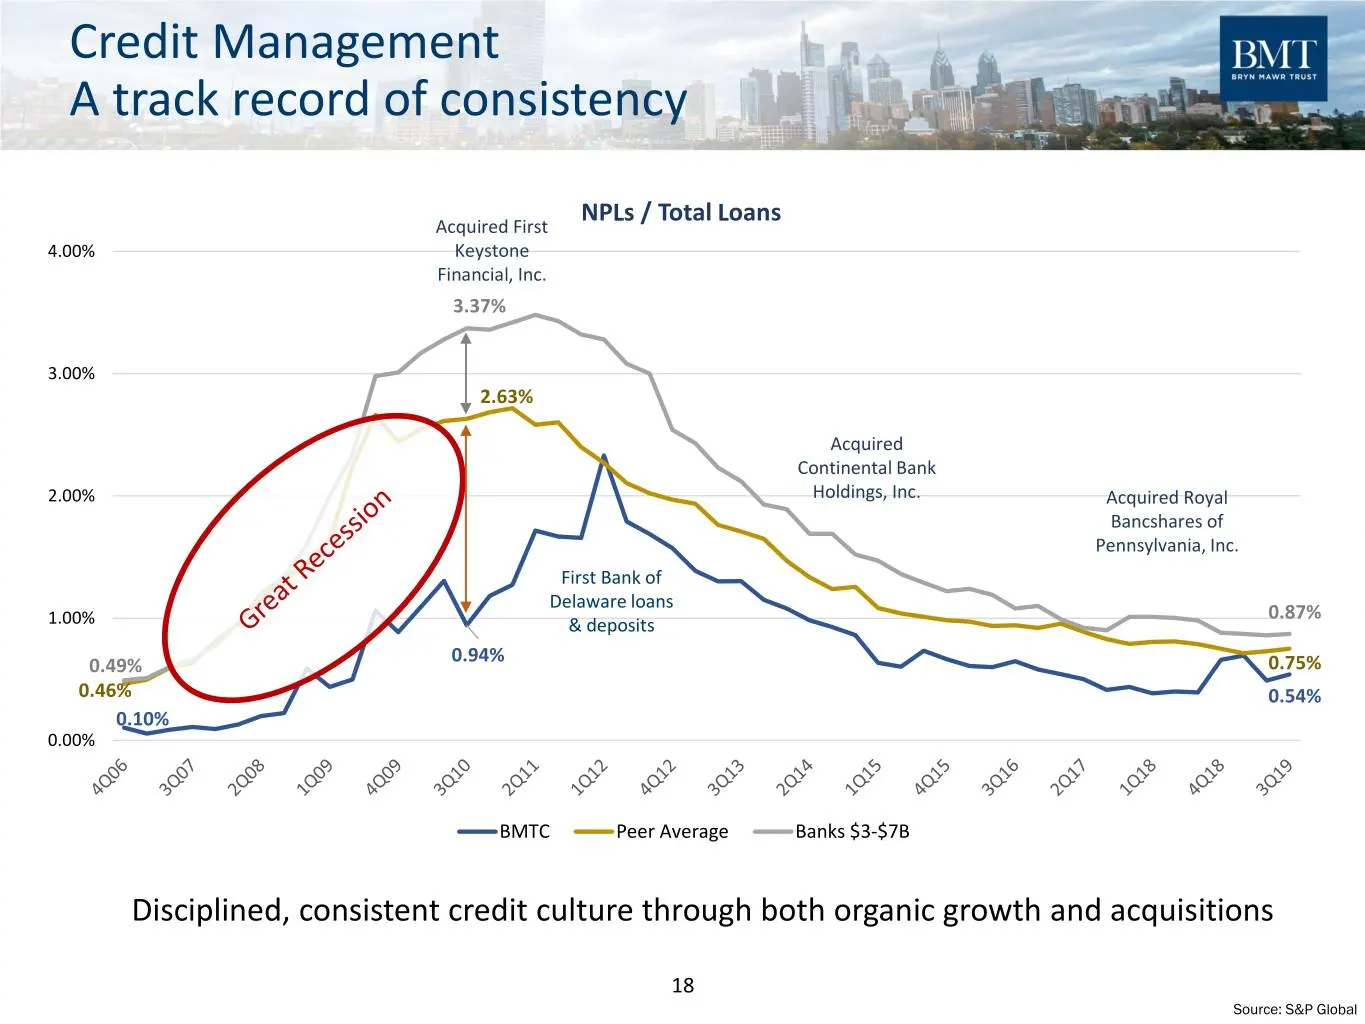
Credit Management A track record of consistency NPLs / Total Loans Acquired First 4.00% Keystone Financial, Inc. 3.37% 3.00% 2.63% Acquired Continental Bank 2.00% Holdings, Inc. Acquired Royal Bancshares of Pennsylvania, Inc. First Bank of Delaware loans 0.87% 1.00% & deposits 0.94% 0.49% 0.75% 0.46
Slide 19: Loan Portfolio Composition
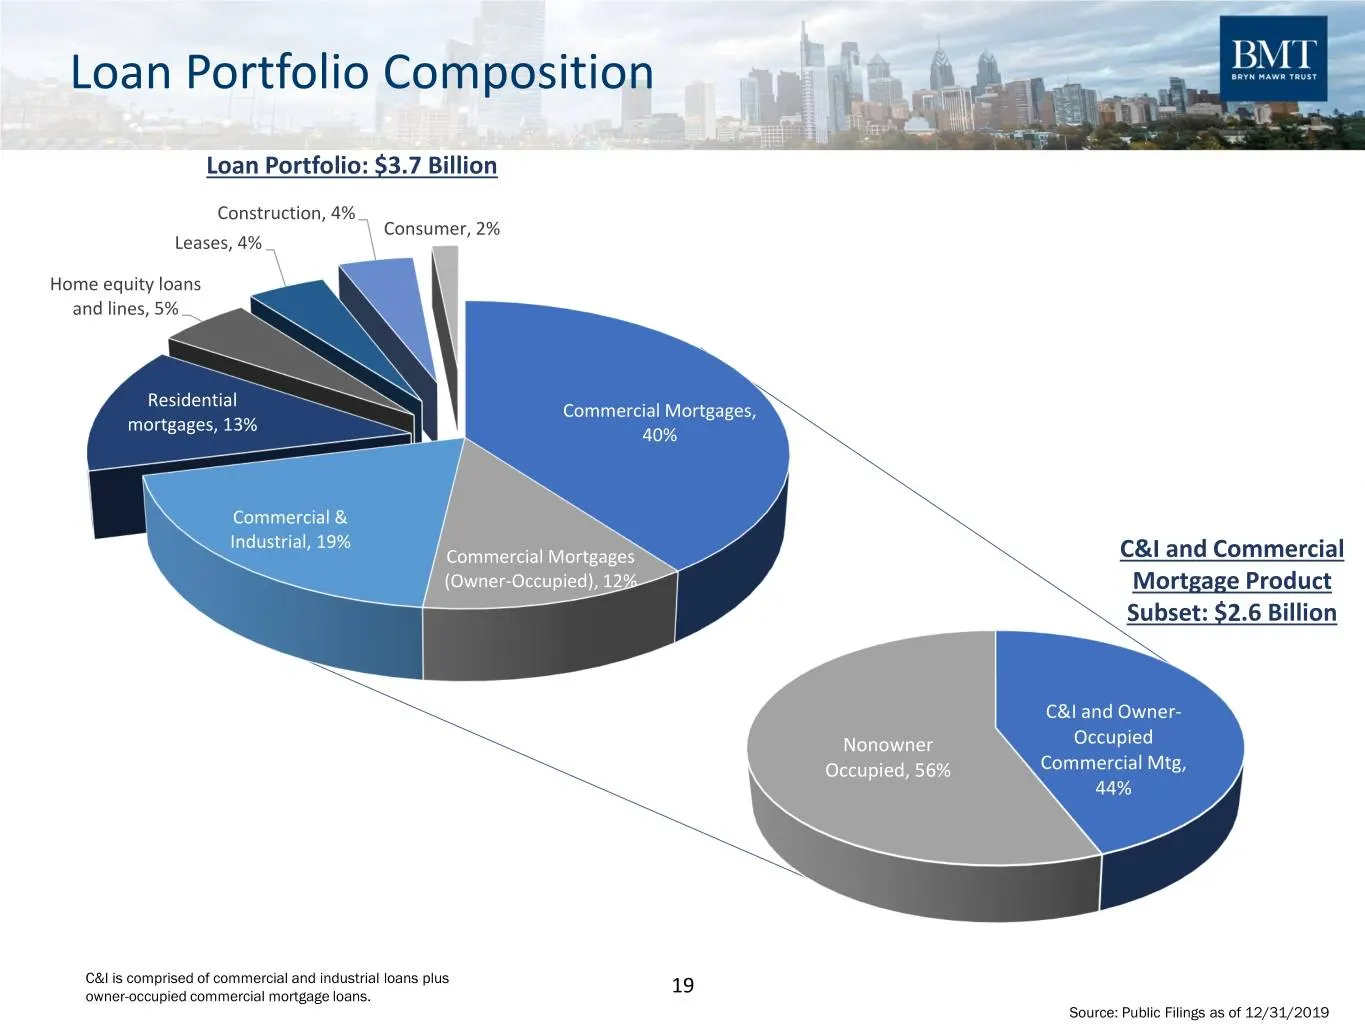
Loan Portfolio Composition Loan Portfolio: $3.7 Billion Construction, 4% Consumer, 2% Leases, 4% Home equity loans and lines, 5% Residential Commercial Mortgages, mortgages, 13% 40% Commercial & Industrial, 19% Commercial Mortgages C&I and Commercial (Owner-Occupied), 12% Mortgage Product Subset: $2
Slide 20: Managing CRE Concentrations
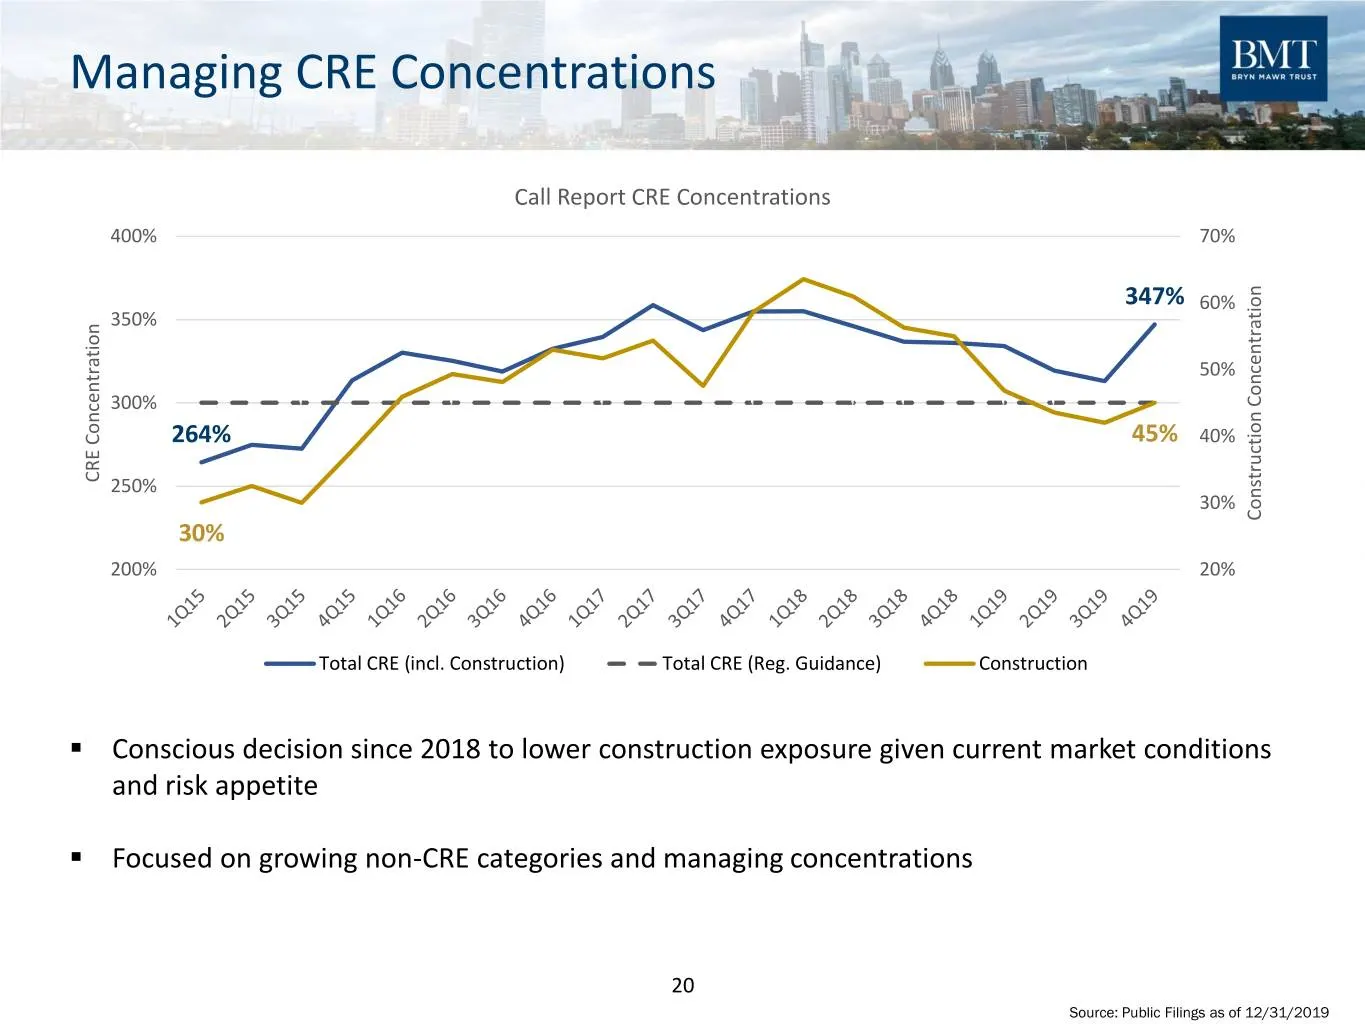
Managing CRE Concentrations Call Report CRE Concentrations 400% 70% 347% 60% 350% 50% 300% 264% 45% 40% CRE Concentration CRE 250% 30% Construction Concentration Construction 30% 200% 20% Total CRE (incl. Construction) Total CRE (Reg. Guidance) Construction ▪ Conscious decision since 2018 to lower c

Slide 21: Wealth Management
Wealth Management eo Fi “BRYN | AWR TRUST WerOWn Radu vu Shane
Slide 22: BMT Wealth Management
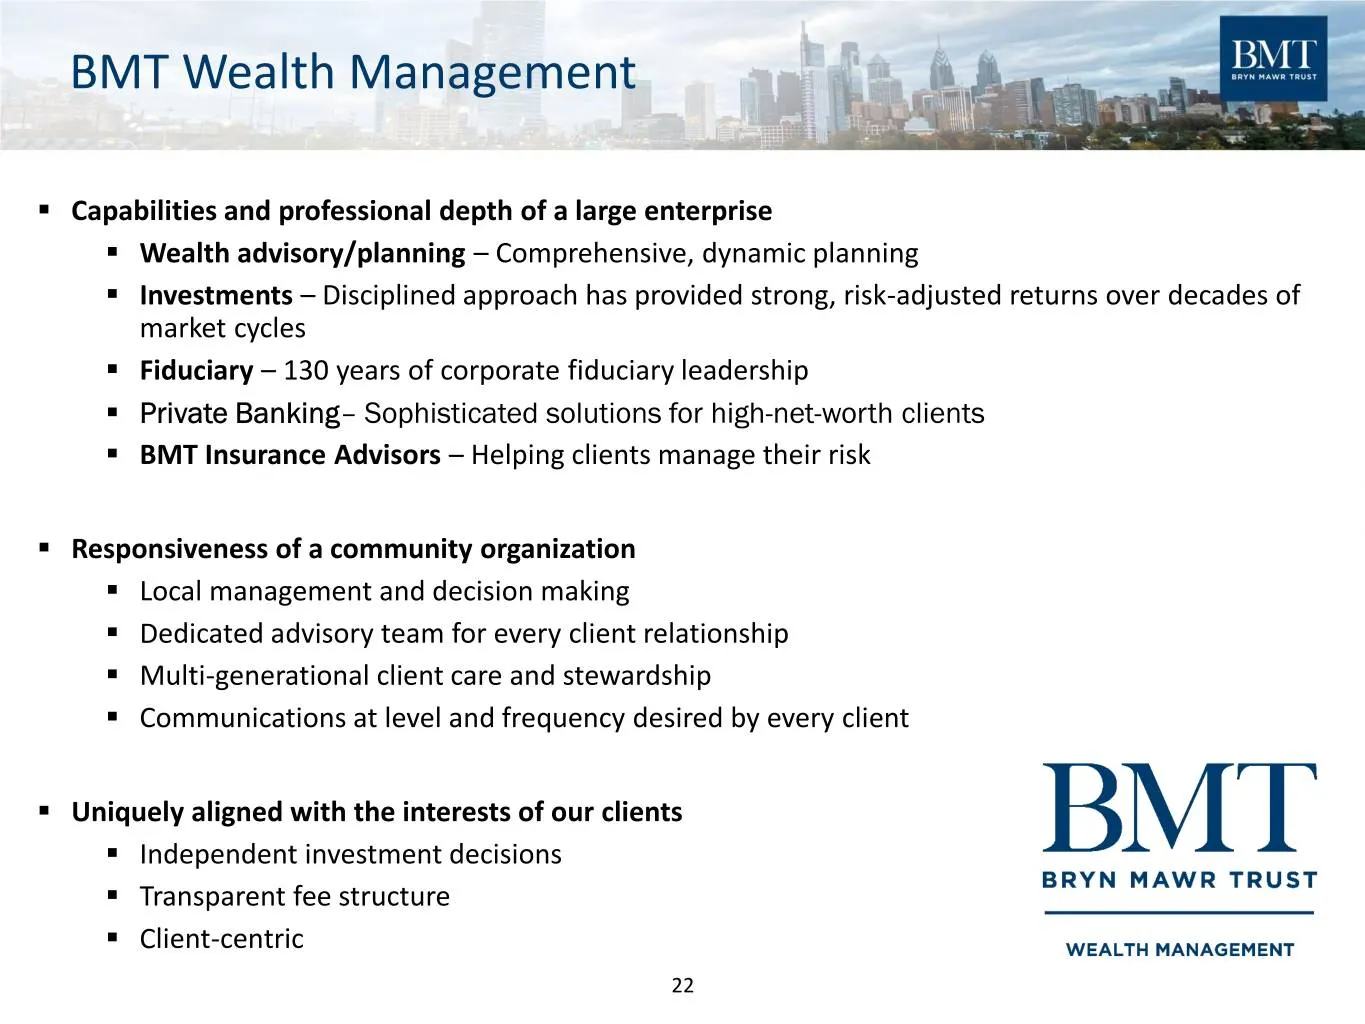
BMT Wealth Management ▪ Capabilities and professional depth of a large enterprise ▪ Wealth advisory/planning – Comprehensive, dynamic planning ▪ Investments – Disciplined approach has provided strong, risk-adjusted returns over decades of market cycles ▪ Fiduciary – 130 years of corporate fiduciary
Slide 23: Promise, Purpose & Priorities
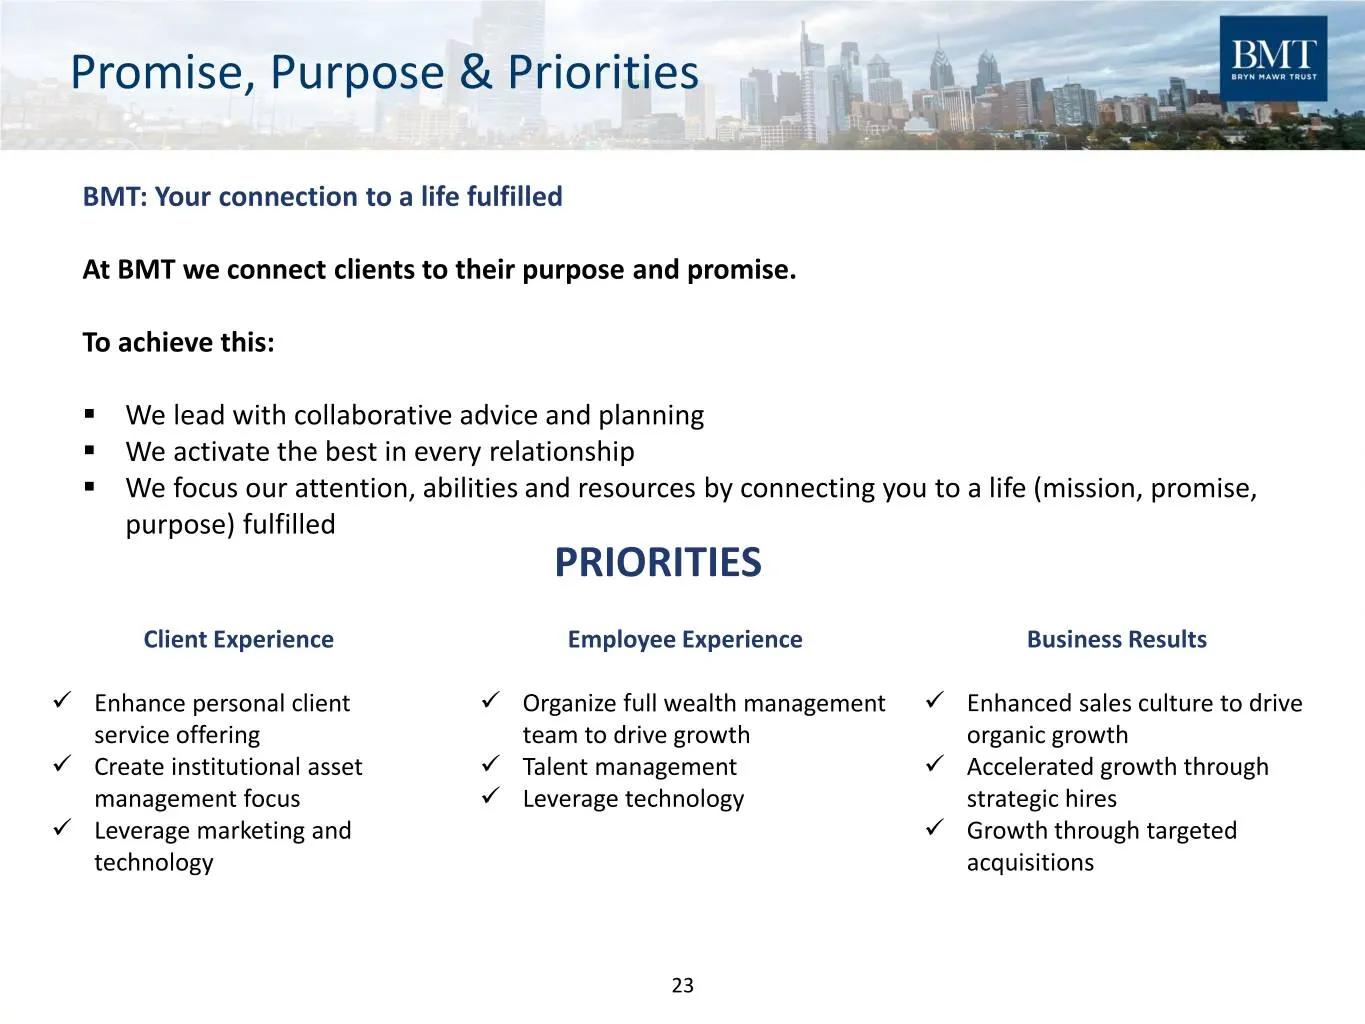
Promise, Purpose & Priorities BMT: Your connection to a life fulfilled At BMT we connect clients to their purpose and promise. To achieve this: ▪ We lead with collaborative advice and planning ▪ We activate the best in every relationship ▪ We focus our attention, abilities and resources by connectin
Slide 24: A Premier Wealth Management Brand
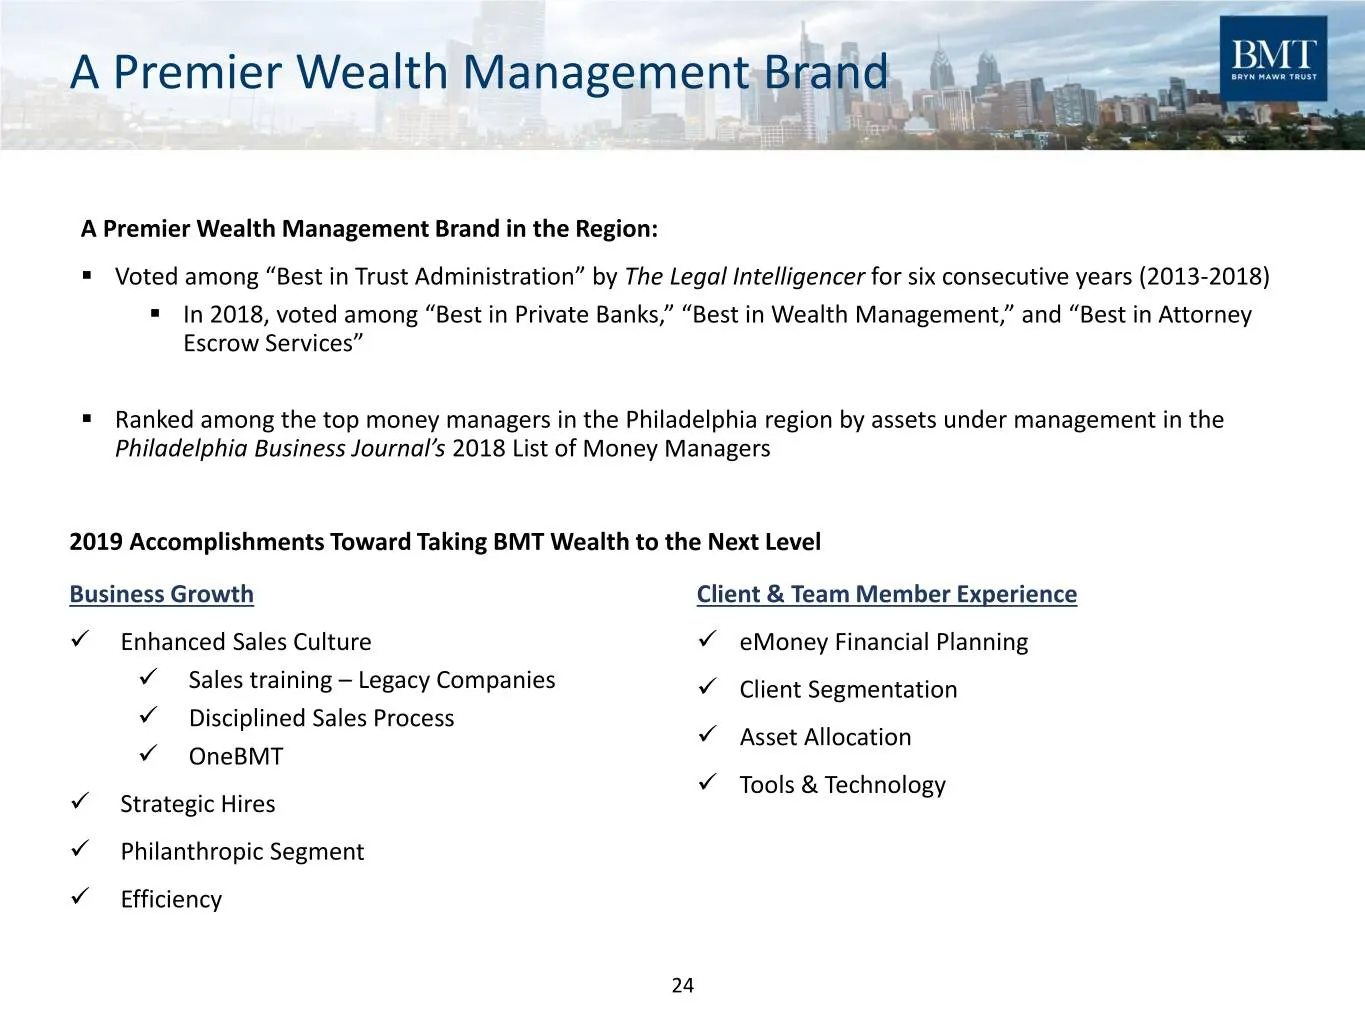
A Premier Wealth Management Brand A Premier Wealth Management Brand in the Region: ▪ Voted among “Best in Trust Administration” by The Legal Intelligencer for six consecutive years (2013-2018) ▪ In 2018, voted among “Best in Private Banks,” “Best in Wealth Management,” and “Best in Attorney Escrow S
Slide 25: BMT Delaware: The Delaware Advantage
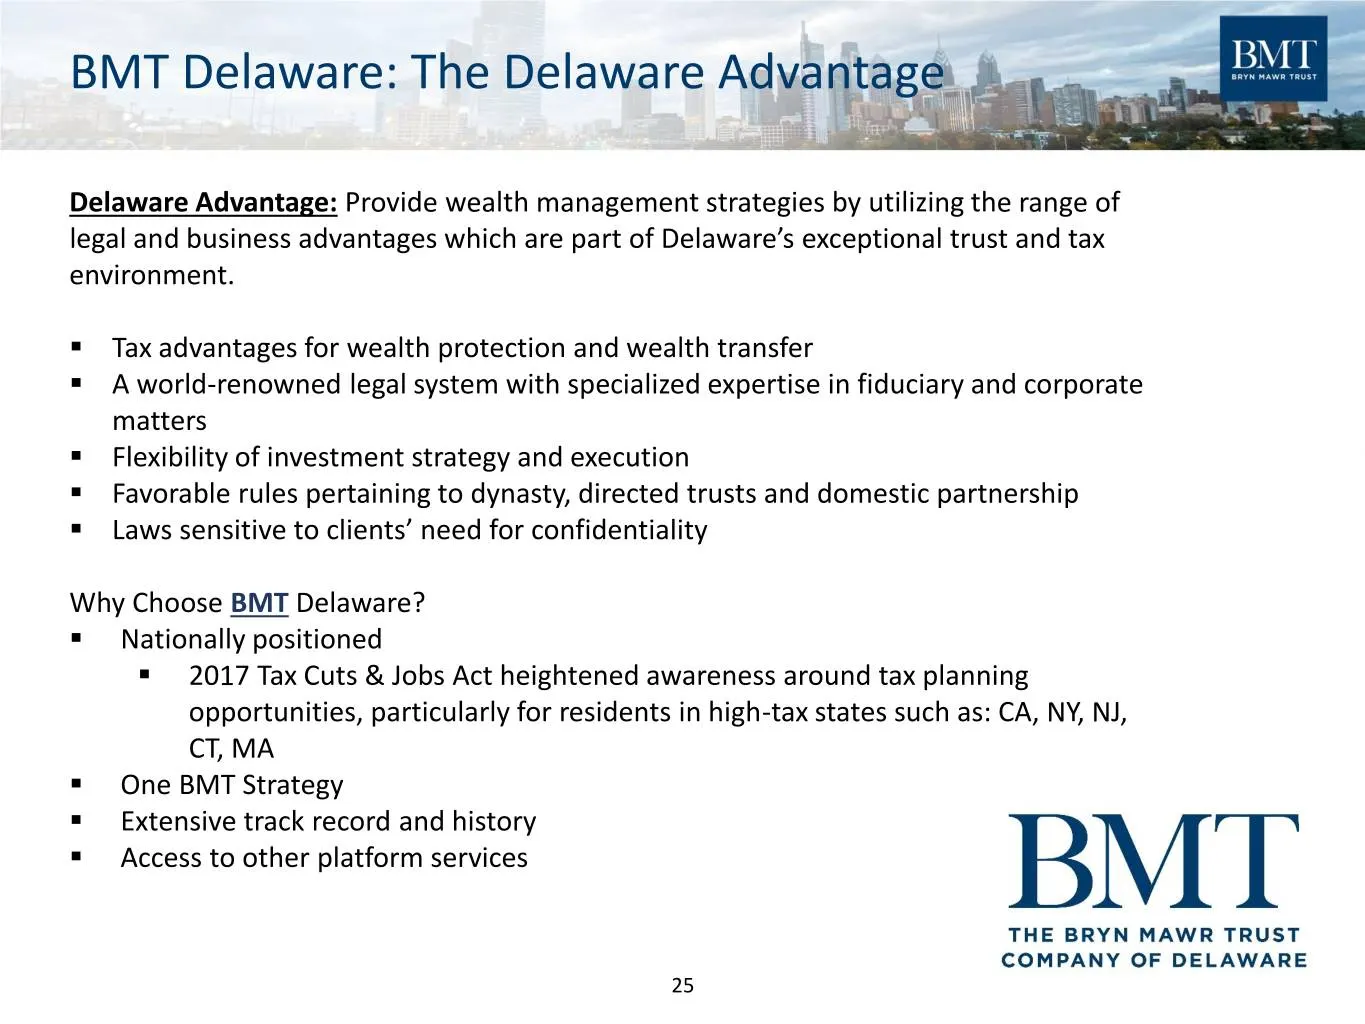
BMT Delaware: The Delaware Advantage Delaware Advantage: Provide wealth management strategies by utilizing the range of legal and business advantages which are part of Delaware’s exceptional trust and tax environment. ▪ Tax advantages for wealth protection and wealth transfer ▪ A world-renowned lega

Slide 26: Technology Strategy
Technology Strategy
Slide 27: Technology Strategy
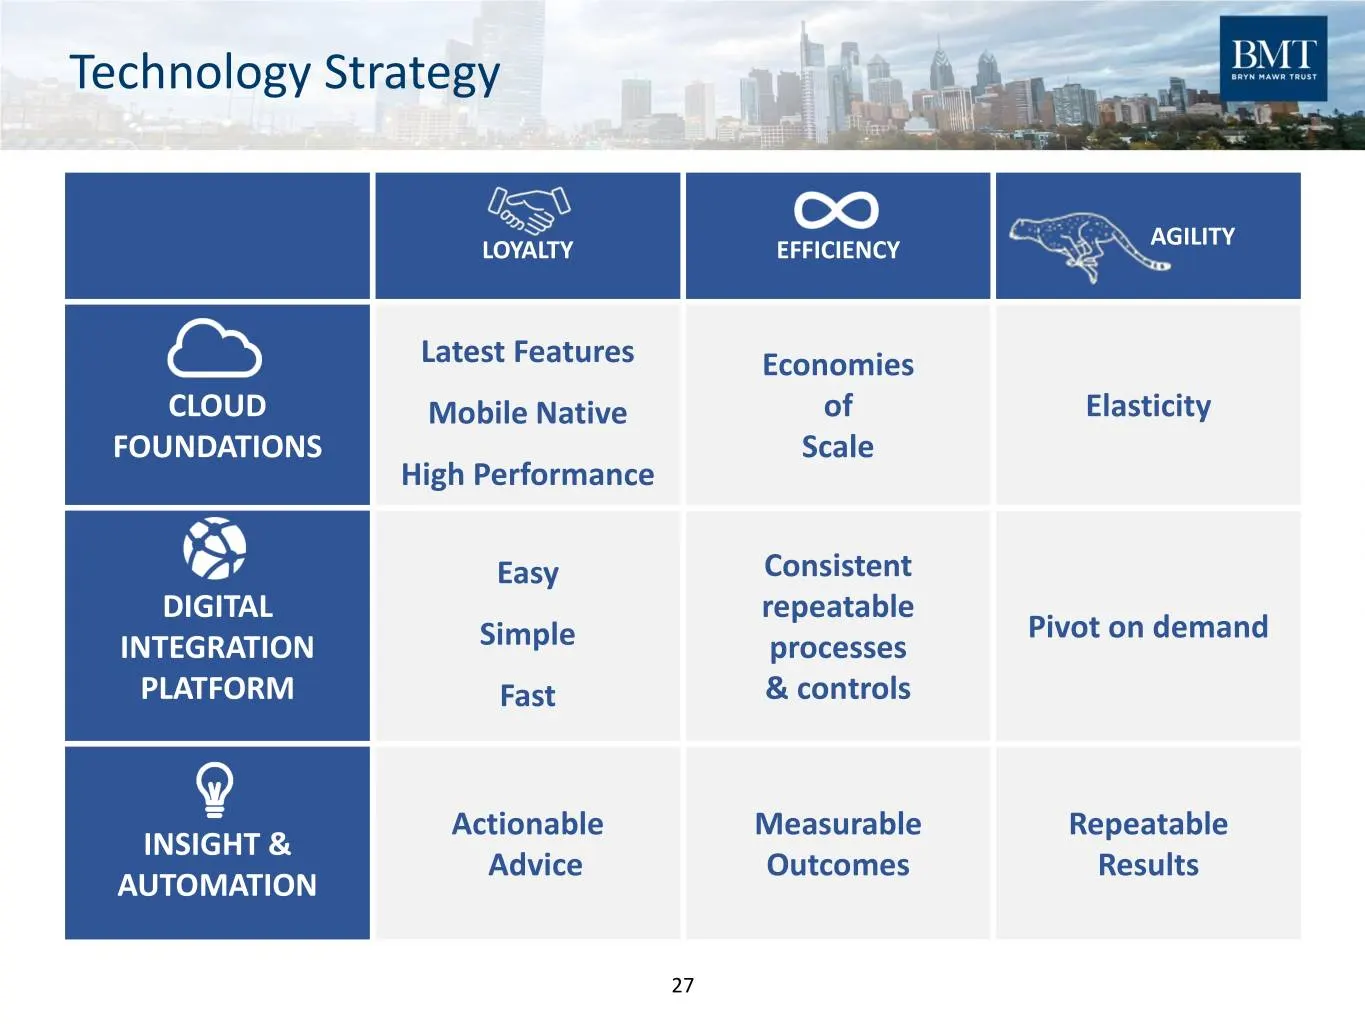
Technology Strategy AGILITY LOYALTY EFFICIENCY Latest Features Economies CLOUD Mobile Native of Elasticity FOUNDATIONS Scale High Performance Easy Consistent DIGITAL repeatable Pivot on demand INTEGRATION Simple processes PLATFORM Fast & controls Actionable Measurable Repeatable INSIGHT & Advice Out
Slide 28: Financial Outlook
Financial Outlook eo Fi “BRYN | AWR TRUST WerOWn Radu vu Shane
Slide 29: Financial Recap – Q4 and Full Year 2019
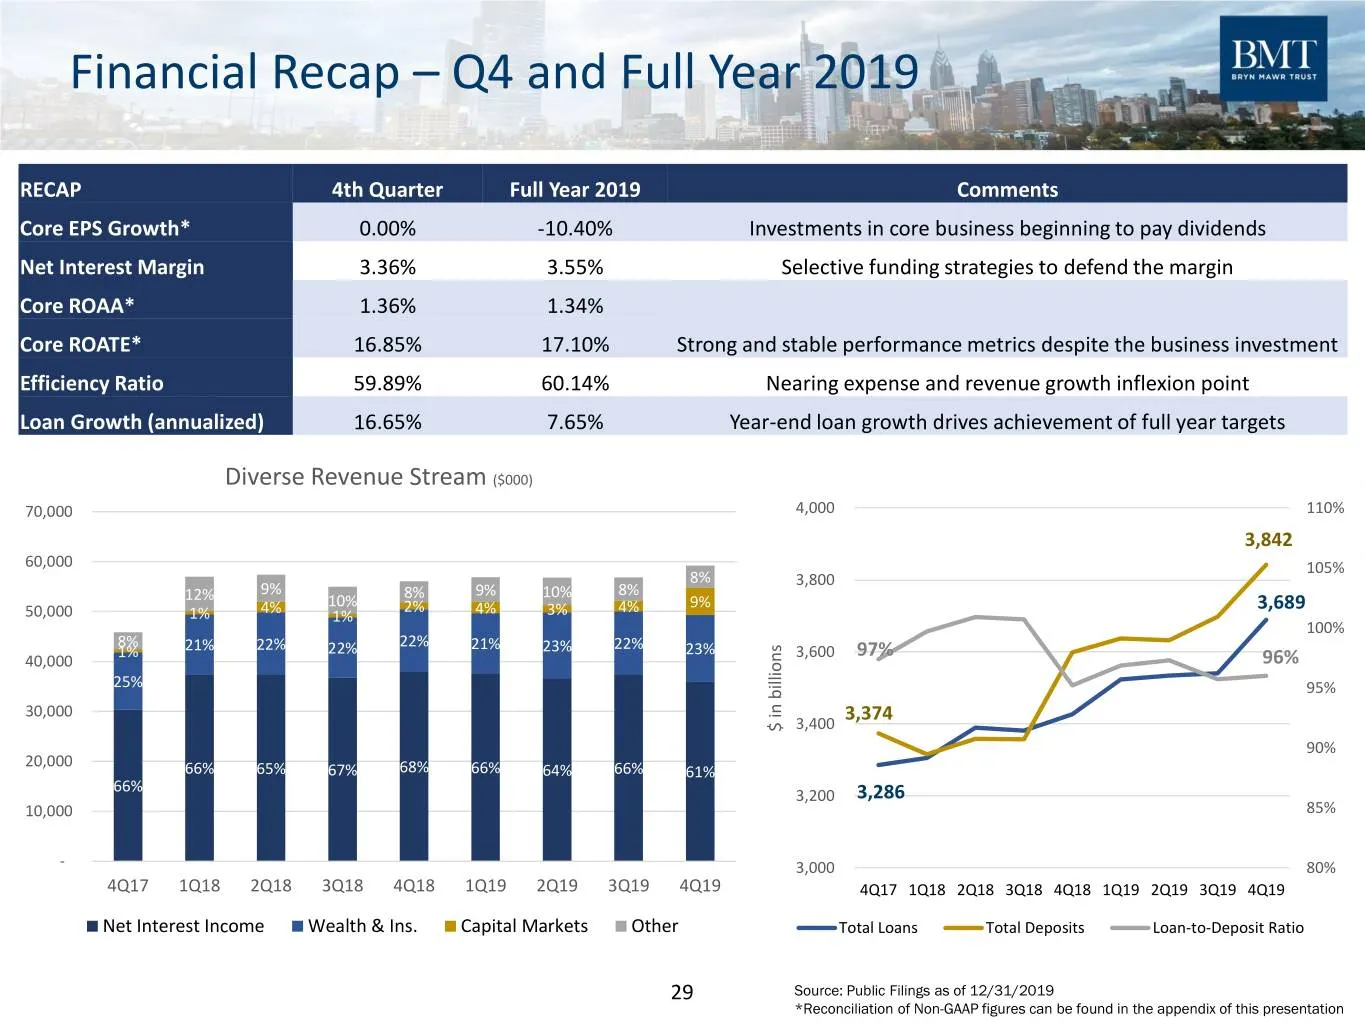
Financial Recap – Q4 and Full Year 2019 RECAP 4th Quarter Full Year 2019 Comments Core EPS Growth* 0.00% -10.40% Investments in core business beginning to pay dividends Net Interest Margin 3.36% 3.55% Selective funding strategies to defend the margin Core ROAA* 1.36% 1.34% Core ROATE* 16.85% 17.10%
Slide 30: Enhancing Wealth Revenue Profile
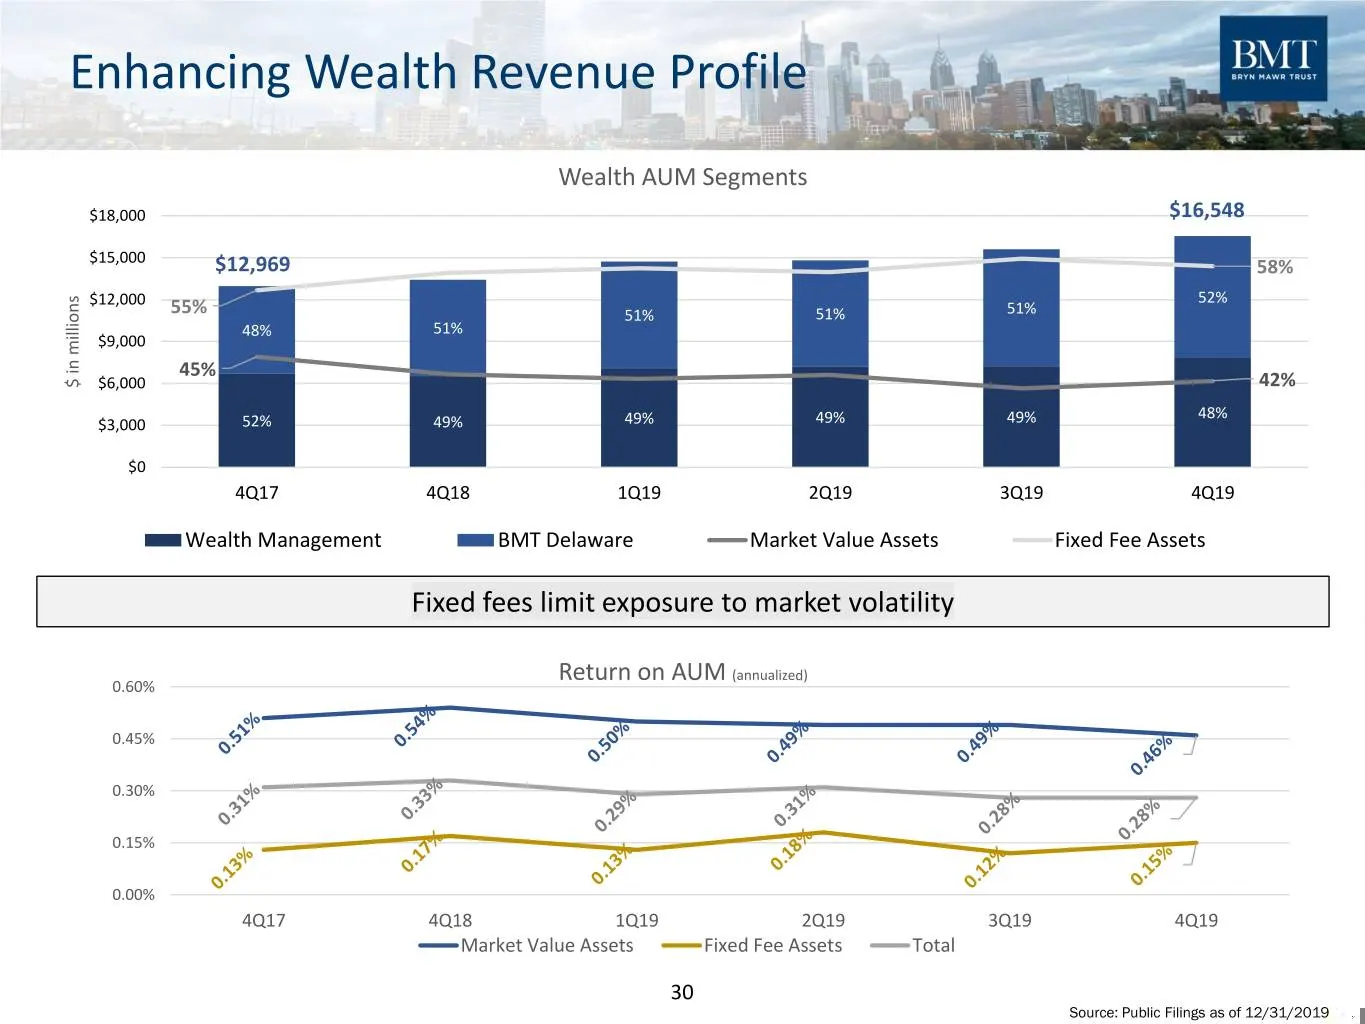
Enhancing Wealth Revenue Profile Wealth AUM Segments $18,000 $16,548 $15,000 $12,969 58% $12,000 52% 55% 51% 51% 51% 48% 51% $9,000 45% $ in $ millions $6,000 42% 48% $3,000 52% 49% 49% 49% 49% $0 4Q17 4Q18 1Q19 2Q19 3Q19 4Q19 Wealth Management BMT Delaware Market Value Assets Fixed Fee Assets Fixed
Slide 31: Financial Outlook – Strategy Drives Economics
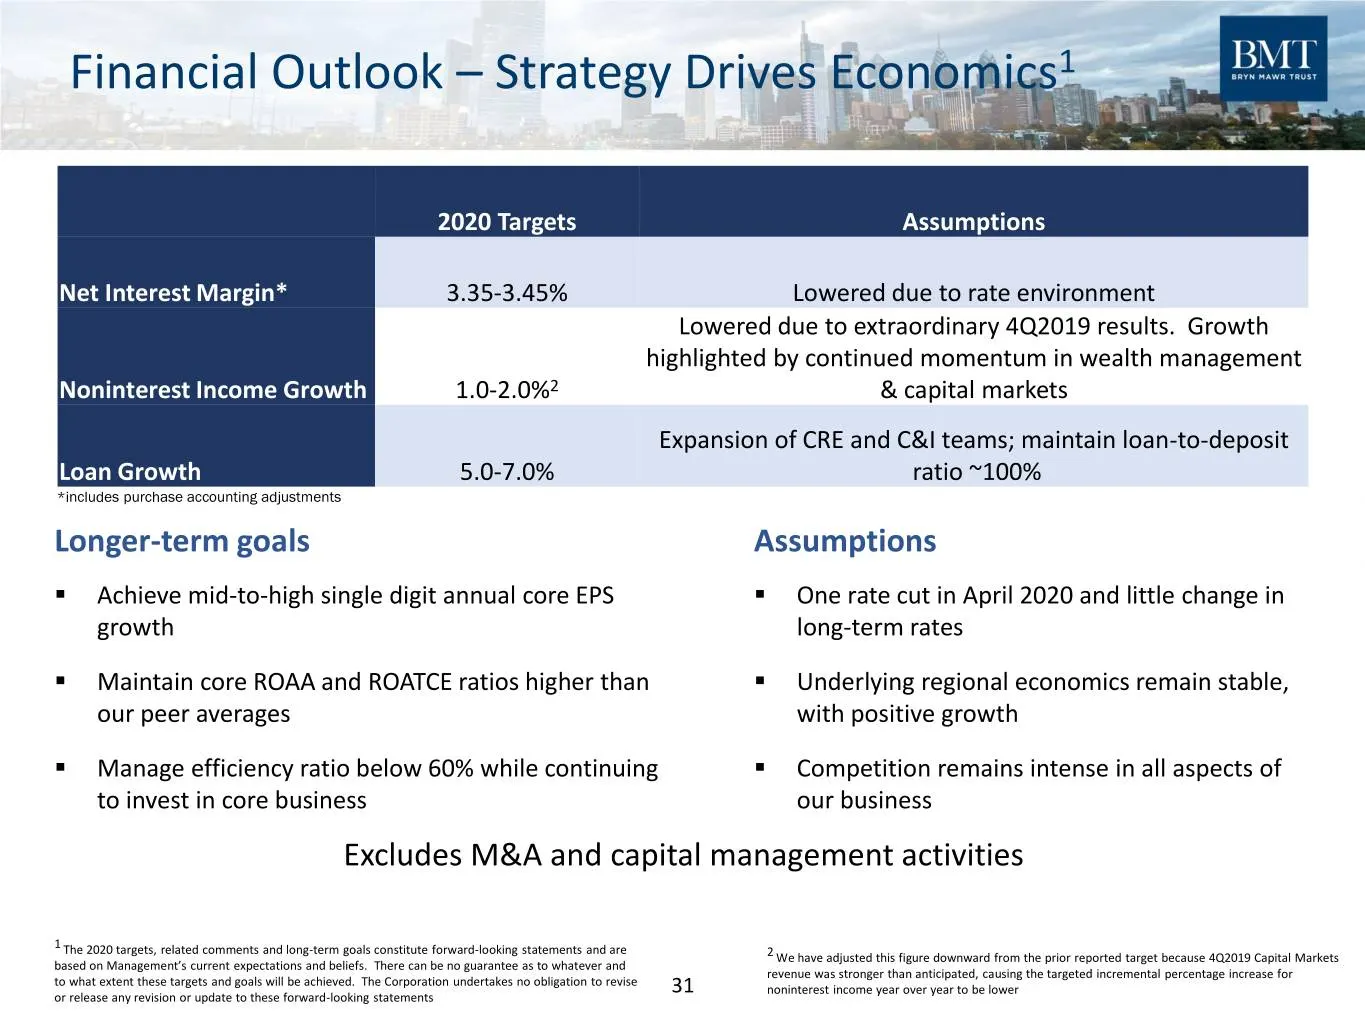
Financial Outlook – Strategy Drives Economics1 2020 Targets Assumptions Net Interest Margin* 3.35-3.45% Lowered due to rate environment Lowered due to extraordinary 4Q2019 results. Growth highlighted by continued momentum in wealth management Noninterest Income Growth 1.0-2.0%2 & capital markets Exp

Slide 32: Appendix
Appendix eo Fi “BRYN | AWR TRUST WerOWn Radu vu Shane
Slide 33: Statement on Non-GAAP Measures
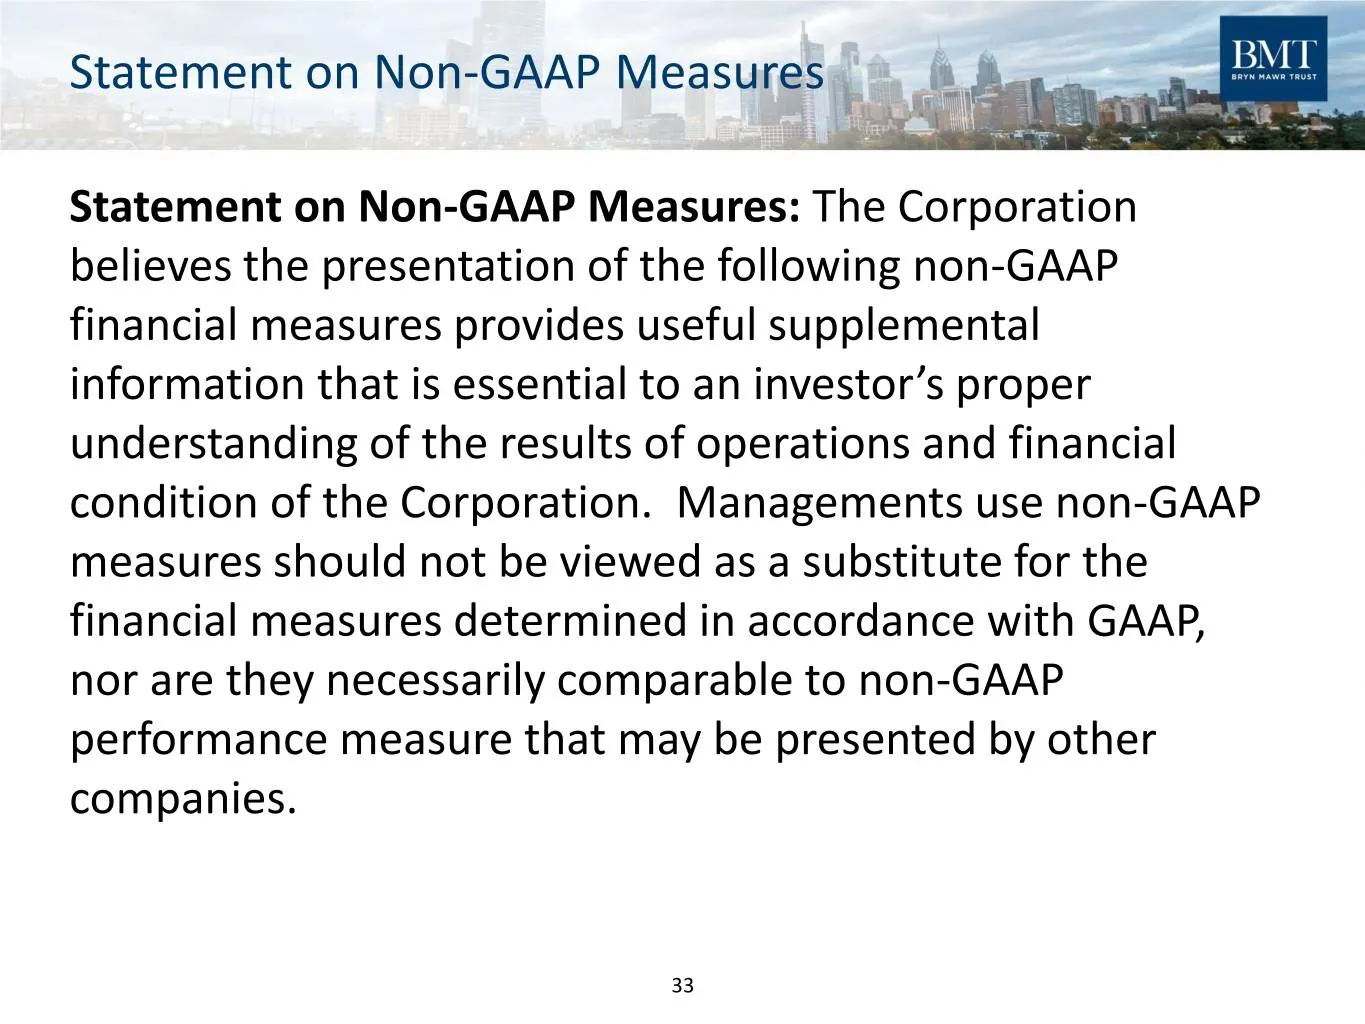
Statement on Non-GAAP Measures Statement on Non-GAAP Measures: The Corporation believes the presentation of the following non-GAAP financial measures provides useful supplemental information that is essential to an investor’s proper understanding of the results of operations and financial condition
Slide 34: Non-GAAP Reconciliation
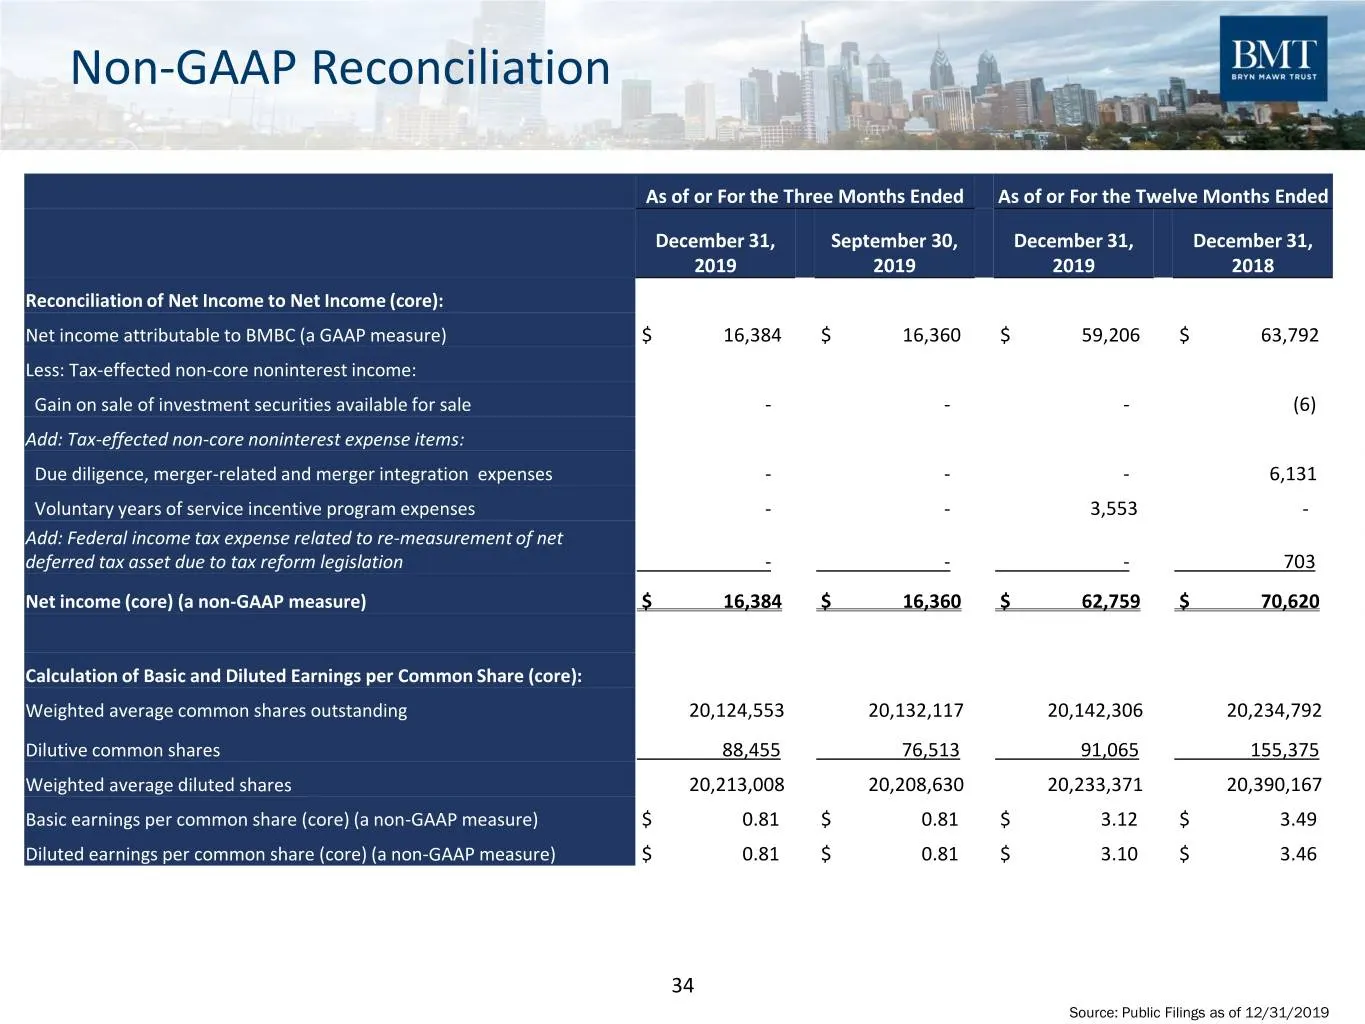
Non-GAAP Reconciliation As of or For the Three Months Ended As of or For the Twelve Months Ended December 31, September 30, December 31, December 31, 2019 2019 2019 2018 Reconciliation of Net Income to Net Income (core): Net income attributable to BMBC (a GAAP measure) $ 16,384 $ 16,360 $ 59,206 $ 6
Slide 35: Non-GAAP Reconciliation
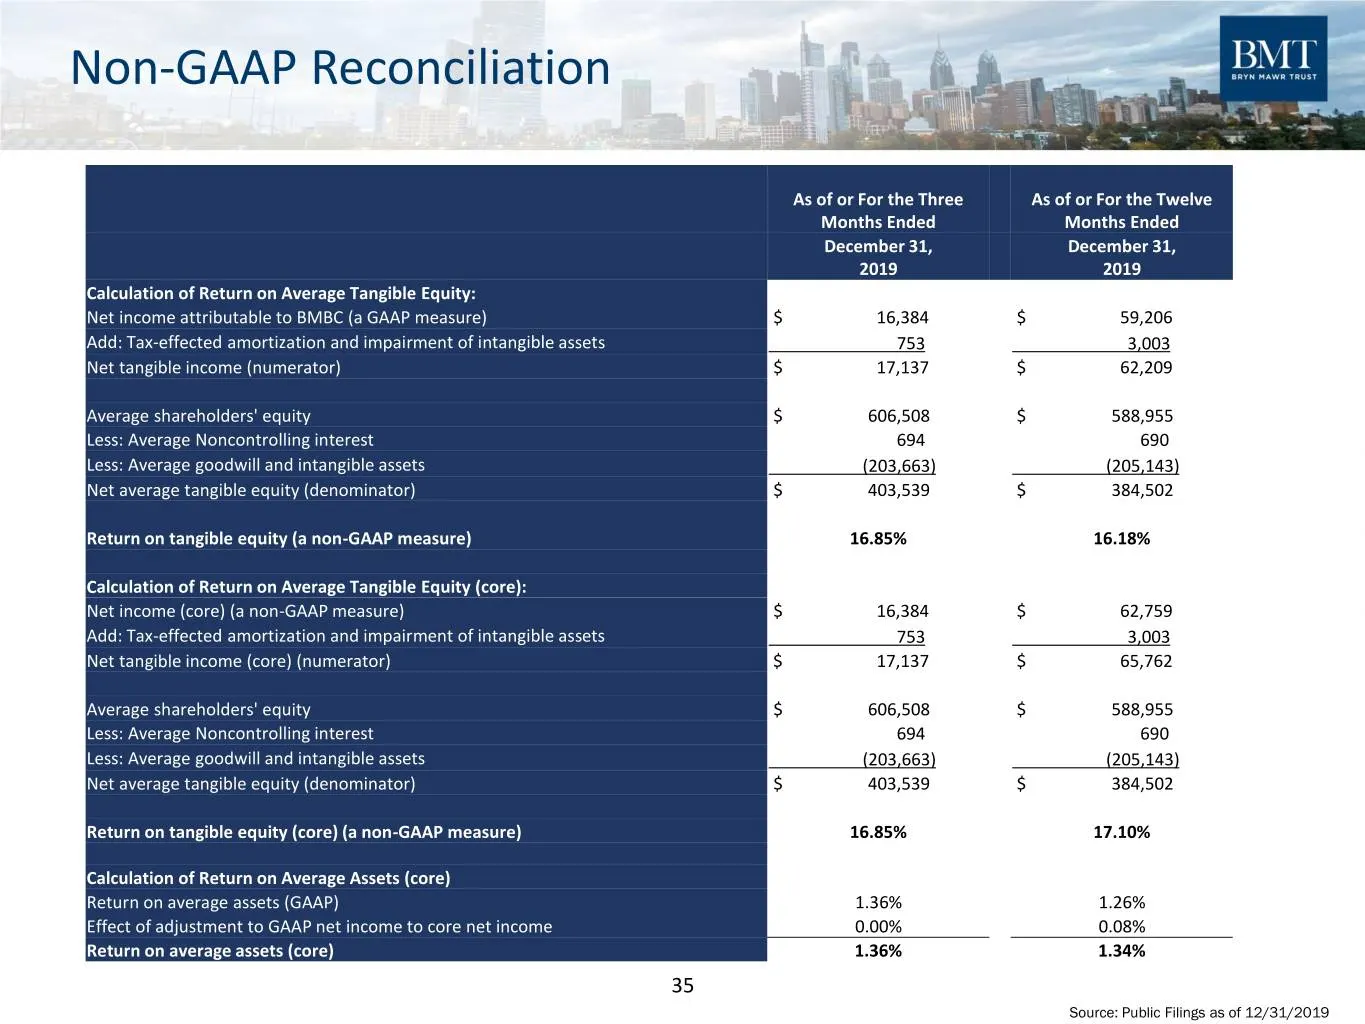
Non-GAAP Reconciliation As of or For the Three As of or For the Twelve Months Ended Months Ended December 31, December 31, 2019 2019 Calculation of Return on Average Tangible Equity: Net income attributable to BMBC (a GAAP measure) $ 16,384 $ 59,206 Add: Tax-effected amortization and impairment of i
Slide 36: 2019 Peer Group
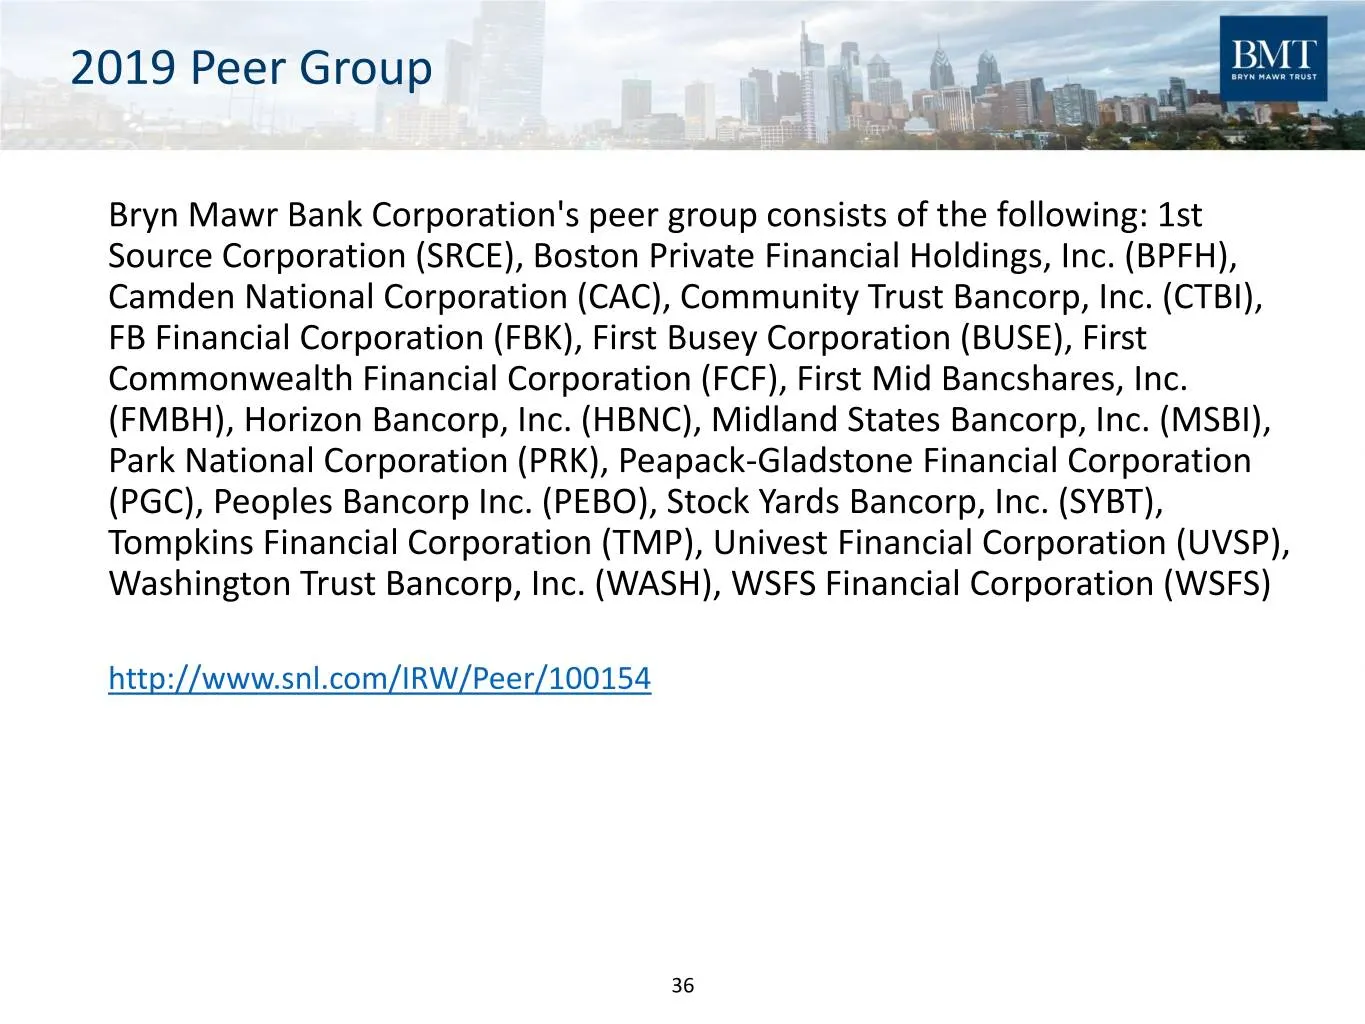
2019 Peer Group Bryn Mawr Bank Corporation's peer group consists of the following: 1st Source Corporation (SRCE), Boston Private Financial Holdings, Inc. (BPFH), Camden National Corporation (CAC), Community Trust Bancorp, Inc. (CTBI), FB Financial Corporation (FBK), First Busey Corporation (BUSE), F
Source: SEC EDGAR · 8-K filed Feb 12, 2020
More decks from Bryn Mawr Bank Corporation
 Merger or Acquisition (March 2021)20 slides · Mar 10, 2021
 Q4 2020 Earnings Presentation16 slides · Jan 22, 2021
 Q3 2020 Earnings Presentation14 slides · Oct 23, 2020
 Investor Presentation (September 2020)17 slides · Sep 21, 2020
 Q2 2020 Earnings Presentation14 slides · Jul 21, 2020
 Q1 2020 Earnings Presentation13 slides · Apr 21, 2020