Perion Network Ltd · NASDAQ:PERI
Perion Network — Q1 2022 Earnings Presentation
32 slides from Perion Network's earnings presentation, May 2022

Slide 1: IR Presentation May 2022
Perion IR Presentation May 2022
Slide 2: Forward Looking Statements
FORWARD LOOKING STATEMENTS This presentation and our remarks contain forward-looking statements (within the meaning of The Private Securities Litigation Reform Act of 1995) that involve substantial risks and uncertainties, including statements regarding our expectations and beliefs about our busines
Slide 3: Doron Gerstel, CEO and Maoz Sigron, CFO
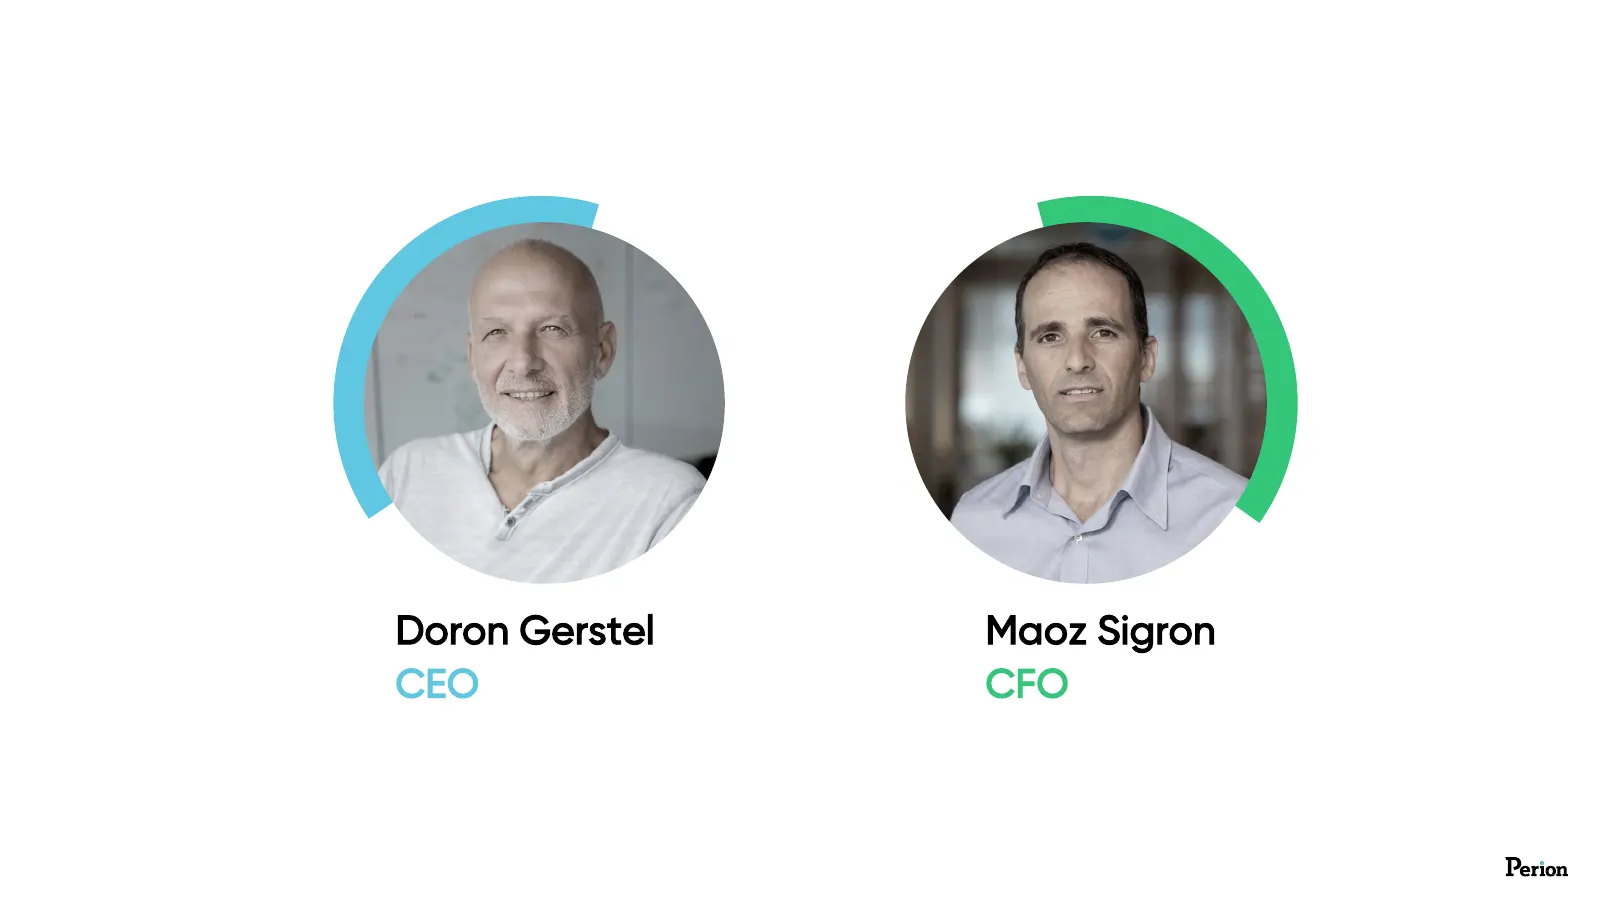
Doron Gerstel Maoz Sigron CEO CFO
Slide 4: Record revenue in Q1 2022
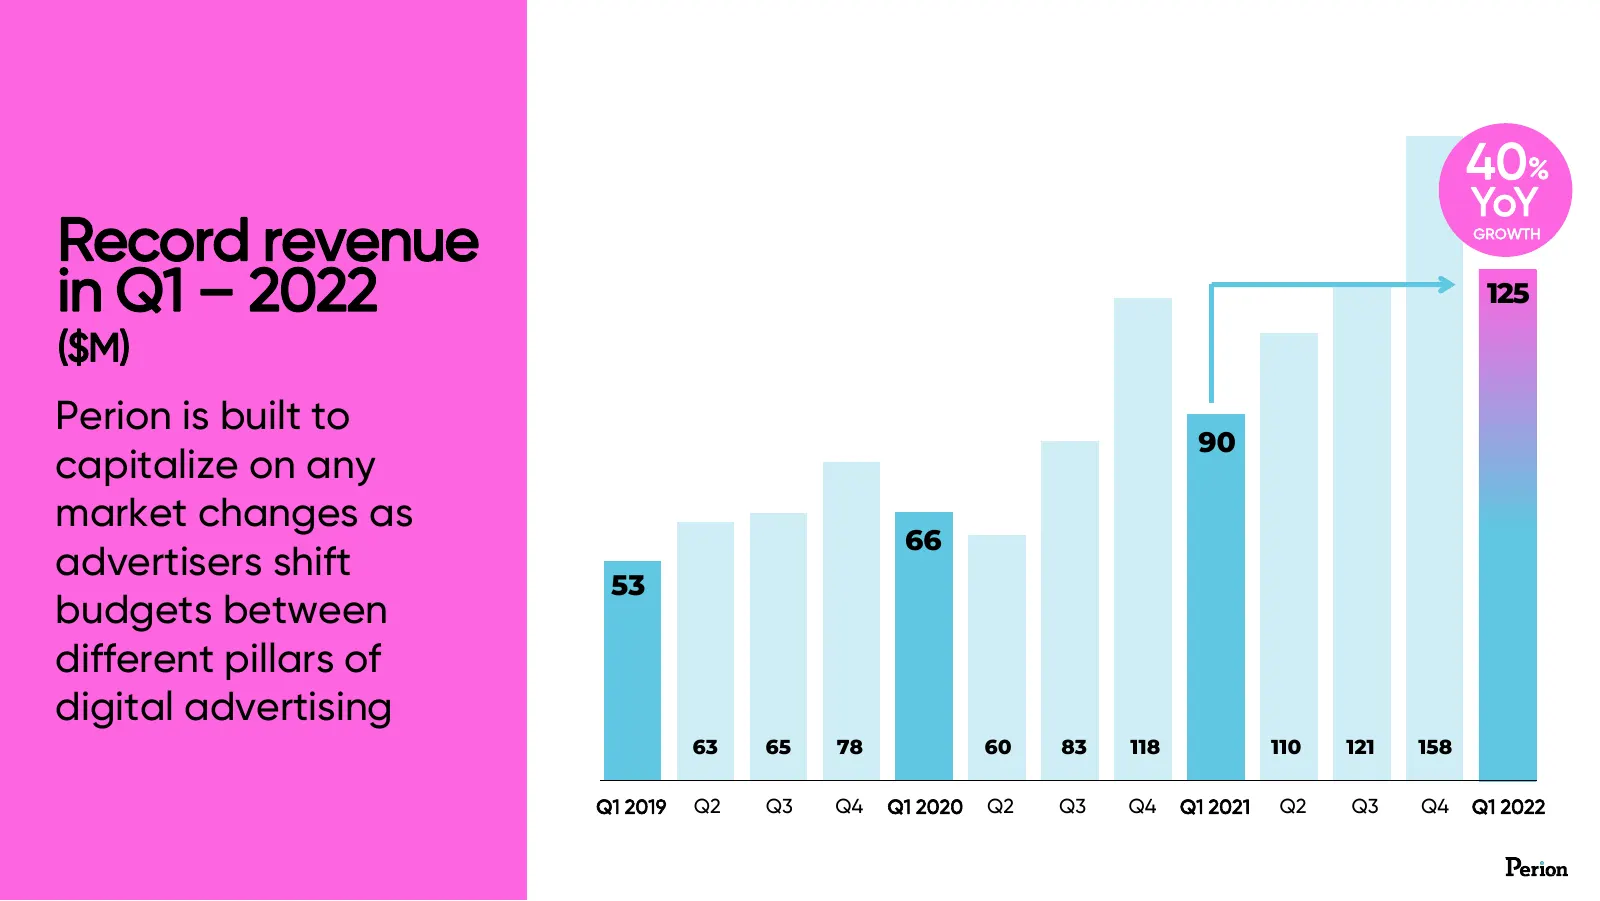
40% YoY Record revenue GROWTH in Q1 – 2022 125 ($M) Perion is built to 90 capitalize on any market changes as 66 advertisers shift 53 budgets between different pillars of digital advertising 63 65 78 60 83 118 110 121 158 Q1 2019 Q2 Q3 Q4 Q1 2020 Q2 Q3 Q4 Q1 2021 Q2 Q3 Q4 Q1 2022
Slide 5: Our diversification model in action
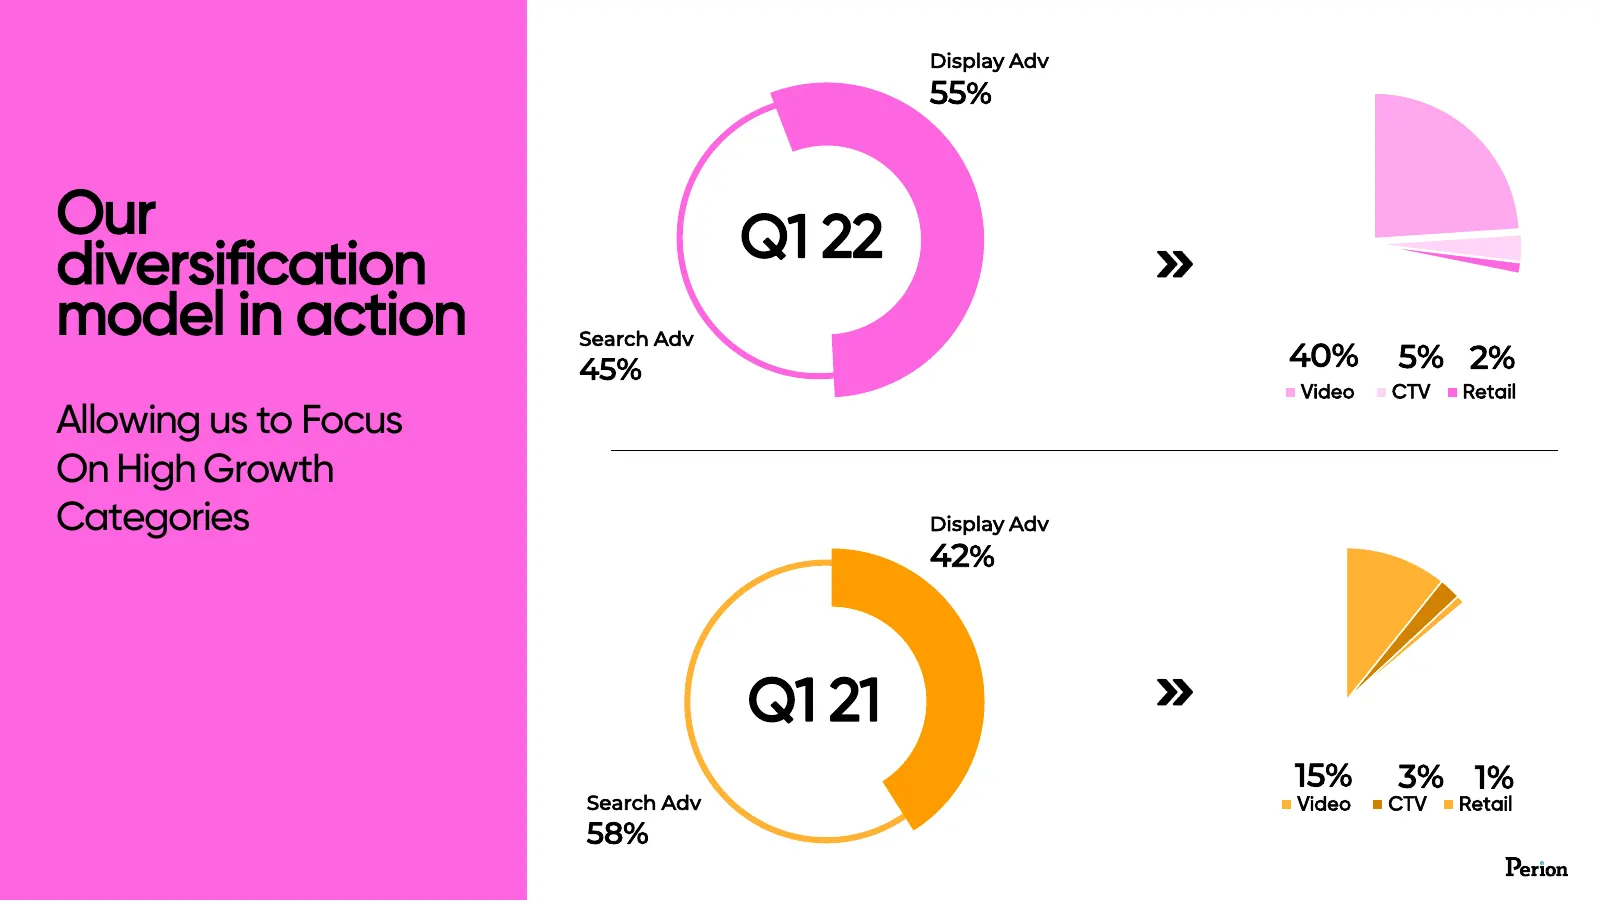
Display Adv 55% Our Q1 22 diversification model in action Search Adv 45% 40% 5% 2% Video CTV Retail Allowing us to Focus On High Growth Categories Display Adv 42% Q1 21 15% 3% 1% Search Adv Video CTV Retail 58%
Slide 6: Perion continues to outperform
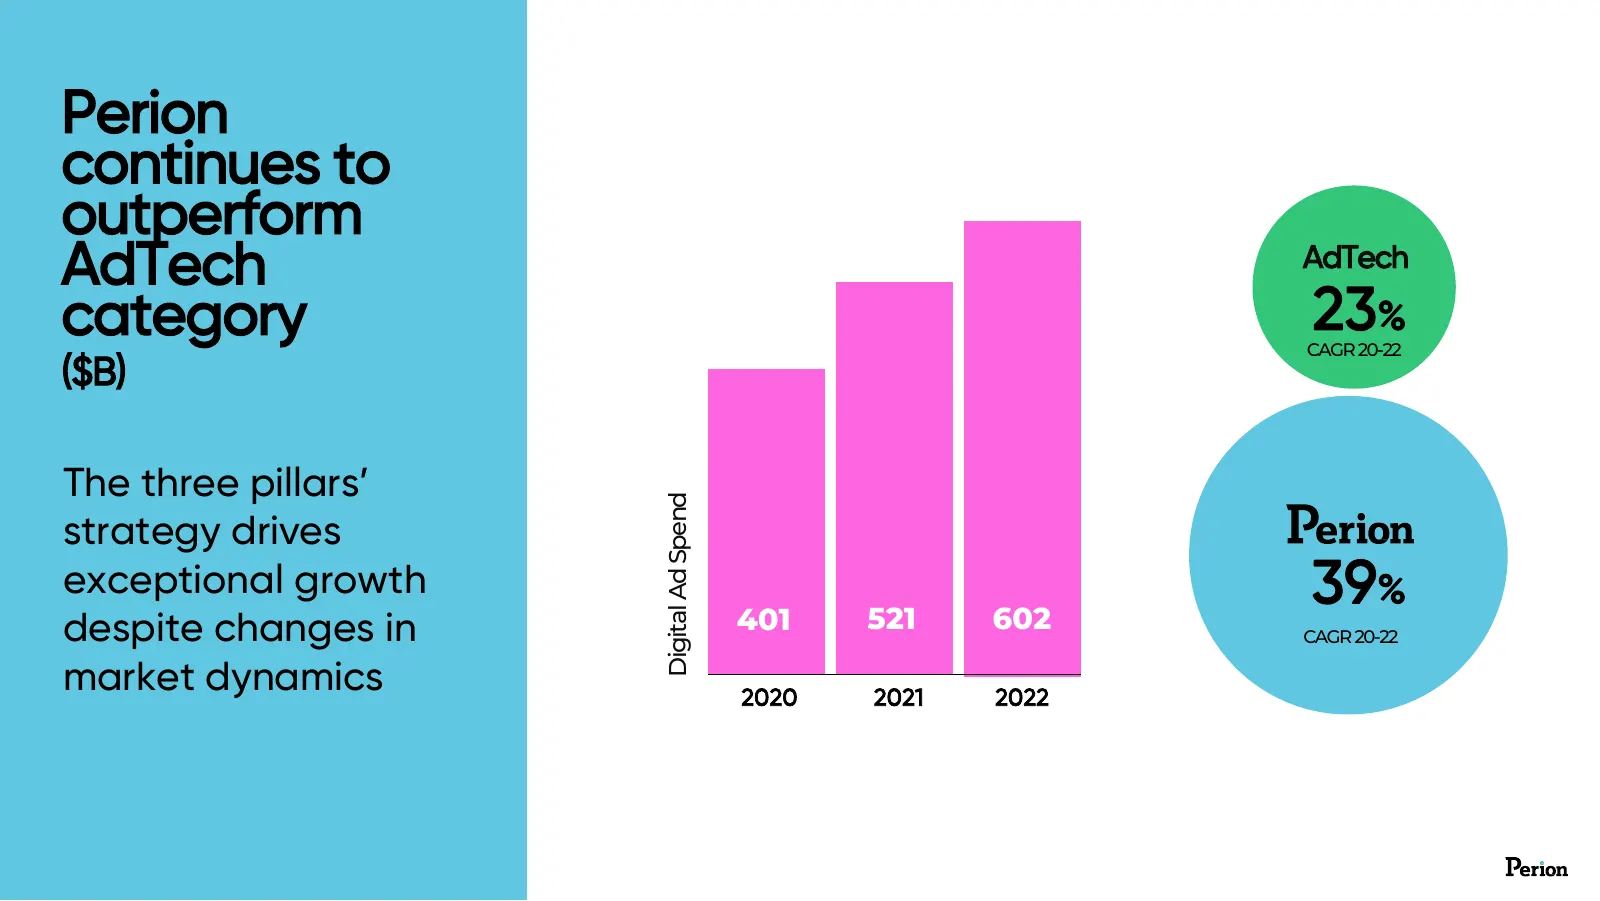
Perion continues to outperform AdTech AdTech category 23% CAGR 20-22 ($B) The three pillars’ Digital Ad Spend strategy drives exceptional growth 401 521 602 39% despite changes in CAGR 20-22 market dynamics 2020 2021 2022
Slide 7: Record EBITDA margin
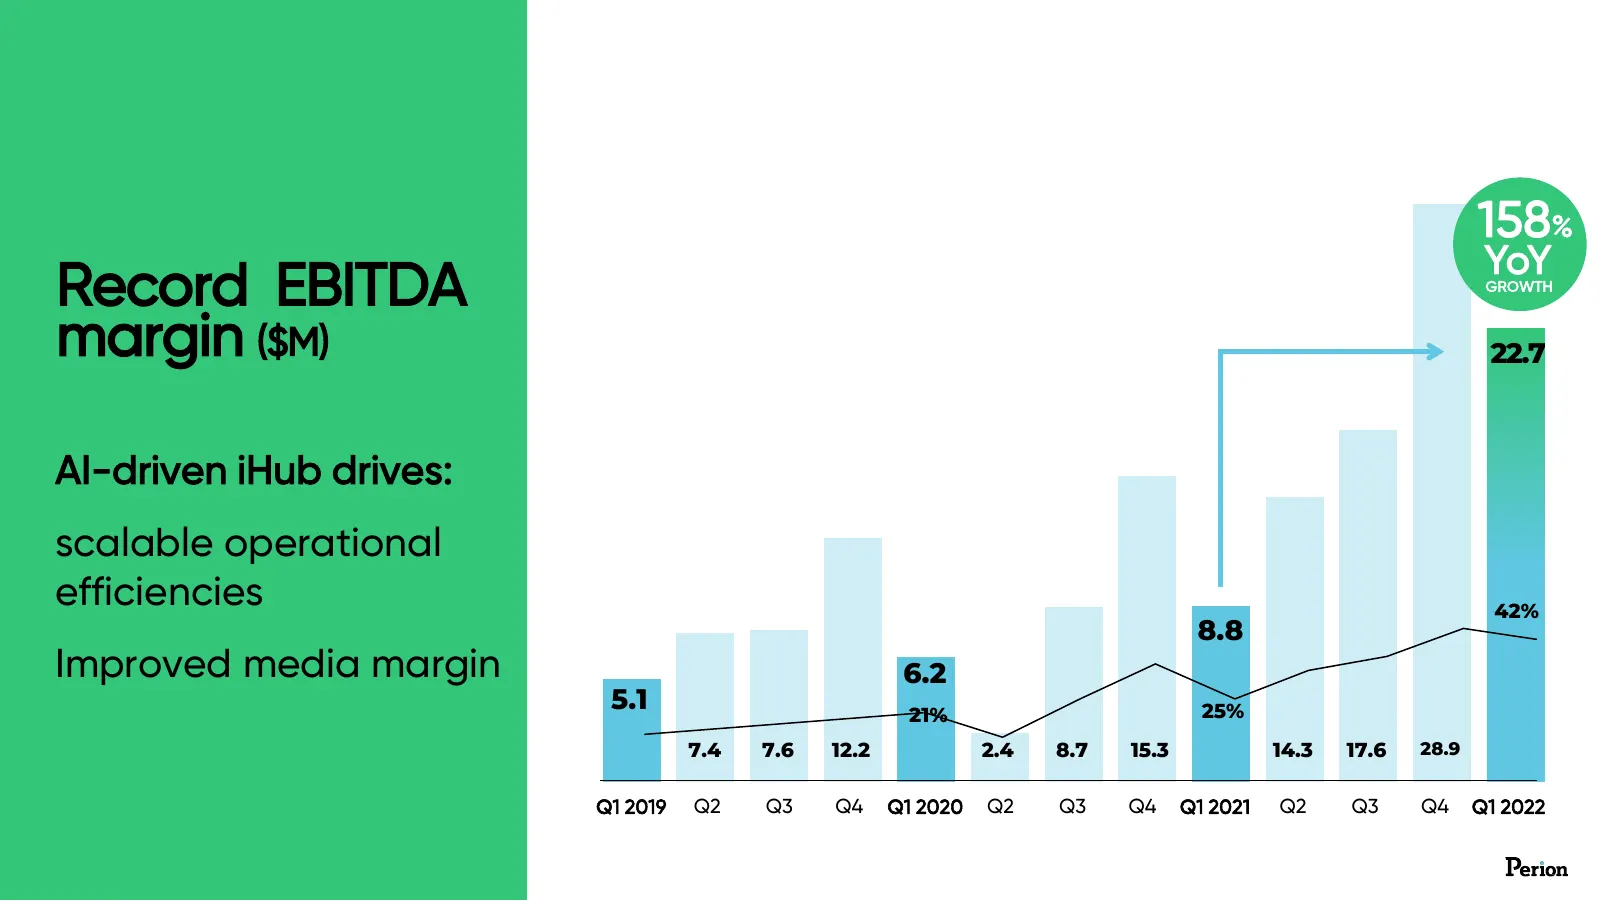
158% YoY Record EBITDA GROWTH margin ($M) 22.7 AI-driven iHub drives: scalable operational efficiencies 42% 8.8 Improved media margin 6.2 5.1 21% 25% 7.4 7.6 12.2 2.4 8.7 15.3 14.3 17.6 28.9 Q1 2019 Q2 Q3 Q4 Q1 2020 Q2 Q3 Q4 Q1 2021 Q2 Q3 Q4 Q1 2022
Slide 8: 3D Diversified Business Strategy
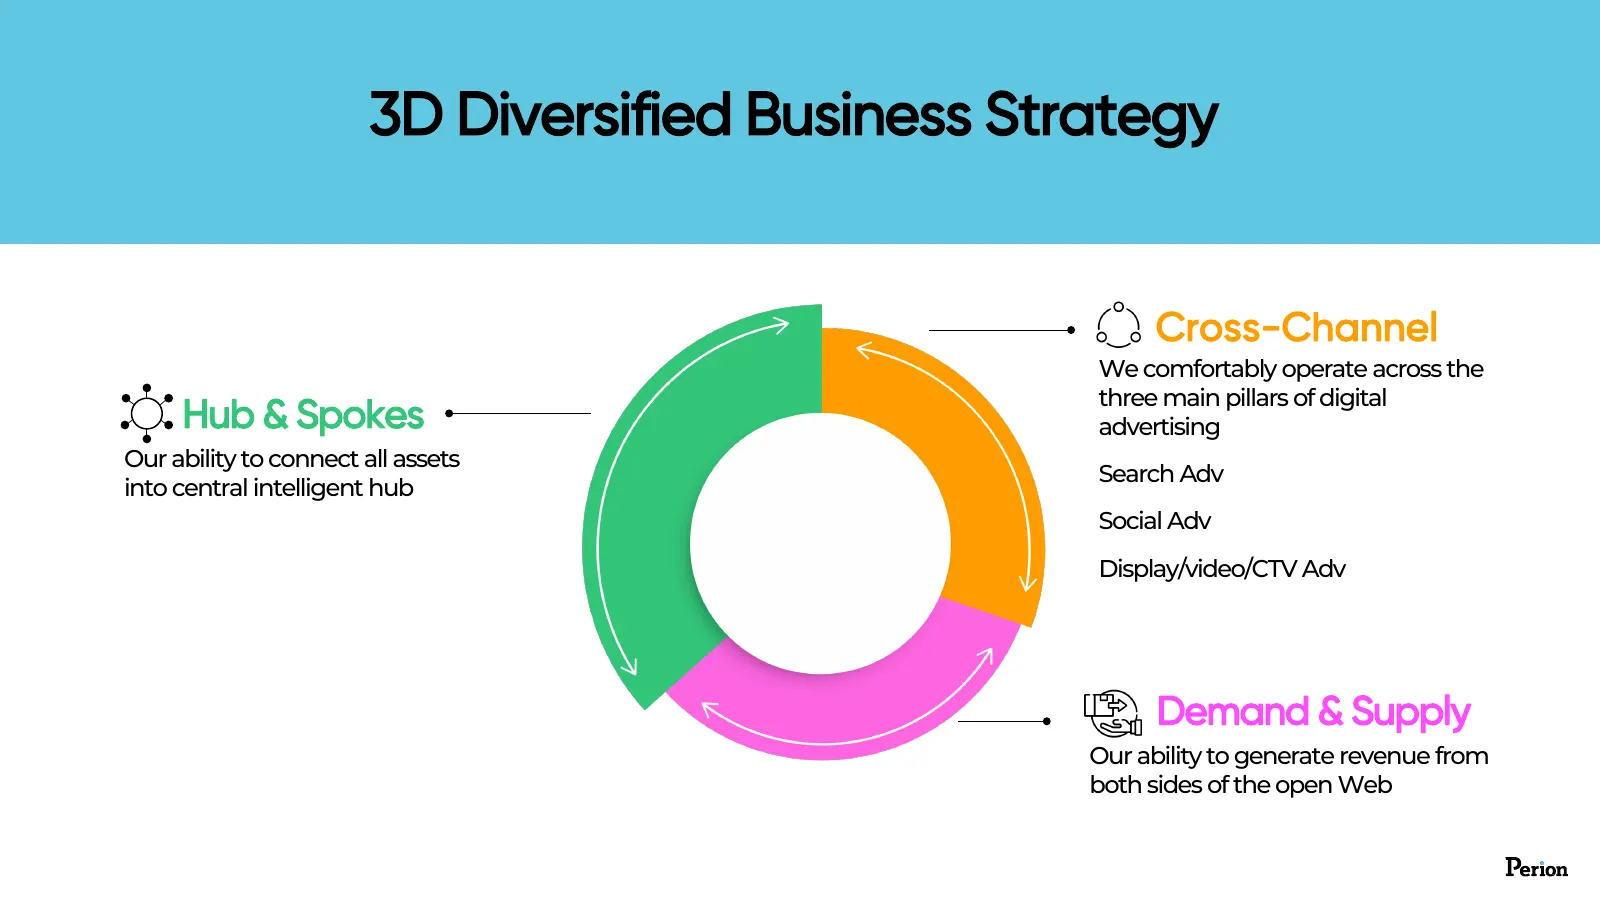
3D Diversified Business Strategy Cross-Channel We comfortably operate across the three main pillars of digital Hub & Spokes advertising Our ability to connect all assets Search Adv into central intelligent hub Social Adv Display/video/CTV Adv Demand & Supply Our ability to generate revenue from both
Slide 9: Connecting Perion's Assets To Our iHub
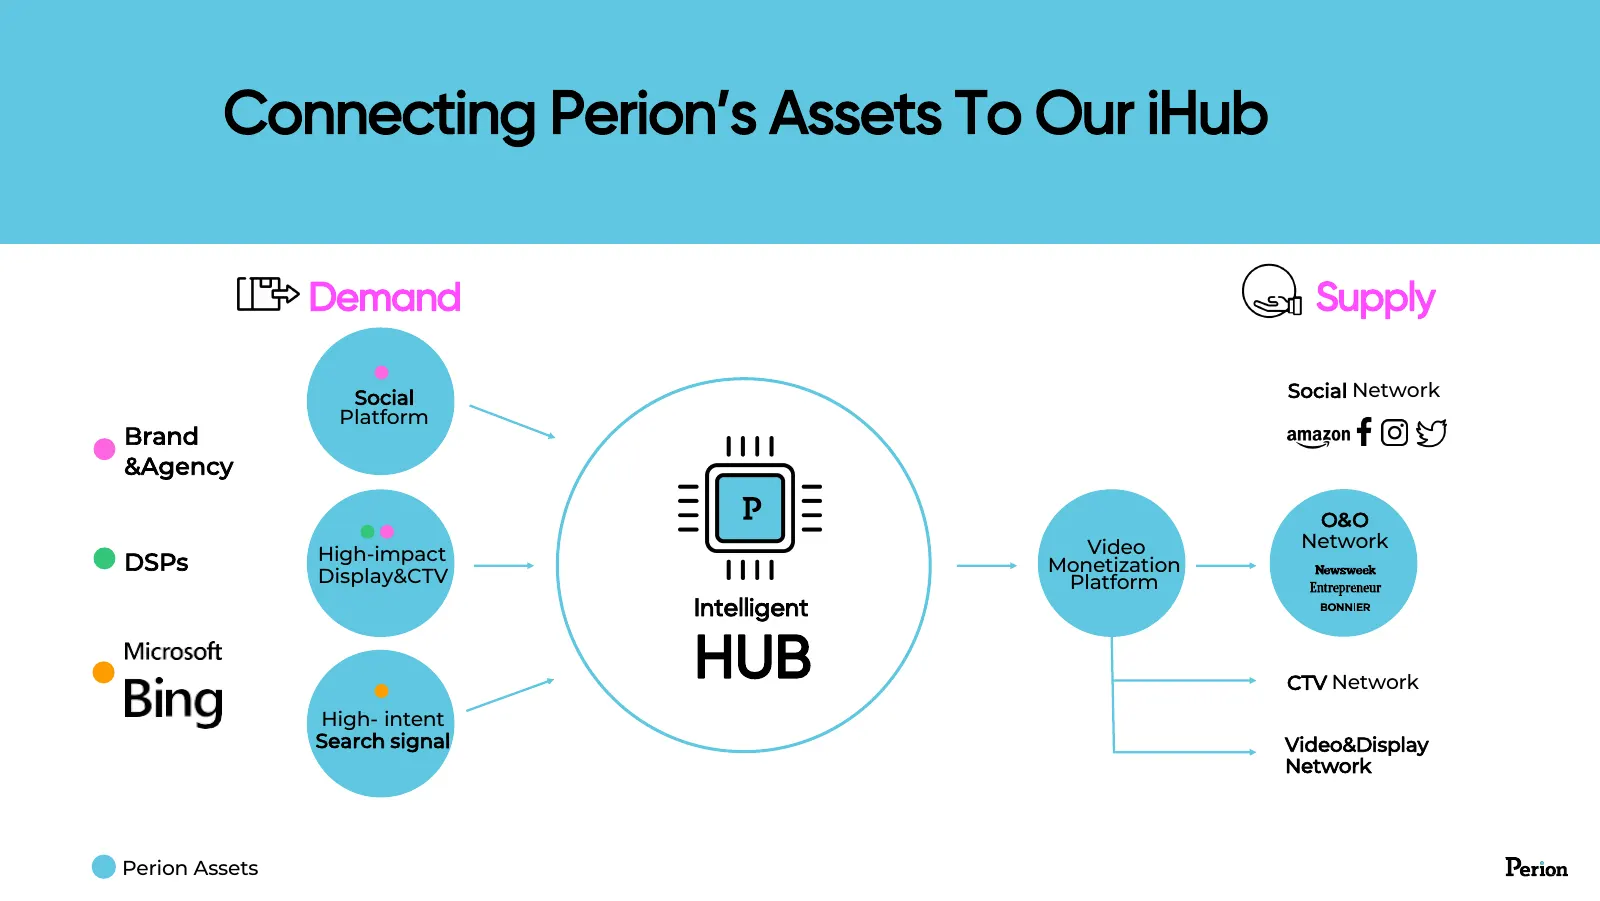
Connecting Perion’s Assets To Our iHub Demand Supply Social Social Network Platform Brand &Agency O&O Video Network DSPs High-impact Monetization Display&CTV Platform Intelligent HUB CTV Network High- intent Search signal Video&Display Network Perion Assets
Slide 10: iHub Benefits
Increased Customer value Reduced operational cost iHub Benefits Reduced media cost
Slide 11: Privacy First Cookieless Patented Technology
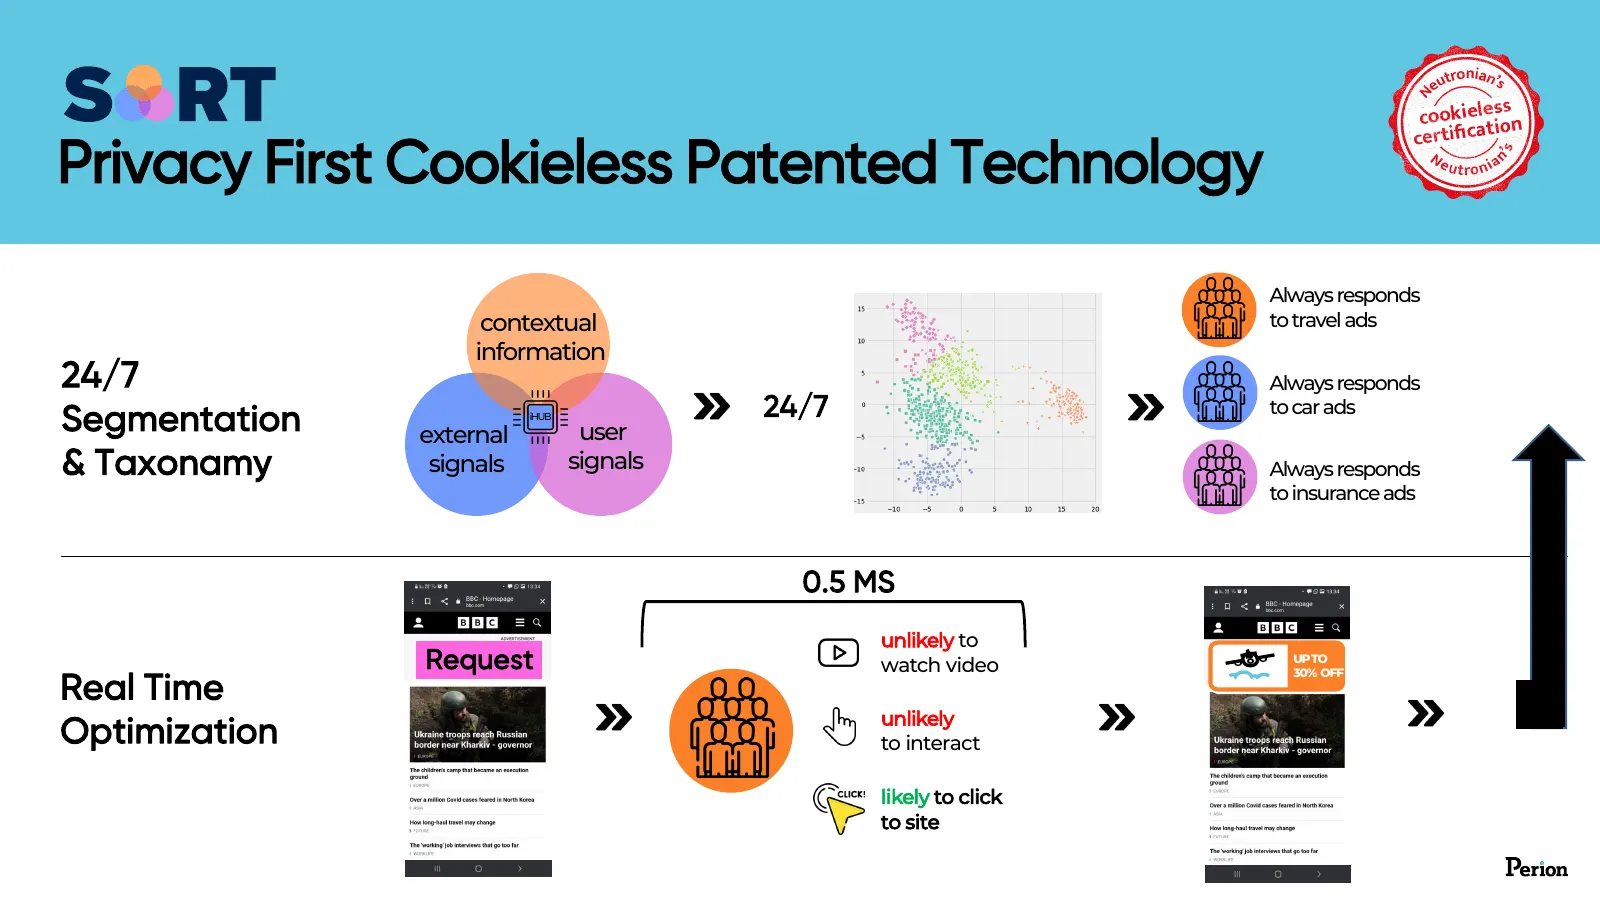
Privacy First Cookieless Patented Technology Always responds contextual to travel ads information 24/7 Always responds Segmentation iHUB 24/7 to car ads external user & Taxonamy signals signals Always responds to insurance ads 0.5 MS unlikely to Request watch video UP TO Real Time 30% OFF unlikely O
Slide 12: Patented Technology
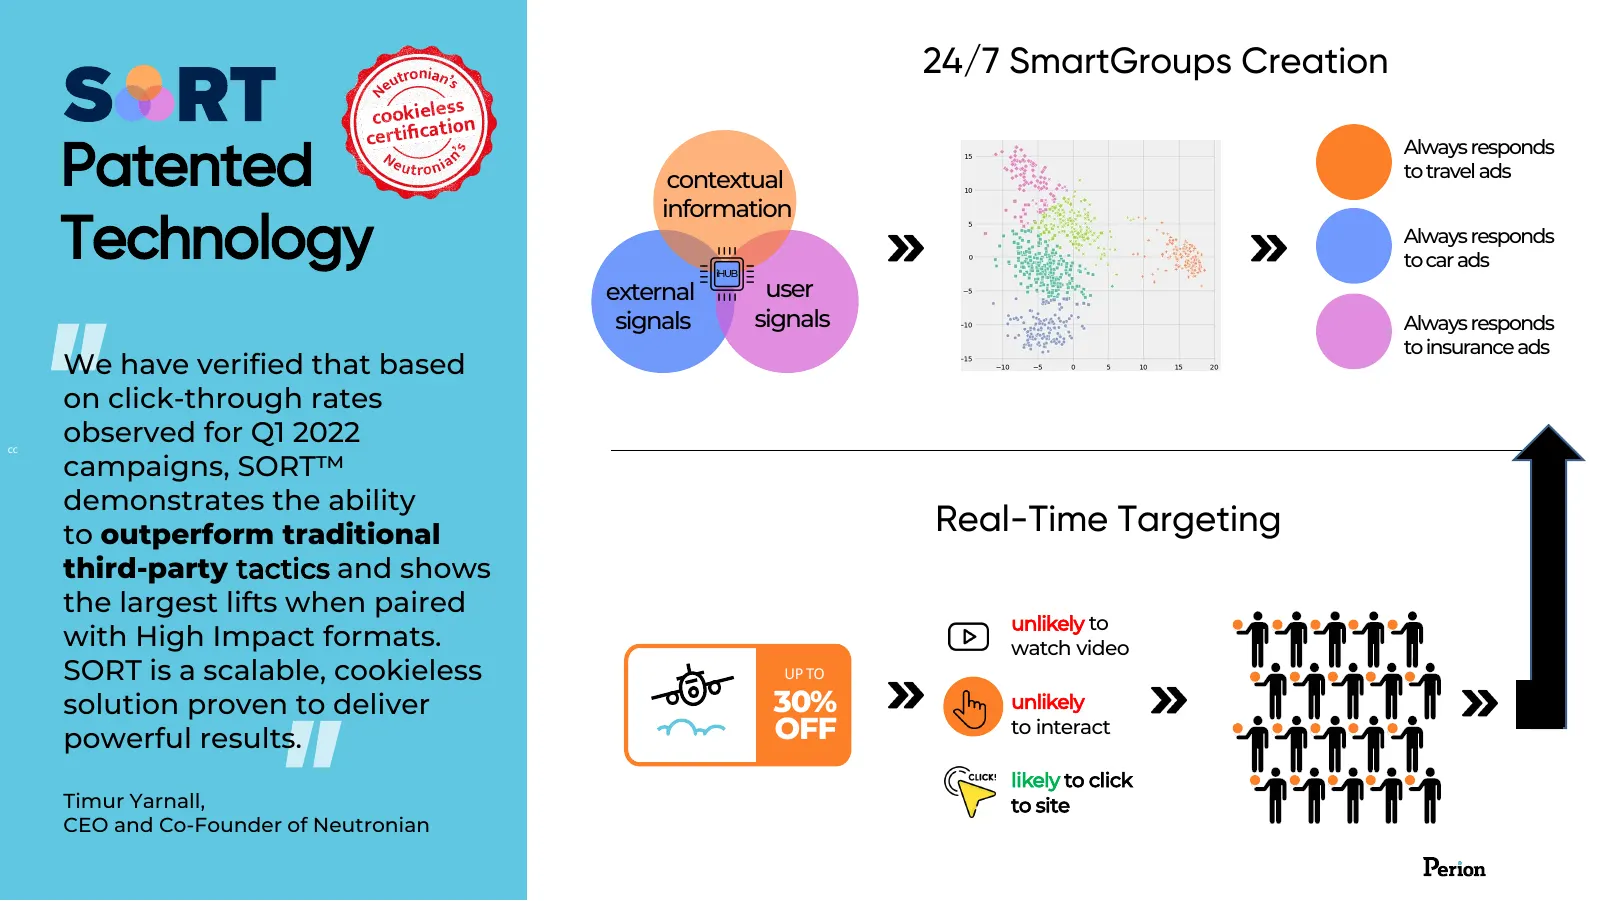
24/7 SmartGroups Creation Patented Always responds contextual to travel ads information Technology iHUB Always responds to car ads external user signals signals Always responds to insurance ads We have verified that based on click-through rates cc observed for Q1 2022 campaigns, SORT™ demonstrates t

Slide 13: Now Advertisers Have a Choice! Privacy and yet...Better Performance
Now Advertisers Have a Choice! Privacy and yet...Better Performance Delivered 40% towards new audiences SORT vs. 3rd Party Cookies on cookie-free browsers 106% 38% Lift in Page Lift in Brand Grabber CTR Reveal CTR 60% 35% Lift in Page Grabber Lift in Brand Reveal Interaction Rate Interaction Rate “U
Slide 14: Cookie Free Safety – FIRST Solution
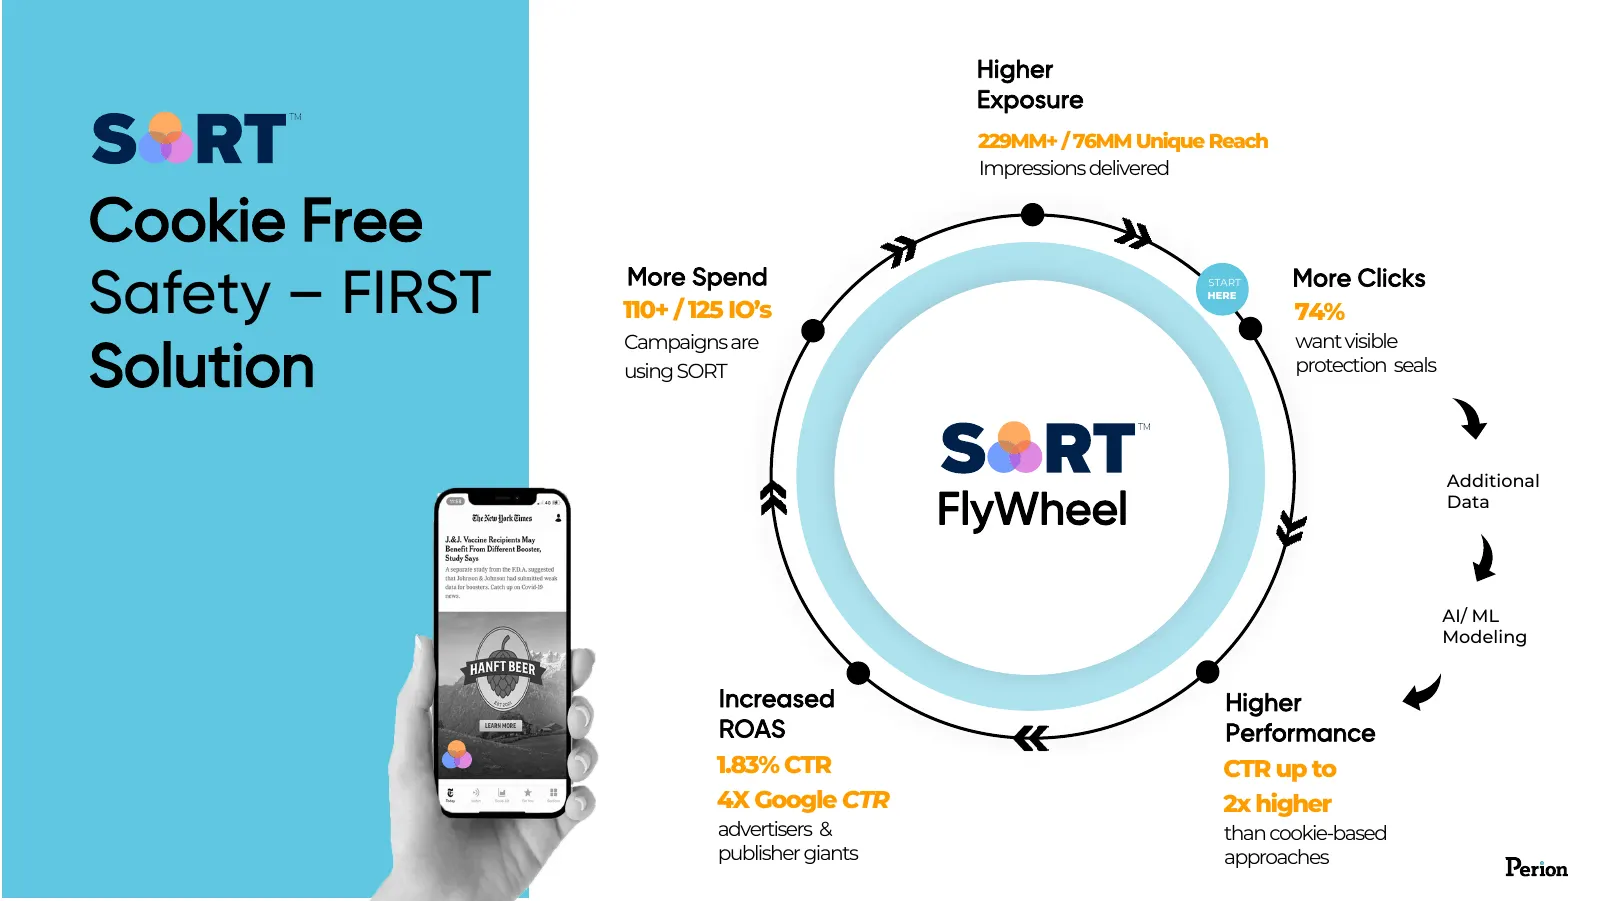
Higher Exposure 229MM+ / 76MM Unique Reach Impressions delivered Cookie Free Safety – FIRST More Spend 110+ / 125 IO’s START HERE More Clicks 74% want visible Solution Campaigns are using SORT protection seals Additional FlyWheel Data AI/ ML Modeling Increased Higher ROAS Performance 1.83% CTR CTR u
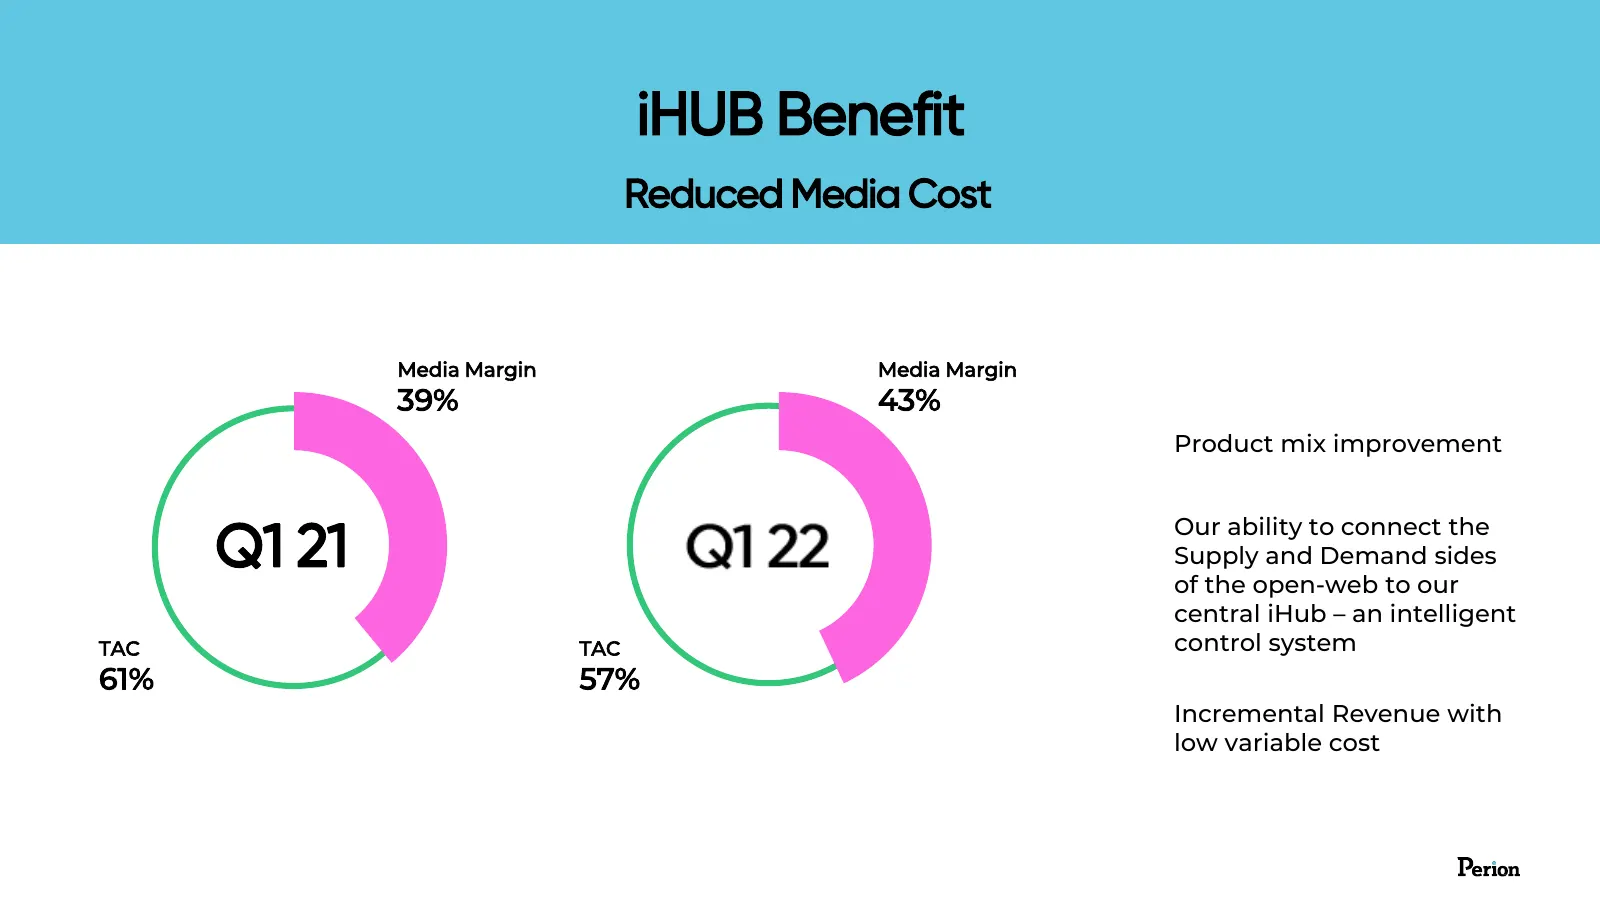
Slide 15: iHUB Benefit: Reduced Media Cost
iHUB Benefit Reduced Media Cost Media Margin Media Margin 39% 43% Product mix improvement Q1 21 Q1 21 Our ability to connect the Supply and Demand sides of the open-web to our central iHub – an intelligent TAC TAC control system 61% 57% Incremental Revenue with low variable cost
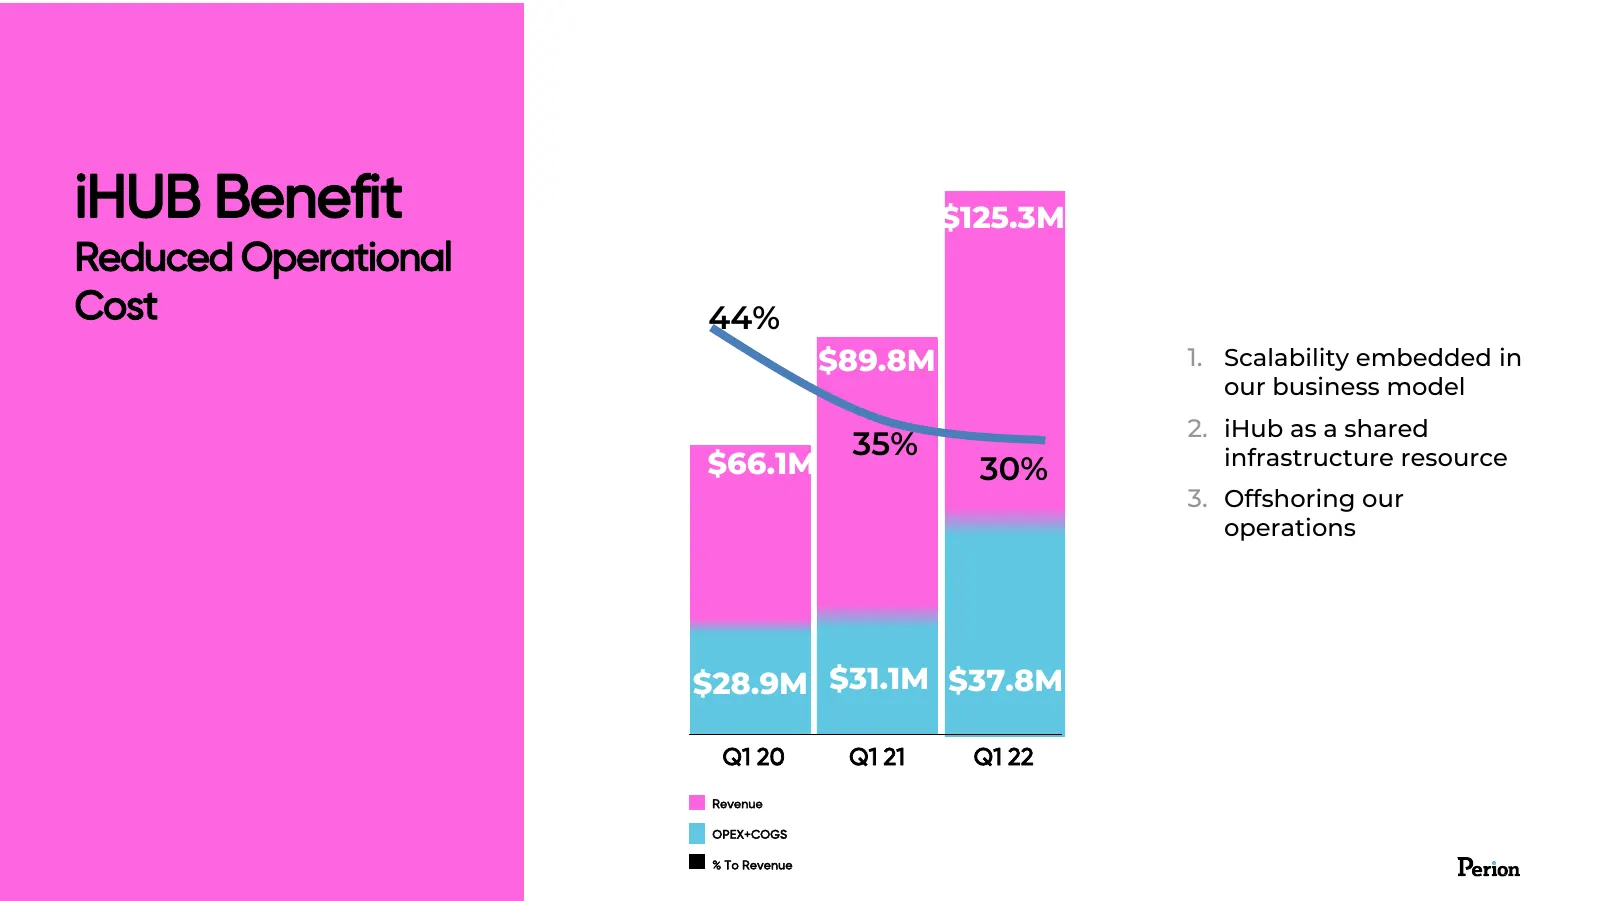
Slide 16: iHUB Benefit: Reduced Operational Cost
iHUB Benefit $66.1M $125.3M Reduced Operational Cost 44% $89.8M 1. Scalability embedded in our business model 2. iHub as a shared 35% infrastructure resource $66.1M 30% 3. Offshoring our operations $28.9M $31.1M $37.8M Q1 20 Q1 21 Q1 22 Revenue OPEX+COGS $26M % To Revenue
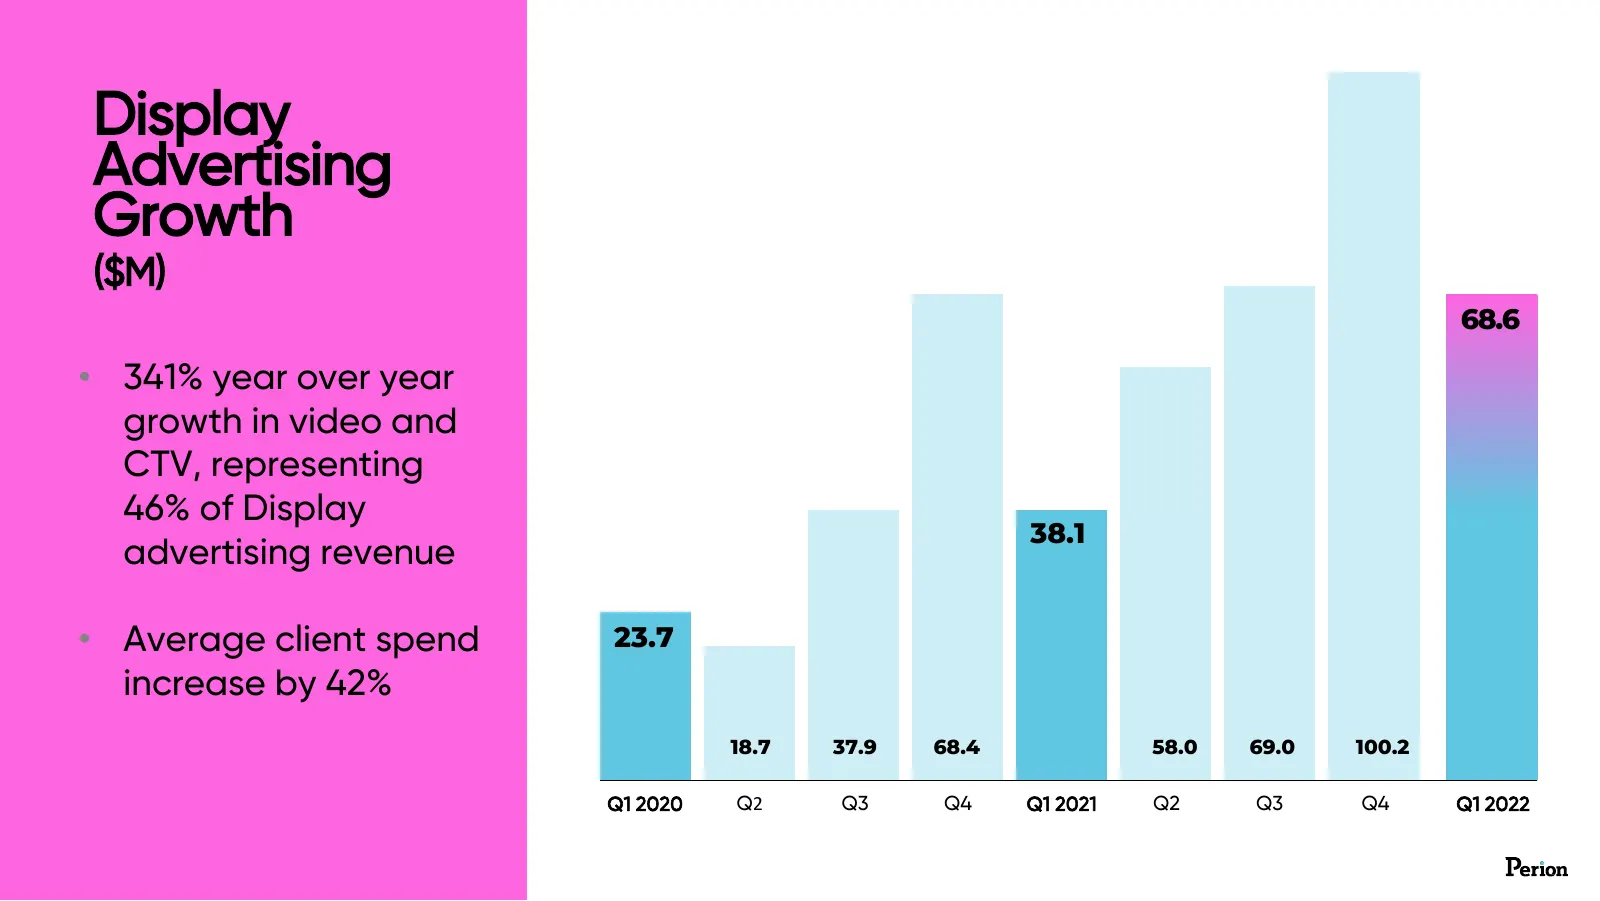
Slide 17: Display Advertising Growth
Display Advertising Growth ($M) 68.6 • 341% year over year growth in video and CTV, representing 46% of Display 38.1 advertising revenue • Average client spend 23.7 increase by 42% 18.7 37.9 68.4 58.0 69.0 100.2 Q1 2020 Q2 Q3 Q4 Q1 2021 Q2 Q3 Q4 Q1 2022
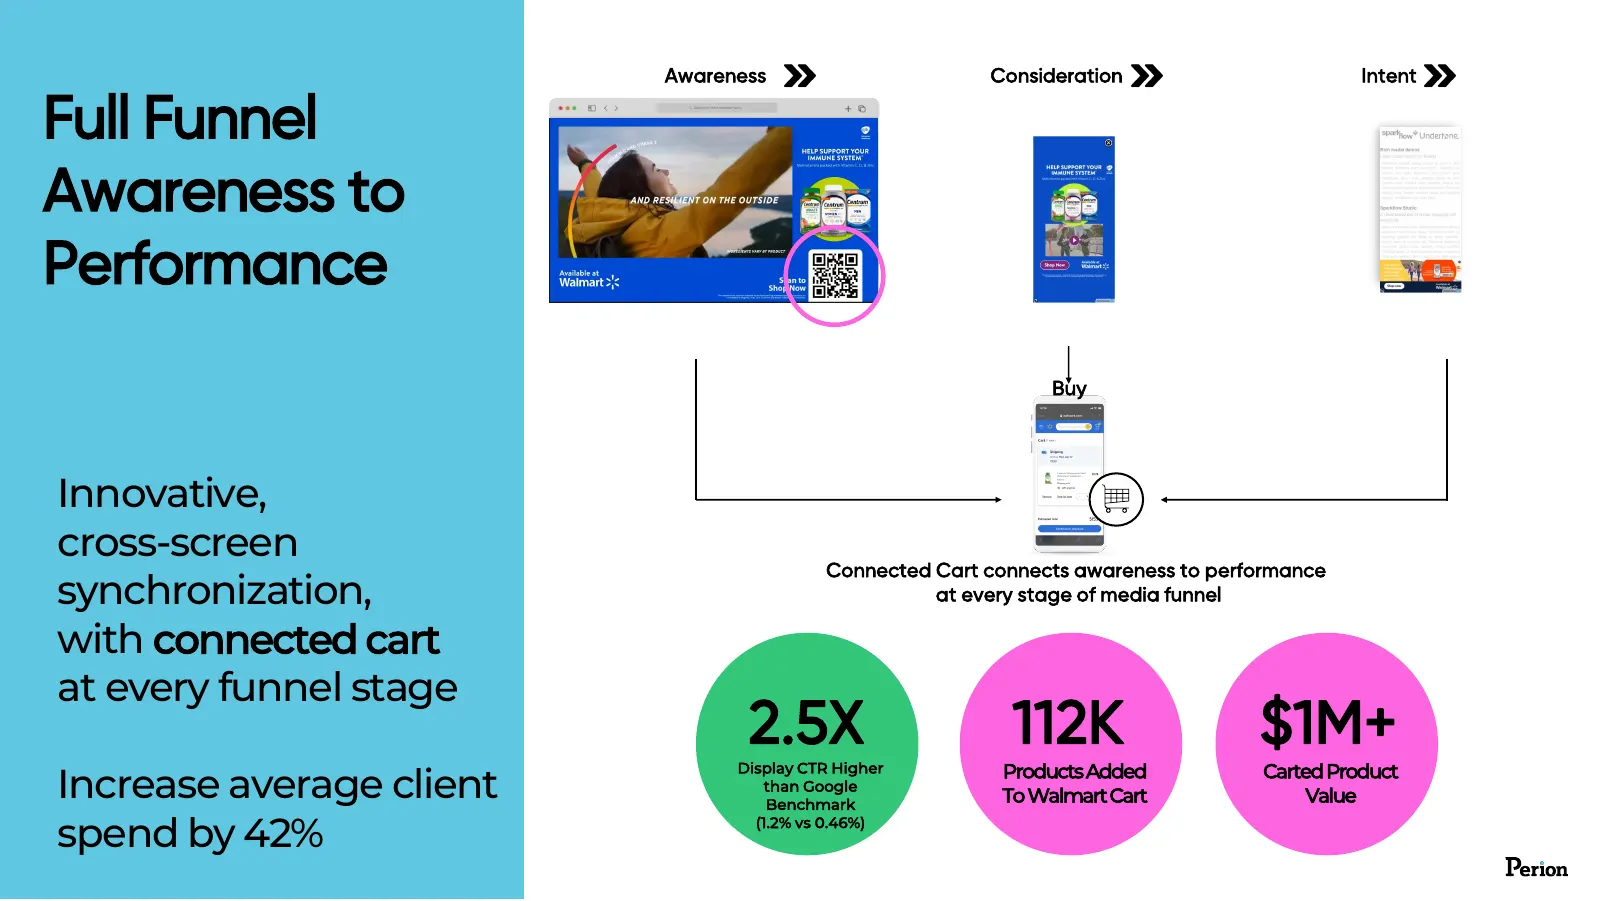
Slide 18: Full Funnel Awareness to Performance
Awareness Consideration Intent Full Funnel Awareness to Performance Buy Innovative, cross-screen Connected Cart connects awareness to performance synchronization, at every stage of media funnel with connected cart at every funnel stage 2.5X 112K $1M+ Display CTR Higher Products Added Carted Product
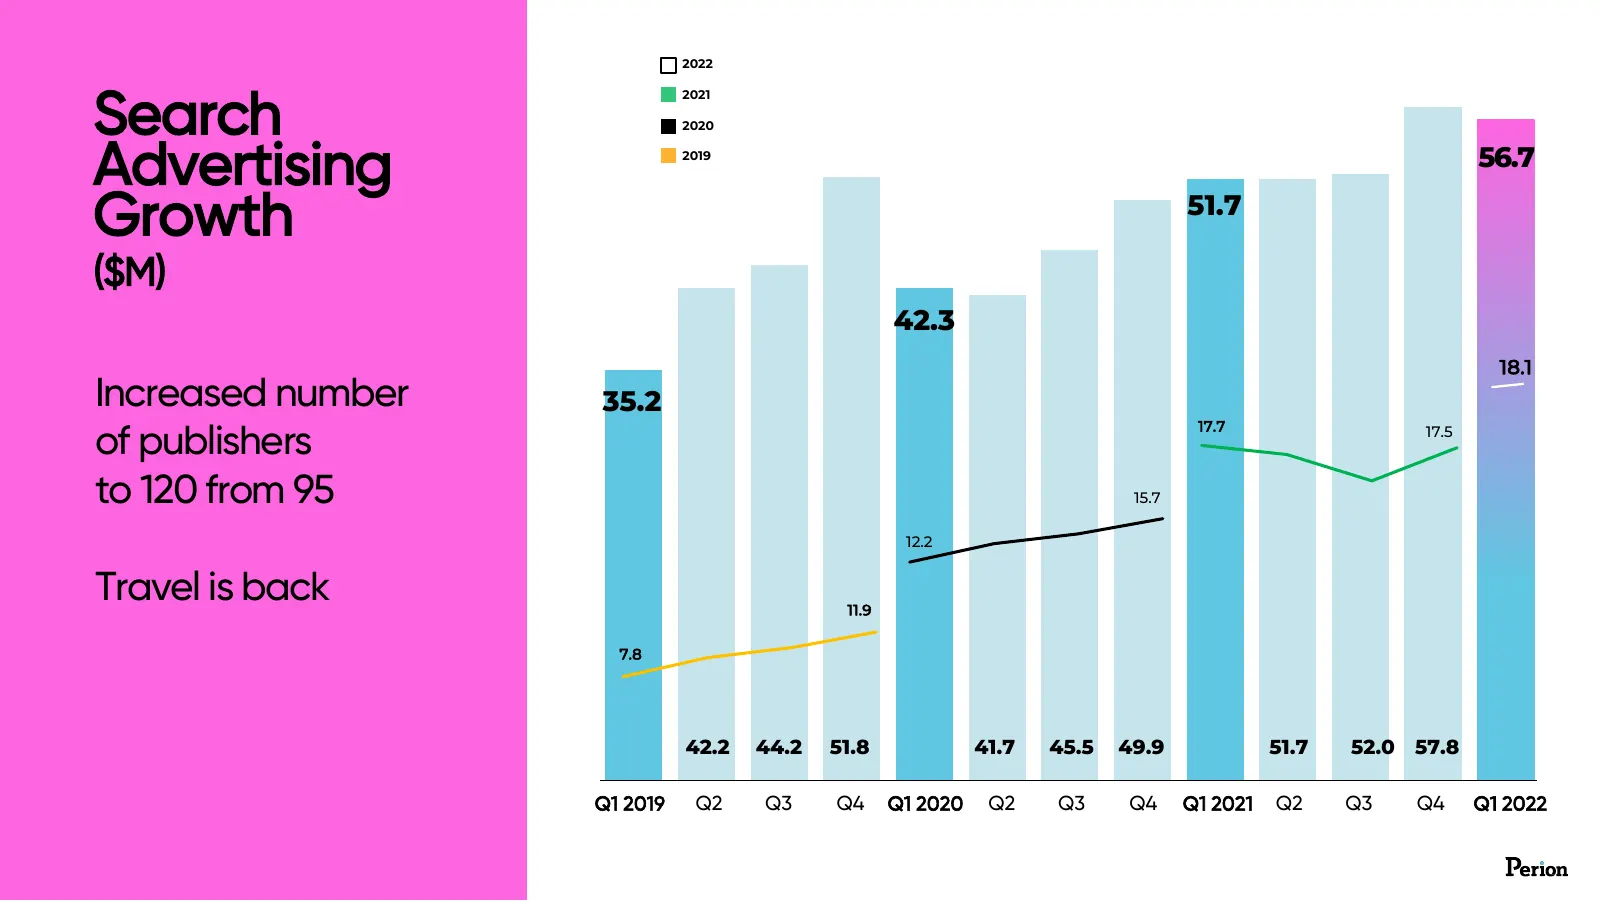
Slide 19: Search Advertising Growth
2022 Search 2021 2020 Advertising 2019 56.7 Growth 51.7 ($M) 42.3 18.1 Increased number 35.2 17.7 of publishers 17.5 to 120 from 95 15.7 12.2 Travel is back 11.9 7.8 42.2 44.2 51.8 41.7 45.5 49.9 51.7 52.0 57.8 Q1 2019 Q2 Q3 Q4 Q1 2020 Q2 Q3 Q4 Q1 2021 Q2 Q3 Q4 Q1 2022

Slide 20: Microsoft Advertising Global Supply Partner Of The Year
Microsoft Advertising Global Supply Partner Of The Year
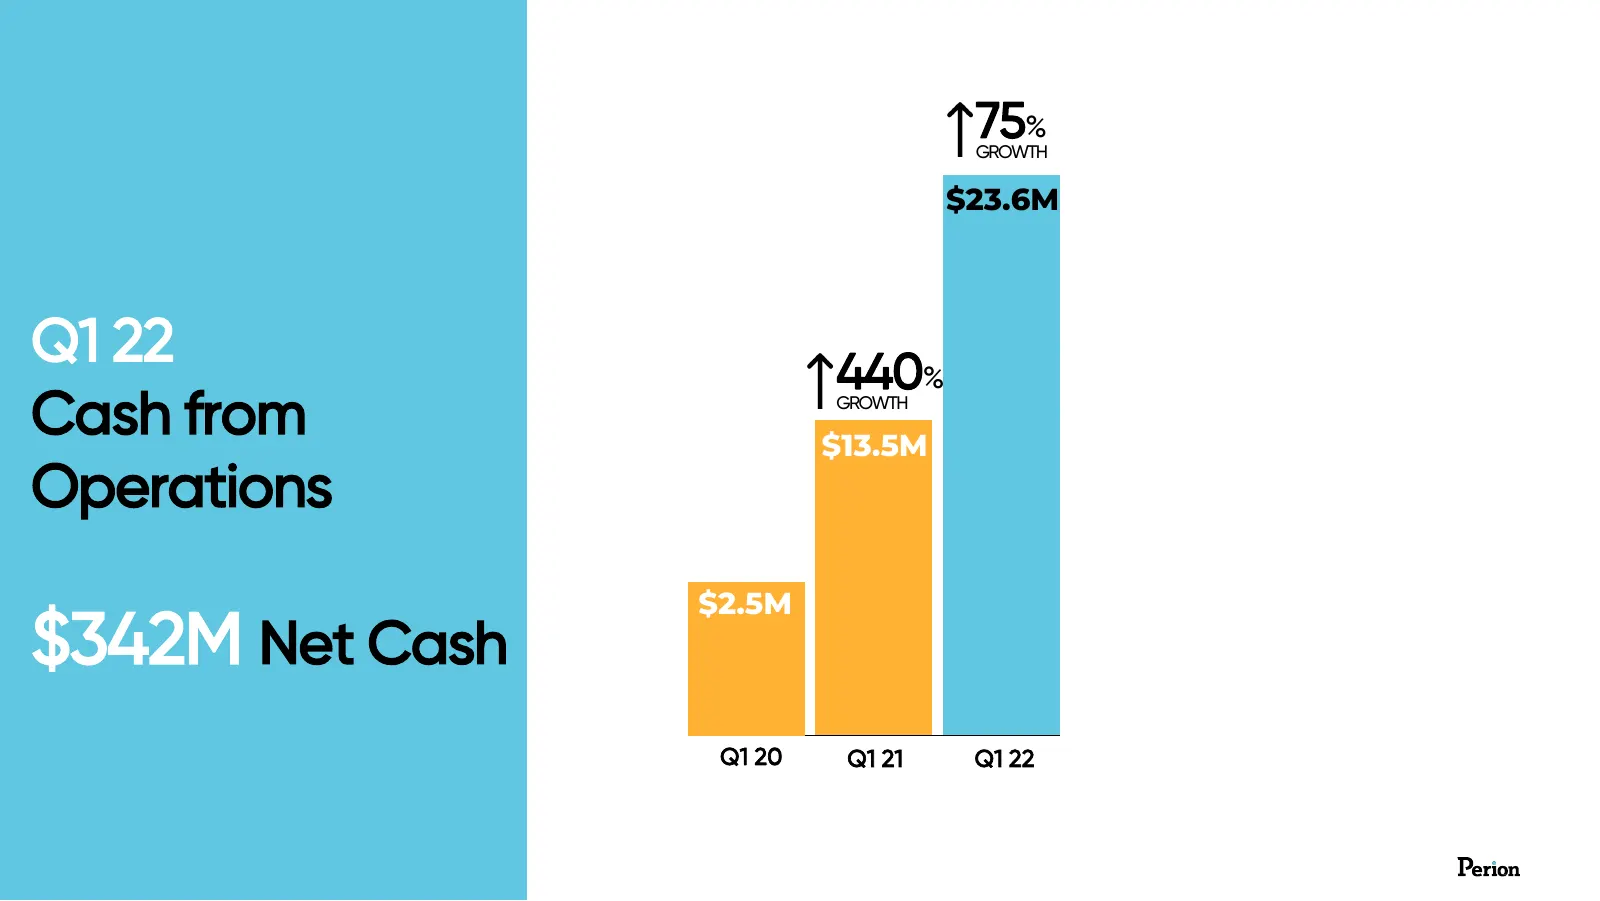
Slide 21: $342M Net Cash
75% GROWTH $23.6M Q1 22 440% Cash from GROWTH $13.5M Operations $2.5M $342M Net Cash Q1 20 Q1 21 Q1 22
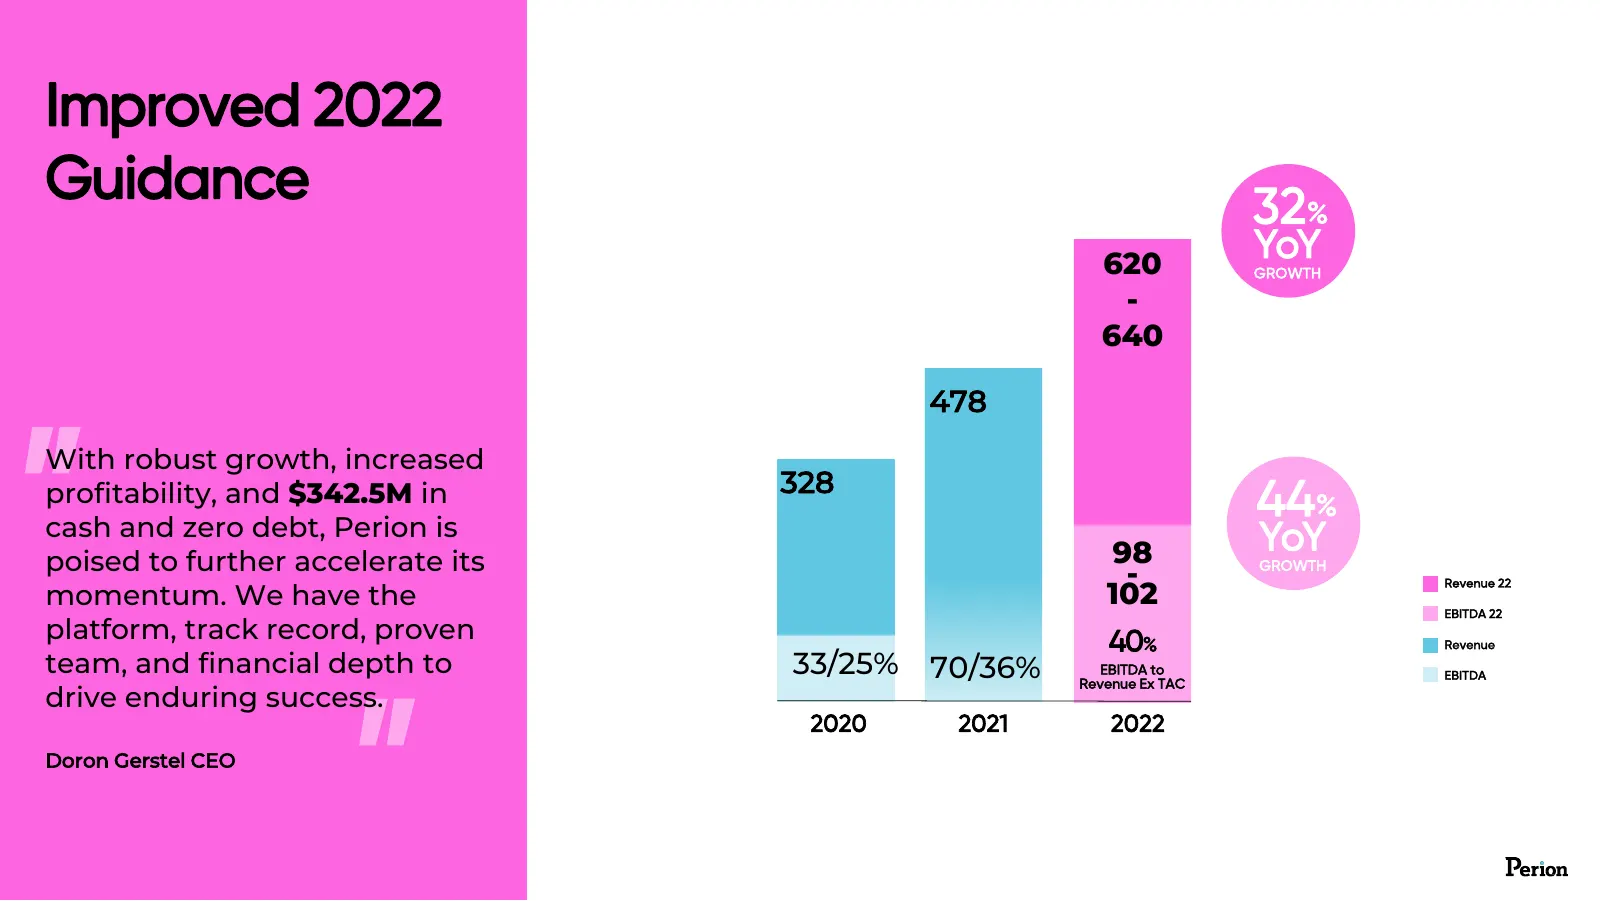
Slide 22: Improved 2022 Guidance
Improved 2022 Guidance 32% 620 YoY $118M GROWTH - 640 $78M 478 With robust growth, increased 328 profitability, and $342.5M in cash and zero debt, Perion is 44% 98 YoY poised to further accelerate its - GROWTH 102 Revenue 22 momentum. We have the EBITDA 22 platform, track record, proven 40% Revenue

Slide 23: Thank You
Thank You

Slide 24: Appendix
appendix 24
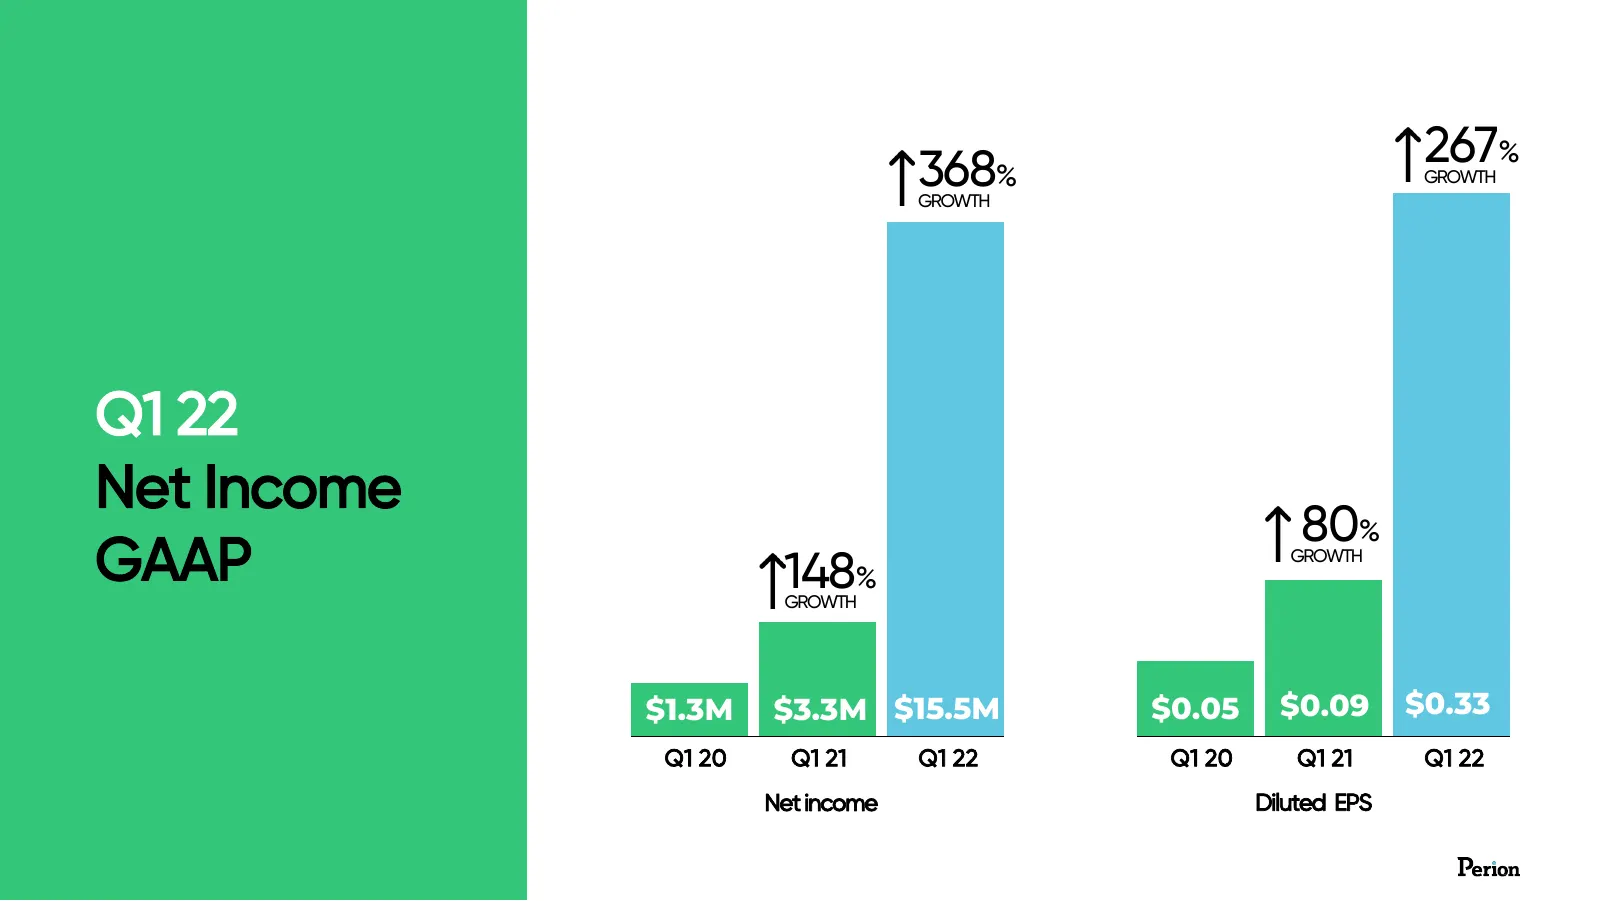
Slide 25: Q1 22 Net Income GAAP
368% 267% GROWTH GROWTH Q1 22 Net Income 80% GAAP 148% GROWTH GROWTH $1.3M $3.3M $15.5M $0.05 $0.09 $0.33 Q1 20 Q1 21 Q1 22 Q1 20 Q1 21 Q1 22 Net income Diluted EPS
Slide 26: Q1 22 Non-GAAP Net Income and Diluted EPS
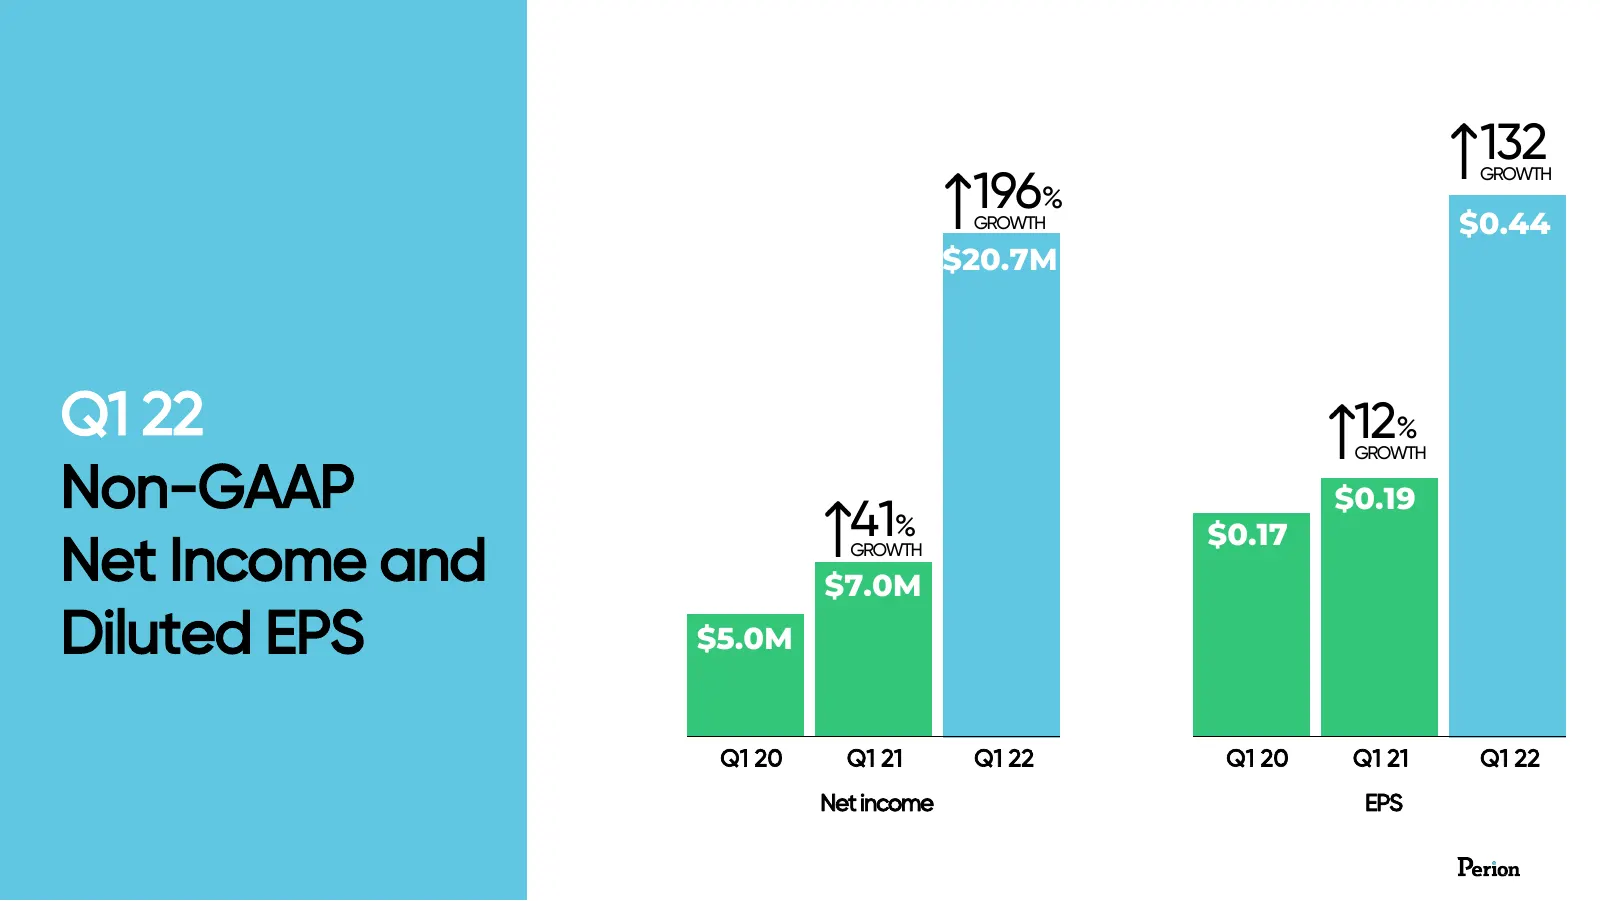
132 196% GROWTH GROWTH $0.44 $20.7M Q1 22 12% GROWTH Non-GAAP 41% $0.19 $0.17 Net Income and GROWTH $7.0M Diluted EPS $5.0M Q1 20 Q1 21 Q1 22 Q1 20 Q1 21 Q1 22 Net income EPS
Slide 27: Balance Sheet GAAP Basis Overview ($M)
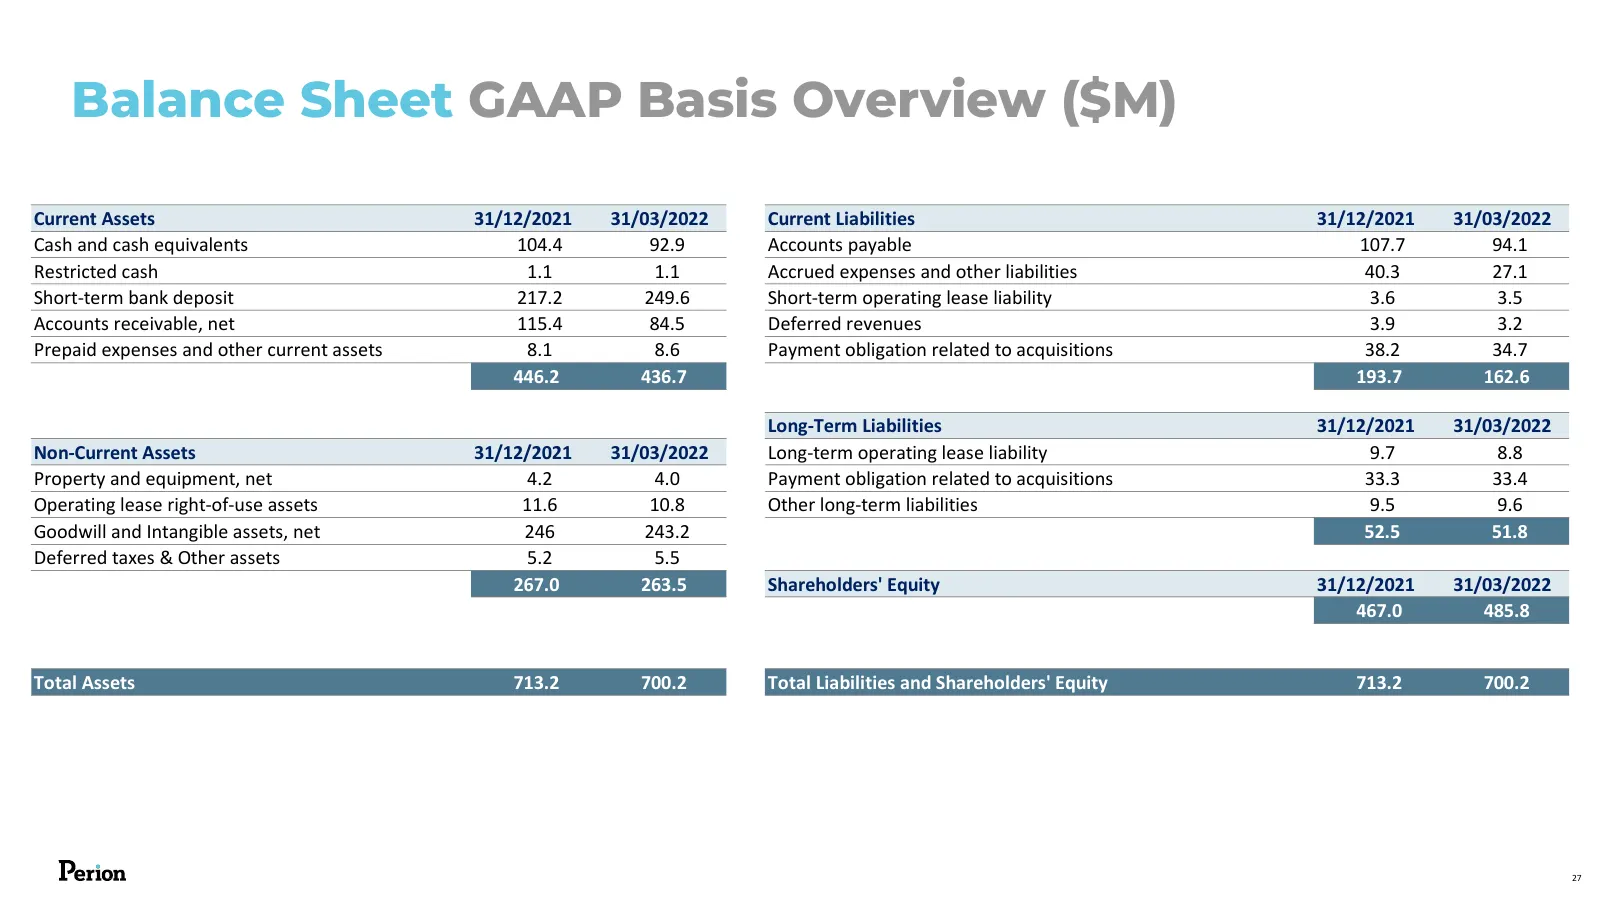
Balance Sheet GAAP Basis Overview ($M) Current Assets 31/12/2021 31/03/2022 Current Liabilities 31/12/2021 31/03/2022 Cash and cash equivalents 104.4 92.9 Accounts payable 107.7 94.1 Restricted cash 1.1 1.1 Accrued expenses and other liabilities 40.3 27.1 Short-term bank deposit 217.2 249.6 Short-te
Slide 28: Income Statement GAAP Basis ($M)
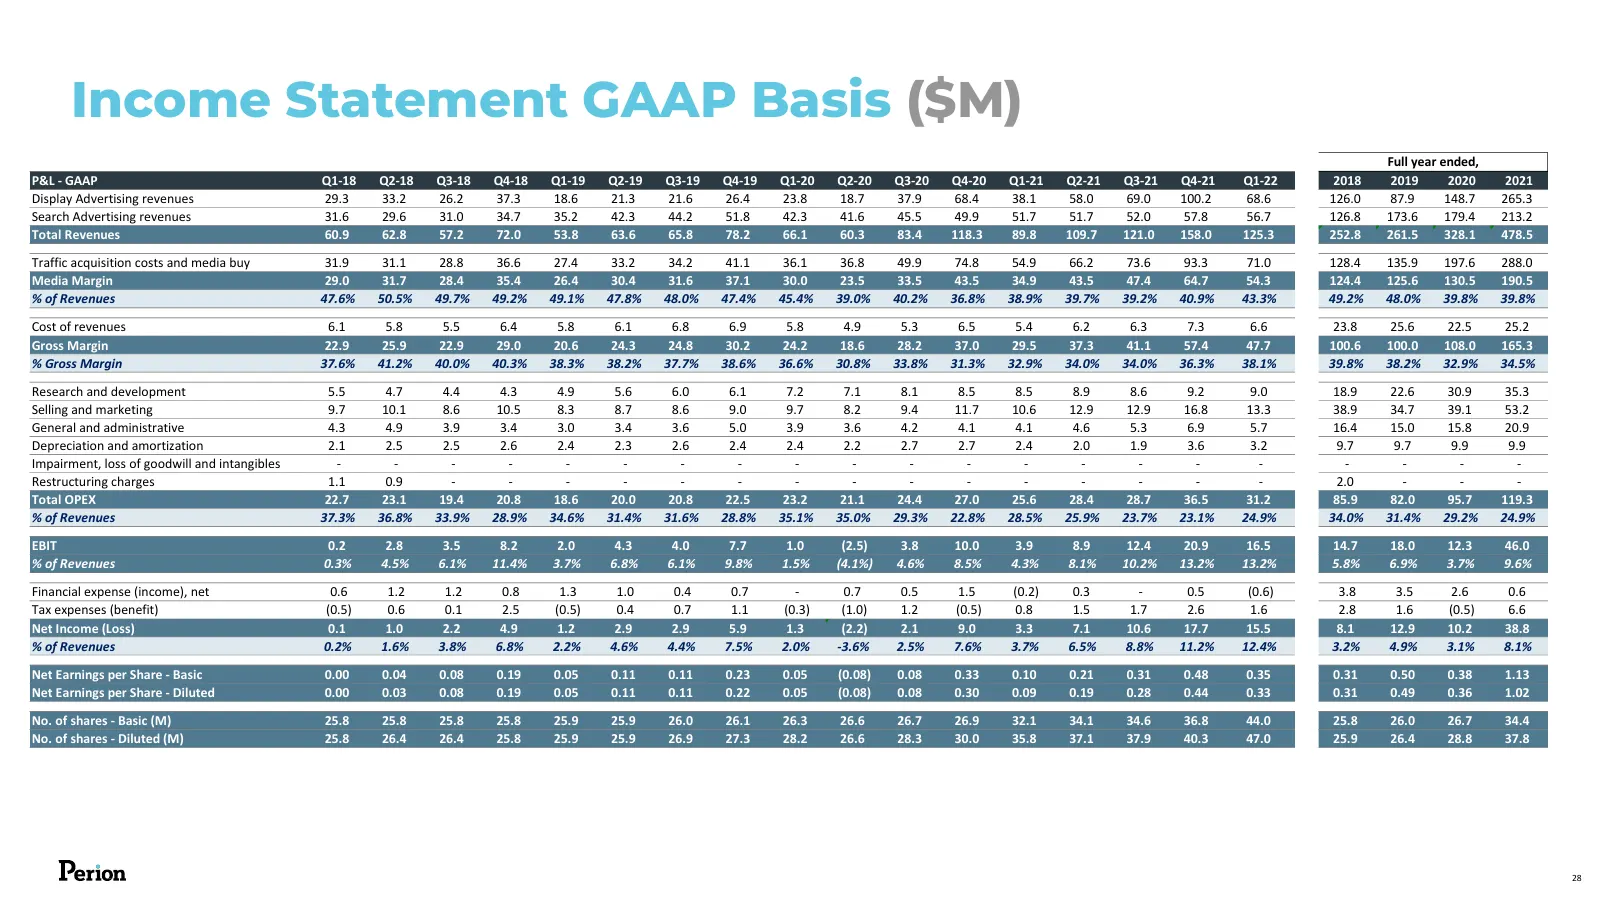
Income Statement GAAP Basis ($M) Full year ended, P&L - GAAP Q1-18 Q2-18 Q3-18 Q4-18 Q1-19 Q2-19 Q3-19 Q4-19 Q1-20 Q2-20 Q3-20 Q4-20 Q1-21 Q2-21 Q3-21 Q4-21 Q1-22 2018 2019 2020 2021 Display Advertising revenues 29.3 33.2 26.2 37.3 18.6 21.3 21.6 26.4 23.8 18.7 37.9 68.4 38.1 58.0 69.0 100.2 68.6 12
Slide 29: Cash Flow GAAP Basis Overview ($M)
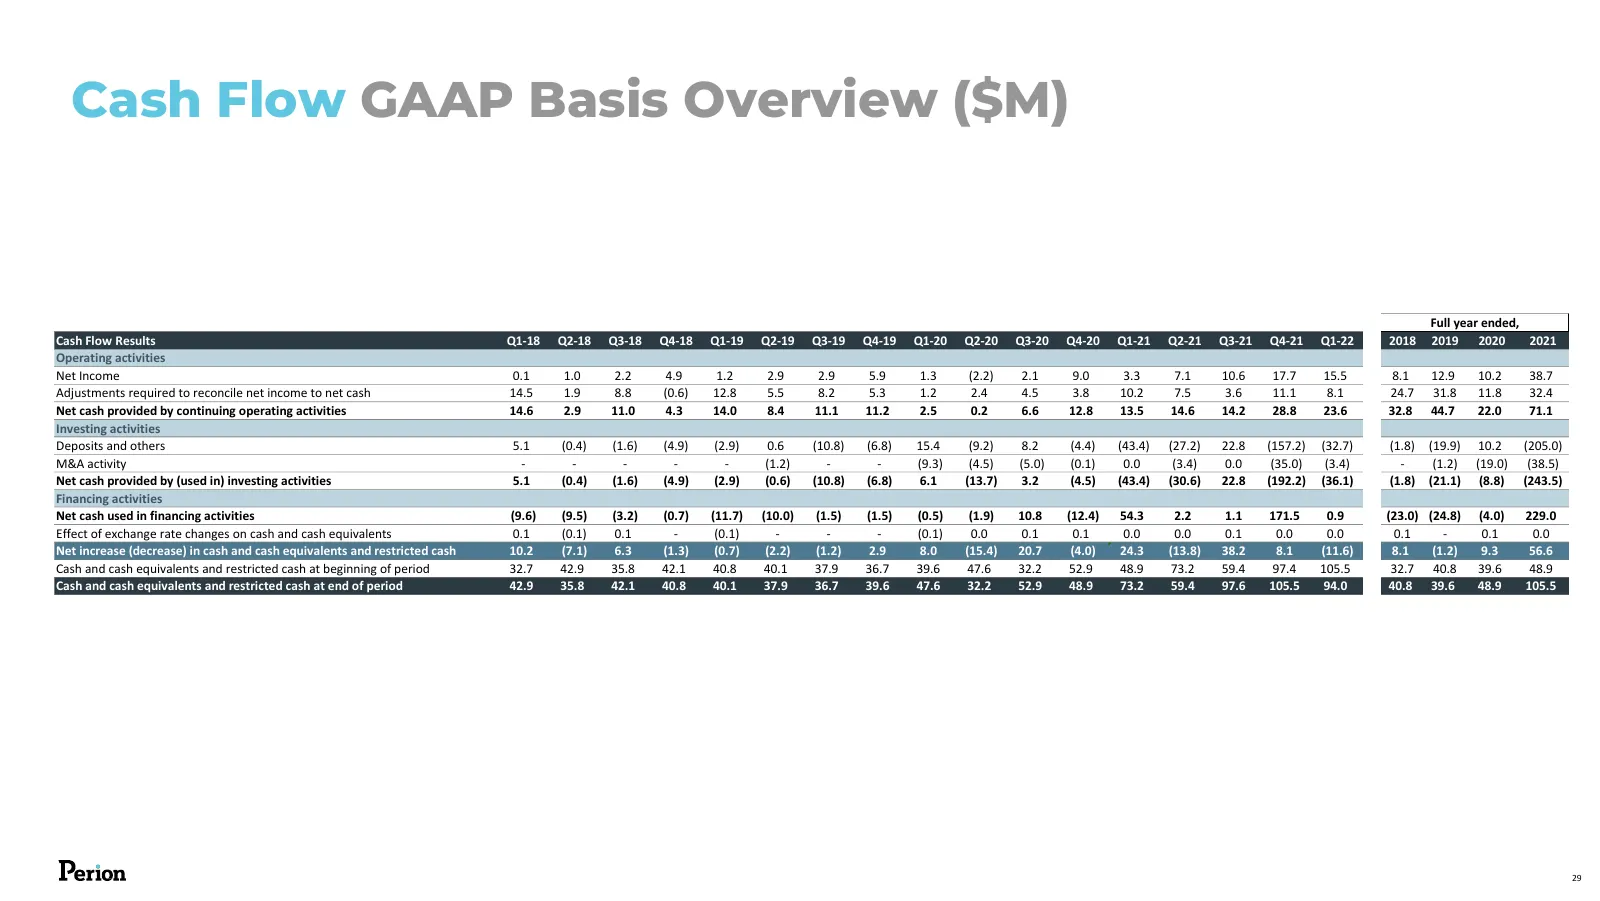
Cash Flow GAAP Basis Overview ($M) Full year ended, Cash Flow Results Q1-18 Q2-18 Q3-18 Q4-18 Q1-19 Q2-19 Q3-19 Q4-19 Q1-20 Q2-20 Q3-20 Q4-20 Q1-21 Q2-21 Q3-21 Q4-21 Q1-22 2018 2019 2020 2021 Operating activities Net Income 0.1 1.0 2.2 4.9 1.2 2.9 2.9 5.9 1.3 (2.2) 2.1 9.0 3.3 7.1 10.6 17.7 15.5 8.1
Slide 30: Non-GAAP Adjustments ($M)
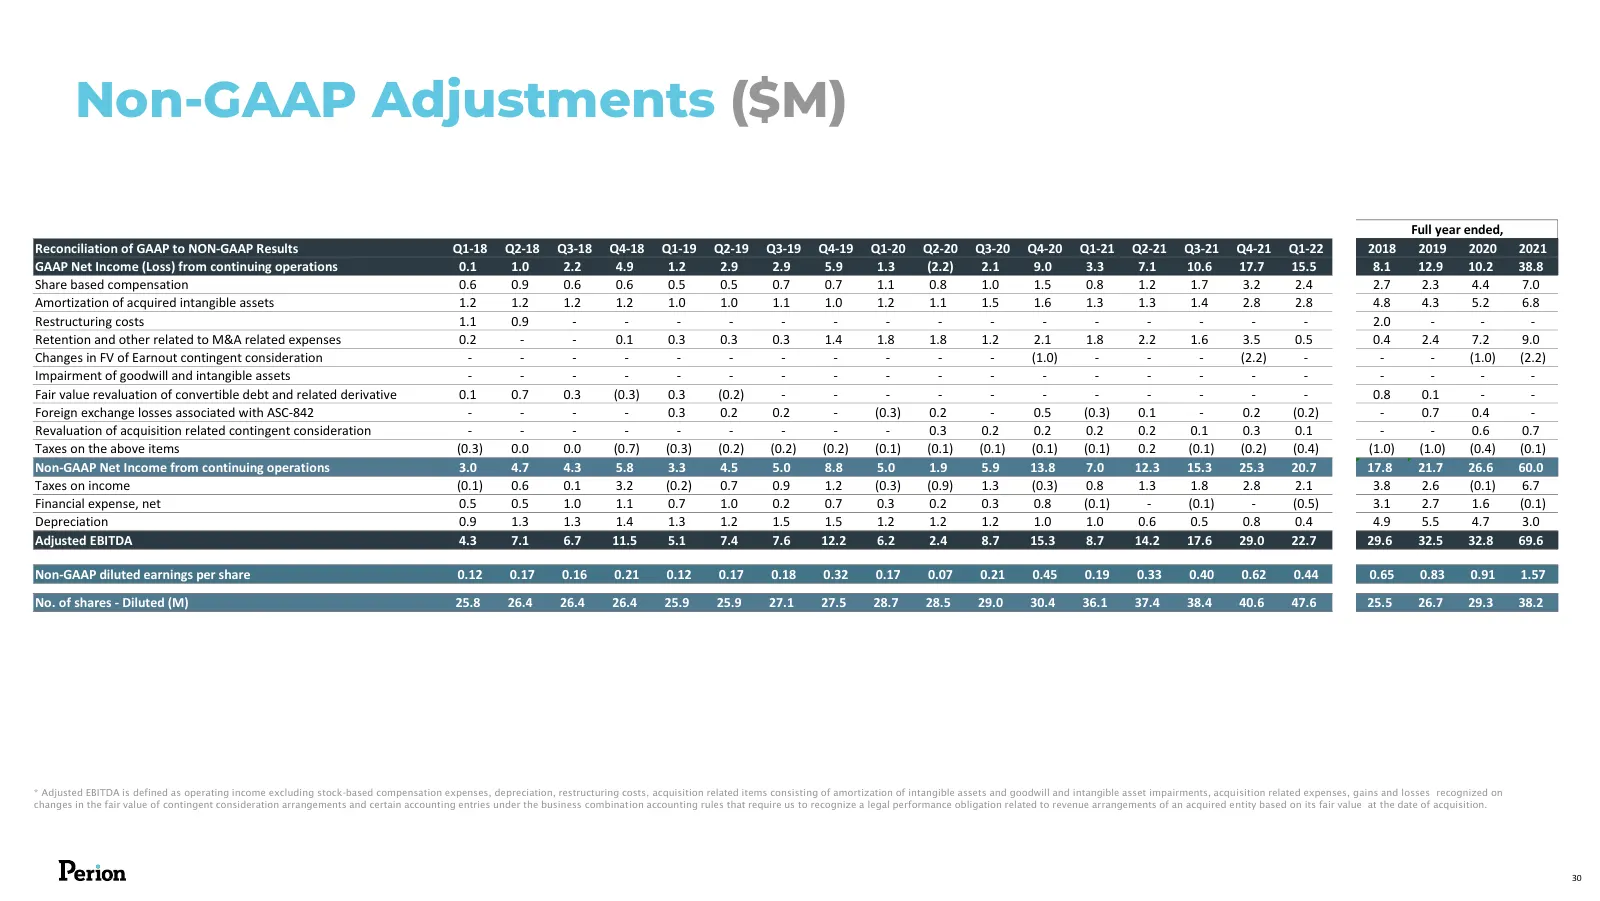
Non-GAAP Adjustments ($M) Full year ended, Reconciliation of GAAP to NON-GAAP Results Q1-18 Q2-18 Q3-18 Q4-18 Q1-19 Q2-19 Q3-19 Q4-19 Q1-20 Q2-20 Q3-20 Q4-20 Q1-21 Q2-21 Q3-21 Q4-21 Q1-22 2018 2019 2020 2021 GAAP Net Income (Loss) from continuing operations 0.1 1.0 2.2 4.9 1.2 2.9 2.9 5.9 1.3 (2.2)
Slide 31: P&L Non-GAAP ($M)
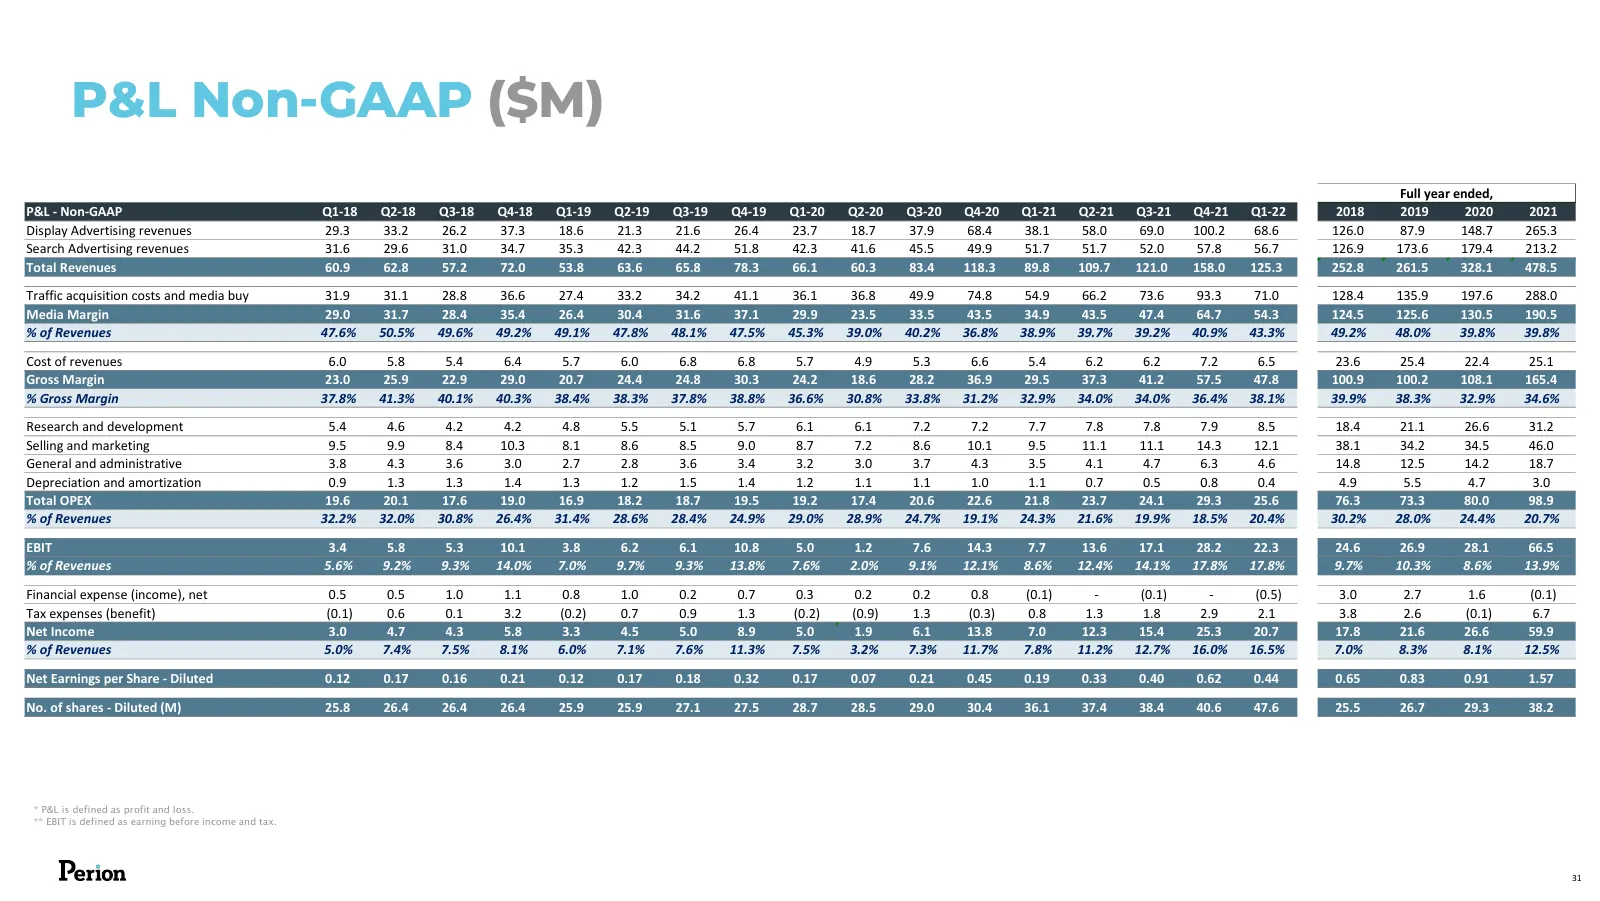
P&L Non-GAAP ($M) Full year ended, P&L - Non-GAAP Q1-18 Q2-18 Q3-18 Q4-18 Q1-19 Q2-19 Q3-19 Q4-19 Q1-20 Q2-20 Q3-20 Q4-20 Q1-21 Q2-21 Q3-21 Q4-21 Q1-22 2018 2019 2020 2021 Display Advertising revenues 29.3 33.2 26.2 37.3 18.6 21.3 21.6 26.4 23.7 18.7 37.9 68.4 38.1 58.0 69.0 100.2 68.6 126.0 87.9 14
Slide 32: Q1 22 Revenue
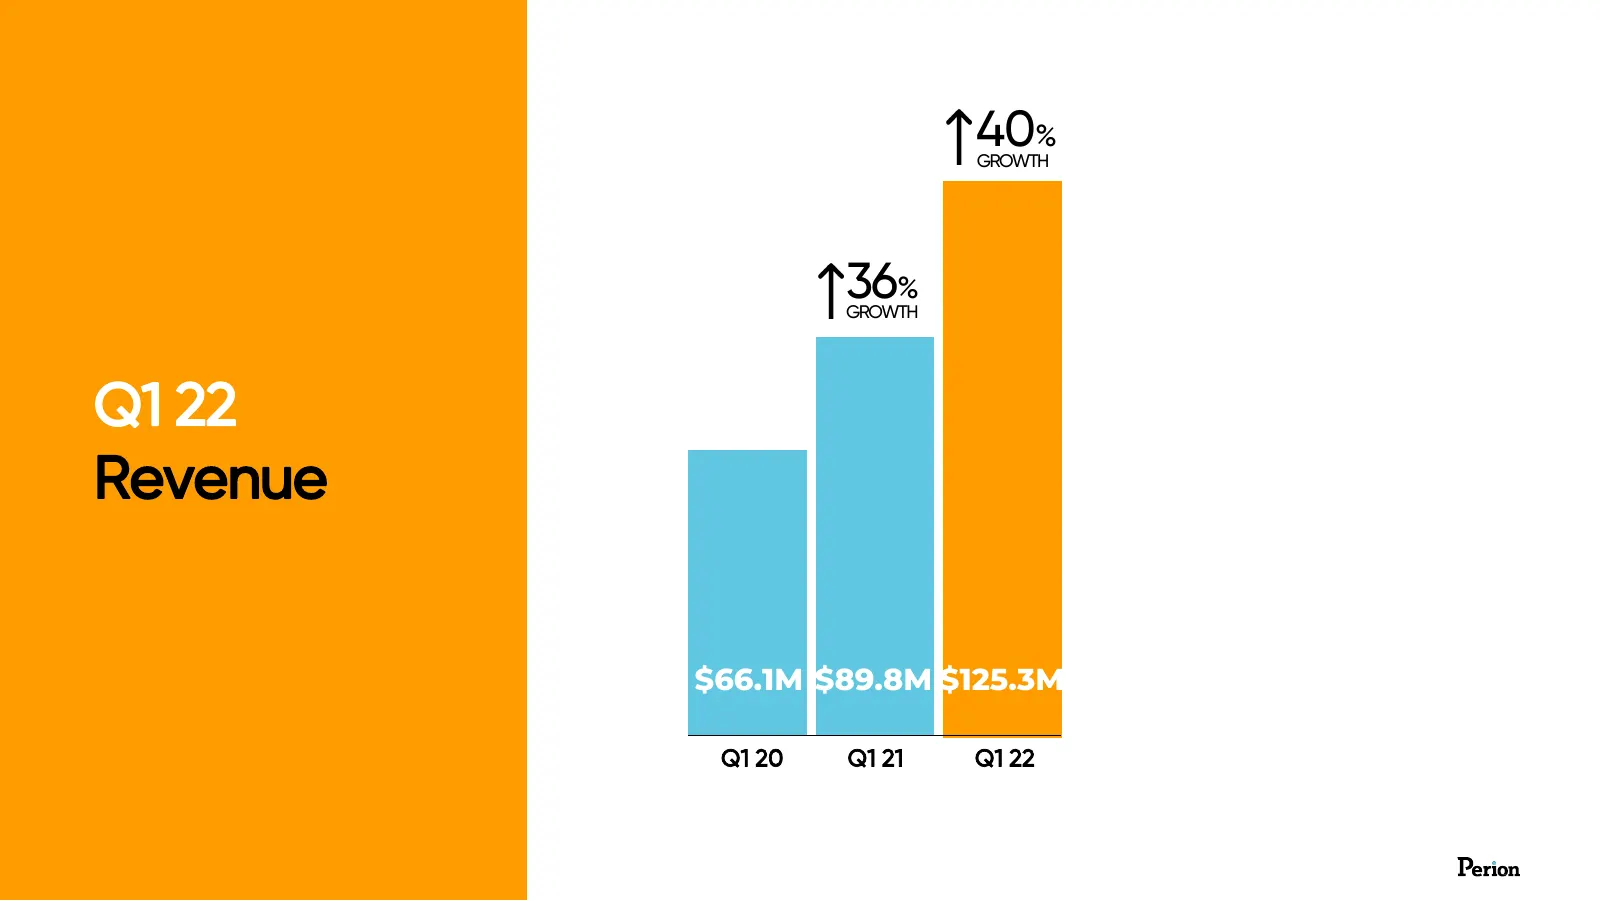
40% GROWTH 36% GROWTH Q1 22 Revenue $66.1M $89.8M $125.3M Q1 20 Q1 21 Q1 22 $26M
Source: Internet Archive copy of wp-cdn.perion.com
More decks from Perion Network Ltd
 Q2 2026 Earnings Presentation43 slides · Aug 10, 2026
 Investor Presentation (August 2026)83 slides · August 2026
 Investor Presentation (June 2026)80 slides · Jun 29, 2026
 Q1 2026 Earnings Presentation39 slides · May 20, 2026
 Q4 2025 Earnings Presentation54 slides · Feb 18, 2026
 Q3 2025 Earnings Presentation40 slides · Nov 12, 2025