Heartland Financial USA — Q4 2022 Earnings Presentation
47 slides from Heartland Financial USA's earnings presentation, Jan 30, 2023
Slide 1: We See Growth. 4th Quarter 2022 Financials
We see Growth. Ath Quarter 2022 Financials
Slide 2: Safe Harbor
2 Safe Harbor Within the charts and tables presented, certain segments, columns and rows may not sum to totals shown due to rounding. This investor presentation (including any information incorporated herein by reference) and future oral and written statements of HTLF and its management, may contain
Slide 3: 4Q 2022 Highlights
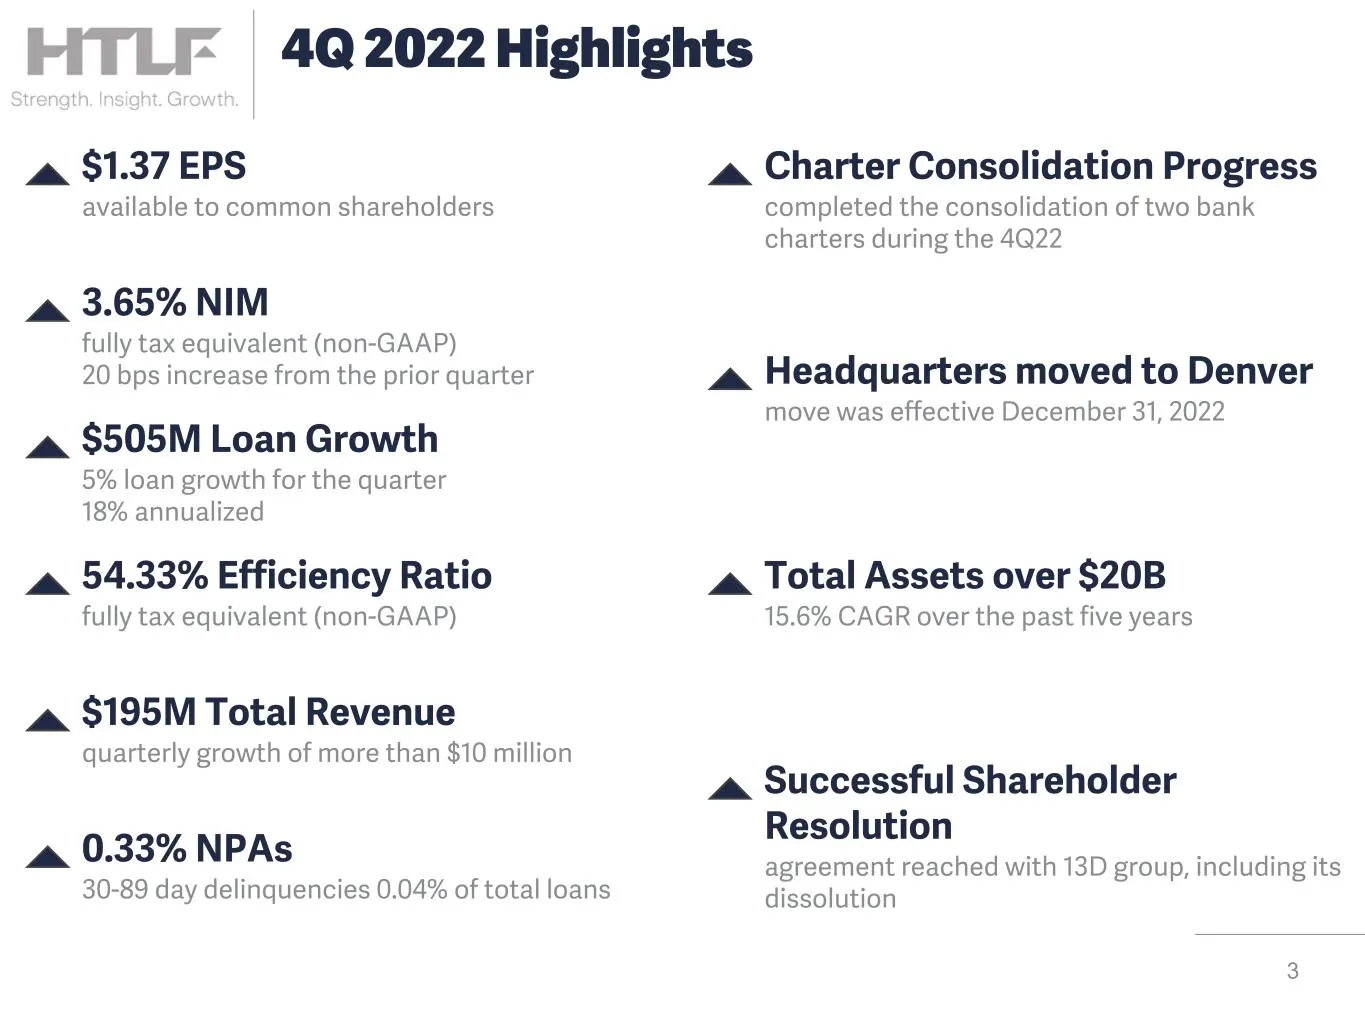
3 $1.37 EPS available to common shareholders Total Assets over $20B 15.6% CAGR over the past five years Charter Consolidation Progress completed the consolidation of two bank charters during the 4Q22 4Q 2022 Highlights $505M Loan Growth 5% loan growth for the quarter 18% annualized 3.65% NIM fully t
Slide 4: FY 2022 Highlights
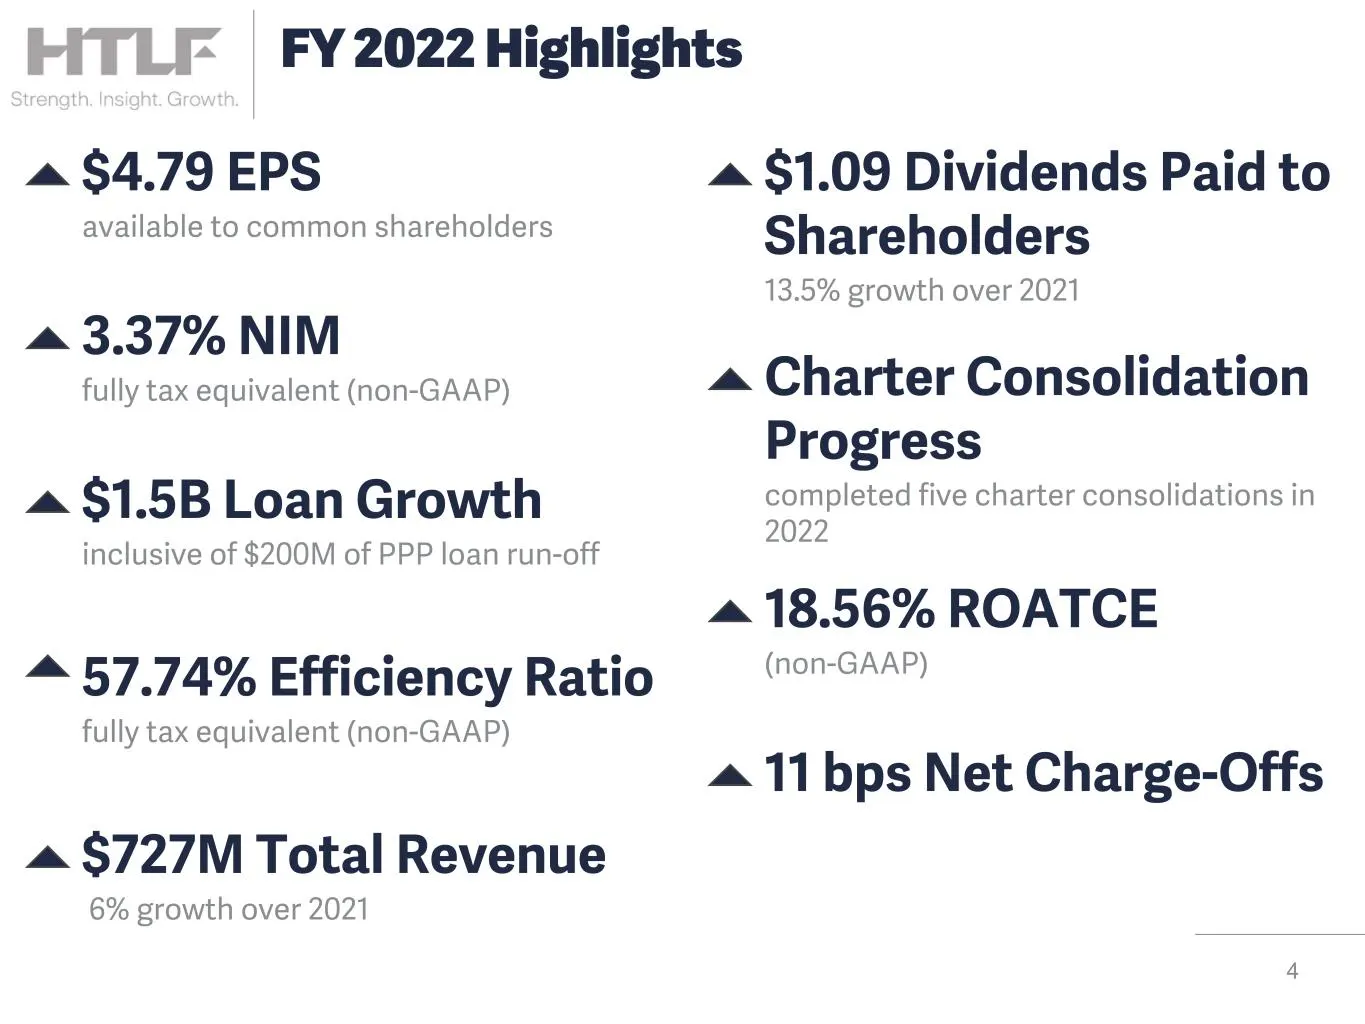
57.74% Efficiency Ratio fully tax equivalent (non-GAAP) 4 $4.79 EPS available to common shareholders 18.56% ROATCE (non-GAAP) $1.09 Dividends Paid to Shareholders 13.5% growth over 2021 FY 2022 Highlights $1.5B Loan Growth inclusive of $200M of PPP loan run-off 3.37% NIM fully tax equivalent (non-GA
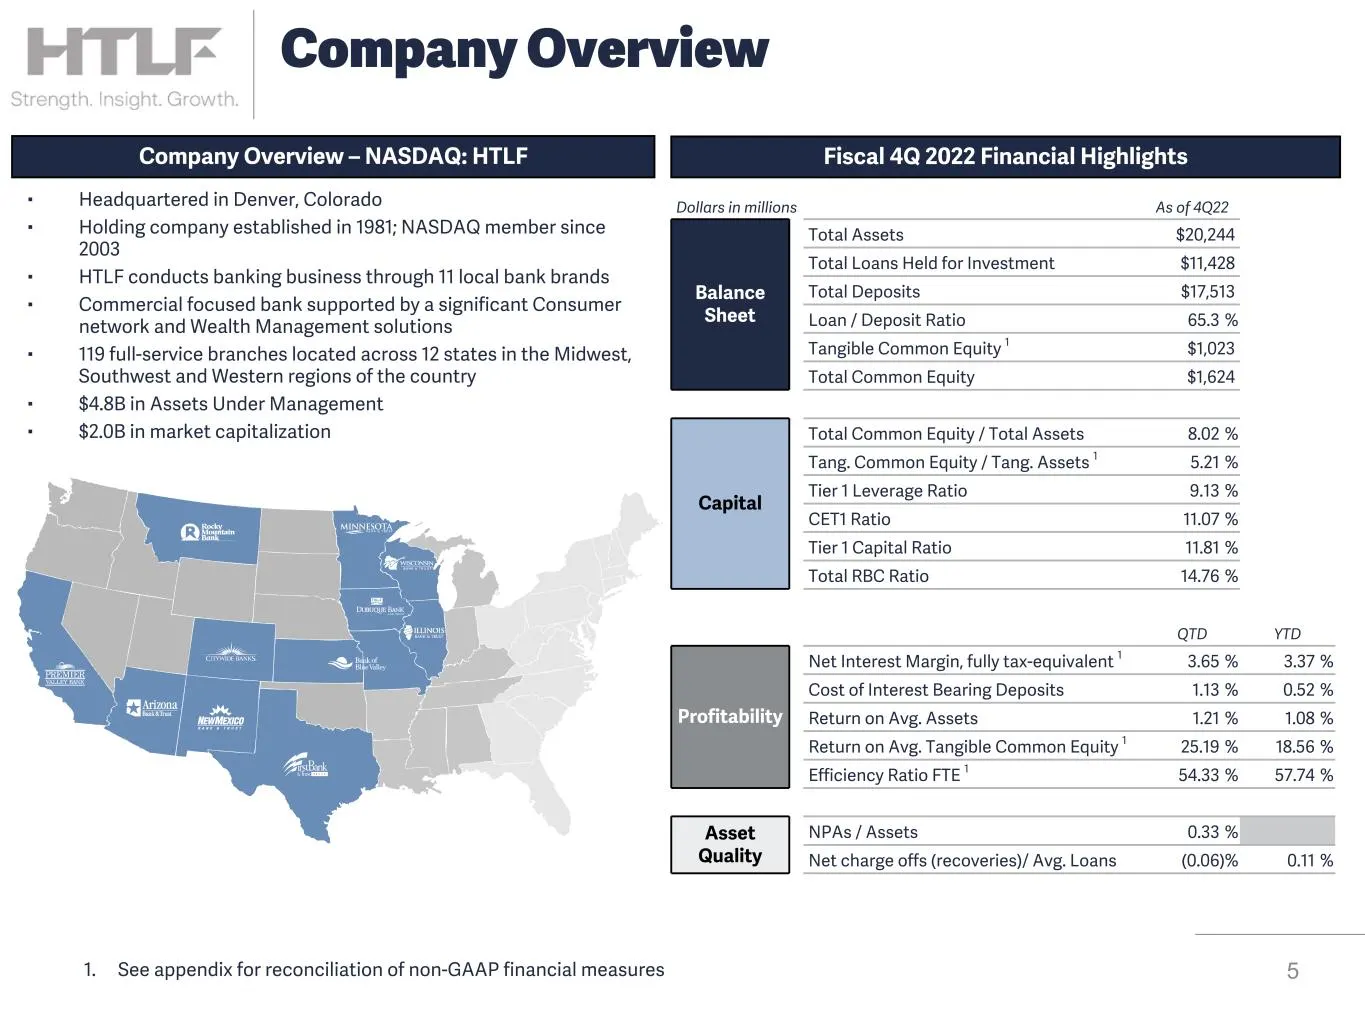
Slide 5: Company Overview – Fiscal 4Q 2022 Financial Highlights
Company Overview – NASDAQ: HTLF Fiscal 4Q 2022 Financial Highlights ▪ Headquartered in Denver, Colorado ▪ Holding company established in 1981; NASDAQ member since 2003 ▪ HTLF conducts banking business through 11 local bank brands ▪ Commercial focused bank supported by a significant Consumer network
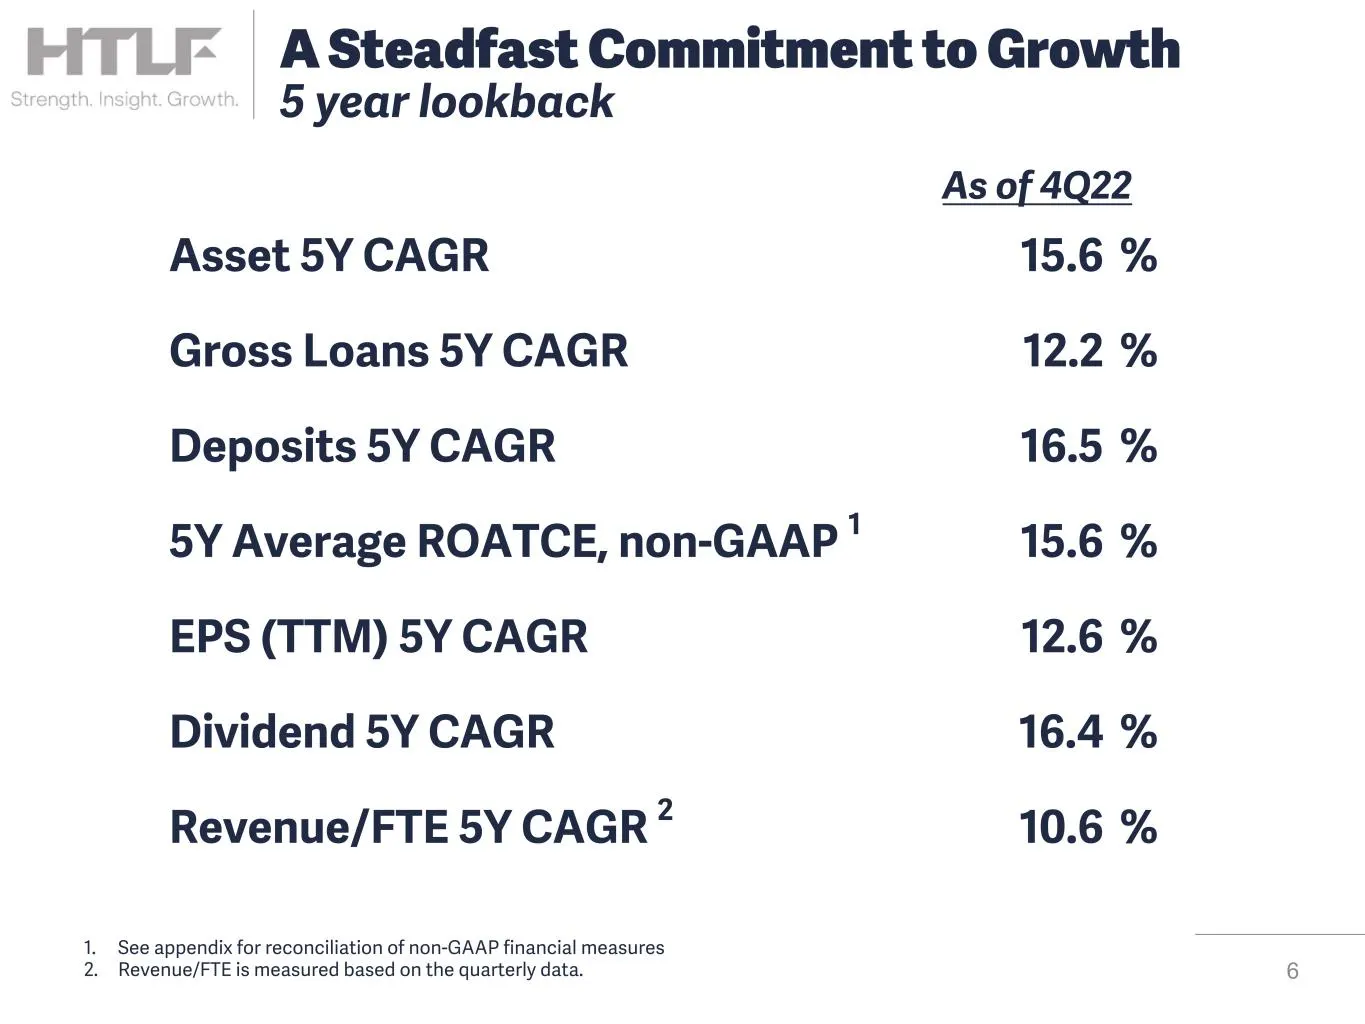
Slide 6: A Steadfast Commitment to Growth
As of 4Q22 Asset 5Y CAGR 15.6 % Gross Loans 5Y CAGR 12.2 % Deposits 5Y CAGR 16.5 % 5Y Average ROATCE, non-GAAP 1 15.6 % EPS (TTM) 5Y CAGR 12.6 % Dividend 5Y CAGR 16.4 % Revenue/FTE 5Y CAGR 2 10.6 % 6 1. See appendix for reconciliation of non-GAAP financial measures 2. Revenue/FTE is measured based o
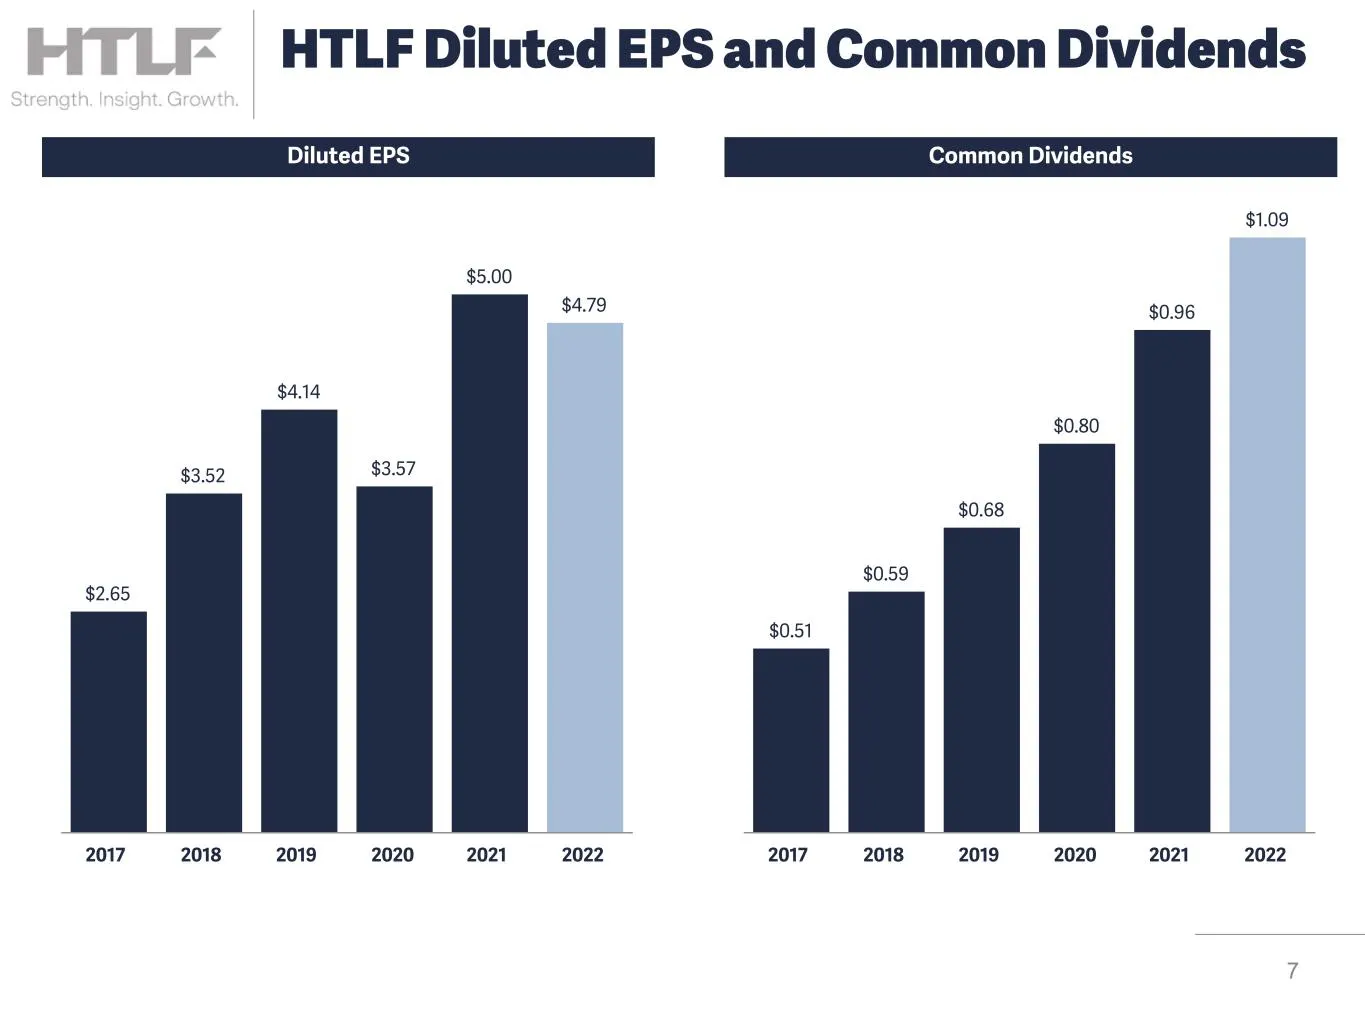
Slide 7: HTLF Diluted EPS and Common Dividends
$0.51 $0.59 $0.68 $0.80 $0.96 $1.09 2017 2018 2019 2020 2021 2022 $2.65 $3.52 $4.14 $3.57 $5.00 $4.79 2017 2018 2019 2020 2021 2022 7 HTLF Diluted EPS and Common Dividends Diluted EPS Common Dividends
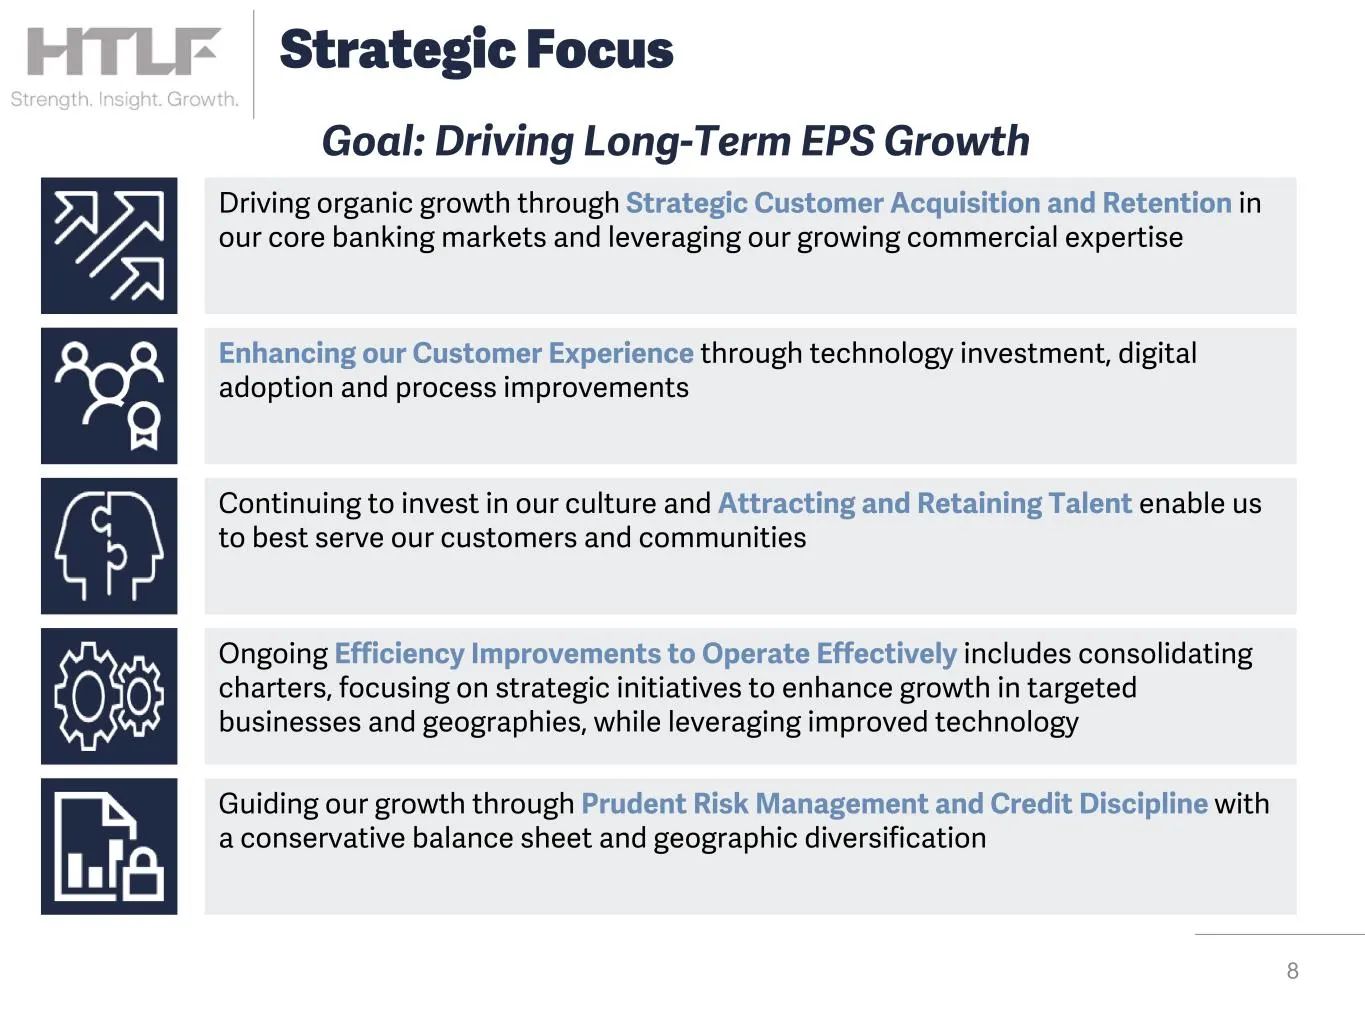
Slide 8: Strategic Focus
Driving organic growth through Strategic Customer Acquisition and Retention in our core banking markets and leveraging our growing commercial expertise 8 Strategic Focus Enhancing our Customer Experience through technology investment, digital adoption and process improvements Ongoing Efficiency Impr
Slide 9: Expanding Middle Market Services
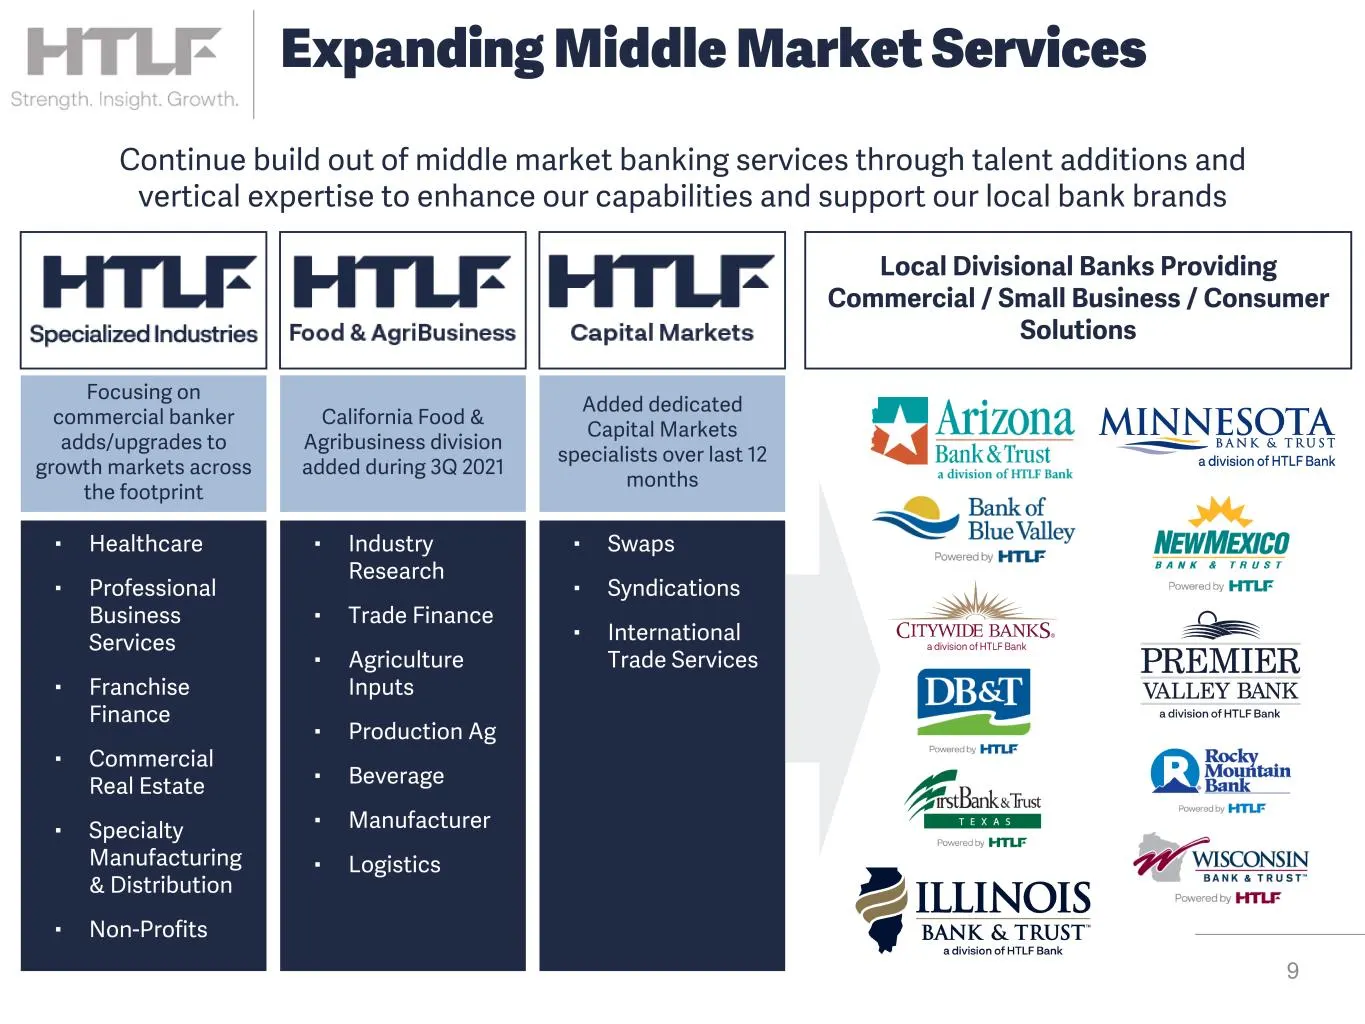
9 Expanding Middle Market Services Continue build out of middle market banking services through talent additions and vertical expertise to enhance our capabilities and support our local bank brands ▪ Healthcare ▪ Professional Business Services ▪ Franchise Finance ▪ Commercial Real Estate ▪ Specialty
Slide 10: New Commercial Relationships
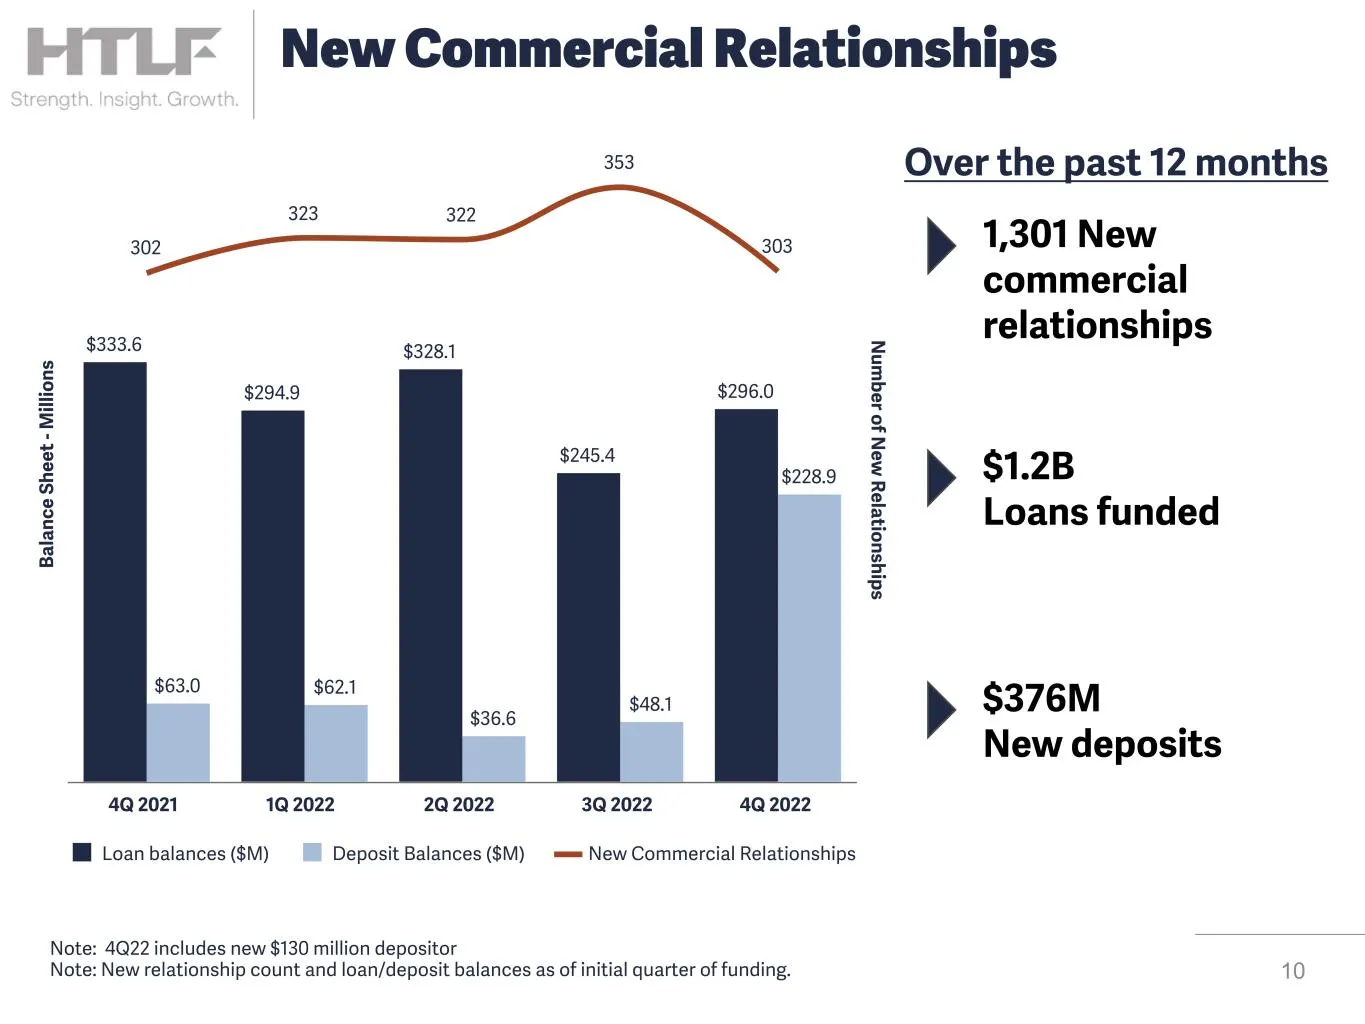
10 New Commercial Relationships B al an ce S he et - M ill io ns N um ber of N ew R elationships $333.6 $294.9 $328.1 $245.4 $296.0 $63.0 $62.1 $36.6 $48.1 $228.9 302 323 322 353 303 Loan balances ($M) Deposit Balances ($M) New Commercial Relationships 4Q 2021 1Q 2022 2Q 2022 3Q 2022 4Q 2022 1,301 N
Slide 11: Improving Customer Experiences
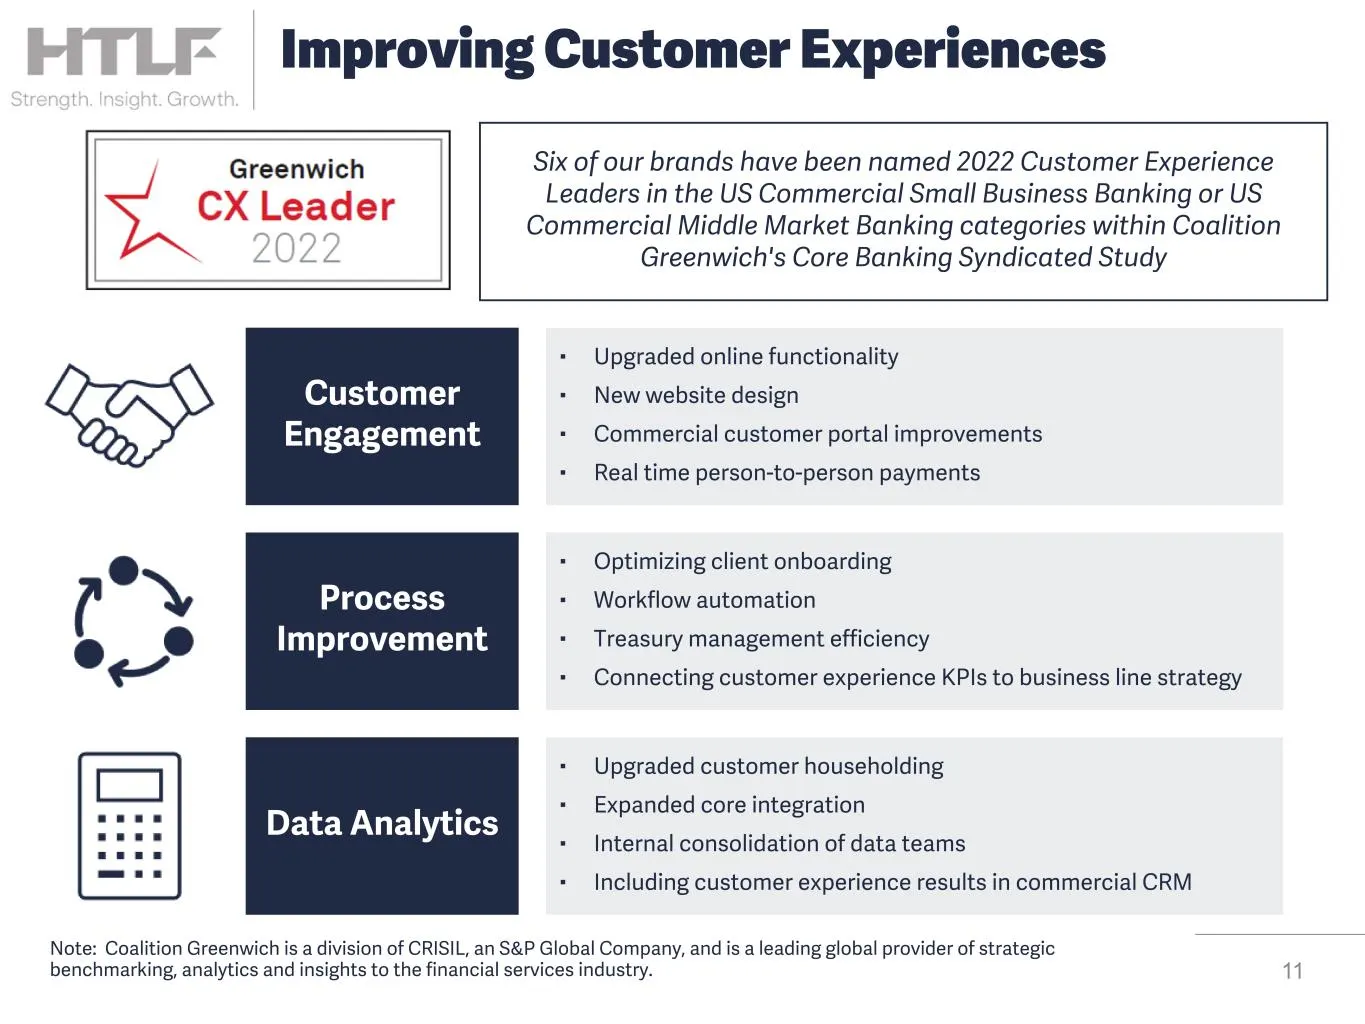
11 Improving Customer Experiences Customer Engagement Process Improvement Data Analytics ▪ Upgraded online functionality ▪ New website design ▪ Commercial customer portal improvements ▪ Real time person-to-person payments ▪ Optimizing client onboarding ▪ Workflow automation ▪ Treasury management eff
Slide 12: HTLF Excellence Recognition
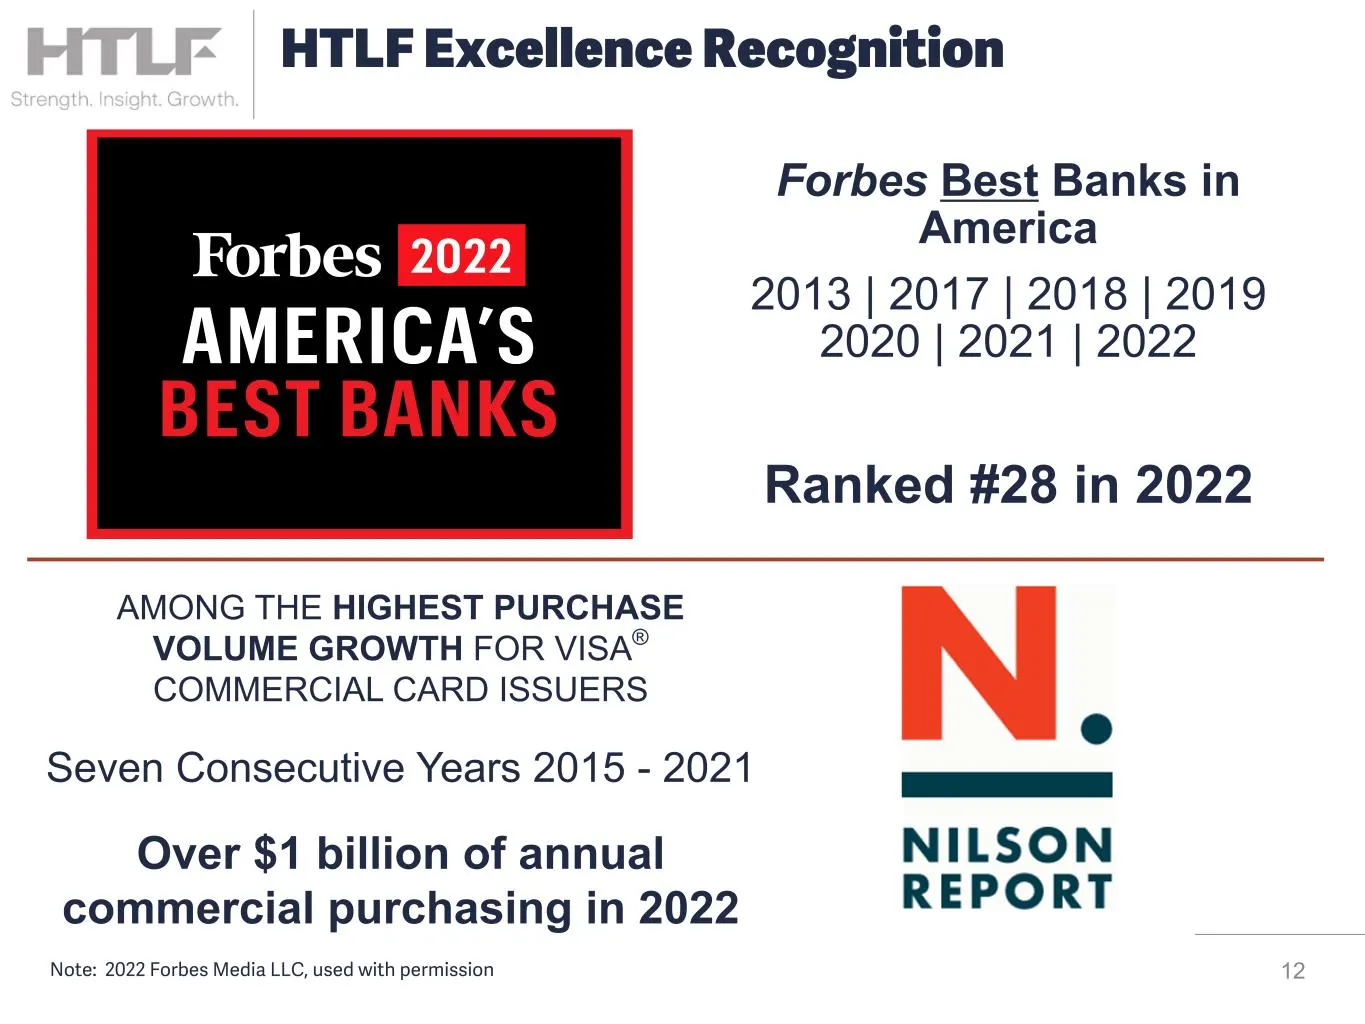
Note: 2022 Forbes Media LLC, used with permission AMONG THE HIGHEST PURCHASE VOLUME GROWTH FOR VISA® COMMERCIAL CARD ISSUERS Seven Consecutive Years 2015 - 2021 Over $1 billion of annual commercial purchasing in 2022 Forbes Best Banks in America 2013 | 2017 | 2018 | 2019 2020 | 2021 | 2022 Ranked #2
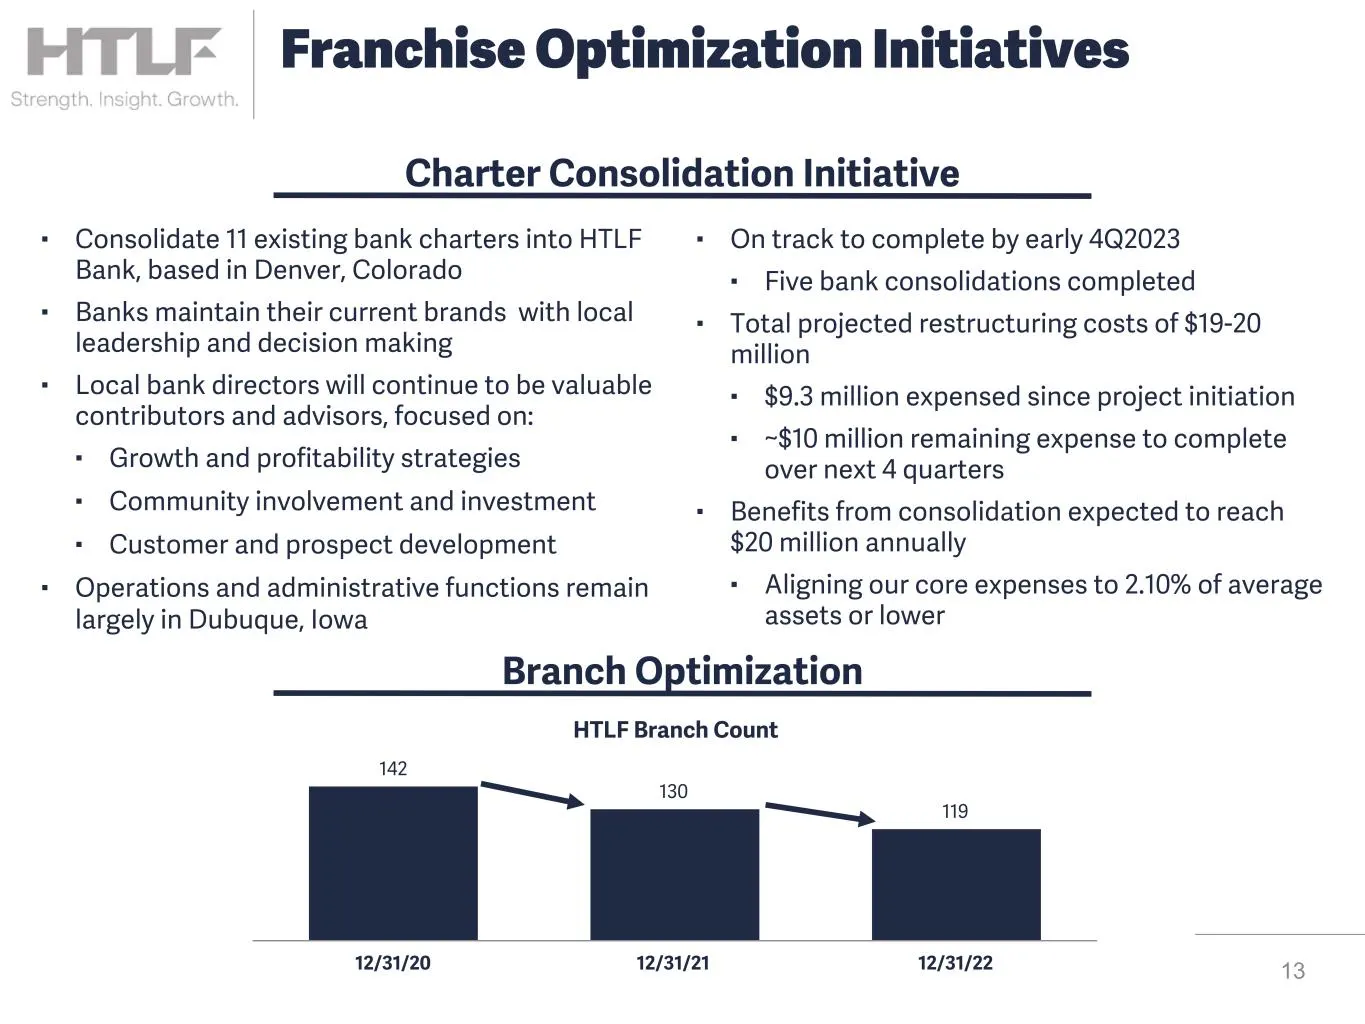
Slide 13: Charter Consolidation Initiative
▪ Consolidate 11 existing bank charters into HTLF Bank, based in Denver, Colorado ▪ Banks maintain their current brands with local leadership and decision making ▪ Local bank directors will continue to be valuable contributors and advisors, focused on: ▪ Growth and profitability strategies ▪ Communi
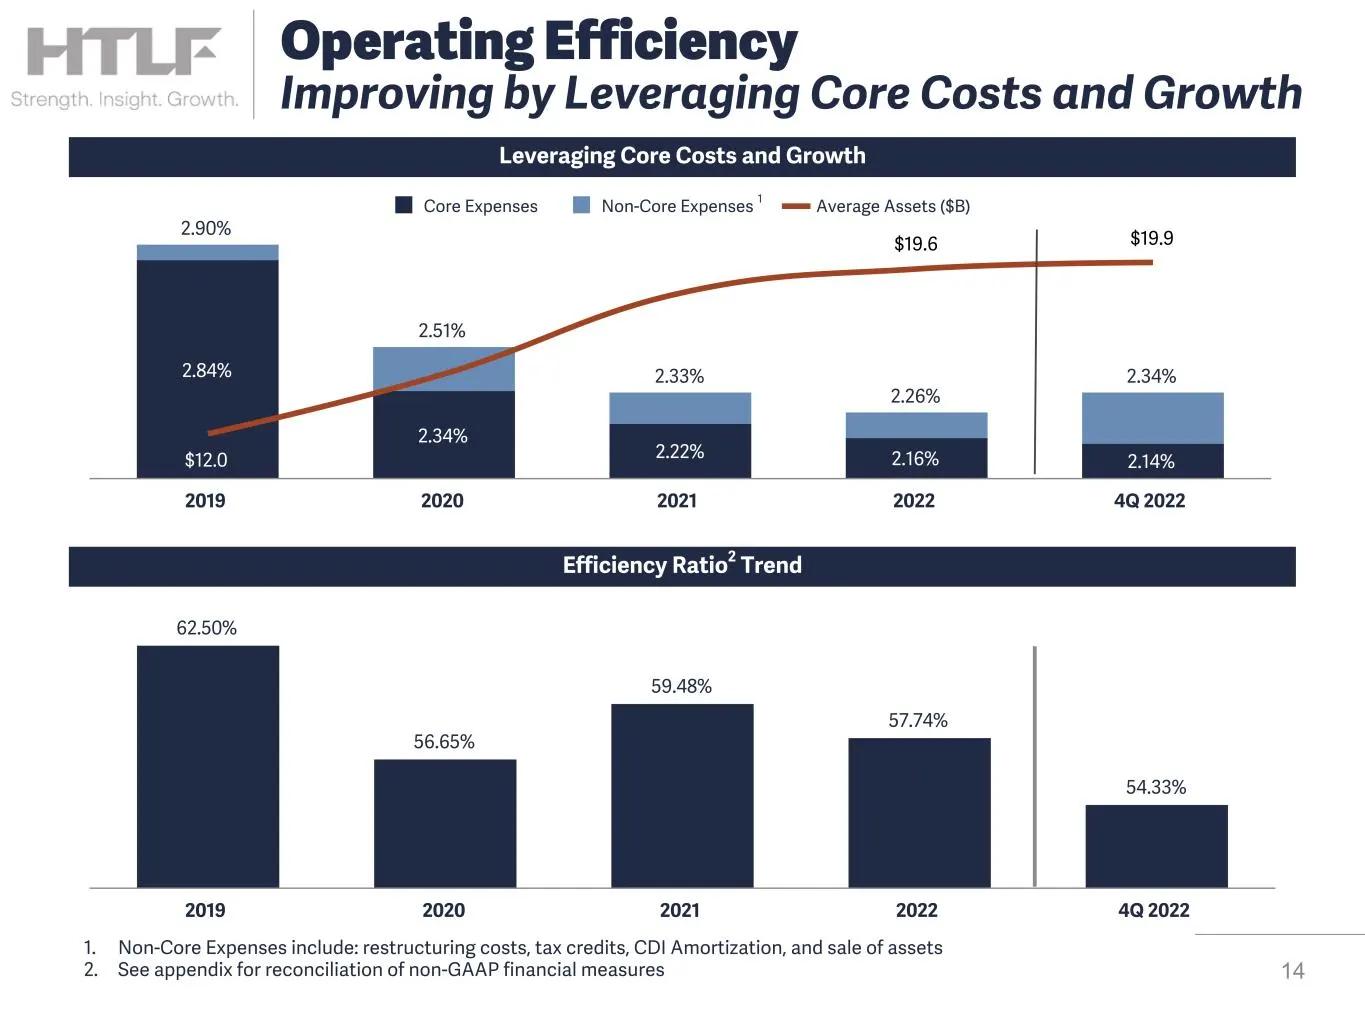
Slide 14: Leveraging Core Costs and Growth
62.50% 56.65% 59.48% 57.74% 54.33% 2019 2020 2021 2022 4Q 2022 1. Non-Core Expenses include: restructuring costs, tax credits, CDI Amortization, and sale of assets 2. See appendix for reconciliation of non-GAAP financial measures Efficiency Ratio2 Trend Leveraging Core Costs and Growth 14 2.90% 2.51
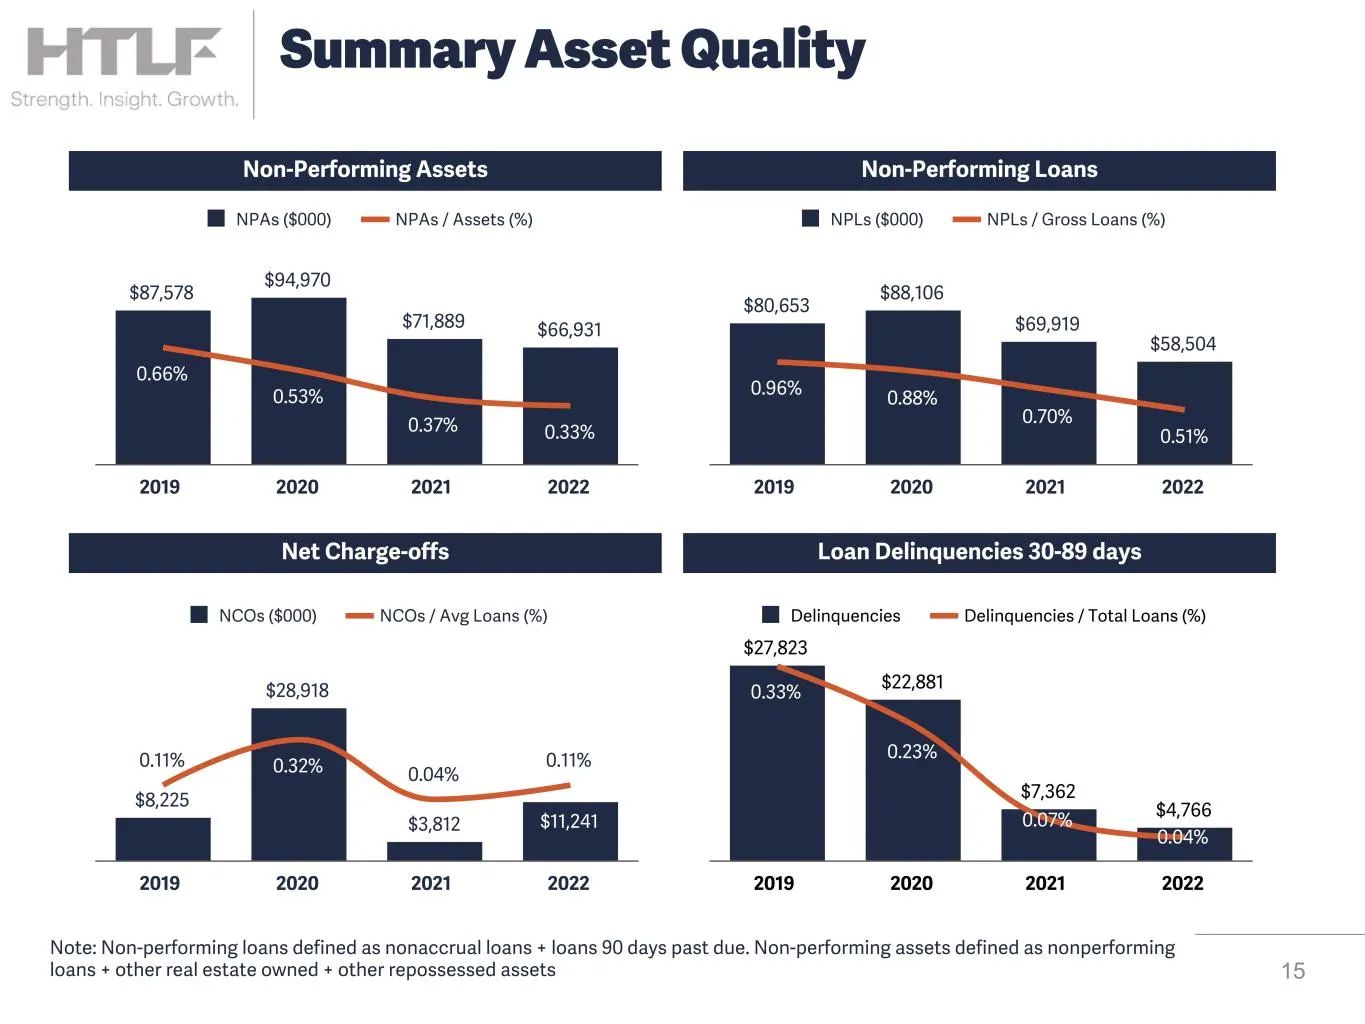
Slide 15: Summary Asset Quality
Non-Performing Assets Non-Performing Loans Net Charge-offs Loan Delinquencies 30-89 days $87,578 $94,970 $71,889 $66,931 0.66% 0.53% 0.37% 0.33% NPAs ($000) NPAs / Assets (%) 2019 2020 2021 2022 $80,653 $88,106 $69,919 $58,504 0.96% 0.88% 0.70% 0.51% NPLs ($000) NPLs / Gross Loans (%) 2019 2020 2021
Slide 16: Financial Summary
Financial Summary 16
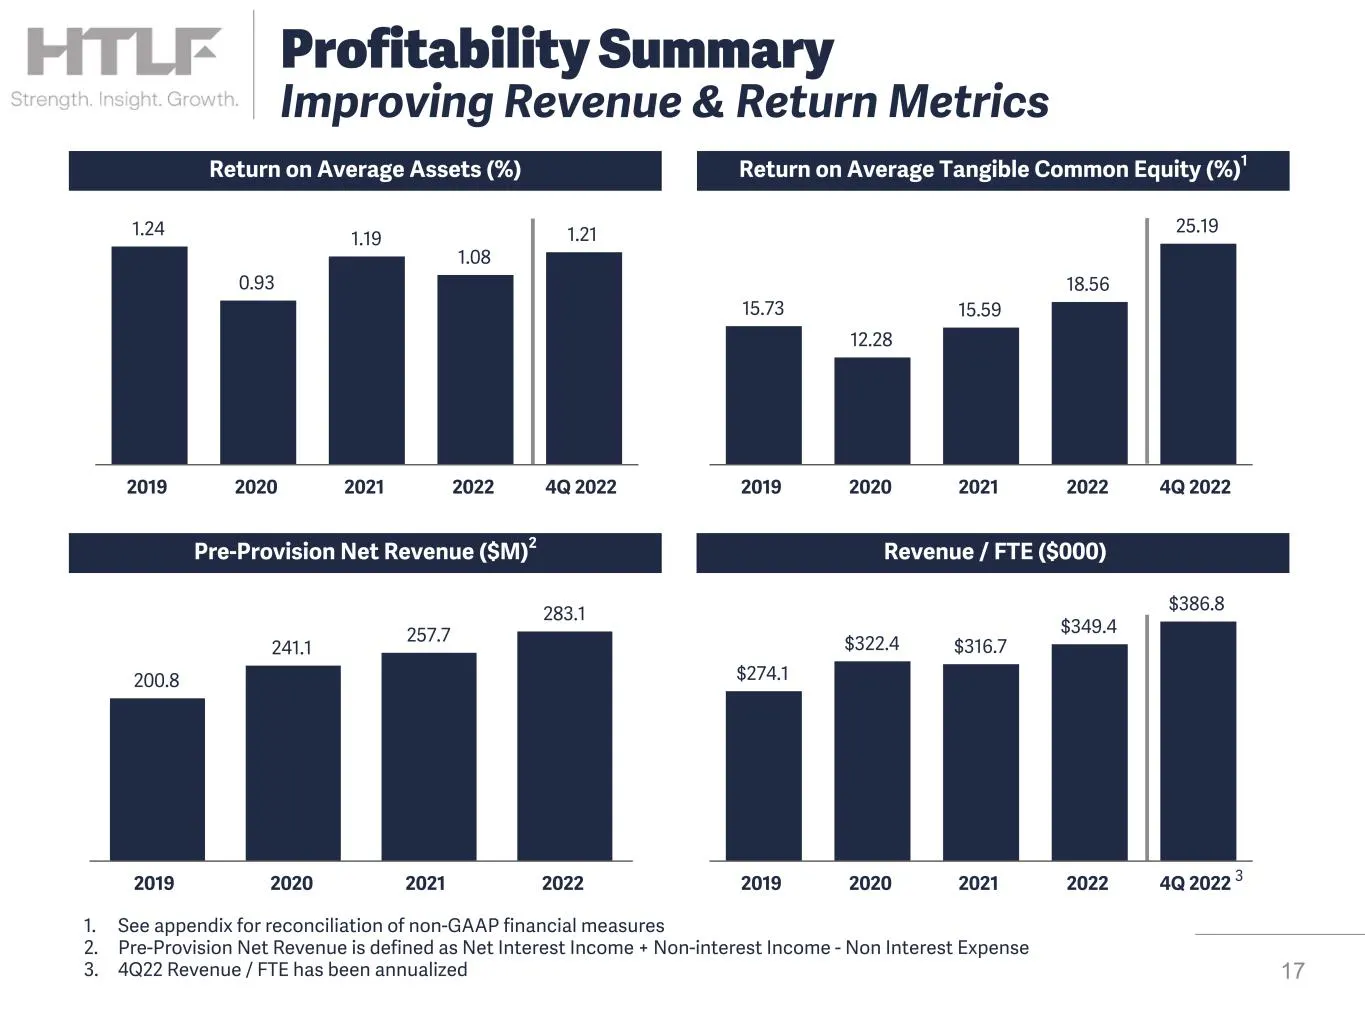
Slide 17: Profitability Summary
Return on Average Assets (%) Return on Average Tangible Common Equity (%)1 Pre-Provision Net Revenue ($M)2 Revenue / FTE ($000) 1.24 0.93 1.19 1.08 1.21 2019 2020 2021 2022 4Q 2022 $274.1 $322.4 $316.7 $349.4 $386.8 2019 2020 2021 2022 4Q 2022 200.8 241.1 257.7 283.1 2019 2020 2021 2022 17 1. See ap
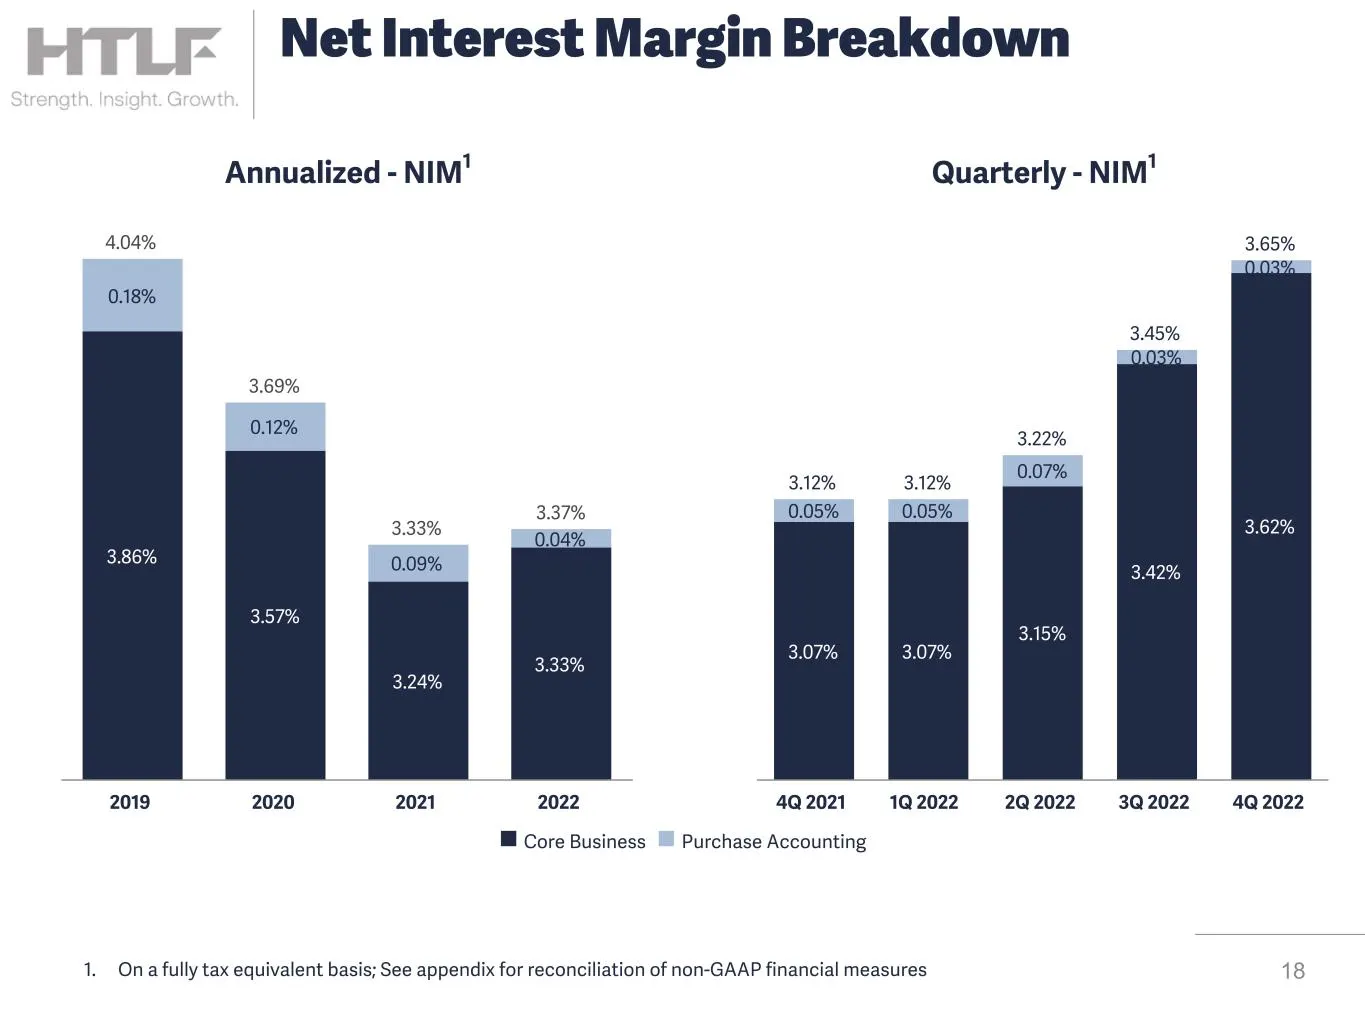
Slide 18: Net Interest Margin Breakdown
4.04% 3.69% 3.33% 3.37% 3.86% 3.57% 3.24% 3.33% 0.18% 0.12% 0.09% 0.04% 2019 2020 2021 2022 3.12% 3.12% 3.22% 3.45% 3.65% 3.07% 3.07% 3.15% 3.42% 3.62% 0.05% 0.05% 0.07% 0.03% 0.03% 4Q 2021 1Q 2022 2Q 2022 3Q 2022 4Q 2022 n Core Business n Purchase Accounting 181. On a fully tax equivalent basis; Se
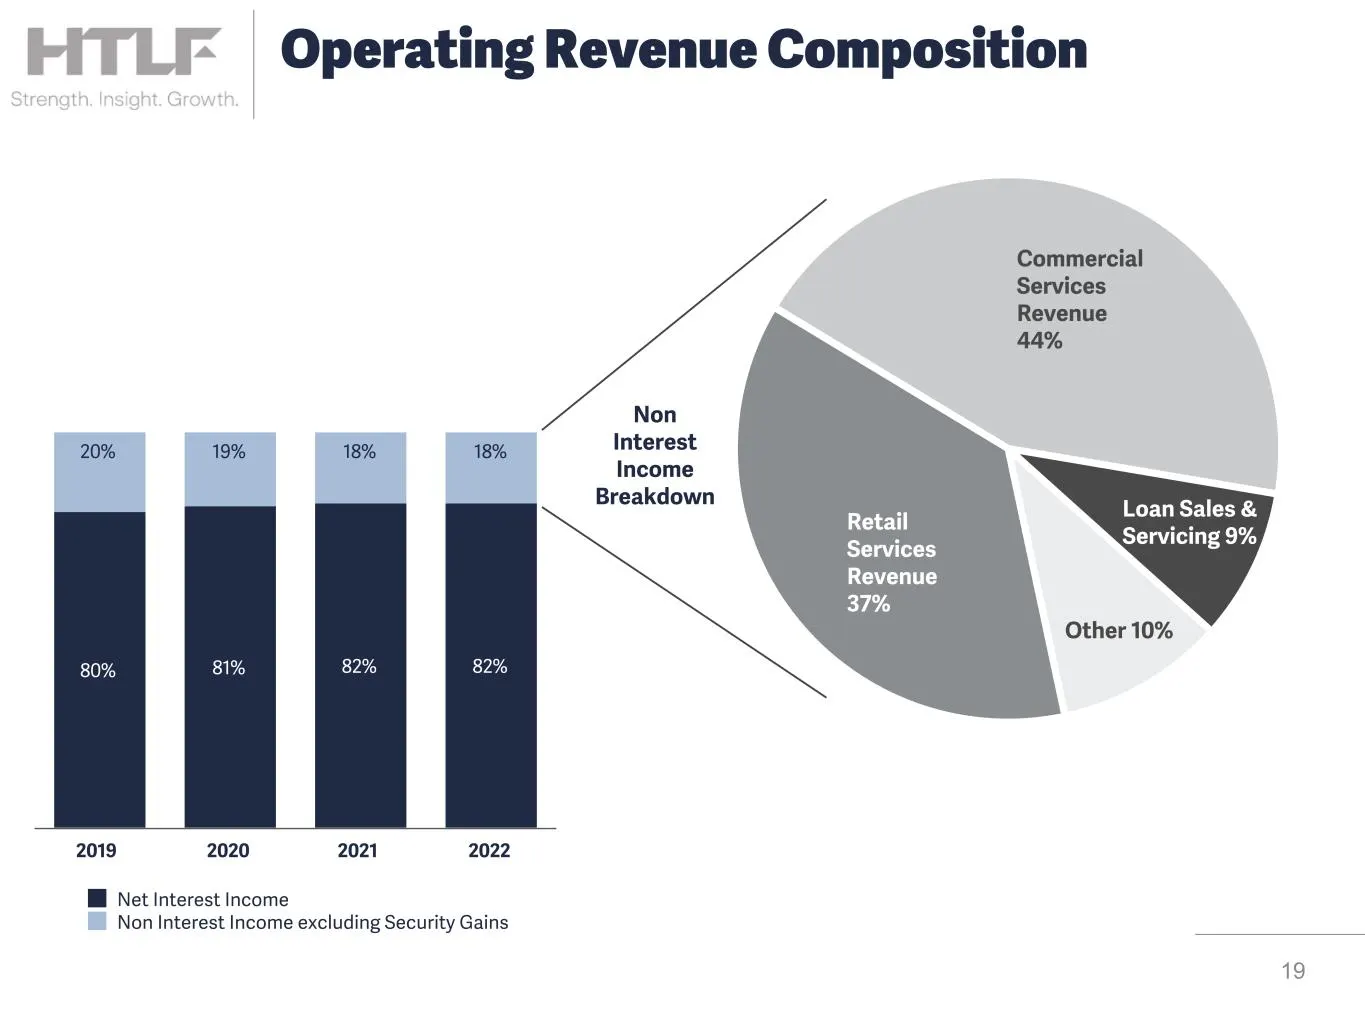
Slide 19: Operating Revenue Composition
Non Interest Income Breakdown 80% 81% 82% 82% 20% 19% 18% 18% Net Interest Income Non Interest Income excluding Security Gains 2019 2020 2021 2022 Retail Services Revenue 37% Commercial Services Revenue 44% Loan Sales & Servicing 9% Other 10% 19 Operating Revenue Composition
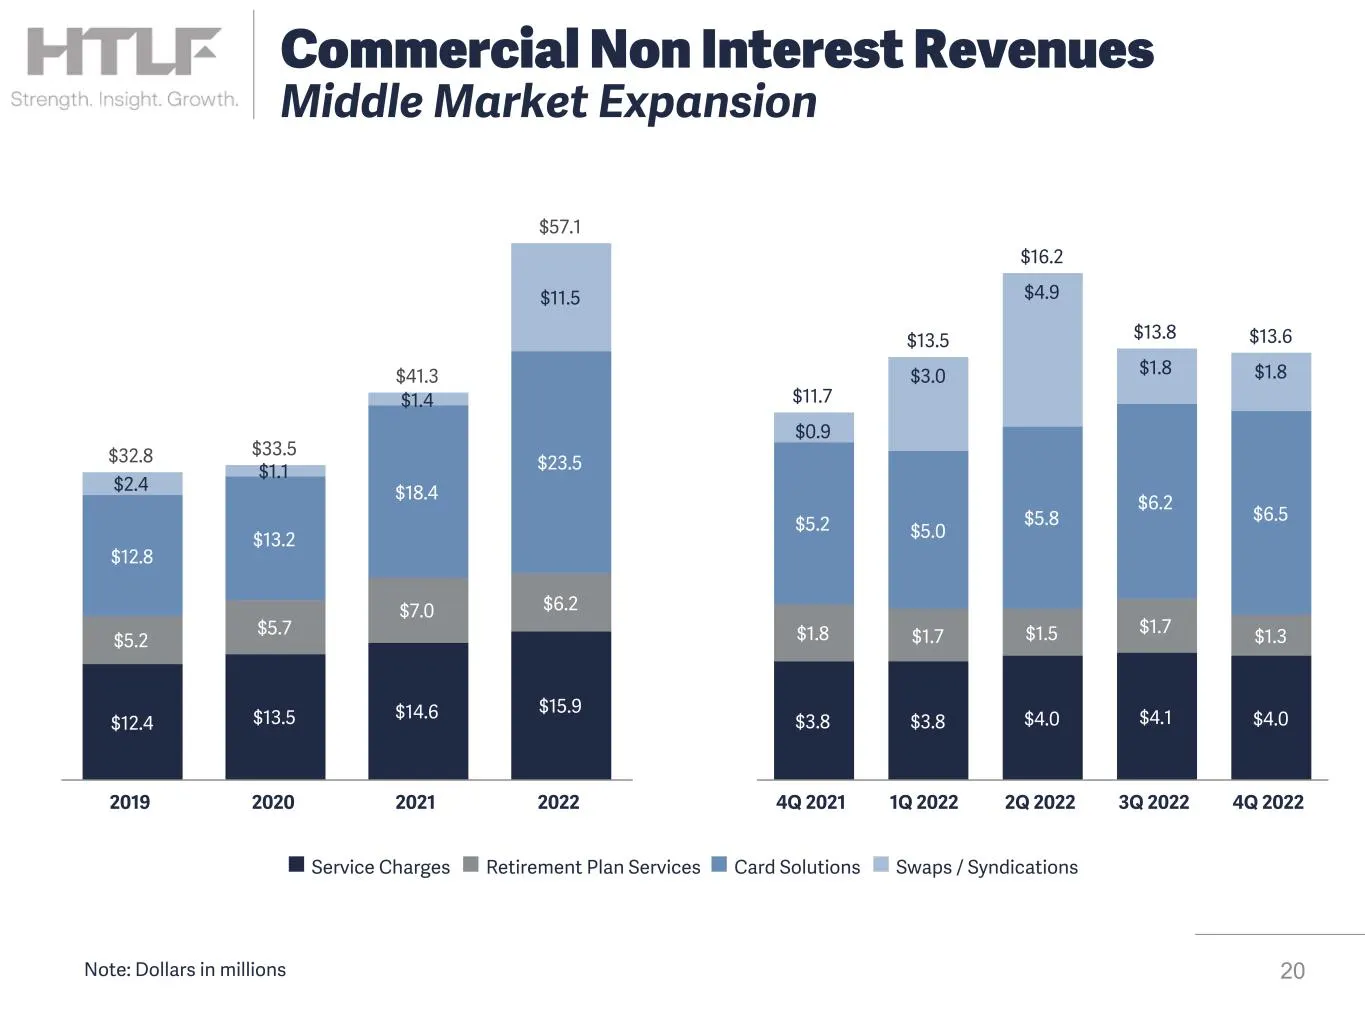
Slide 20: Commercial Non Interest Revenues
$32.8 $33.5 $41.3 $57.1 $12.4 $13.5 $14.6 $15.9 $5.2 $5.7 $7.0 $6.2 $12.8 $13.2 $18.4 $23.5 $2.4 $1.1 $1.4 $11.5 2019 2020 2021 2022 $11.7 $13.5 $16.2 $13.8 $13.6 $3.8 $3.8 $4.0 $4.1 $4.0 $1.8 $1.7 $1.5 $1.7 $1.3 $5.2 $5.0 $5.8 $6.2 $6.5 $0.9 $3.0 $4.9 $1.8 $1.8 4Q 2021 1Q 2022 2Q 2022 3Q 2022 4Q 20
Slide 21: Consumer Non Interest Revenues
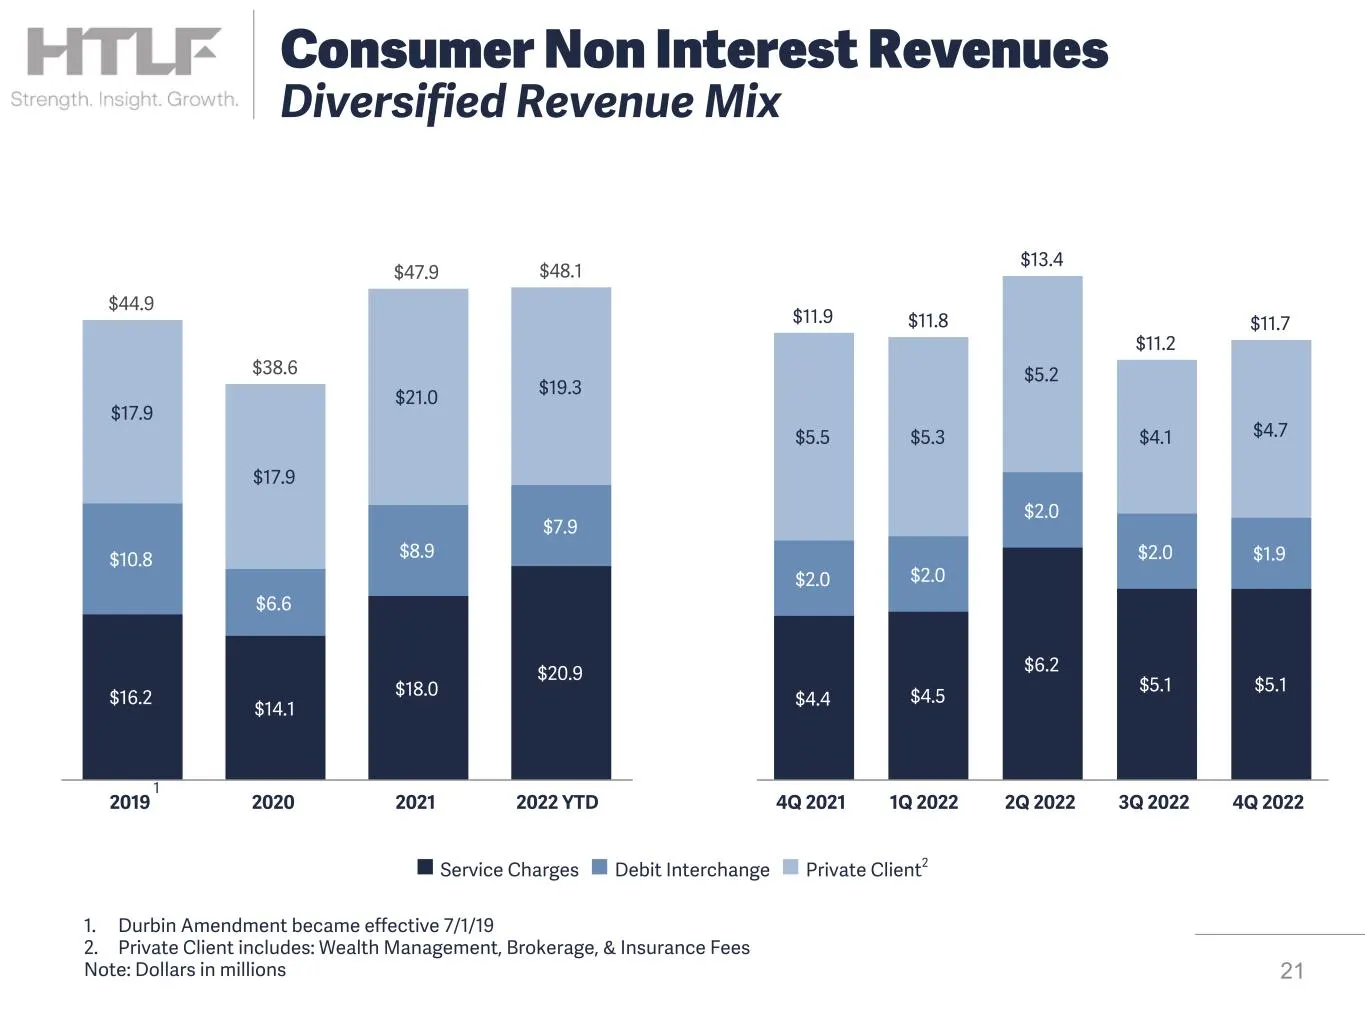
1. Durbin Amendment became effective 7/1/19 2. Private Client includes: Wealth Management, Brokerage, & Insurance Fees Note: Dollars in millions $44.9 $38.6 $47.9 $48.1 $16.2 $14.1 $18.0 $20.9 $10.8 $6.6 $8.9 $7.9 $17.9 $17.9 $21.0 $19.3 2019 2020 2021 2022 YTD $11.9 $11.8 $13.4 $11.2 $11.7 $4.4 $4.
Slide 22: Balance Sheet Summary
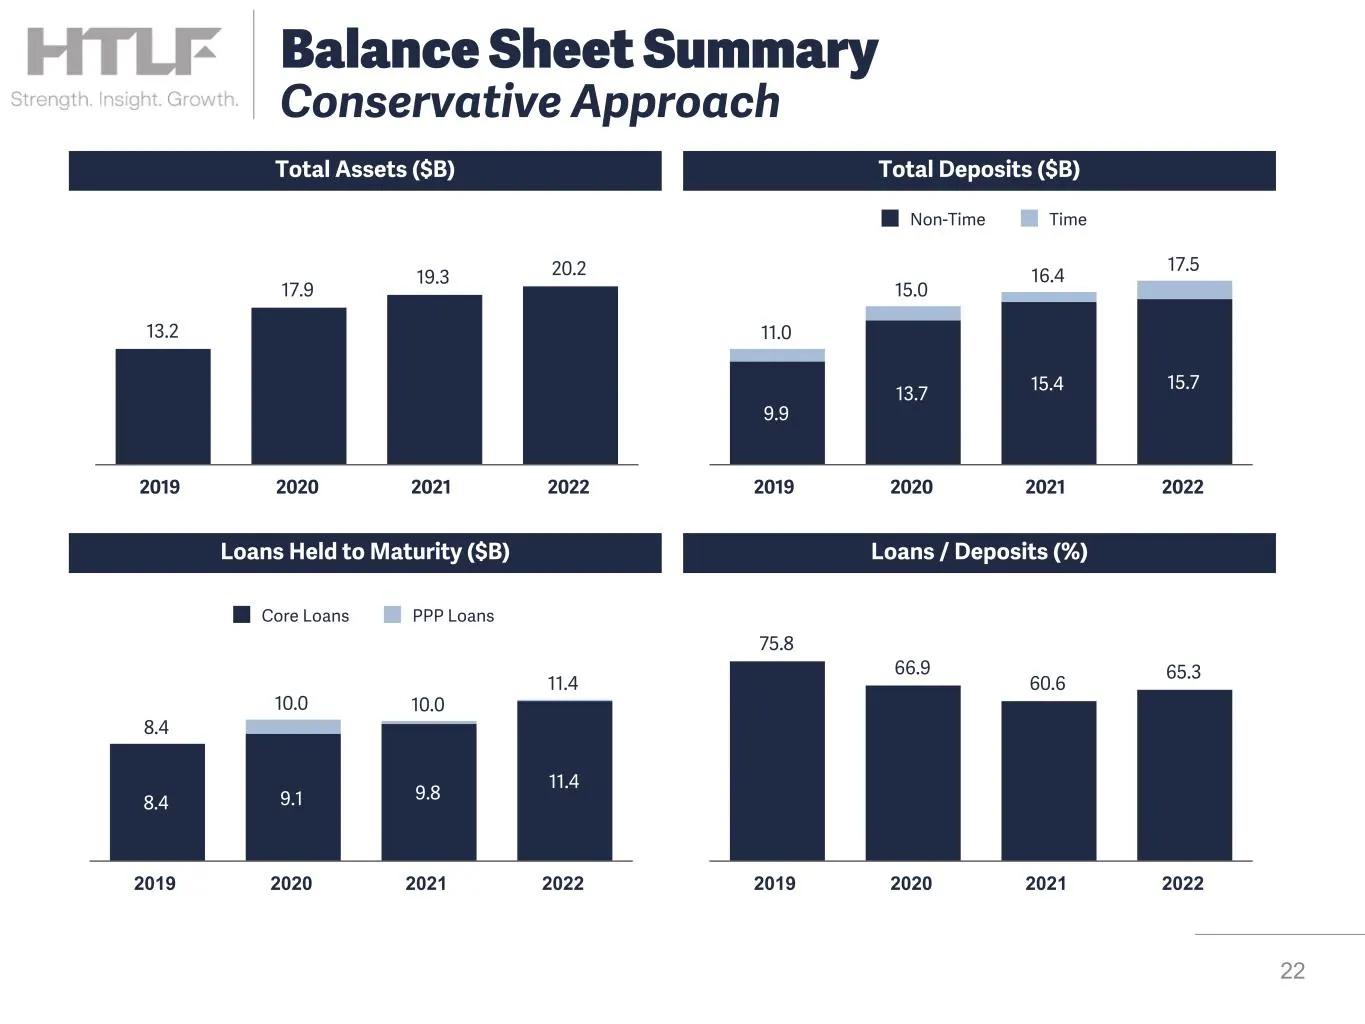
Total Assets ($B) Total Deposits ($B) Loans Held to Maturity ($B) Loans / Deposits (%) 13.2 17.9 19.3 20.2 2019 2020 2021 2022 11.0 15.0 16.4 17.5 9.9 13.7 15.4 15.7 Non-Time Time 2019 2020 2021 2022 8.4 10.0 10.0 11.4 8.4 9.1 9.8 11.4 Core Loans PPP Loans 2019 2020 2021 2022 75.8 66.9 60.6 65.3 201
Slide 23: Deposit Summary
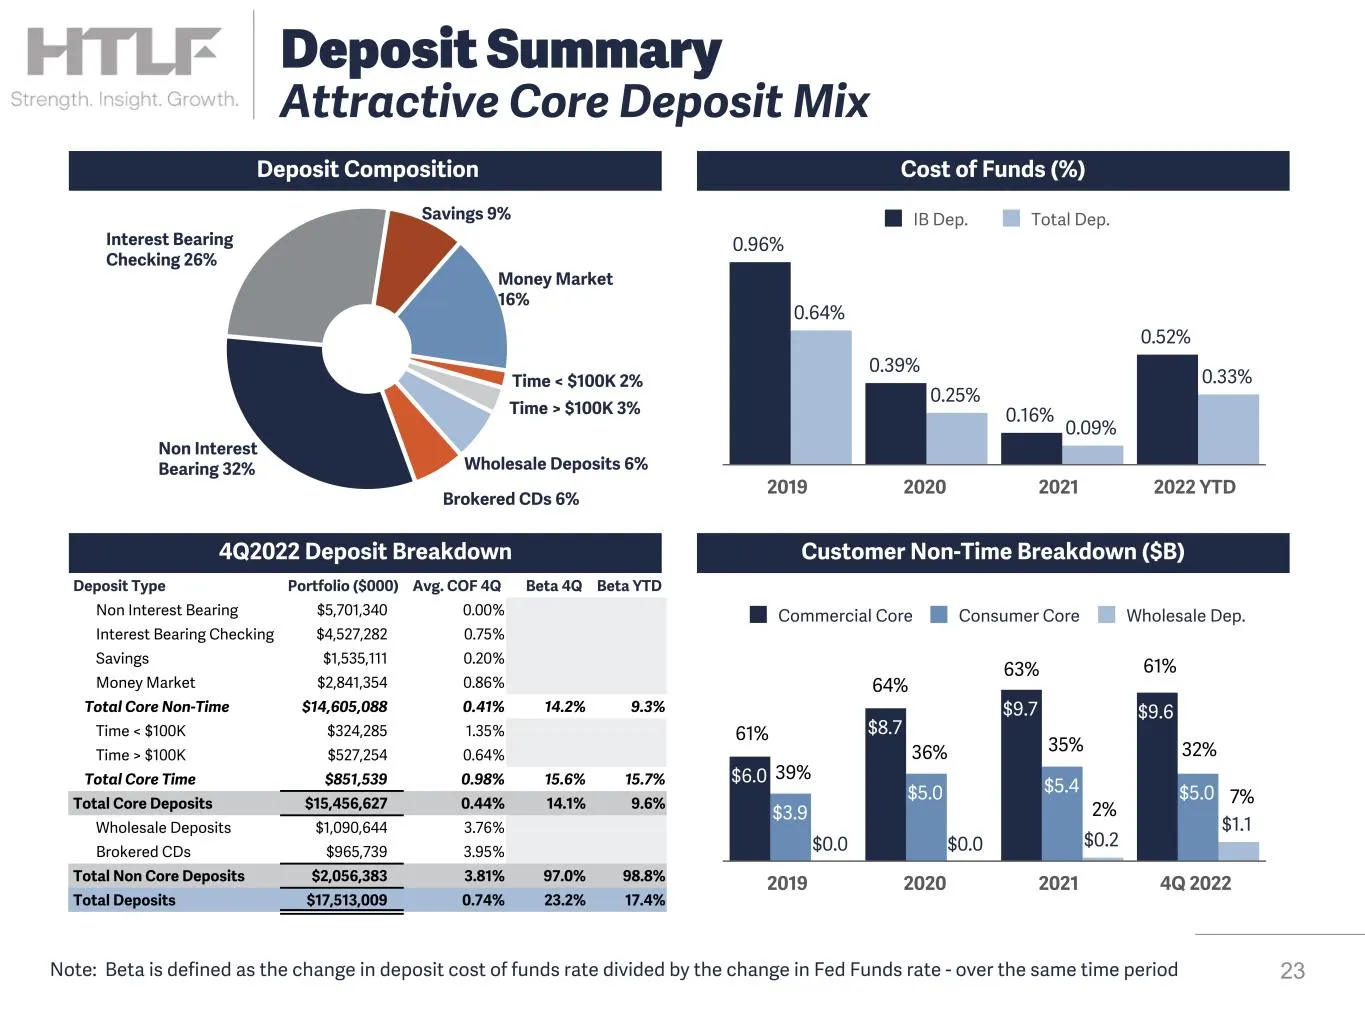
$6.0 $8.7 $9.7 $9.6 $3.9 $5.0 $5.4 $5.0 $0.0 $0.0 $0.2 $1.1 Commercial Core Consumer Core Wholesale Dep. 2019 2020 2021 4Q 2022 Deposit Composition Cost of Funds (%) Customer Non-Time Breakdown ($B) 0.96% 0.39% 0.16% 0.52% 0.64% 0.25% 0.09% 0.33% IB Dep. Total Dep. 2019 2020 2021 2022 YTD 61% 39% 64
Slide 24: Diversified Loan Portfolio Across both Product and Footprint
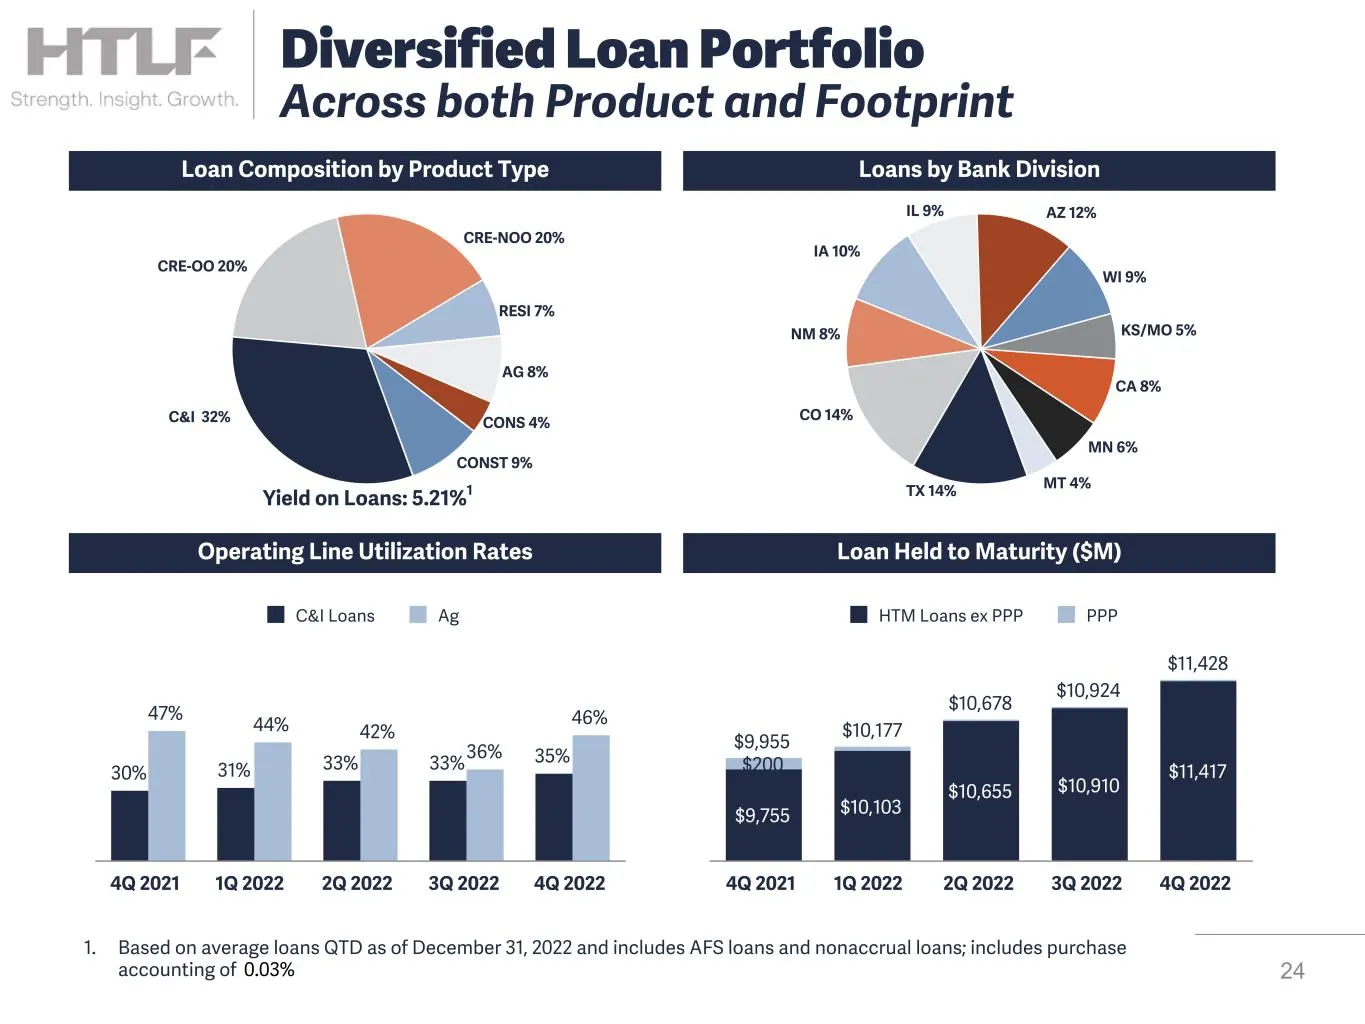
Loan Composition by Product Type Loans by Bank Division Loan Held to Maturity ($M)Operating Line Utilization Rates C&I 32% CRE-OO 20% CRE-NOO 20% RESI 7% AG 8% CONS 4% CONST 9% Yield on Loans: 5.21%1 TX 14% CO 14% NM 8% IA 10% IL 9% AZ 12% WI 9% KS/MO 5% CA 8% MN 6% MT 4% 30% 31% 33% 33% 35% 47% 44%
Slide 25: Allowance for Credit Related Losses
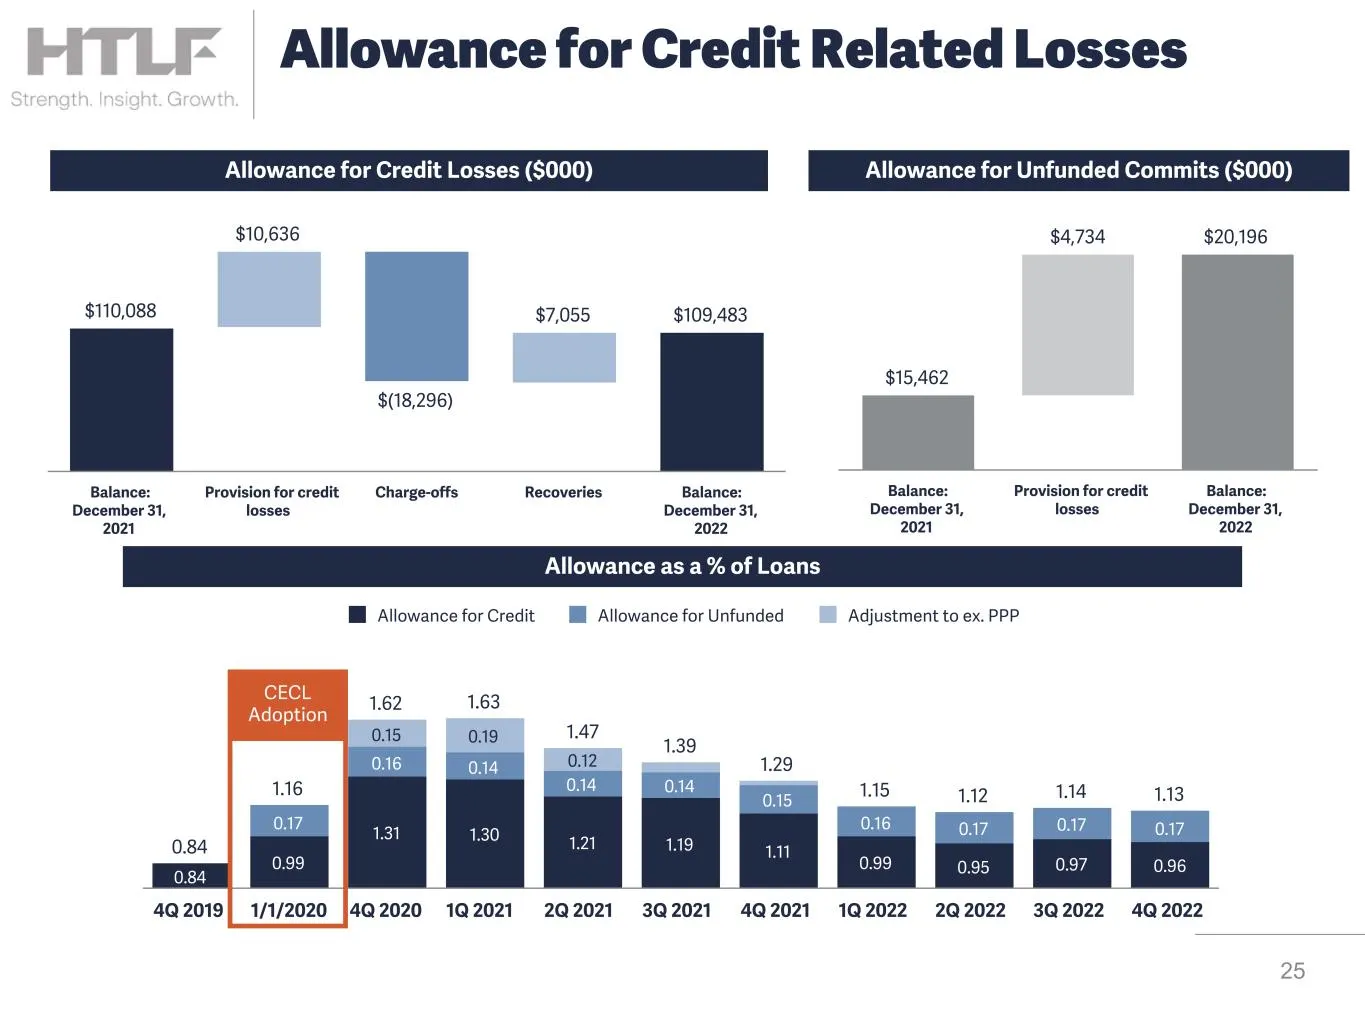
0.84 1.16 1.15 1.12 1.14 1.13 1.62 1.63 1.47 1.39 1.29 0.84 0.99 1.31 1.30 1.21 1.19 1.11 0.99 0.95 0.97 0.96 0.17 0.16 0.14 0.14 0.14 0.15 0.16 0.17 0.17 0.17 0.15 0.19 0.12 Allowance for Credit Allowance for Unfunded Adjustment to ex. PPP 4Q 2019 1/1/2020 4Q 2020 1Q 2021 2Q 2021 3Q 2021 4Q 2021 1Q
Slide 26: Consolidated Capital Ratios
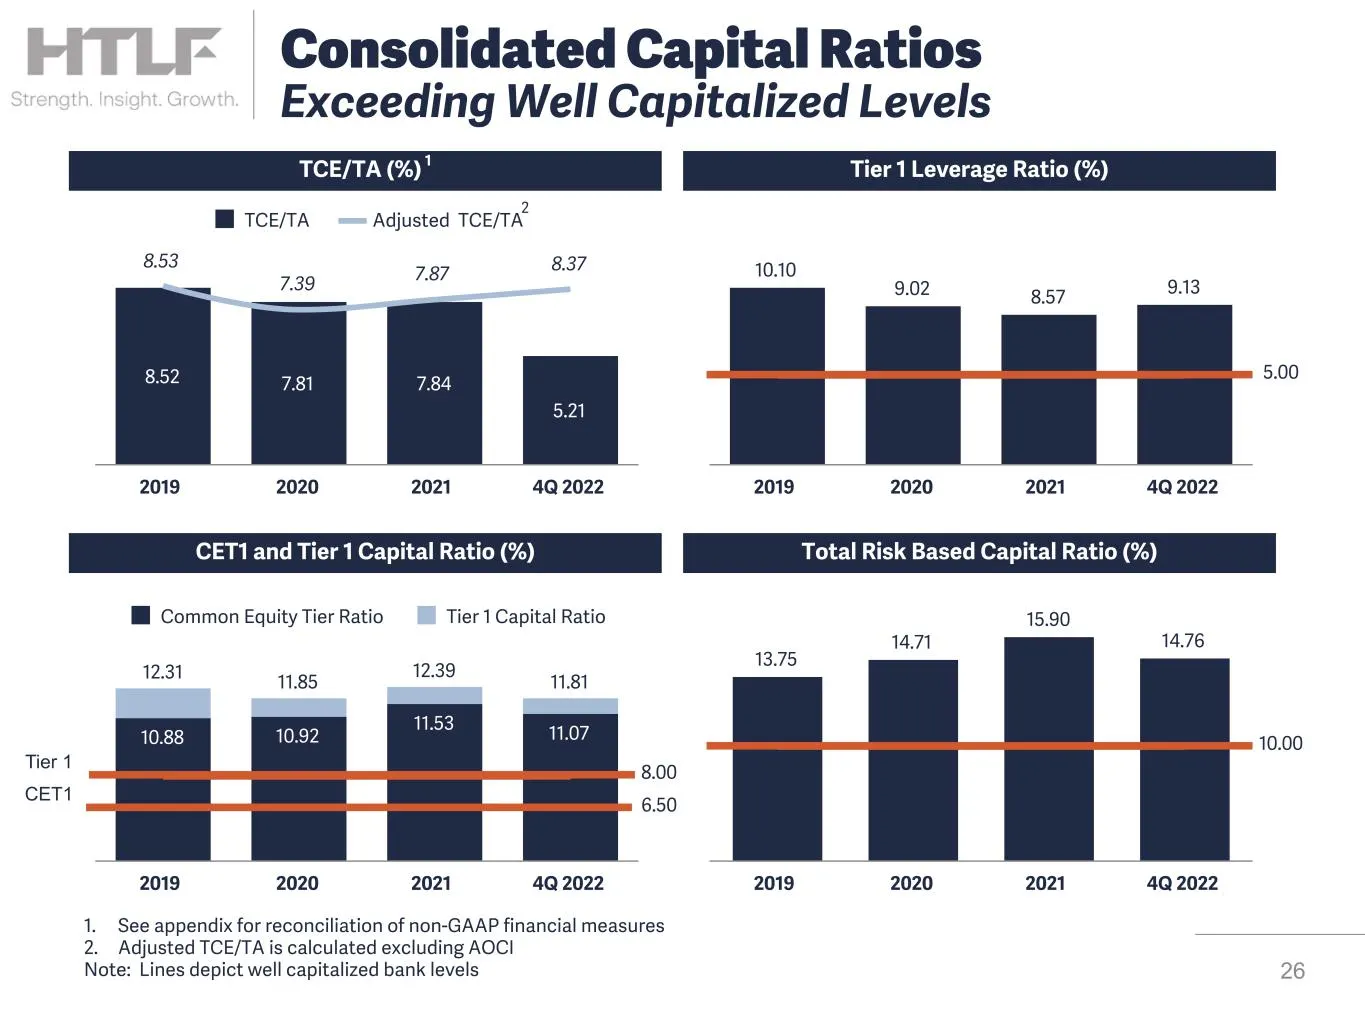
TCE/TA (%) 1 Tier 1 Leverage Ratio (%) CET1 and Tier 1 Capital Ratio (%) Total Risk Based Capital Ratio (%) 8.52 7.81 7.84 5.21 8.53 7.39 7.87 8.37 TCE/TA Adjusted TCE/TA 2019 2020 2021 4Q 2022 10.10 9.02 8.57 9.13 5.00 2019 2020 2021 4Q 2022 12.31 11.85 12.39 11.81 10.88 10.92 11.53 11.07 Common Eq
Slide 27: Investment Portfolio Detail
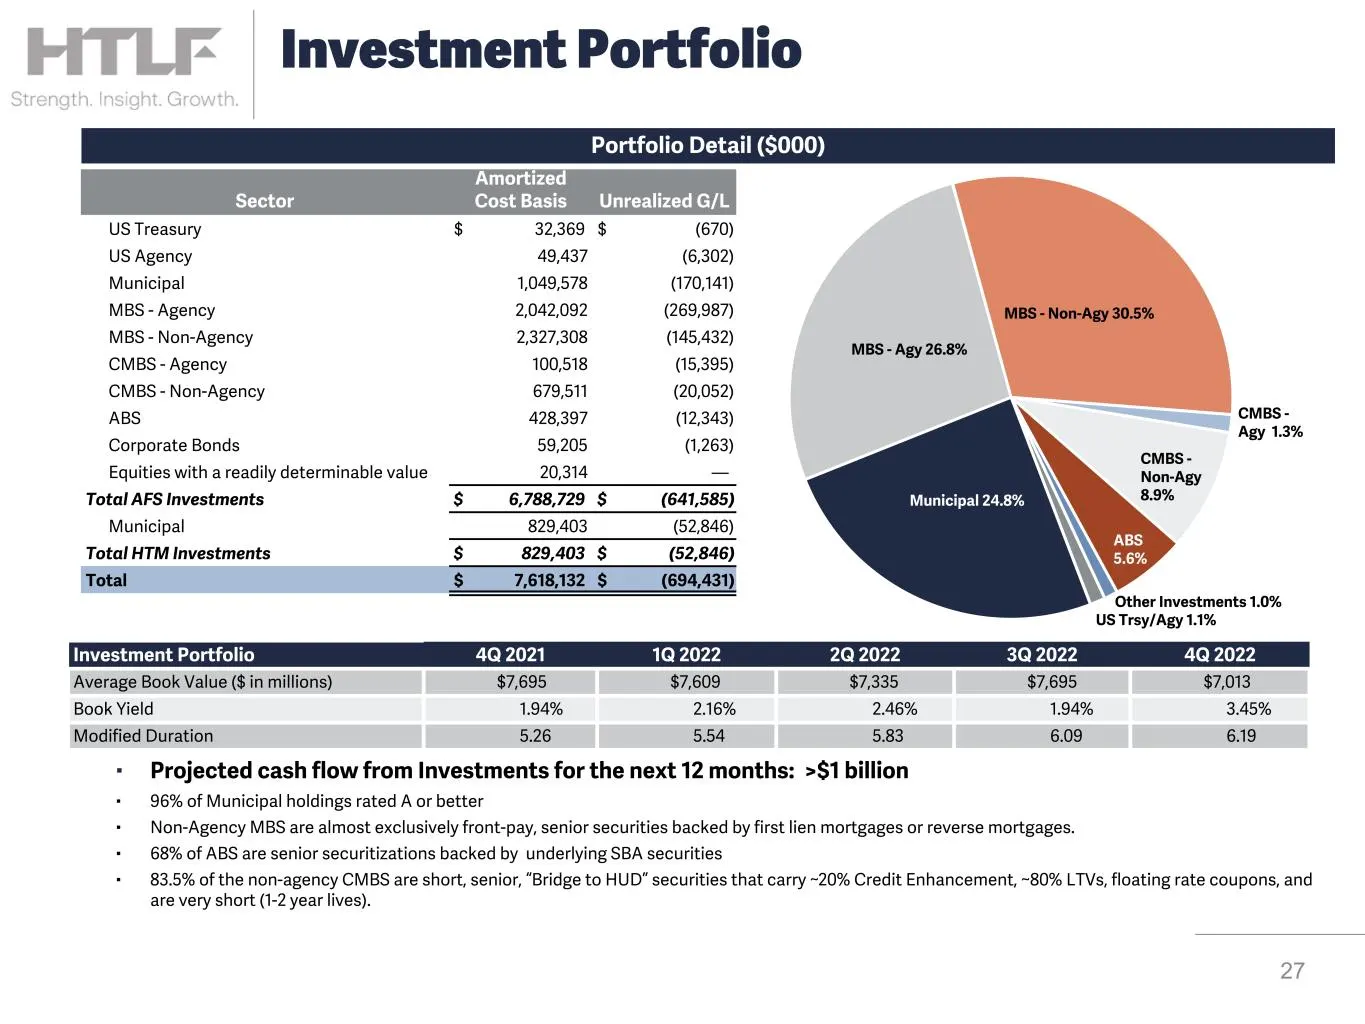
▪ Projected cash flow from Investments for the next 12 months: >$1 billion ▪ 96% of Municipal holdings rated A or better ▪ Non-Agency MBS are almost exclusively front-pay, senior securities backed by first lien mortgages or reverse mortgages. ▪ 68% of ABS are senior securitizations backed by underly
Slide 28: Liquidity and Capital Instruments
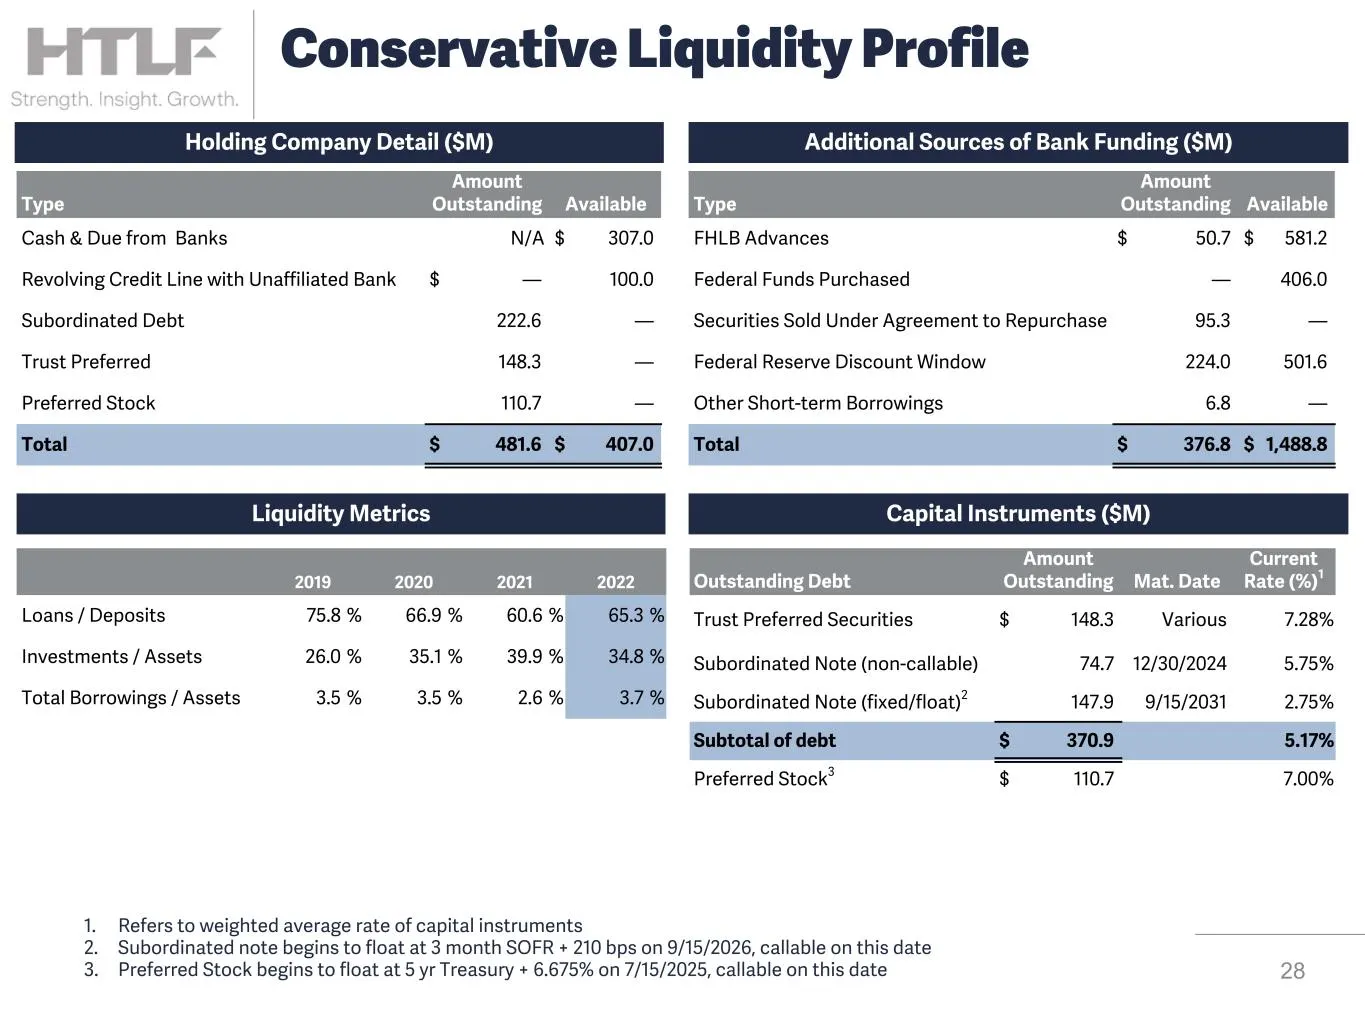
Capital Instruments ($M)Liquidity Metrics Additional Sources of Bank Funding ($M)Holding Company Detail ($M) Type Amount Outstanding Available Cash & Due from Banks N/A $ 307.0 Revolving Credit Line with Unaffiliated Bank $ — 100.0 Subordinated Debt 222.6 — Trust Preferred 148.3 — Preferred Stock 11
Slide 29: Living our Core Values
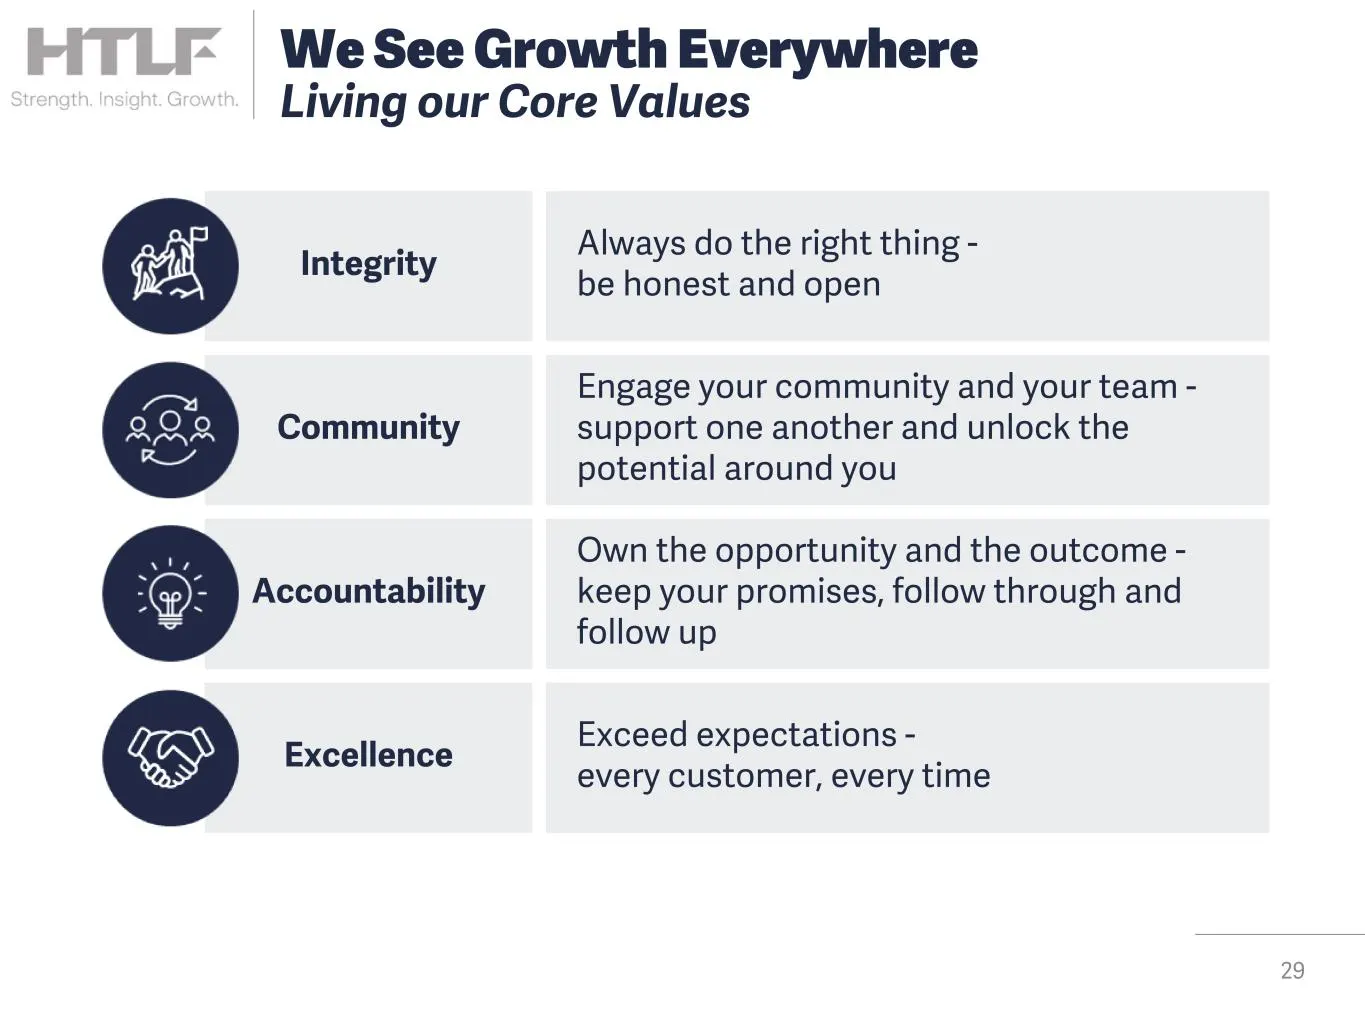
29 Integrity Community Accountability Excellence Always do the right thing - be honest and open Engage your community and your team - support one another and unlock the potential around you Own the opportunity and the outcome - keep your promises, follow through and follow up Exceed expectations - e
Slide 30: ESG and Community Initiatives
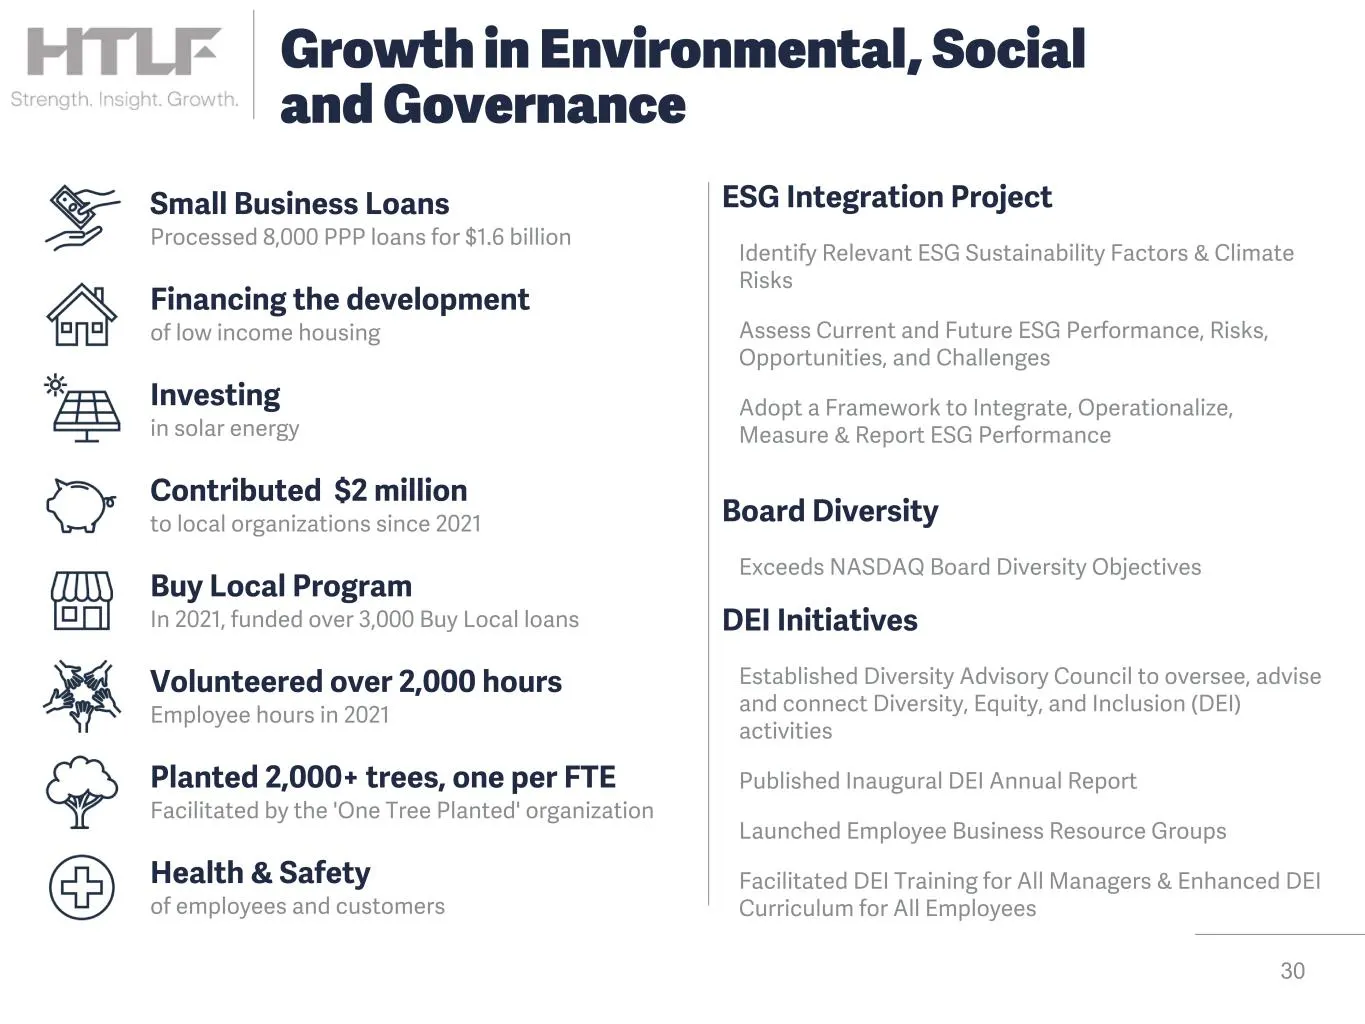
Contributed $2 million to local organizations since 2021 Investing in solar energy Health & Safety of employees and customers Buy Local Program In 2021, funded over 3,000 Buy Local loans Volunteered over 2,000 hours Employee hours in 2021 Financing the development of low income housing Small Busines
Slide 31: HTLF Investor Summary
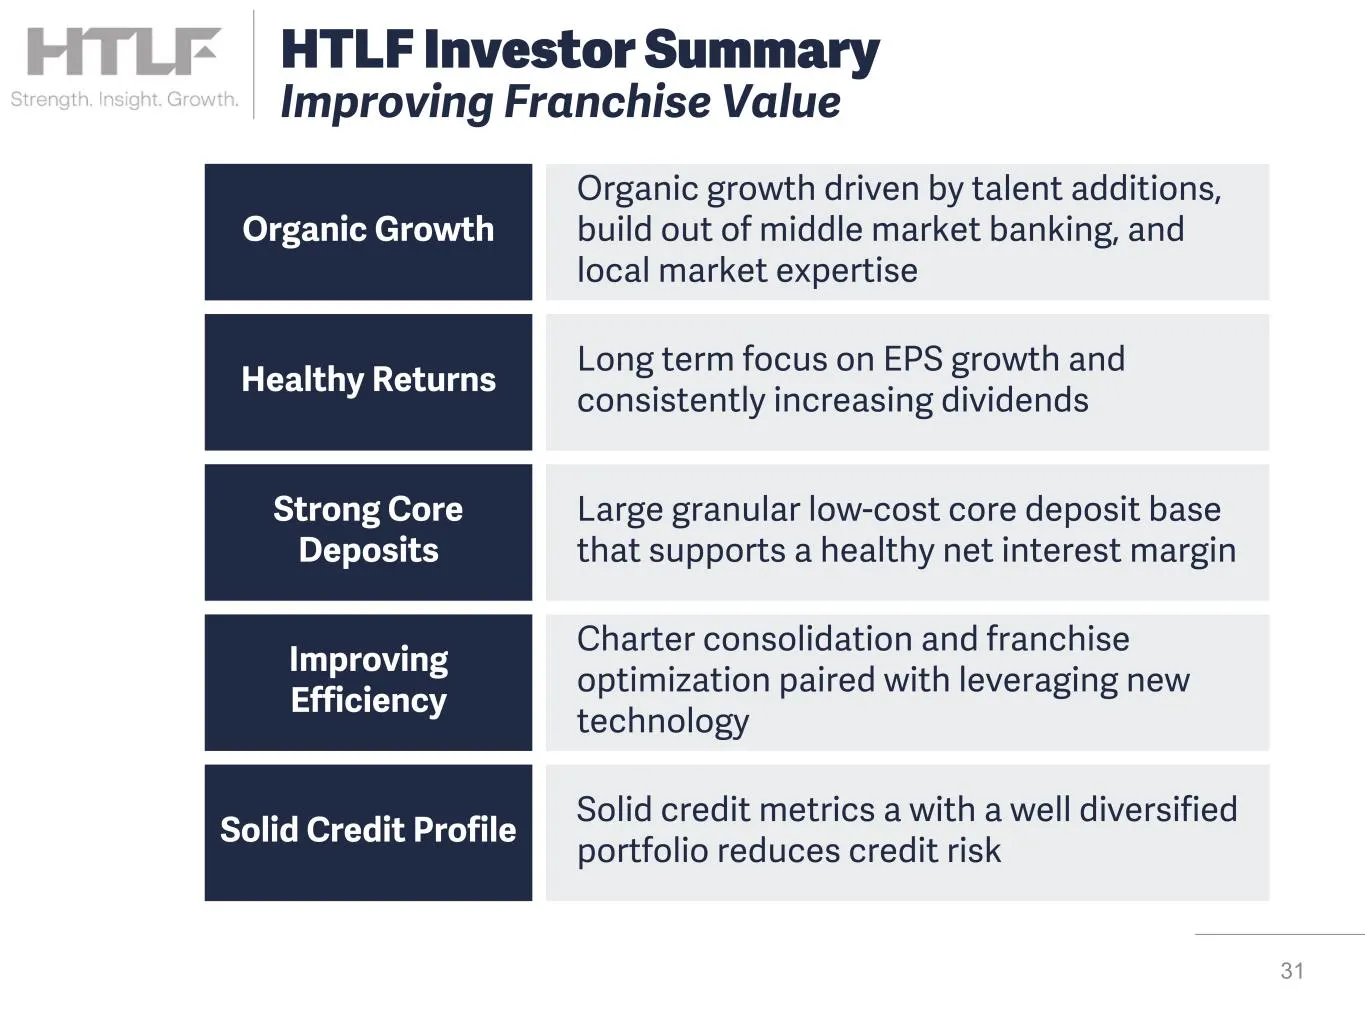
31 Organic Growth Healthy Returns Strong Core Deposits Improving Efficiency Organic growth driven by talent additions, build out of middle market banking, and local market expertise Large granular low-cost core deposit base that supports a healthy net interest margin Charter consolidation and franch
Slide 32: Contact Information
-ITLE Contact Information FTLF Strength. Insight. Growth. Bruce K. Lee President and CEO 563.587.4176 office 419.351.1274 cell BLee@htlf.com FHTLF Strength. Insight. Growth. Bryan R. McKeag EVP, Chief Financial Officer 563,5871994 office 920.284.0732 cell BMcKeag@htif.com FTLF Strength. Insight. Gro
Slide 33: Supplementary Data
33 Supplementary Data
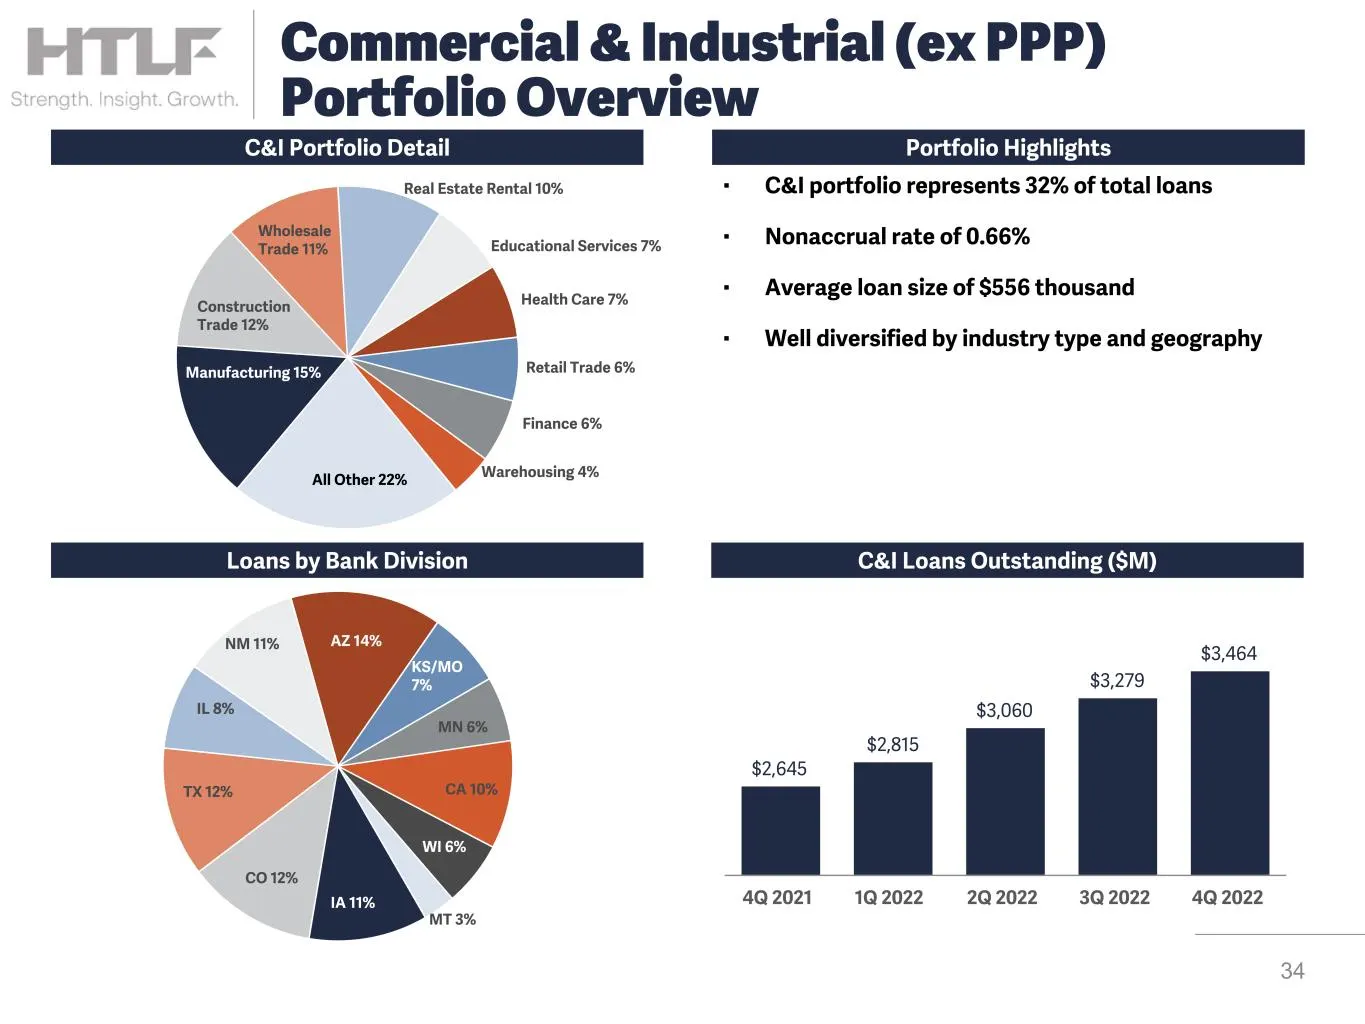
Slide 34: Commercial & Industrial Portfolio Overview
Manufacturing 15% Construction Trade 12% Wholesale Trade 11% Real Estate Rental 10% Educational Services 7% Health Care 7% Retail Trade 6% Finance 6% Warehousing 4%All Other 22% ▪ C&I portfolio represents 32% of total loans ▪ Nonaccrual rate of 0.66% ▪ Average loan size of $556 thousand ▪ Well diver
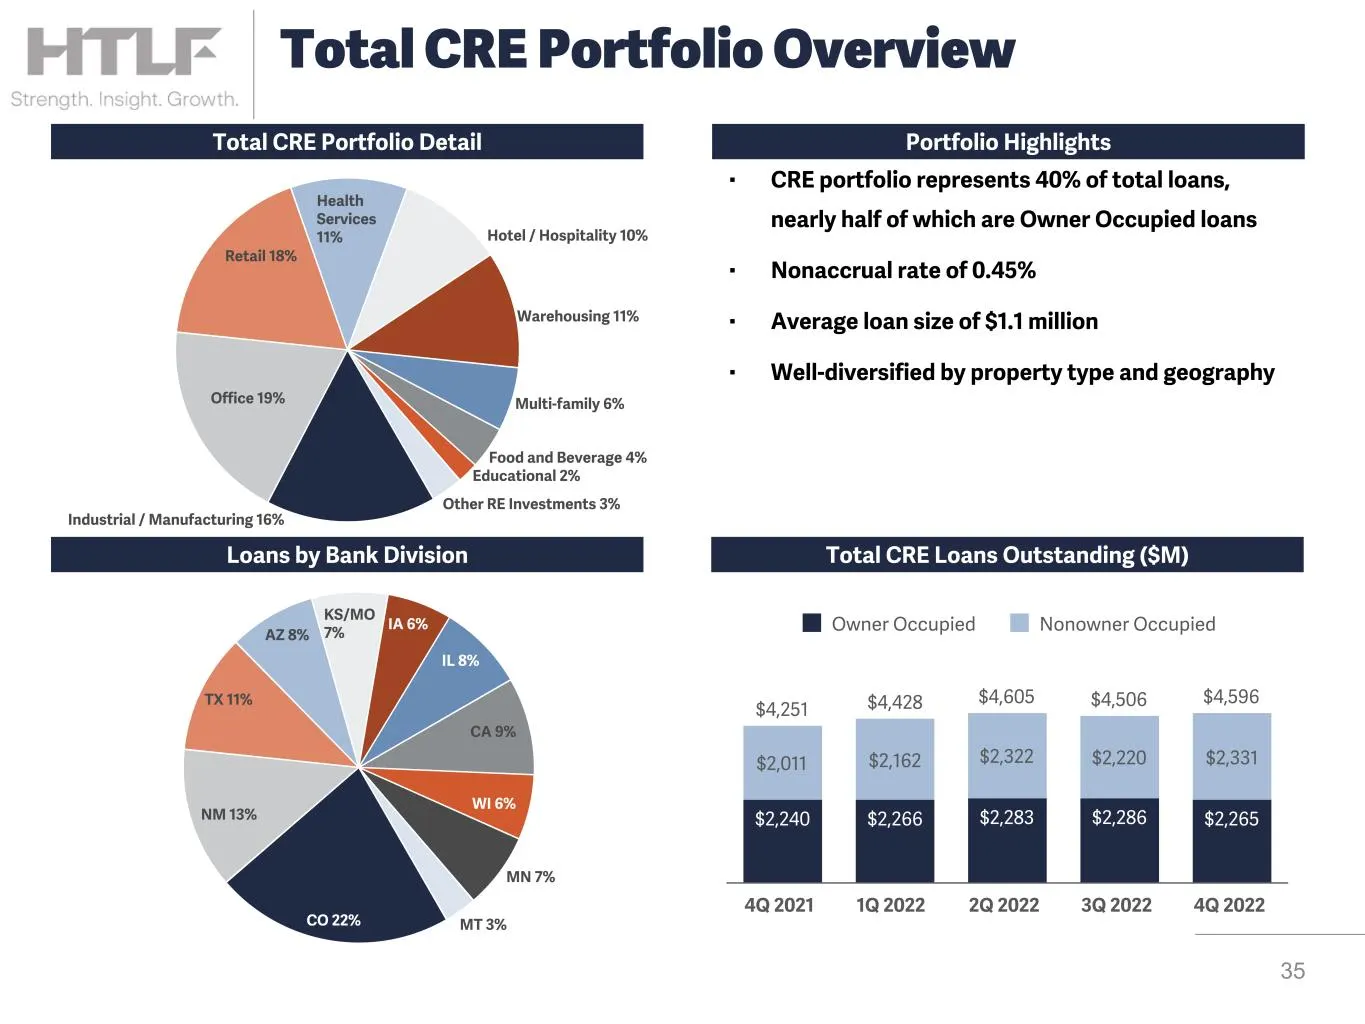
Slide 35: Total CRE Portfolio Overview
CO 22% NM 13% TX 11% AZ 8% KS/MO 7% IA 6% IL 8% CA 9% WI 6% MN 7% MT 3% Industrial / Manufacturing 16% Office 19% Retail 18% Health Services 11% Hotel / Hospitality 10% Warehousing 11% Multi-family 6% Food and Beverage 4% Educational 2% Other RE Investments 3% ▪ CRE portfolio represents 40% of total
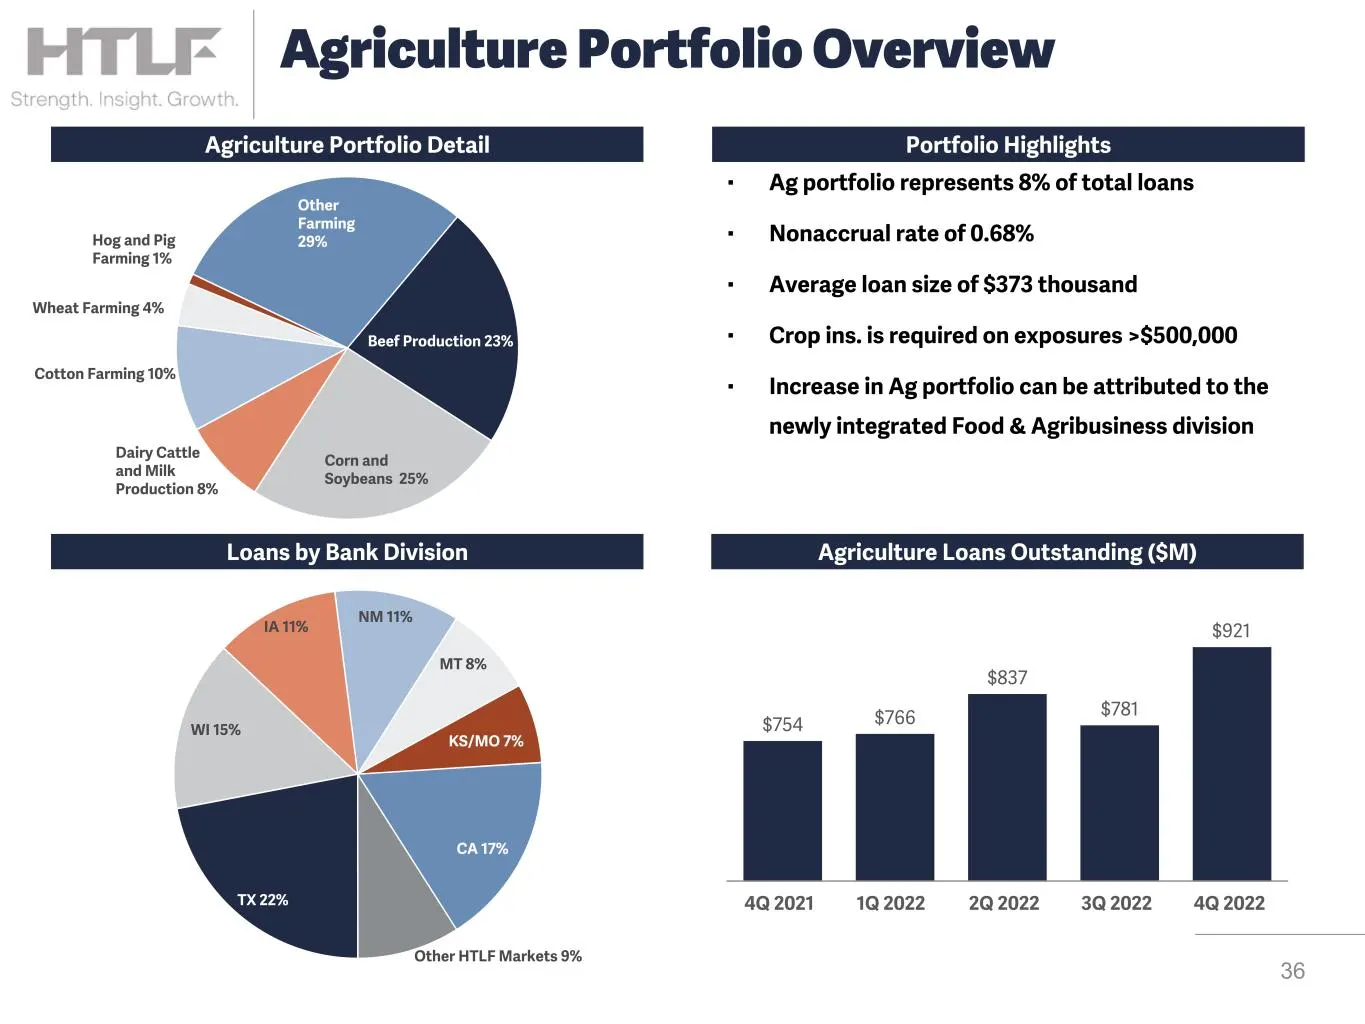
Slide 36: Agriculture Portfolio Overview
TX 22% WI 15% IA 11% NM 11% MT 8% KS/MO 7% CA 17% Other HTLF Markets 9% ▪ Ag portfolio represents 8% of total loans ▪ Nonaccrual rate of 0.68% ▪ Average loan size of $373 thousand ▪ Crop ins. is required on exposures >$500,000 ▪ Increase in Ag portfolio can be attributed to the newly integrated Food
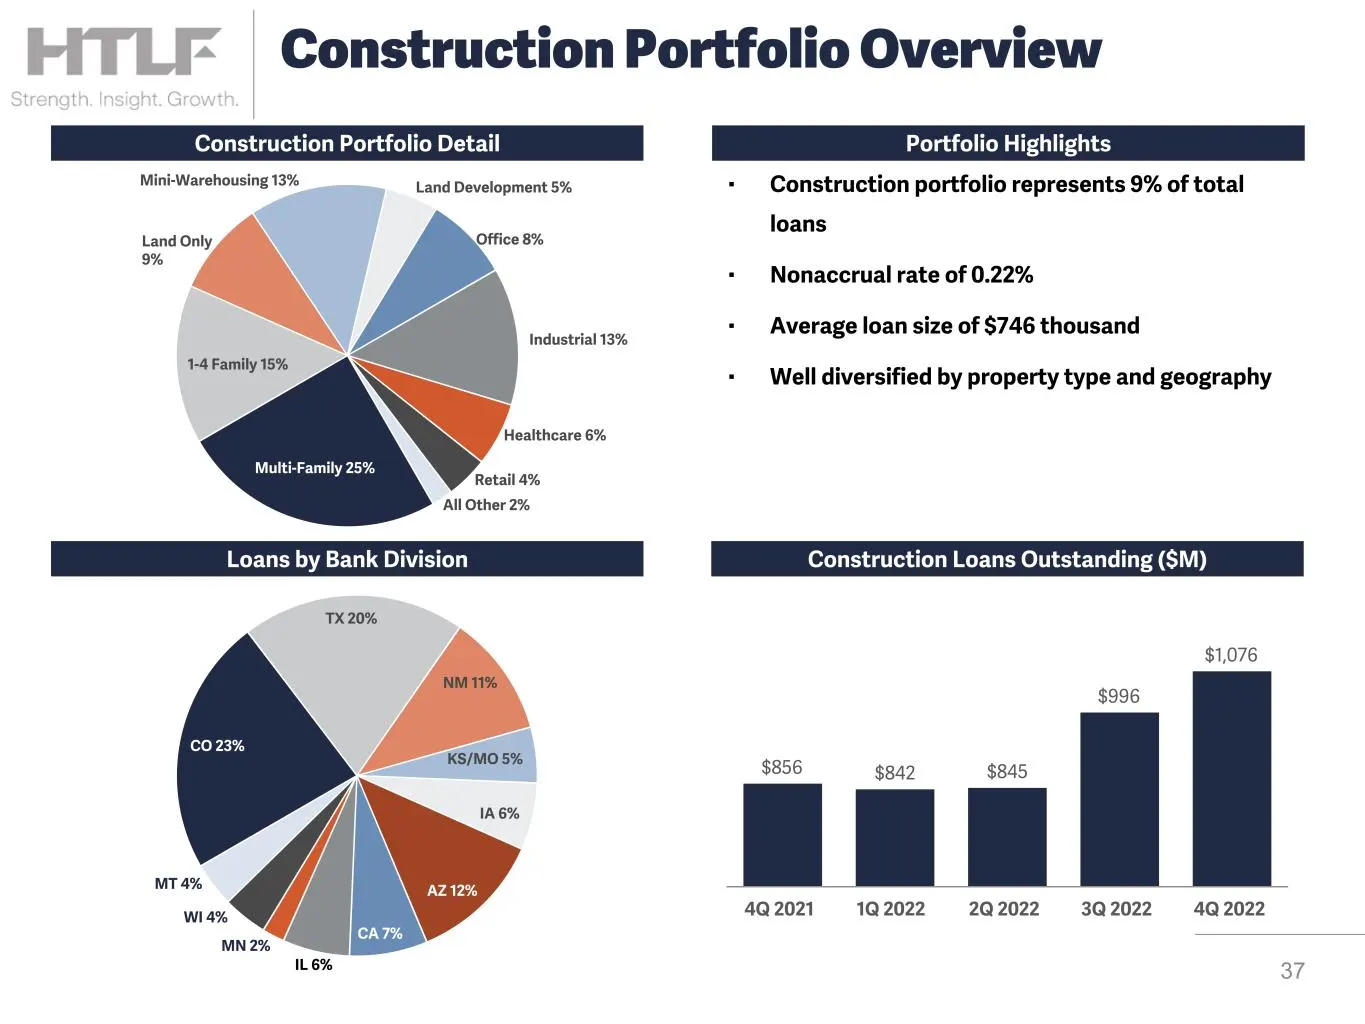
Slide 37: Construction Portfolio Overview
Multi-Family 25% 1-4 Family 15% Land Only 9% Mini-Warehousing 13% Land Development 5% Office 8% Industrial 13% Healthcare 6% Retail 4% All Other 2% Portfolio HighlightsConstruction Portfolio Detail ▪ Construction portfolio represents 9% of total loans ▪ Nonaccrual rate of 0.22% ▪ Average loan size o
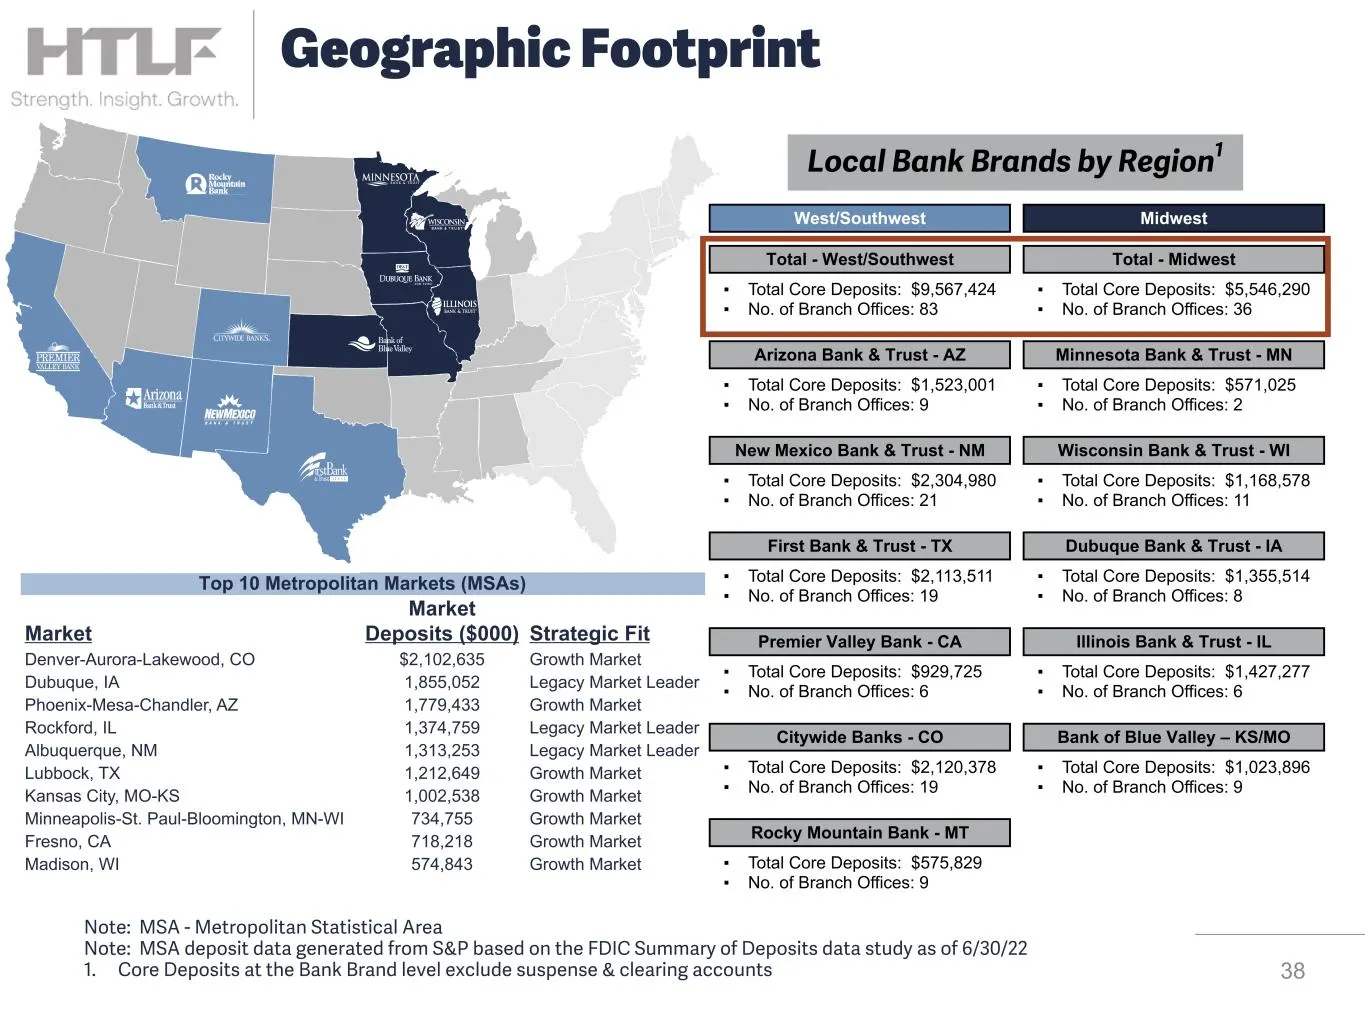
Slide 38: Local Bank Brands by Region
Local Bank Brands by Region1 Bank of Blue Valley – KS/MO Illinois Bank & Trust - IL Total - Midwest Midwest ▪ Total Core Deposits: $1,427,277 ▪ No. of Branch Offices: 6 ▪ Total Core Deposits: $1,023,896 ▪ No. of Branch Offices: 9 Rocky Mountain Bank - MT Citywide Banks - CO Premier Valley Bank - CA
Slide 39: Non-GAAP Reconciliation
39 Non-GAAP Reconciliation
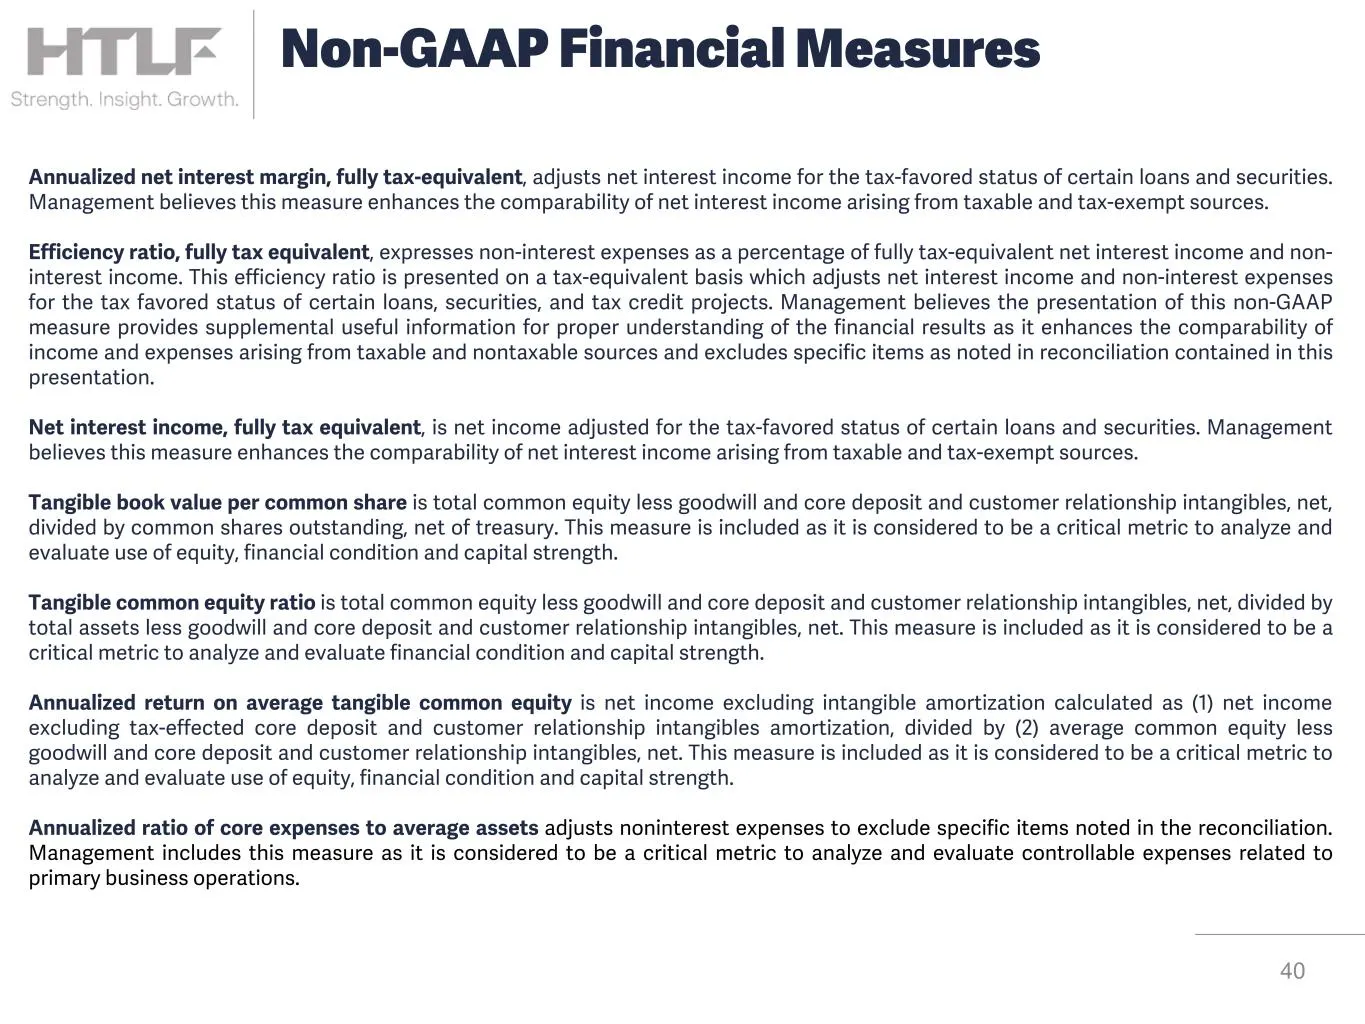
Slide 40: Non-GAAP Measure Definitions
Annualized net interest margin, fully tax-equivalent, adjusts net interest income for the tax-favored status of certain loans and securities. Management believes this measure enhances the comparability of net interest income arising from taxable and tax-exempt sources. Efficiency ratio, fully tax eq
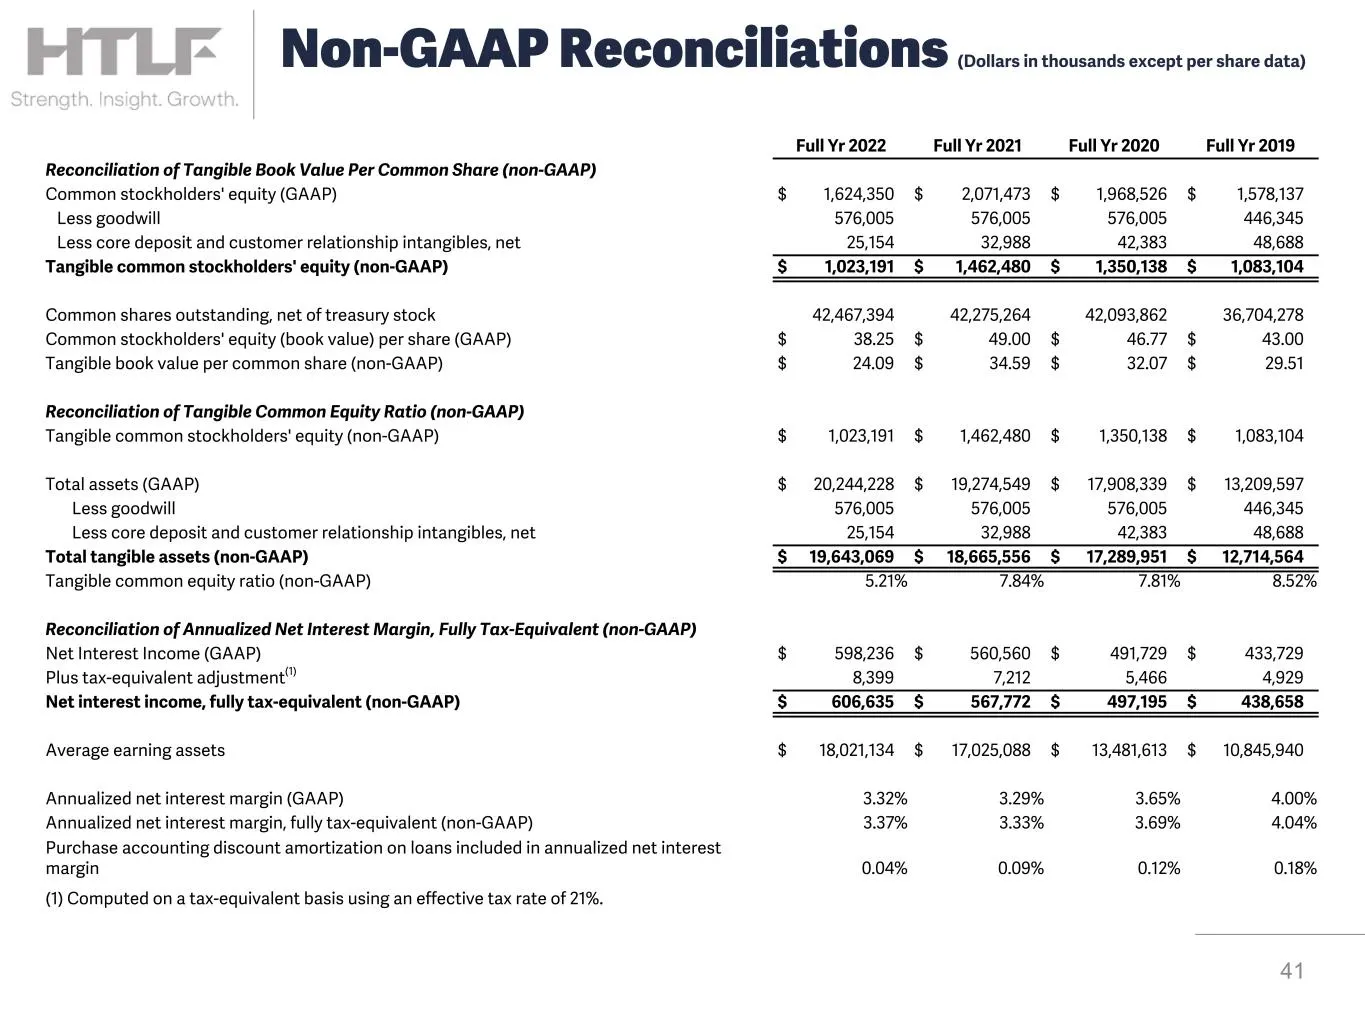
Slide 41: Reconciliation of Tangible Book Value Per Share
Full Yr 2022 Full Yr 2021 Full Yr 2020 Full Yr 2019 Reconciliation of Tangible Book Value Per Common Share (non-GAAP) Common stockholders' equity (GAAP) $ 1,624,350 $ 2,071,473 $ 1,968,526 $ 1,578,137 Less goodwill 576,005 576,005 576,005 446,345 Less core deposit and customer relationship intangibl
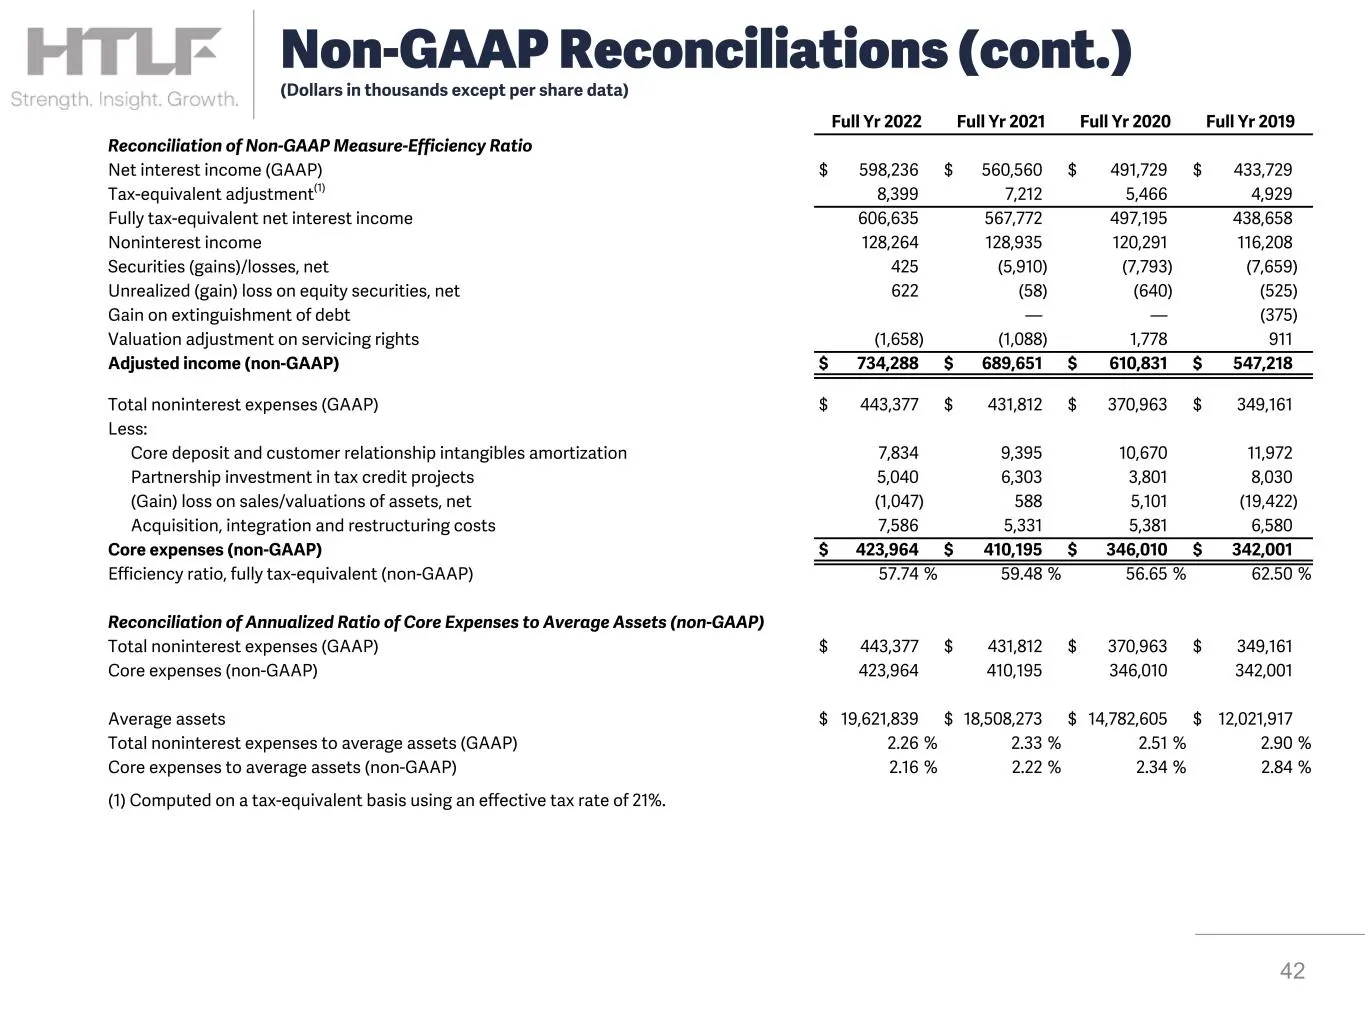
Slide 42: Reconciliation of Efficiency Ratio
Full Yr 2022 Full Yr 2021 Full Yr 2020 Full Yr 2019 Reconciliation of Non-GAAP Measure-Efficiency Ratio Net interest income (GAAP) $ 598,236 $ 560,560 $ 491,729 $ 433,729 Tax-equivalent adjustment(1) 8,399 7,212 5,466 4,929 Fully tax-equivalent net interest income 606,635 567,772 497,195 438,658 Non
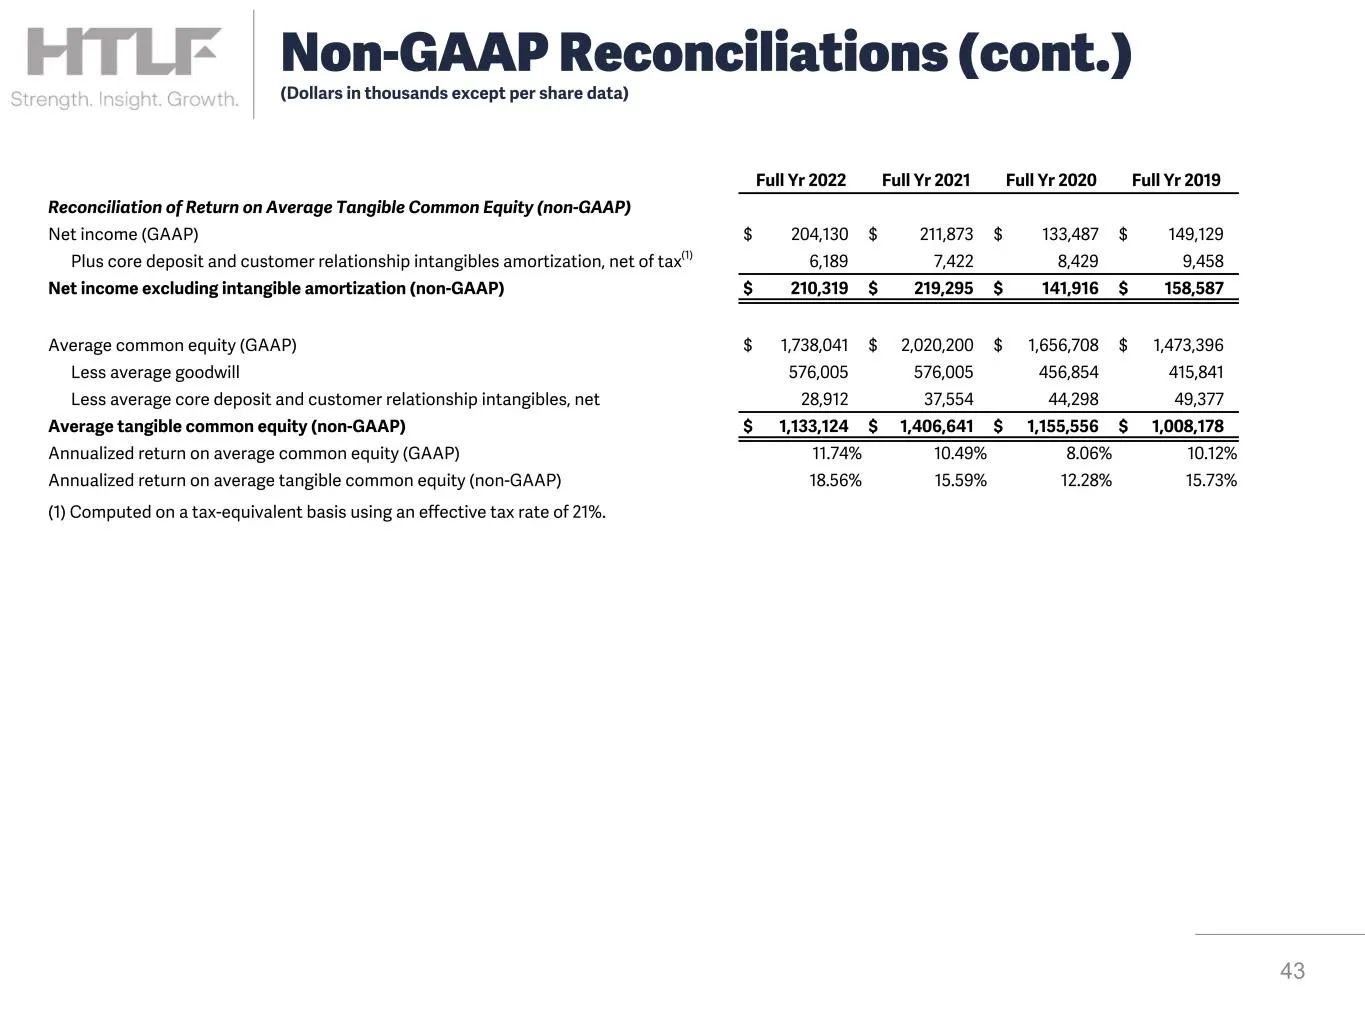
Slide 43: Non-GAAP Reconciliations (cont.)
Non-GAAP Reconciliations (cont.) (Dollars in thousands except per share data) Full Yr 2022 Full Yr 2021 Full Yr 2020 Full Yr 2019 Reconciliation of Return on Average Tangible Common Equity (non-GAAP) Net income (GAAP) $ 204,130 $ 211,873 $ 133,487 $ 149,129 Plus core deposit and customer relationshi
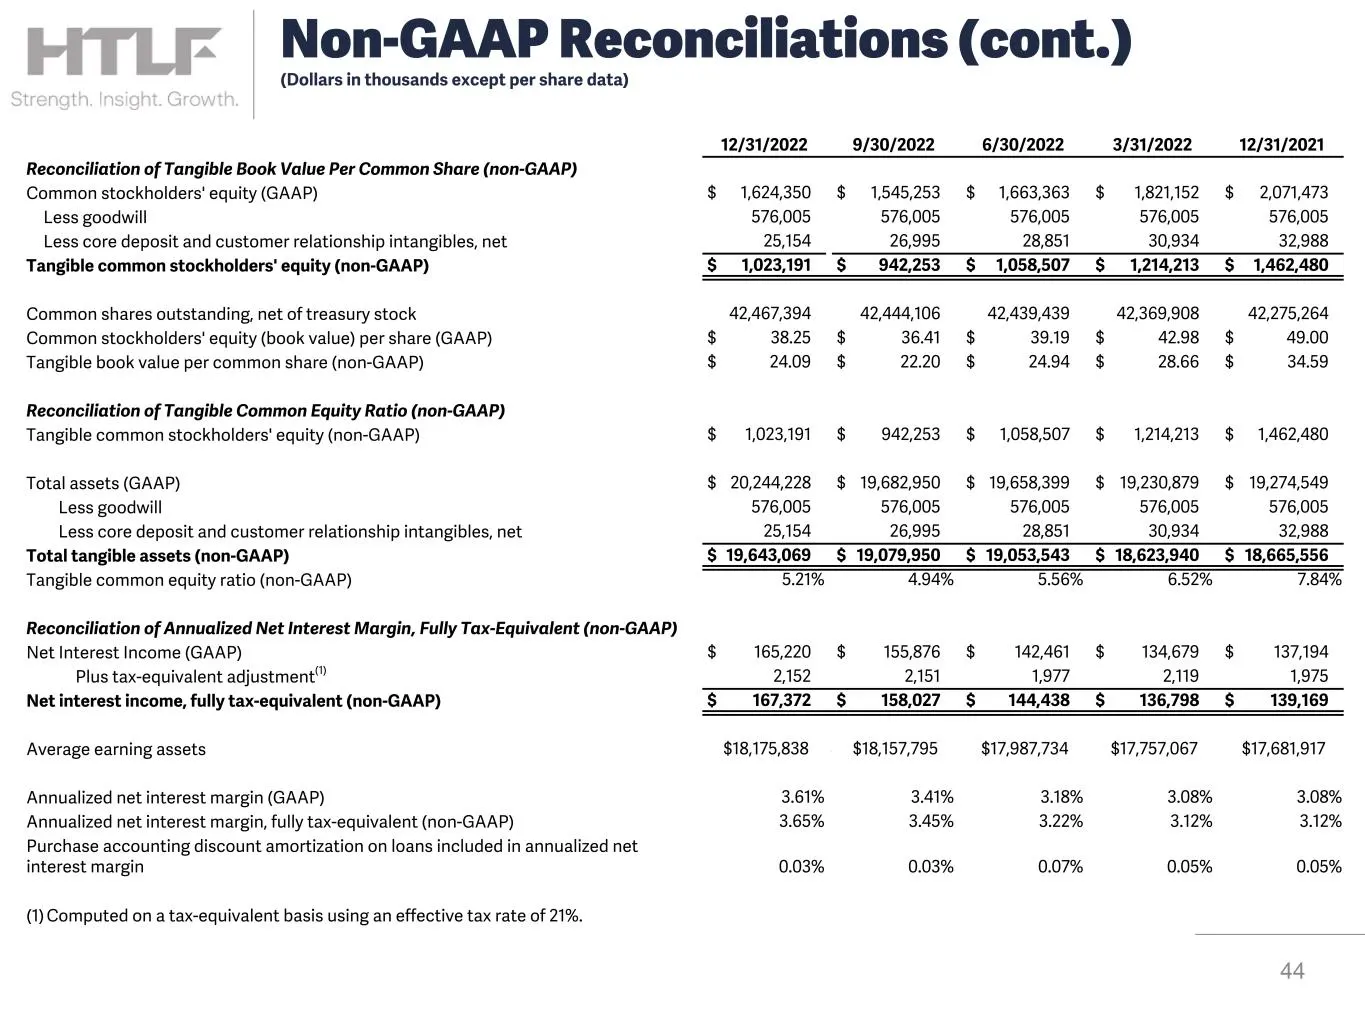
Slide 44: Quarterly Tangible Book Value Reconciliation
12/31/2022 9/30/2022 6/30/2022 3/31/2022 12/31/2021 Reconciliation of Tangible Book Value Per Common Share (non-GAAP) Common stockholders' equity (GAAP) $ 1,624,350 $ 1,545,253 $ 1,663,363 $ 1,821,152 $ 2,071,473 Less goodwill 576,005 576,005 576,005 576,005 576,005 Less core deposit and customer re
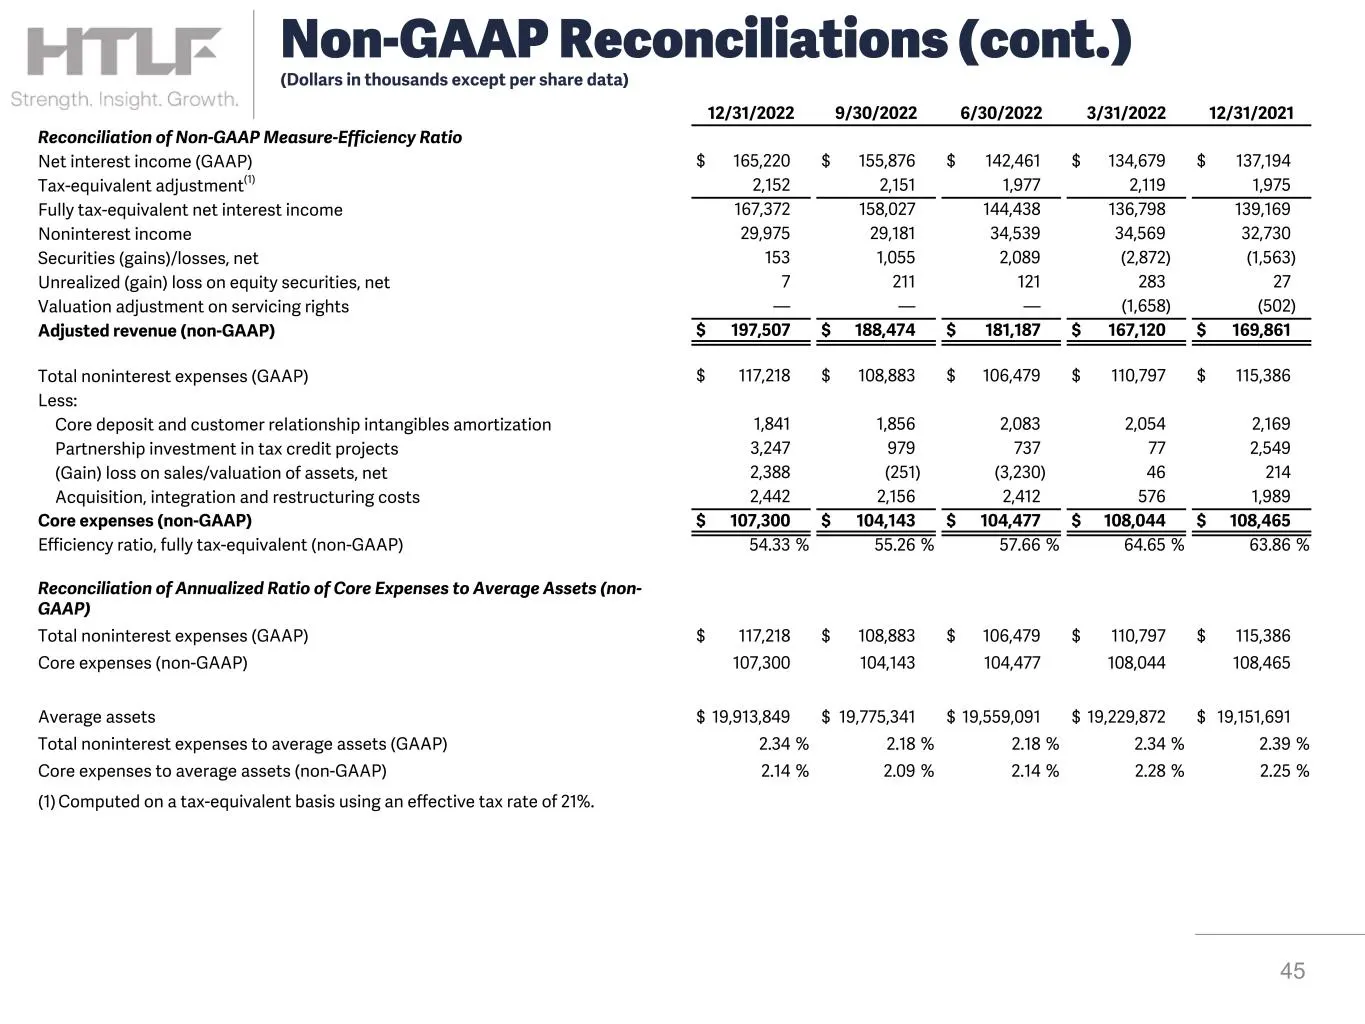
Slide 45: Quarterly Efficiency Ratio Reconciliation
12/31/2022 9/30/2022 6/30/2022 3/31/2022 12/31/2021 Reconciliation of Non-GAAP Measure-Efficiency Ratio Net interest income (GAAP) $ 165,220 $ 155,876 $ 142,461 $ 134,679 $ 137,194 Tax-equivalent adjustment(1) 2,152 2,151 1,977 2,119 1,975 Fully tax-equivalent net interest income 167,372 158,027 144
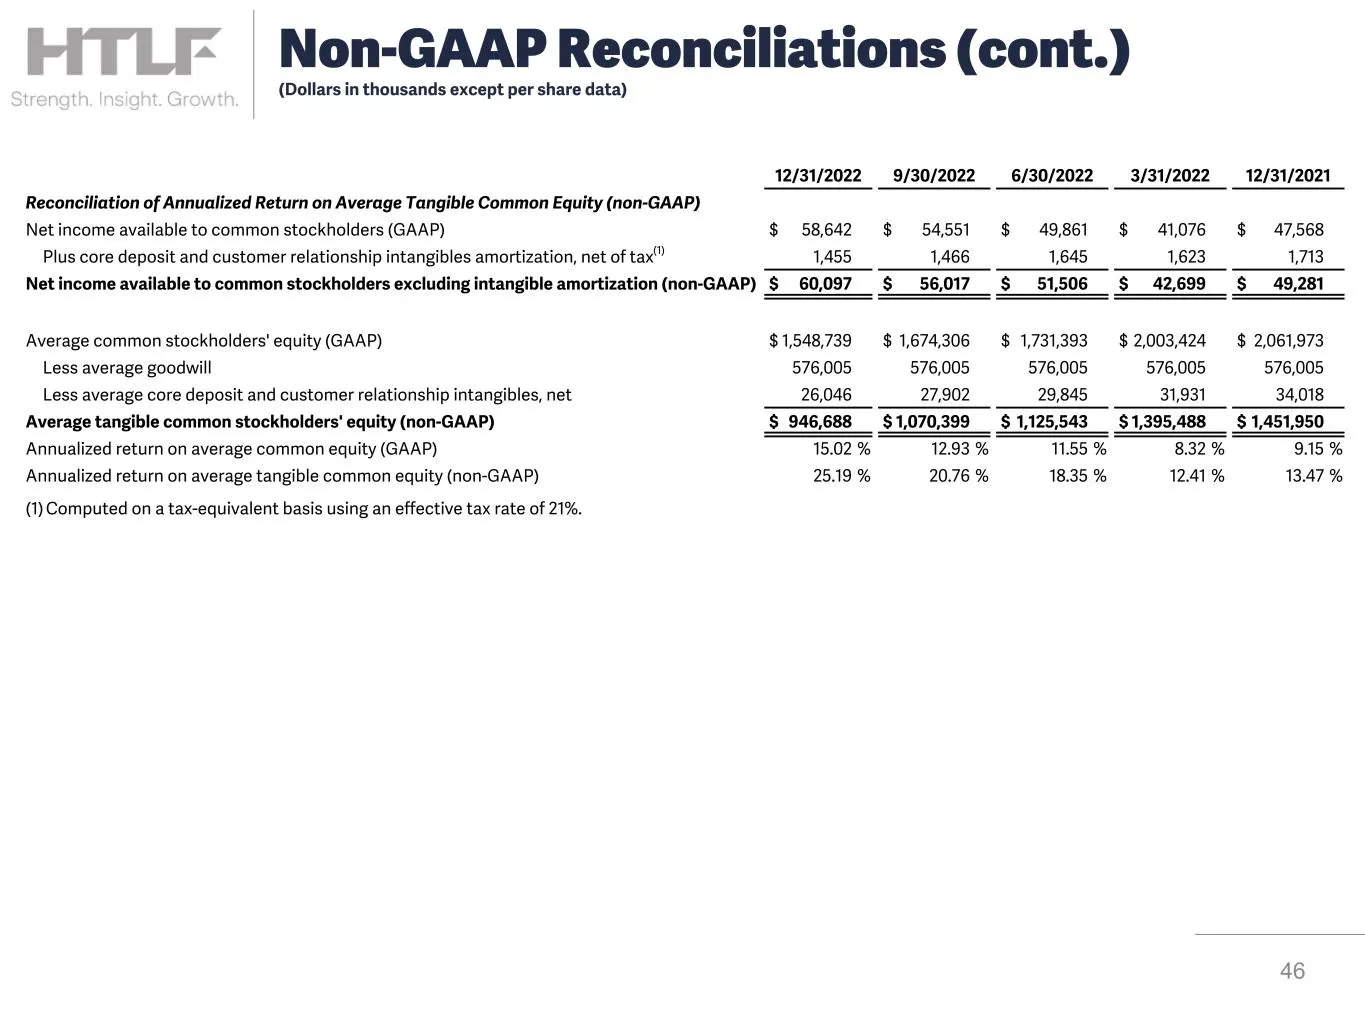
Slide 46: Non-GAAP Reconciliations (cont.)
46 Non-GAAP Reconciliations (cont.) (Dollars in thousands except per share data) 12/31/2022 9/30/2022 6/30/2022 3/31/2022 12/31/2021 Reconciliation of Annualized Return on Average Tangible Common Equity (non-GAAP) Net income available to common stockholders (GAAP) $ 58,642 $ 54,551 $ 49,861 $ 41,076

Slide 47: Forward Together
Forward Together > FITLF Strength. Insight. Growth.
Source: SEC EDGAR · 8-K filed Jan 30, 2023
More decks from Heartland Financial USA Inc
 Merger or Acquisition (July 2024)6 slides · Jul 31, 2024
 Merger or Acquisition (May 2024)6 slides · May 2, 2024
 Merger or Acquisition (May 2024)27 slides · May 2, 2024
 Q4 2023 Earnings Presentation54 slides · Feb 13, 2024
 Q4 2023 Earnings Presentation35 slides · Jan 29, 2024
 Q3 2023 Earnings Presentation55 slides · Nov 15, 2023