National City Corporation
National City — Q3 2008 Earnings Presentation
38 slides from National City's earnings presentation, Oct 21, 2008
Slide 1: Supplemental Data for Earnings Conference Call October 21, 2008
Supplemental Data for Earnings Conference Call October 21, 2008
Slide 2: Forward-Looking Statements
This presentation contains forward-looking statements. Forward looking statements, written or oral, provide current expectations or forecasts of future events and are not guarantees of future performance, nor should they be relied upon as representing management's views as of any subsequent date. Th
Slide 3: List of Participants
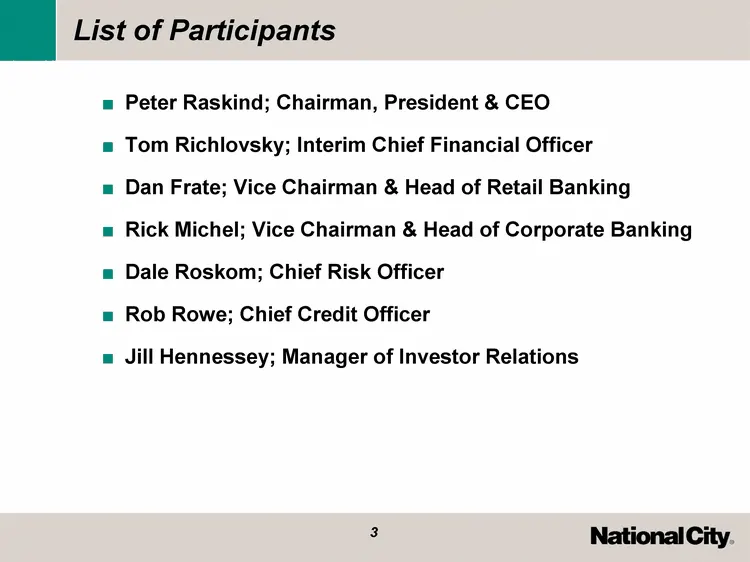
List of Participants Peter Raskind; Chairman, President & CEO Tom Richlovsky; Interim Chief Financial Officer Dan Frate; Vice Chairman & Head of Retail Banking Rick Michel; Vice Chairman & Head of Corporate Banking Dale Roskom; Chief Risk Officer Rob Rowe; Chief Credit Officer Jill Hennessey; Manage
Slide 4: 3Q-08 Quarterly Highlights
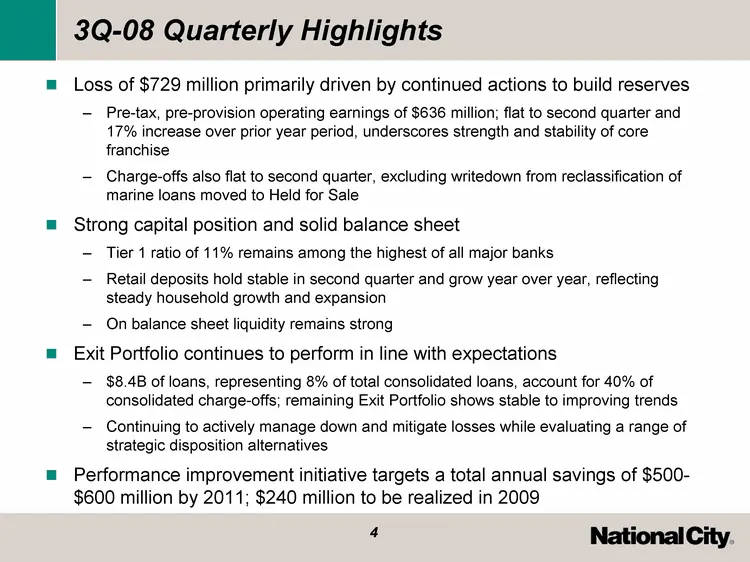
3Q-08 Quarterly Highlights Loss of $729 million primarily driven by continued actions to build reserves Pre-tax, pre-provision operating earnings of $636 million; flat to second quarter and 17% increase over prior year period, underscores strength and stability of core franchise Charge-offs also fla
Slide 5: 3Q-08 Quarter EPS Reconciliation
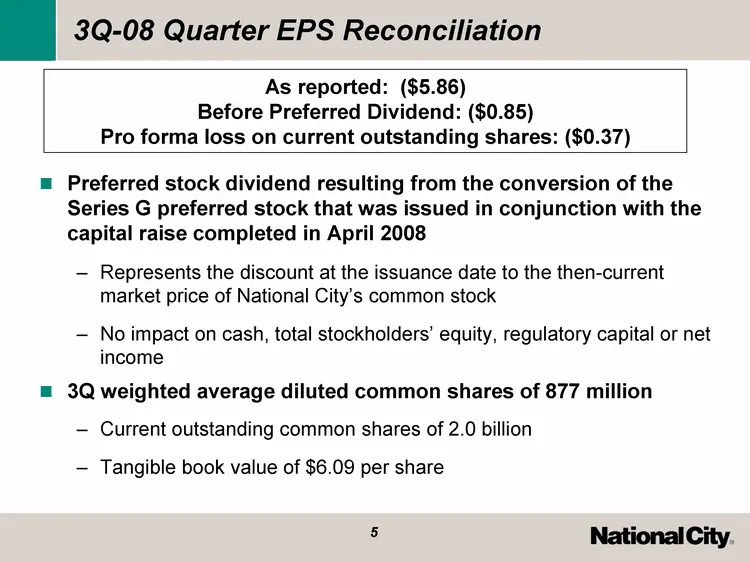
3Q-08 Quarter EPS Reconciliation Preferred stock dividend resulting from the conversion of the Series G preferred stock that was issued in conjunction with the capital raise completed in April 2008 Represents the discount at the issuance date to the then-current market price of National City's commo
Slide 6: Pre-tax, Pre-provision Operating Earnings
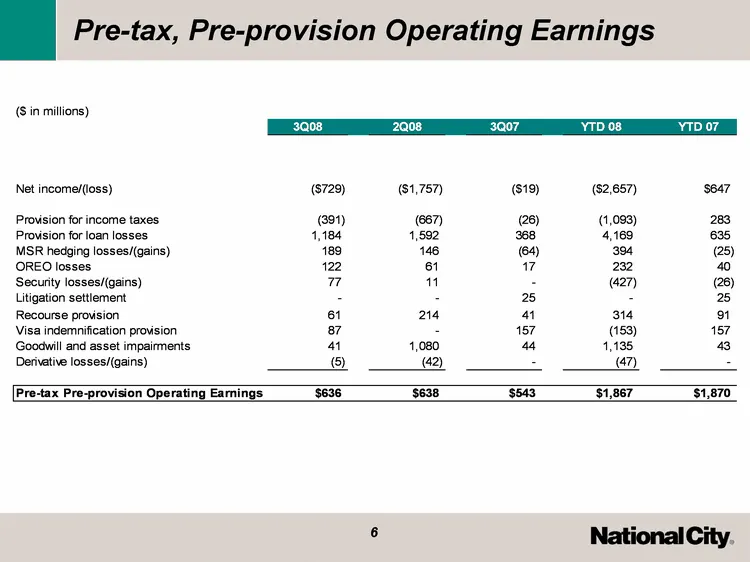
Pre-tax, Pre-provision Operating Earnings
Slide 7: Net Interest Margin
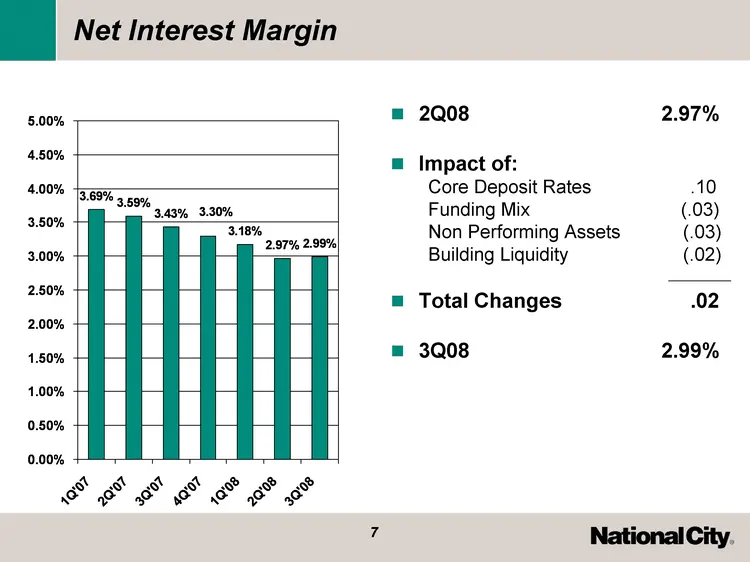
Net Interest Margin 1Q'07 2Q'07 3Q'07 4Q'07 1Q'08 2Q'08 3Q'08 East 20.4 27.4 90 20.4 West 30.6 38.6 34.6 31.6 North 0.0369 0.0359 0.0343 0.033 0.0318 0.0297 0.0299 2Q08 2.97% Impact of: Core Deposit Rates .10 Funding Mix (.03) Non Performing Assets (.03) Building Liquidity (.02) Total Changes .02 3Q
Slide 8: Strong Capital Position
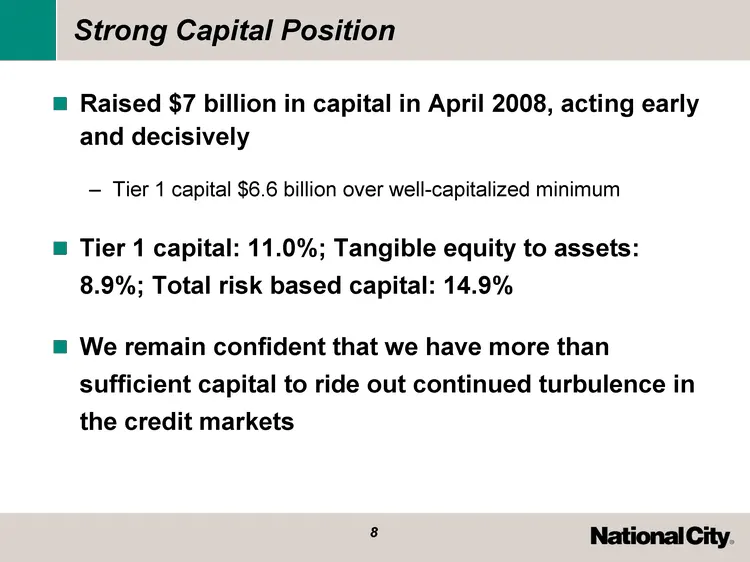
Strong Capital Position Raised $7 billion in capital in April 2008, acting early and decisively Tier 1 capital $6.6 billion over well-capitalized minimum Tier 1 capital: 11.0%; Tangible equity to assets: 8.9%; Total risk based capital: 14.9% We remain confident that we have more than sufficient capi
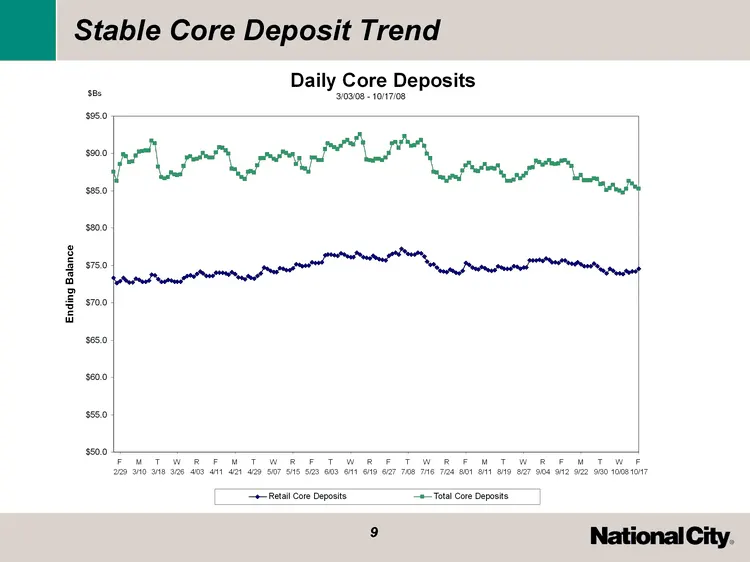
Slide 9: Stable Core Deposit Trend
Stable Core Deposit Trend Bear Stearns IndyMac WM/WB
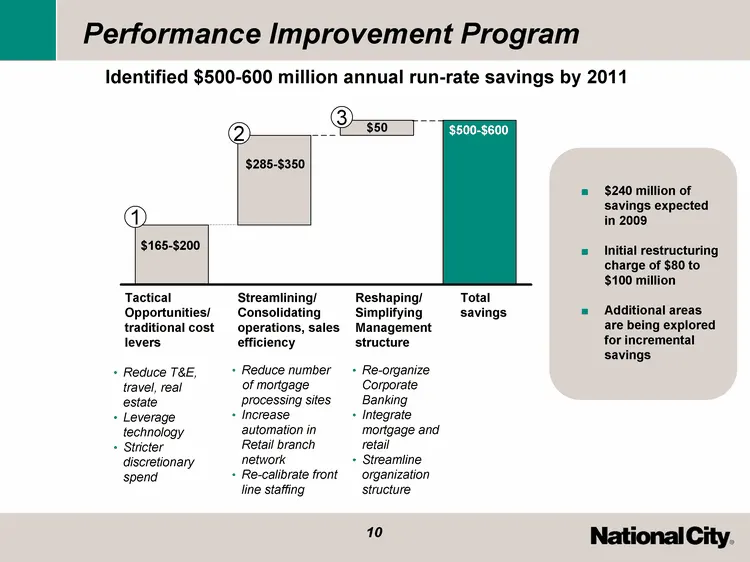
Slide 10: Performance Improvement Program
200.000000000023 500.000000000057 200.000000000023 300.000000000034 50.0000000000057 550.000000000063 $285-$350 $165-$200 $500-$600 Performance Improvement Program Total savings Tactical Opportunities/ traditional cost levers 1 Streamlining/ Consolidating operations, sales efficiency Reshaping/ Simp

Slide 11: Business Segment Overview
Business Segment Overview
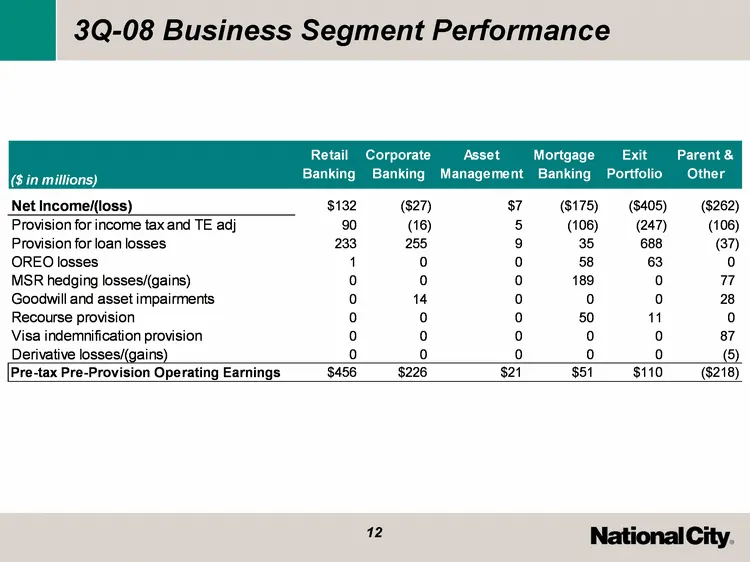
Slide 12: 3Q-08 Business Segment Performance
3Q-08 Business Segment Performance
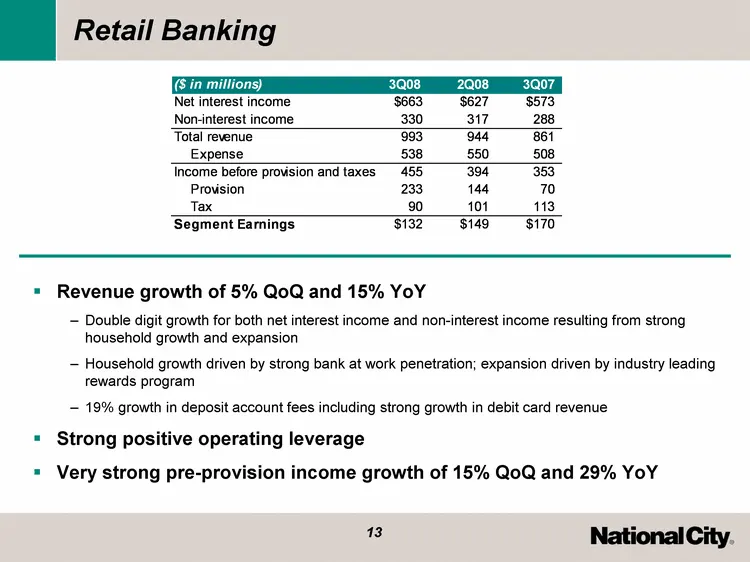
Slide 13: Retail Banking
Retail Banking Revenue growth of 5% QoQ and 15% YoY Double digit growth for both net interest income and non-interest income resulting from strong household growth and expansion Household growth driven by strong bank at work penetration; expansion driven by industry leading rewards program 19% growt
Slide 14: Corporate Banking
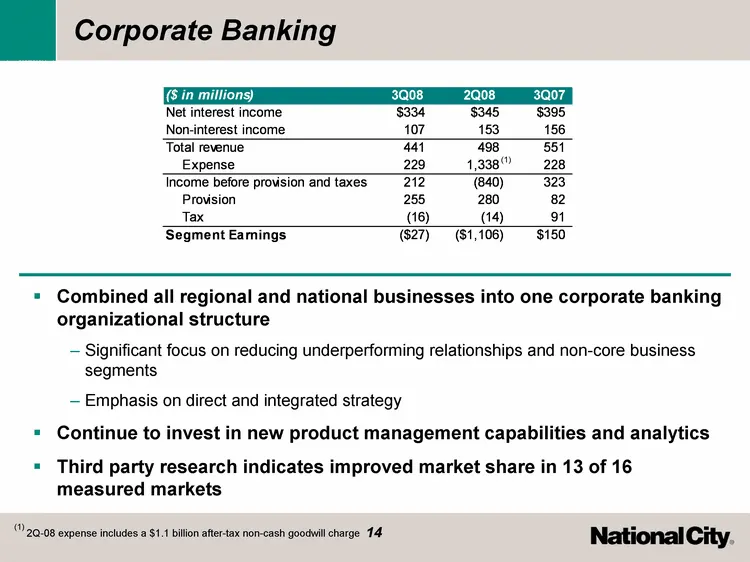
Corporate Banking Combined all regional and national businesses into one corporate banking organizational structure Significant focus on reducing underperforming relationships and non-core business segments Emphasis on direct and integrated strategy Continue to invest in new product management capab
Slide 15: Asset Management
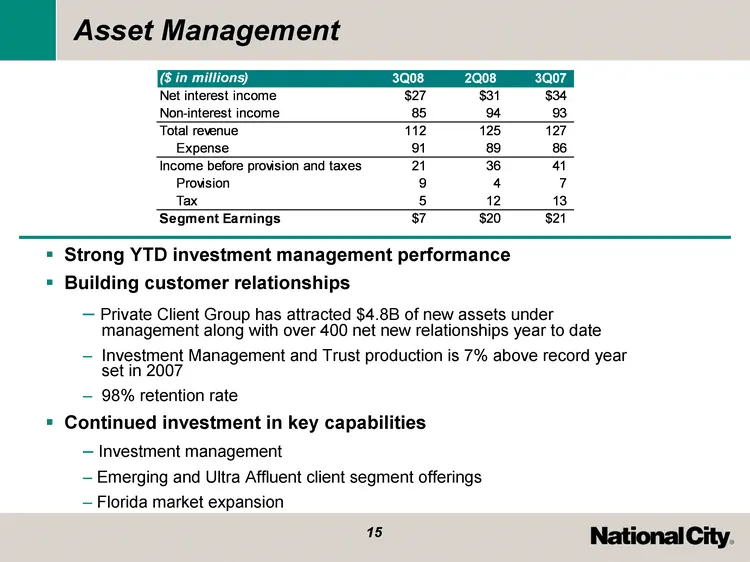
Asset Management Strong YTD investment management performance Building customer relationships Private Client Group has attracted $4.8B of new assets under management along with over 400 net new relationships year to date Investment Management and Trust production is 7% above record year set in 2007
Slide 16: Mortgage Banking
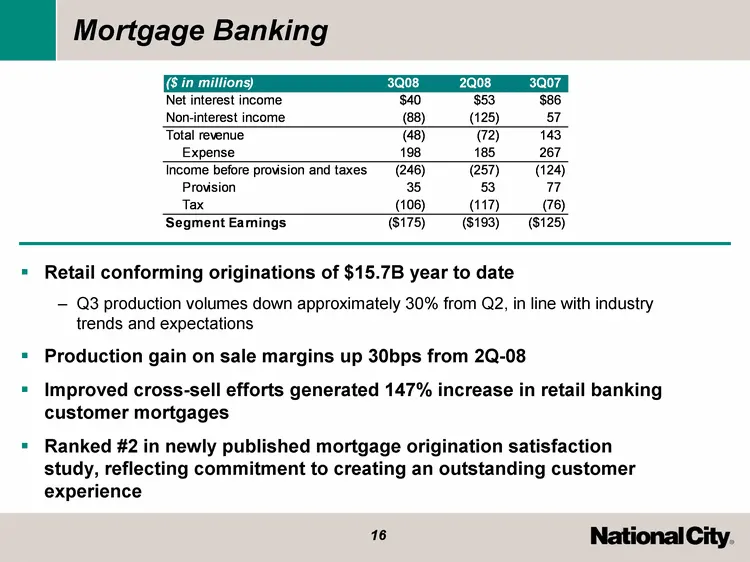
Mortgage Banking Retail conforming originations of $15.7B year to date Q3 production volumes down approximately 30% from Q2, in line with industry trends and expectations Production gain on sale margins up 30bps from 2Q-08 Improved cross-sell efforts generated 147% increase in retail banking custome
Slide 17: Exit Portfolio
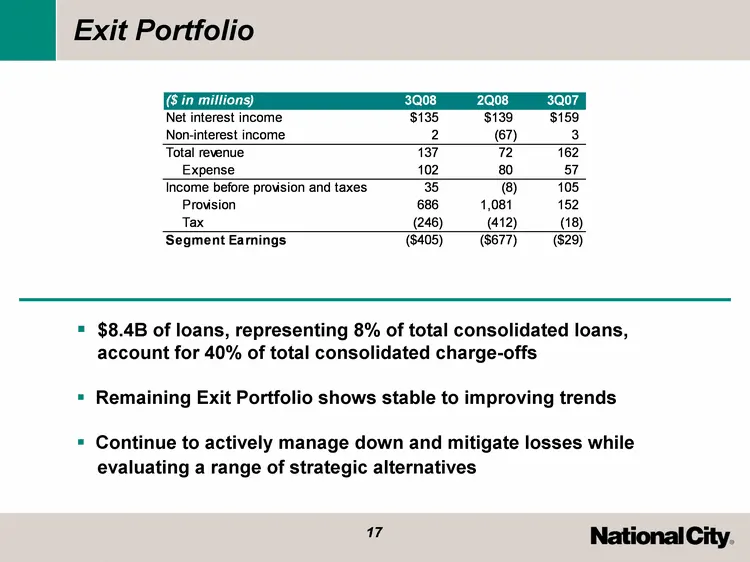
Exit Portfolio $8.4B of loans, representing 8% of total consolidated loans, account for 40% of total consolidated charge-offs Remaining Exit Portfolio shows stable to improving trends Continue to actively manage down and mitigate losses while evaluating a range of strategic alternatives
Slide 18: Credit Performance
Credit Performance
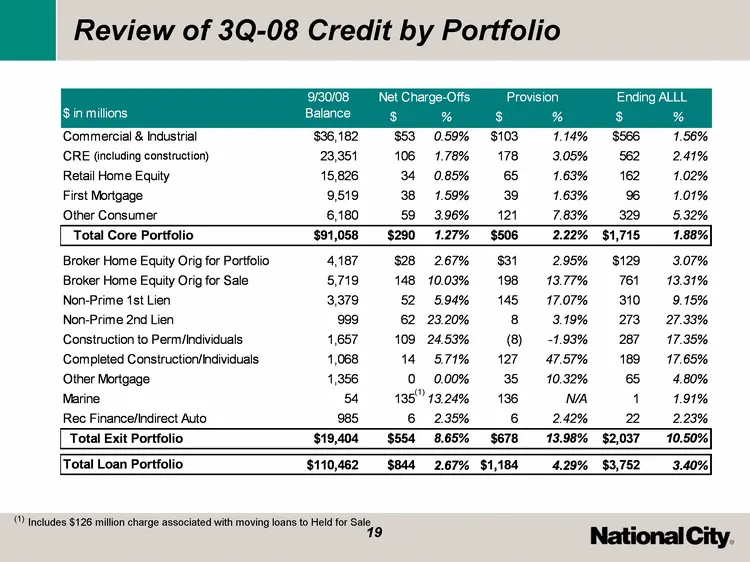
Slide 19: Review of 3Q-08 Credit by Portfolio
Review of 3Q-08 Credit by Portfolio (1) (1) Includes $126 million charge associated with moving loans to Held for Sale
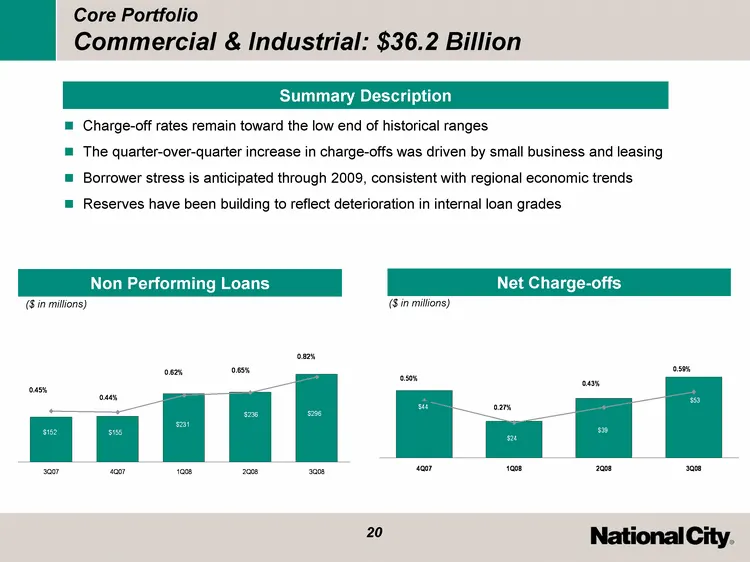
Slide 20: Core Portfolio Commercial & Industrial
Core Portfolio Commercial & Industrial: $36.2 Billion 2Q07 3Q07 4Q07 1Q08 2Q08 3Q08 NPL 125 152 155 231 236 296 NPL % 0.0039 0.0045 0.0044 0.0062 0.0065 0.0082 Non Performing Loans 2Q07 3Q07 4Q07 1Q08 2Q08 3Q08 Charge-off $ 19 16 44 24 39 53 Charge-off % 0.0022 0.0021 0.005 0.0027 0.0043 0.0059 Net
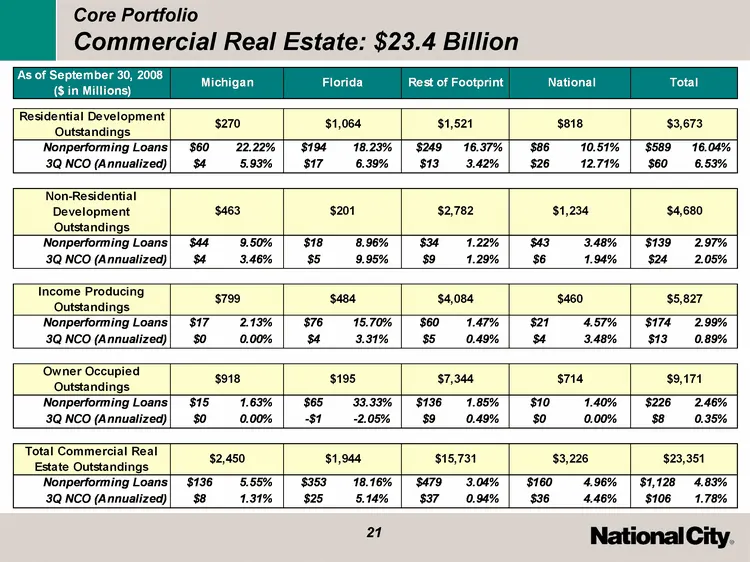
Slide 21: Core Portfolio Commercial Real Estate
Core Portfolio Commercial Real Estate: $23.4 Billion (1)
Slide 22: Core Portfolio Retail Home Equity
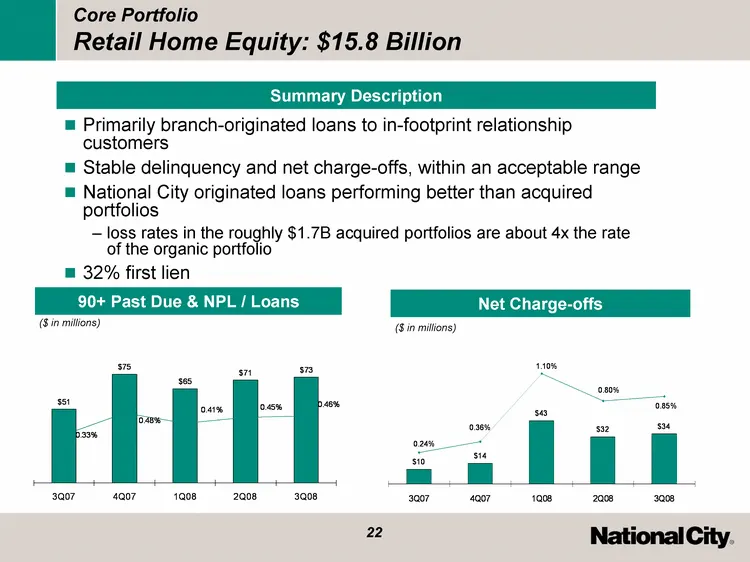
Core Portfolio Retail Home Equity: $15.8 Billion Net Charge-offs 90+ Past Due & NPL / Loans 3Q07 4Q07 1Q08 2Q08 3Q08 East 20.4 27.4 90 20.4 % 0.0024 0.0036 0.011 0.008 0.0085 Net C/O 10 14 43 32 34 Primarily branch-originated loans to in-footprint relationship customers Stable delinquency and net ch
Slide 23: Core Portfolio First Mortgage
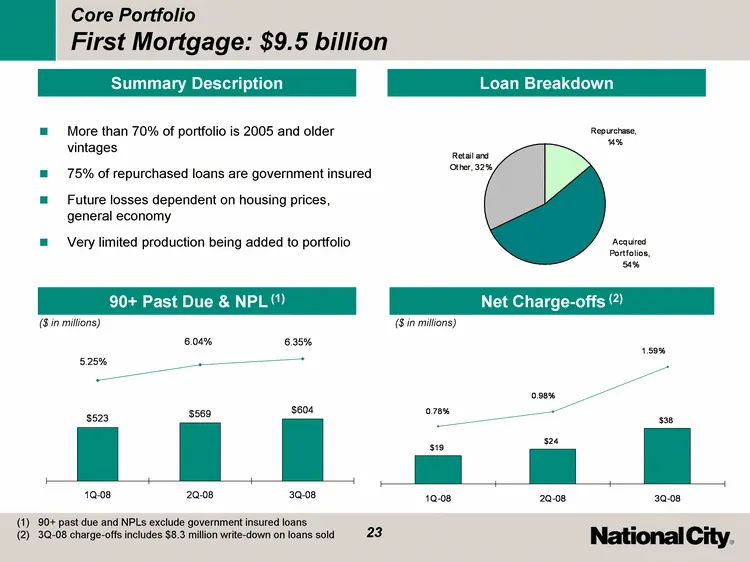
Core Portfolio First Mortgage: $9.5 billion More than 70% of portfolio is 2005 and older vintages 75% of repurchased loans are government insured Future losses dependent on housing prices, general economy Very limited production being added to portfolio 'Dec-06 'Mar-07 6/1/2007 3Q07 4Q-07 1Q-08 2Q-0
Slide 24: Exit Portfolio Broker Originated Home Equity
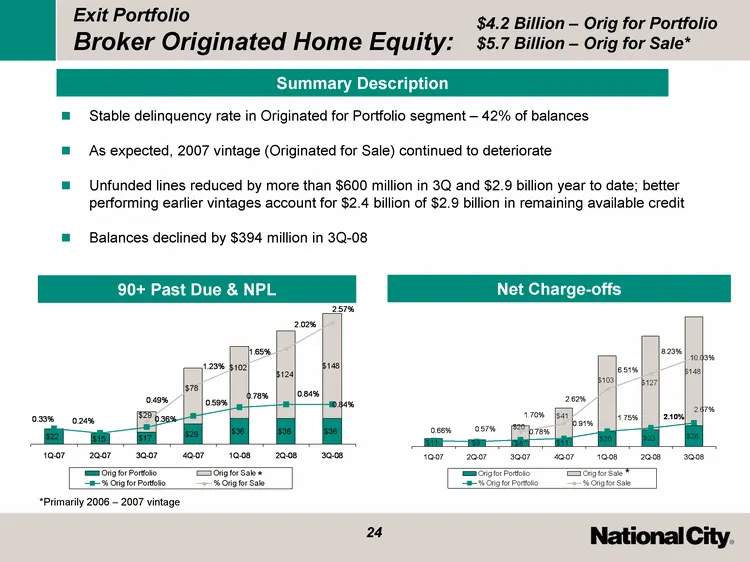
Exit Portfolio Broker Originated Home Equity: Stable delinquency rate in Originated for Portfolio segment - 42% of balances As expected, 2007 vintage (Originated for Sale) continued to deteriorate Unfunded lines reduced by more than $600 million in 3Q and $2.9 billion year to date; better performing
Slide 25: Exit Portfolio Nonprime Mortgage
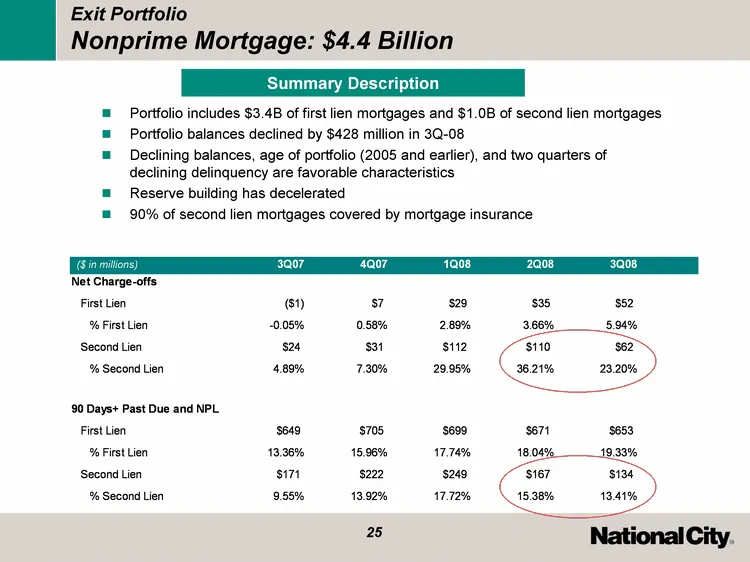
Exit Portfolio Nonprime Mortgage: $4.4 Billion Summary Description Portfolio includes $3.4B of first lien mortgages and $1.0B of second lien mortgages Portfolio balances declined by $428 million in 3Q-08 Declining balances, age of portfolio (2005 and earlier), and two quarters of declining delinquen
Slide 26: Exit Portfolio Construction to Individuals
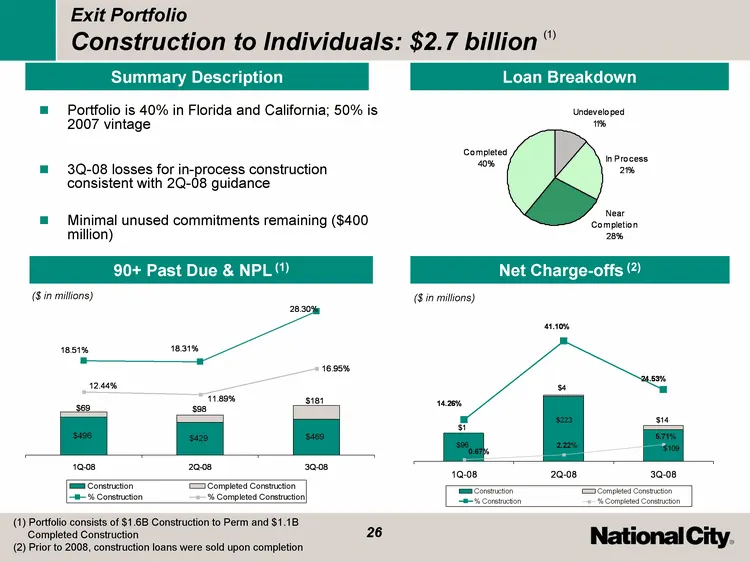
Exit Portfolio Construction to Individuals: $2.7 billion Portfolio is 40% in Florida and California; 50% is 2007 vintage 3Q-08 losses for in-process construction consistent with 2Q-08 guidance Minimal unused commitments remaining ($400 million) 3Q-07 4Q-07 1Q-08 2Q-08 3Q-08 Construction 279 447 496
Slide 27: Exit Portfolio Other Mortgage
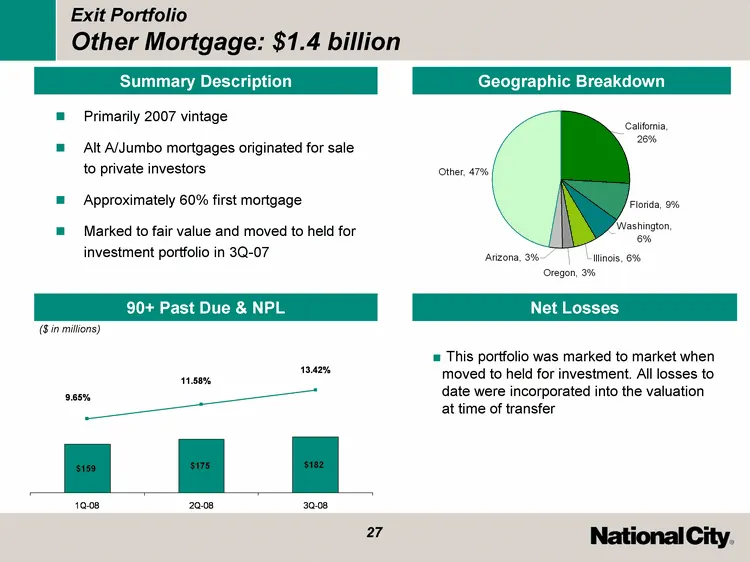
Exit Portfolio Other Mortgage: $1.4 billion Primarily 2007 vintage Alt A/Jumbo mortgages originated for sale to private investors Approximately 60% first mortgage Marked to fair value and moved to held for investment portfolio in 3Q-07 1Q-08 2Q-08 3Q-08 $ 159 175 182 % 0.0965 0.1158 0.1342 90+ Past
Slide 28: Exit Portfolio - Loss Expectations
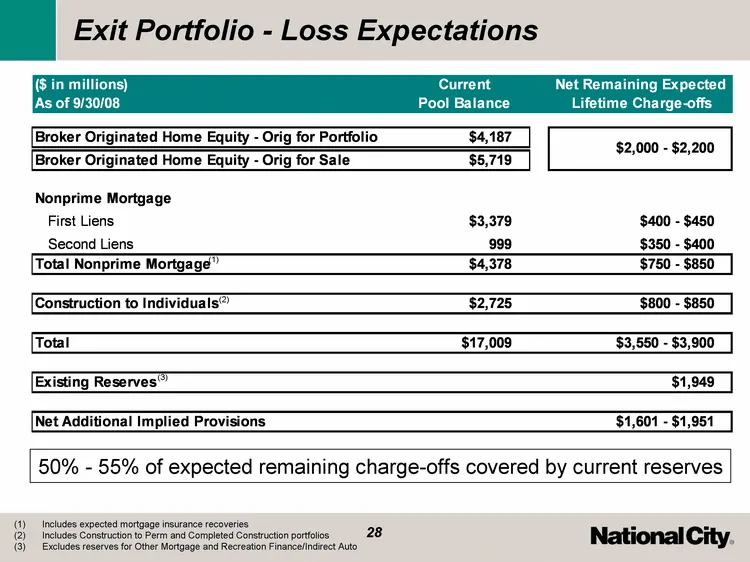
Exit Portfolio - Loss Expectations Includes expected mortgage insurance recoveries Includes Construction to Perm and Completed Construction portfolios Excludes reserves for Other Mortgage and Recreation Finance/Indirect Auto (1) (3) (2) 50% - 55% of expected remaining charge-offs covered by current
Slide 29: Investor Takeaways
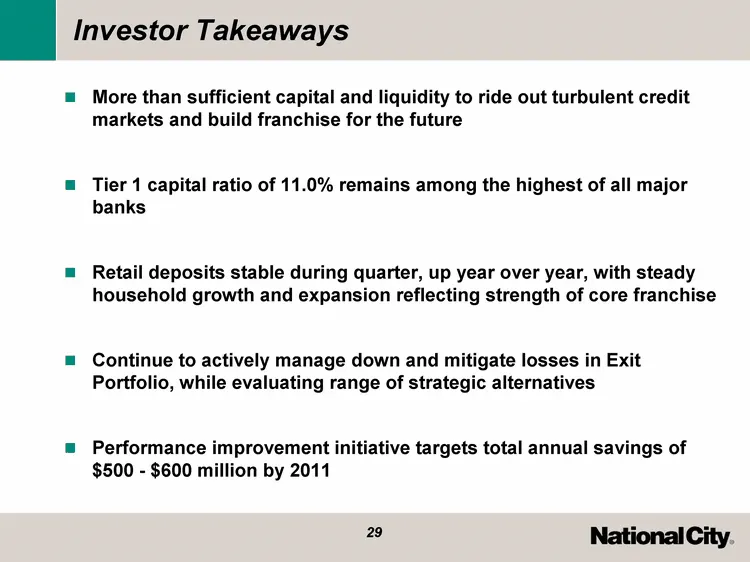
Investor Takeaways More than sufficient capital and liquidity to ride out turbulent credit markets and build franchise for the future Tier 1 capital ratio of 11.0% remains among the highest of all major banks Retail deposits stable during quarter, up year over year, with steady household growth and
Slide 30: Appendix
Appendix
Slide 31: Credit Performance: Non Performing Assets
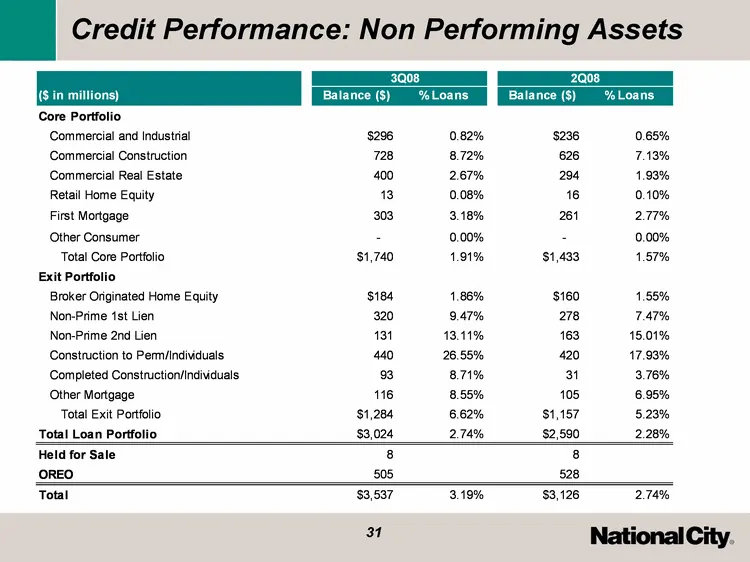
Credit Performance: Non Performing Assets
Slide 32: Credit Performance: 90+ days
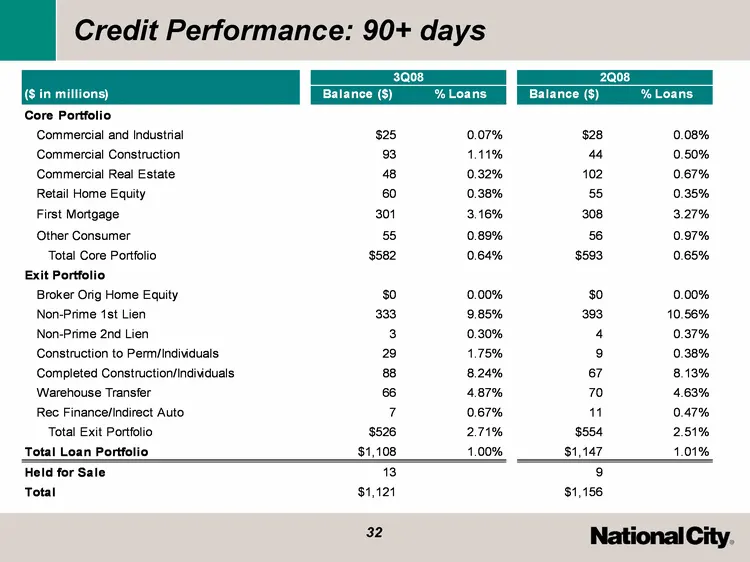
Credit Performance: 90+ days
Slide 33: Credit Performance: Net Charge Offs
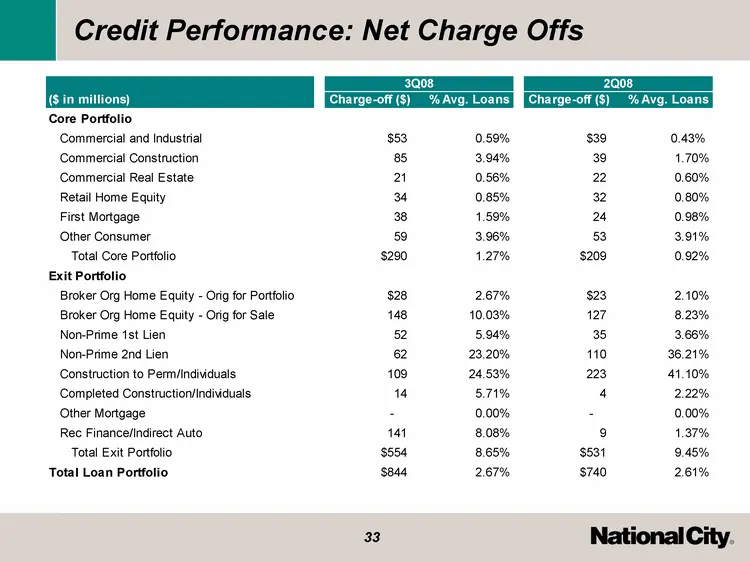
Credit Performance: Net Charge Offs 33
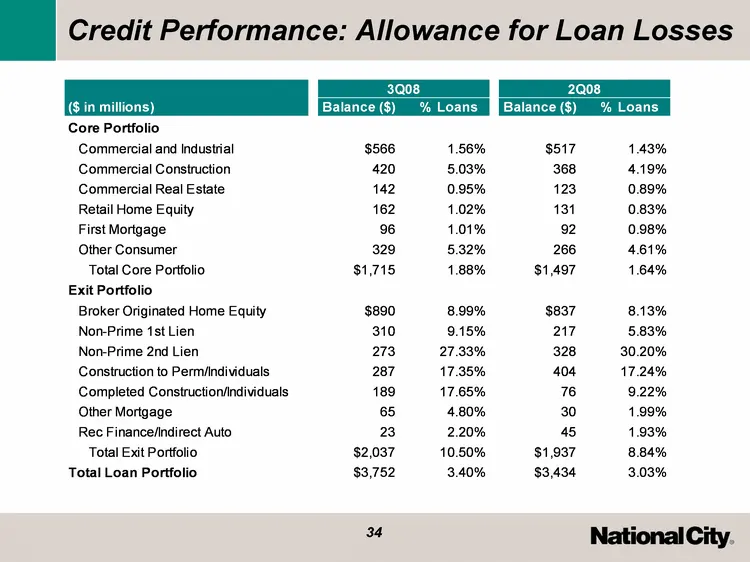
Slide 34: Credit Performance: Allowance for Loan Losses
Credit Performance: Allowance for Loan Losses
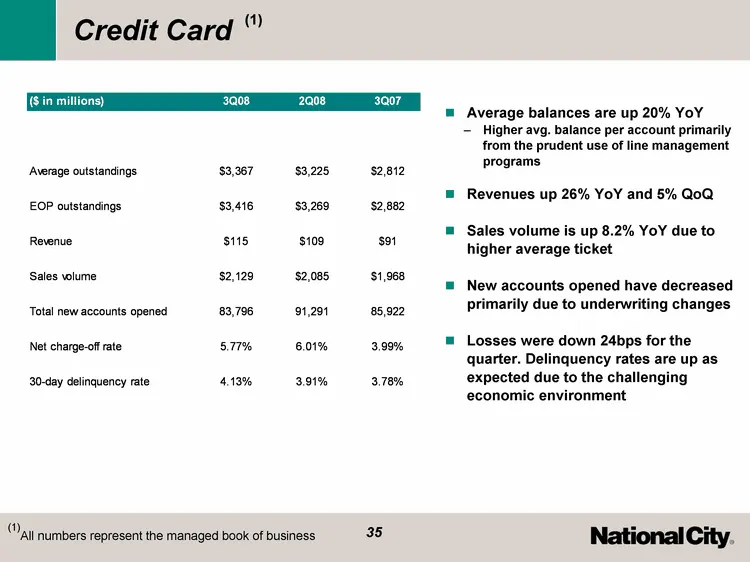
Slide 35: Credit Card
Credit Card All numbers represent the managed book of business (1) (1) Average balances are up 20% YoY Higher avg. balance per account primarily from the prudent use of line management programs Revenues up 26% YoY and 5% QoQ Sales volume is up 8.2% YoY due to higher average ticket New accounts opene
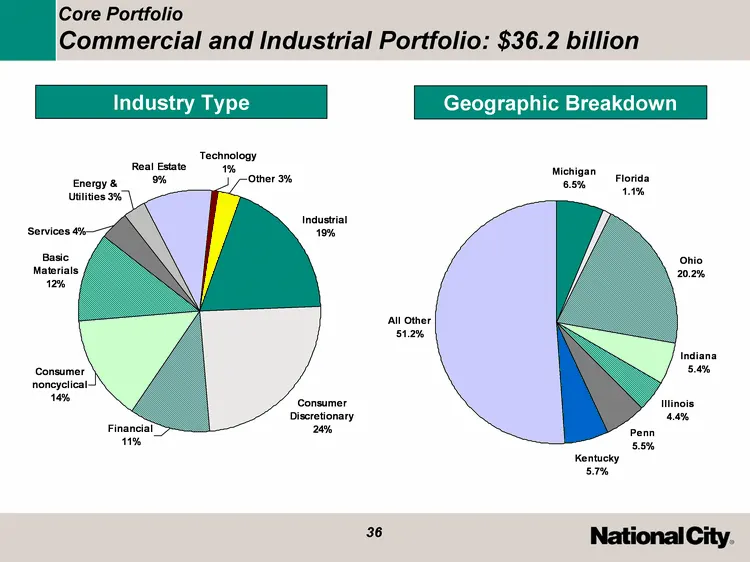
Slide 36: Core Portfolio Commercial and Industrial Portfolio
Core Portfolio Commercial and Industrial Portfolio: $36.2 billion Industry Type Michigan Florida Ohio Indiana Ilinois Penn Kentucky All Other 0.065 0.011 0.202 0.054 0.044 0.055 0.057 0.512 Geographic Breakdown Industrial Consumer Discretionary Financial Consumer noncyclical Basic Materials Services
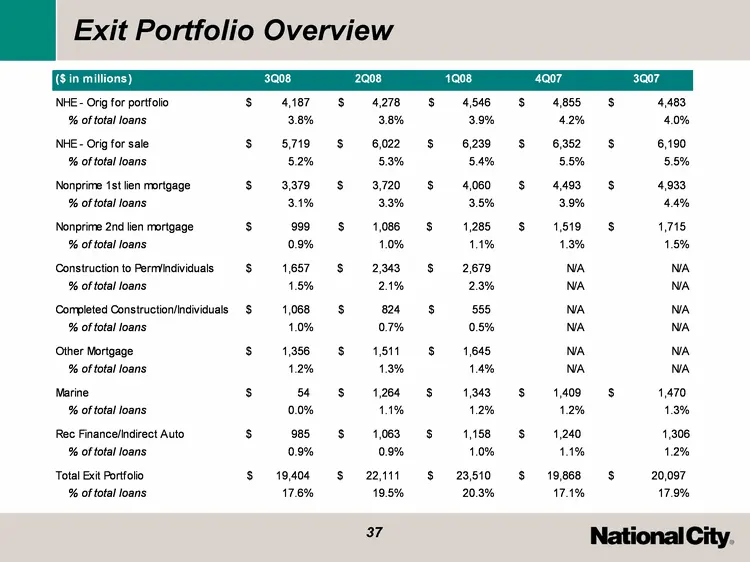
Slide 37: Exit Portfolio Overview
| Exit Portfolio Overview (Sin millions) NHE- Orig for portfolio % of total loans NHE- Orig for sale % of total loans Nonprime 1st len mortgage % of total loans "Nonprime 2nd lien mortgage % of total loans Construction to Permindividuals % of total loans Completed Construction/Individuals % of total

Slide 38
Source: SEC EDGAR · 8-K filed Oct 21, 2008
More decks from National City Corporation
 Q2 2008 Earnings Presentation32 slides · Jul 24, 2008
 Q1 2008 Earnings Presentation16 slides · Apr 21, 2008
 Q1 2008 Earnings Presentation30 slides · Apr 21, 2008
 Q4 2007 Earnings Presentation23 slides · Jan 22, 2008
 MAF Bancorp — Merger or Acquisition (May 2007)17 slides · May 1, 2007
 Fidelity Bankshares — Merger or Acquisition (July 2006)21 slides · Jul 27, 2006