National City Corporation
National City — Q1 2008 Earnings Presentation
16 slides from National City's earnings presentation, Apr 21, 2008
Slide 1: Supplemental Data for Earnings Conference Call April 2008
Supplemental Data for Earnings Conference Call April 2008
Slide 2: Forward-Looking Statements
This presentation contains forward-looking statements. Forward looking statements, written or oral, provide current expectations or forecasts of future events and are not guarantees of future performance, nor should they be relied upon as representing management's views as of any subsequent date. Th
Slide 3: Today's Discussion
Today's Discussion First Quarter Results Credit Performance and Trends
Slide 4: I. First Quarter Results
I. First Quarter Results
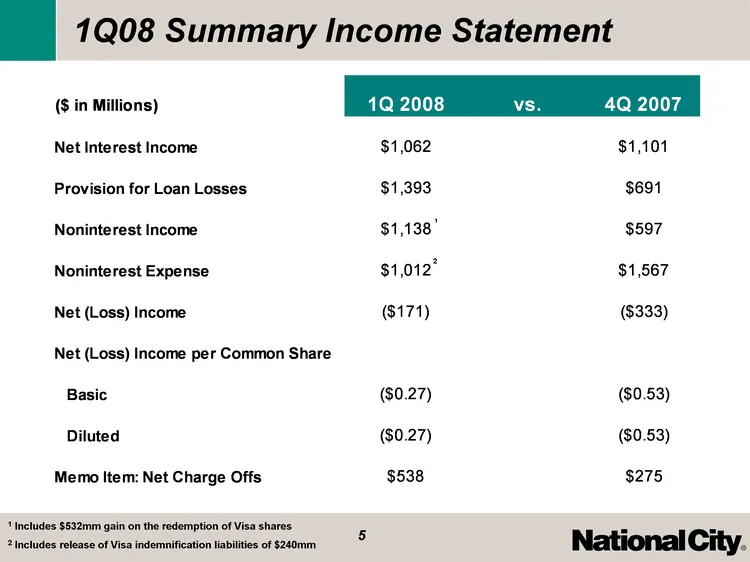
Slide 5: 1Q08 Summary Income Statement
1Q08 Summary Income Statement 1 Includes $532mm gain on the redemption of Visa shares 2 Includes release of Visa indemnification liabilities of $240mm 1 2
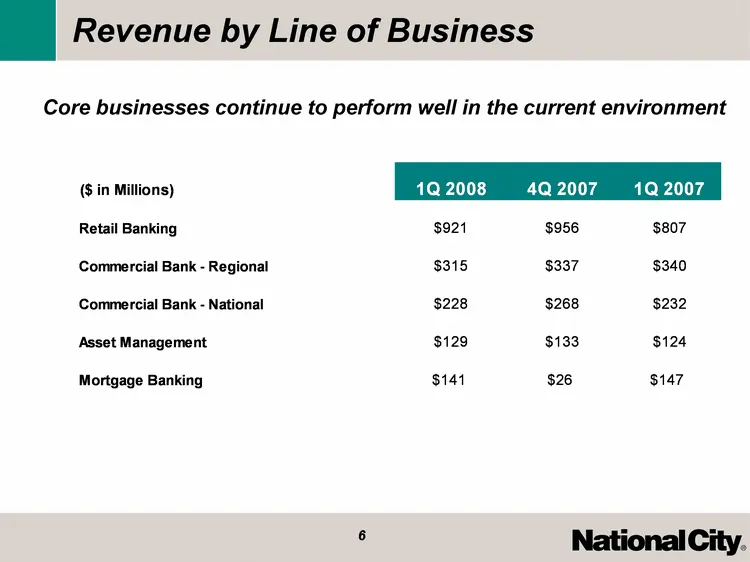
Slide 6: Revenue by Line of Business
Revenue by Line of Business Core businesses continue to perform well in the current environment
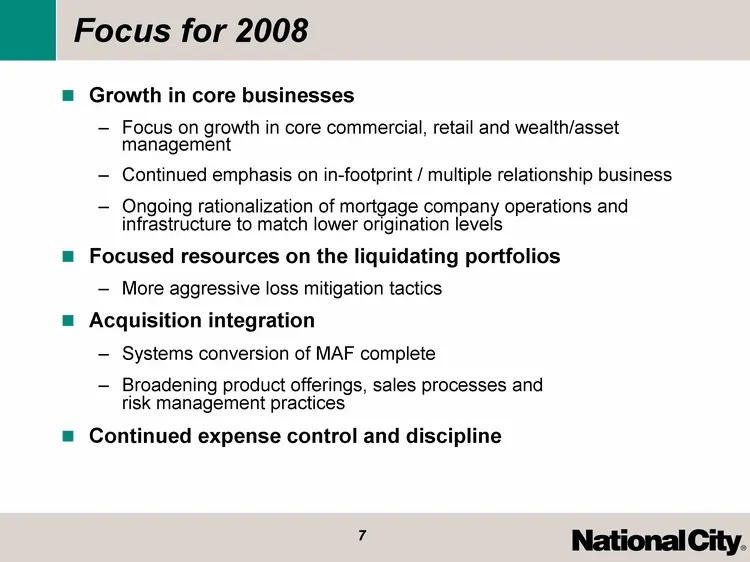
Slide 7: Focus for 2008
Focus for 2008 Growth in core businesses Focus on growth in core commercial, retail and wealth/asset management Continued emphasis on in-footprint / multiple relationship business Ongoing rationalization of mortgage company operations and infrastructure to match lower origination levels Focused reso

Slide 8: II. Credit Performance and Trends
II. Credit Performance and Trends
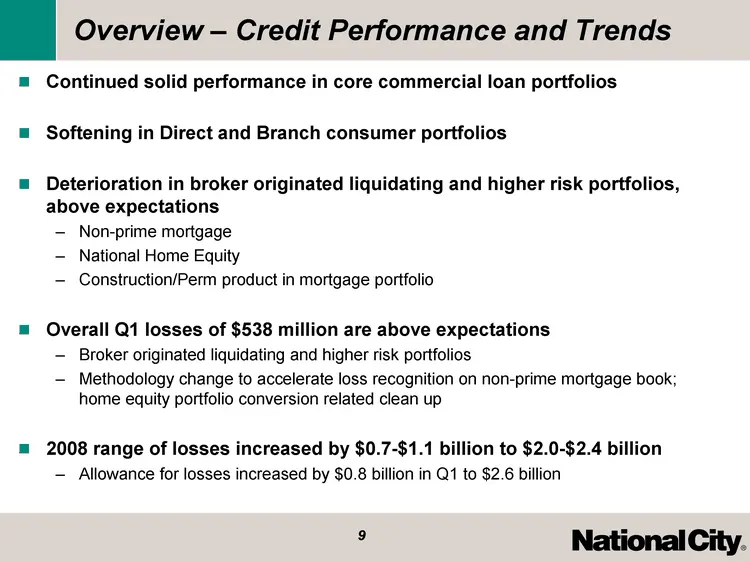
Slide 9: Overview - Credit Performance and Trends
Overview - Credit Performance and Trends Continued solid performance in core commercial loan portfolios Softening in Direct and Branch consumer portfolios Deterioration in broker originated liquidating and higher risk portfolios, above expectations Non-prime mortgage National Home Equity Constructio
Slide 10: Review of 1Q08 Credit by Portfolio
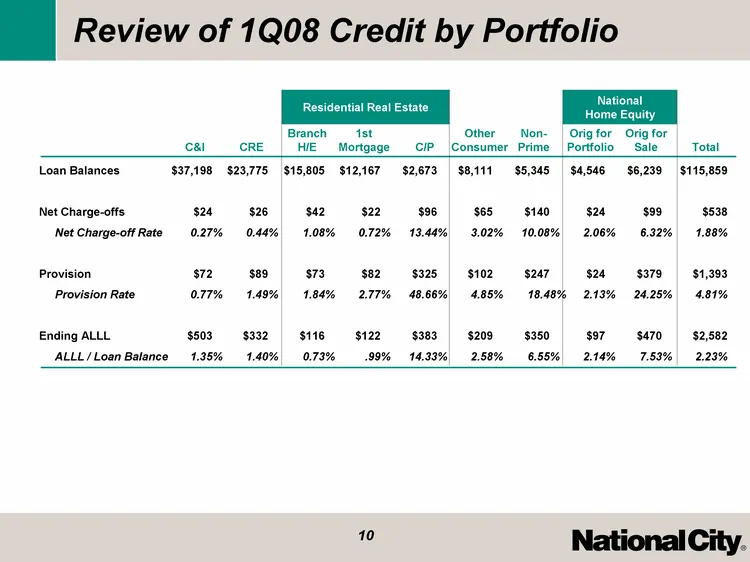
Review of 1Q08 Credit by Portfolio Loan Balances $37,198 $23,775 $15,805 $12,167 $2,673 $8,111 $5,345 $4,546 $6,239 $115,859 Net Charge-offs $24 $26 $42 $22 $96 $65 $140 $24 $99 $538 Net Charge-off Rate 0.27 % 0.44 % 1.08 % 0.72 % 13.44 % 3.02 % 10.08 % 2.06 % 6.32 % 1.88% Provision $72 $89 $73 $82
Slide 11: Commercial Real Estate
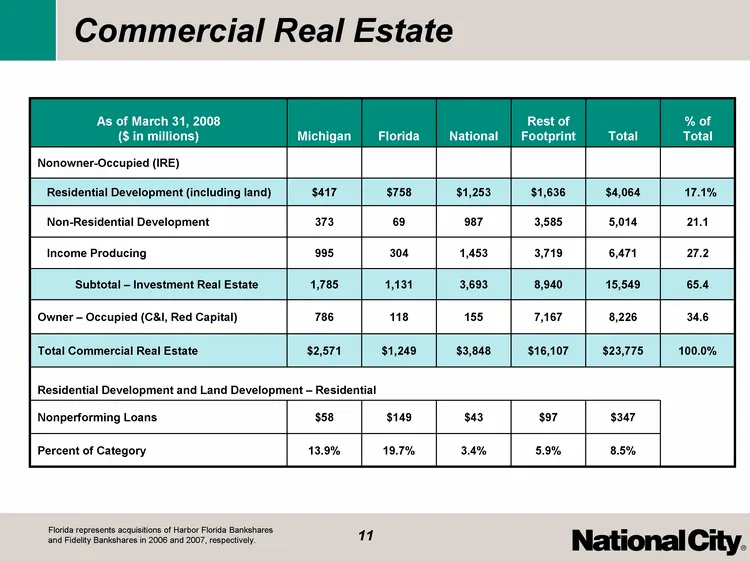
Commercial Real Estate As of March 31, 2008 ($ in millions) Michigan Florida National Rest of Footprint Total % of Total Nonowner-Occupied (IRE) Residential Development (including land) $417 $758 $1,253 $1,636 $4,064 17.1% Non-Residential Development 373 69 987 3,585 5,014 21.1 Income Producing 995
Slide 12: Home Equity Overview
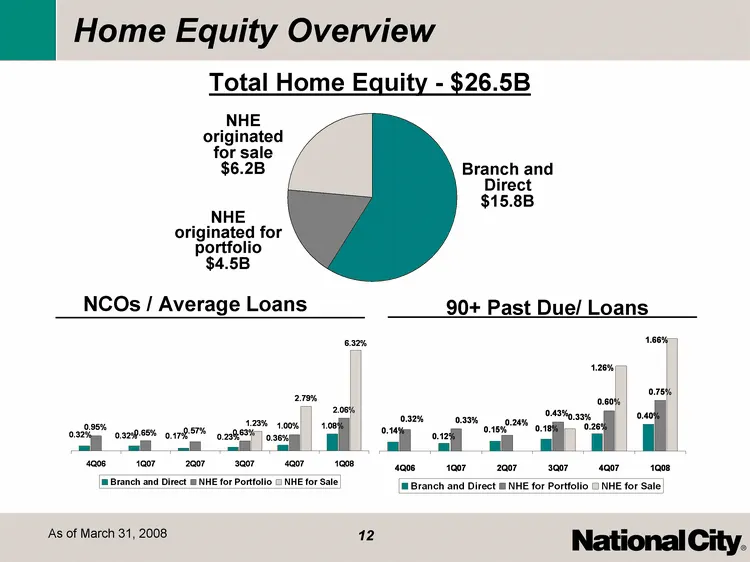
4Q06 1Q07 2Q07 3Q07 4Q07 1Q08 Branch and Direct 0.32 0.32 0.17 0.23 0.36 1.08 NHE for Portfolio 0.95 0.65 0.57 0.63 1 2.06 NHE for Sale 1.23 2.79 6.32 Other Consumer 0.73 0.5 0.48 0.67 1.68 0.384 0.119 -0.021 National Processing 0.02 0 0 Home Equity Overview 4Q06 1Q07 2Q07 3Q07 4Q07 1Q08 Branch and
Slide 13: National City Mortgage - Residential Construction
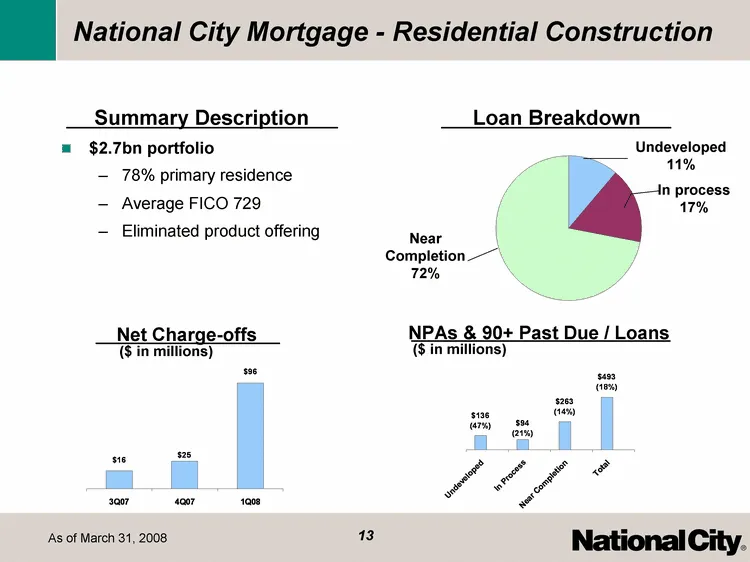
Undeveloped 331 2.19 3.47 4.29 In Process 510 1.35 1.67 1.61 Near Completion 2171 0.033 0.07 First Mortgage 27 0.234 0 Non-Prime 11 0.119 -0.021 NHE 20 0 0 Comm'l 2 Other 16 National City Mortgage - Residential Construction $2.7bn portfolio 78% primary residence Average FICO 729 Eliminated product o
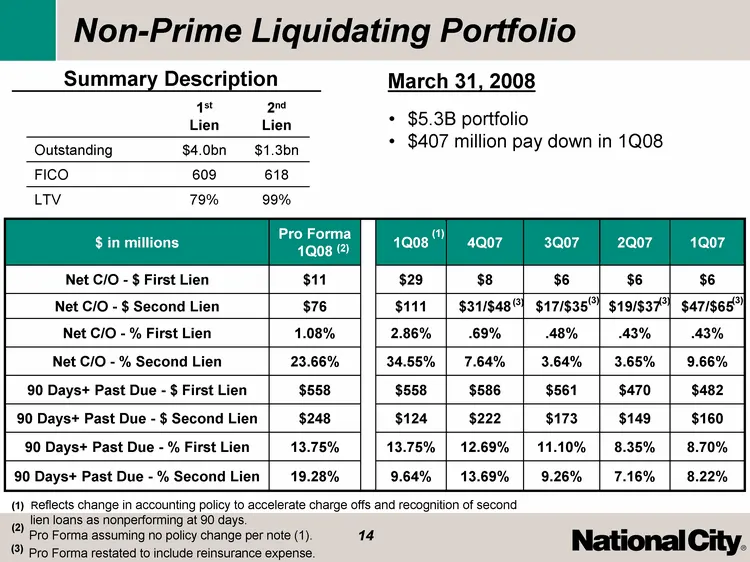
Slide 14: Non-Prime Liquidating Portfolio
Non-Prime Liquidating Portfolio $ in millions Pro Forma 1Q08 1Q08 4Q07 3Q07 2Q07 1Q07 Net C/O - $ First Lien $11 $29 $8 $6 $6 $6 Net C/O - $ Second Lien $76 $111 $31/$48 $17/$35 $19/$37 $47/$65 Net C/O - % First Lien 1.08% 2.86% .69% .48% .43% .43% Net C/O - % Second Lien 23.66% 34.55% 7.64% 3.64% 3
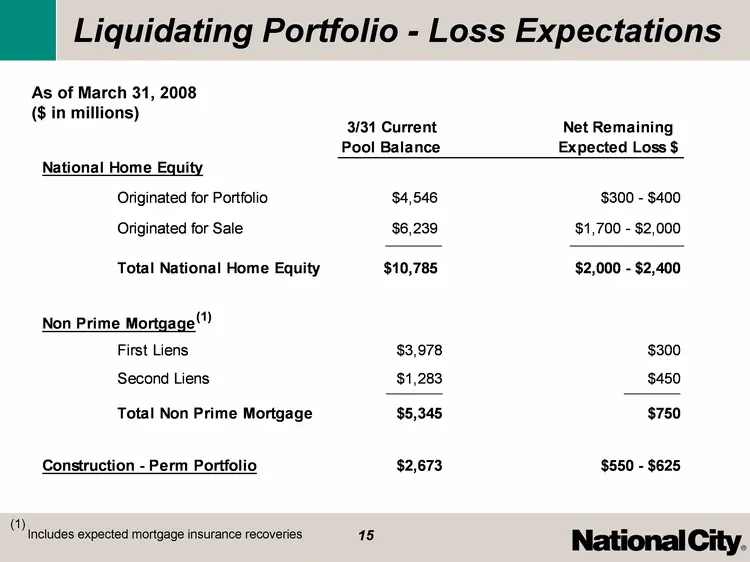
Slide 15: Liquidating Portfolio - Loss Expectations
Liquidating Portfolio - Loss Expectations As of March 31, 2008 ($ in millions) (1) Includes expected mortgage insurance recoveries (1)

Slide 16
Source: SEC EDGAR · 8-K filed Apr 21, 2008
More decks from National City Corporation
 Q3 2008 Earnings Presentation38 slides · Oct 21, 2008
 Q2 2008 Earnings Presentation32 slides · Jul 24, 2008
 Q1 2008 Earnings Presentation30 slides · Apr 21, 2008
 Q4 2007 Earnings Presentation23 slides · Jan 22, 2008
 MAF Bancorp — Merger or Acquisition (May 2007)17 slides · May 1, 2007
 Fidelity Bankshares — Merger or Acquisition (July 2006)21 slides · Jul 27, 2006