FGC Rosseti · RUS:FEES
FGC Rosseti — FGC UES — FY2017 Earnings Presentation
13 slides from FGC Rosseti's earnings presentation, March 2018
Slide 1: 2017 IFRS Operational and Financial Results
2017 IFRS OPERATIONAL AND FINANCIAL RESULTS March 2018
Slide 2: Key financial figures
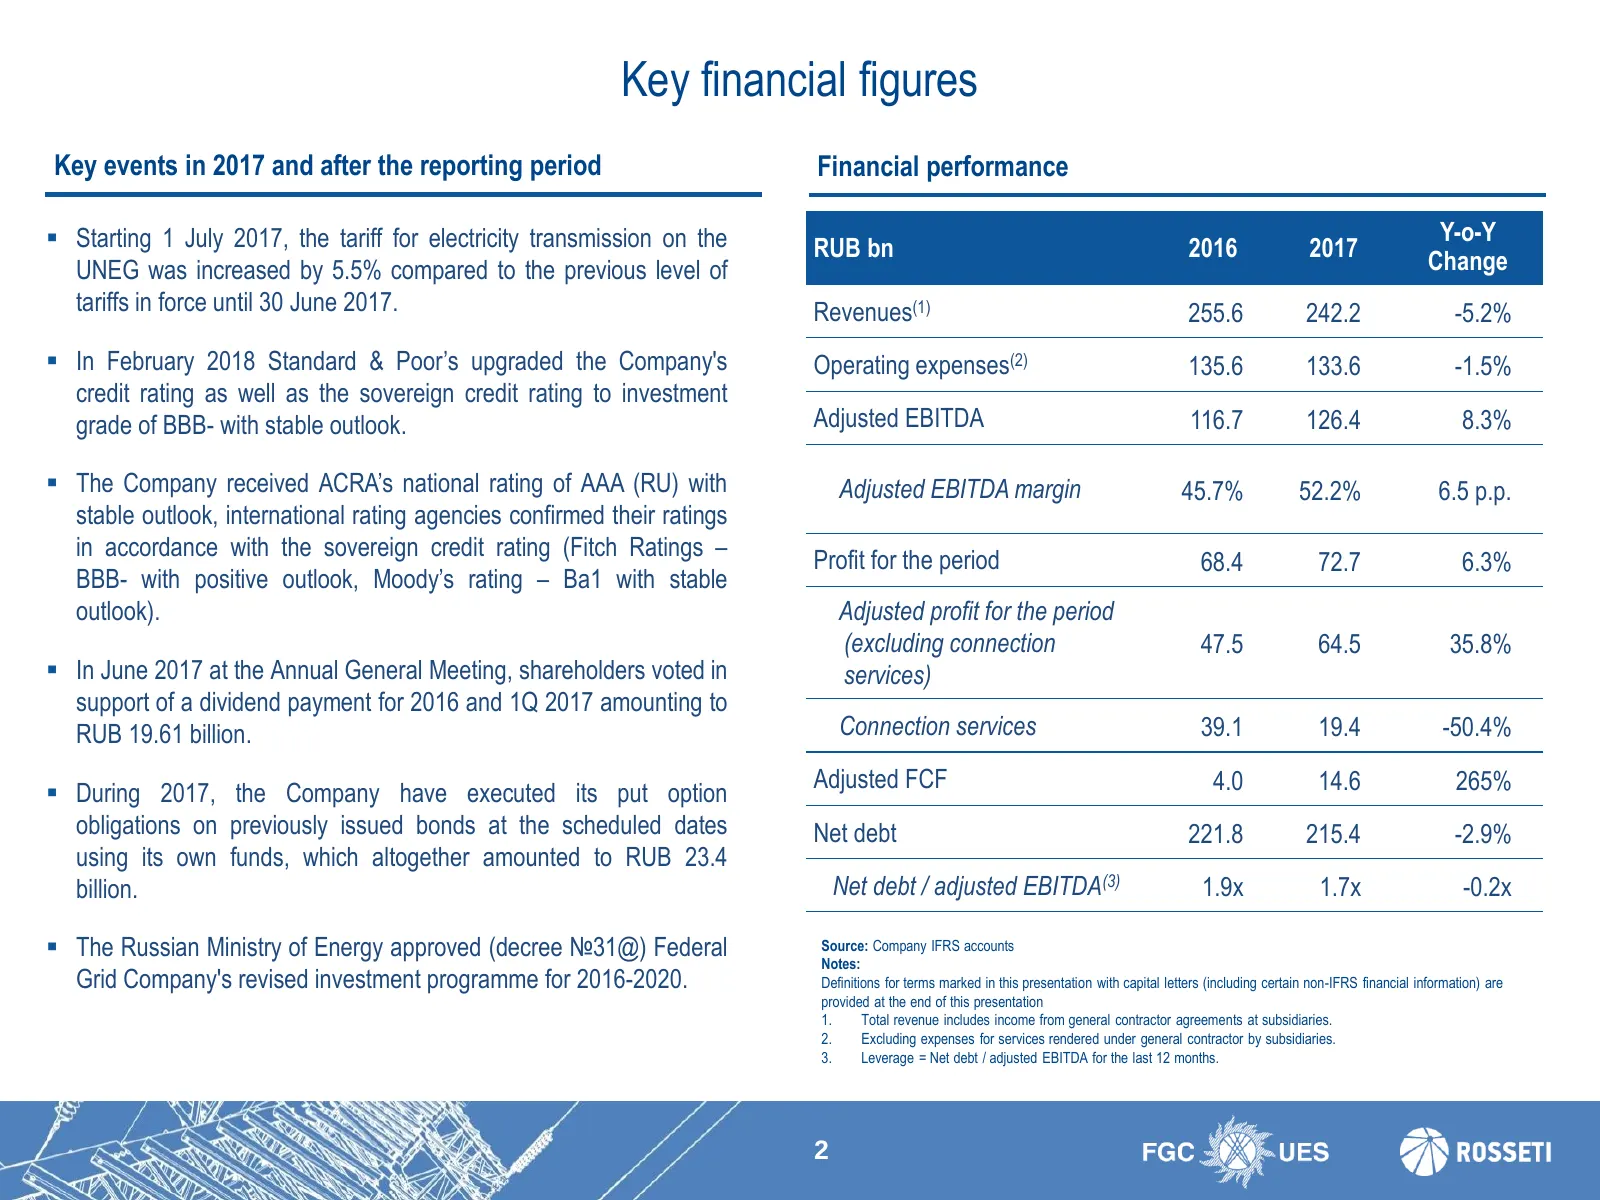
Key financial figures Key events in 2017 and after the reporting period Financial performance Starting 1 July 2017, the tariff for electricity transmission on the Y-o-Y RUB bn 2016 2017 Change UNEG was increased by 5.5% compared to the previous level of tariffs in force until 30 June 2017. Revenue
Slide 3: Operational Overview
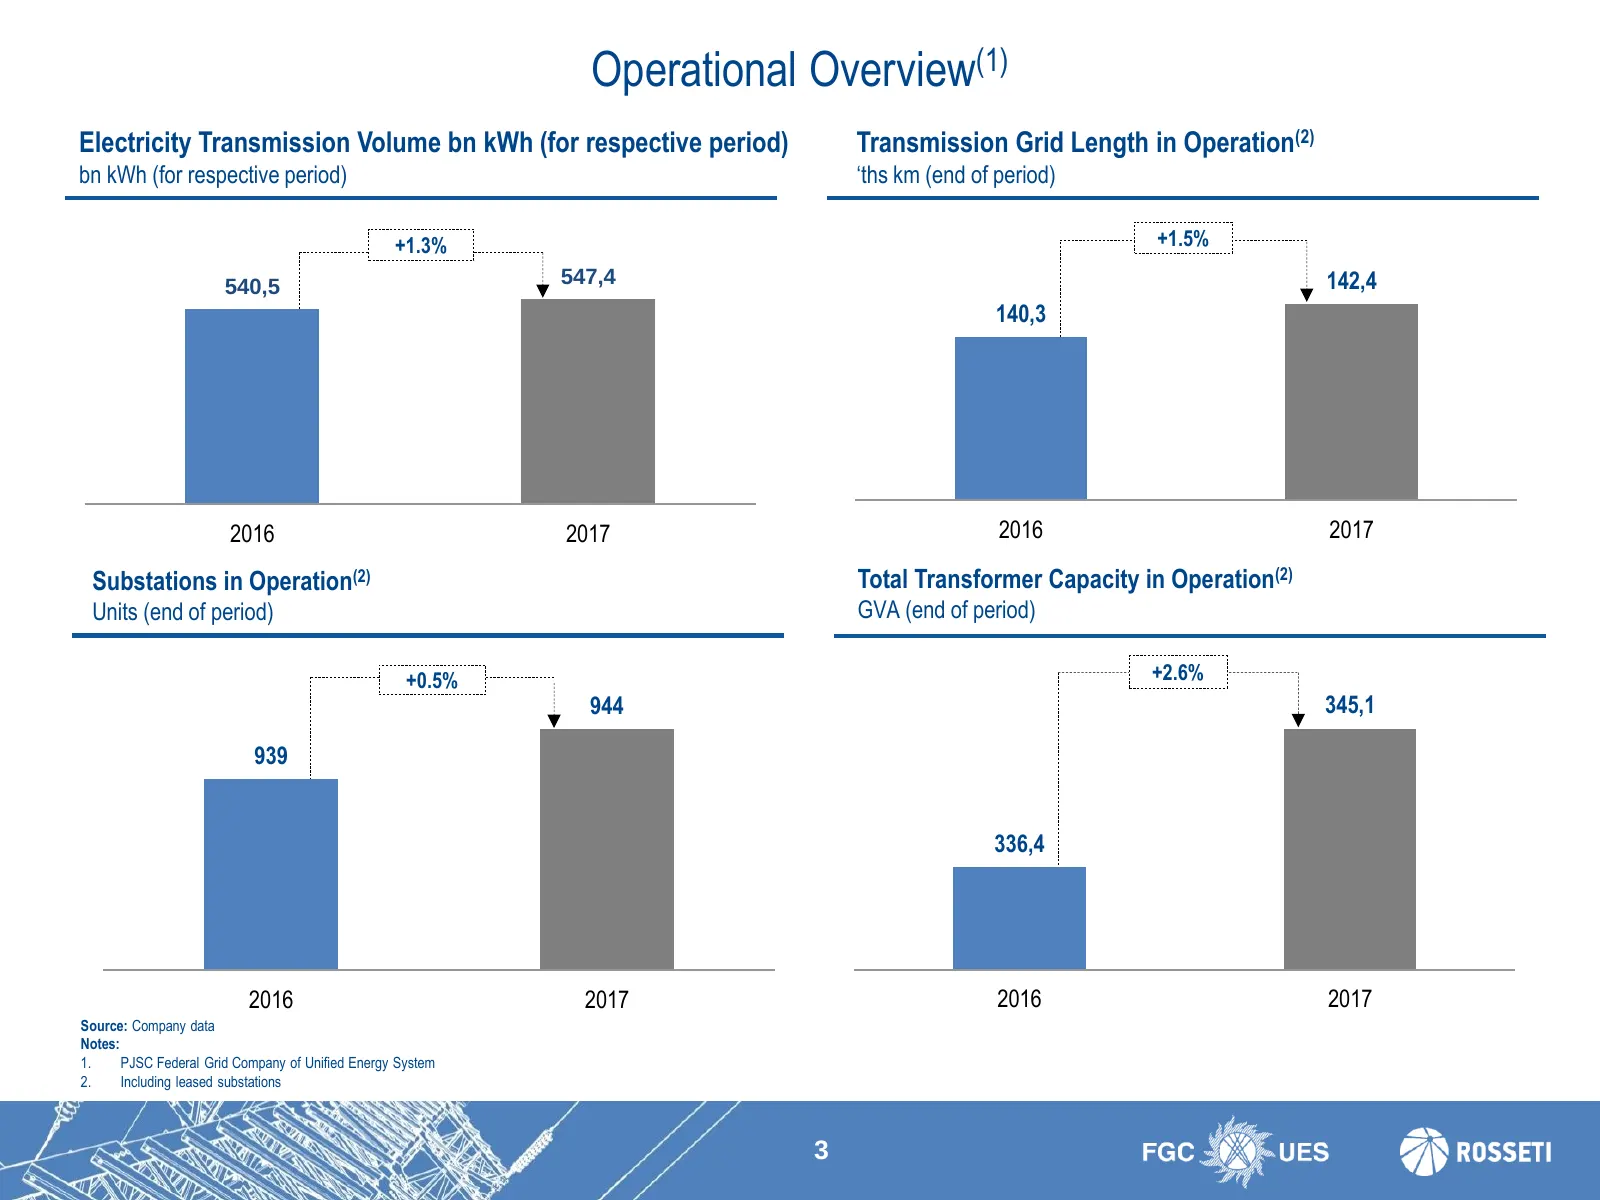
Operational Overview(1) Electricity Transmission Volume bn kWh (for respective period) Transmission Grid Length in Operation(2) bn kWh (for respective period) ‘ths km (end of period) +1.3% +1.5% 540,5 547,4 142,4 140,3 2016 2017 2016 2017 Substations in Operation(2) Total Transformer Capacity in Ope
Slide 4: Key Financials
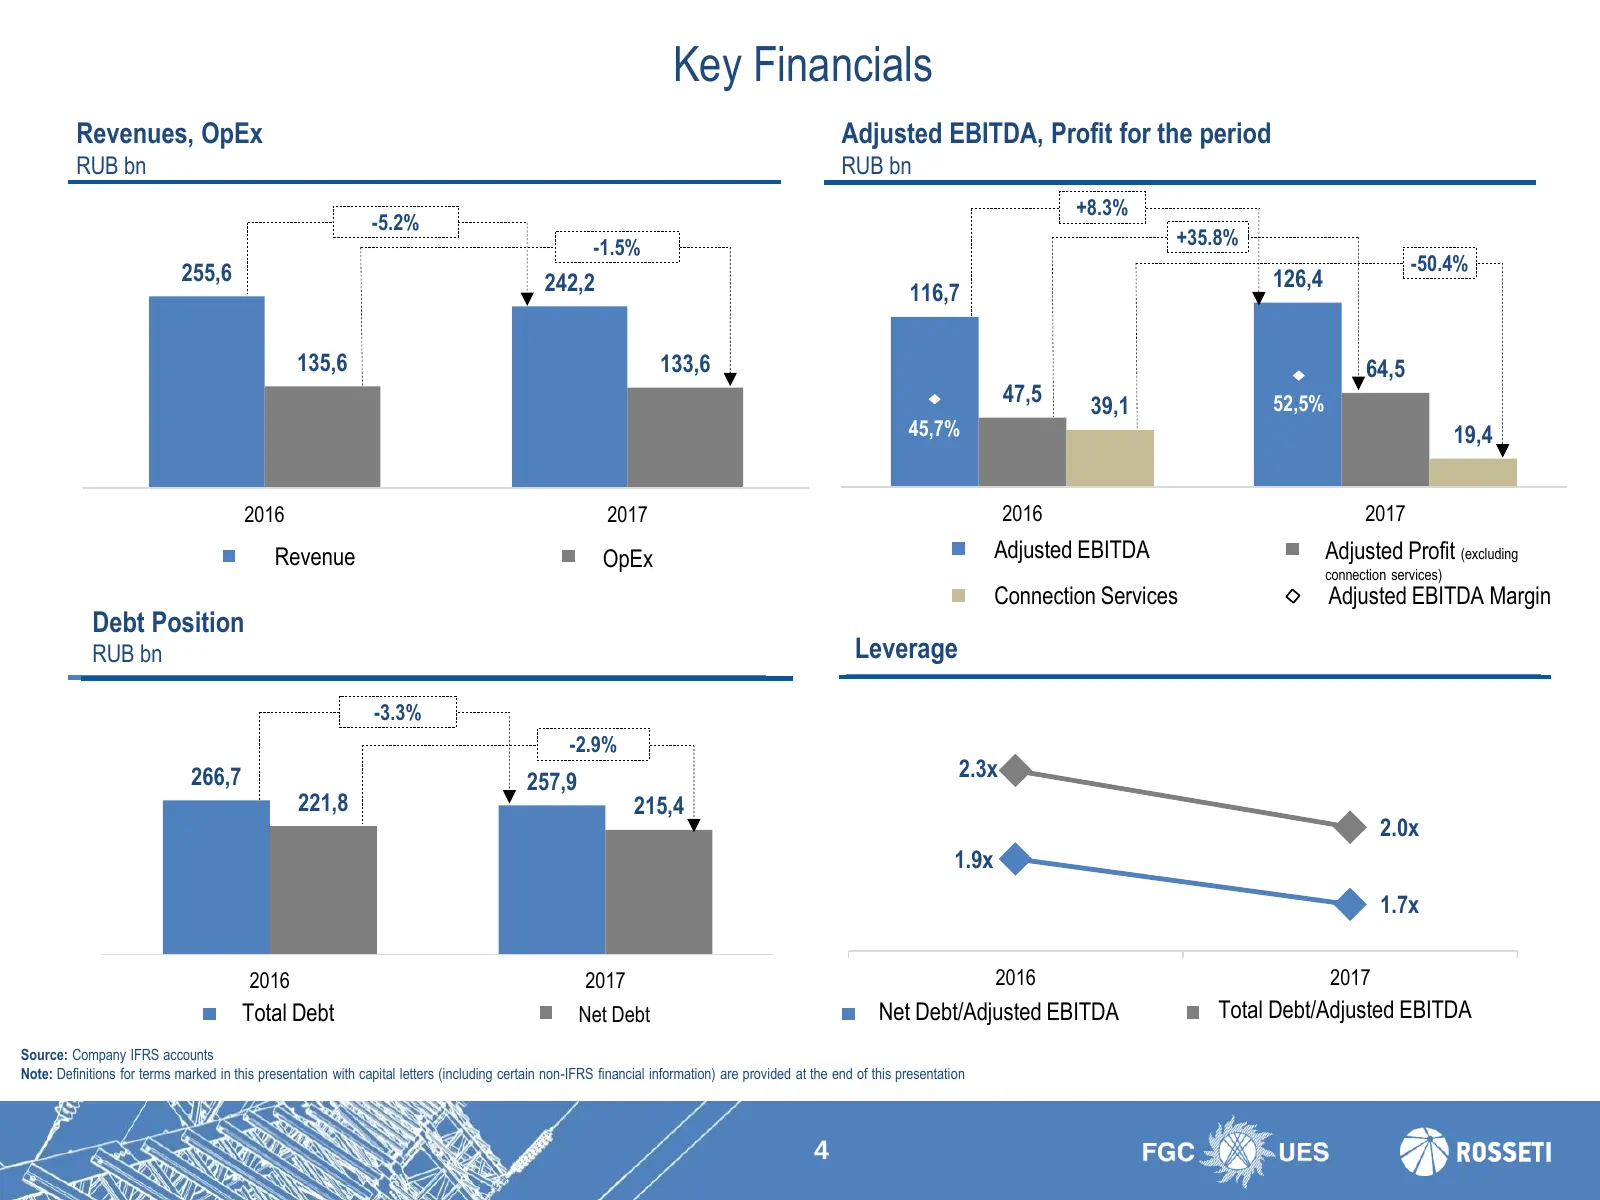
Key Financials Revenues, OpEx Adjusted EBITDA, Profit for the period RUB bn RUB bn +8.3% -5.2% -1.5% +35.8% 255,6 -50.4% 242,2 126,4 116,7 135,6 133,6 64,5 47,5 39,1 52,5% 45,7% 19,4 2016 2017 2016 2017 Revenue OpEx Adjusted EBITDA Adjusted Profit (excluding connection services) Connection Services
Slide 5: Revenue Structure
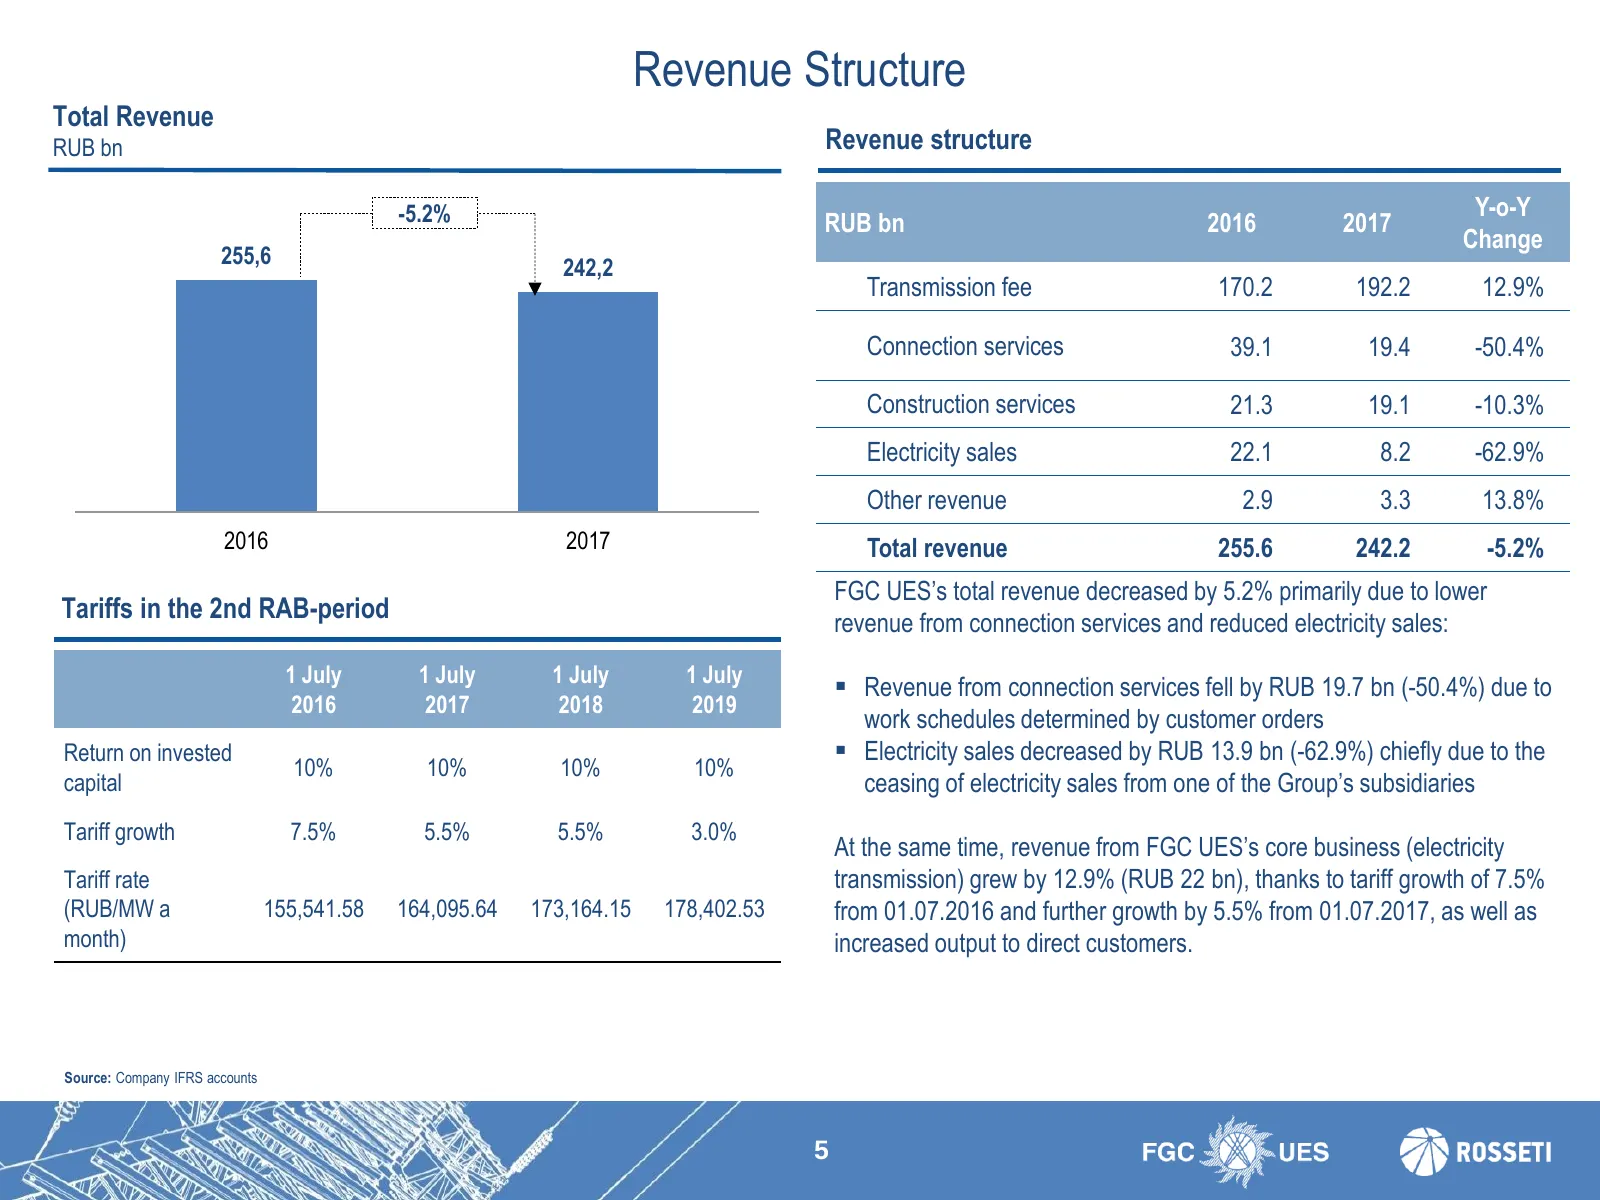
Revenue Structure Total Revenue RUB bn Revenue structure -5.2% Y-o-Y RUB bn 2016 2017 Change 255,6 242,2 Transmission fee 170.2 192.2 12.9% Connection services 39.1 19.4 -50.4% Construction services 21.3 19.1 -10.3% Electricity sales 22.1 8.2 -62.9% Other revenue 2.9 3.3 13.8% 2016 2017 Total revenu
Slide 6: Operating Expense Structure
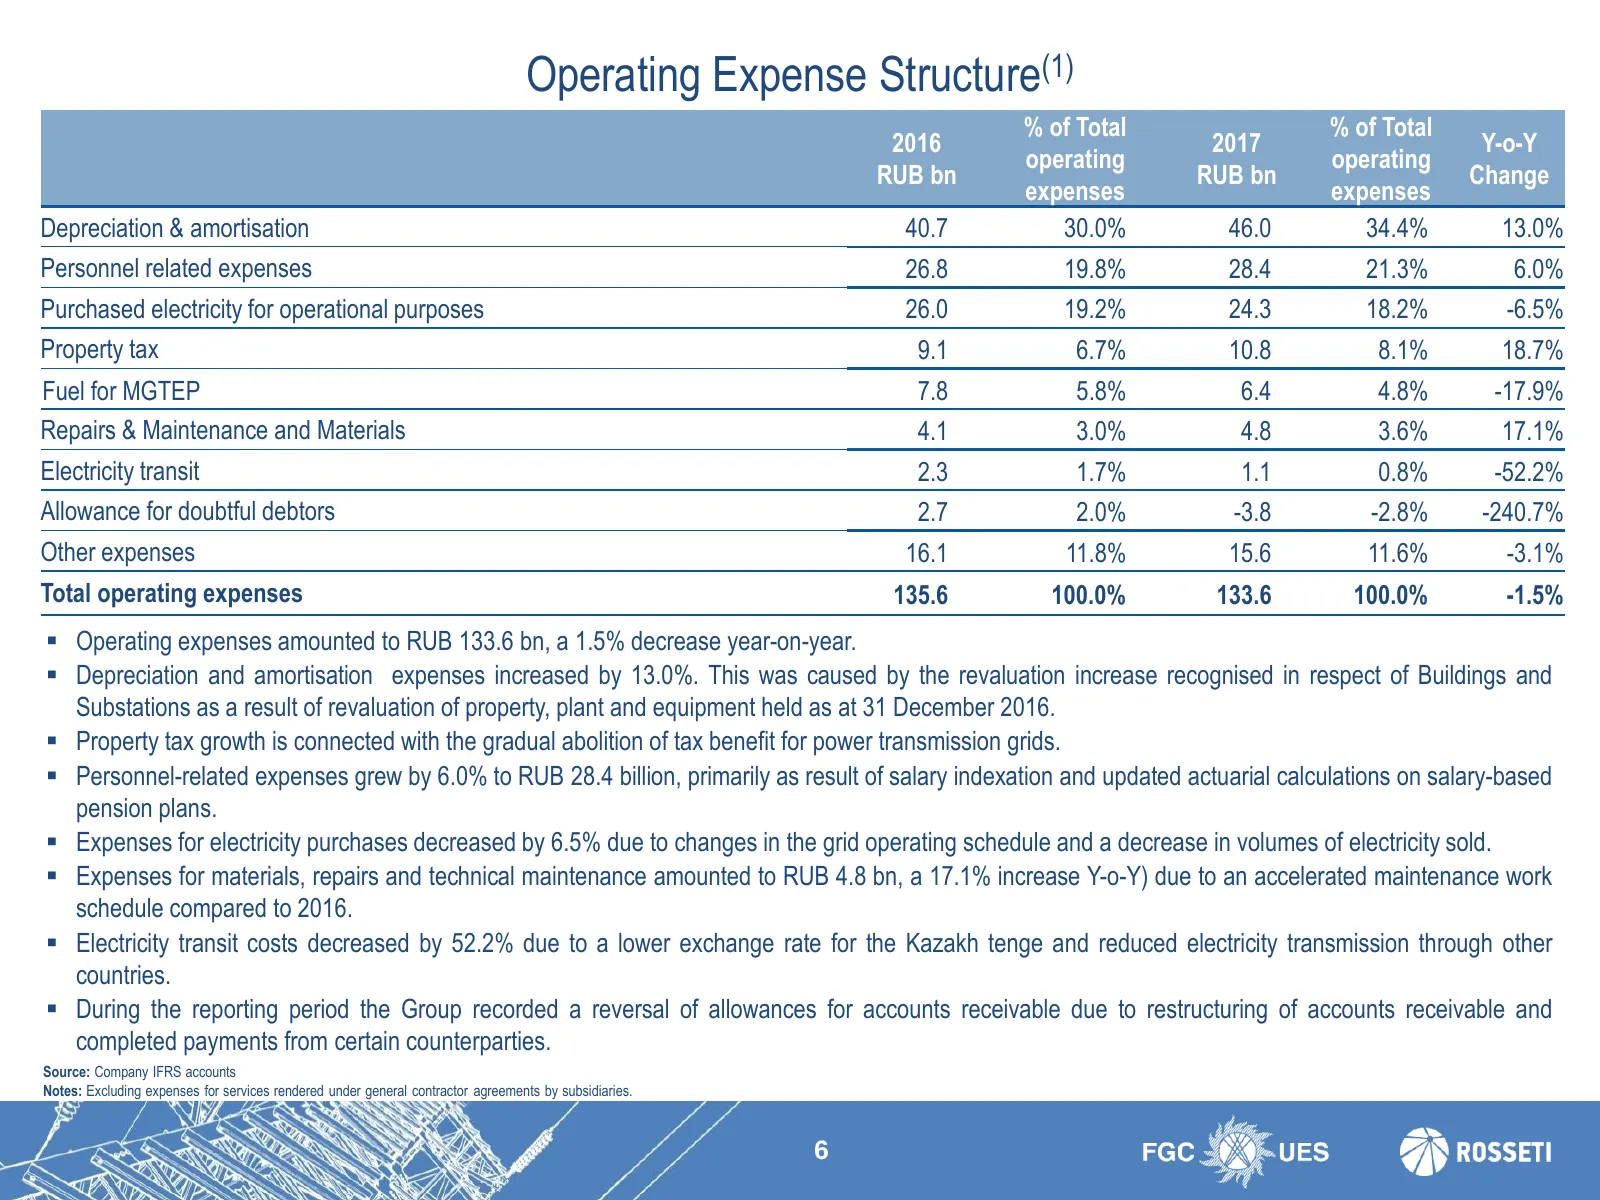
Operating Expense Structure(1) % of Total % of Total 2016 2017 Y-o-Y operating operating RUB bn RUB bn Change expenses expenses Depreciation & amortisation 40.7 30.0% 46.0 34.4% 13.0% Personnel related expenses 26.8 19.8% 28.4 21.3% 6.0% Purchased electricity for operational purposes 26.0 19.2% 24.3
Slide 7: EBITDA Analysis
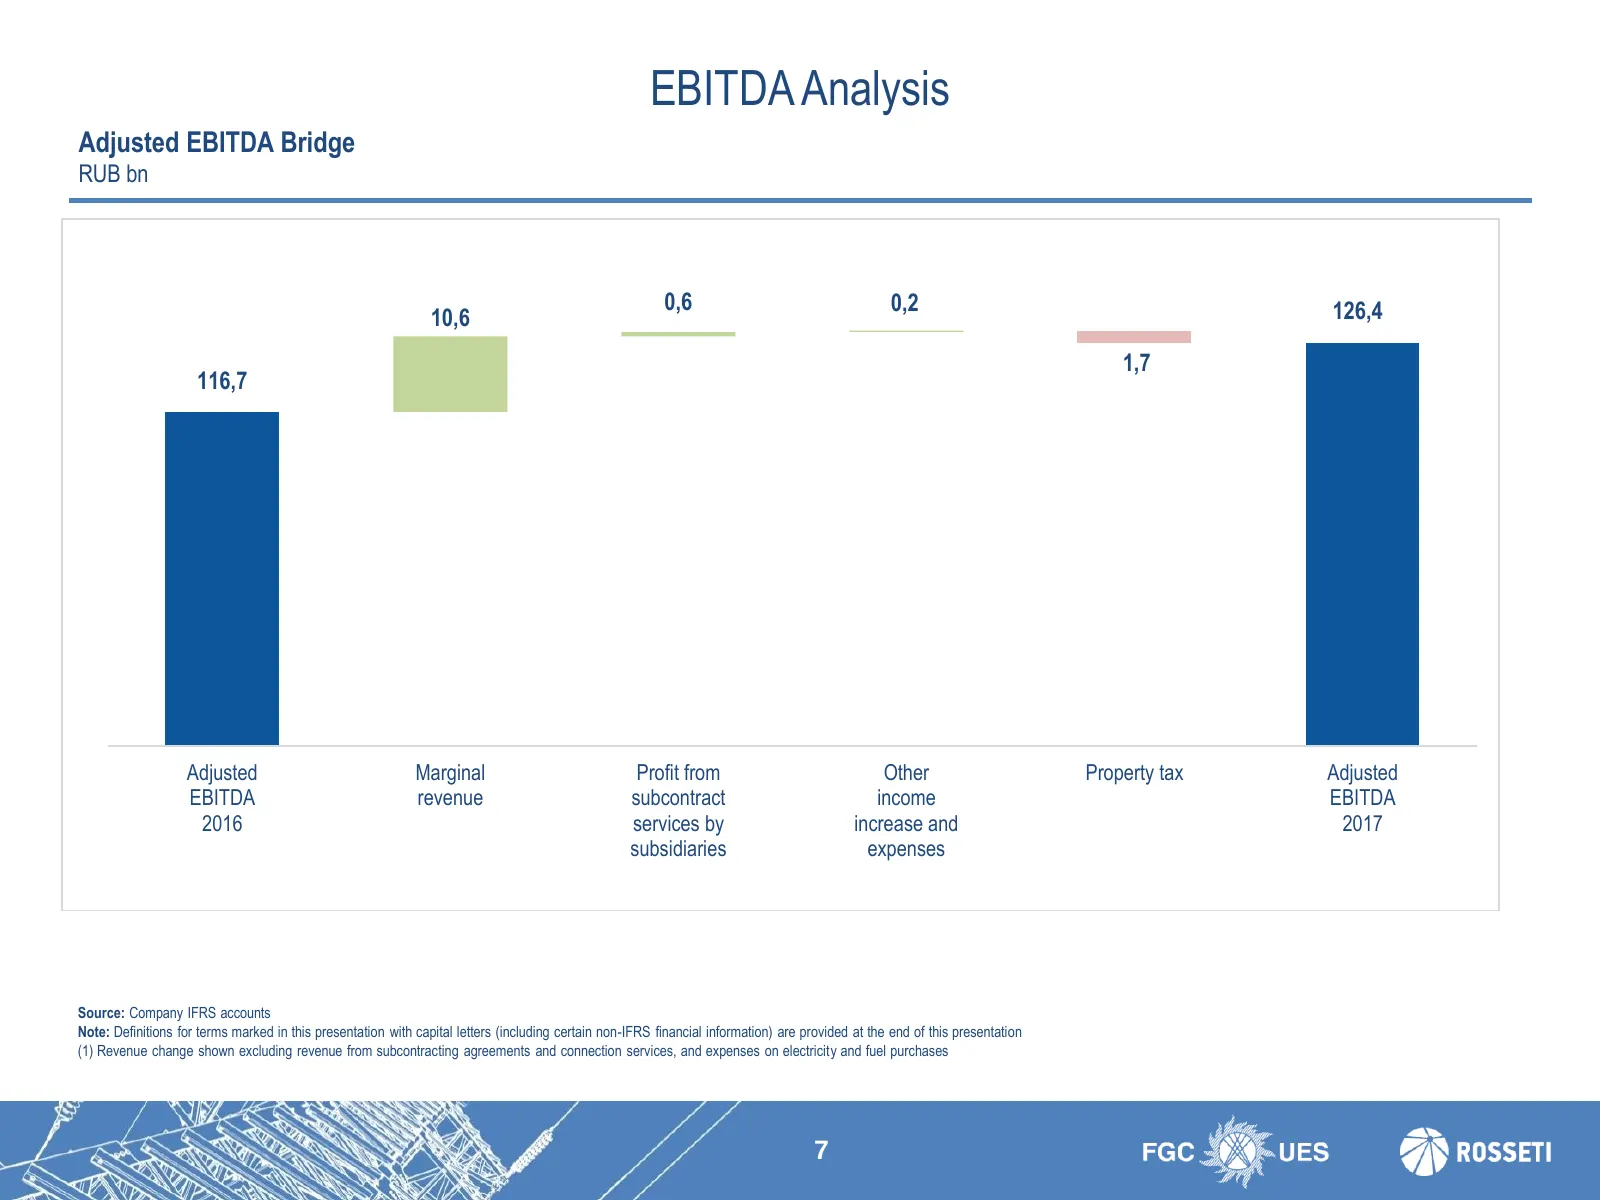
EBITDA Analysis Adjusted EBITDA Bridge RUB bn 0,6 0,2 126,4 10,6 1,7 116,7 Adjusted Marginal Profit from Other Property tax Adjusted EBITDA revenue subcontract income EBITDA 2016 services by increase and 2017 subsidiaries expenses Source: Company IFRS accounts Note: Definitions for terms marked in t
Slide 8: Free Cash Flow
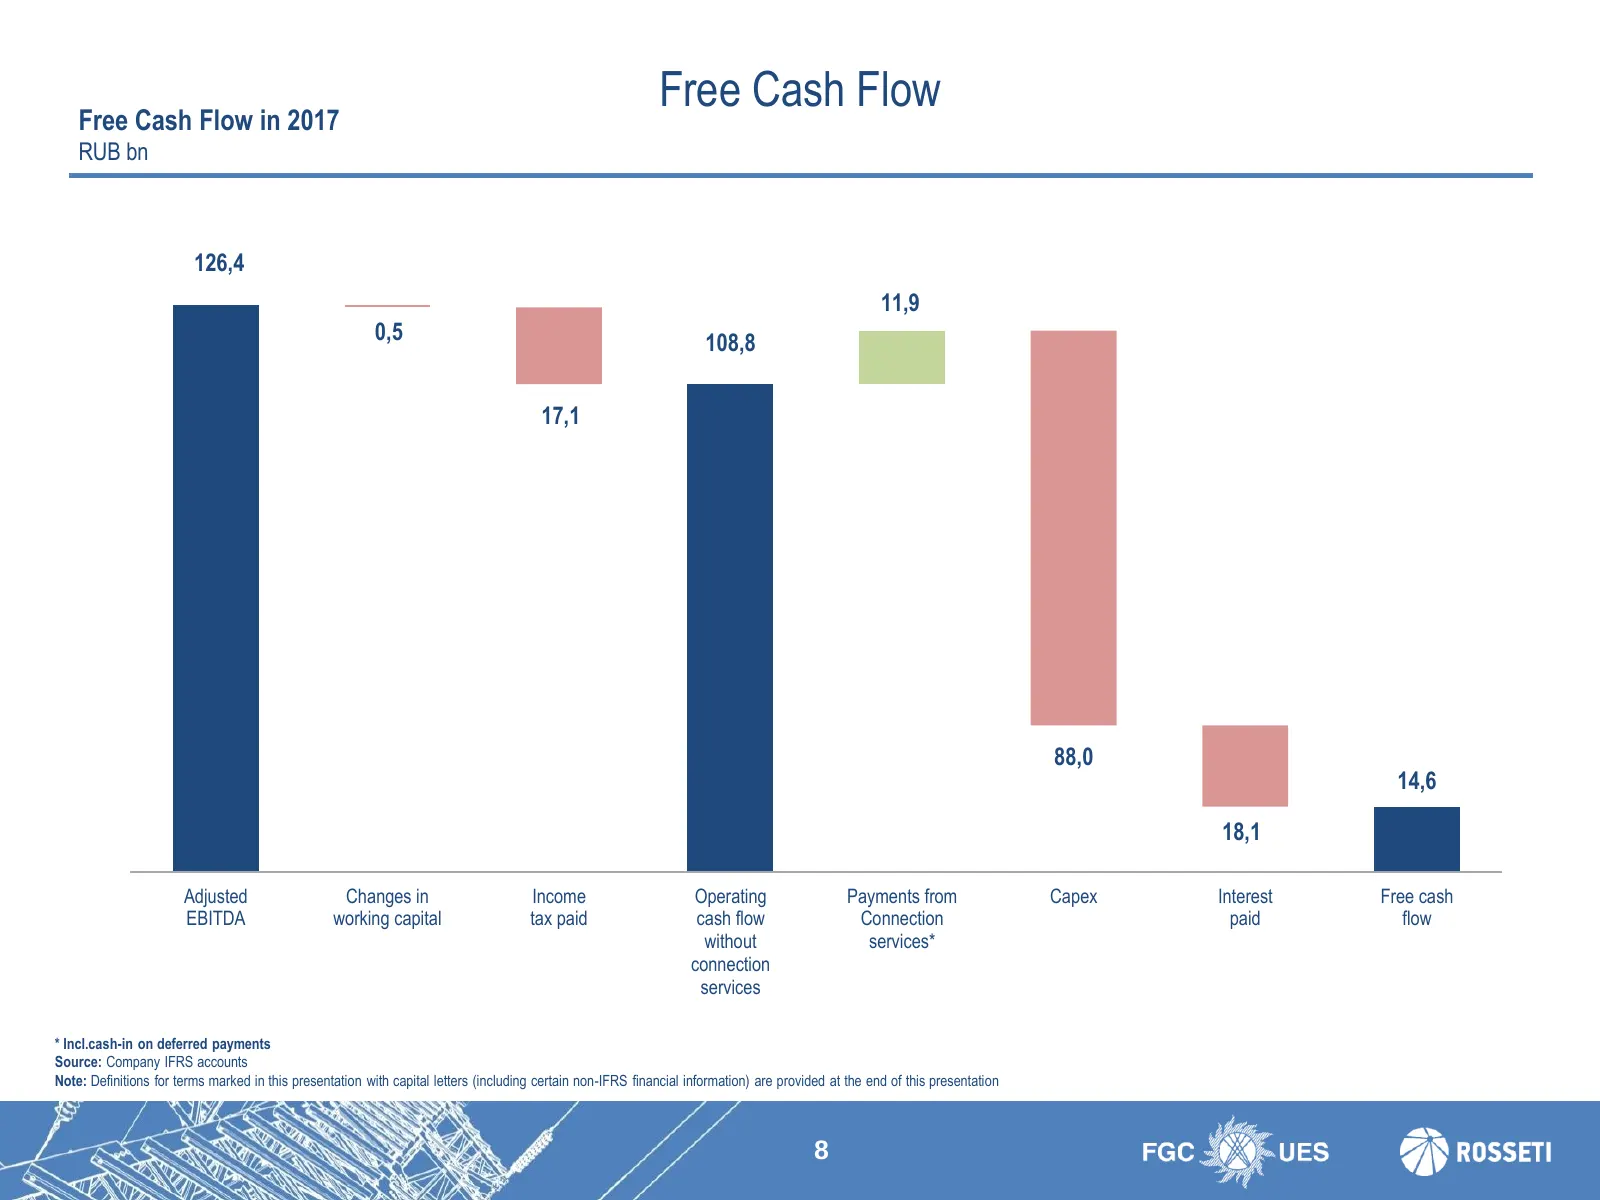
Free Cash Flow in 2017 Free Cash Flow RUB bn 126,4 11,9 0,5 108,8 17,1 88,0 14,6 18,1 Adjusted Changes in Income Operating Payments from Capex Interest Free cash EBITDA working capital tax paid cash flow Connection paid flow without services* connection services * Incl.cash-in on deferred payments S
Slide 9: Debt Capital Structure
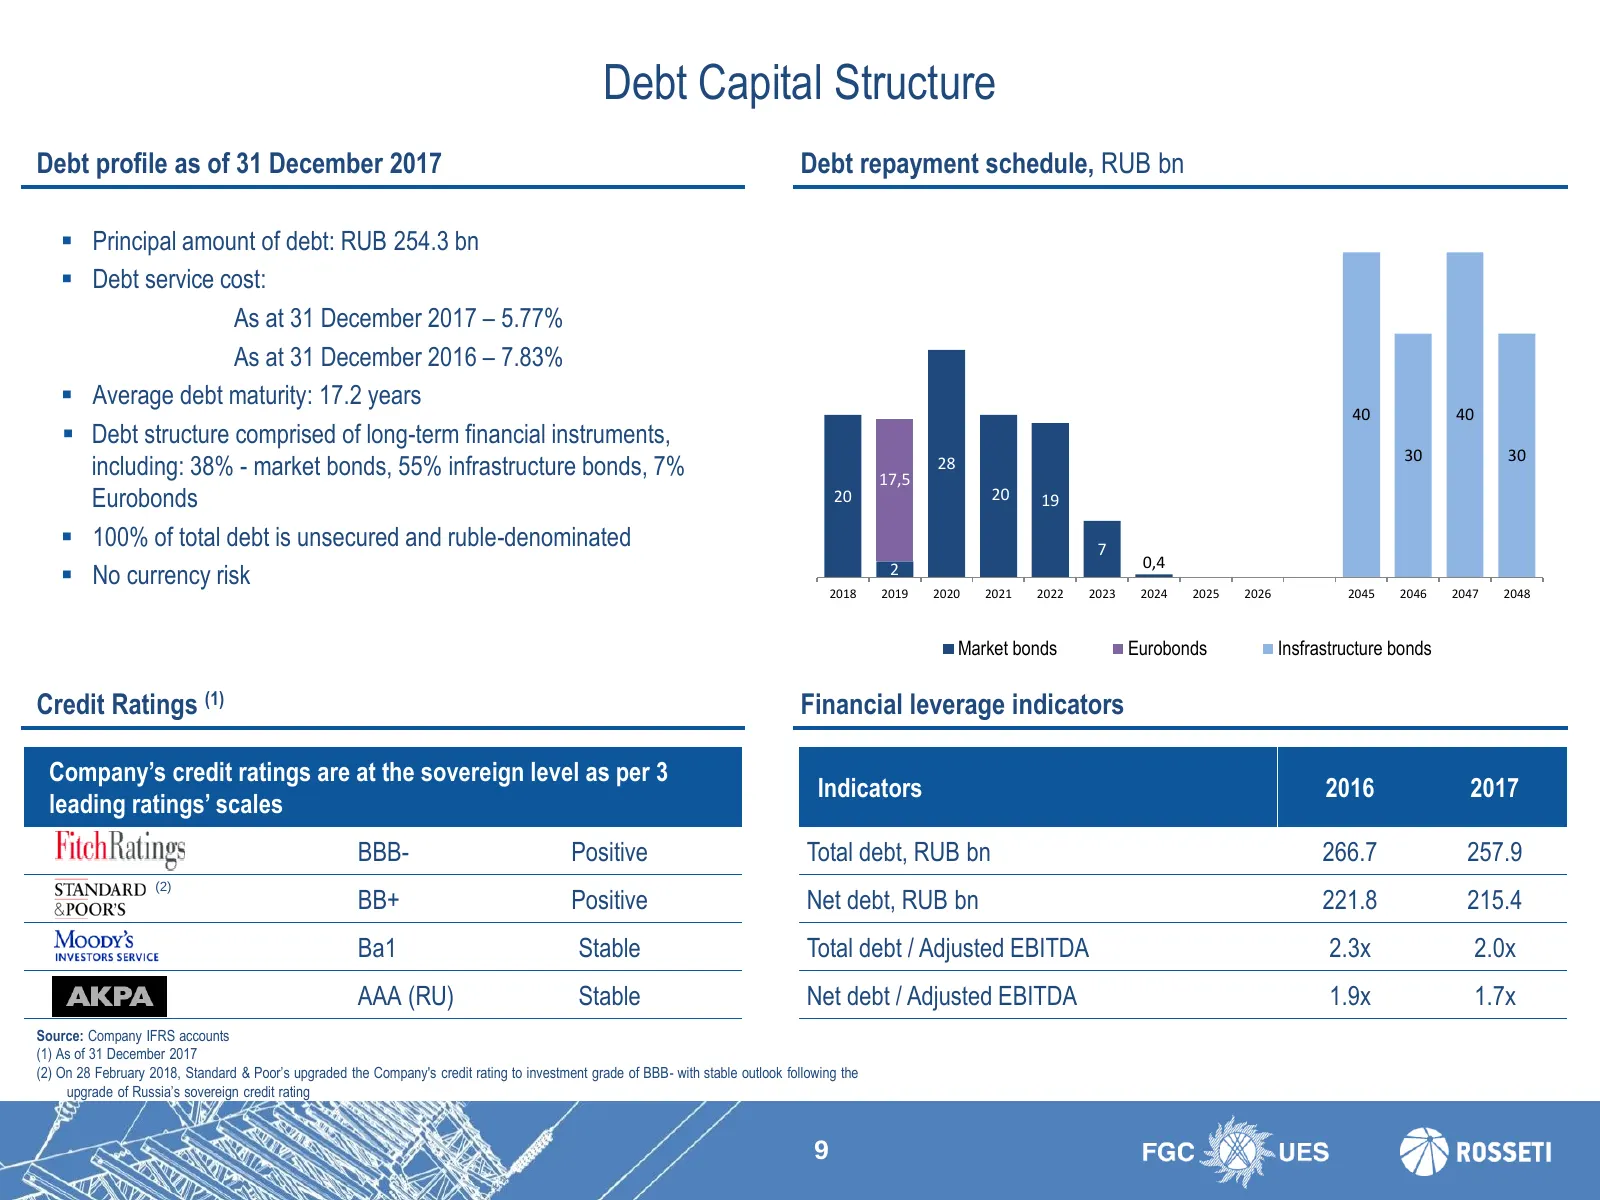
Debt Capital Structure Debt profile as of 31 December 2017 Debt repayment schedule, RUB bn Principal amount of debt: RUB 254.3 bn Debt service cost: As at 31 December 2017 – 5.77% As at 31 December 2016 – 7.83% Average debt maturity: 17.2 years 40 40 Debt structure comprised of long-term fin
Slide 10: Appendices
a London Avy’ Stock Exchange Sate LISTED STANDARD DEPOSITARY RECEIPTS APPENDICES “UES @ ROSSETI
Slide 11: Preliminary results of investment programme in 2017
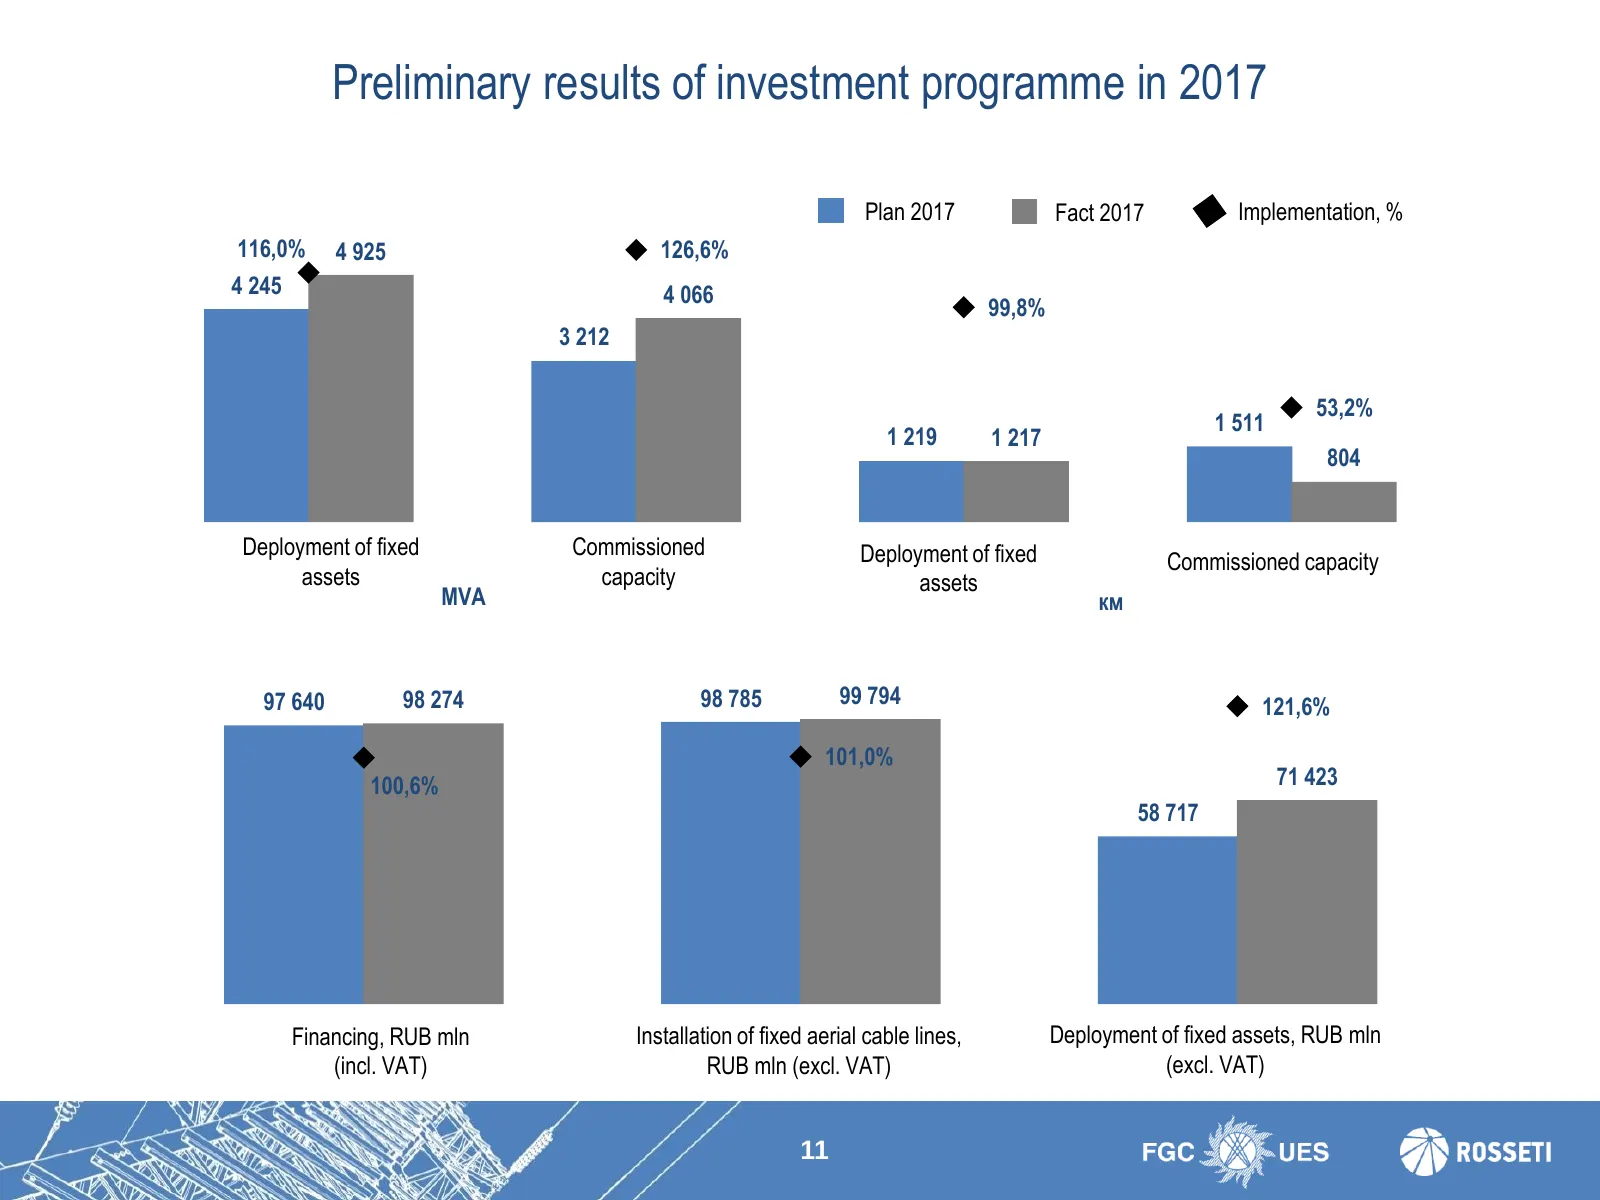
Preliminary results of investment programme in 2017 Plan 2017 Fact 2017 Implementation, % 116,0% 4 925 126,6% 4 245 4 066 99,8% 3 212 53,2% 1 511 1 219 1 217 804 Deployment of fixed Commissioned Deployment of fixed Commissioned capacity assets capacity assets MVA км 97 640 98 274 98 785 99 794 121,6
Slide 12: Glossary
Glossary General • The Unified National Electric Grid – the UNEG • PJSC “Federal Grid Company of Unified Energy System” – Federal Grid Company • PJSC “FGC UES” and its subsidiaries – the Group Financial Metrics Adjusted EBITDA is calculated as EBITDA (earnings before tax, financial income and expe
Slide 13: Investor Relations Contacts
Investor Relations Contacts Egor Toropov Tel.: +7 495 710 9333 ext. 2275 E-mail: toropov-ev@fsk-ees.ru Alexey Novikov Tel.: +7 495 710 9333 ext. 2143 E-mail: novikov-as@fsk-ees.ru
Source: Internet Archive copy of fsk-ees.ru
More decks from FGC Rosseti
 пао «фск еэс» — 9M 2021 Earnings Presentation9 slides · November 2021
 Rosseti FGC UES — 9M 2021 Earnings Presentation9 slides · November 2021
 PJSC FGC UES (Rosseti FGC UES) — FY2020 Earnings Presentation9 slides · Jun 1, 2021
 пао «фск еэс» — FY2020 Earnings Presentation10 slides · 2021
 Россети (Rosseti) / ПАО «ФСК ЕЭС» — FY2020 Earnings Presentation20 slides · 2021
 пао «фск еэс» — FY2019 Earnings Presentation11 slides · Mar 5, 2020