Celsia SA ESP · BVC:CELSIA
Celsia SA ESP — Celsia — Investor Presentation (2020)
26 slides from Celsia SA ESP's investor presentation, 2020

Slide 1: North Andean Investor Trip
North Andean Investor Trip BTG Pactual
Slide 2: Agenda
AGENDA 1. Company overview 2. Path to a new age of energy 3. Investor value proposition 4. Embracing sustainability 5. Key financials 6. Appendix
Slide 3: Disclaimer
3 Disclaimer This document provides information about Celsia S.A. In no case this document constitutes a comprehensive analysis of the financial, production and sales situation of the company. To evaluate whether to purchase or sell securities of the company, the investor must conduct its own indepe
Slide 4: Celsia at a glance
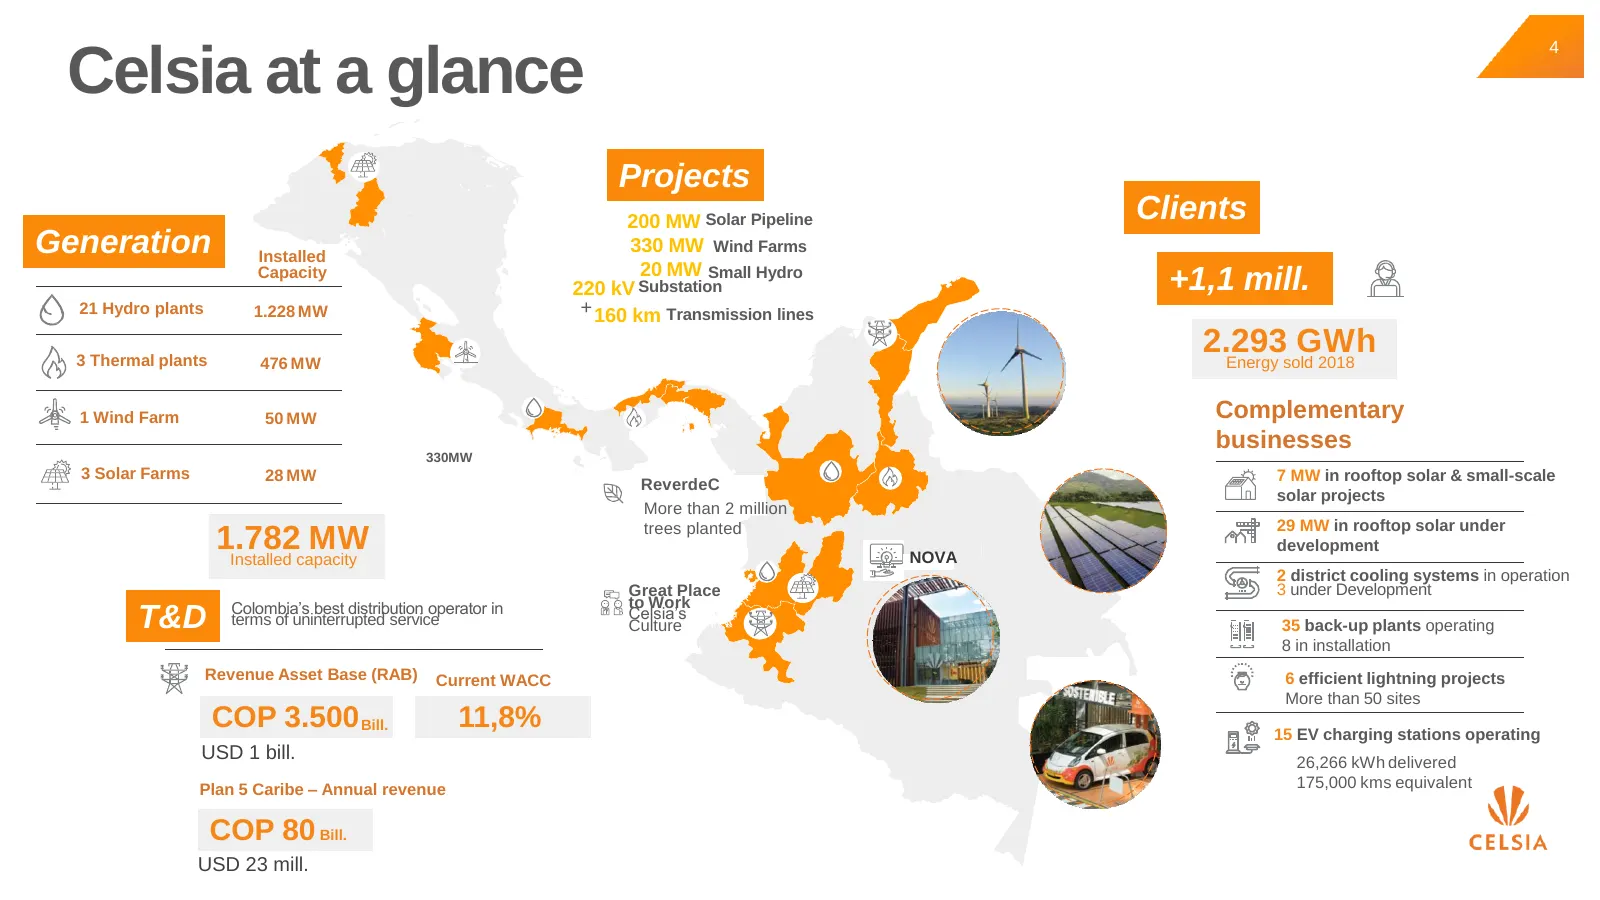
4 Celsia at a glance Projects 200 MW Solar Pipeline Clients Generation Installed 330 MW Wind Farms Capacity 20 MW Small Hydro 220 kV Substation +1,1 mill. 21 Hydro plants 1.228 MW + 160 km Transmission lines 3 Thermal plants 2.293 GWh Energy sold 2018 476 MW 1 Wind Farm 50 MW Complementary businesse
Slide 5: 2025 vision | MEGA
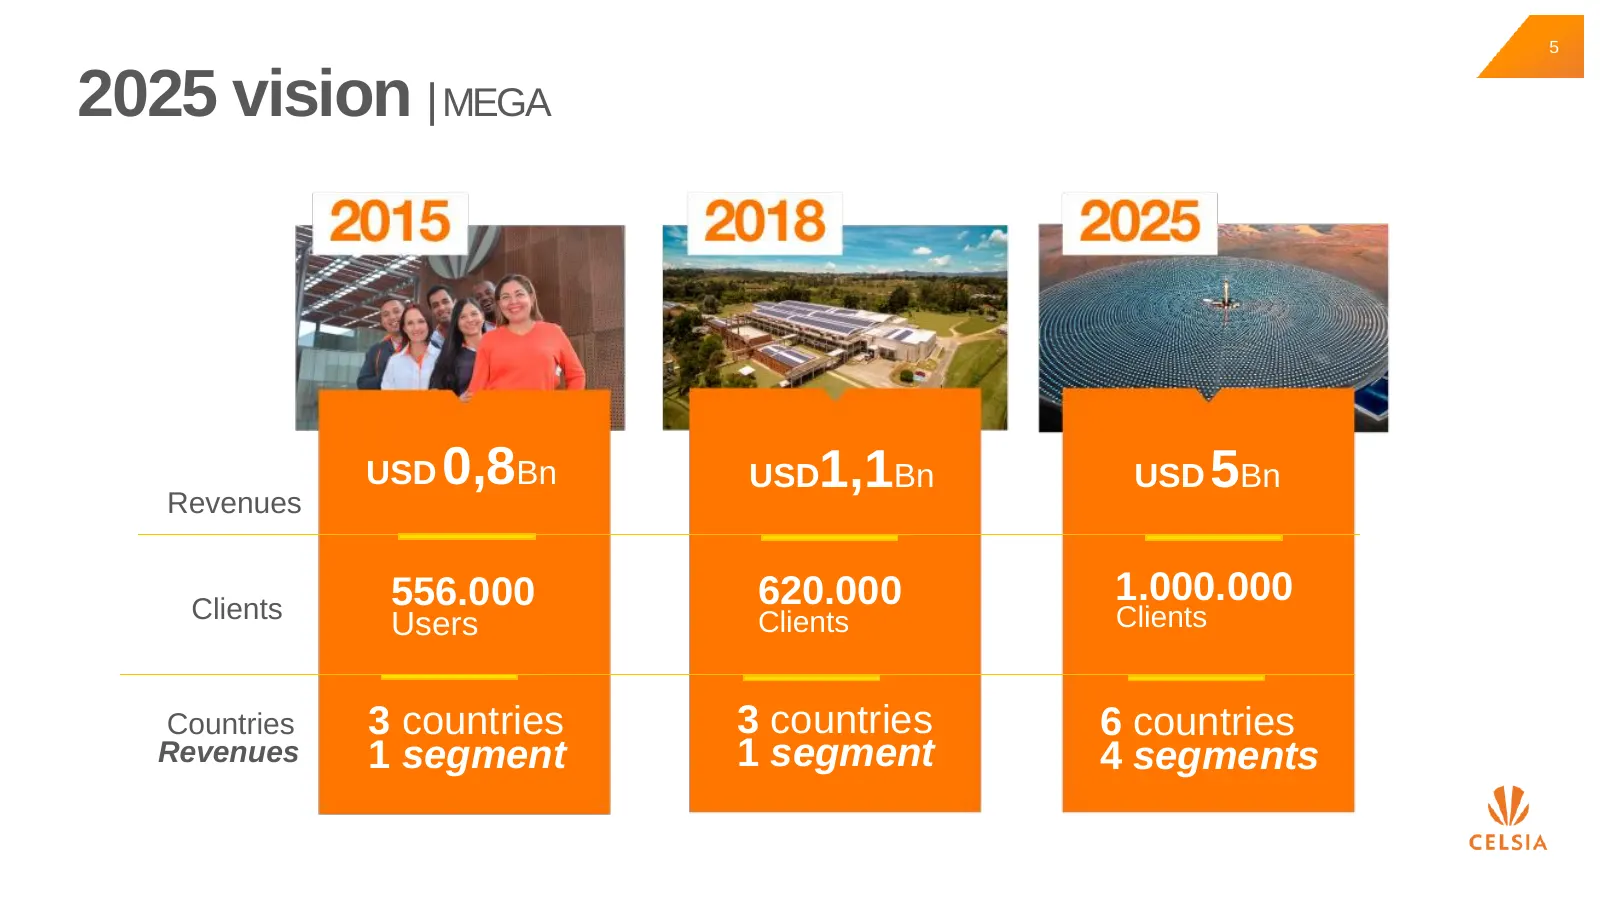
5 2025 vision | MEGA USD 0,8Bn USD1,1Bn USD 5Bn Revenues Clients 556.000 620.000 1.000.000 Users Clients Clients Countries 3 countries 3 countries 6 countries Revenues 1 segment 1 segment 4 segments
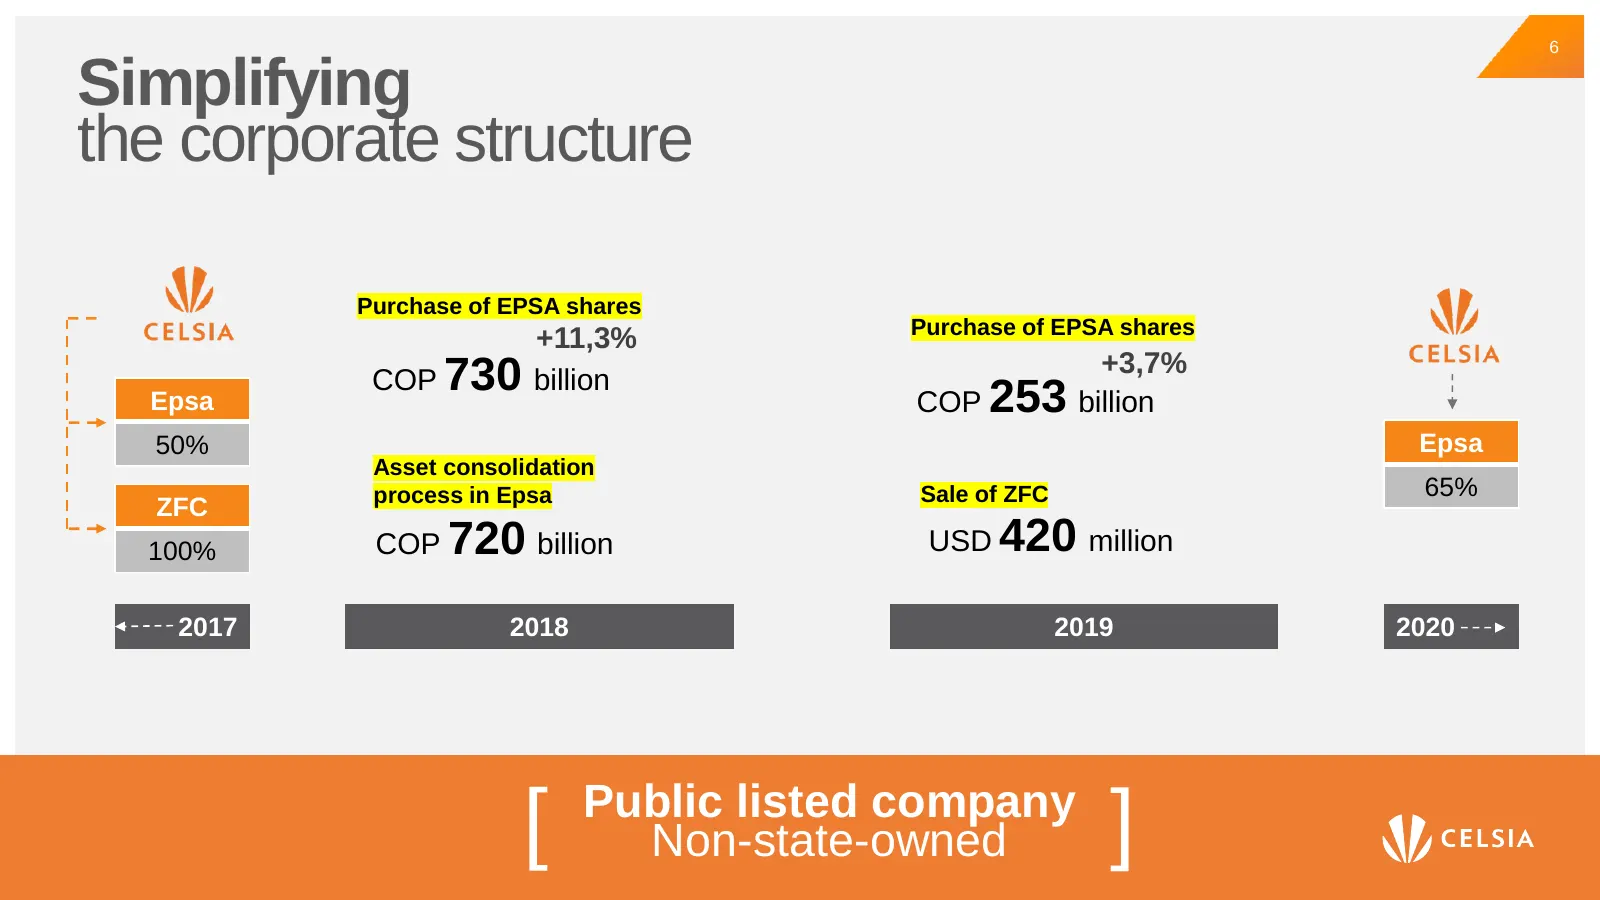
Slide 6: Simplifying the corporate structure
6 Simplifying the corporate structure Purchase of EPSA shares Purchase of EPSA shares +11,3% +3,7% COP 730 billion Epsa COP 253 billion 50% Epsa Asset consolidation process in Epsa Sale of ZFC 65% ZFC 100% COP 720 billion USD 420 million 2017 2018 2019 2020 Public listed company [ [ Non-state-owned
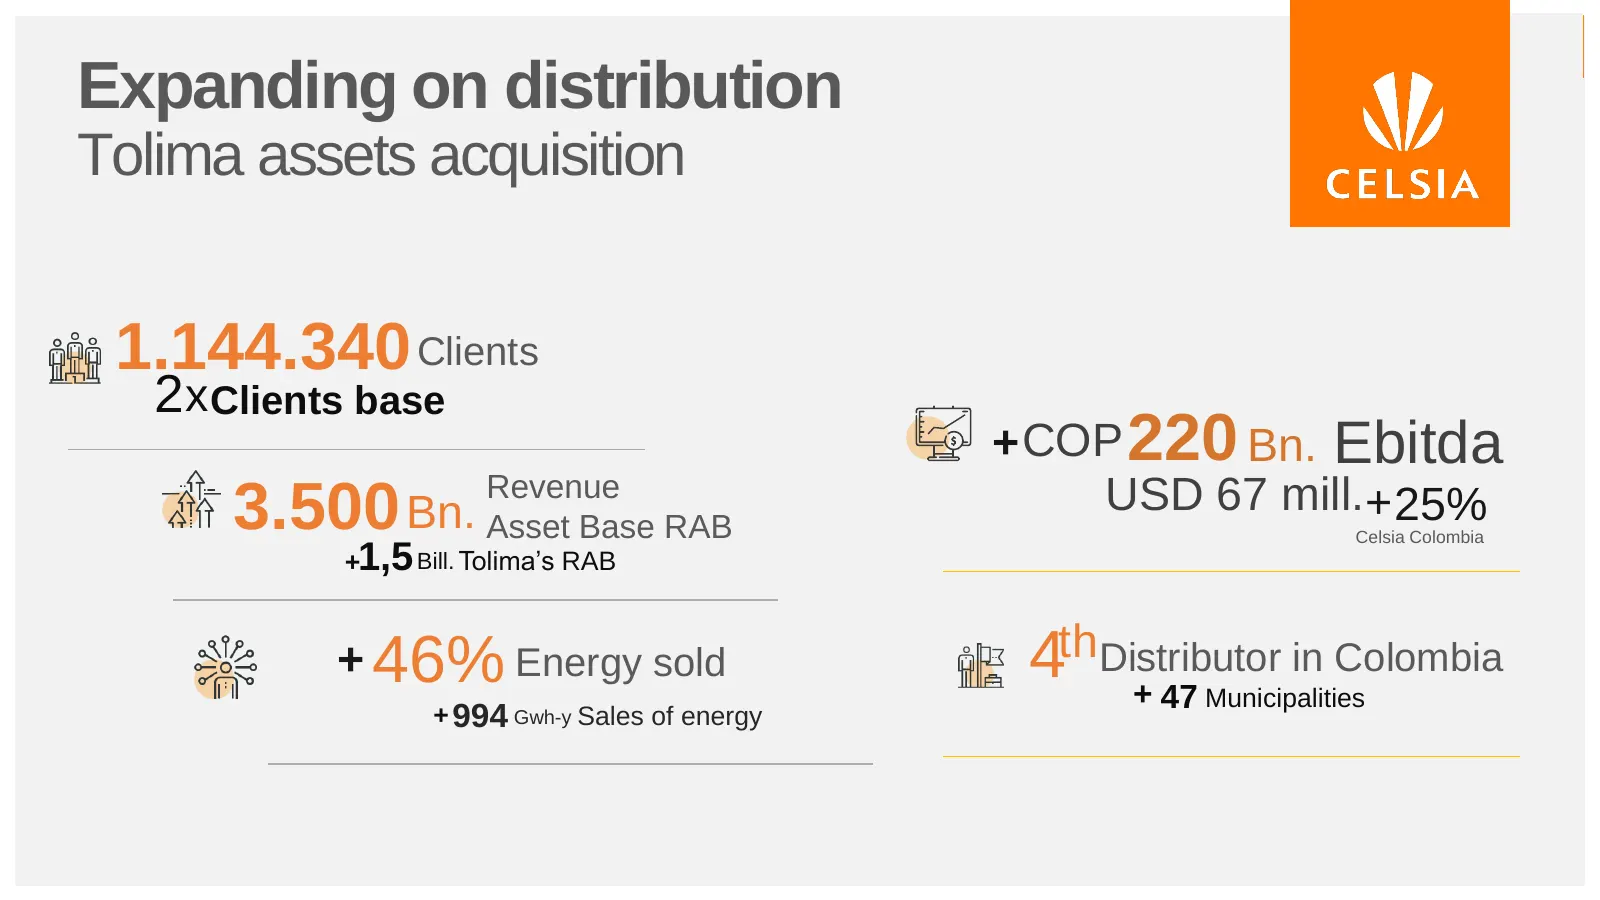
Slide 7: Expanding on distribution: Tolima assets acquisition
7 Expanding on distribution Tolima assets acquisition 1.144.340 Clients 2x Clients base + COP 220 Bn. Ebitda Revenue USD 67 mill.+ 25% 3.500 Bn. Asset Base RAB Celsia Colombia +1,5 Bill. Tolima’s RAB + 46% Energy sold 4thDistributor + 47 in Colombia Municipalities + 994 Gwh-y Sales of energy
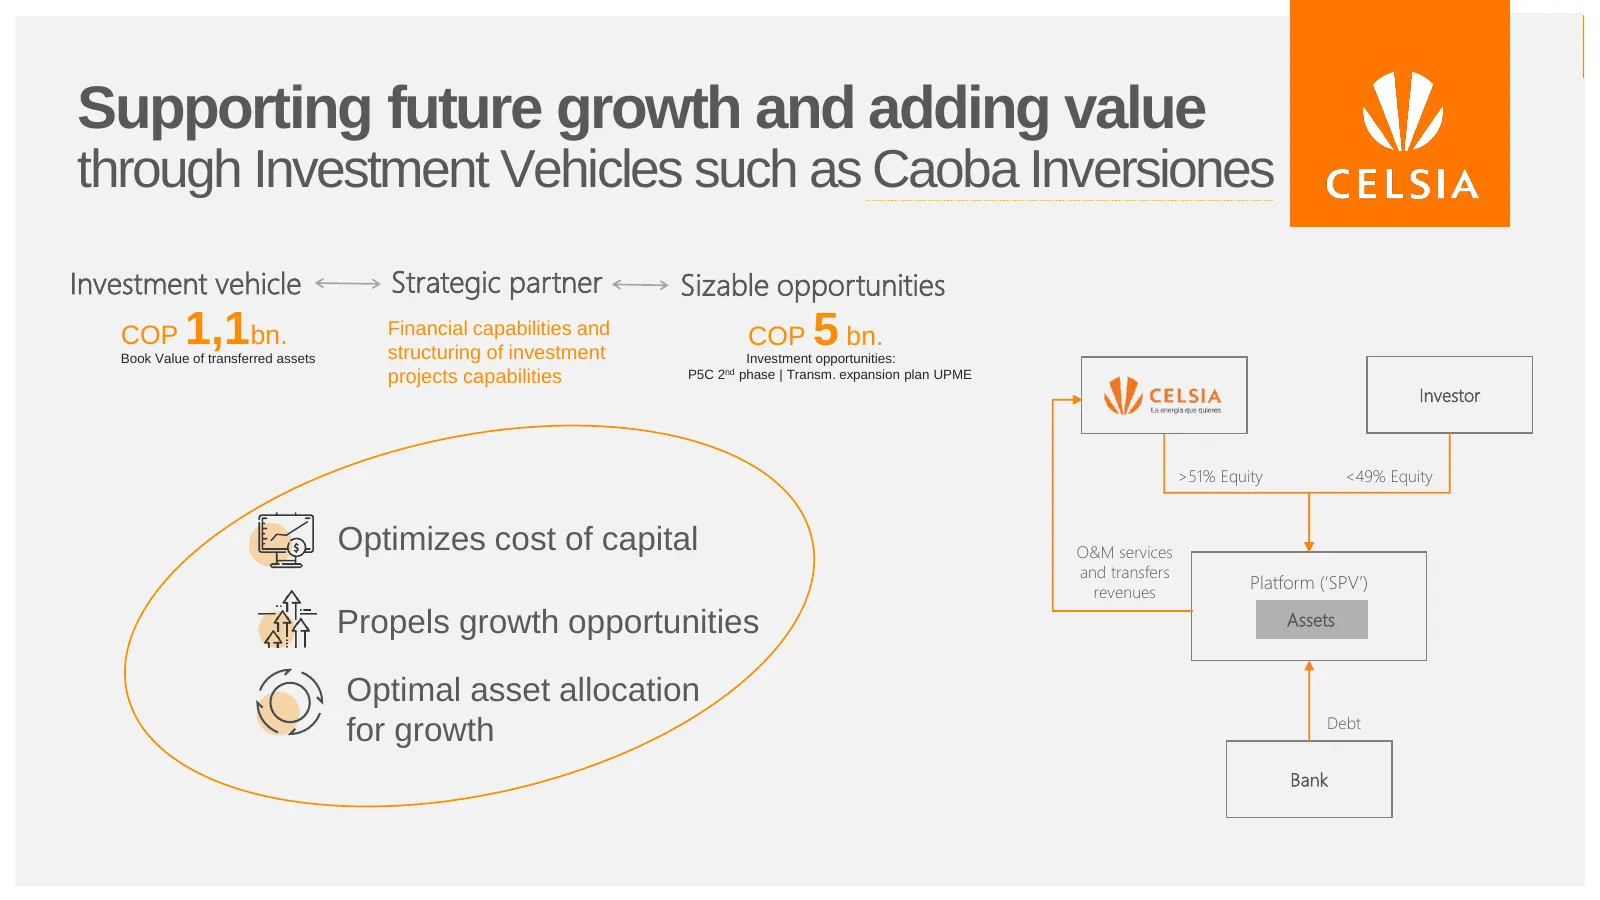
Slide 8: Supporting future growth and adding value through Investment Vehicles such as Caoba Inversiones
8 Supporting future growth and adding value through Investment Vehicles such as Caoba Inversiones Investment vehicle Strategic partner Sizable opportunities COP 1,1bn. Book Value of transferred assets Financial capabilities and structuring of investment COP 5 bn. Investment opportunities: projects c
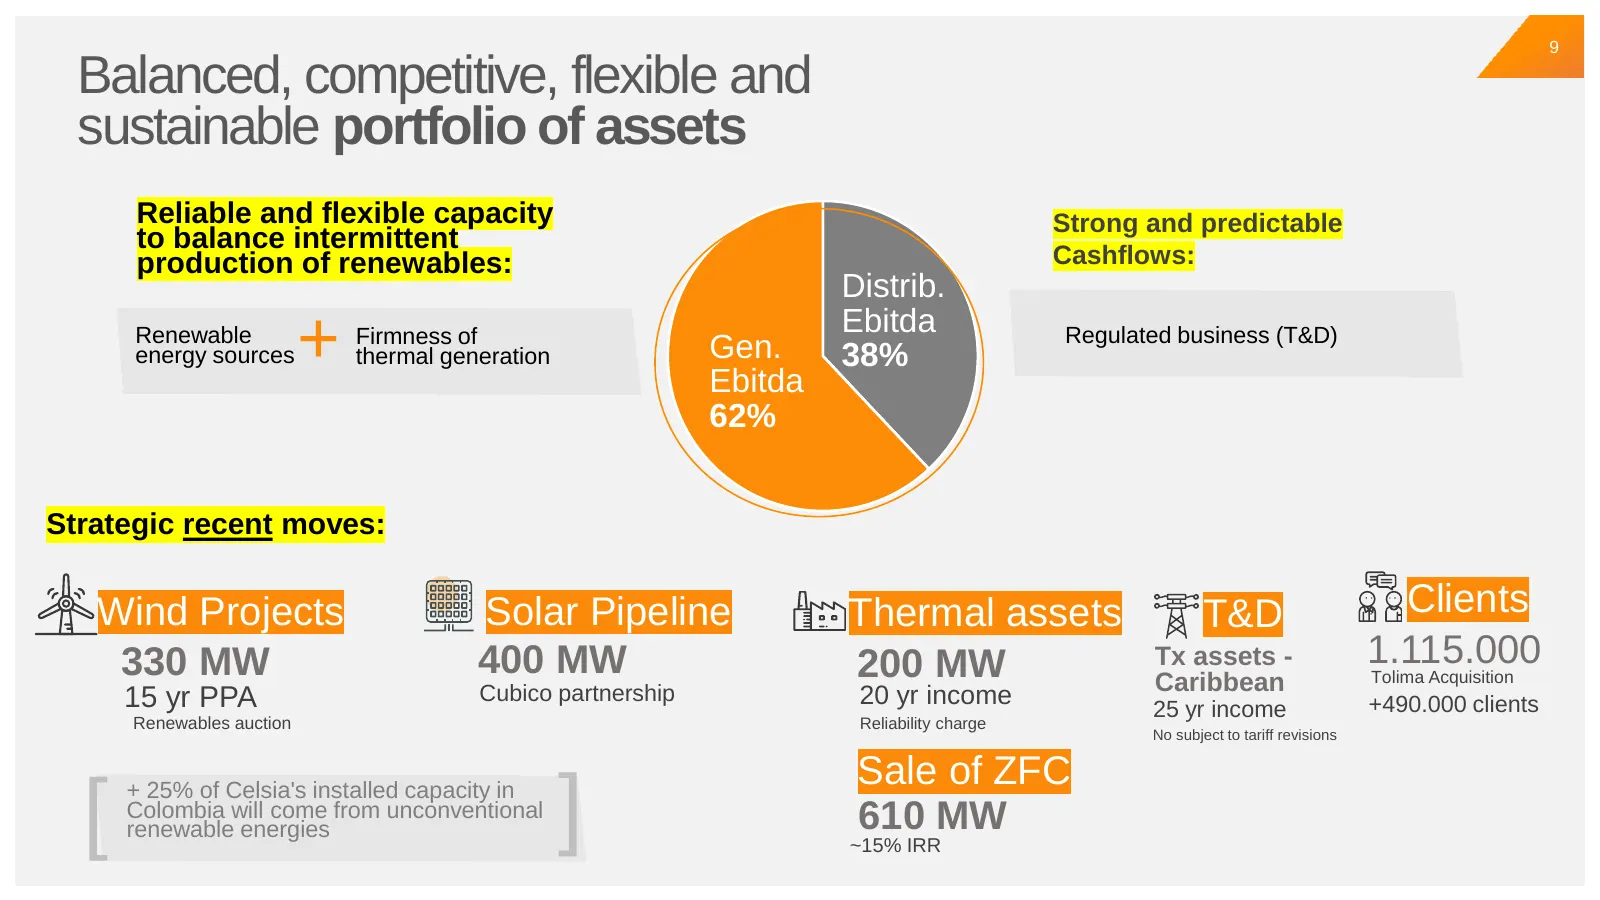
Slide 9: Balanced, competitive, flexible and sustainable portfolio of assets
9 Balanced, competitive, flexible and sustainable portfolio of assets Reliable and flexible capacity Strong and predictable to balance intermittent production of renewables: Cashflows: Distrib. Ebitda Renewable energy sources + Firmness of thermal generation Gen. Ebitda 38% Regulated business (T&D)
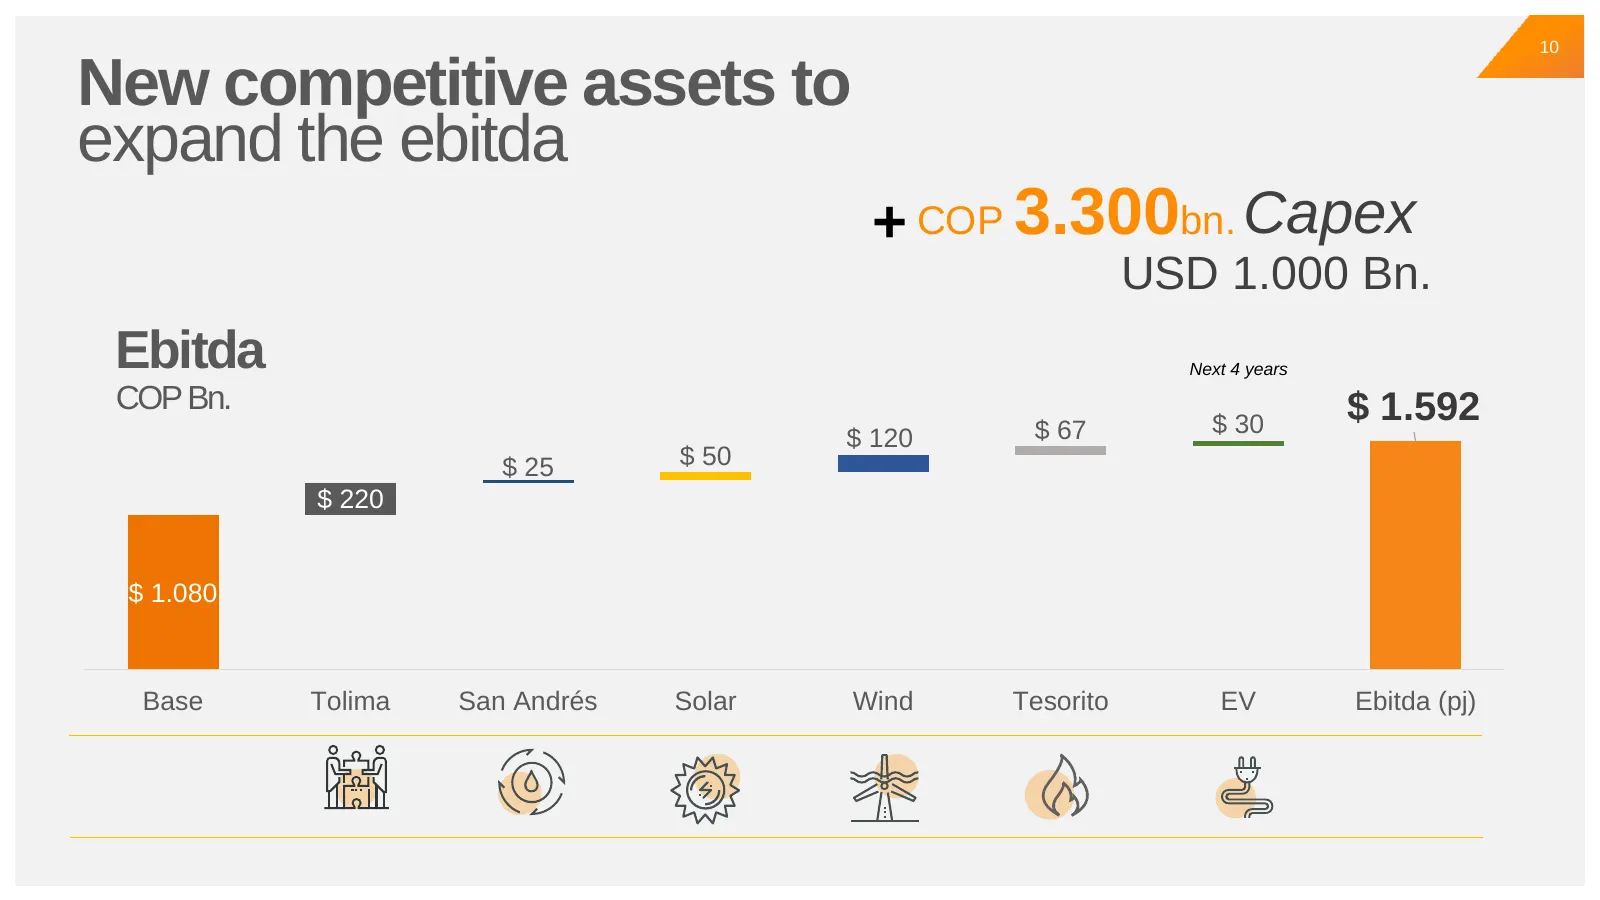
Slide 10: New competitive assets to expand the ebitda
10 New competitive assets to expand the ebitda + COP 3.300bn. Capex USD 1.000 Bn. Ebitda Next 4 years COP Bn. $ 1.592 $ 67 $ 30 $ 120 $ 25 $ 50 $ 220 $ 1.080 Base Tolima San Andrés Solar Wind Tesorito EV Ebitda (pj)
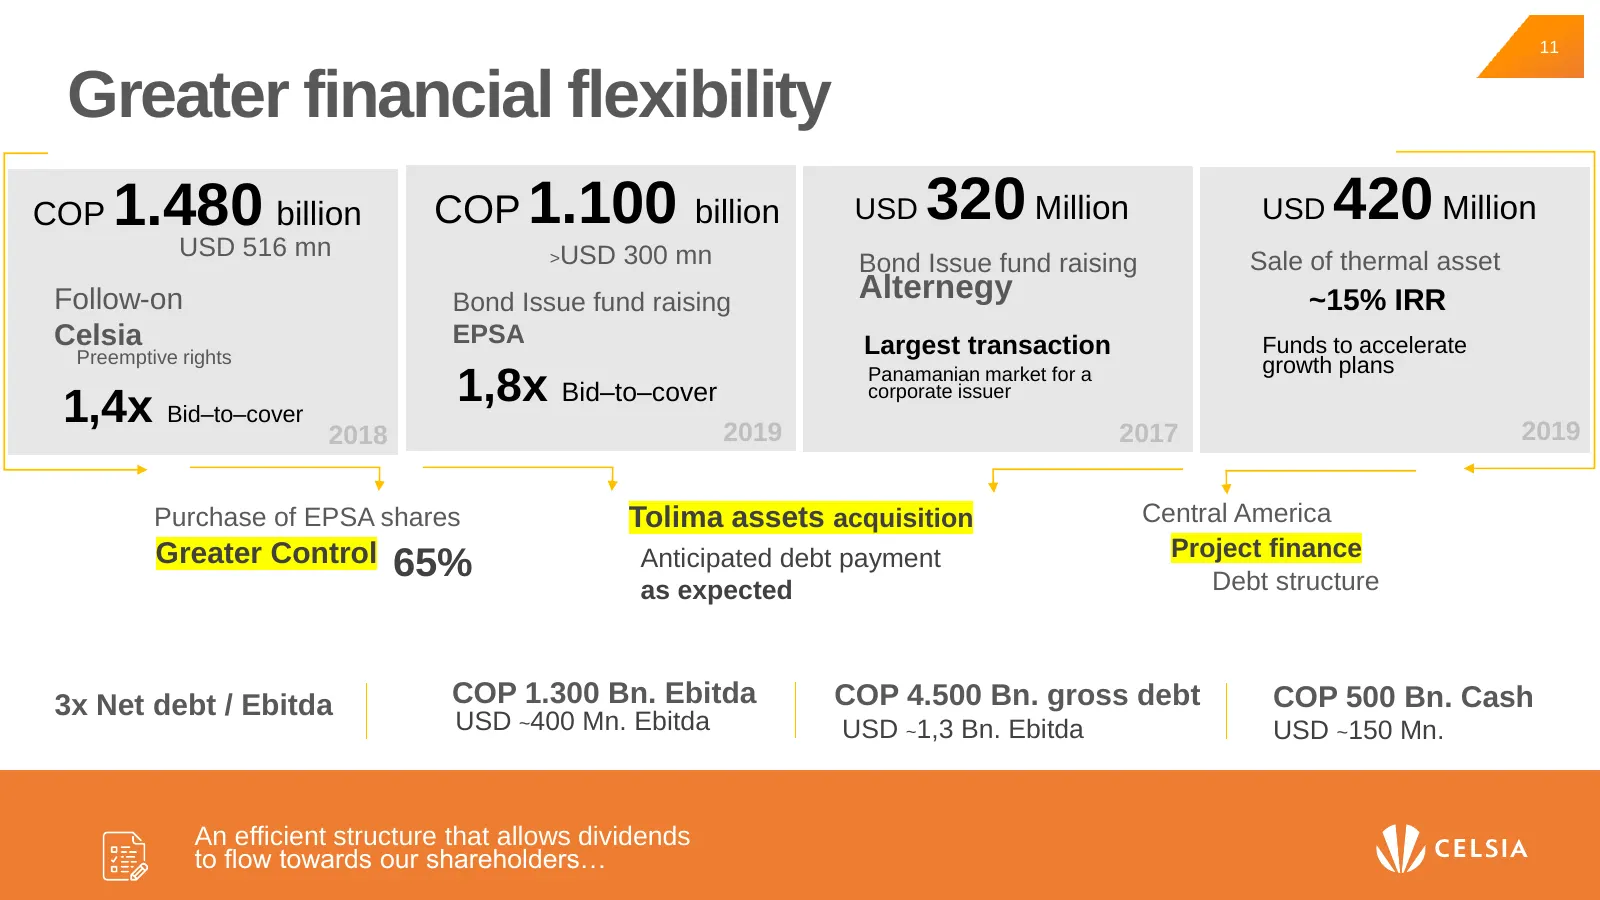
Slide 11: Greater financial flexibility
11 Greater financial flexibility COP 1.480 billion COP 1.100 billion USD 320 Million USD 420 Million USD 516 mn >USD 300 mn Bond Issue fund raising Sale of thermal asset Follow-on Bond Issue fund raising Alternegy ~15% IRR Celsia EPSA Largest transaction Funds to accelerate Preemptive rights growth
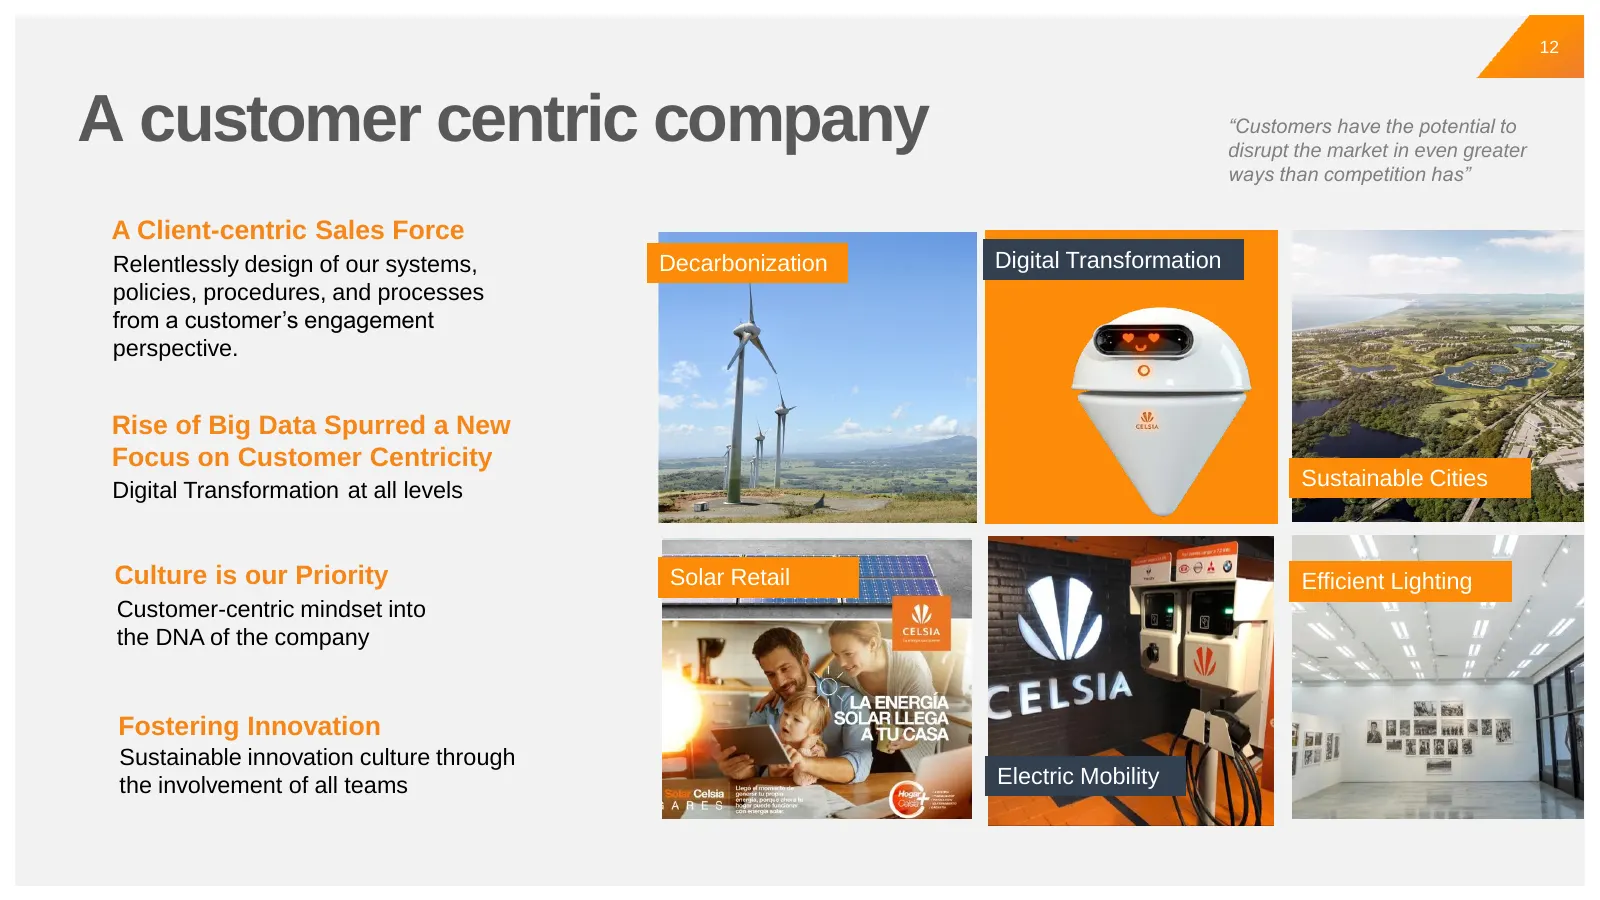
Slide 12: A customer centric company
12 A customer centric company “Customers have the potential to disrupt the market in even greater ways than competition has” A Client-centric Sales Force Relentlessly design of our systems, Decarbonization Digital Transformation policies, procedures, and processes from a customer’s engagement perspe
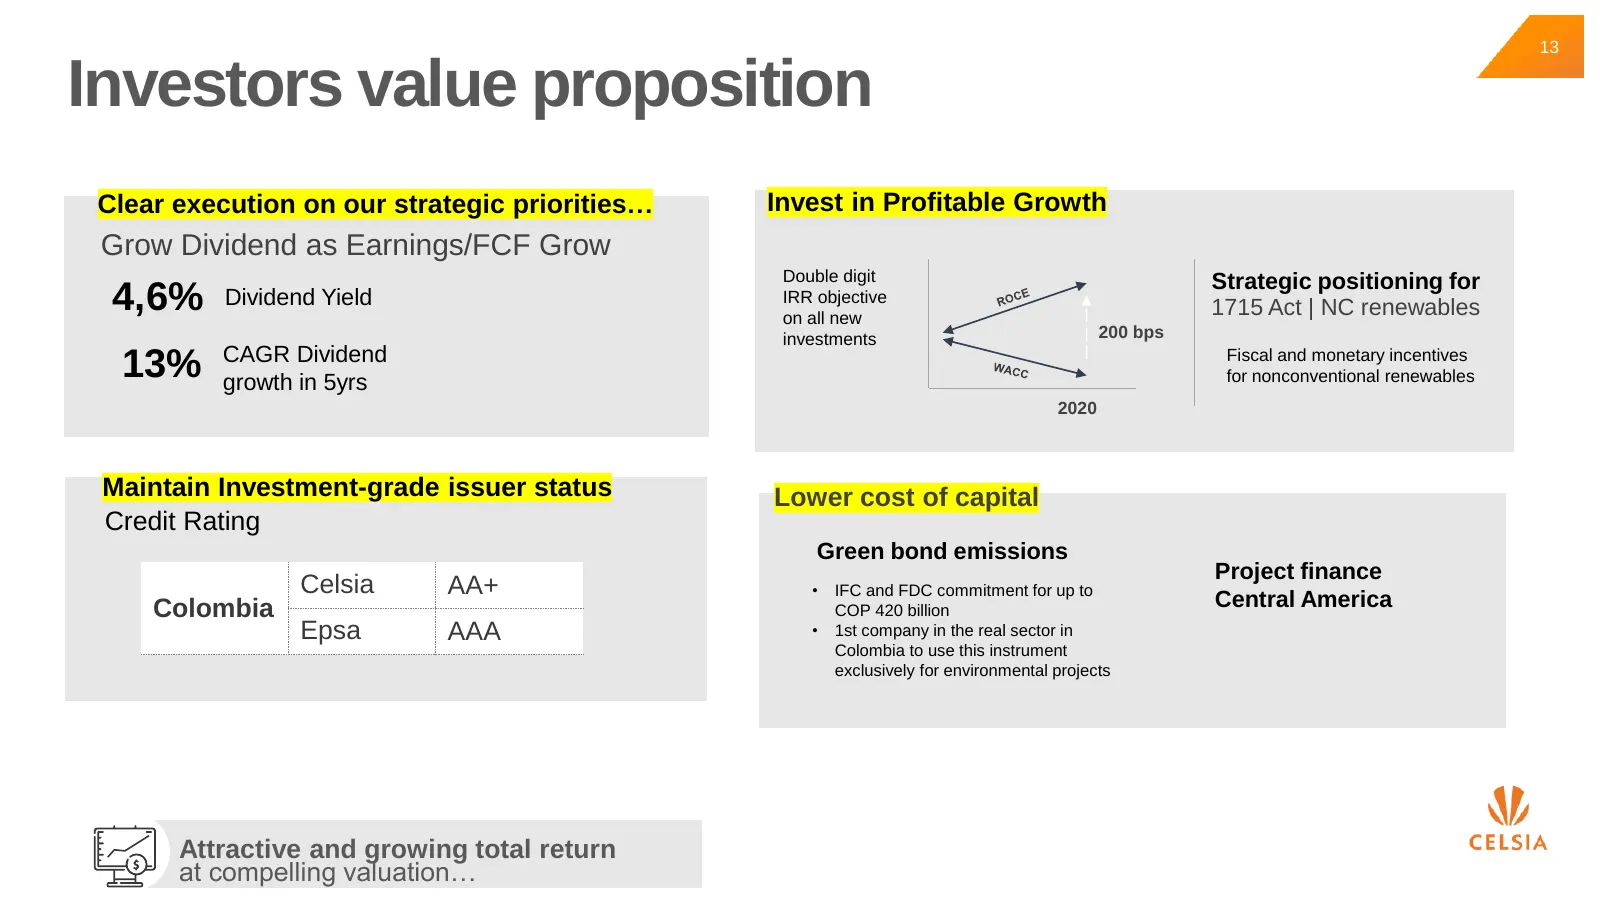
Slide 13: Investors value proposition
13 Investors value proposition Clear execution on our strategic priorities… Invest in Profitable Growth Grow Dividend as Earnings/FCF Grow Double digit Strategic positioning for 4,6% Dividend Yield IRR objective on all new 1715 Act | NC renewables investments 200 bps 13% CAGR Dividend growth in 5yrs
Slide 14: Communities and Environment
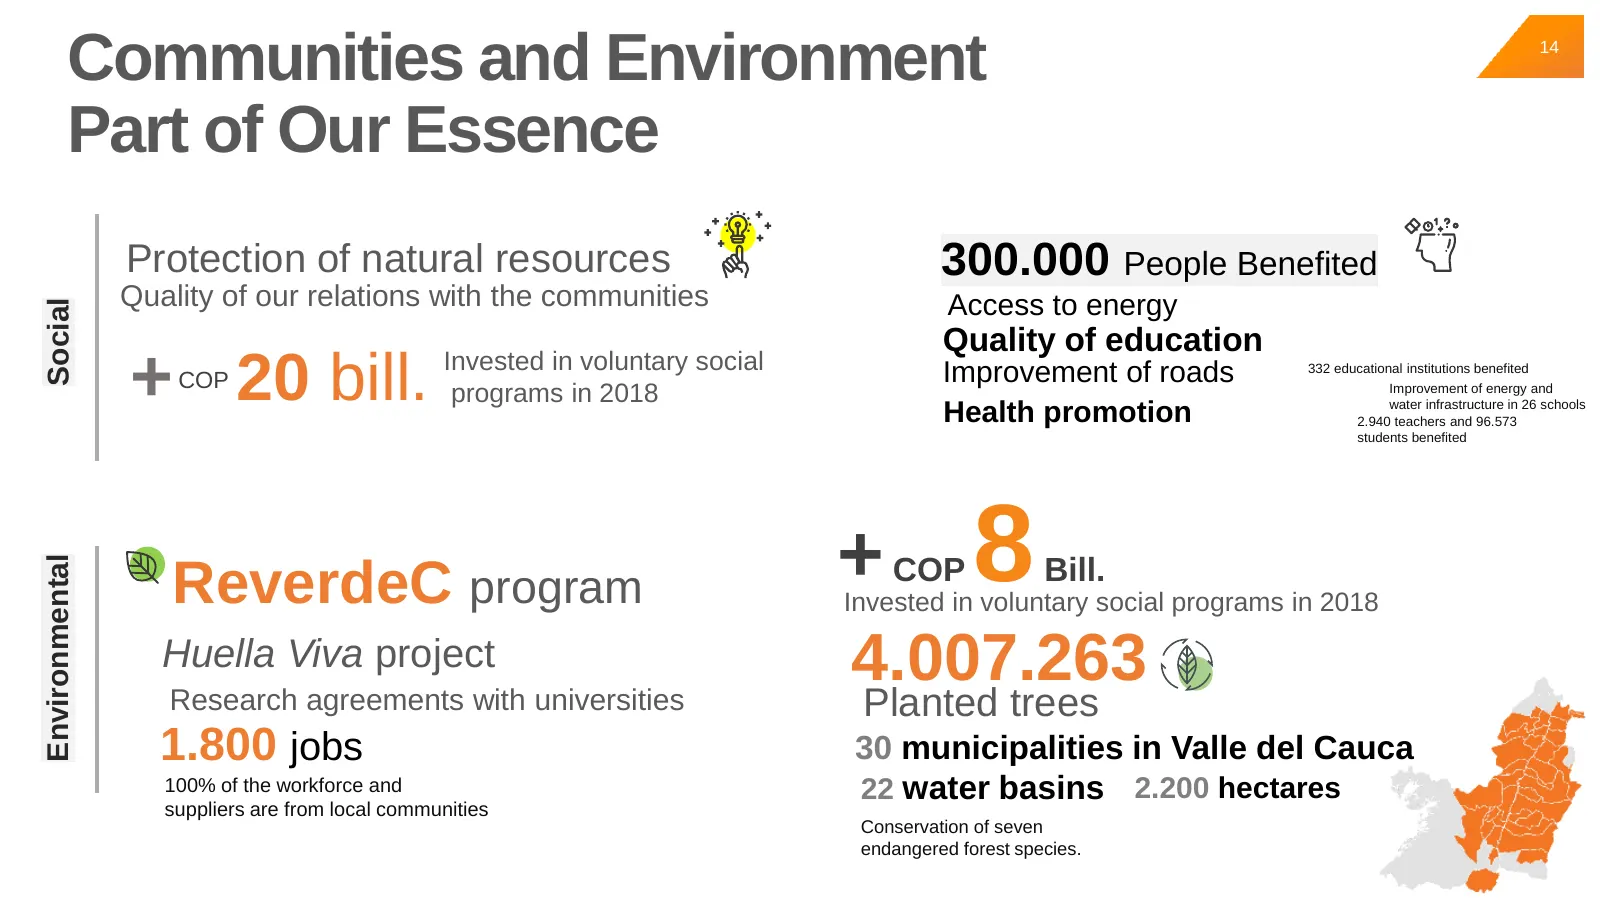
Communities and Environment 14 Part of Our Essence Protection of natural resources 300.000 People Benefited Quality of our relations with the communities Access to energy Social Quality of education + 20 bill. COP Invested in voluntary social programs in 2018 Improvement of roads Health promotion 33
Slide 15: Key Financials
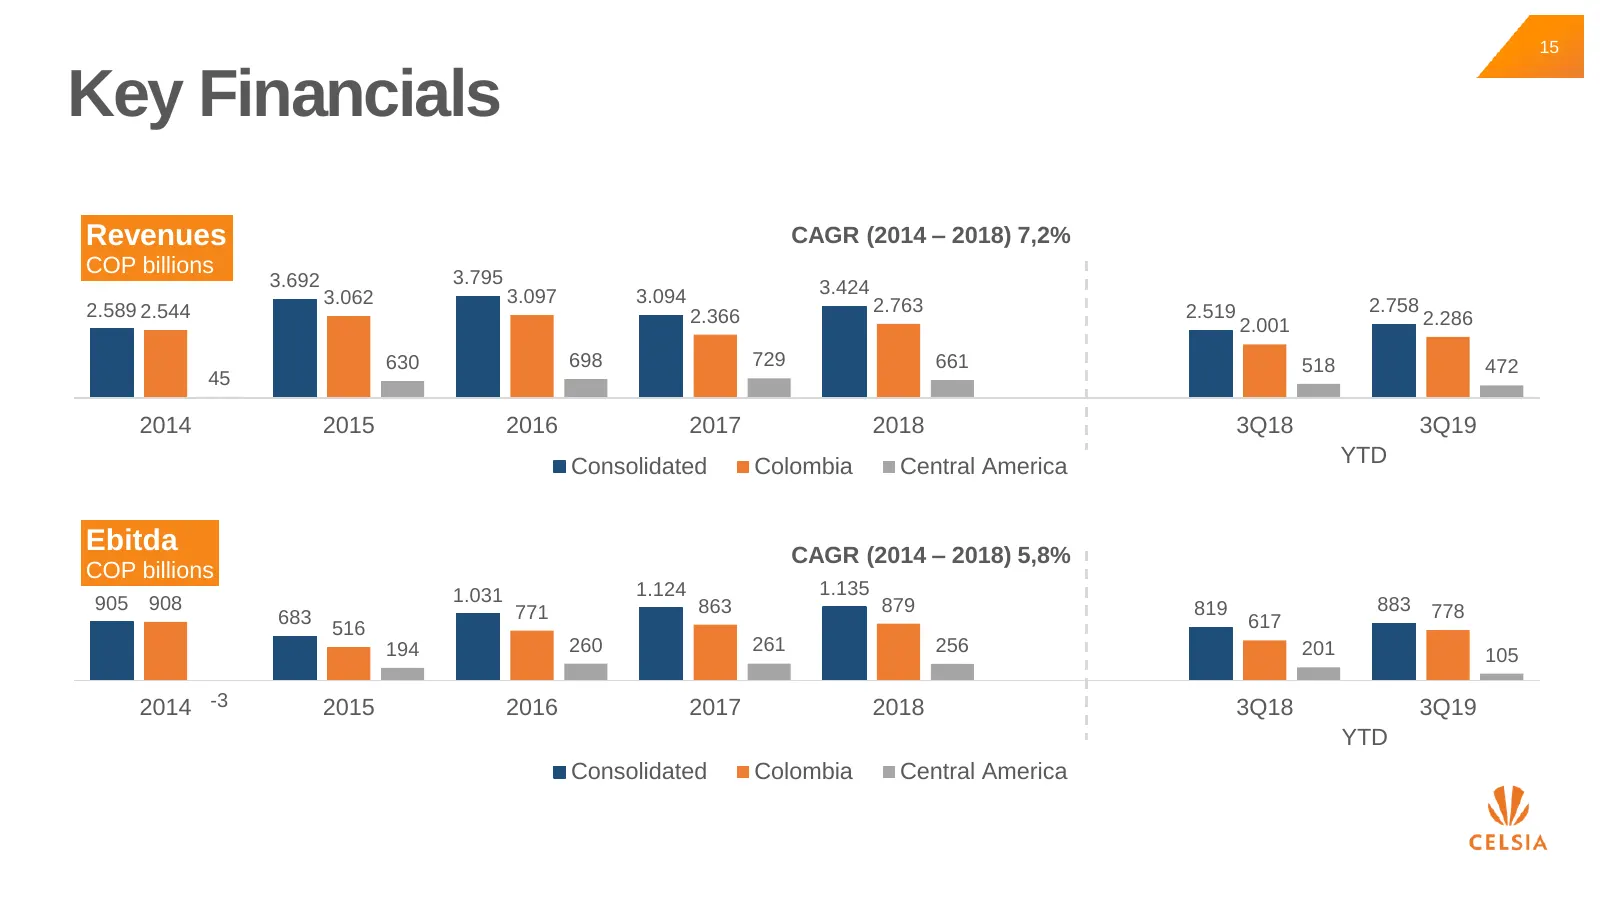
15 Key Financials Revenues CAGR (2014 – 2018) 7,2% COP billions 3.795 3.692 3.424 3.062 3.097 3.094 2.763 2.758 2.589 2.544 2.366 2.519 2.286 2.001 630 698 729 661 518 472 45 2014 2015 2016 2017 2018 3Q18 3Q19 Consolidated Colombia Central America YTD Ebitda CAGR (2014 – 2018) 5,8% COP billions 1.03
Slide 16: Key Financials
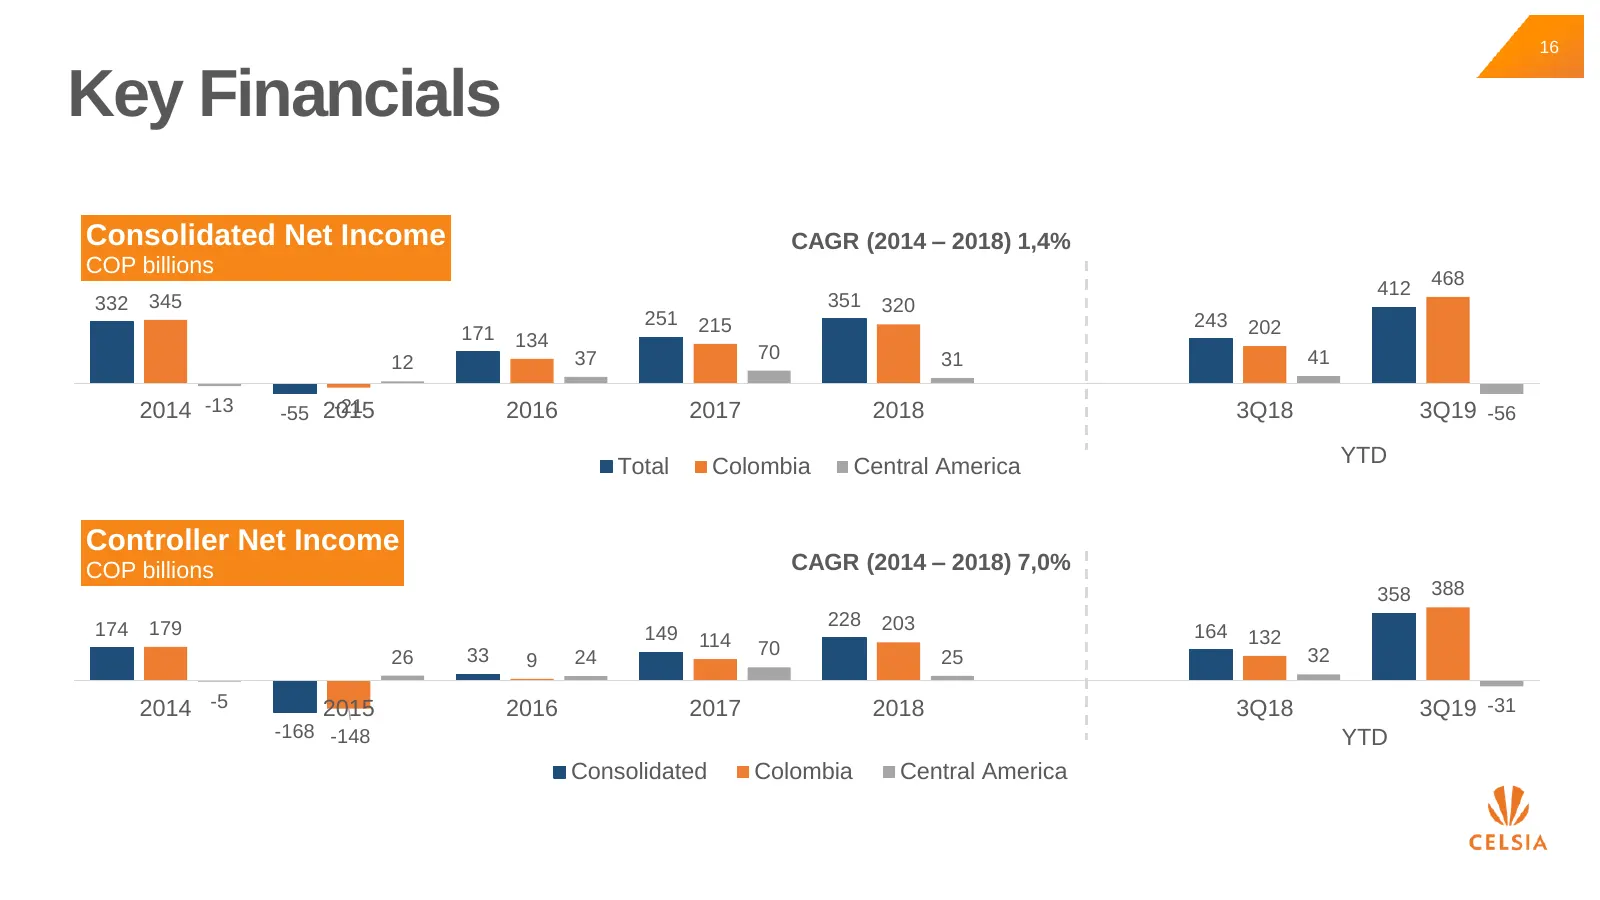
16 Key Financials Consolidated Net Income CAGR (2014 – 2018) 1,4% COP billions 468 412 332 345 351 320 251 215 243 202 171 134 37 70 31 41 12 2014 -13 -21 -55 2015 2016 2017 2018 3Q18 3Q19 -56 Total Colombia Central America YTD Controller Net Income COP billions CAGR (2014 – 2018) 7,0% 358 388 179 2
Slide 17: Key Financials
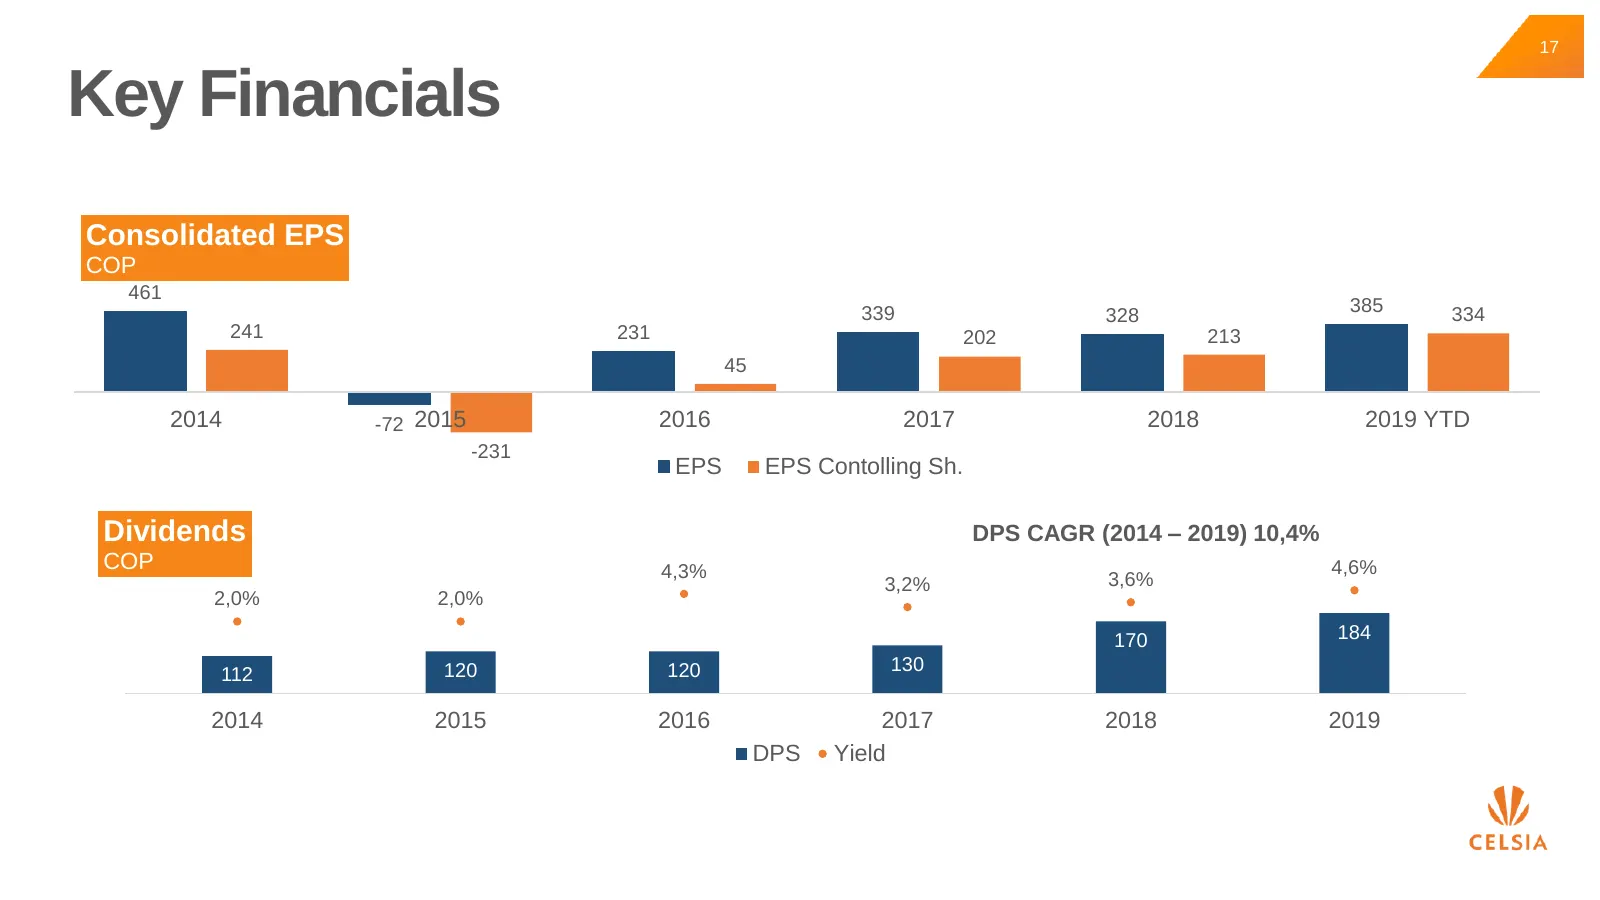
17 Key Financials Consolidated EPS COP 461 339 385 334 328 241 231 202 213 45 2014 -72 2015 2016 2017 2018 2019 YTD -231 EPS EPS Contolling Sh. Dividends DPS CAGR (2014 – 2019) 10,4% 250COP 4,3% 3,2% 3,6% 4,6% 6,0% 2,0% 2,0% 150 170 184 1,0% 120 120 130 112 50 -4,0% 2014 2015 2016 2017 2018 2019 DPS
Slide 18: Key Financials
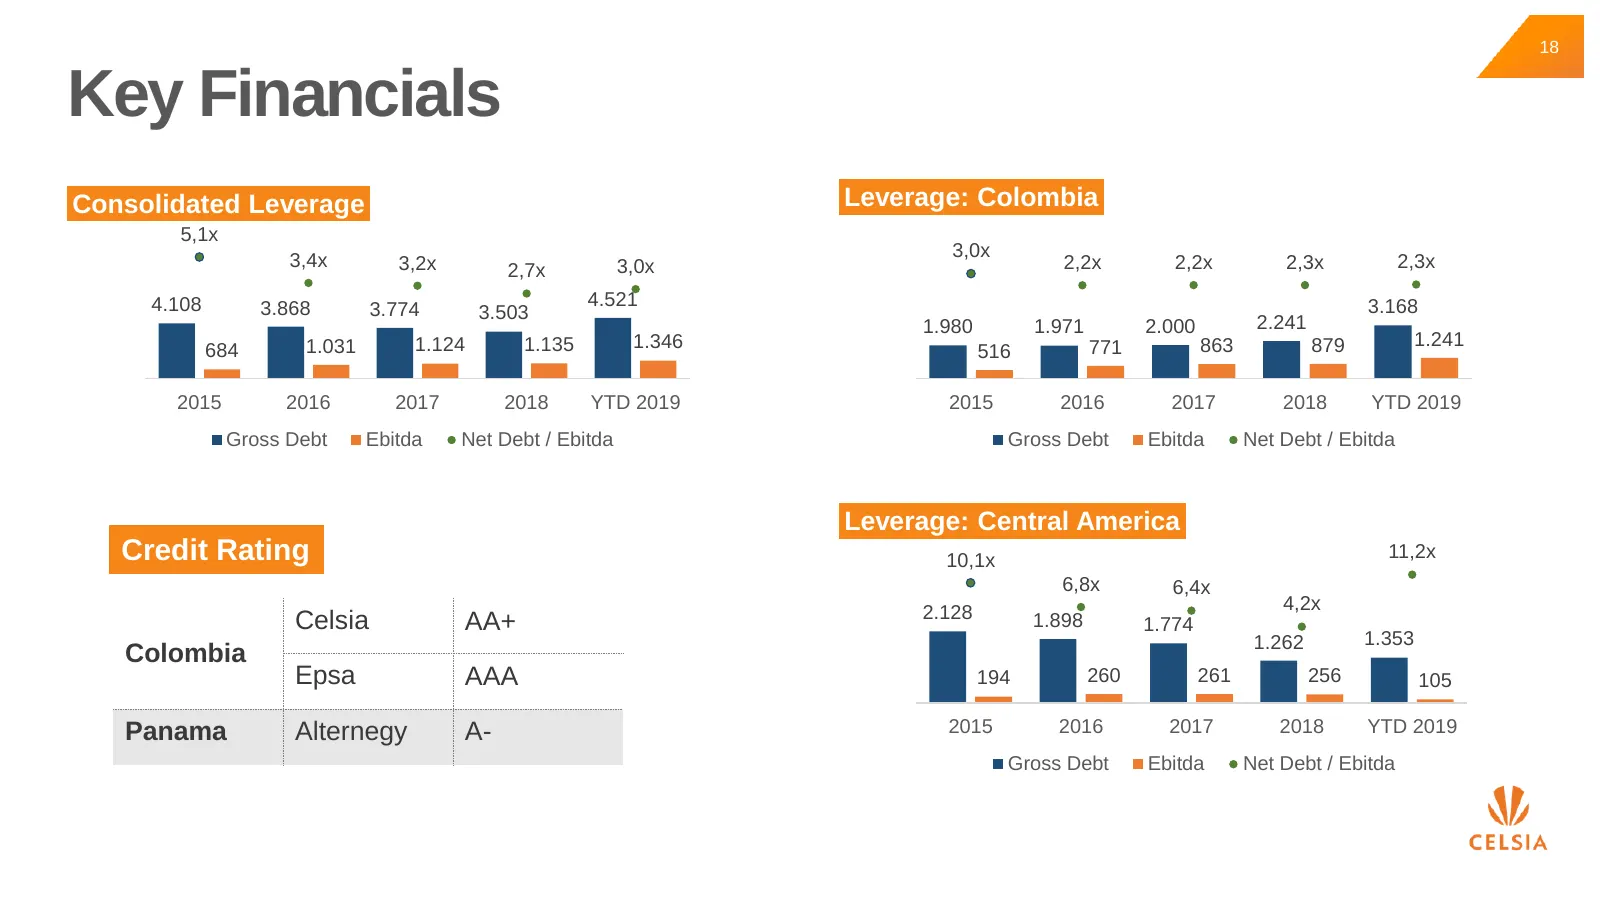
18 Key Financials Consolidated Leverage Leverage: Colombia 10.000 5,1x 8.000 3,4x 5,0x 3,0x 4,0x 8.000 3,2x 2,7x 3,0x 2,2x 2,2x 2,3x 2,3x 6.000 6.000 3,0x 2,0x 4.108 3.868 4.521 3.168 3.774 3.503 1,0x 4.000 0,0x 4.000 1.980 1.971 2.000 2.241 1.031 1.124 1.135 1.346 -1,0x 2.000 771 863 879 1.241 -2,0

Slide 19: Appendix
www.celsia.com 00000 Appendix, ¥
Slide 20: Colombian power industry overview
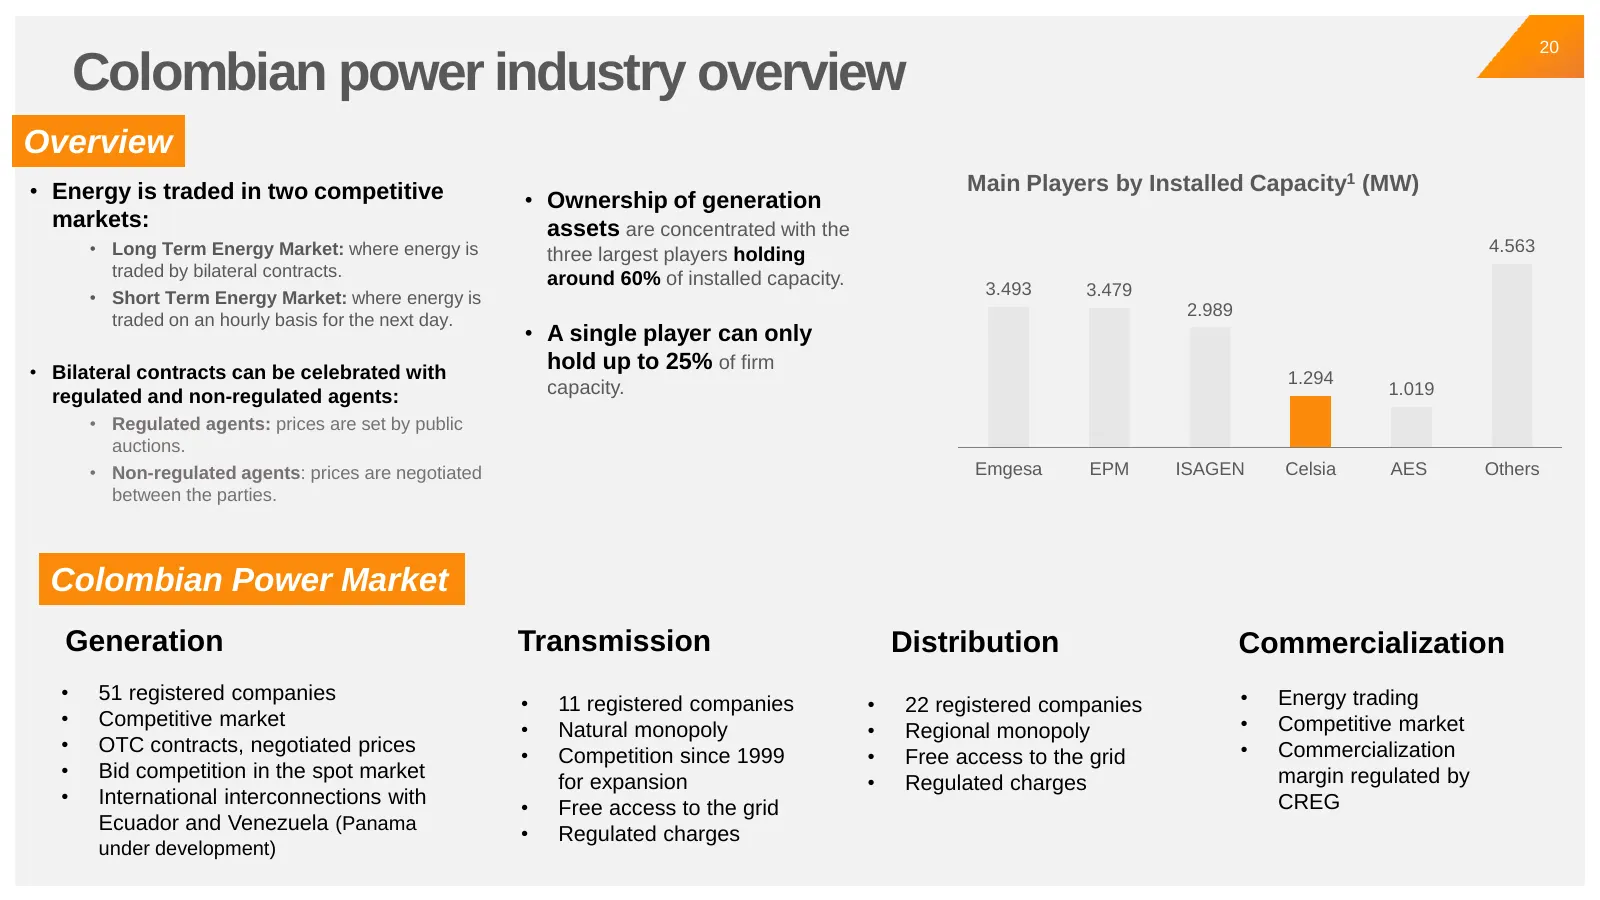
20 Colombian power industry overview Overview • Energy is traded in two competitive Main Players by Installed Capacity1 (MW) • Ownership of generation markets: assets are concentrated with the • Long Term Energy Market: where energy is three largest players holding 4.563 traded by bilateral contract
Slide 21: Strong regulatory framework
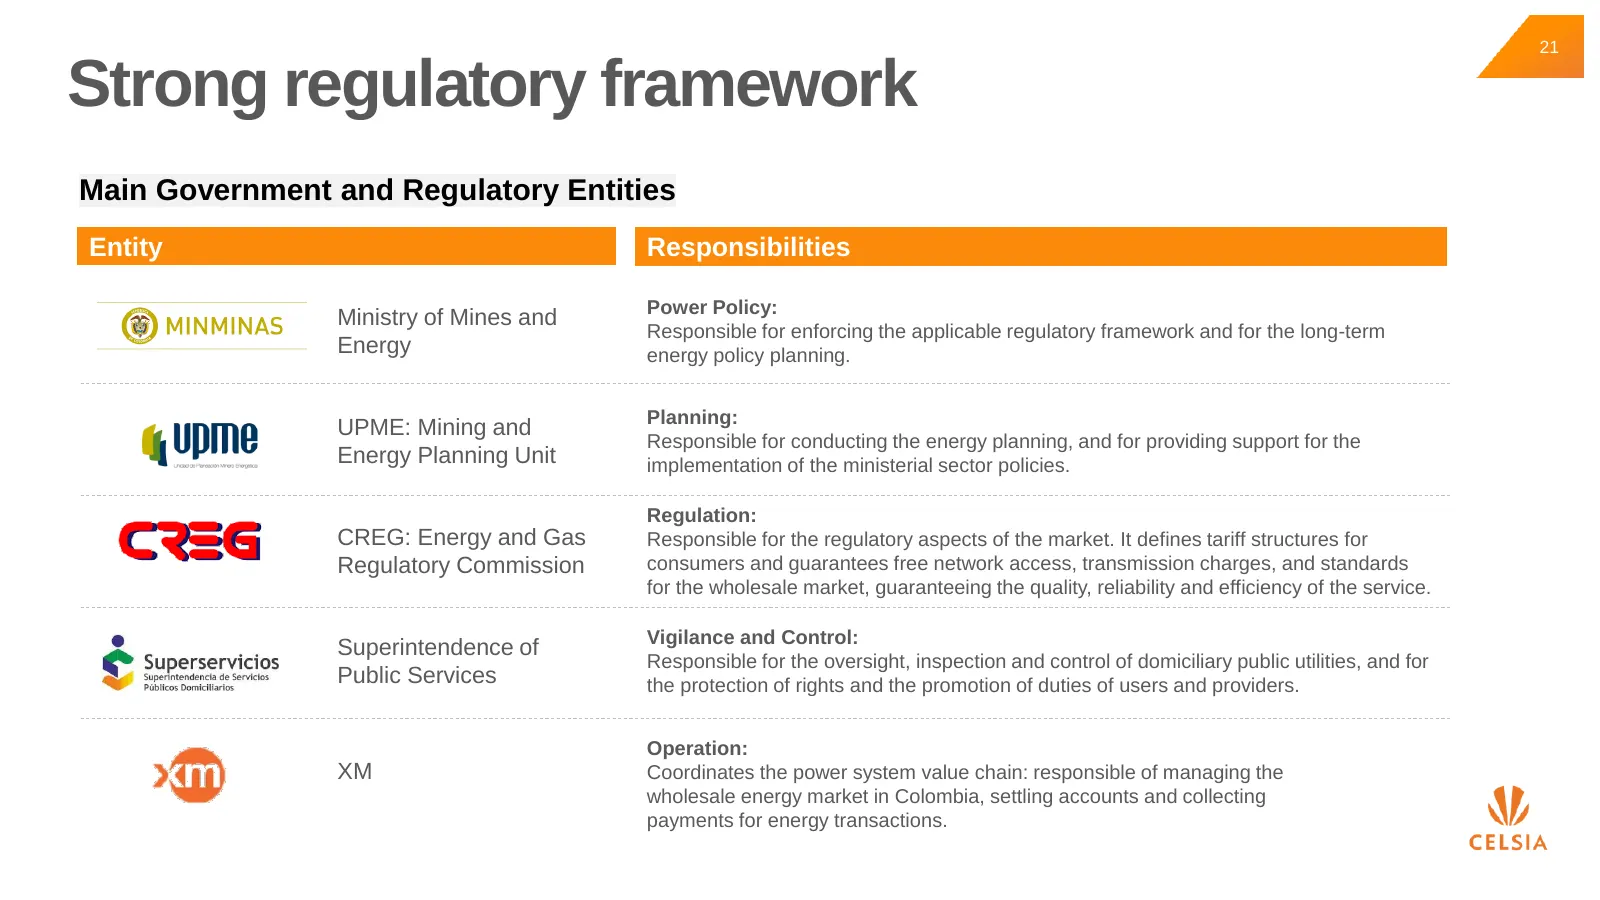
21 Strong regulatory framework Main Government and Regulatory Entities Entity Responsibilities Power Policy: Ministry of Mines and Responsible for enforcing the applicable regulatory framework and for the long-term Energy energy policy planning. Planning: UPME: Mining and Responsible for conducting
Slide 22: Growing power industry
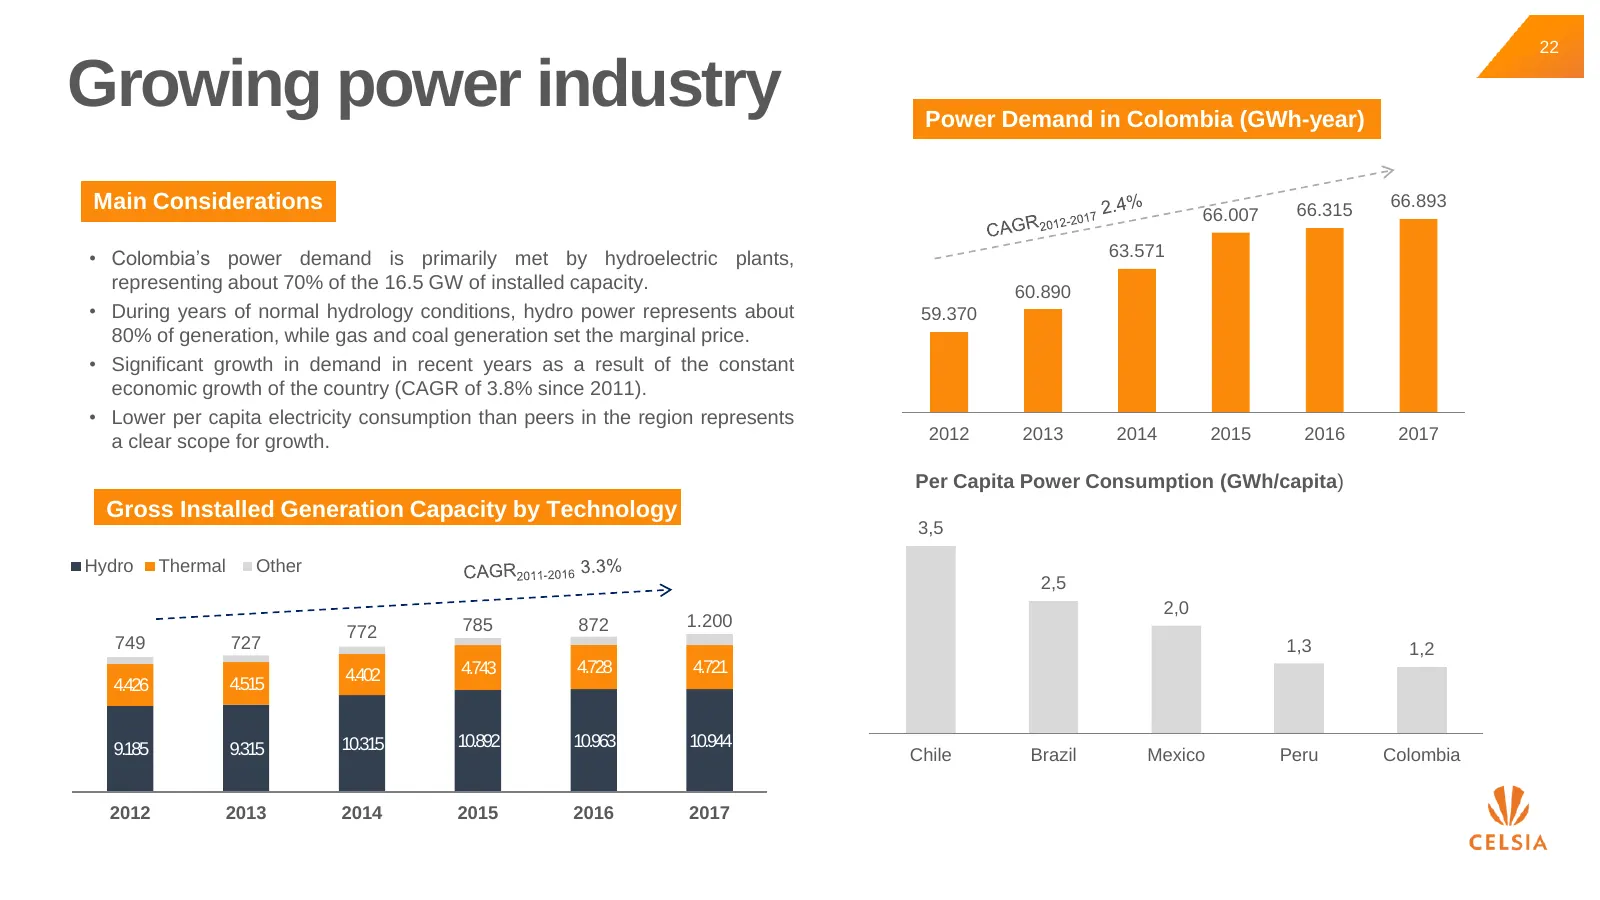
22 Growing power industry Power Demand in Colombia (GWh-year) Main Considerations 66.007 66.315 66.893 • Colombia’s power demand is primarily met by hydroelectric plants, 63.571 representing about 70% of the 16.5 GW of installed capacity. 60.890 • During years of normal hydrology conditions, hydro p
Slide 23: Power transmission
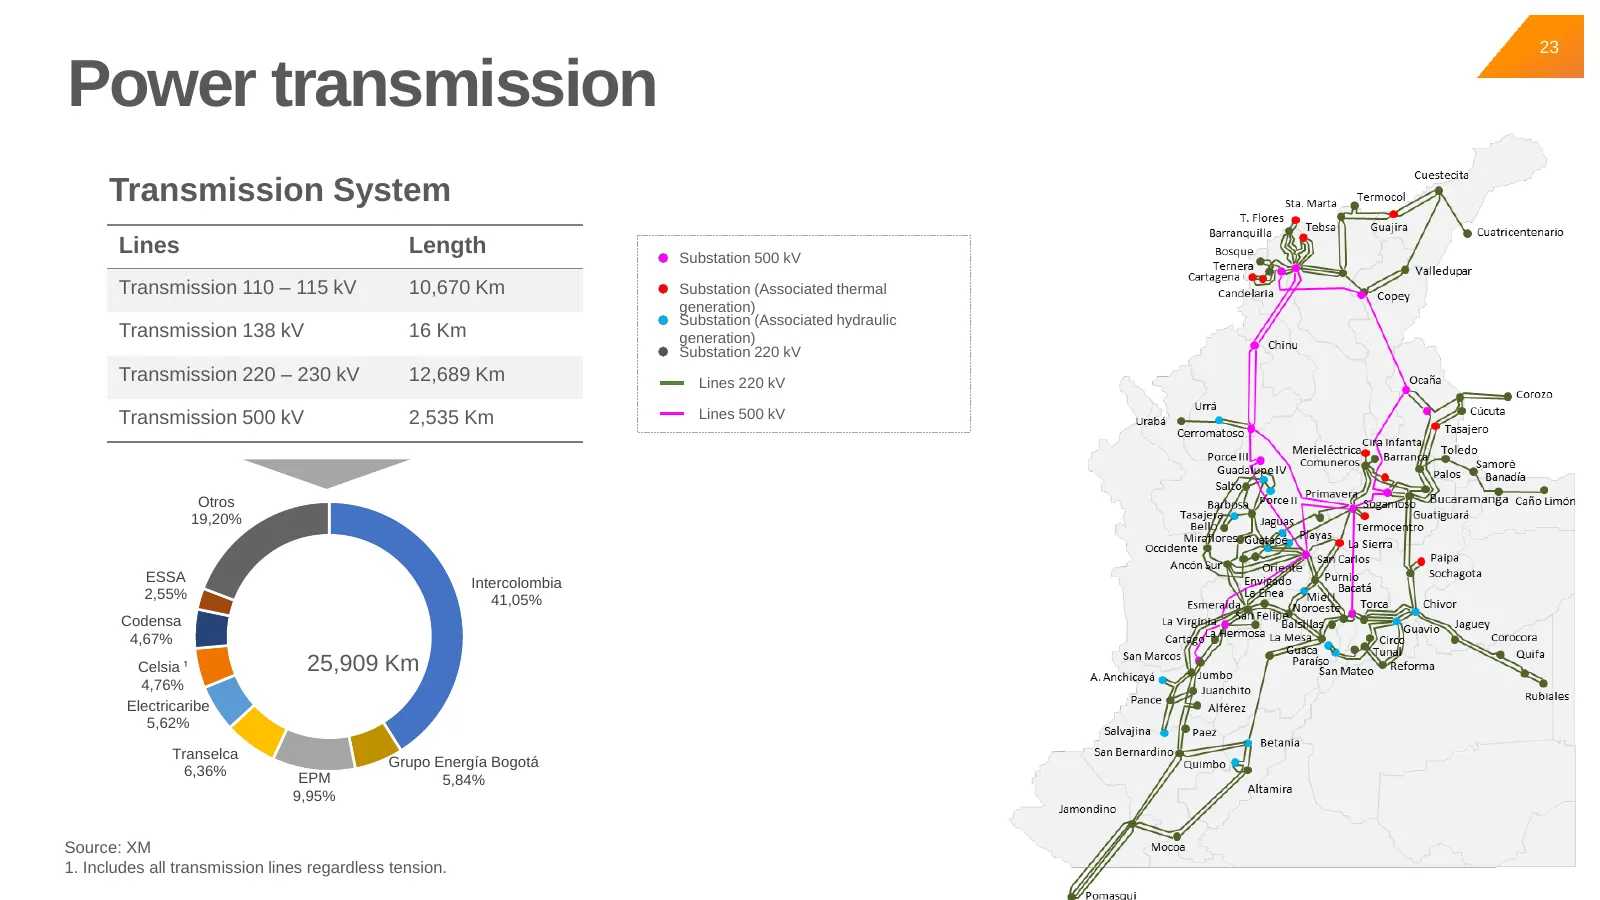
23 Power transmission Transmission System Lines Length Substation 500 kV Transmission 110 – 115 kV 10,670 Km Substation (Associated thermal generation) Substation (Associated hydraulic Transmission 138 kV 16 Km generation) Substation 220 kV Transmission 220 – 230 kV 12,689 Km Lines 220 kV Transmissi
Slide 24: Power distribution
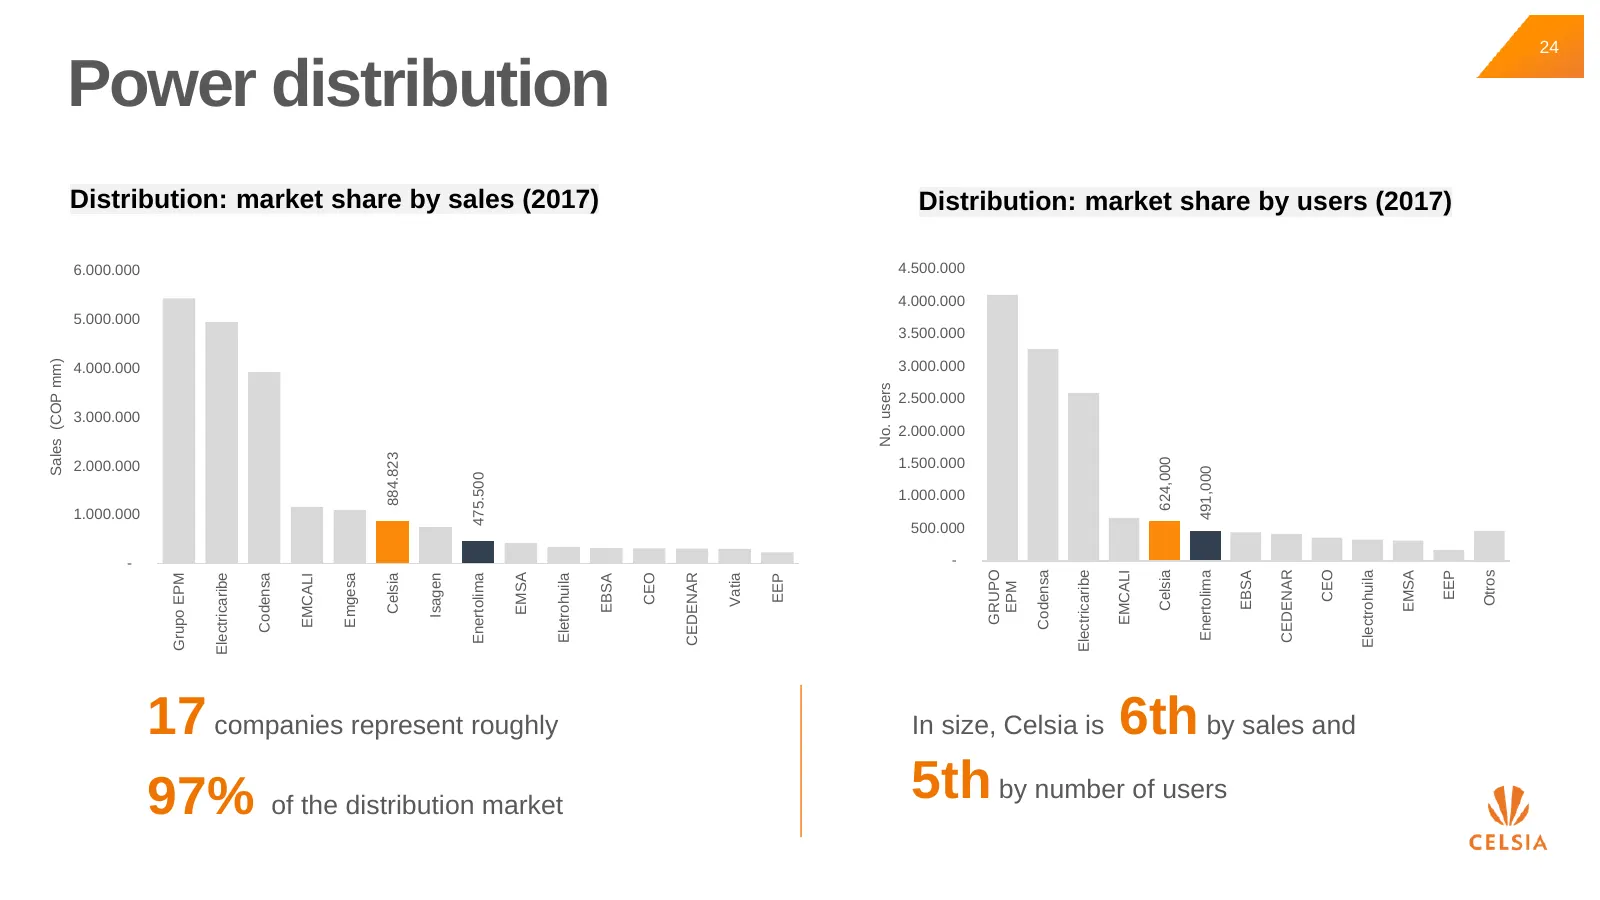
24 Power distribution Distribution: market share by sales (2017) Distribution: market share by users (2017) 6.000.000 4.500.000 4.000.000 5.000.000 3.500.000 Sales (COP mm) 4.000.000 3.000.000 No. users 2.500.000 3.000.000 2.000.000 884.823 624,000 2.000.000 1.500.000 491,000 475.500 1.000.000 1.000
Slide 25: Regulatory framework for distribution assets
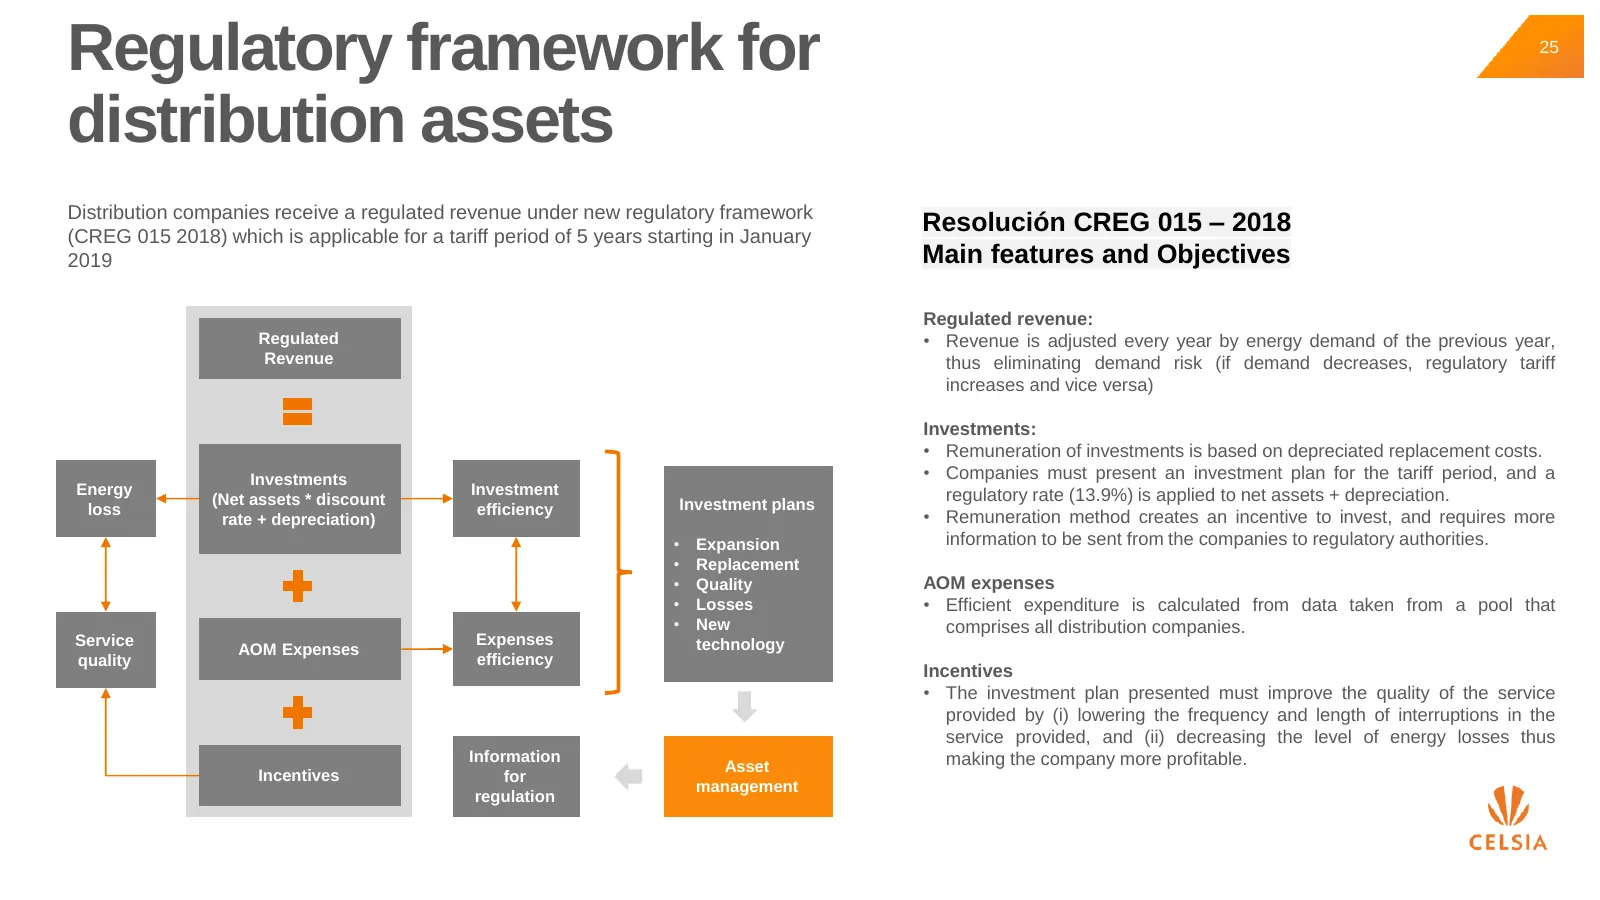
Regulatory framework for 25 distribution assets Distribution companies receive a regulated revenue under new regulatory framework (CREG 015 2018) which is applicable for a tariff period of 5 years starting in January Resolución CREG 015 – 2018 2019 Main features and Objectives Regulated revenue: Reg
Slide 26: Celsia
Wy CELSIA
Source: Internet Archive copy of celsia.com
More decks from Celsia SA ESP
 Q3 2026 Earnings Presentation15 slides · November 2026
 Celsia — Investor Presentation (June 2026)26 slides · June 2026
 Celsia — Investor Presentation (June 2026)26 slides · June 2026
 Q4 2025 Earnings Presentation28 slides · February 2026
 Q2 2026 Earnings Presentation16 slides · 2026
 Investor Day (October 2025)46 slides · October 2025