Schawk — Investor Presentation (November 2006)
31 slides from Schawk's investor presentation, Nov 7, 2006
Slide 1: Investor Presentation
EXHIBIT 99.1 Investor Presentation November 2006 ©2006 Schawk, Inc. All rights reserved.
Slide 2: Forward Looking Statement
Forward Looking Statement Certain statements in this presentation are forward-looking statements within the meaning of Section 21E of the Securities and Exchange Act of 1934, as amended and are subject to the safe harbor created thereby. These statements are made based upon current expectations and
Slide 3: Who We Are
Who We Are One of the world’s largest independent brand image solutions companies Founded in 1953 – public since 1995 (NYSE:SGK) $614 million in revenue for 2005 Global presence with over 3,800 employees in 12 countries across 4 continents 151 locations including 95 on-site at customer locations (we
Slide 4: Who We Are
Who We Are Schawk is a global business that makes brand messaging more efficient, more predictable and more profitable to our clients. We achieve this by providing a range of marketing execution services and solutions that include: – creative design – image development – implementation – process man
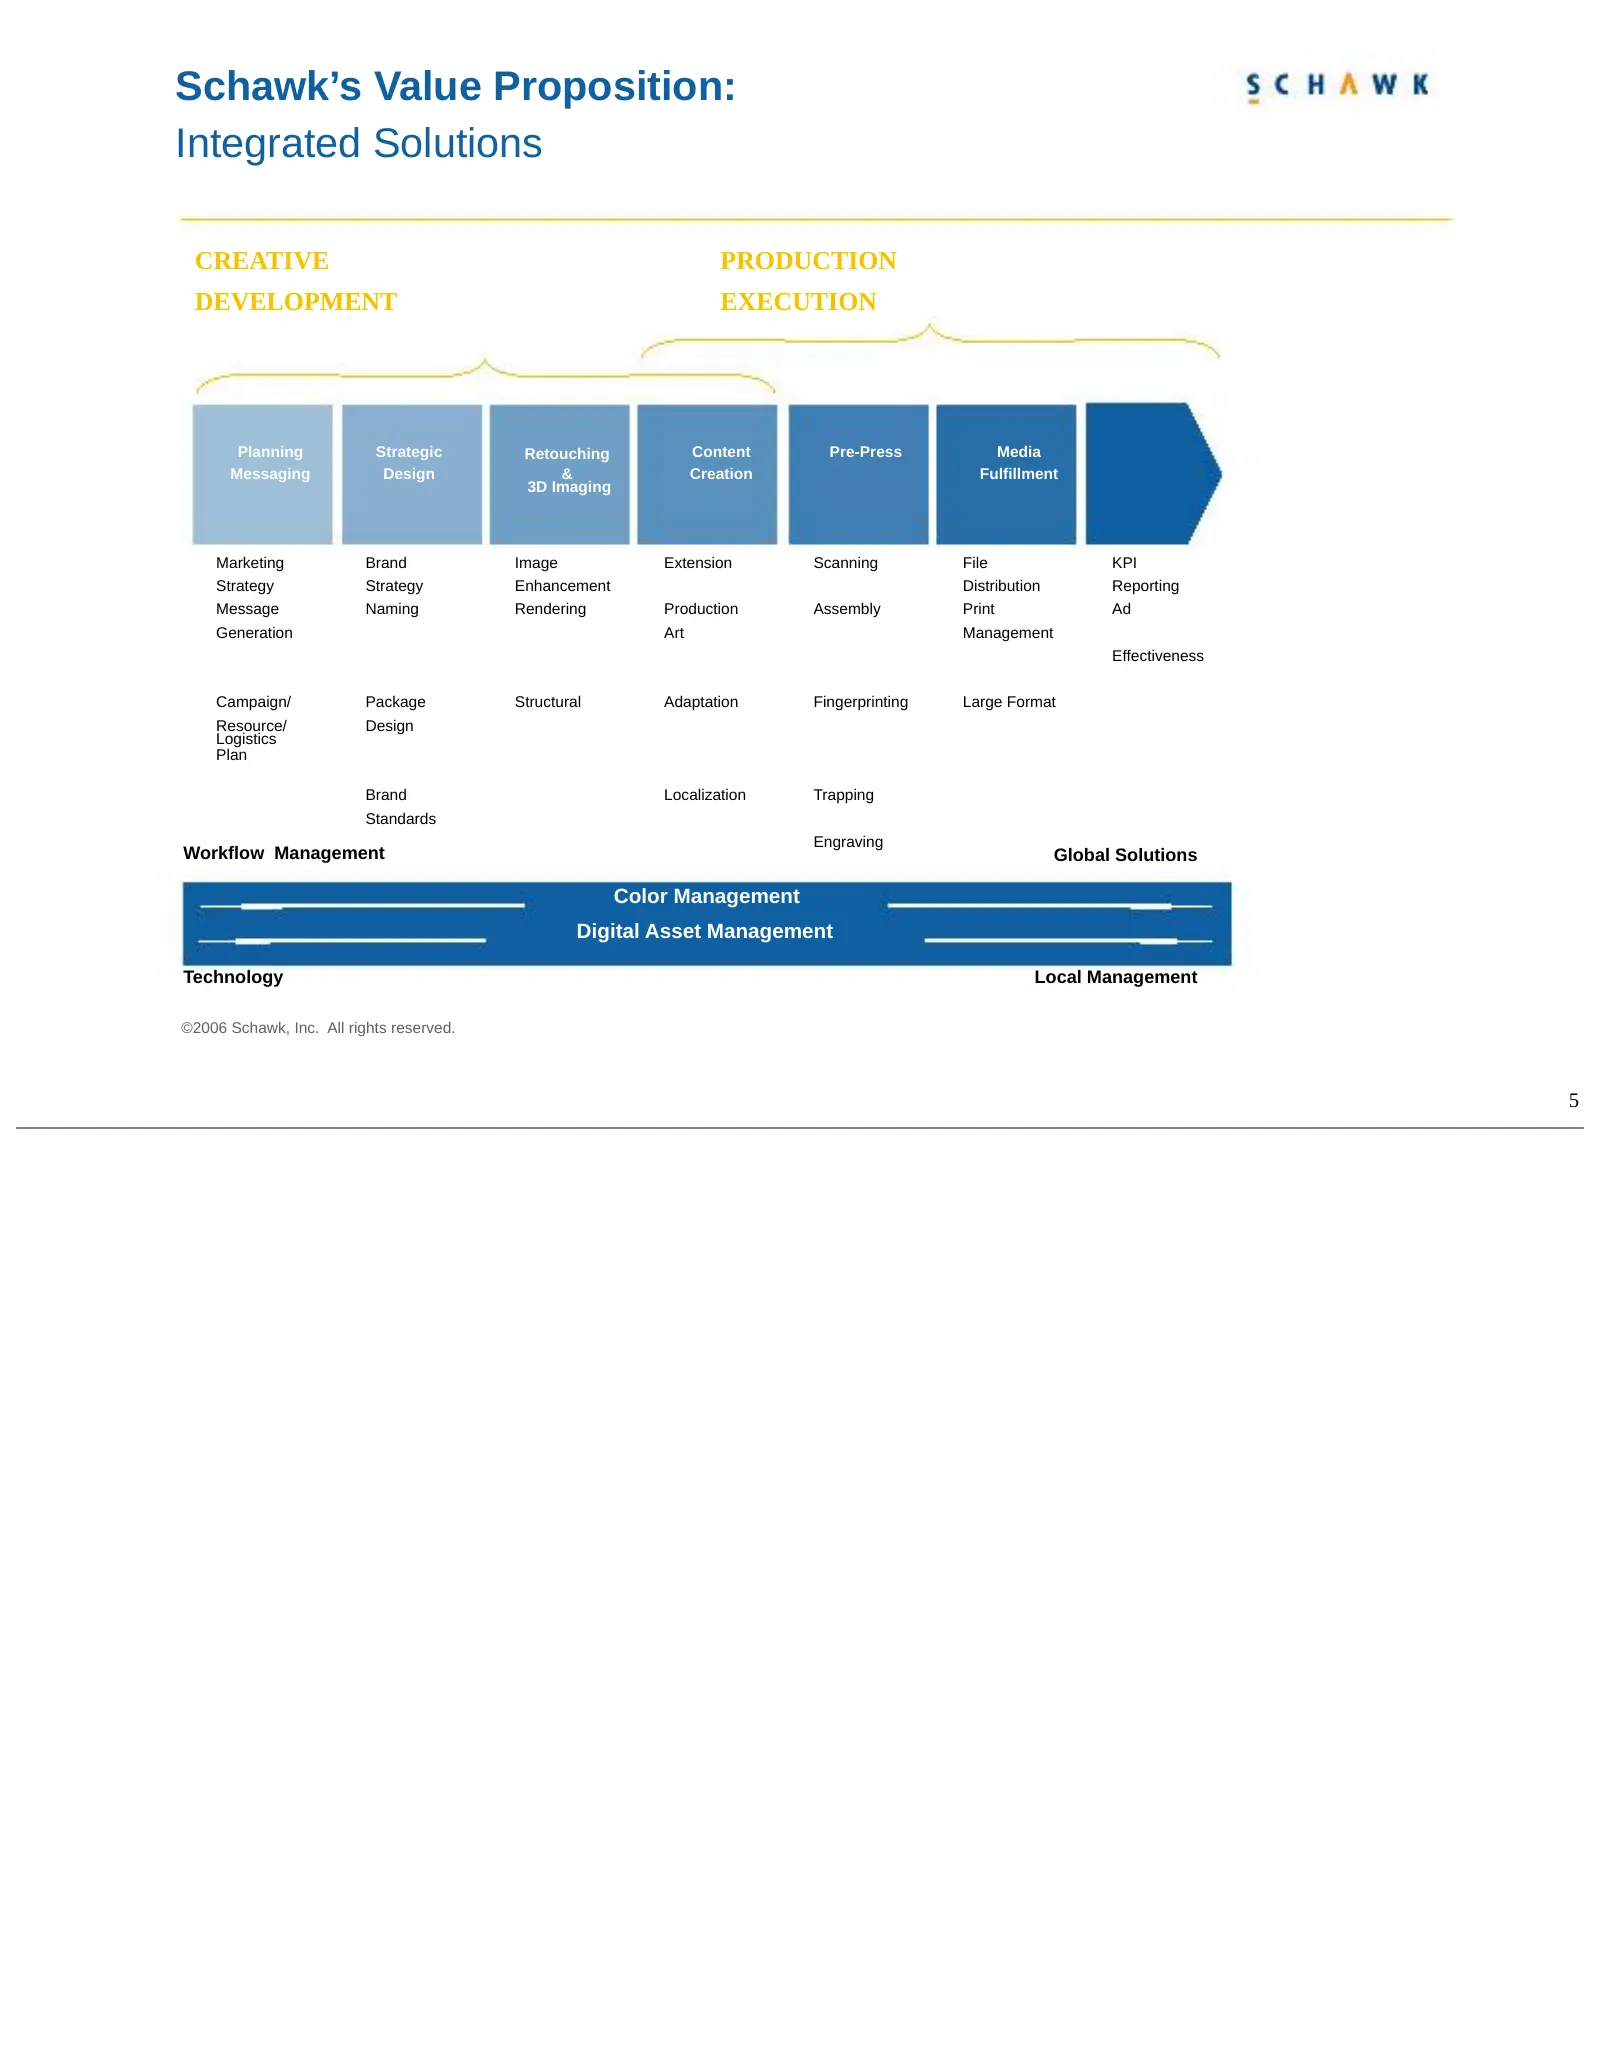
Slide 5: Schawk's Value Proposition: Integrated Solutions
Schawk’s Value Proposition: Integrated Solutions CREATIVE PRODUCTION DEVELOPMENT EXECUTION Planning Strategic Retouching Content Pre-Press Media Messaging Design & Creation Fulfillment 3D Imaging Marketing Brand Image Extension Scanning File KPI Strategy Strategy Enhancement Distribution Reporting M
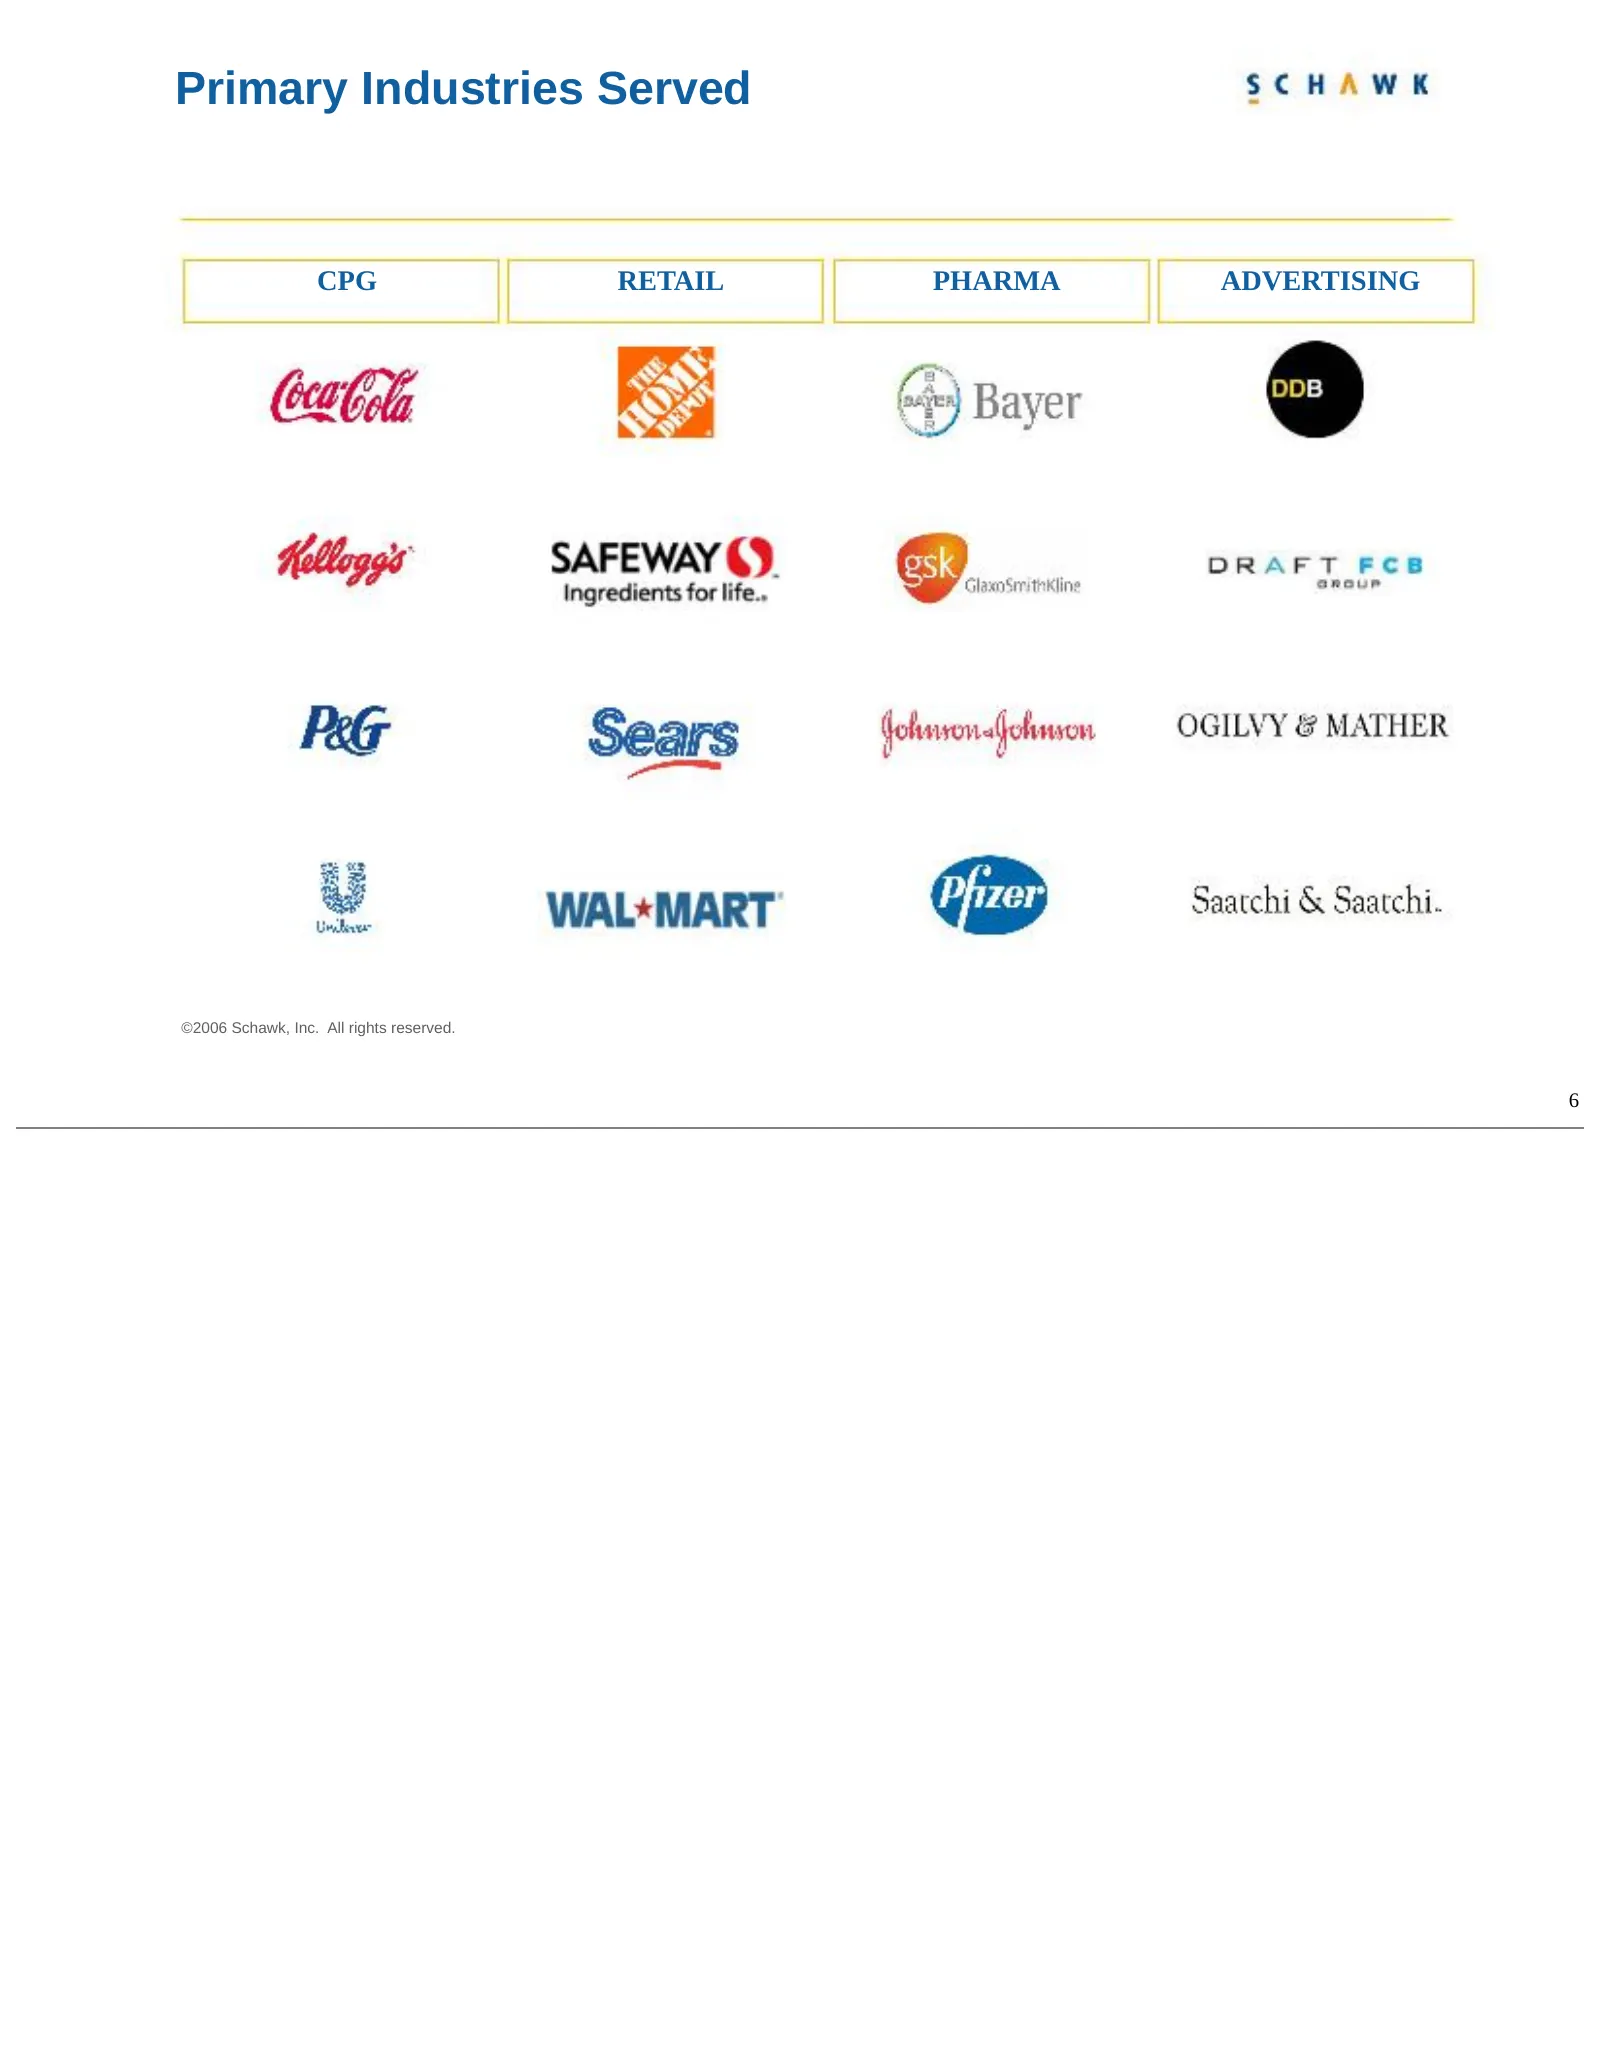
Slide 6: Primary Industries Served
Primary Industries Served CPG RETAIL PHARMA ADVERTISING ©2006 Schawk, Inc. All rights reserved. 6
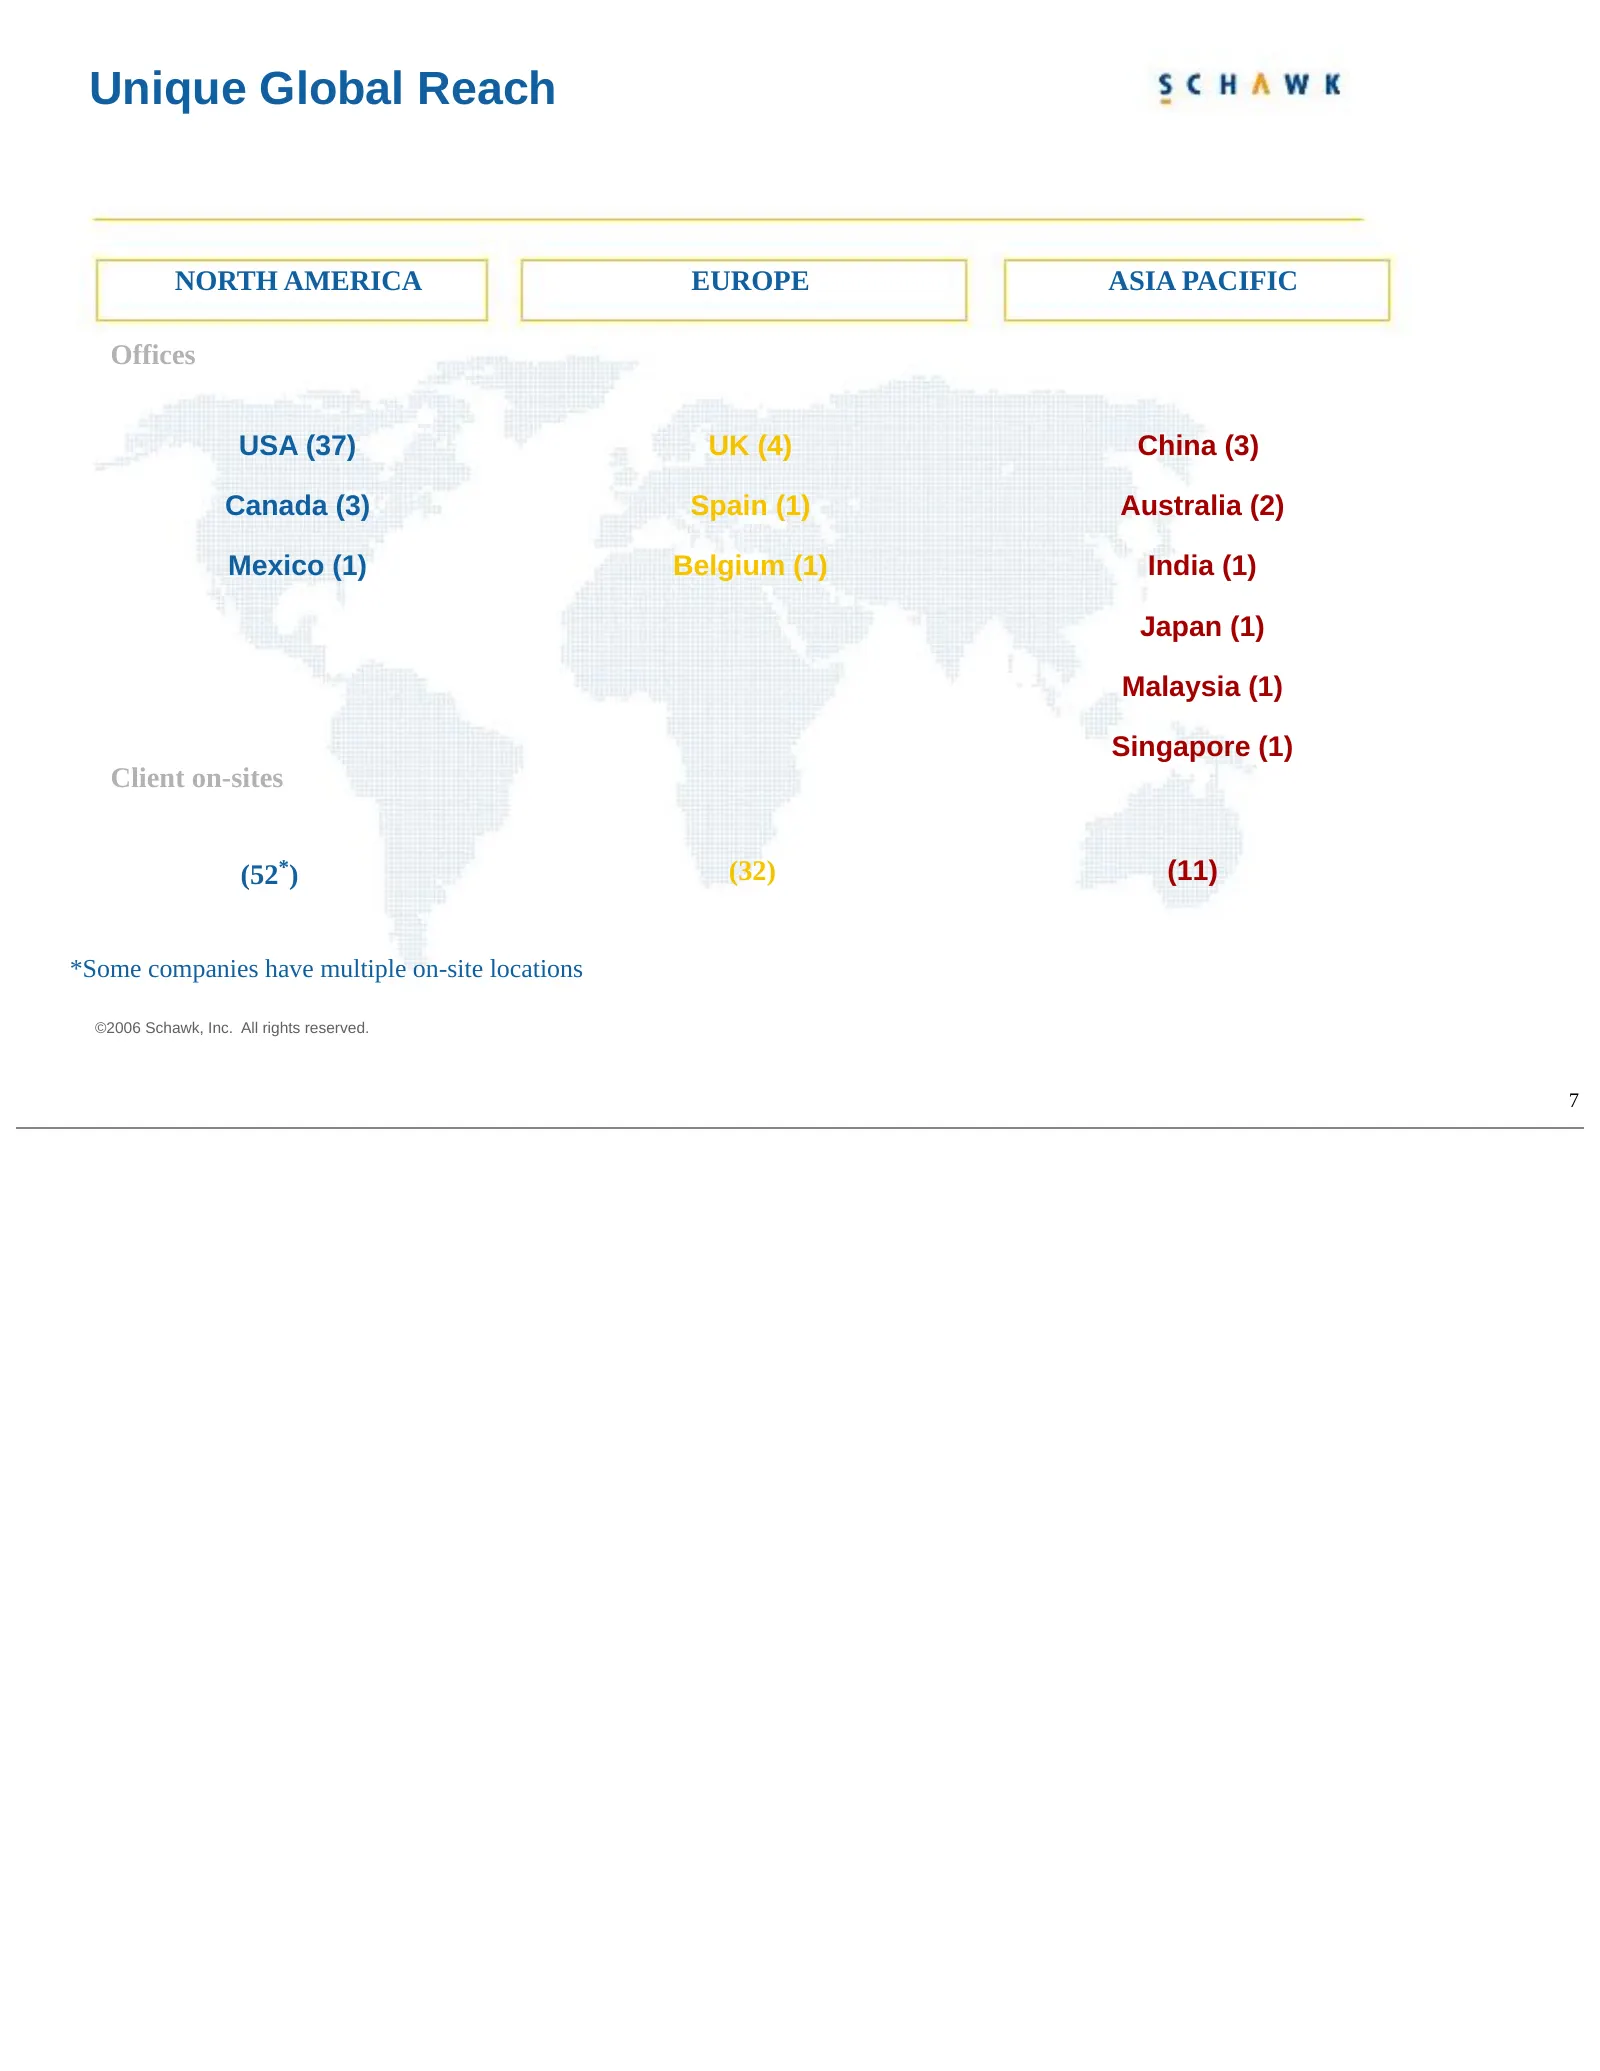
Slide 7: Unique Global Reach
Unique Global Reach NORTH AMERICA EUROPE ASIA PACIFIC Offices USA (37) UK (4) China (3) Canada (3) Spain (1) Australia (2) Mexico (1) Belgium (1) India (1) Japan (1) Malaysia (1) Singapore (1) Client on-sites (52*) (32) (11) *Some companies have multiple on-site locations ©2006 Schawk, Inc. All righ
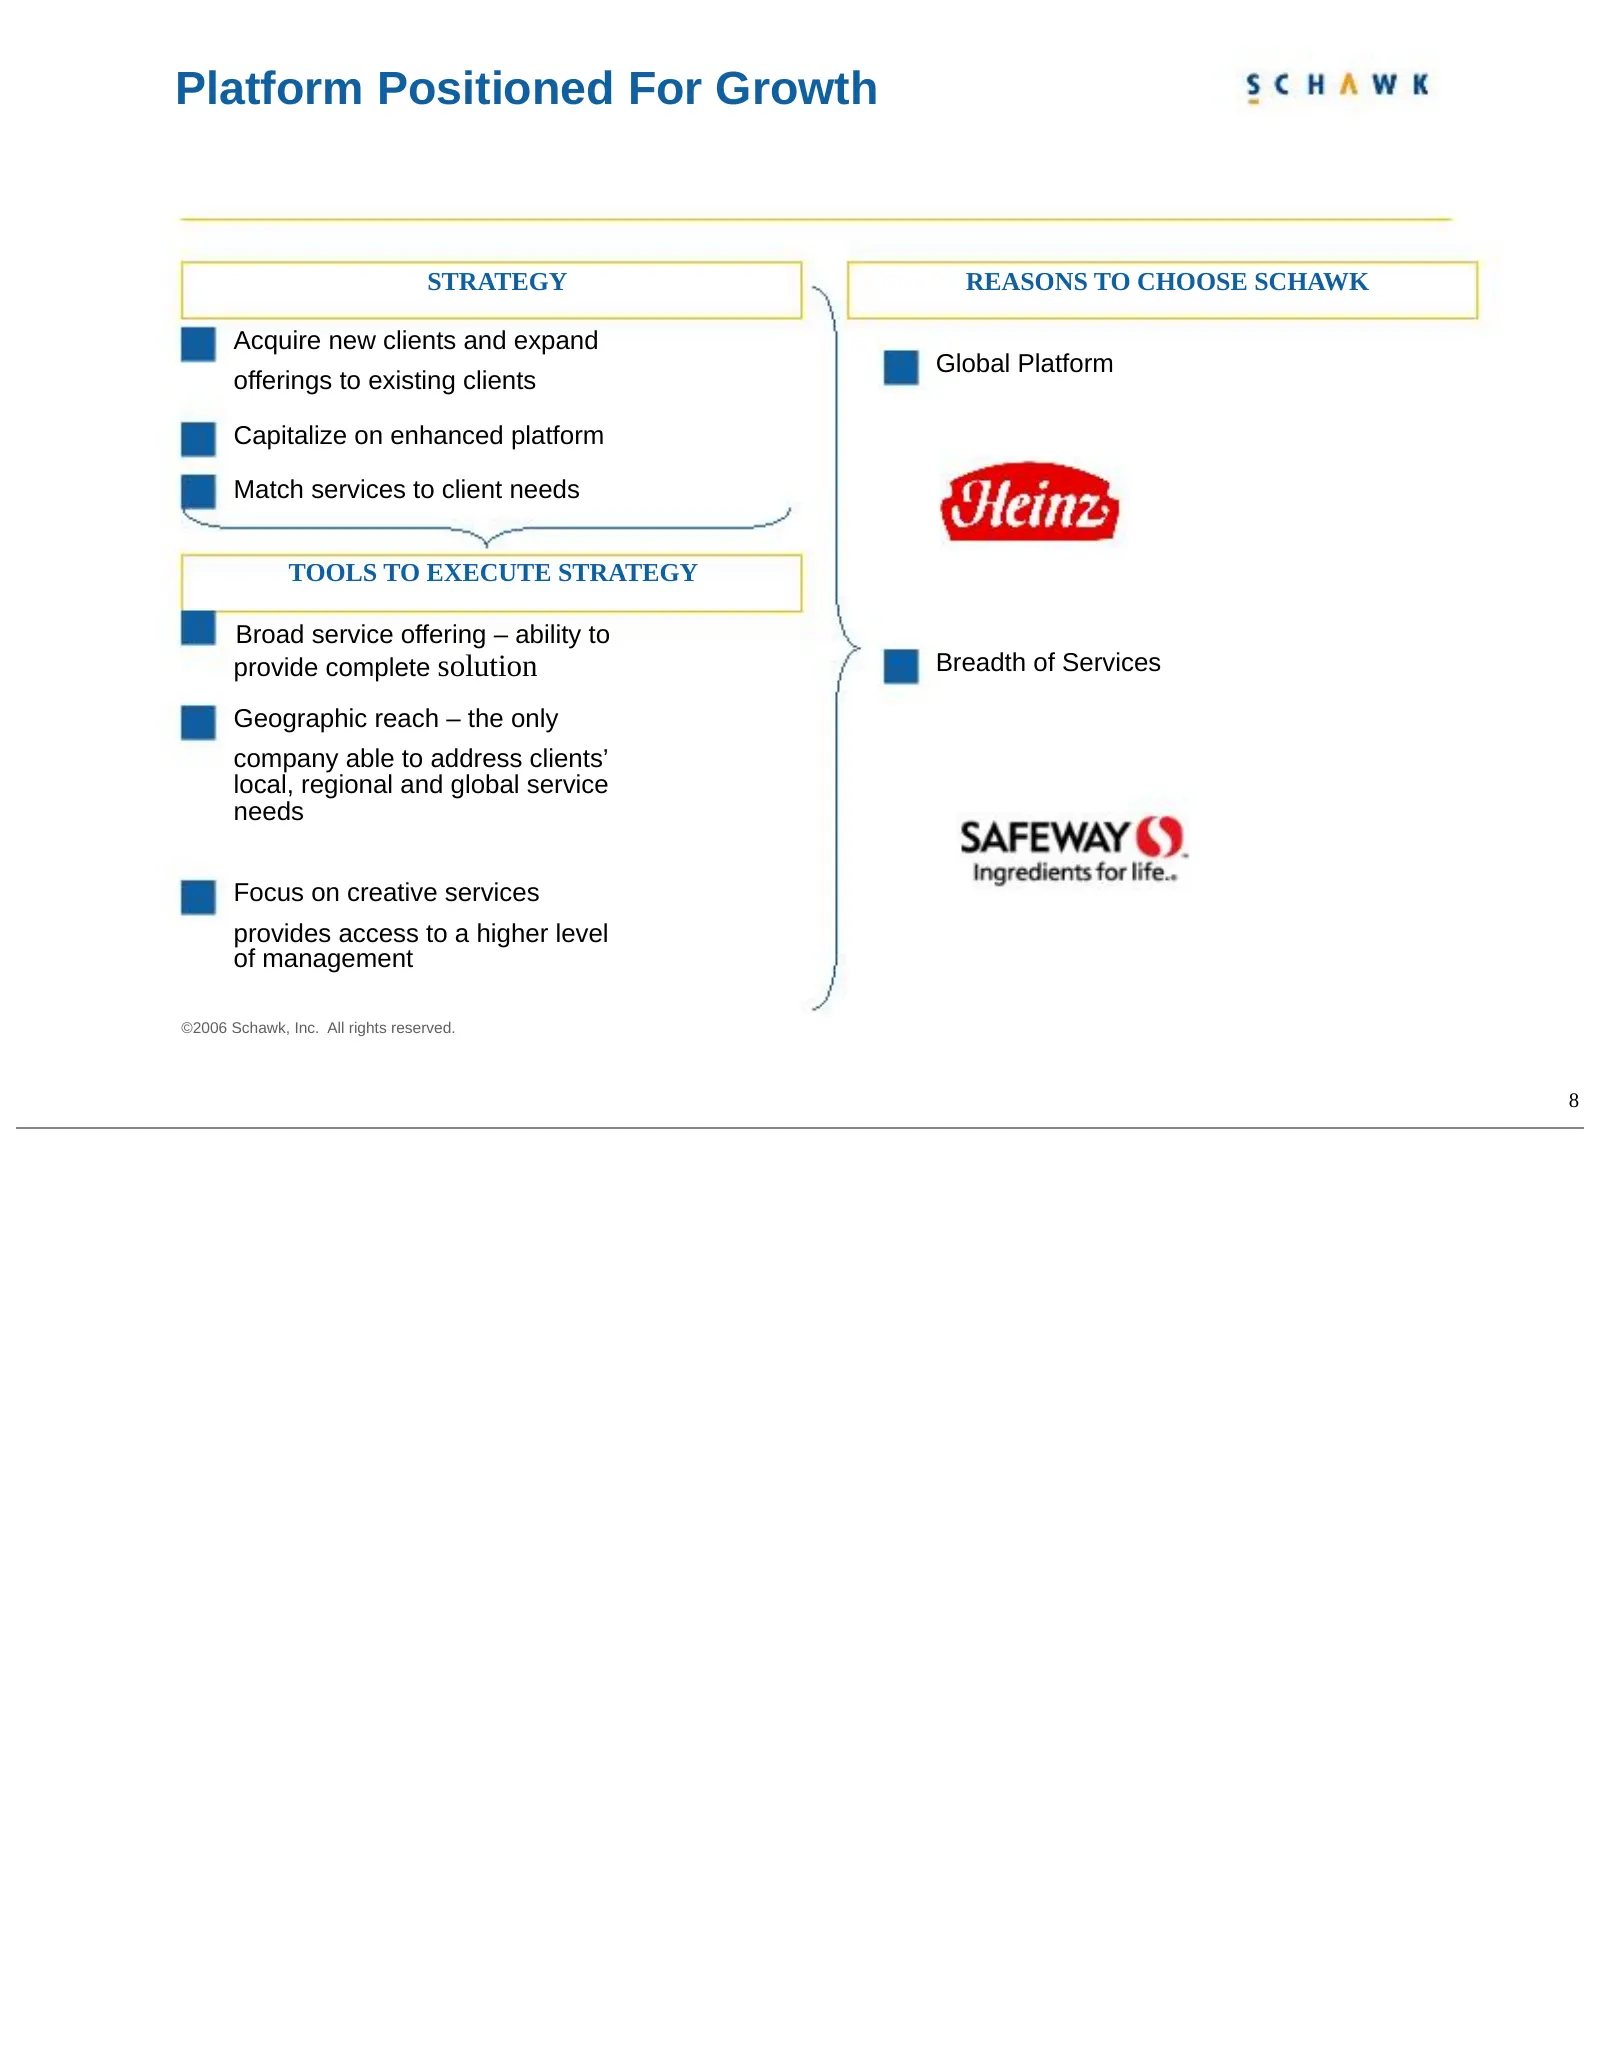
Slide 8: Platform Positioned For Growth
Platform Positioned For Growth STRATEGY REASONS TO CHOOSE SCHAWK Acquire new clients and expand Global Platform offerings to existing clients Capitalize on enhanced platform Match services to client needs TOOLS TO EXECUTE STRATEGY Broad service offering – ability to provide complete solution Breadth
Slide 9: Strategic Growth
Strategic Growth We Are Ahead Of Our 5-year Plan Announced May 2003 Achieve average 20% annual top line growth over 5-years consisting of organic and acquisition growth Achieve low to mid-teen operating margin percentages Achieve mid-teen percentage average annual growth over 5-years Achieve vision
Slide 10: 2007 Focus
2007 Focus Continue our strategy of acquiring, integrating and operating companies Strong, motivated management focused on capitalizing on opportunities with new and existing clients Confidence in our ability to achieve real cost & operating synergies Stronger infrastructure will drive top and botto
Slide 11: 2007 Focus (continued)
2007 Focus (continued) Implement 5 New Business Objectives Enhance/leverage our global presence and offering Drive enterprise-wide executional excellence while relentlessly pursuing innovation Build a knowledge-based employee team to deliver global integrated solutions to our clients Improve overall
Slide 12: Investment Opportunity
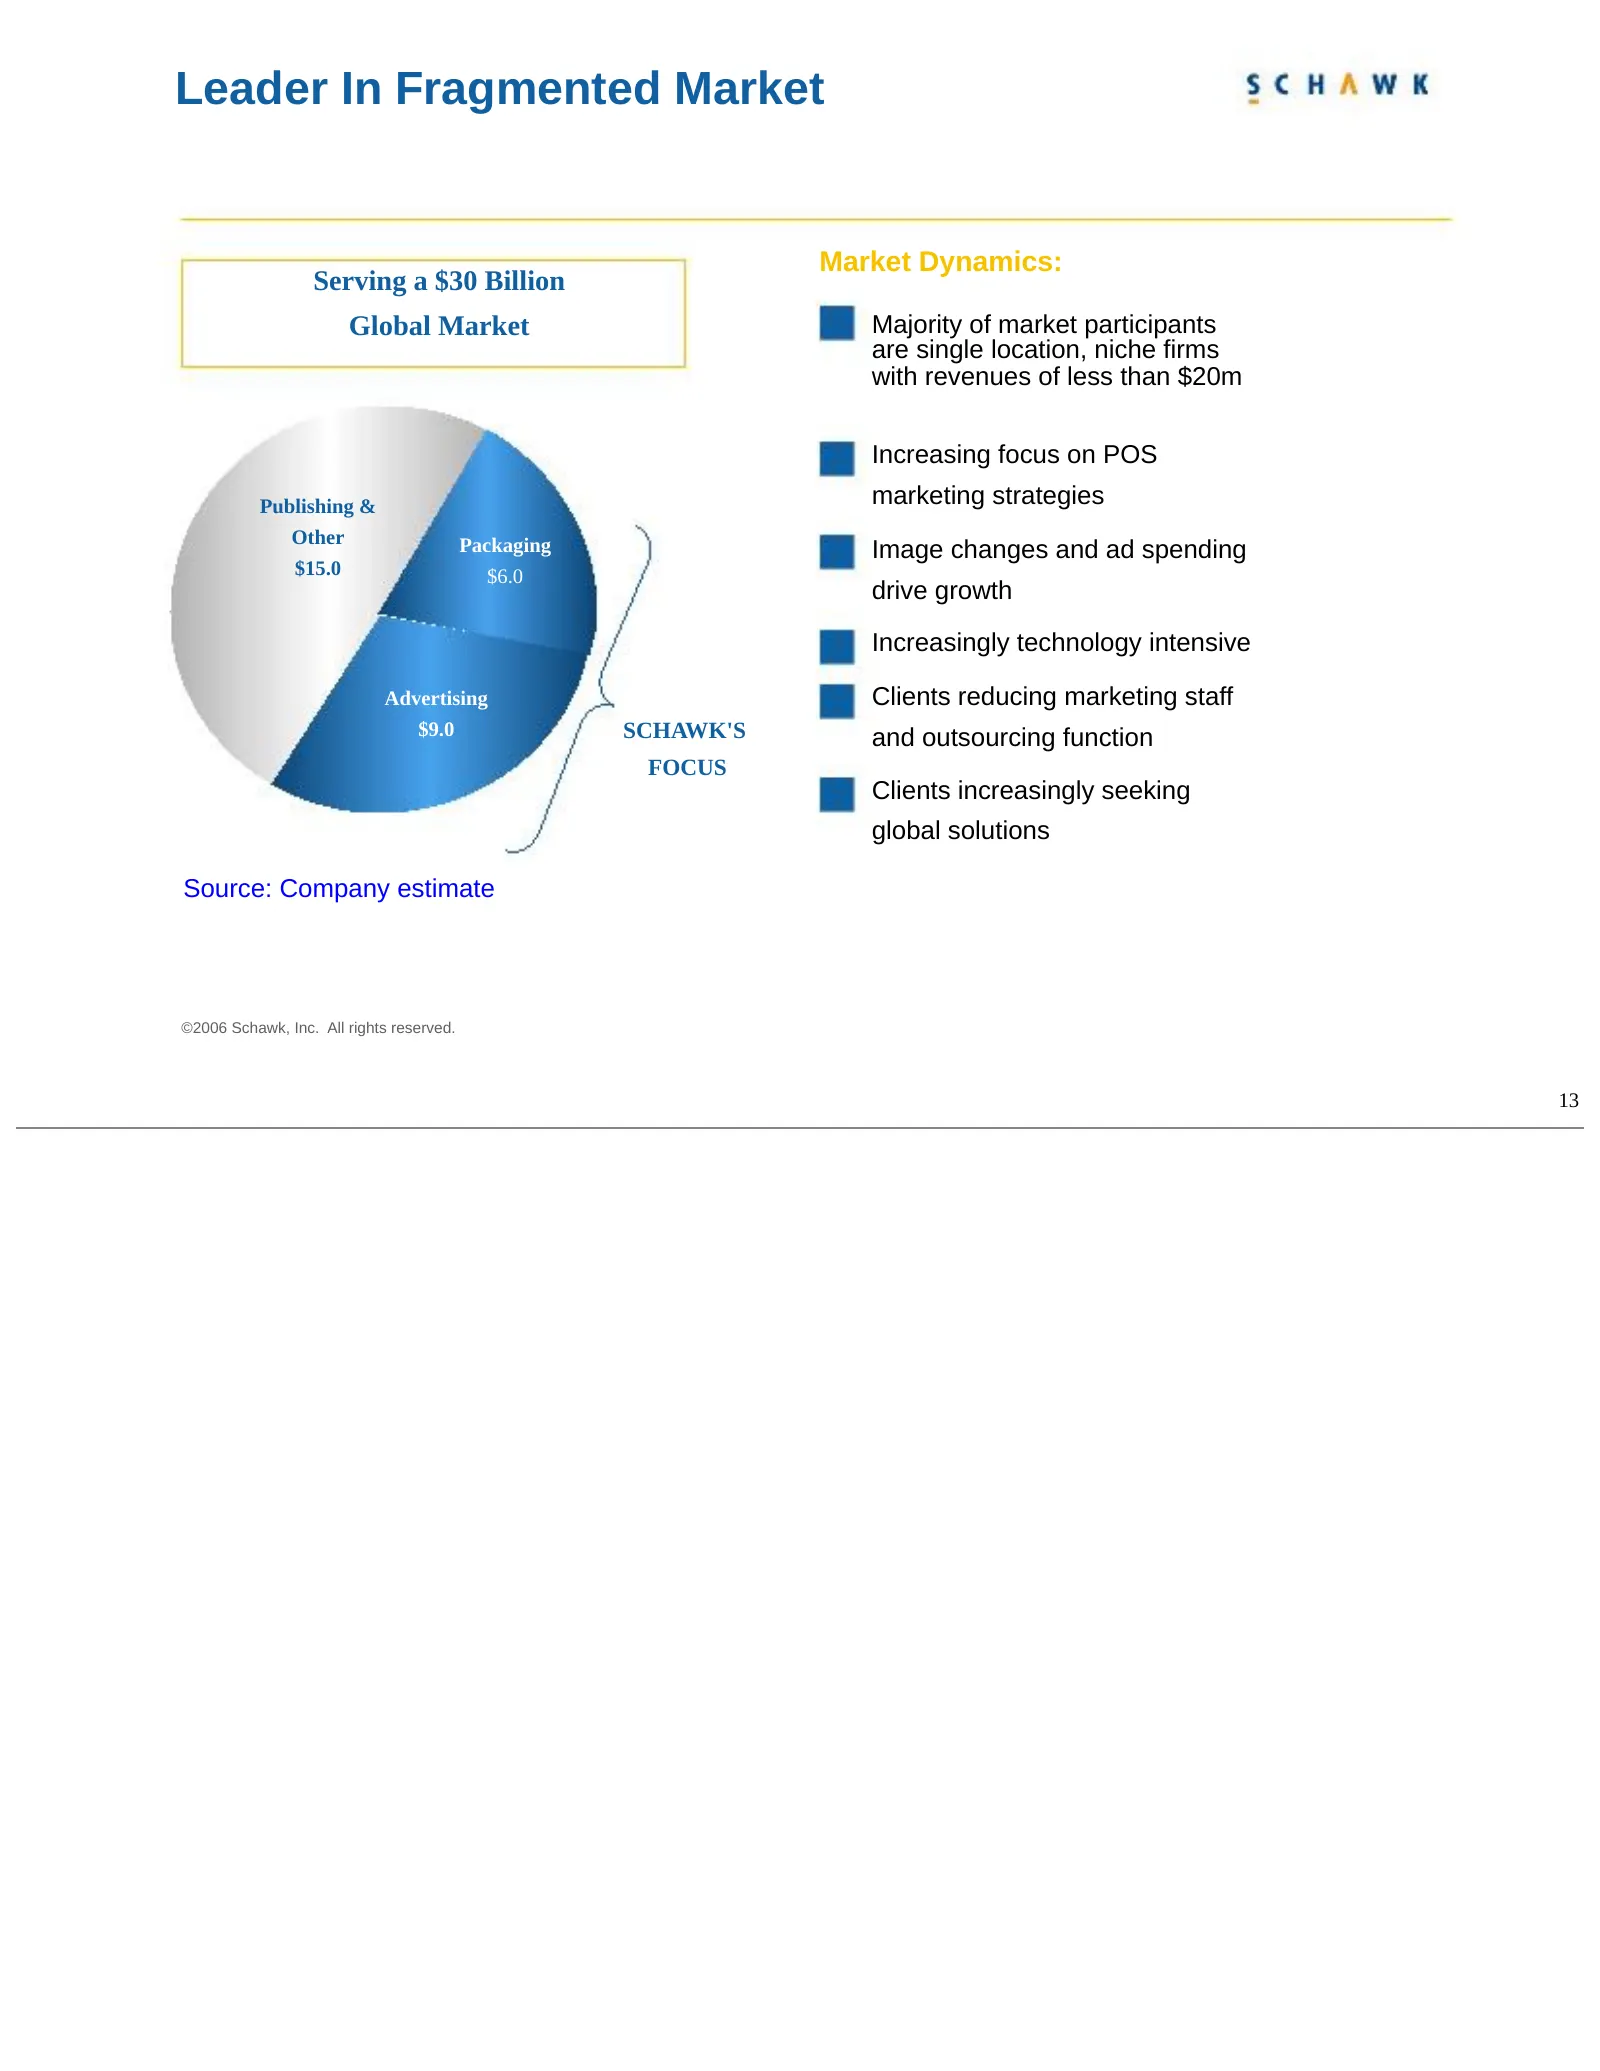
Investment Opportunity $30 billion global market Schawk more than doubled in size from 2004 due to two major acquisitions at the beginning of 2005 Internal growth engine is delivering results Expanding global coverage Dominant industry share – packaging, advertising & promotion Infrastructure that m
Slide 13: Leader In Fragmented Market
Leader In Fragmented Market Market Dynamics: Serving a $30 Billion Global Market Majority of market participants are single location, niche firms with revenues of less than $20m Increasing focus on POS Publishing & marketing strategies Other Packaging Image changes and ad spending $15.0 $6.0 drive g
Slide 14: Financial Overview
Financial Overview ©2006 Schawk, Inc. All rights reserved.
Slide 15: Long Term Performance
Long Term Performance Over the past 10 years, Schawk has grown sales at a 20% compounded average annual growth rate for the period ended December 31, 2005. An investment in Schawk stock 10 years ago at $8.12 per share would have resulted in a 15% compounded average annual return (including dividends
Slide 16: Strong Cash Flow Generator
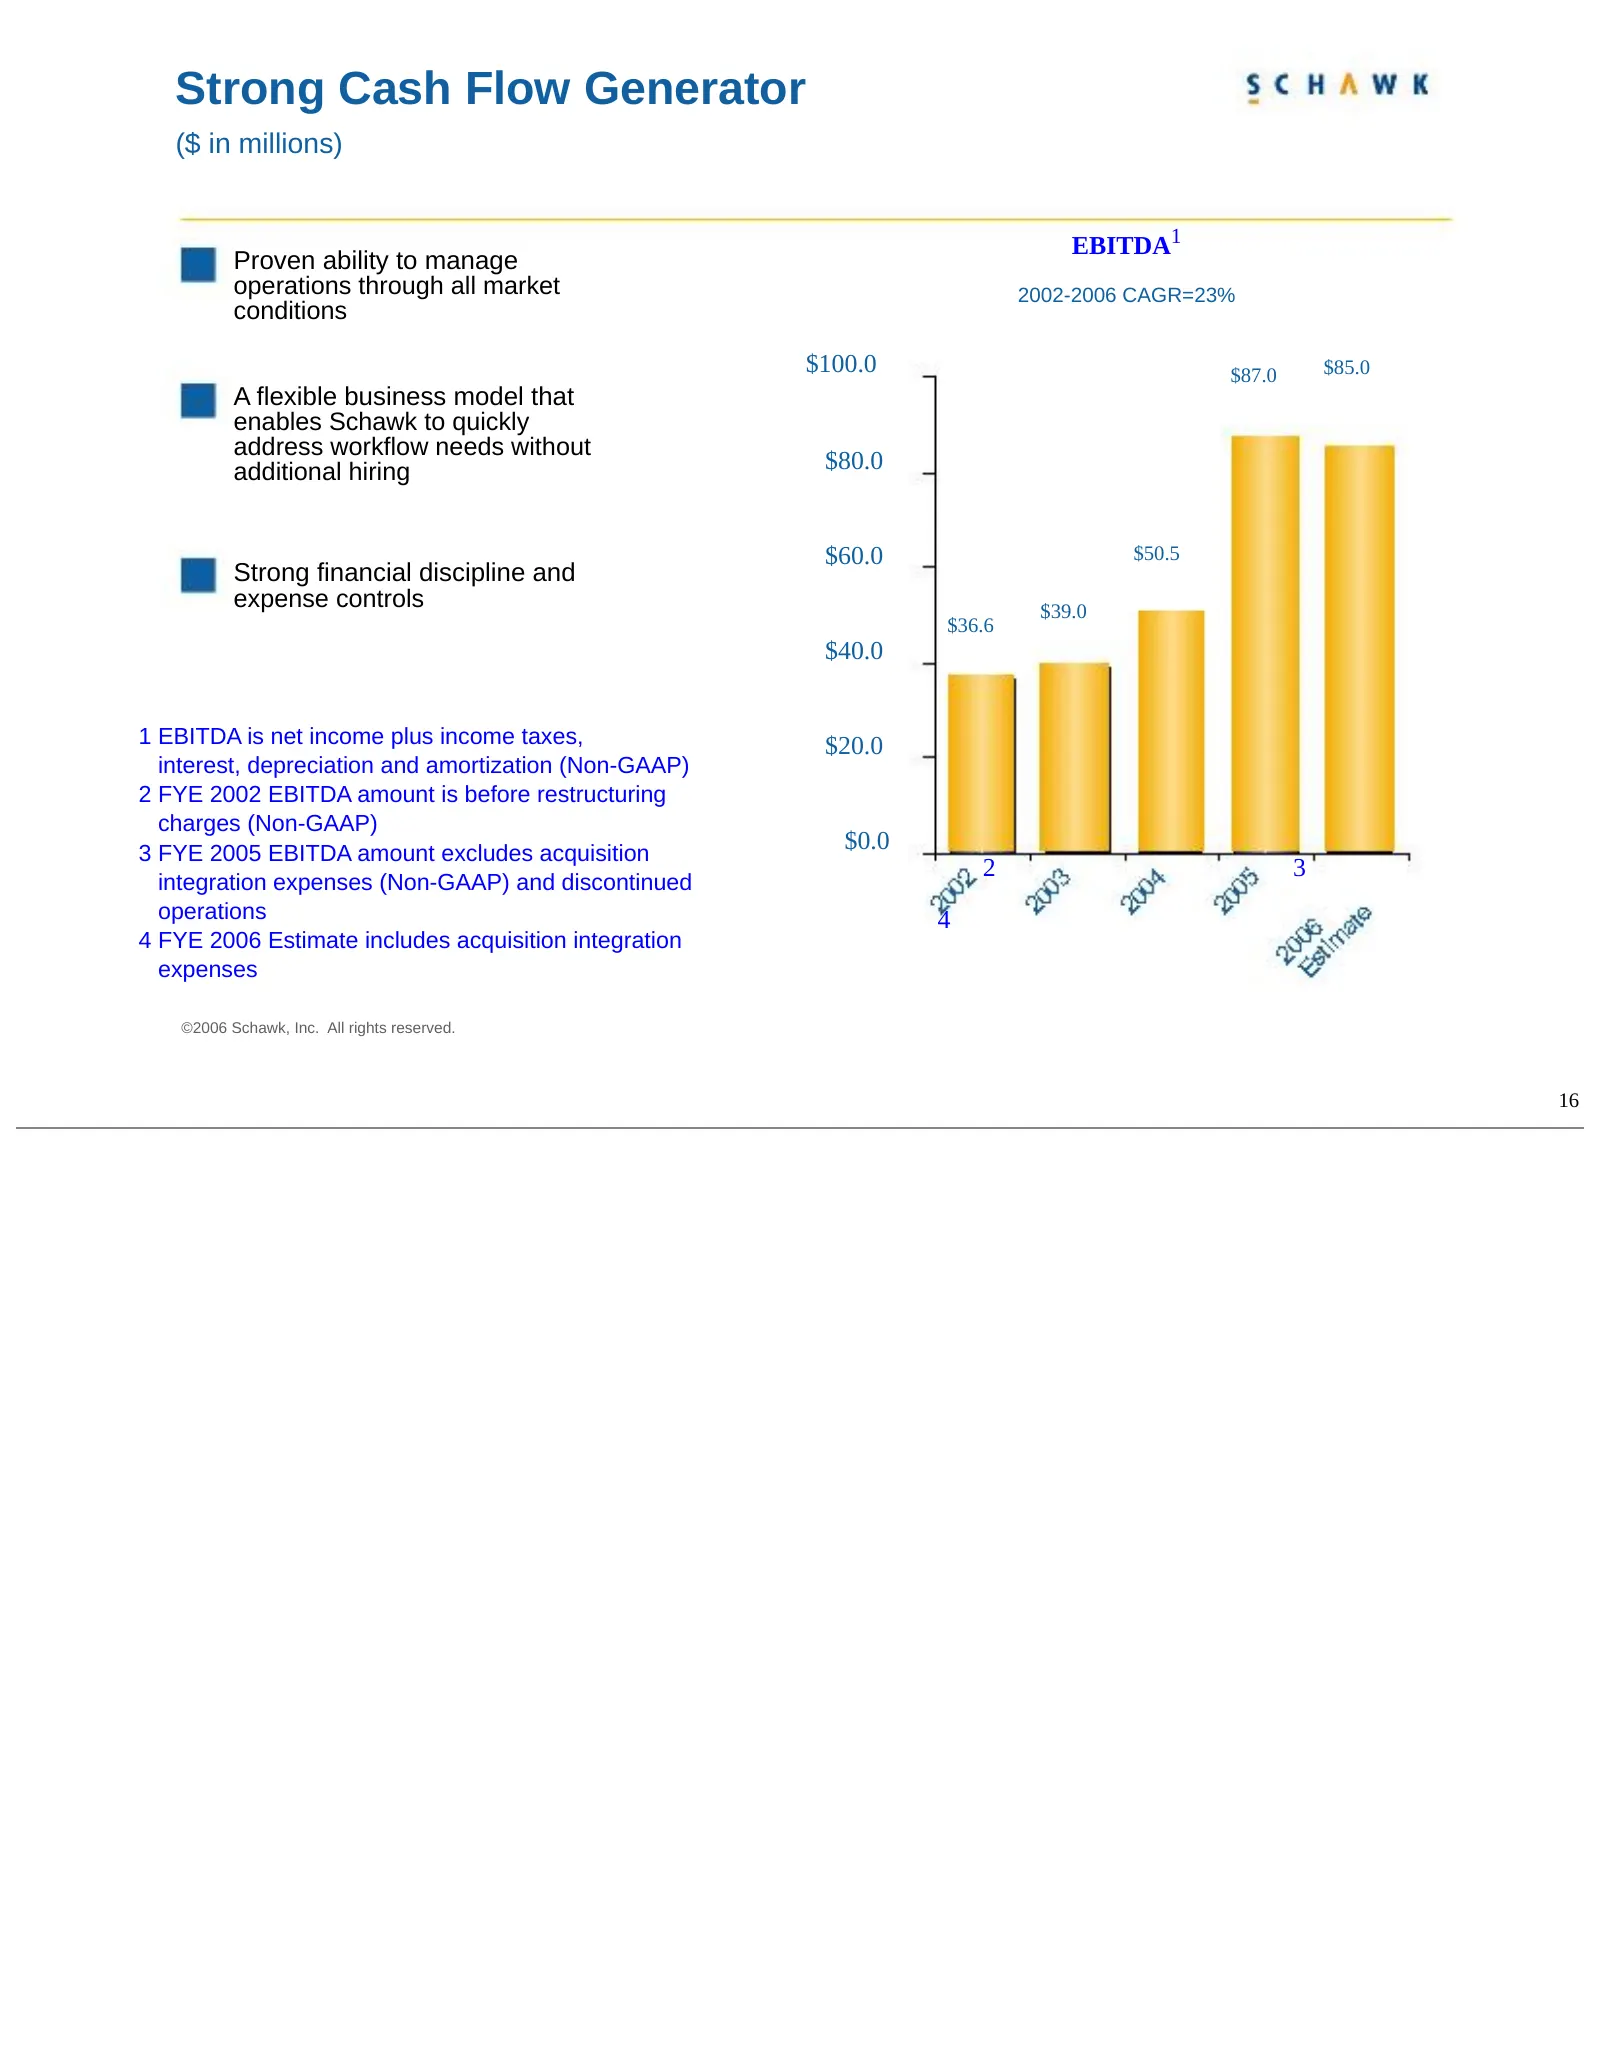
Strong Cash Flow Generator ($ in millions) EBITDA1 Proven ability to manage operations through all market 2002-2006 CAGR=23% conditions $100.0 $87.0 $85.0 A flexible business model that enables Schawk to quickly address workflow needs without additional hiring $80.0 $60.0 $50.5 Strong financial disc
Slide 17: Impact Of Transaction
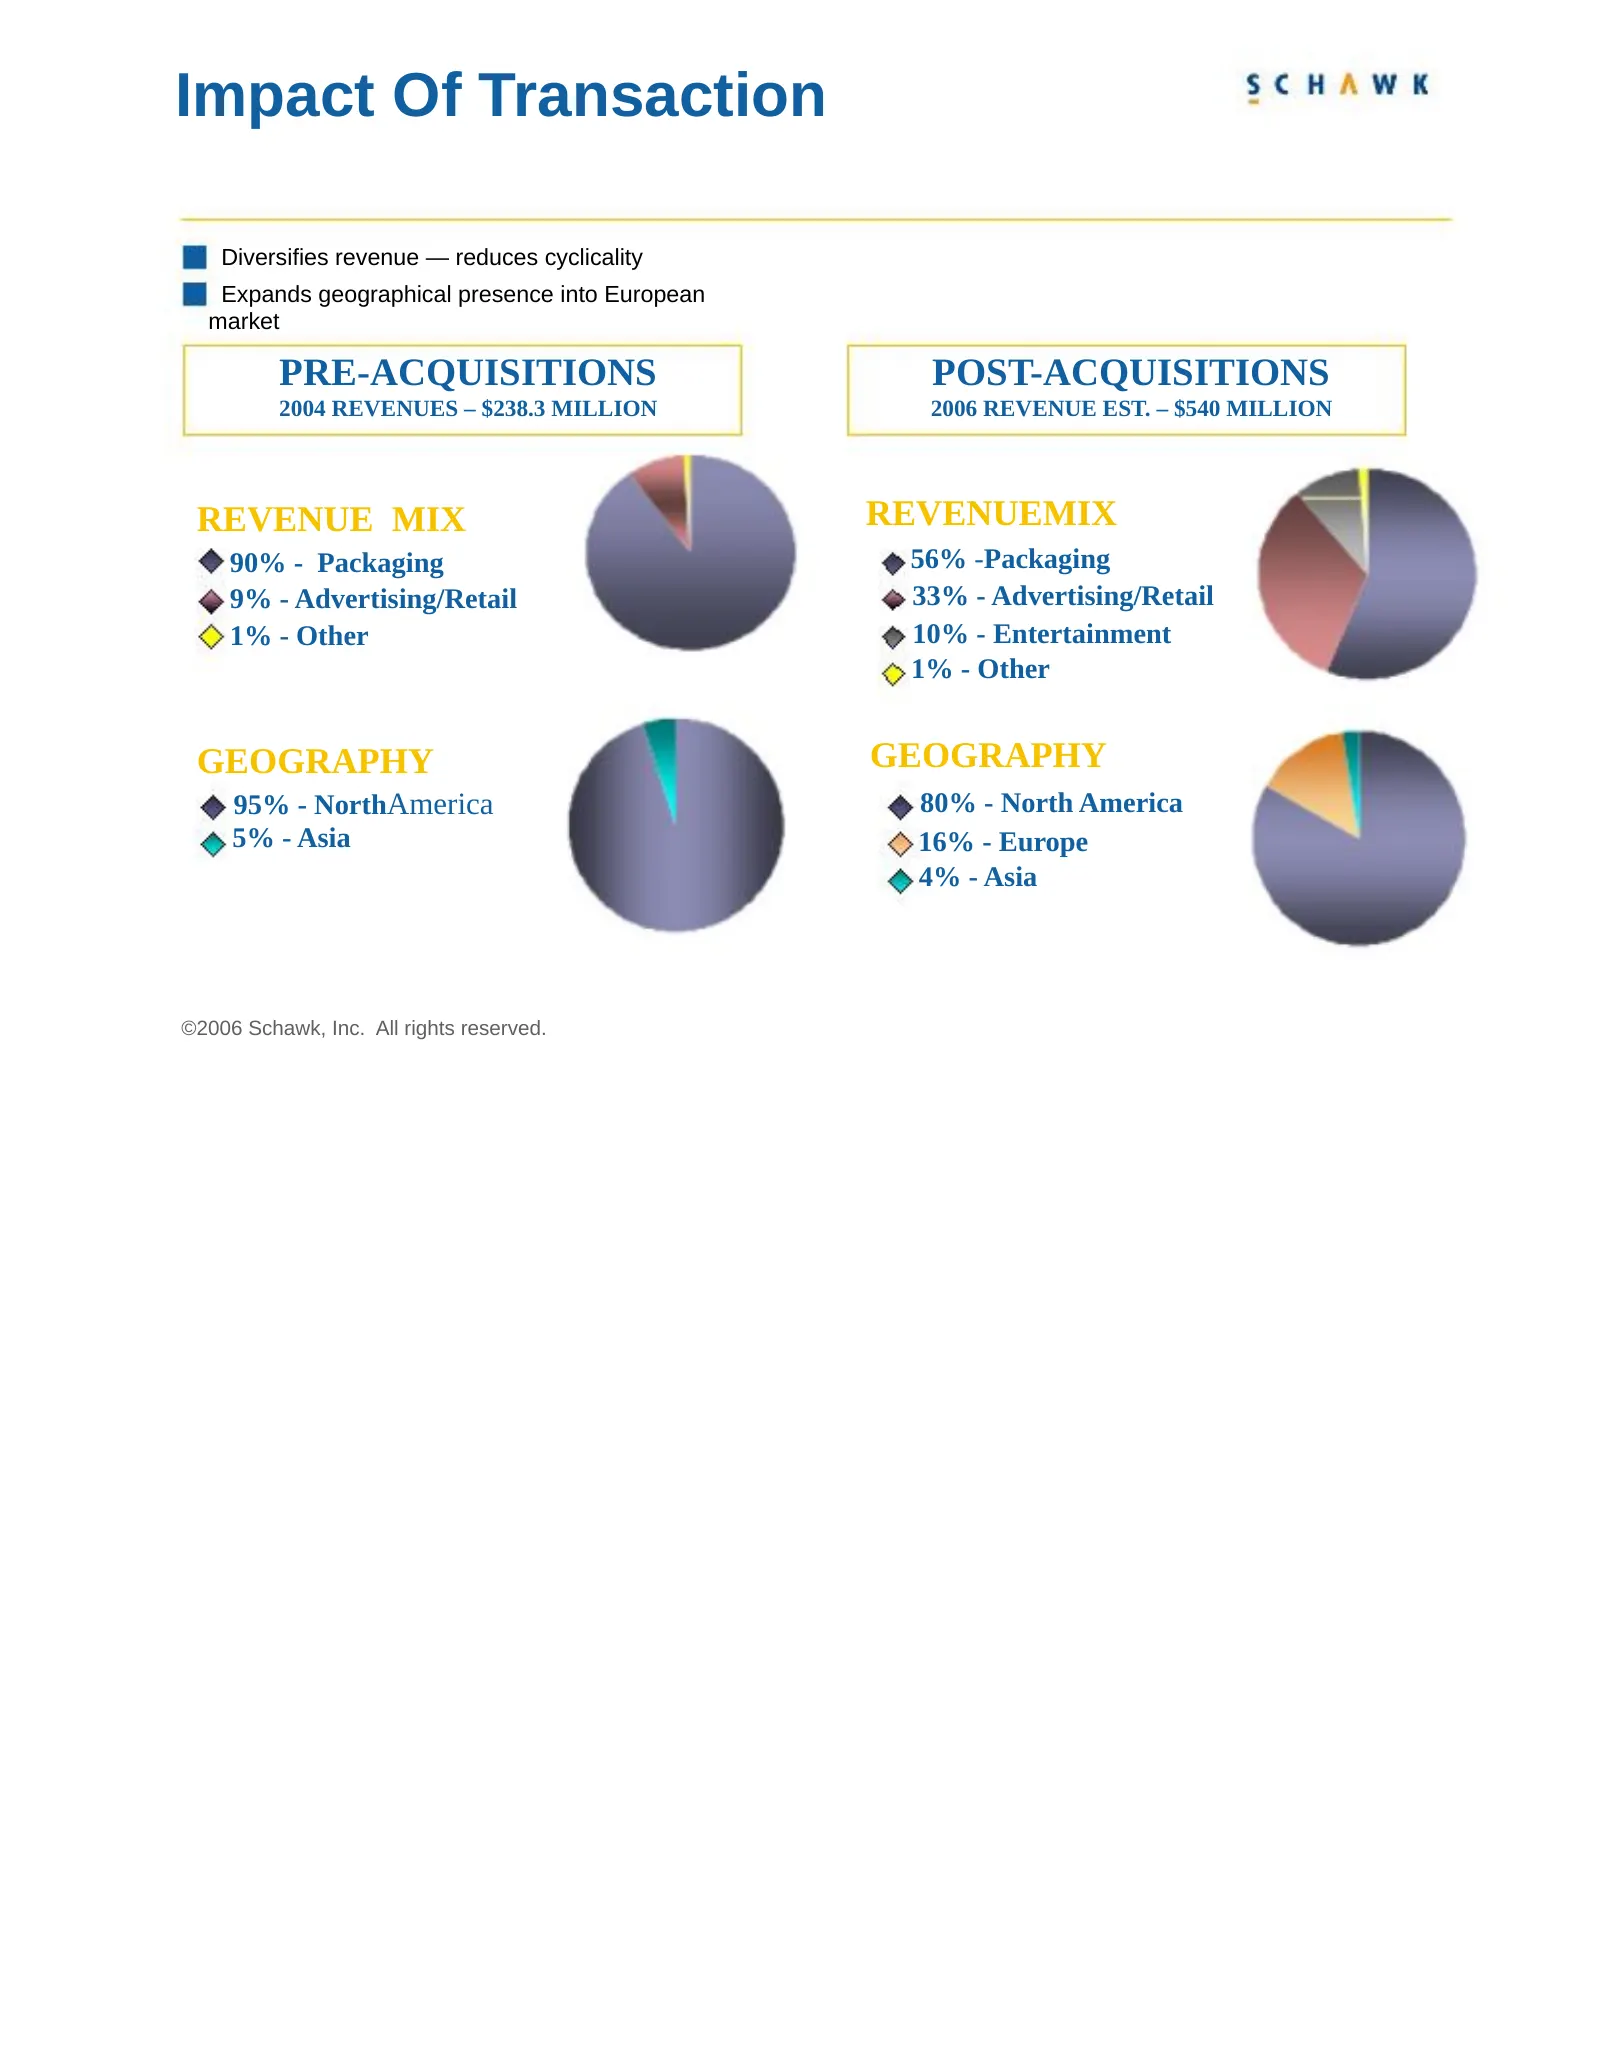
Impact Of Transaction Diversifies revenue — reduces cyclicality Expands geographical presence into European market PRE-ACQUISITIONS POST-ACQUISITIONS 2004 REVENUES – $238.3 MILLION 2006 REVENUE EST. – $540 MILLION 1% REVENUE MIX REVENUEMIX 90% - Packaging 56% -Packaging 9% - Advertising/Retail 33% -

Slide 18: 17
17
Slide 19: Historical Results
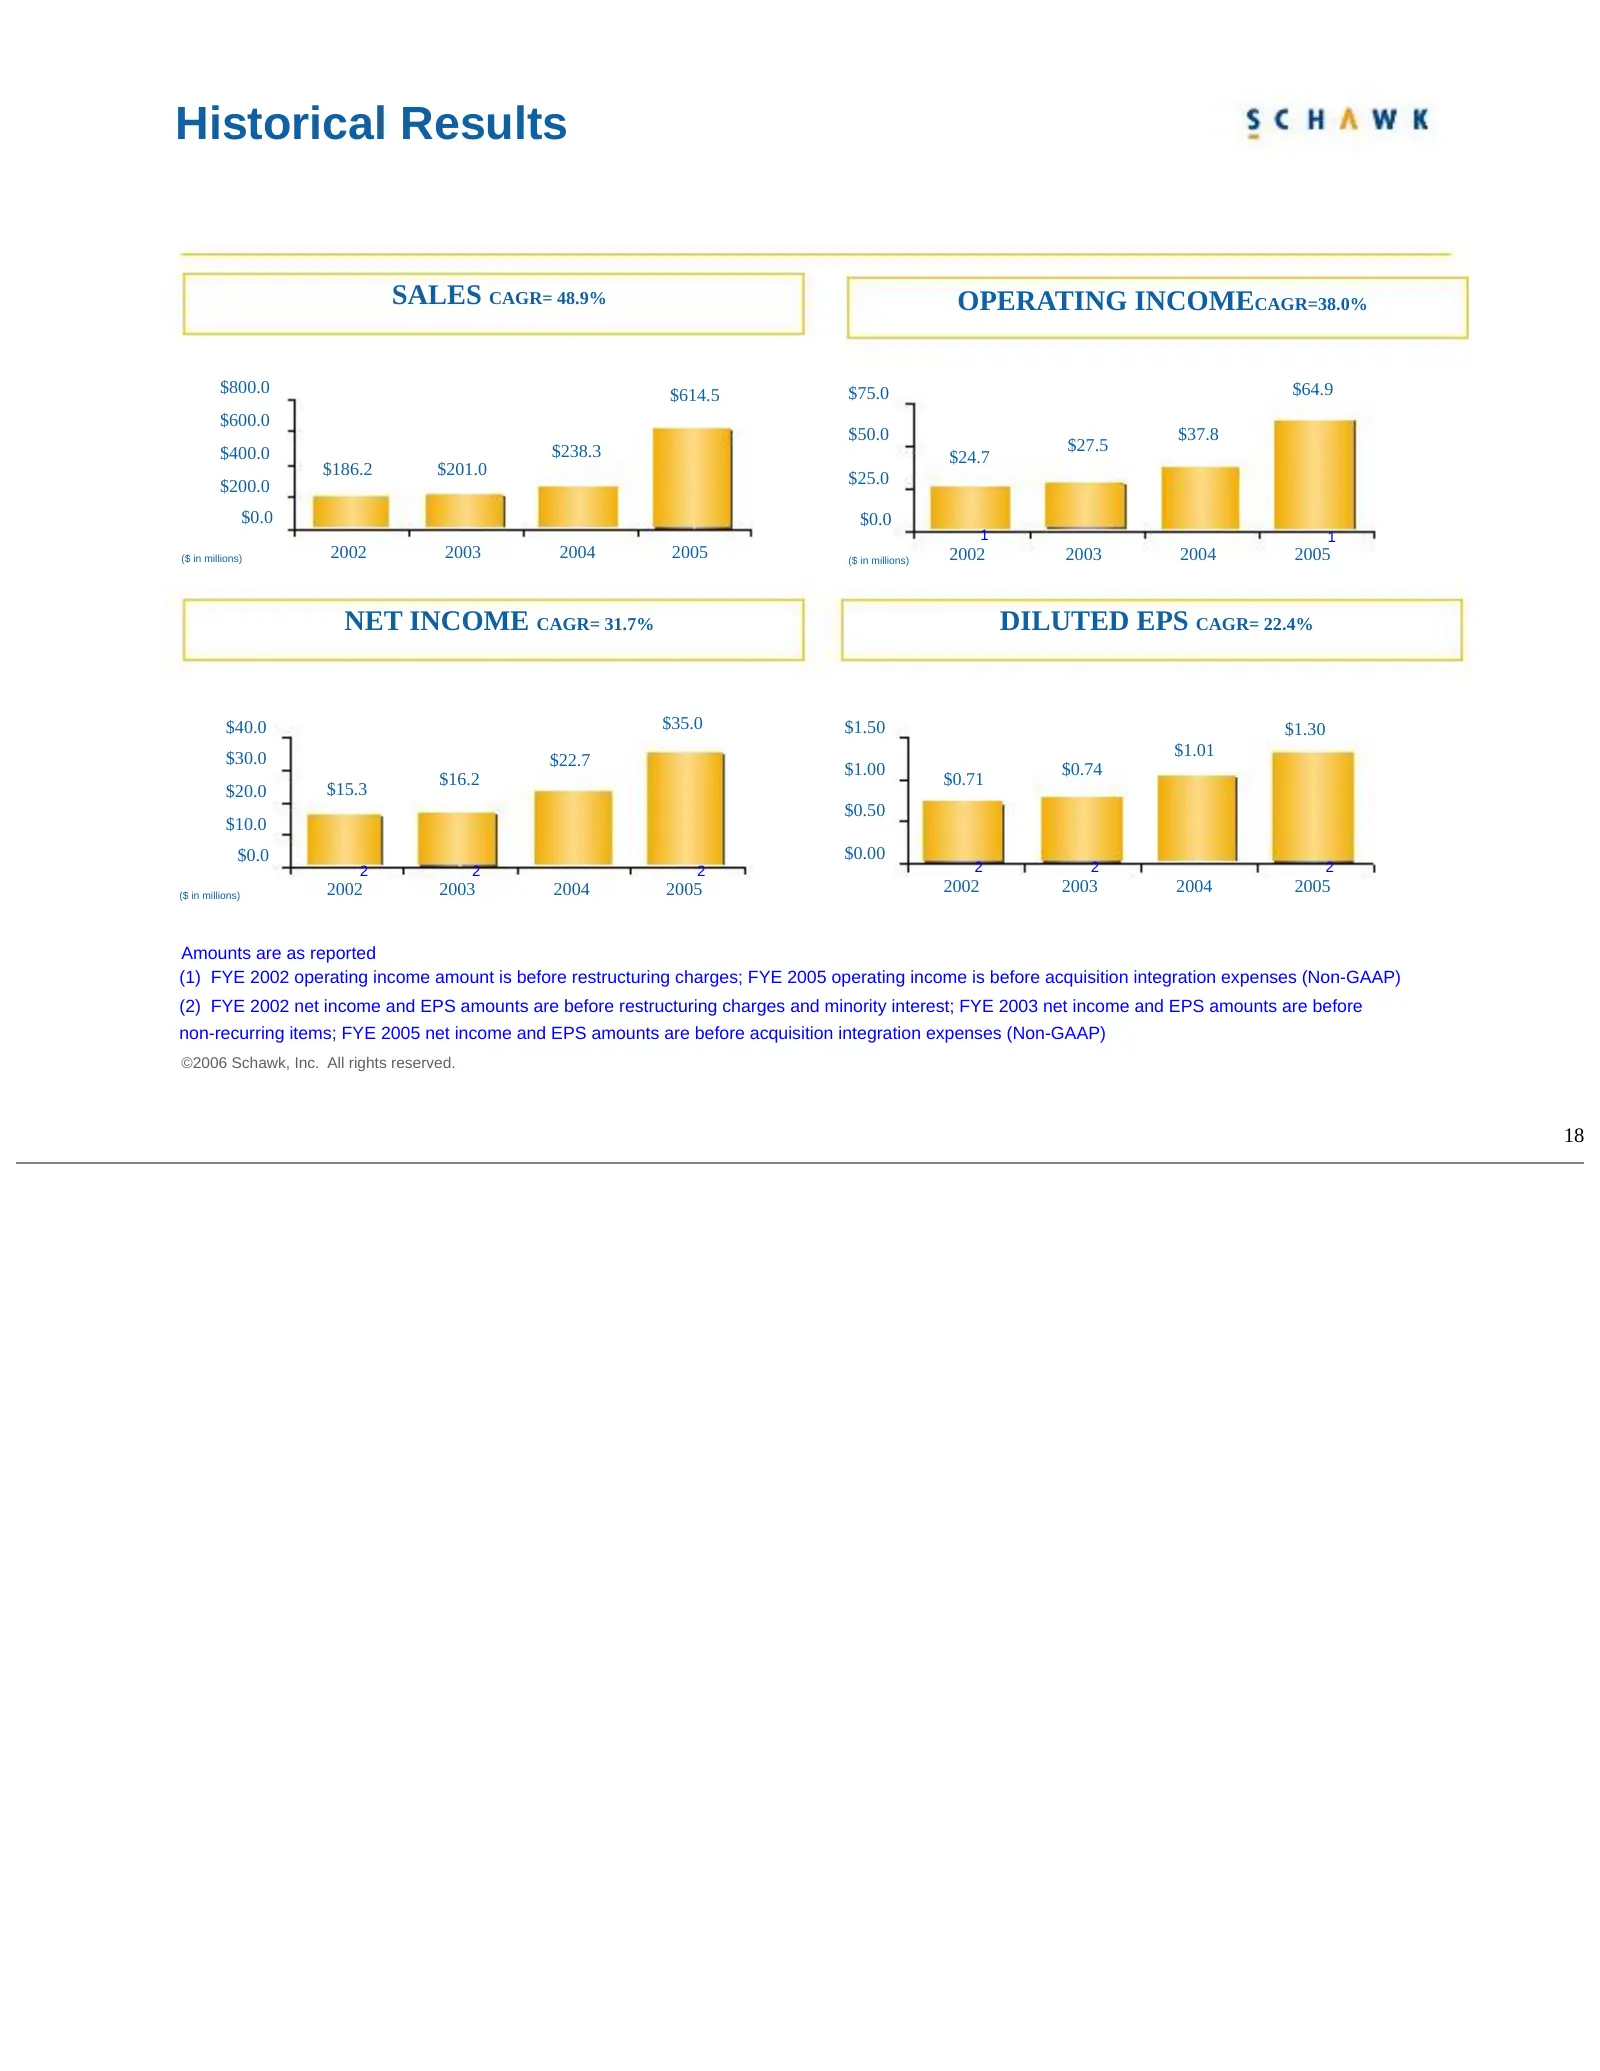
Historical Results SALES CAGR= 48.9% OPERATING INCOMECAGR=38.0% $800.0 $614.5 $75.0 $64.9 $600.0 $50.0 $37.8 $400.0 $238.3 $27.5 $24.7 $186.2 $201.0 $200.0 $25.0 $0.0 $0.0 1 1 ($ in millions) 2002 2003 2004 2005 ($ in millions) 2002 2003 2004 2005 NET INCOME CAGR= 31.7% DILUTED EPS CAGR= 22.4% $40.0
Slide 20: September 30, 2006 Income Statement
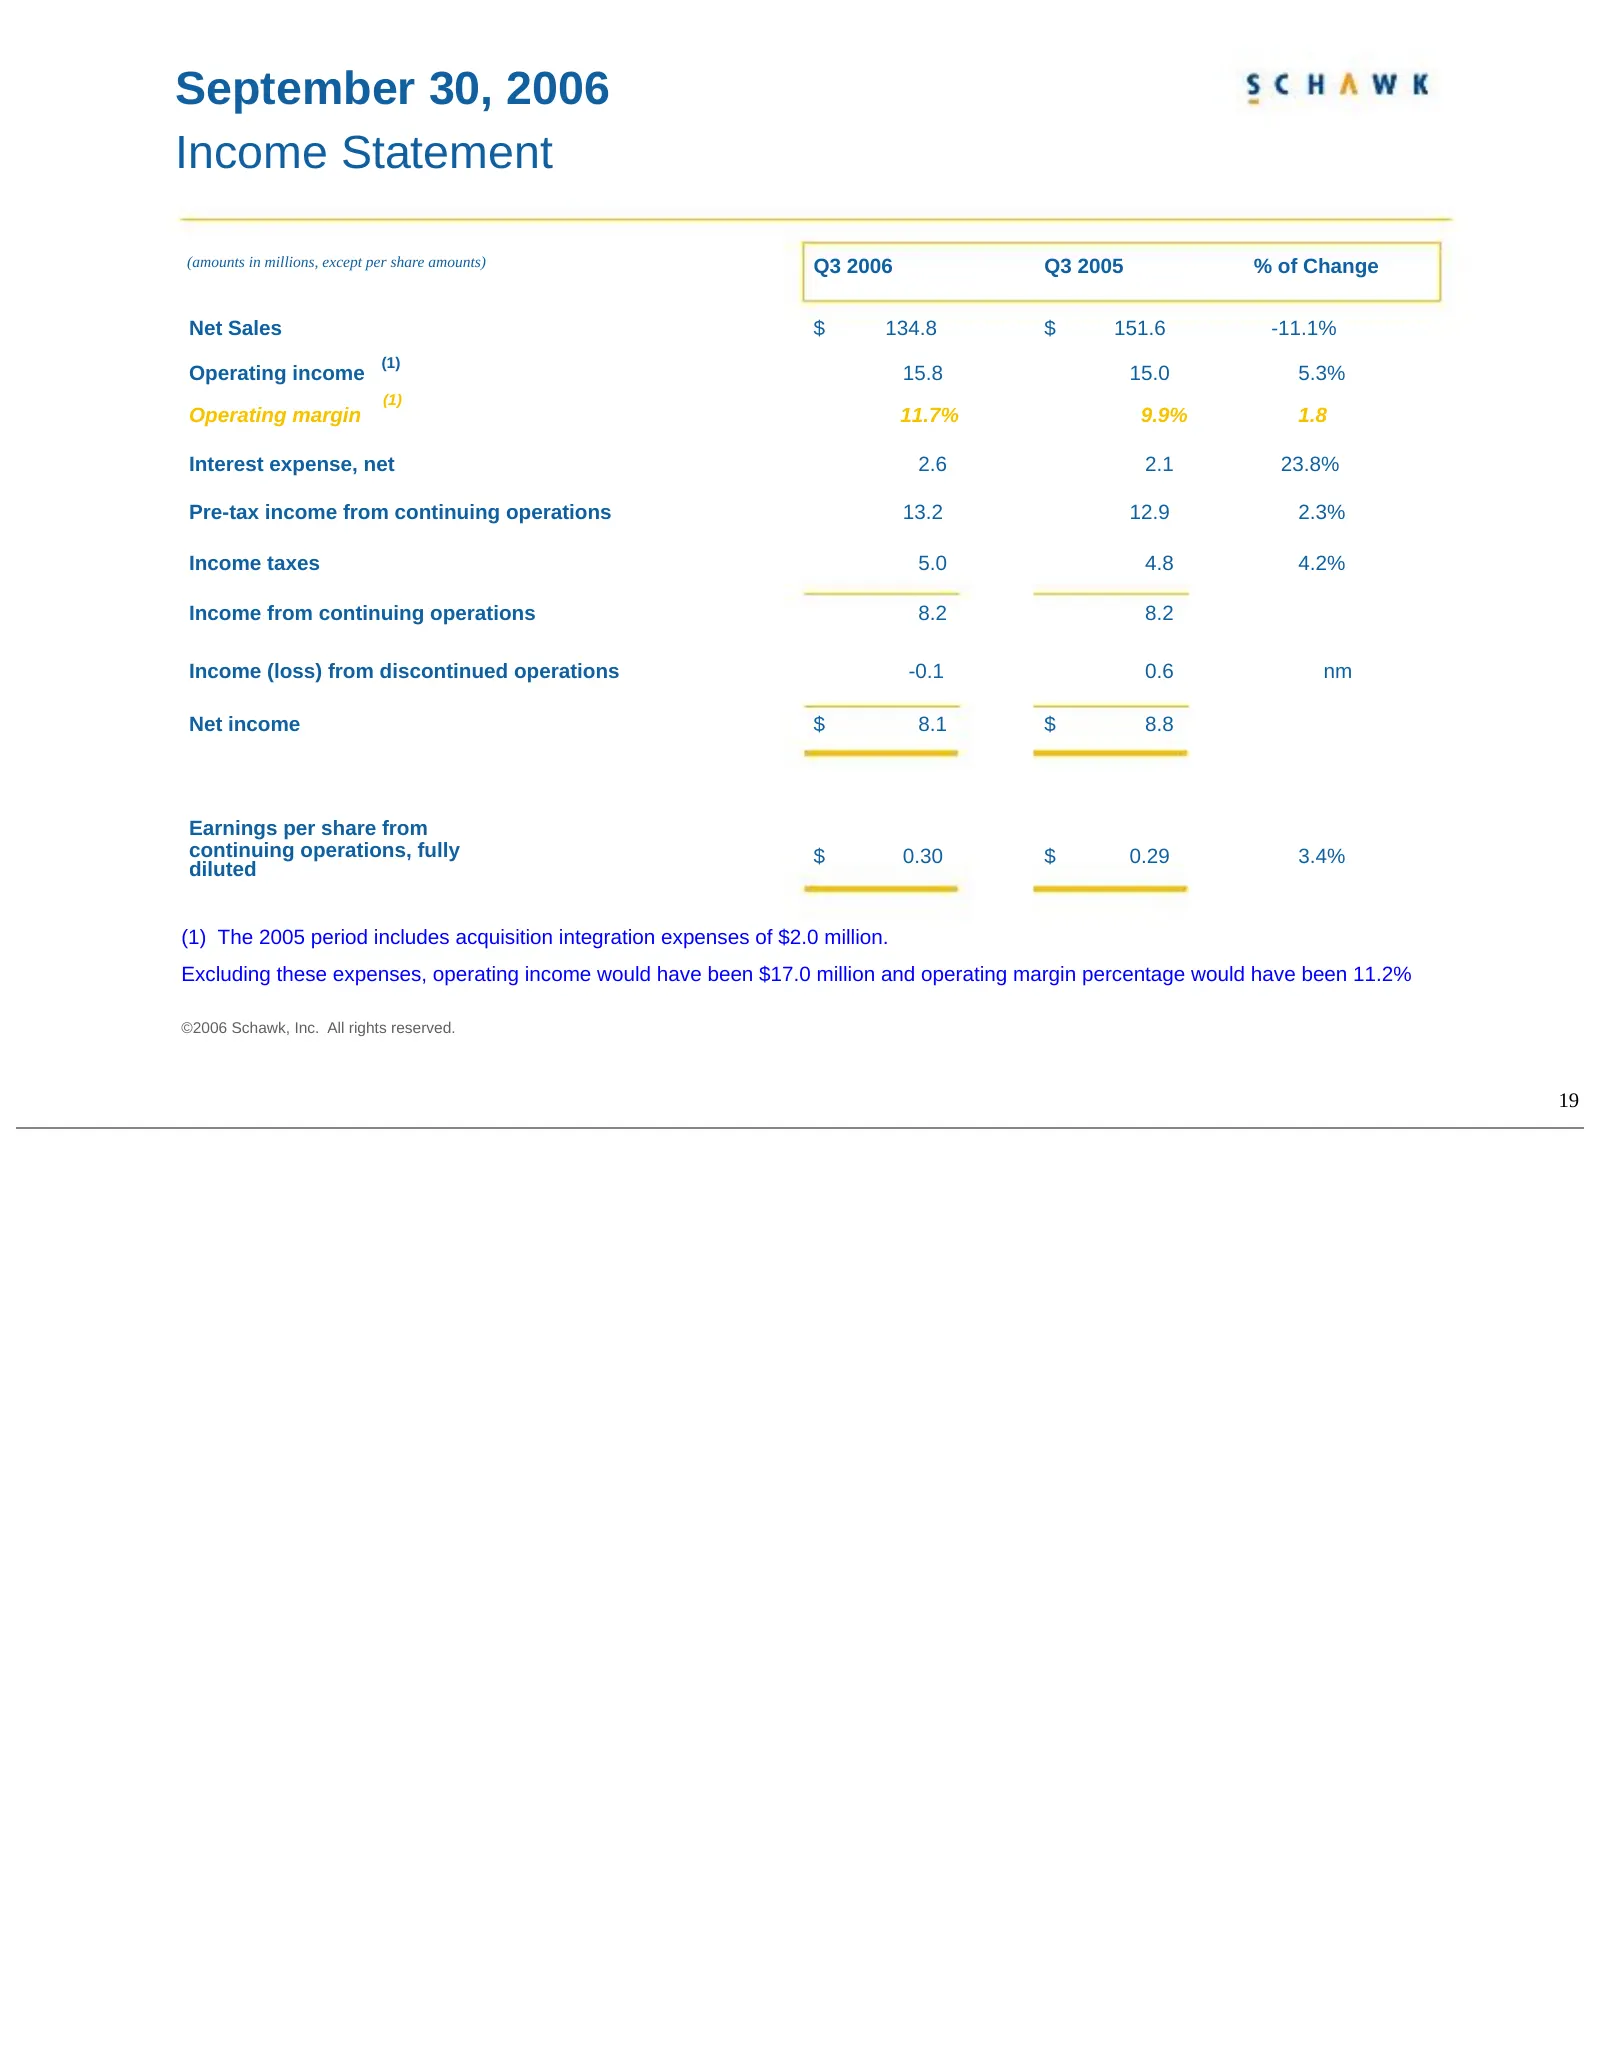
September 30, 2006 Income Statement (amounts in millions, except per share amounts) Q3 2006 Q3 2005 % of Change Net Sales $ 134.8 $ 151.6 -11.1% (1) Operating income 15.8 15.0 5.3% (1) Operating margin 11.7% 9.9% 1.8 Interest expense, net 2.6 2.1 23.8% Pre-tax income from continuing operations 13.2
Slide 21: September 30, 2006 Income Statement
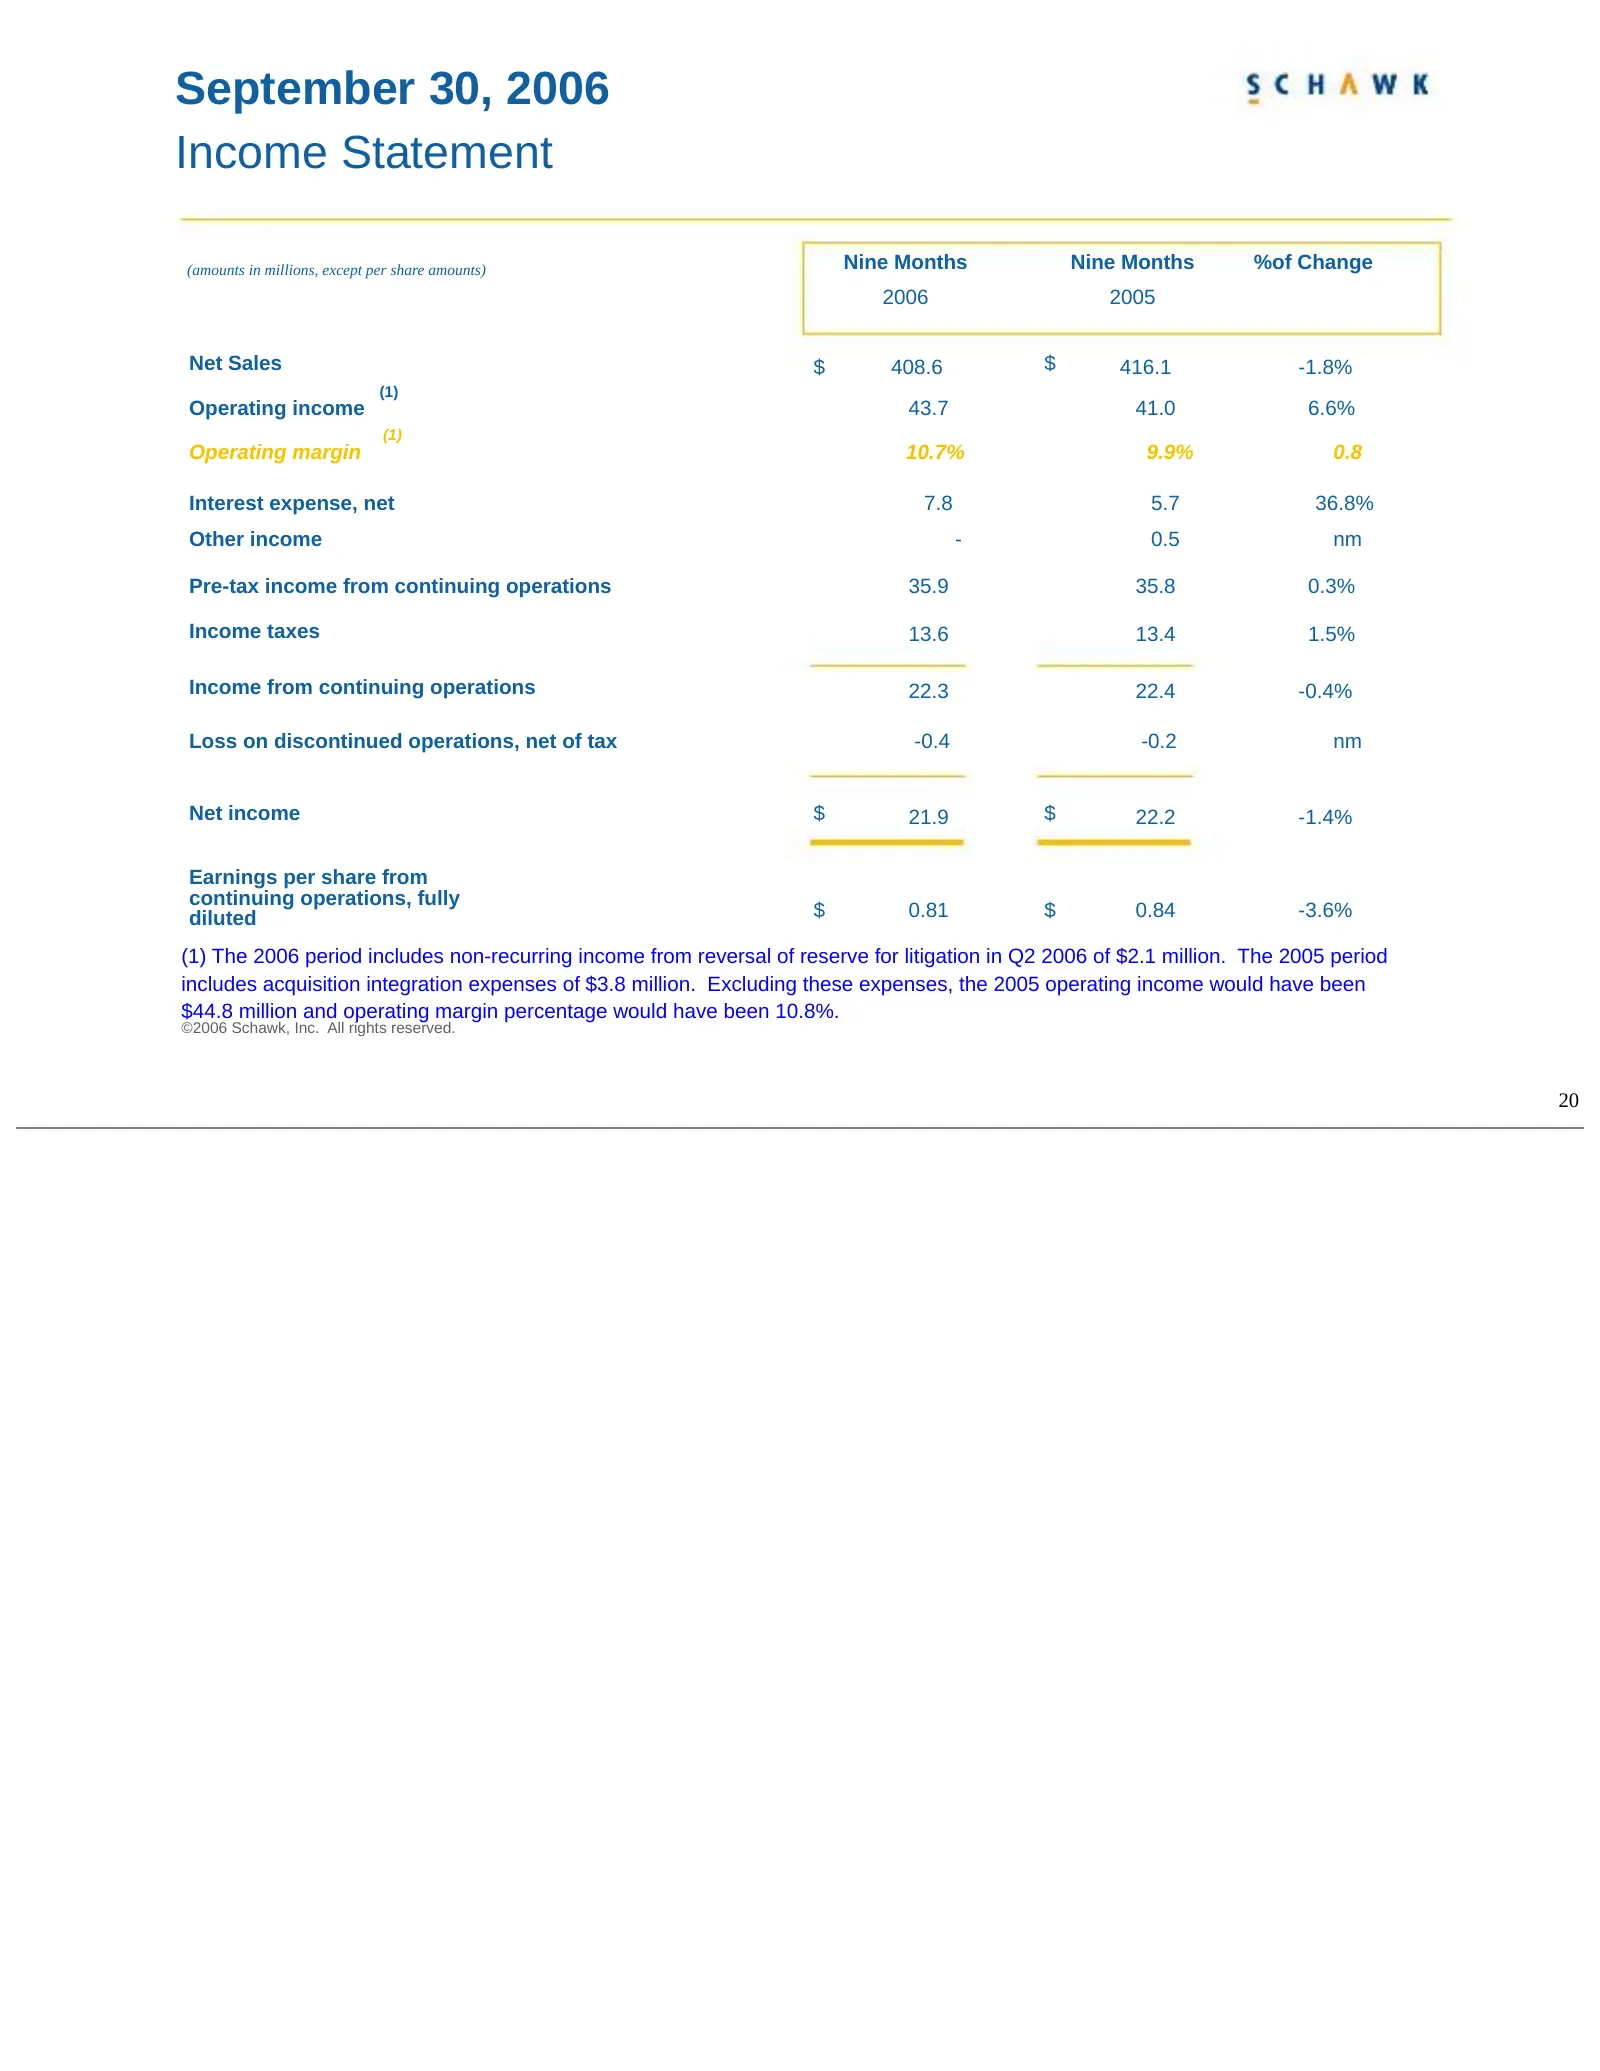
September 30, 2006 Income Statement (amounts in millions, except per share amounts) Nine Months Nine Months %of Change 2006 2005 Net Sales $ 408.6 $ 416.1 -1.8% (1) Operating income 43.7 41.0 6.6% (1) Operating margin 10.7% 9.9% 0.8 Interest expense, net 7.8 5.7 36.8% Other income - 0.5 nm Pre-tax i
Slide 22: September 30, 2006 Balance Sheet
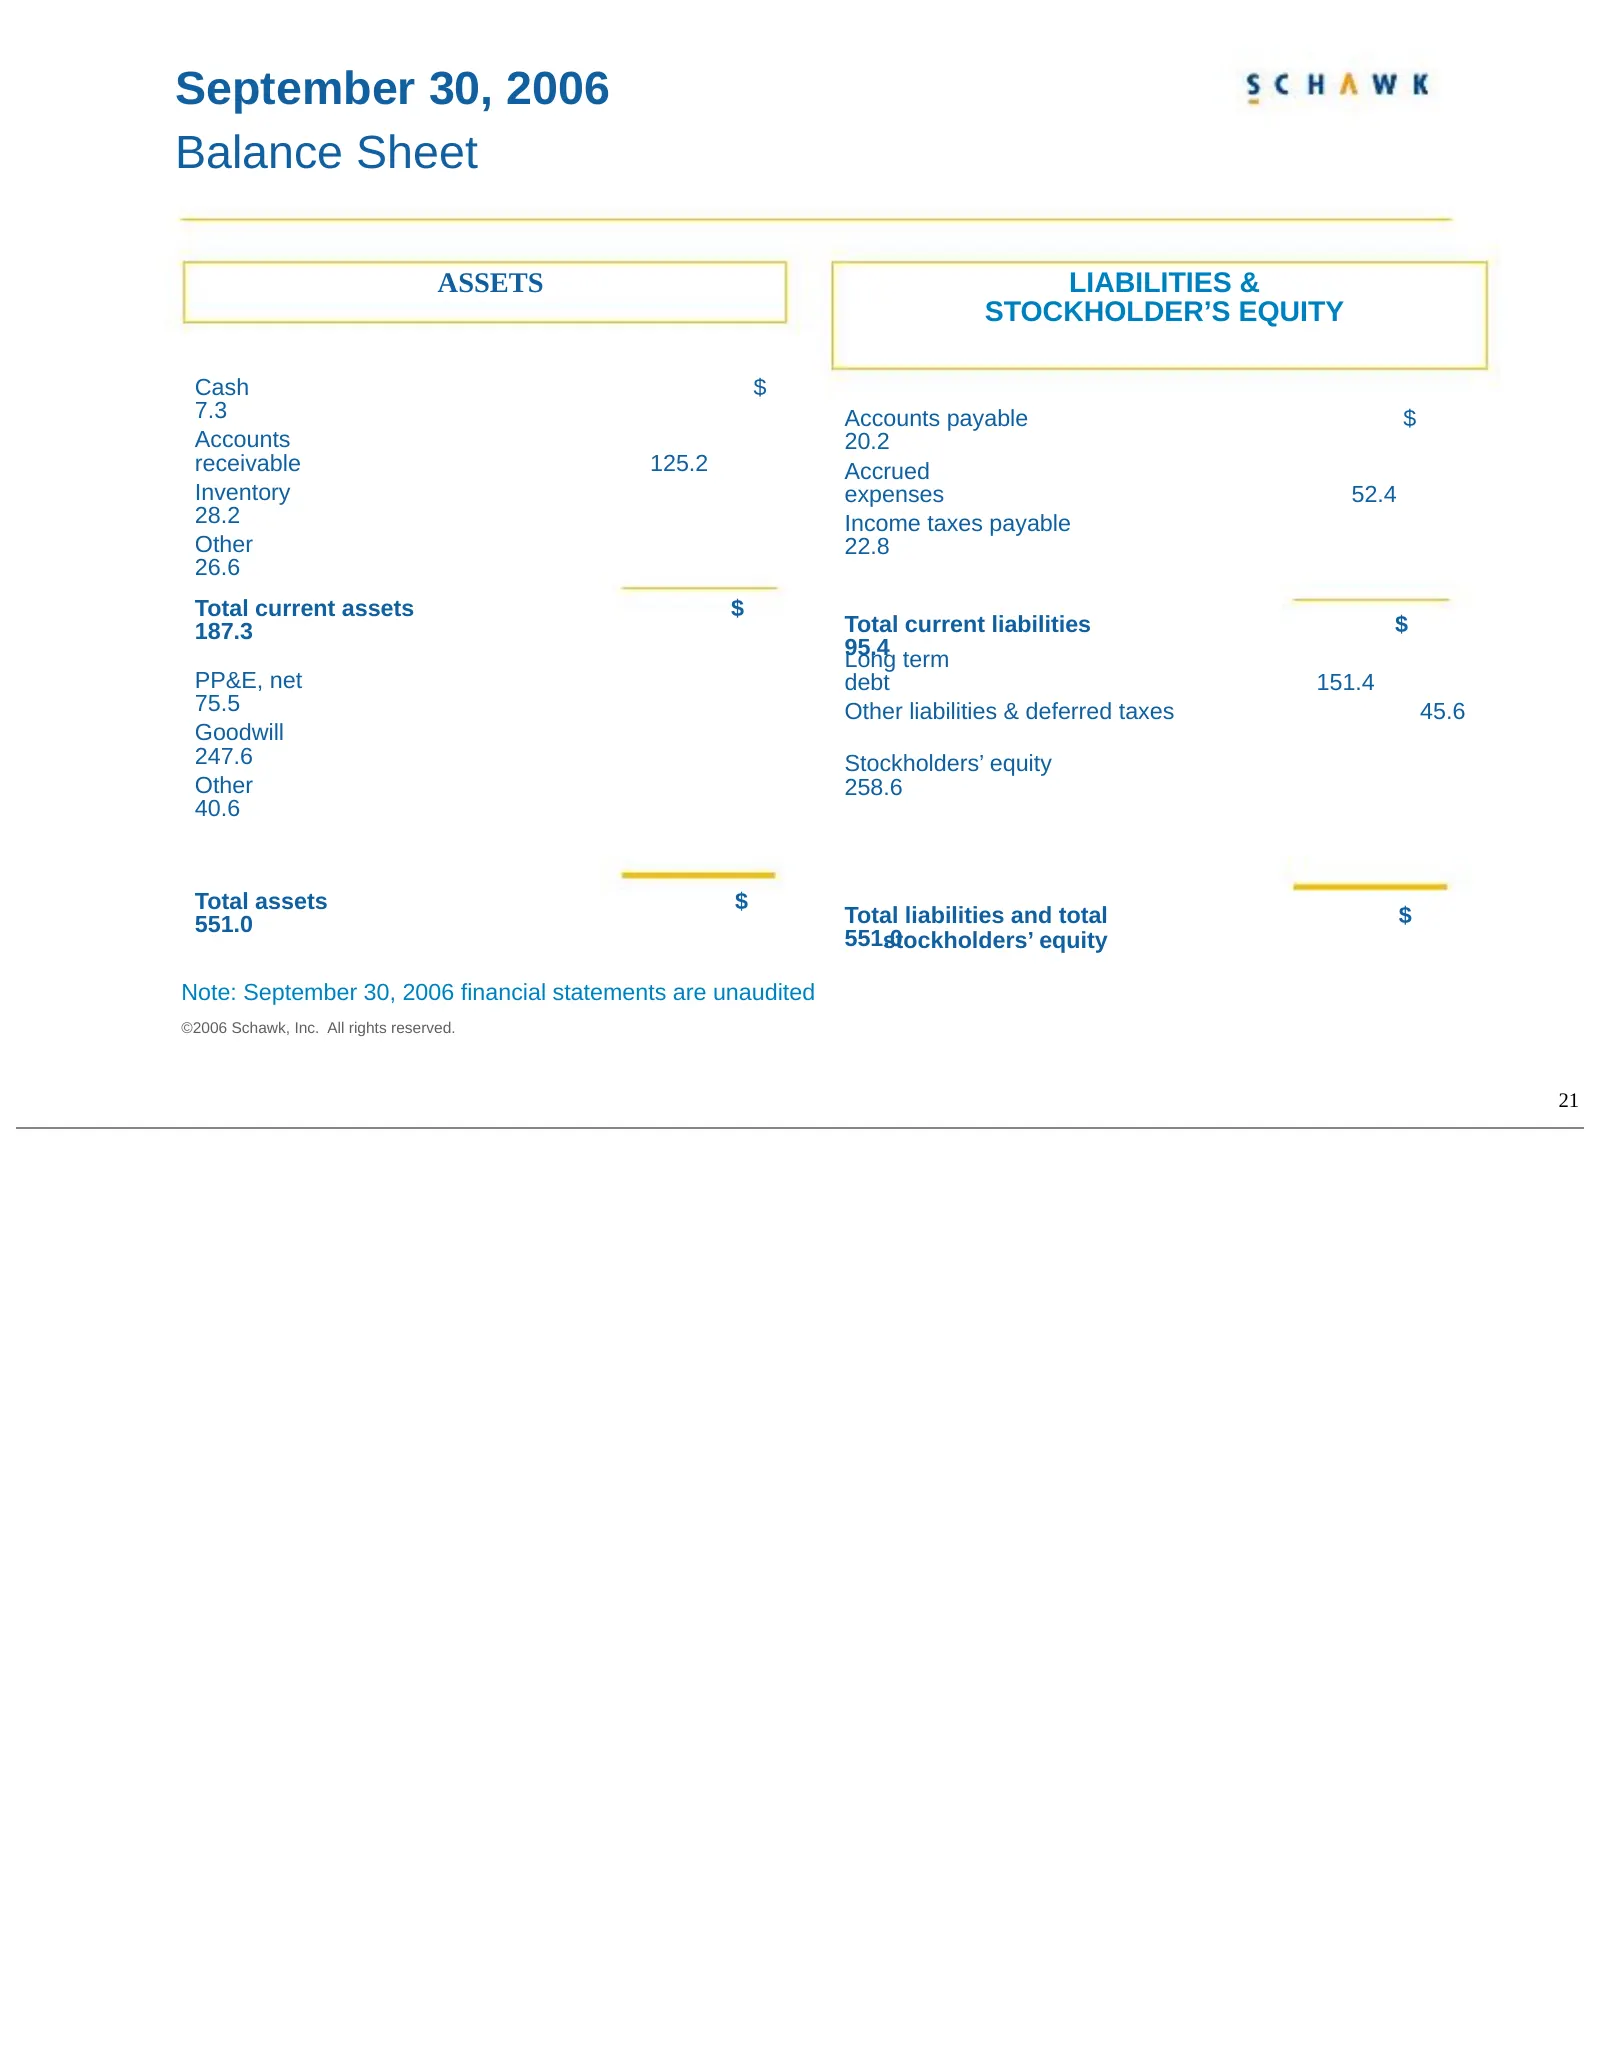
September 30, 2006 Balance Sheet ASSETS LIABILITIES & STOCKHOLDER’S EQUITY Cash $ 7.3 Accounts payable $ Accounts 20.2 receivable 125.2 Accrued Inventory expenses 52.4 28.2 Income taxes payable Other 22.8 26.6 Total current assets $ 187.3 Total current liabilities $ 95.4 Long term PP&E, net debt 151
Slide 23: Nine Months Ended September 30, 2006: Items Impacting Revenue
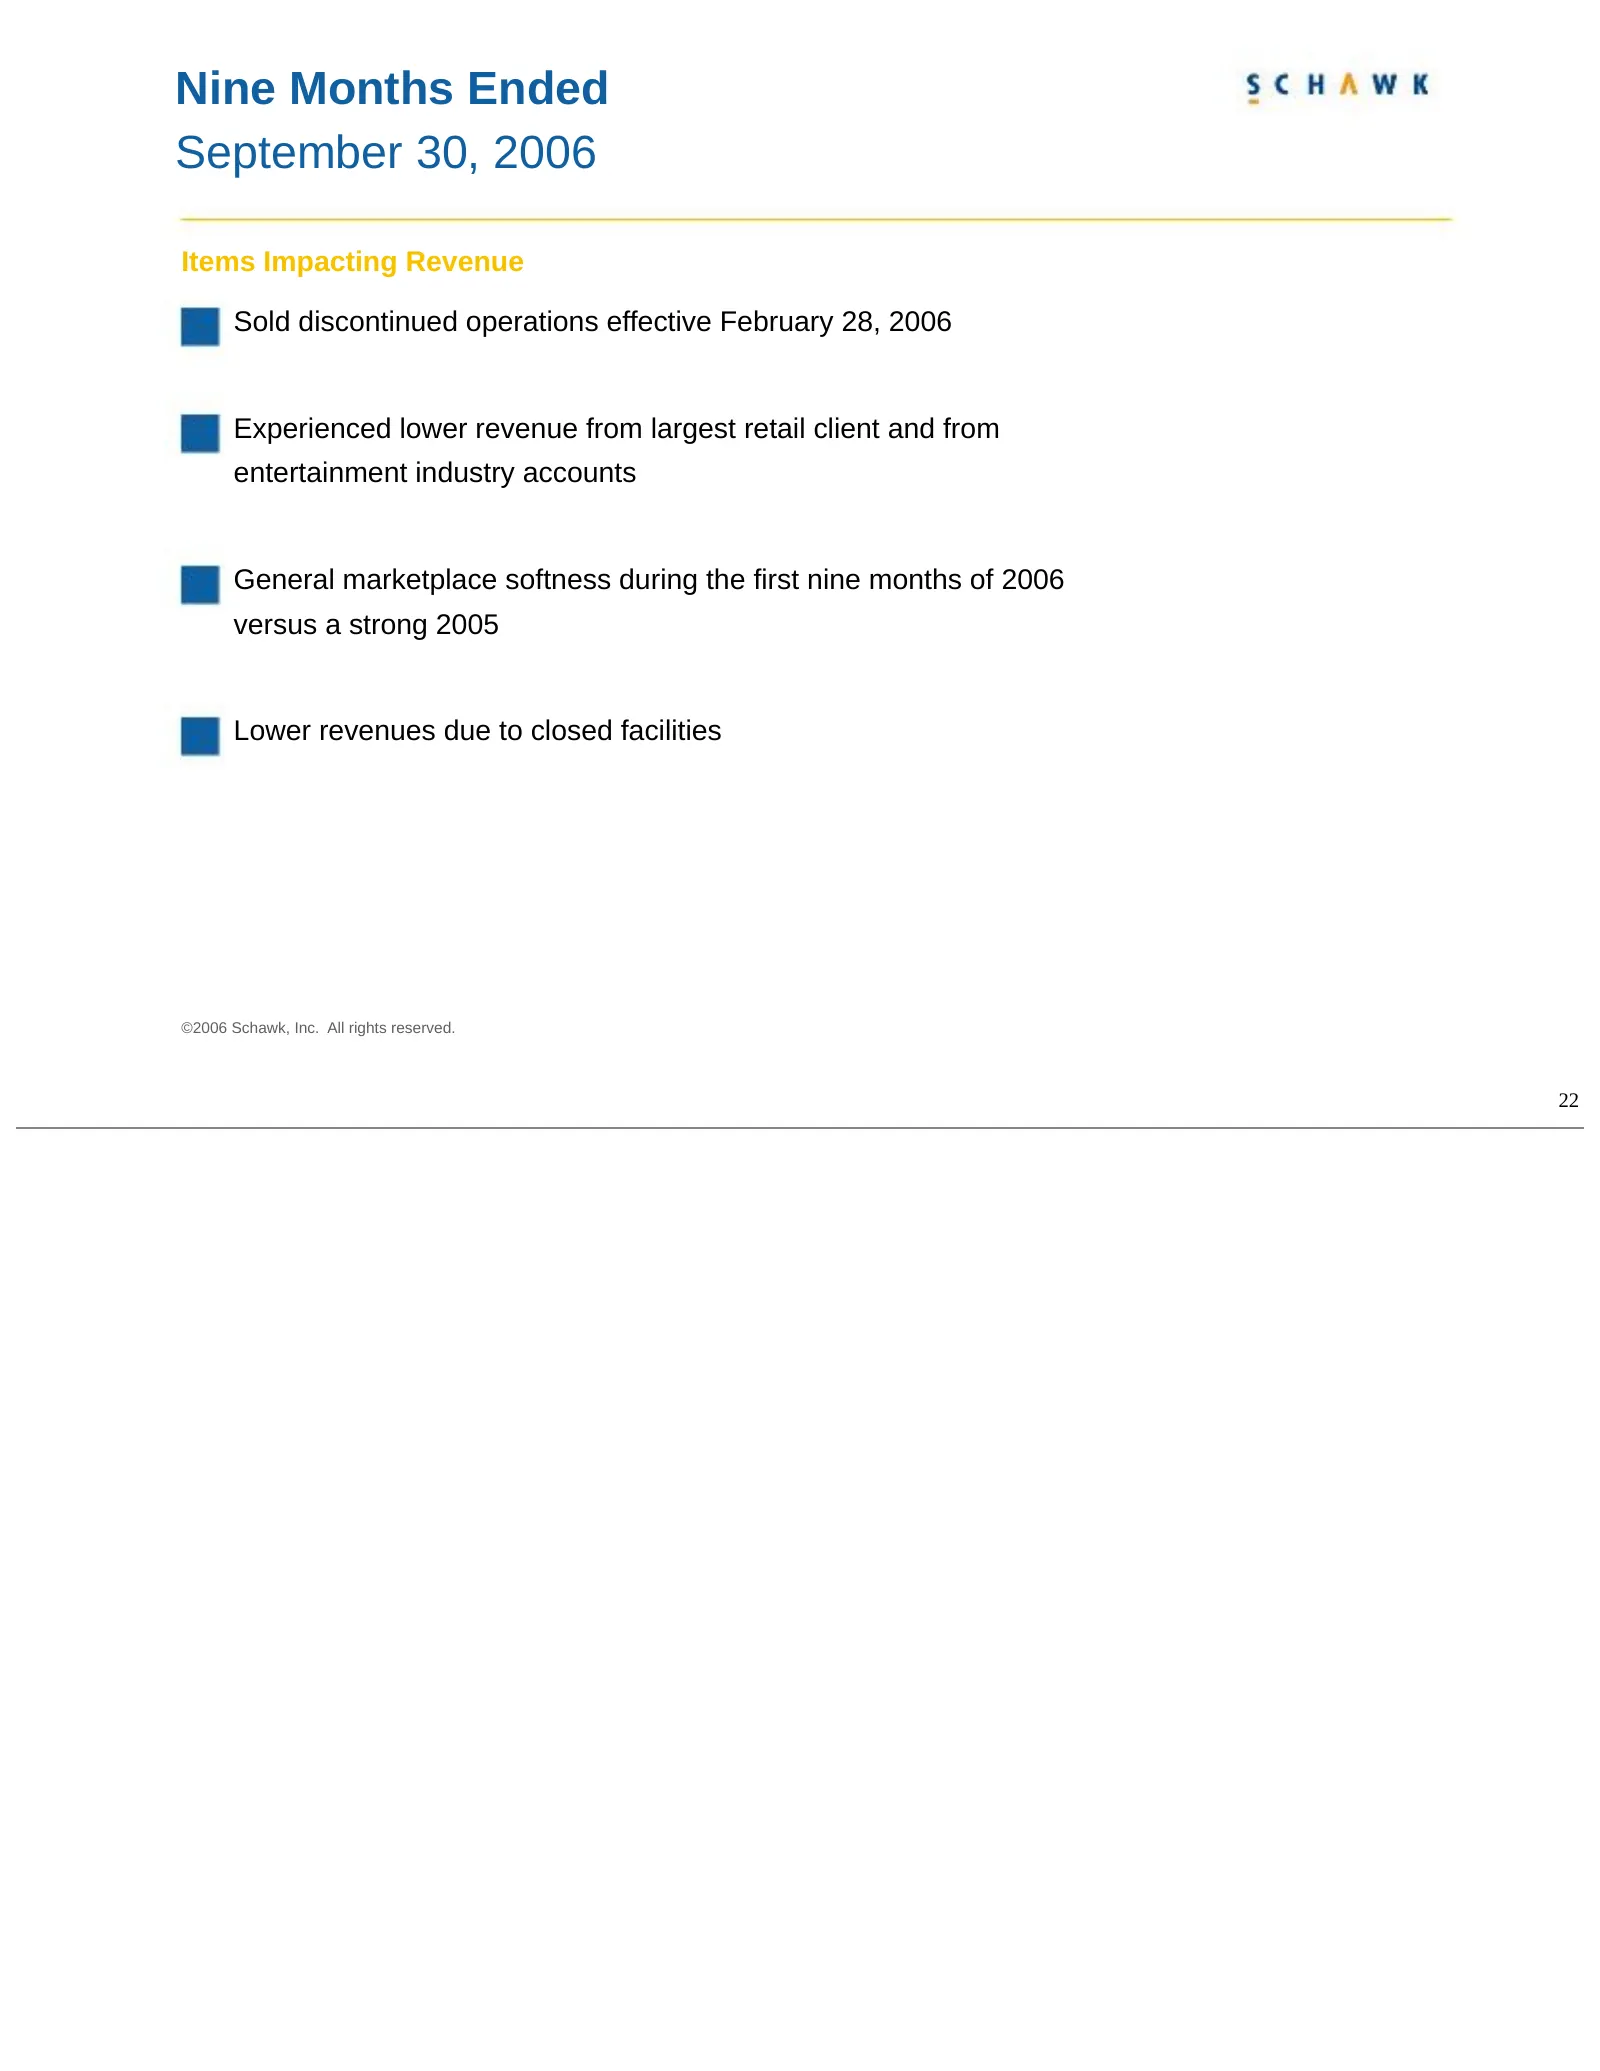
Nine Months Ended September 30, 2006 Items Impacting Revenue Sold discontinued operations effective February 28, 2006 Experienced lower revenue from largest retail client and from entertainment industry accounts General marketplace softness during the first nine months of 2006 versus a strong 2005 L
Slide 24: Nine Months Ended September 30, 2006: Items Impacting Operating Income
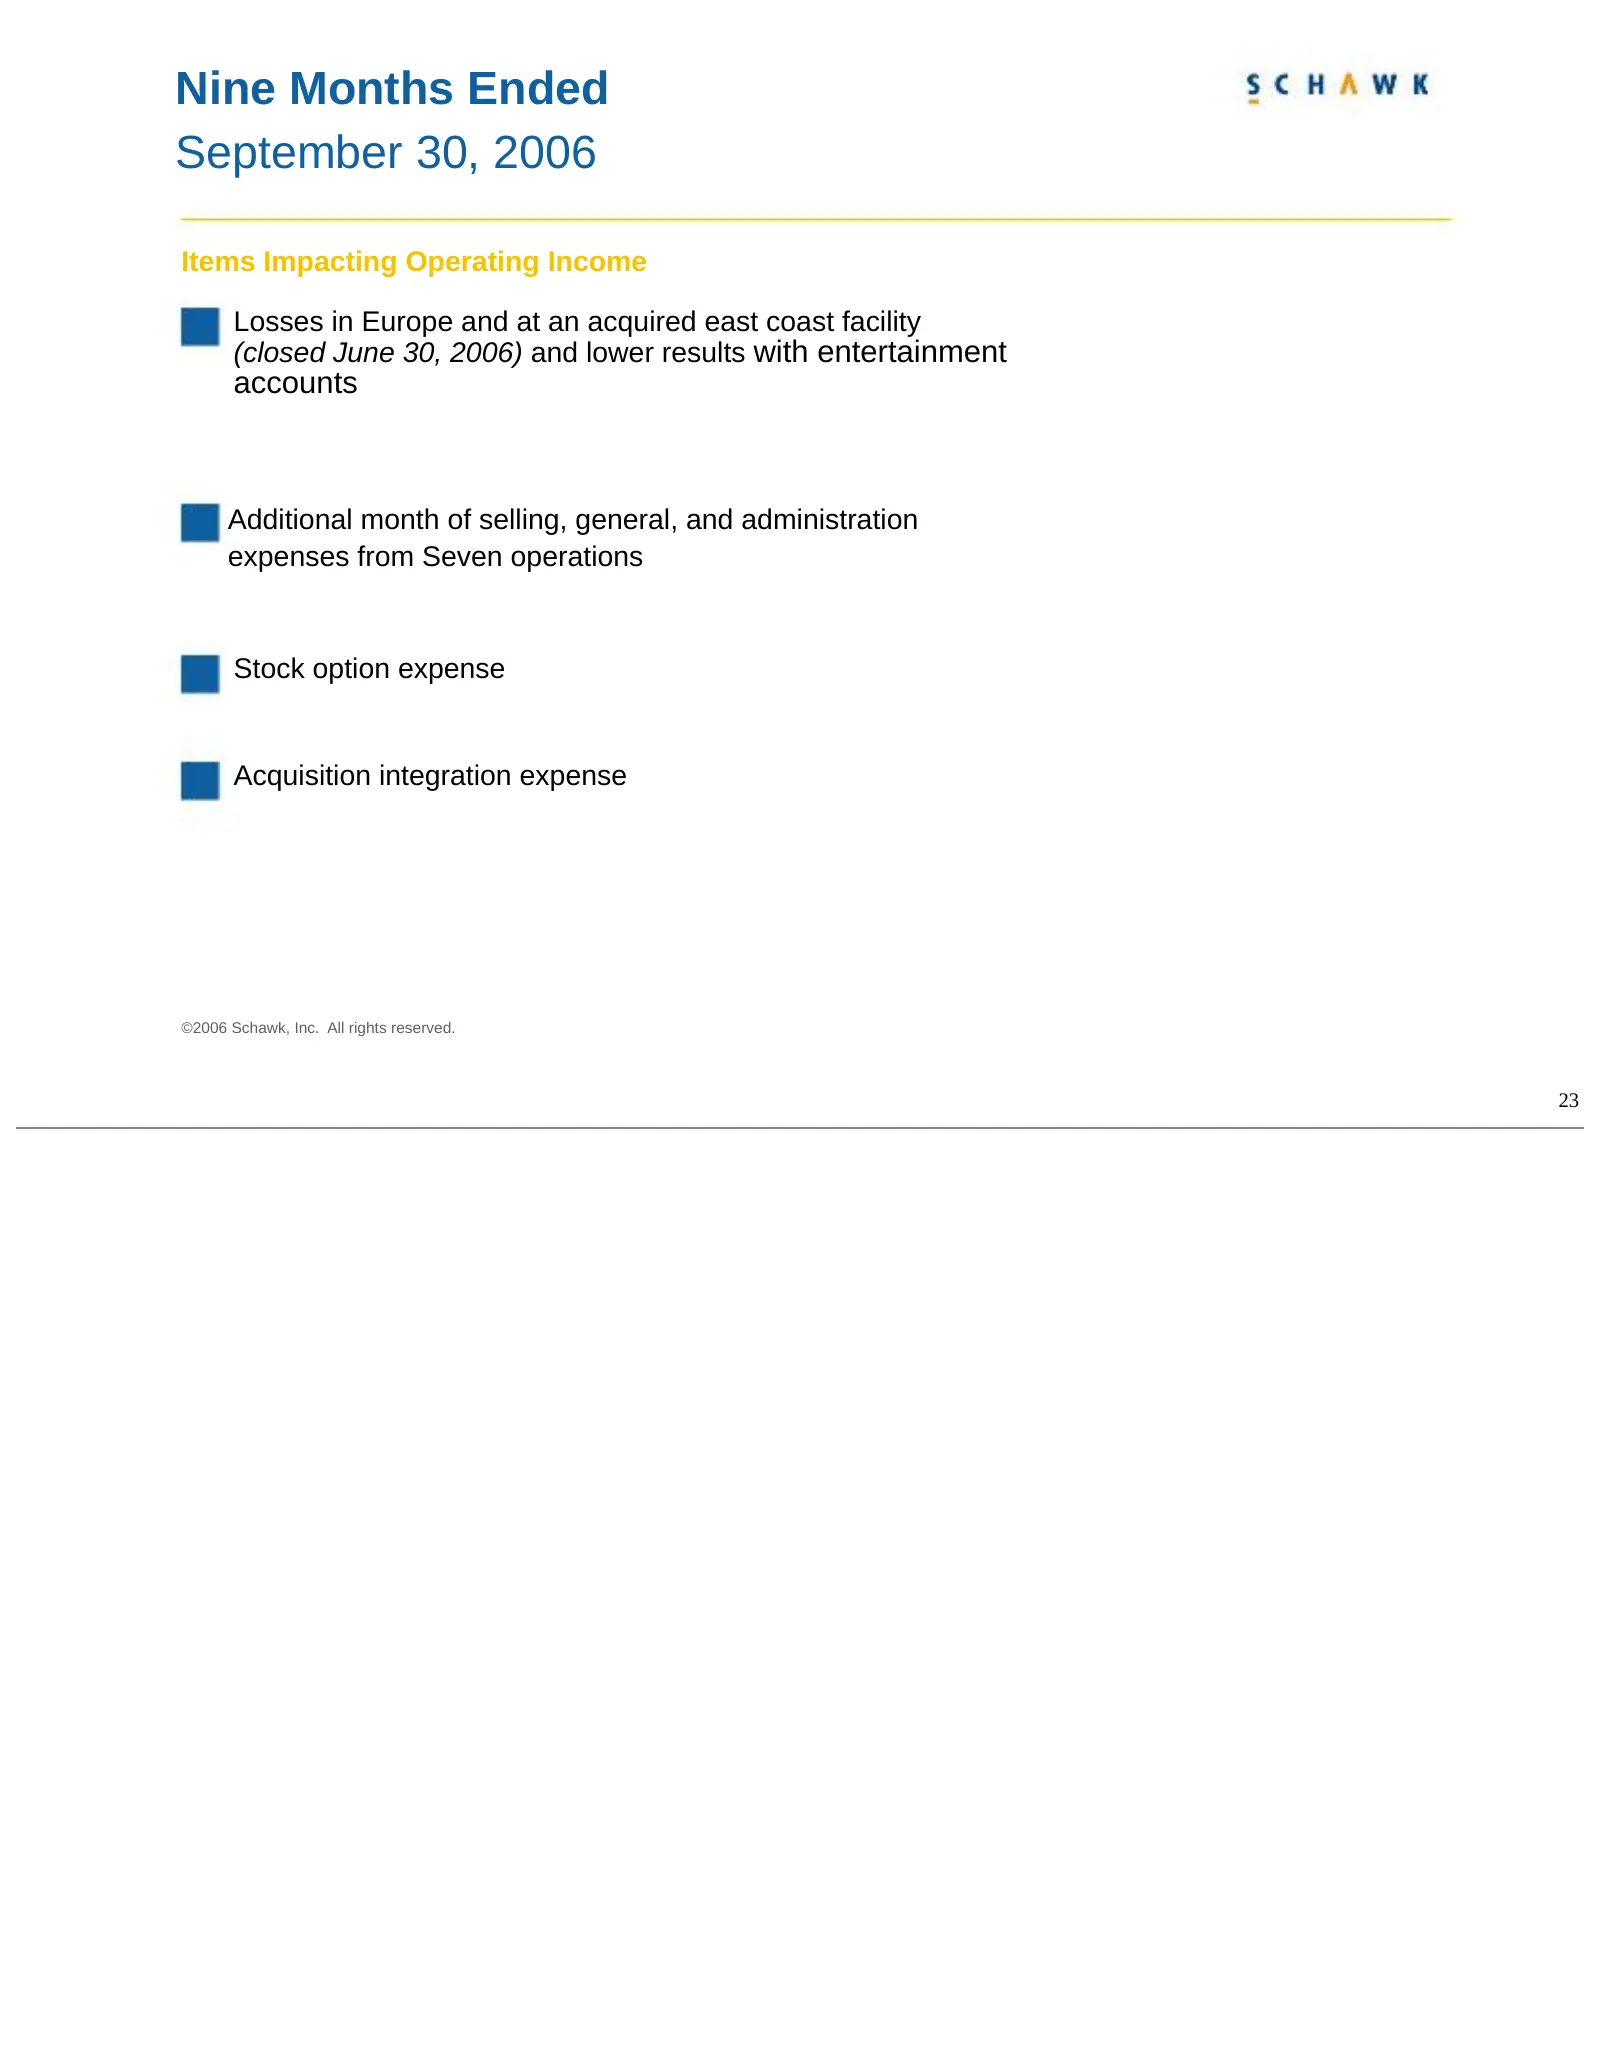
Nine Months Ended September 30, 2006 Items Impacting Operating Income Losses in Europe and at an acquired east coast facility (closed June 30, 2006) and lower results with entertainment accounts Additional month of selling, general, and administration expenses from Seven operations Stock option expe
Slide 25: Key Items For Q4 2006 and 2007
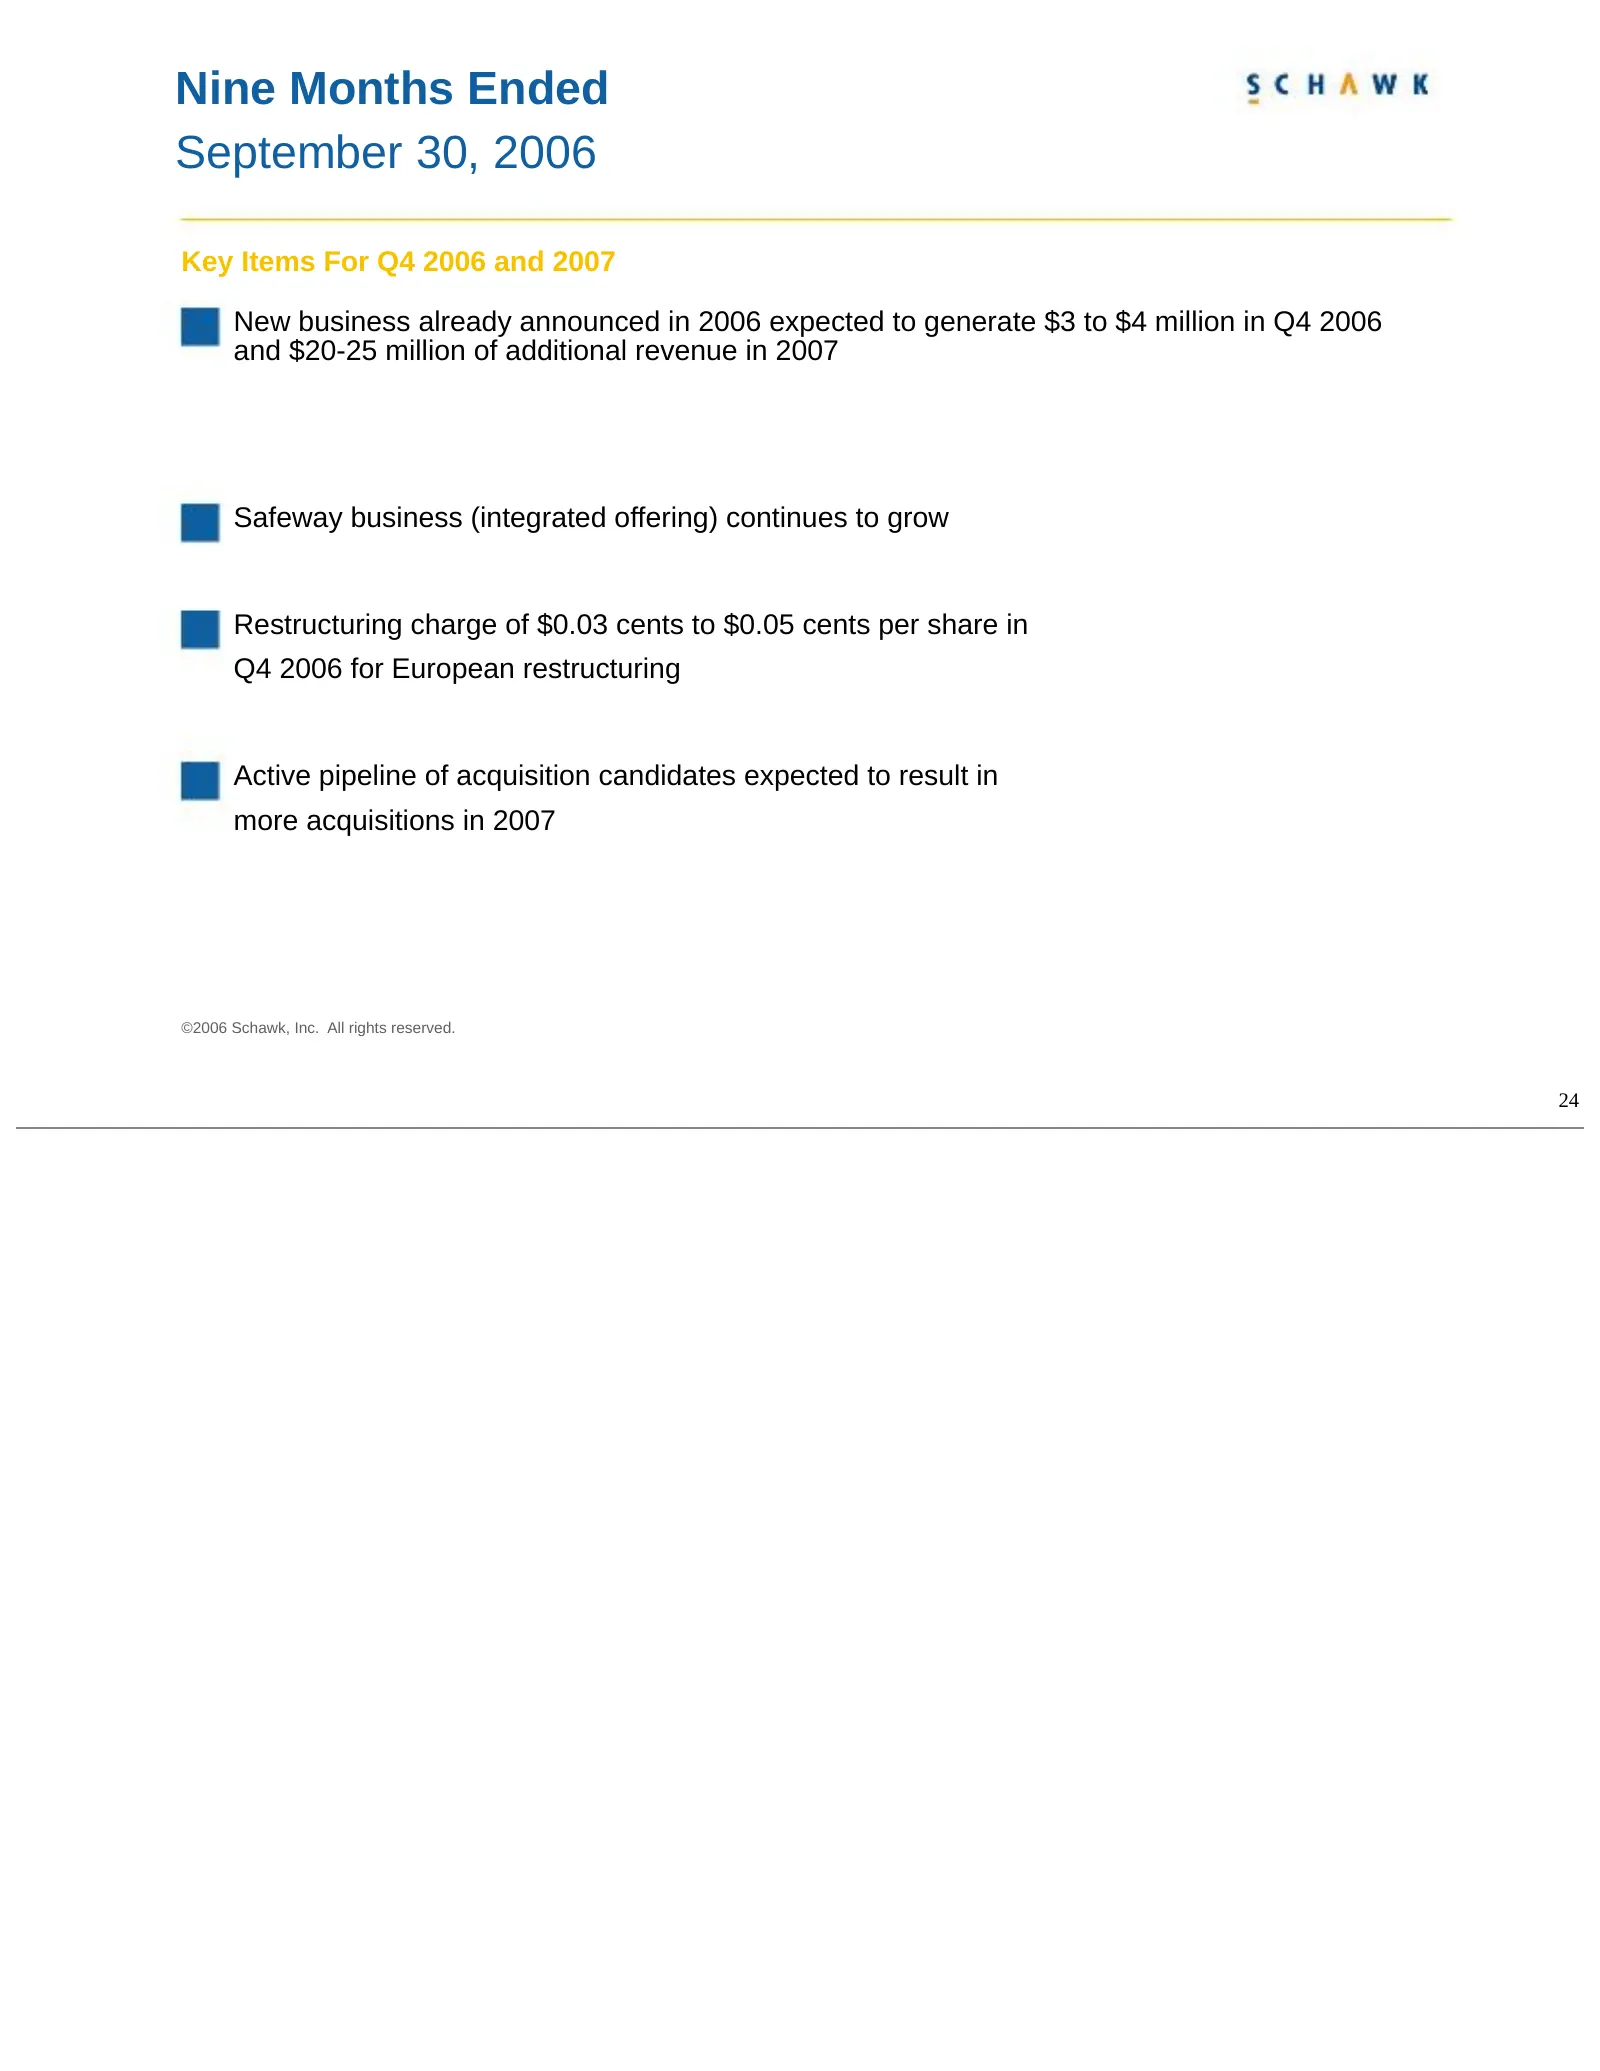
Nine Months Ended September 30, 2006 Key Items For Q4 2006 and 2007 New business already announced in 2006 expected to generate $3 to $4 million in Q4 2006 and $20-25 million of additional revenue in 2007 Safeway business (integrated offering) continues to grow Restructuring charge of $0.03 cents to
Slide 26: Business Awards
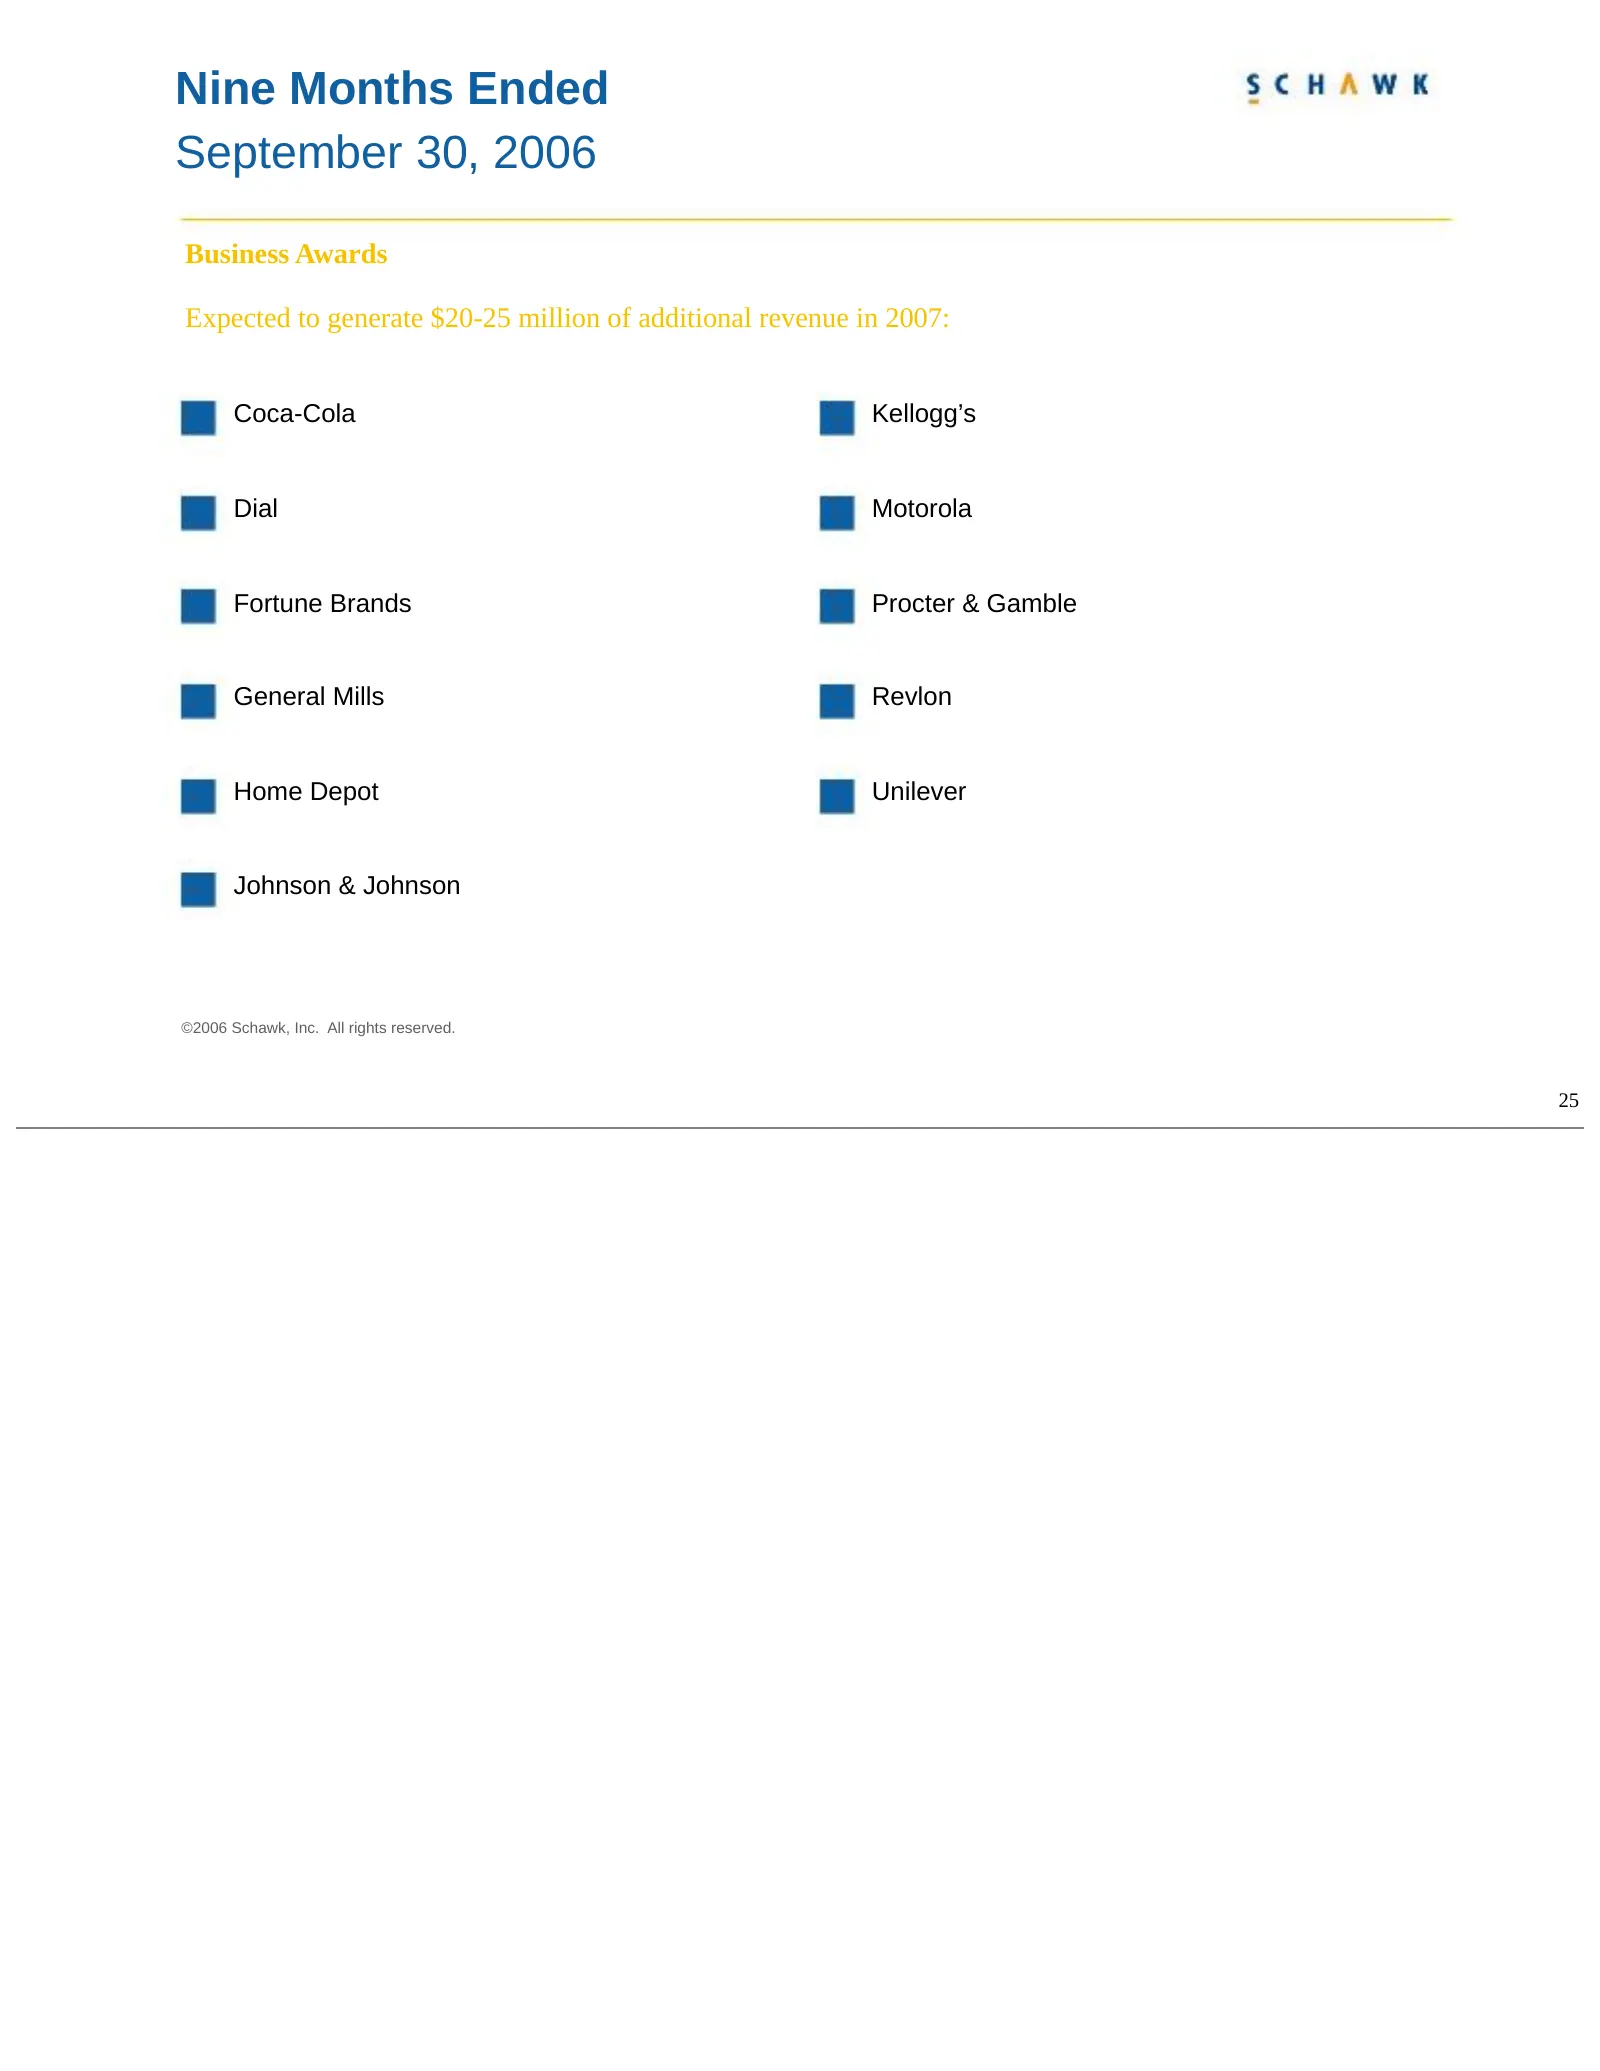
Nine Months Ended September 30, 2006 Business Awards Expected to generate $20-25 million of additional revenue in 2007: Coca-Cola Kellogg’s Dial Motorola Fortune Brands Procter & Gamble General Mills Revlon Home Depot Unilever Johnson & Johnson ©2006 Schawk, Inc. All rights reserved. 25
Slide 27: Recent 2006 Client Wins
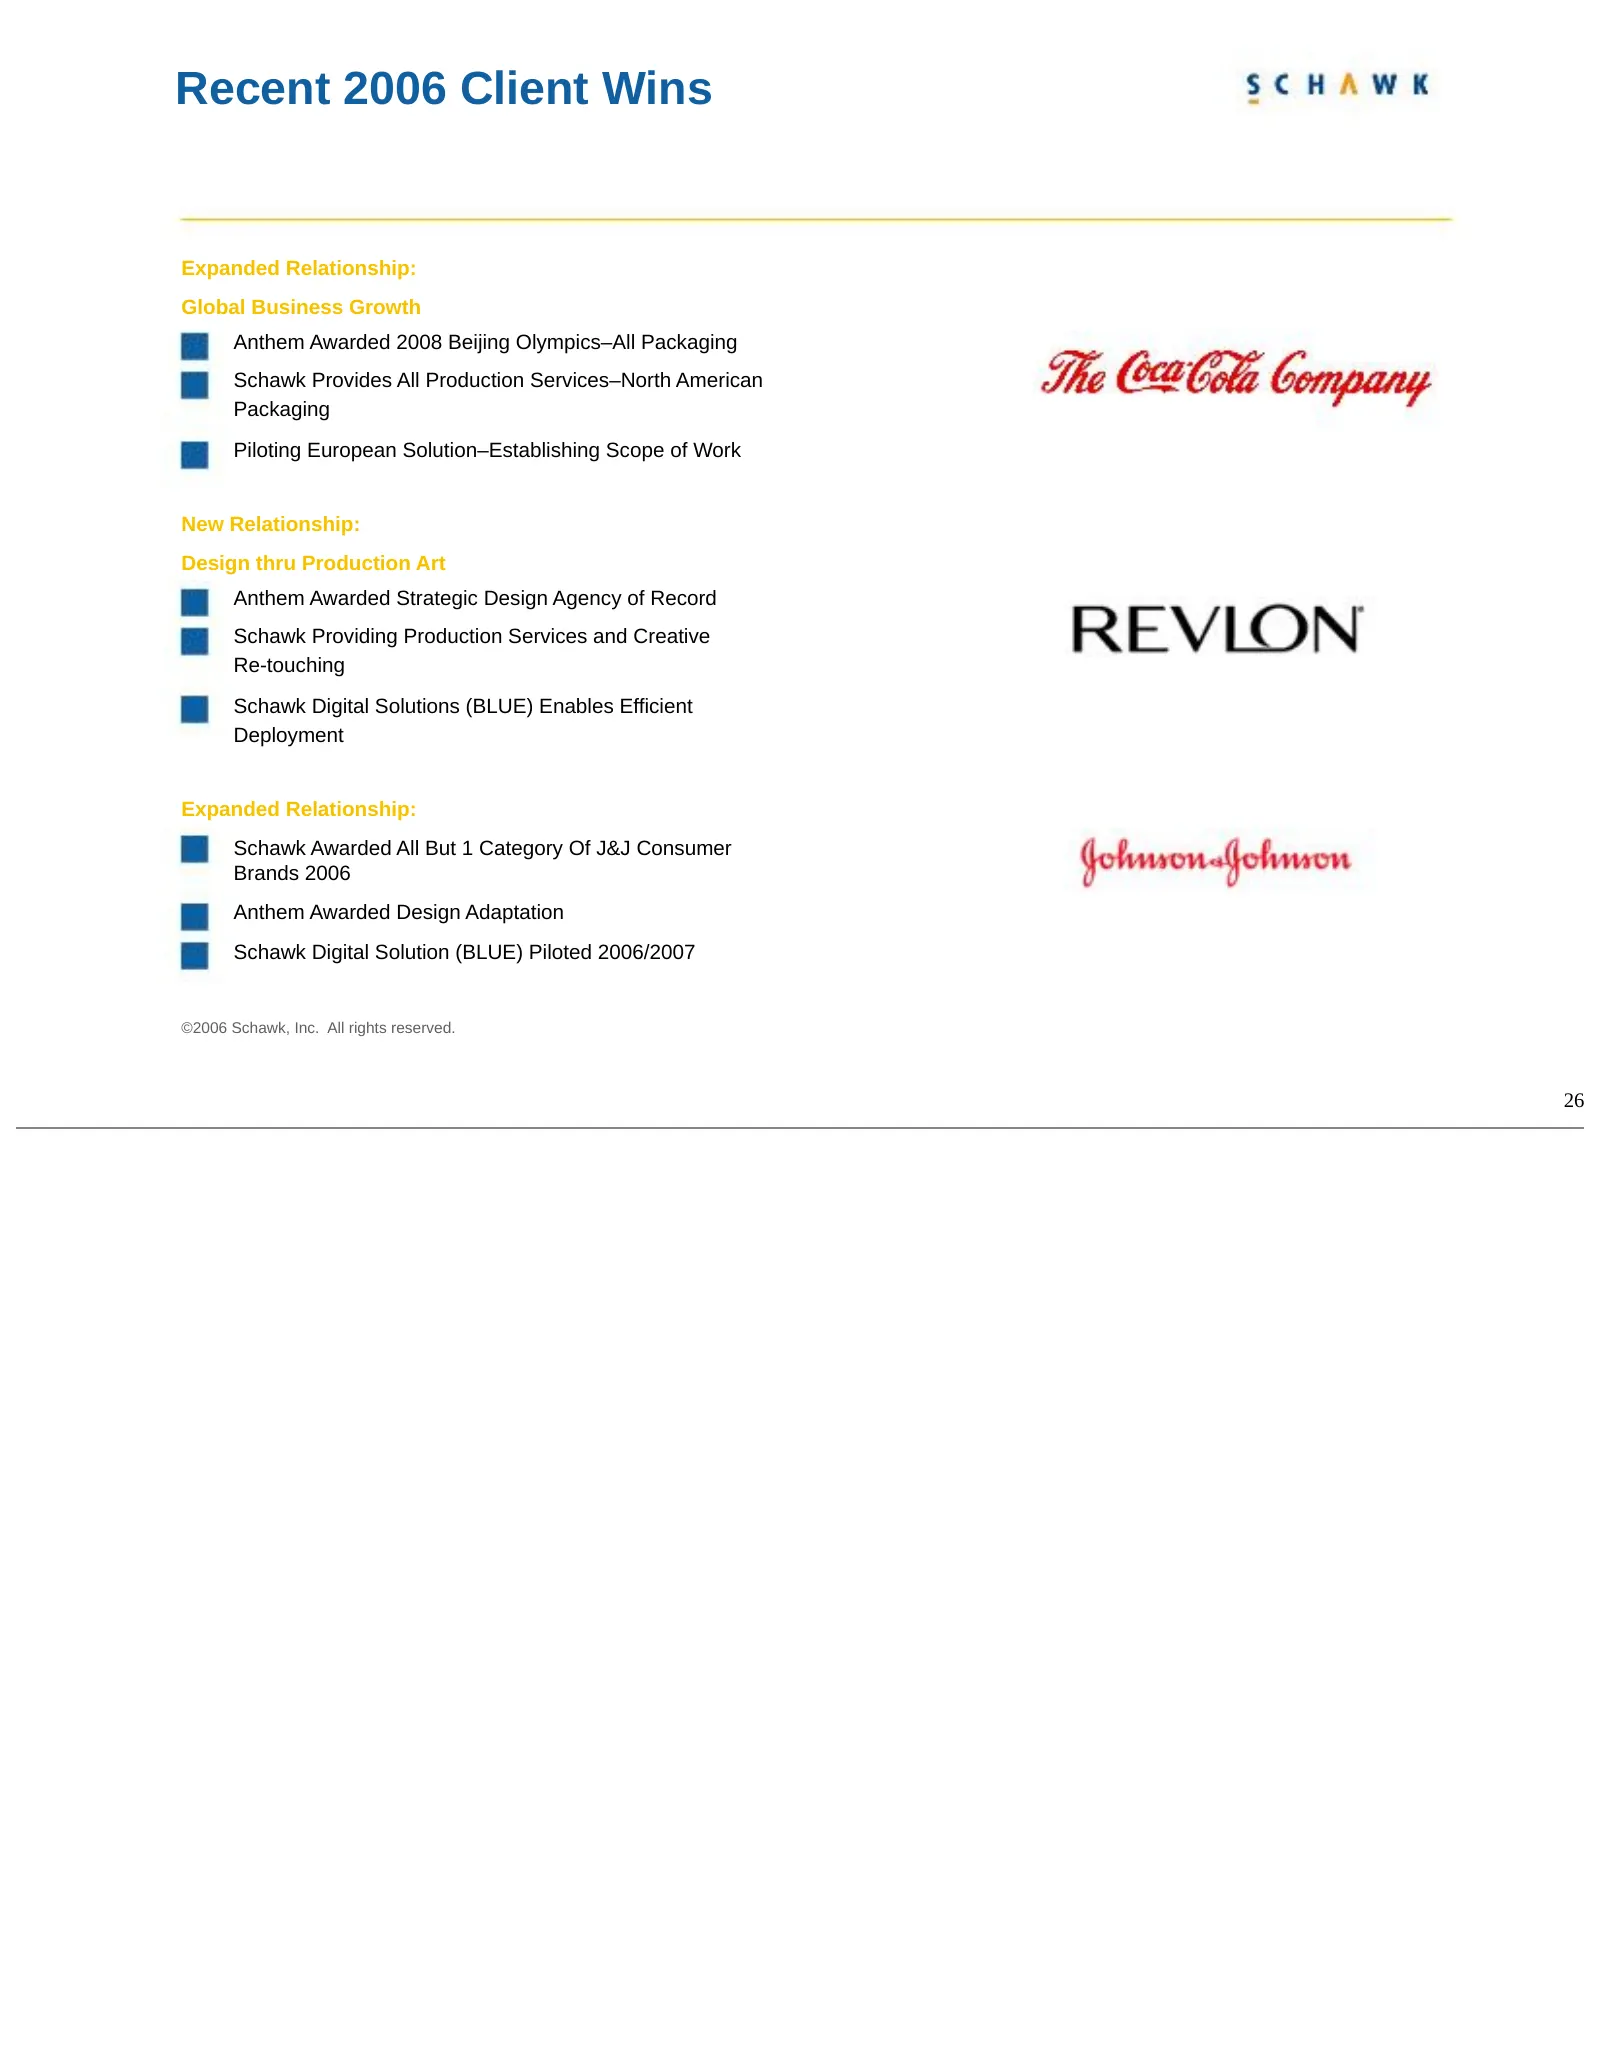
Recent 2006 Client Wins Expanded Relationship: Global Business Growth Anthem Awarded 2008 Beijing Olympics–All Packaging Schawk Provides All Production Services–North American Packaging Piloting European Solution–Establishing Scope of Work New Relationship: Design thru Production Art Anthem Awarded
Slide 28: Investor Highlights
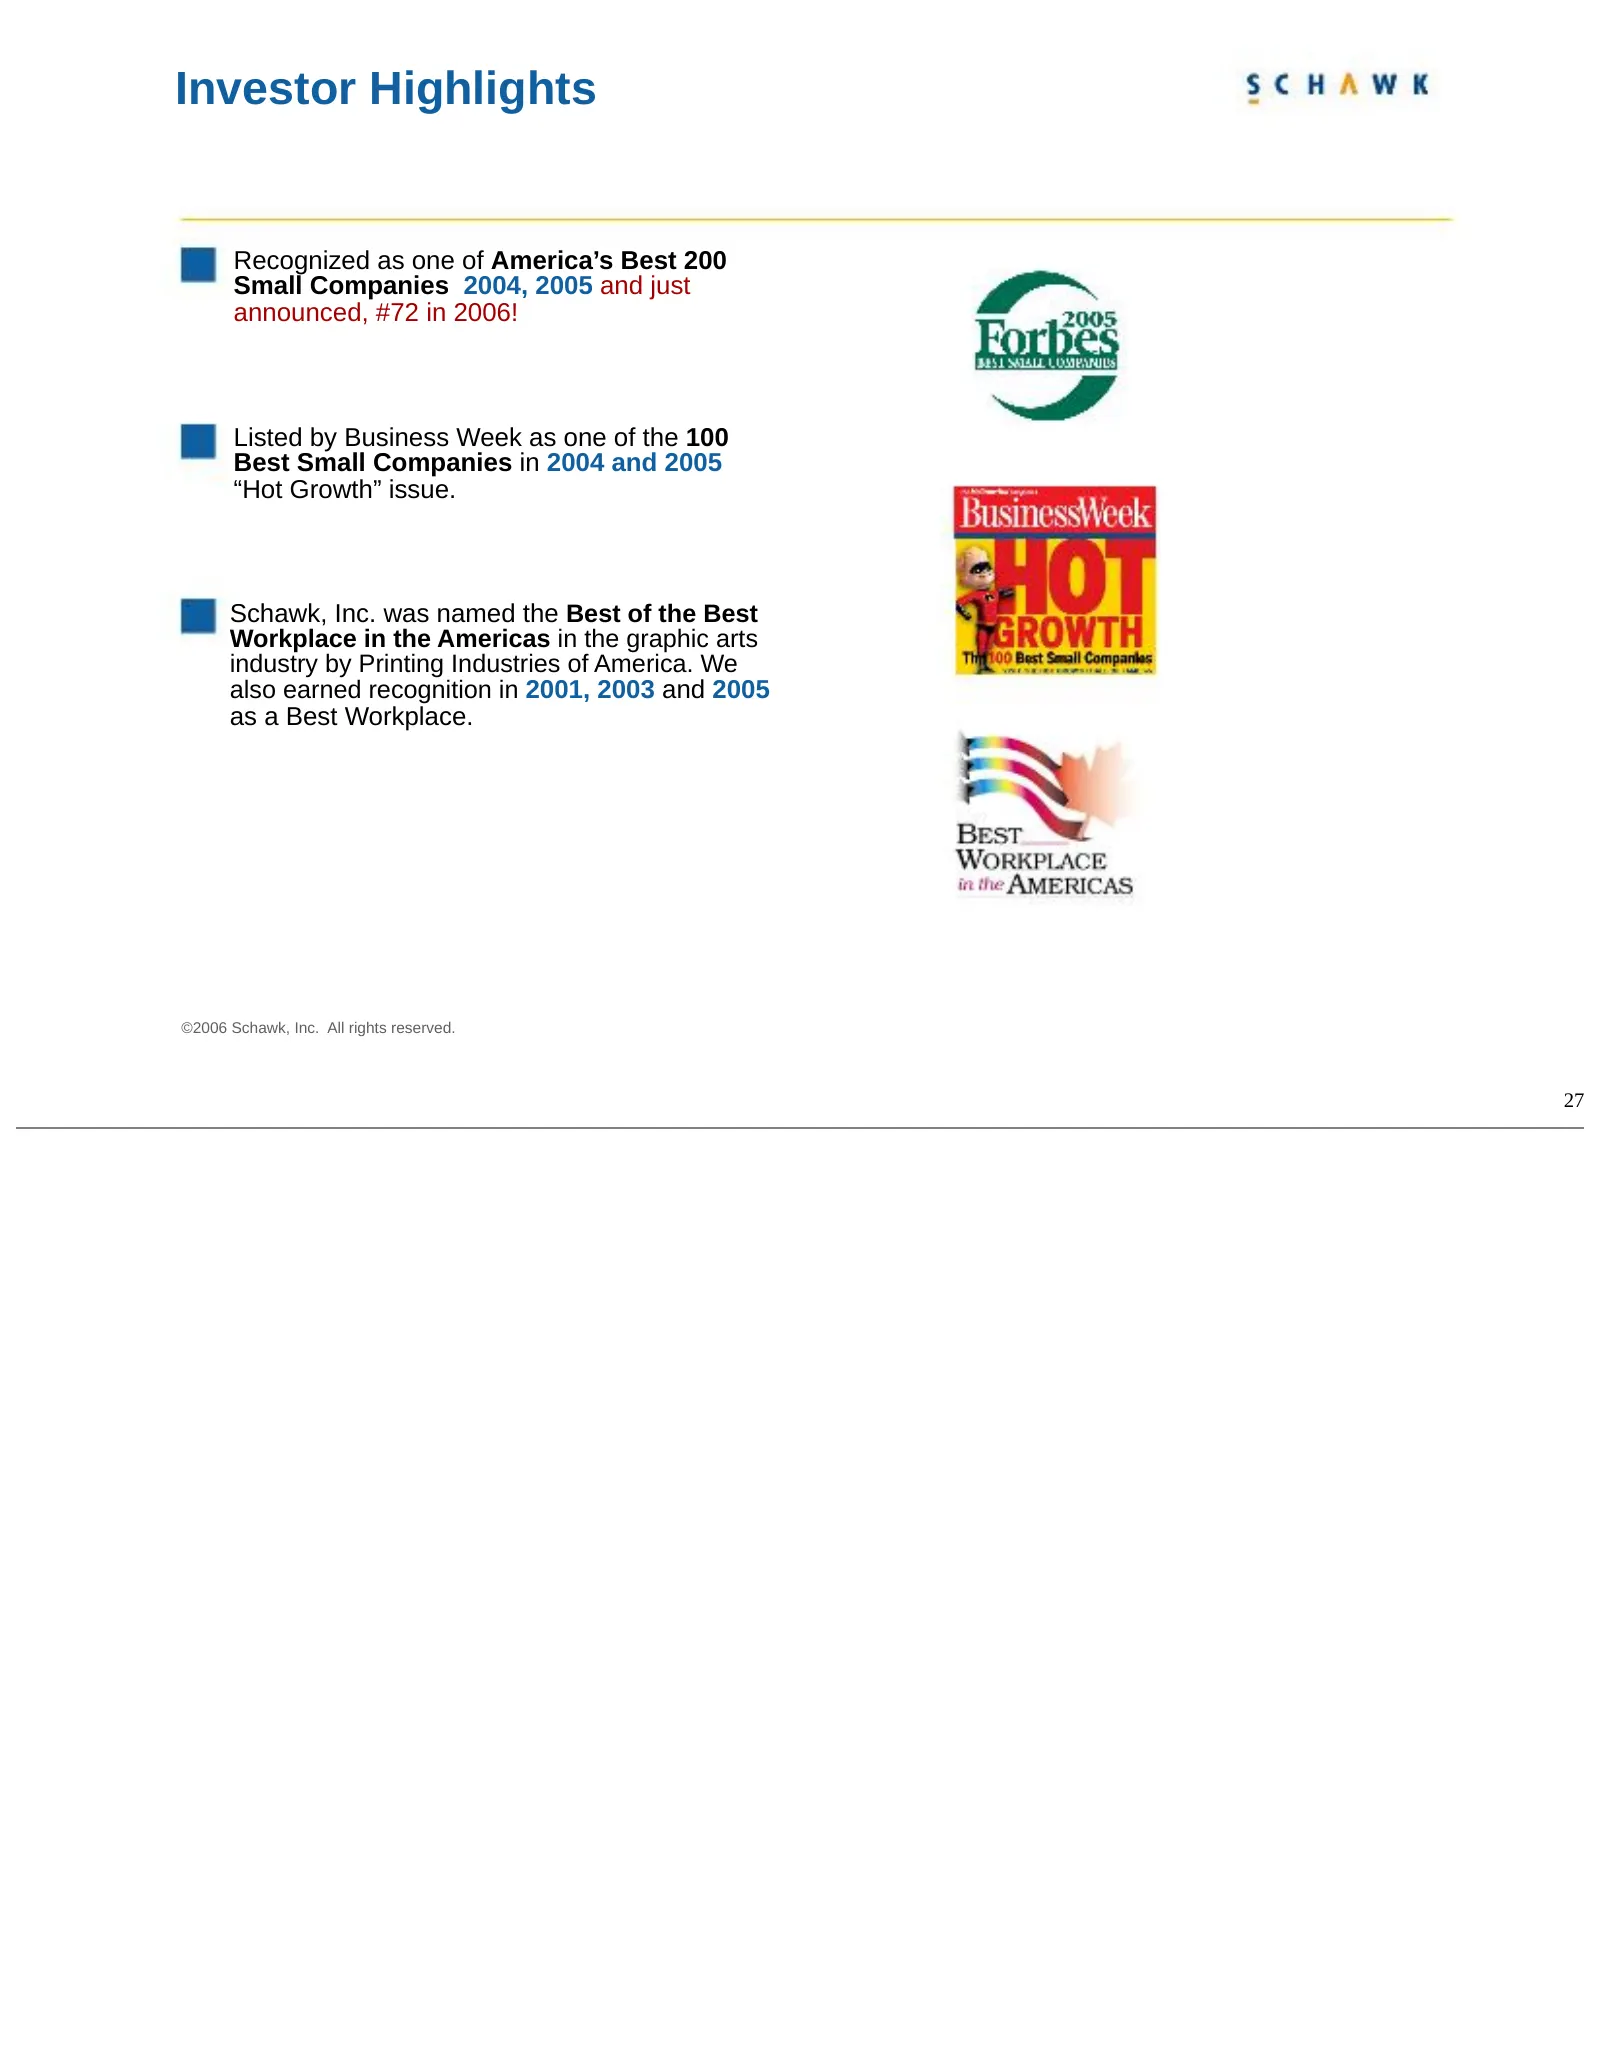
Investor Highlights Recognized as one of America’s Best 200 Small Companies 2004, 2005 and just announced, #72 in 2006! Listed by Business Week as one of the 100 Best Small Companies in 2004 and 2005 “Hot Growth” issue. Schawk, Inc. was named the Best of the Best Workplace in the Americas in the gra
Slide 29: Investor Highlights (continued)
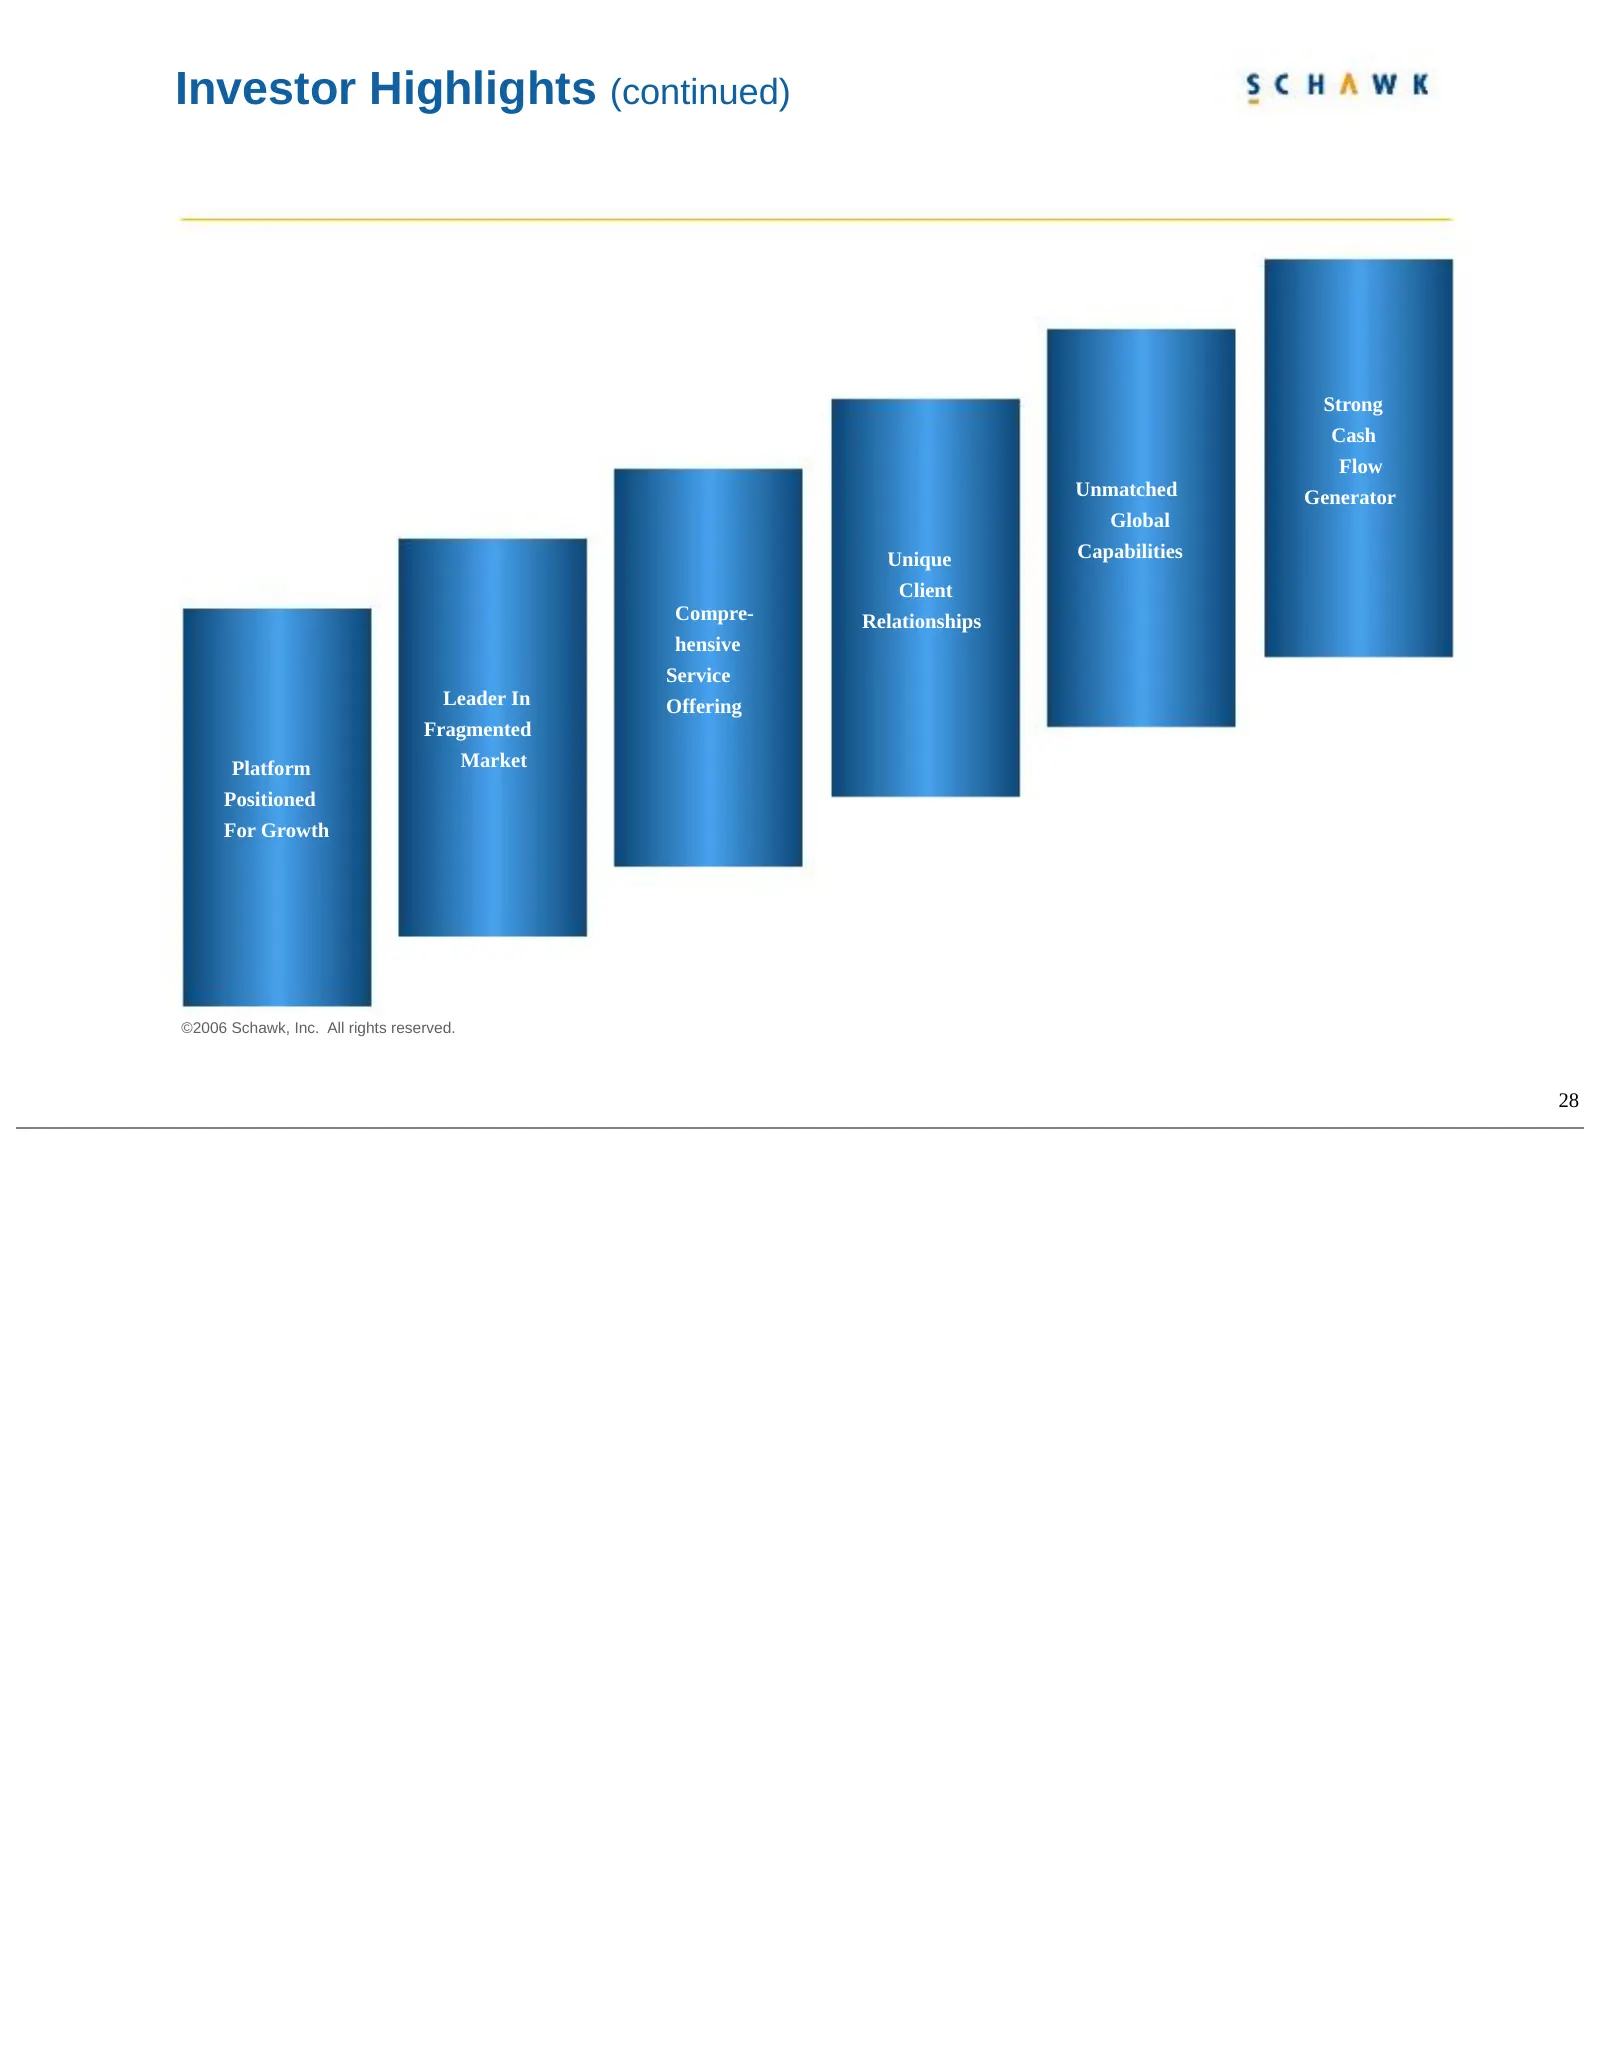
Investor Highlights (continued) Strong Cash Flow Unmatched Generator Global Unique Capabilities Client Compre- Relationships hensive Service Leader In Offering Fragmented Platform Market Positioned For Growth ©2006 Schawk, Inc. All rights reserved. 28
Slide 30: Thank You!
Thank You! ©2006 Schawk, Inc. All rights reserved.

Slide 31
Source: SEC EDGAR · 8-K filed Nov 7, 2006
More decks from Schawk Inc
 Investor Presentation (December 2009)25 slides · Dec 9, 2009
 Investor Presentation (December 2008)20 slides · Dec 2, 2008
 Investor Presentation (November 2008)20 slides · Nov 19, 2008
 5th Annual Boston Emerging Growth Institutional Investor Forum (June 2008)22 slides · Jun 3, 2008
 Shareholder Meeting (May 2008)12 slides · May 21, 2008