Rexel SA · EURONEXT:RXL
Rexel SA — Q2 2014 Earnings Presentation
50 slides from Rexel SA's earnings presentation, Jul 30, 2014
Slide 1: Q2 & H1 2014 Results (unaudited)
Q2 & H1 2014 RESULTS (unaudited) July 30, 2014 Consolidated financial statements as of June 30, 2014 were authorized for issue by the Board of Directors held on July 29, 2014. They have been subjected to a limited review by Rexel’s statutory auditors.
Slide 2: Results at a glance
RESULTS AT A GLANCE Ce a world of energy = Flies MOTION
Slide 3: Q2 2014 highlights
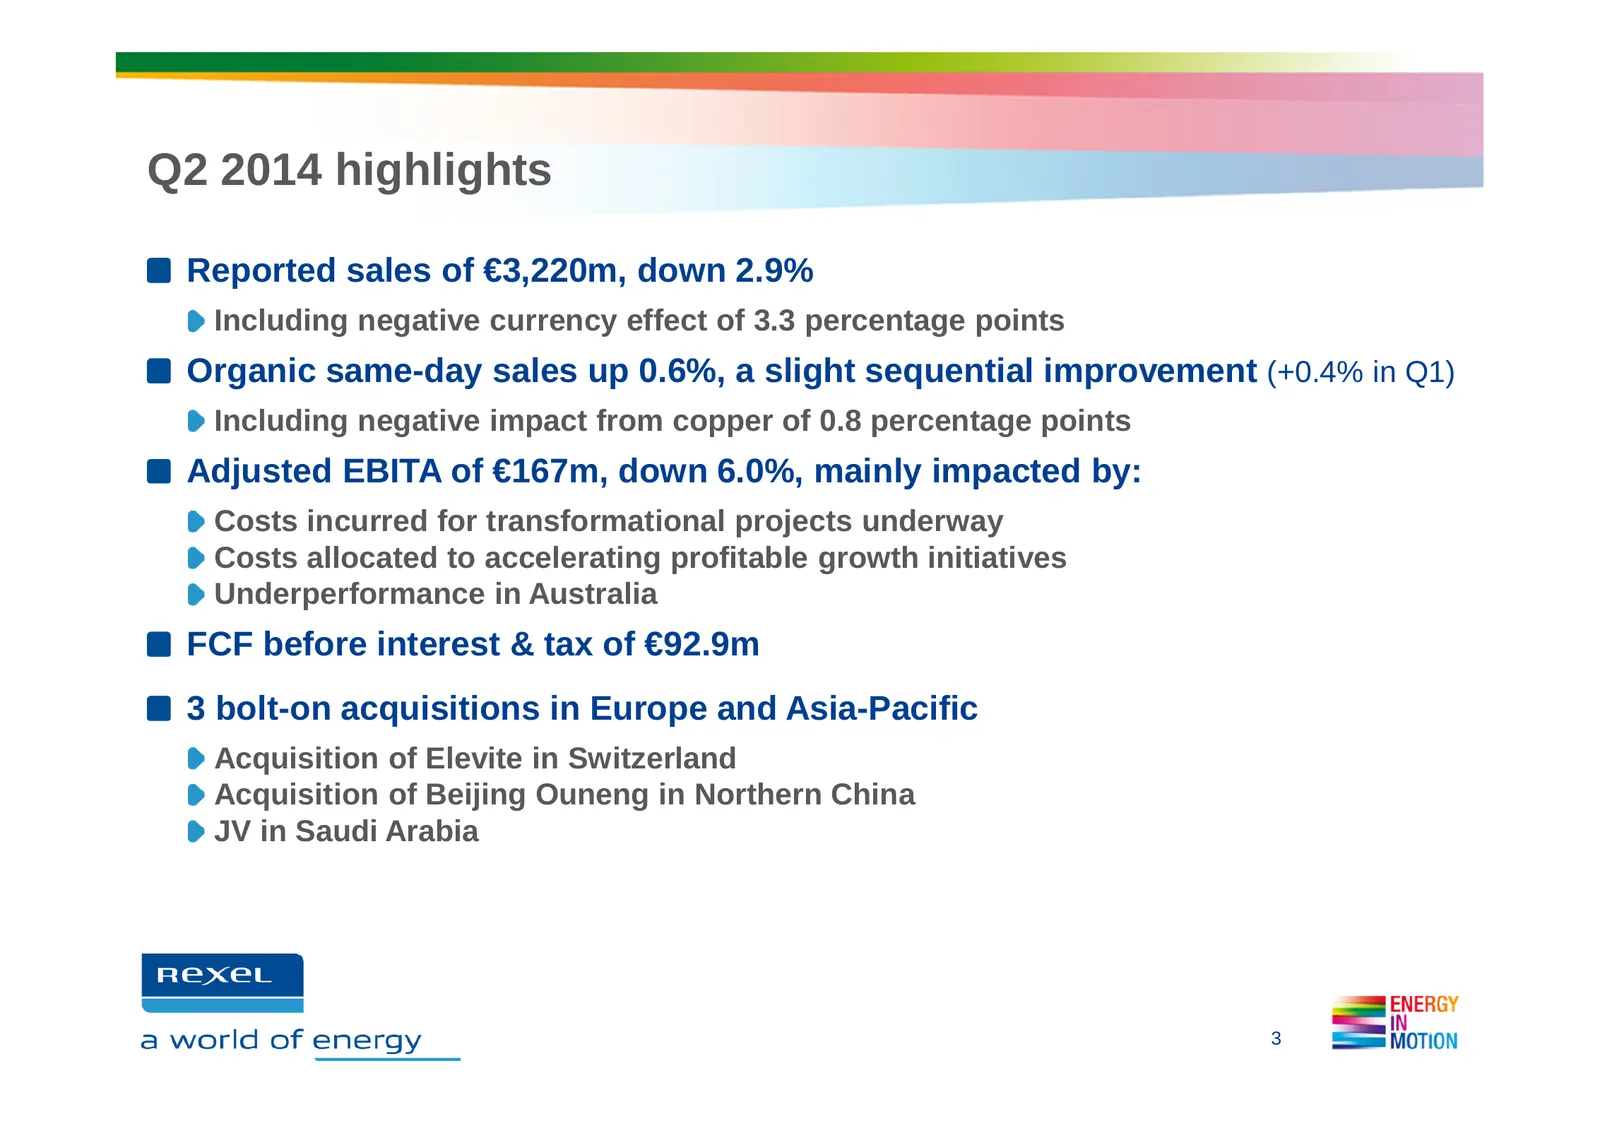
Q2 2014 highlights Reported sales of €3,220m, down 2.9% Including negative currency effect of 3.3 percentage points Organic same-day sales up 0.6%, a slight sequential improvement (+0.4% in Q1) Including negative impact from copper of 0.8 percentage points Adjusted EBITA of €167m, down 6.0%, mainly
Slide 4: H1 2014 highlights
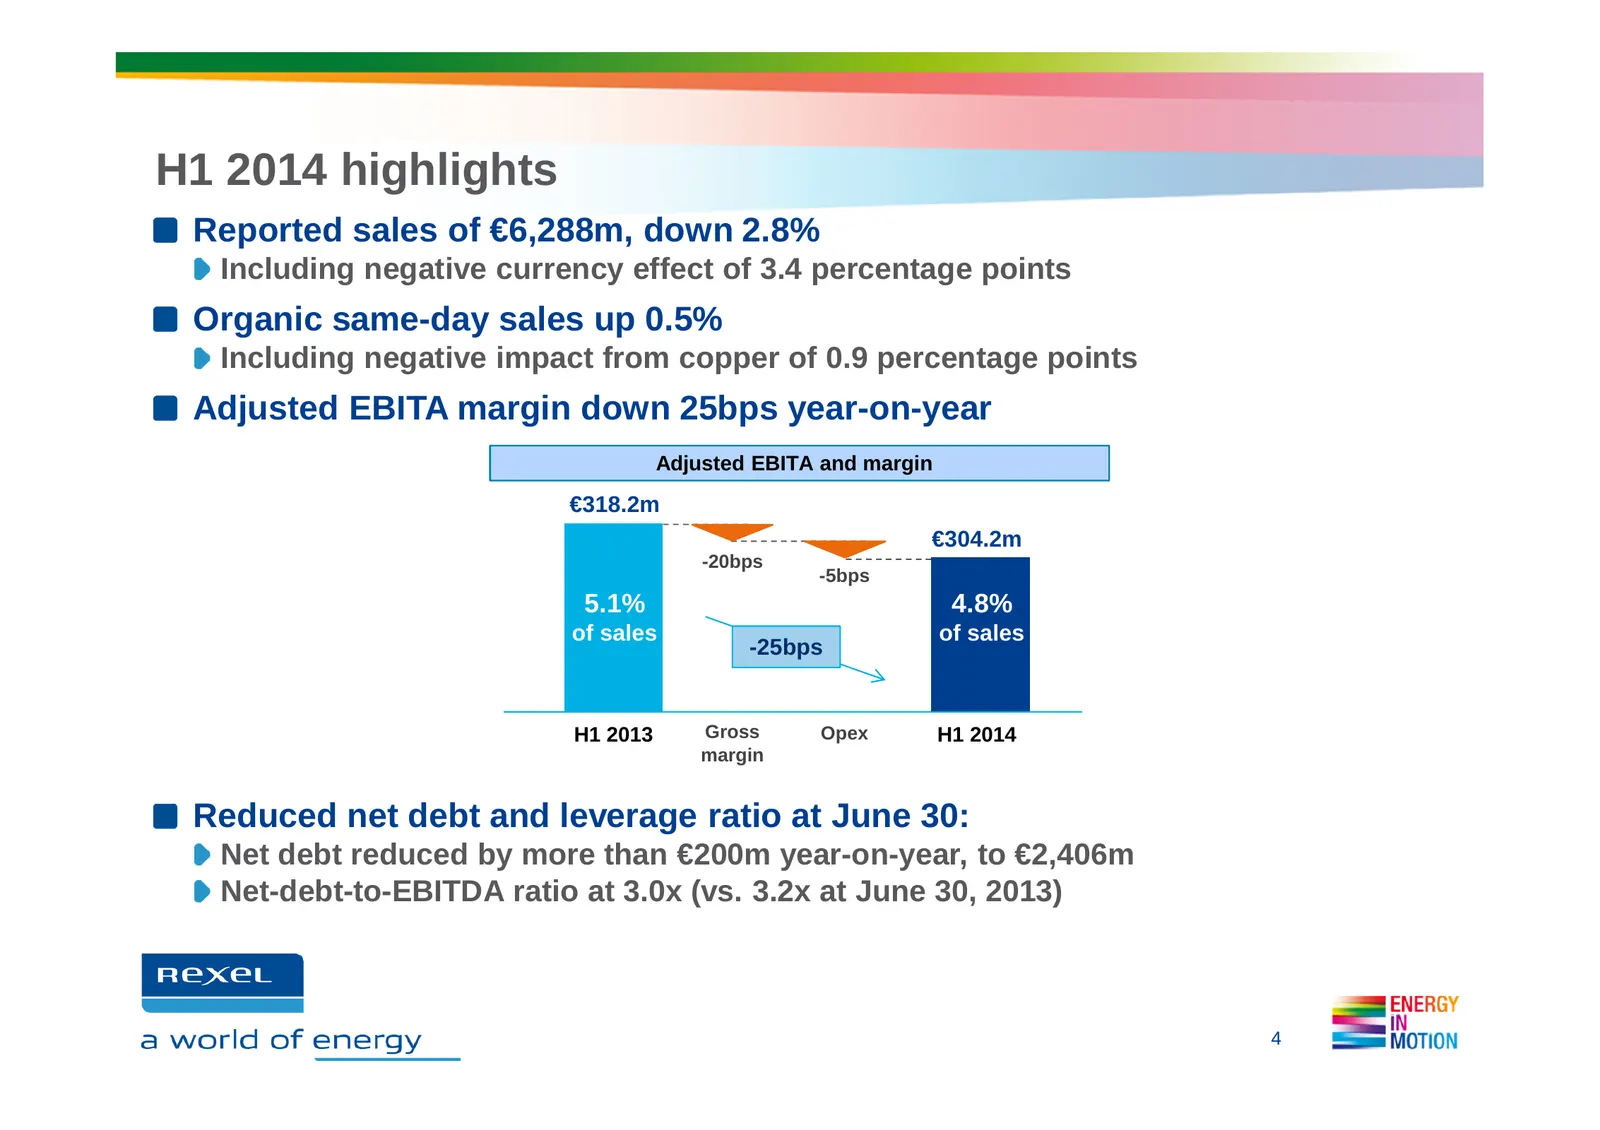
H1 2014 highlights Reported sales of €6,288m, down 2.8% Including negative currency effect of 3.4 percentage points Organic same-day sales up 0.5% Including negative impact from copper of 0.9 percentage points Adjusted EBITA margin down 25bps year-on-year Adjusted EBITA and margin €318.2m €304.2m -2
Slide 5: H1 2014 highlights: Breakdown of adjusted EBITA by zone
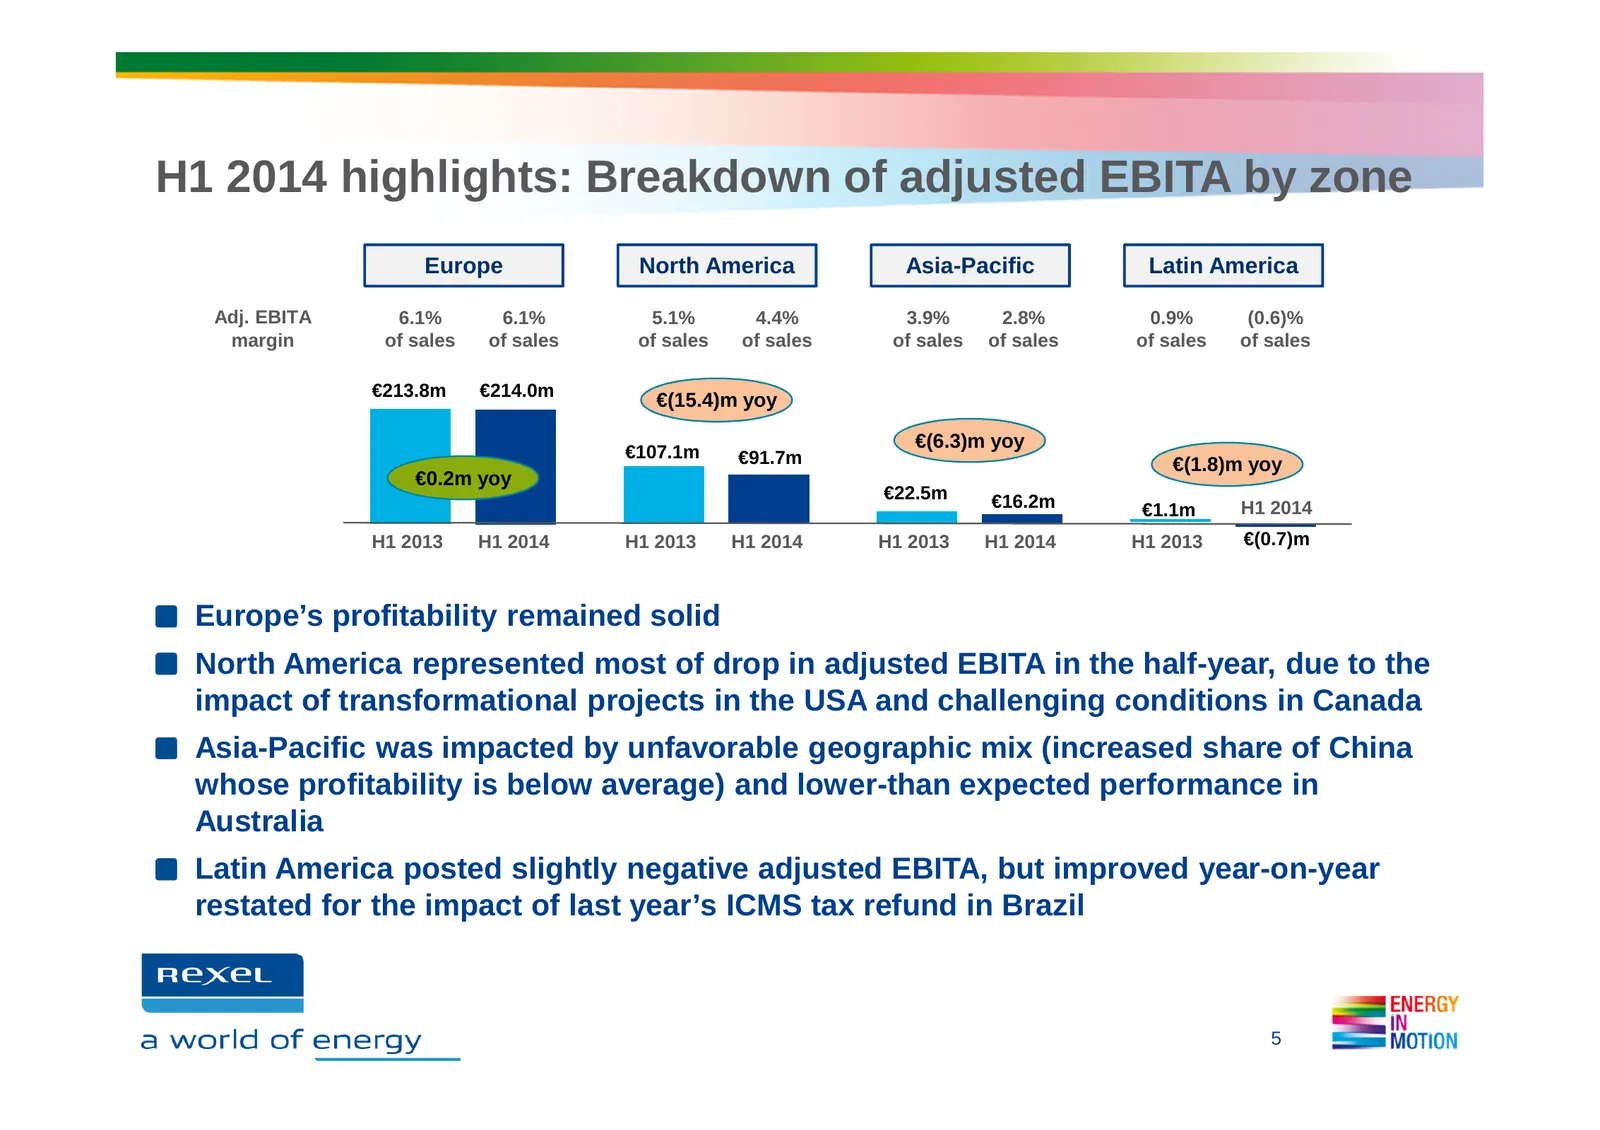
H1 2014 highlights: Breakdown of adjusted EBITA by zone Europe North America Asia-Pacific Latin America Adj. EBITA 6.1% 6.1% 5.1% 4.4% 3.9% 2.8% 0.9% (0.6)% margin of sales of sales of sales of sales of sales of sales of sales of sales €213.8m €214.0m €(15.4)m yoy €(6.3)m yoy €107.1m €91.7m €(1.8)m
Slide 6: Results by geography
RESULTS BY GEOGRAPHY Ce a world of energy = Flies MOTION
Slide 7: Europe: Slight growth in sales and robust profitability
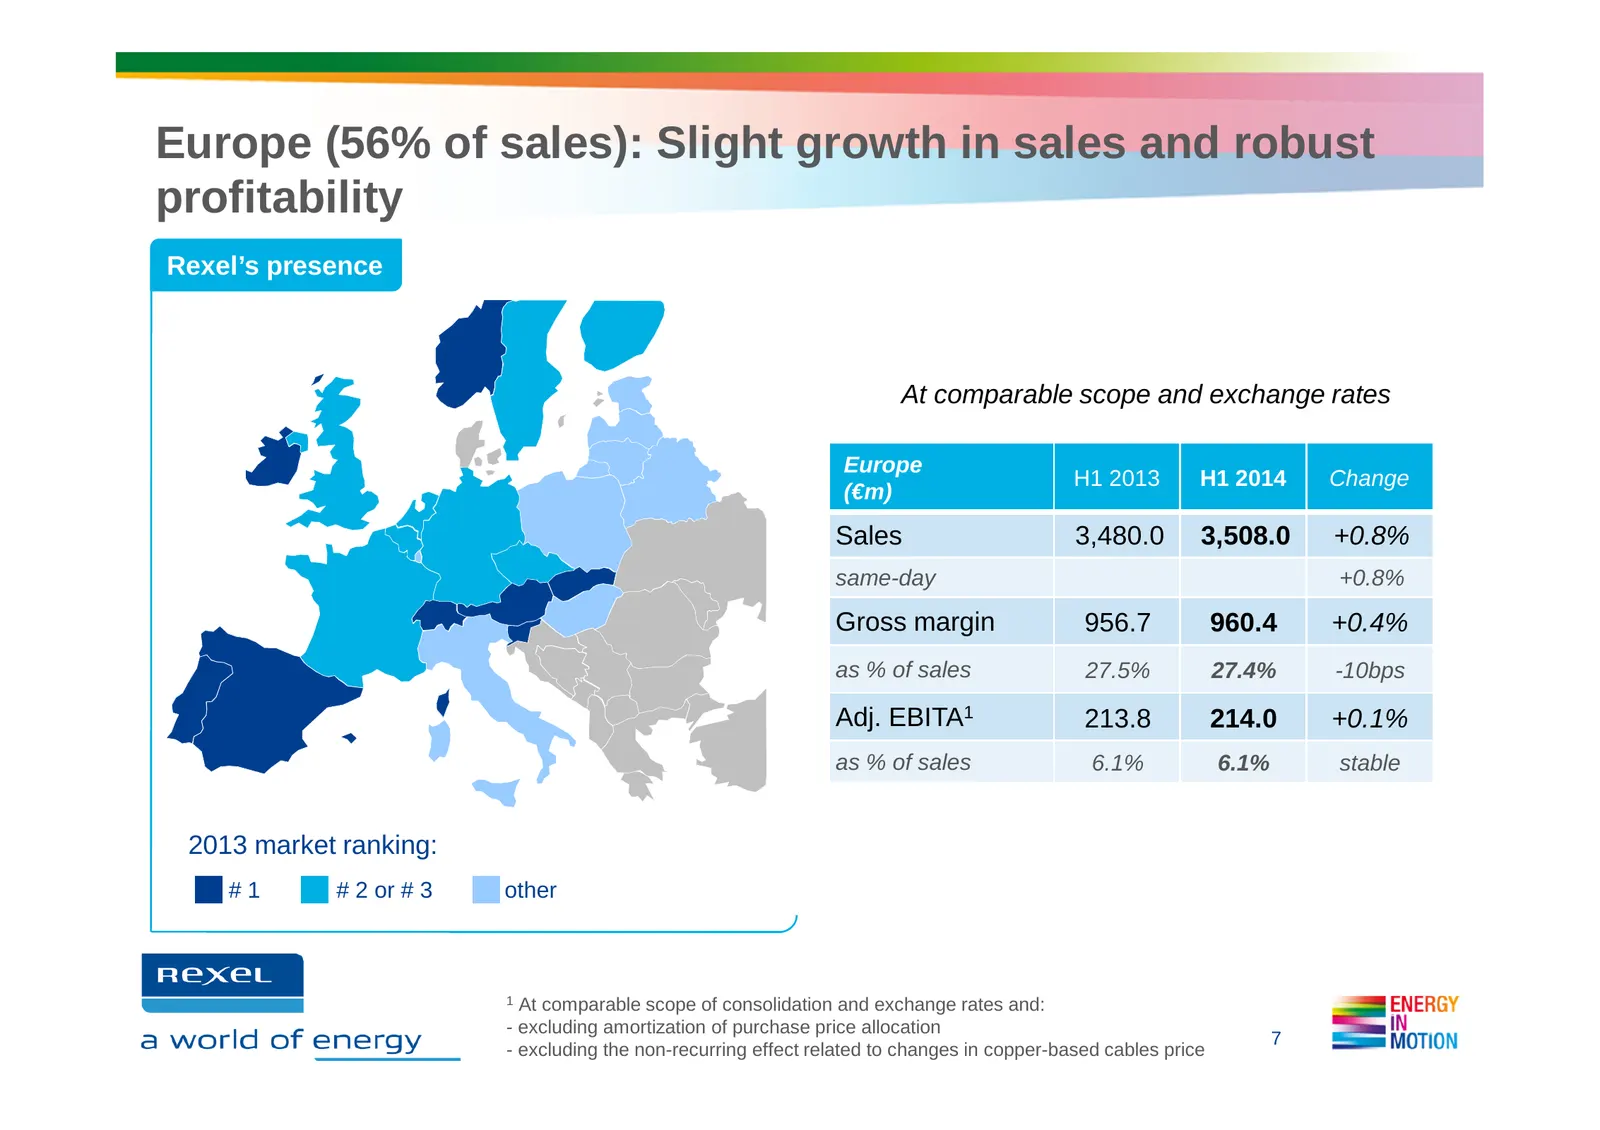
Europe (56% of sales): Slight growth in sales and robust profitability Rexel’s presence At comparable scope and exchange rates Europe H1 2013 H1 2014 Change (€m) Sales 3,480.0 3,508.0 +0.8% same-day +0.8% Gross margin 956.7 960.4 +0.4% as % of sales 27.5% 27.4% -10bps Adj. EBITA1 213.8 214.0 +0.1% a
Slide 8: Europe: Q2 2014 business highlights
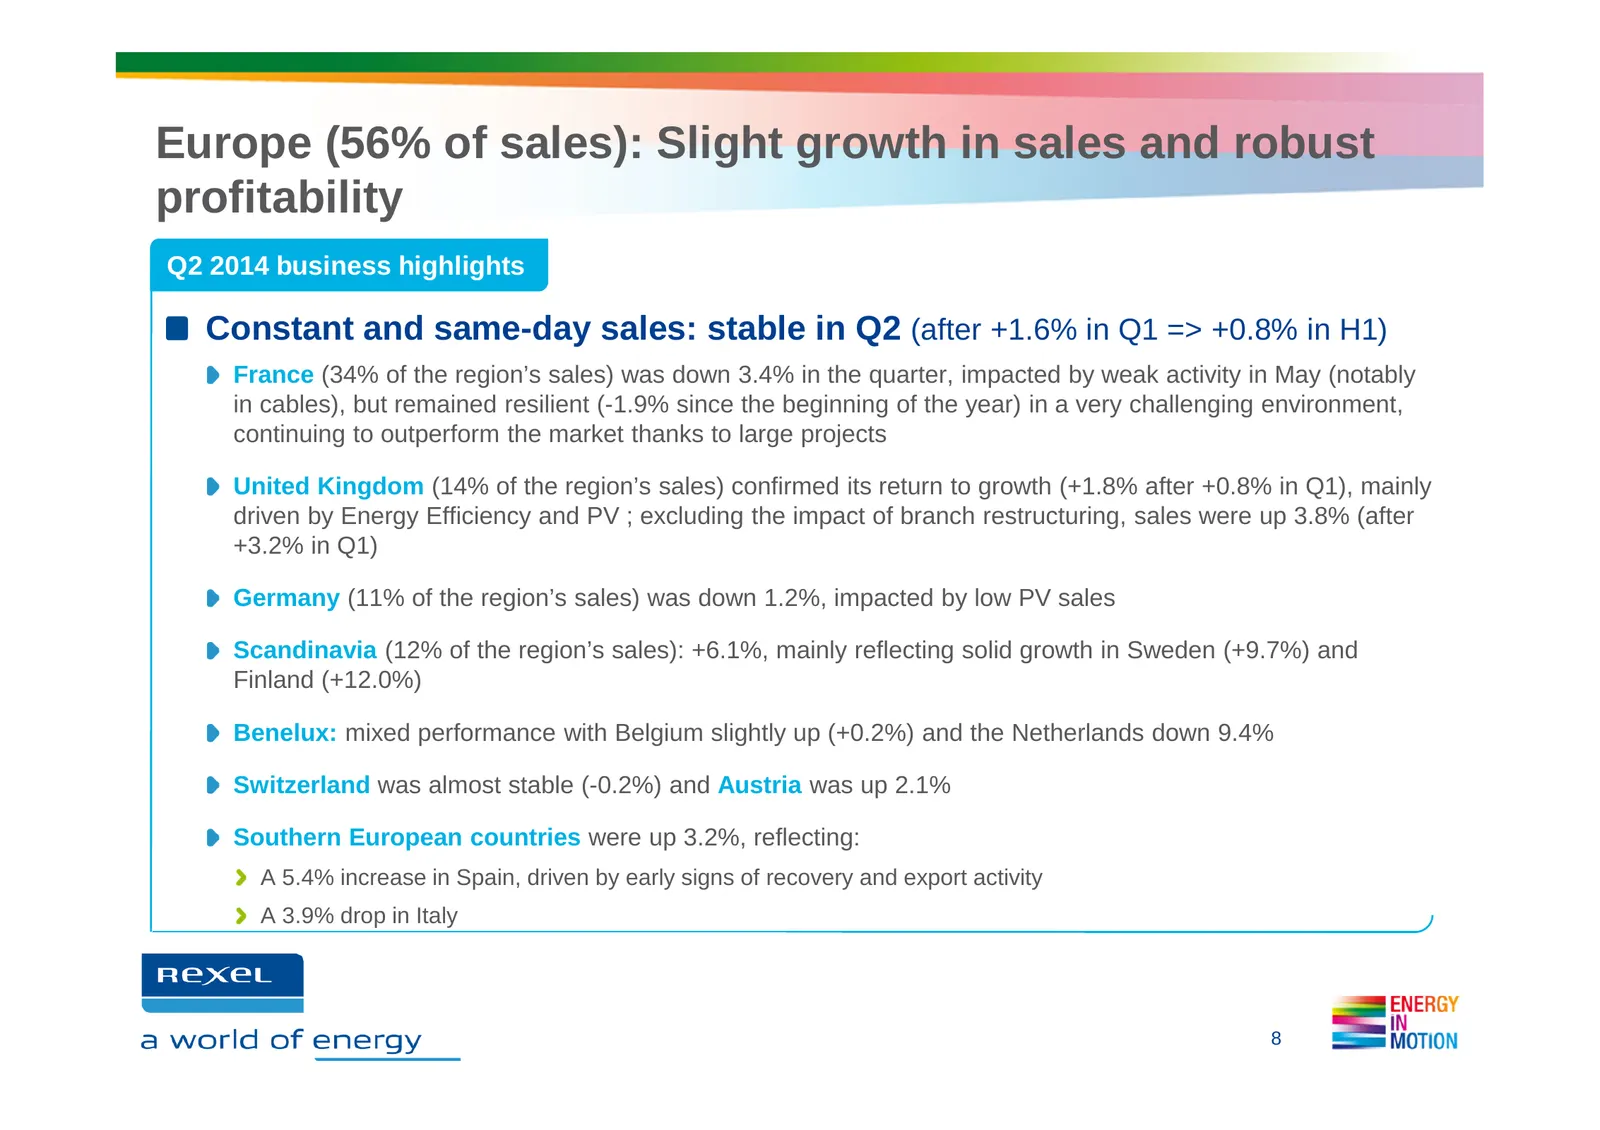
Europe (56% of sales): Slight growth in sales and robust profitability Q2 2014 business highlights Constant and same-day sales: stable in Q2 (after +1.6% in Q1 => +0.8% in H1) France (34% of the region’s sales) was down 3.4% in the quarter, impacted by weak activity in May (notably in cables), but r
Slide 9: North America: Sequential improvement in sales, challenging conditions in Canada
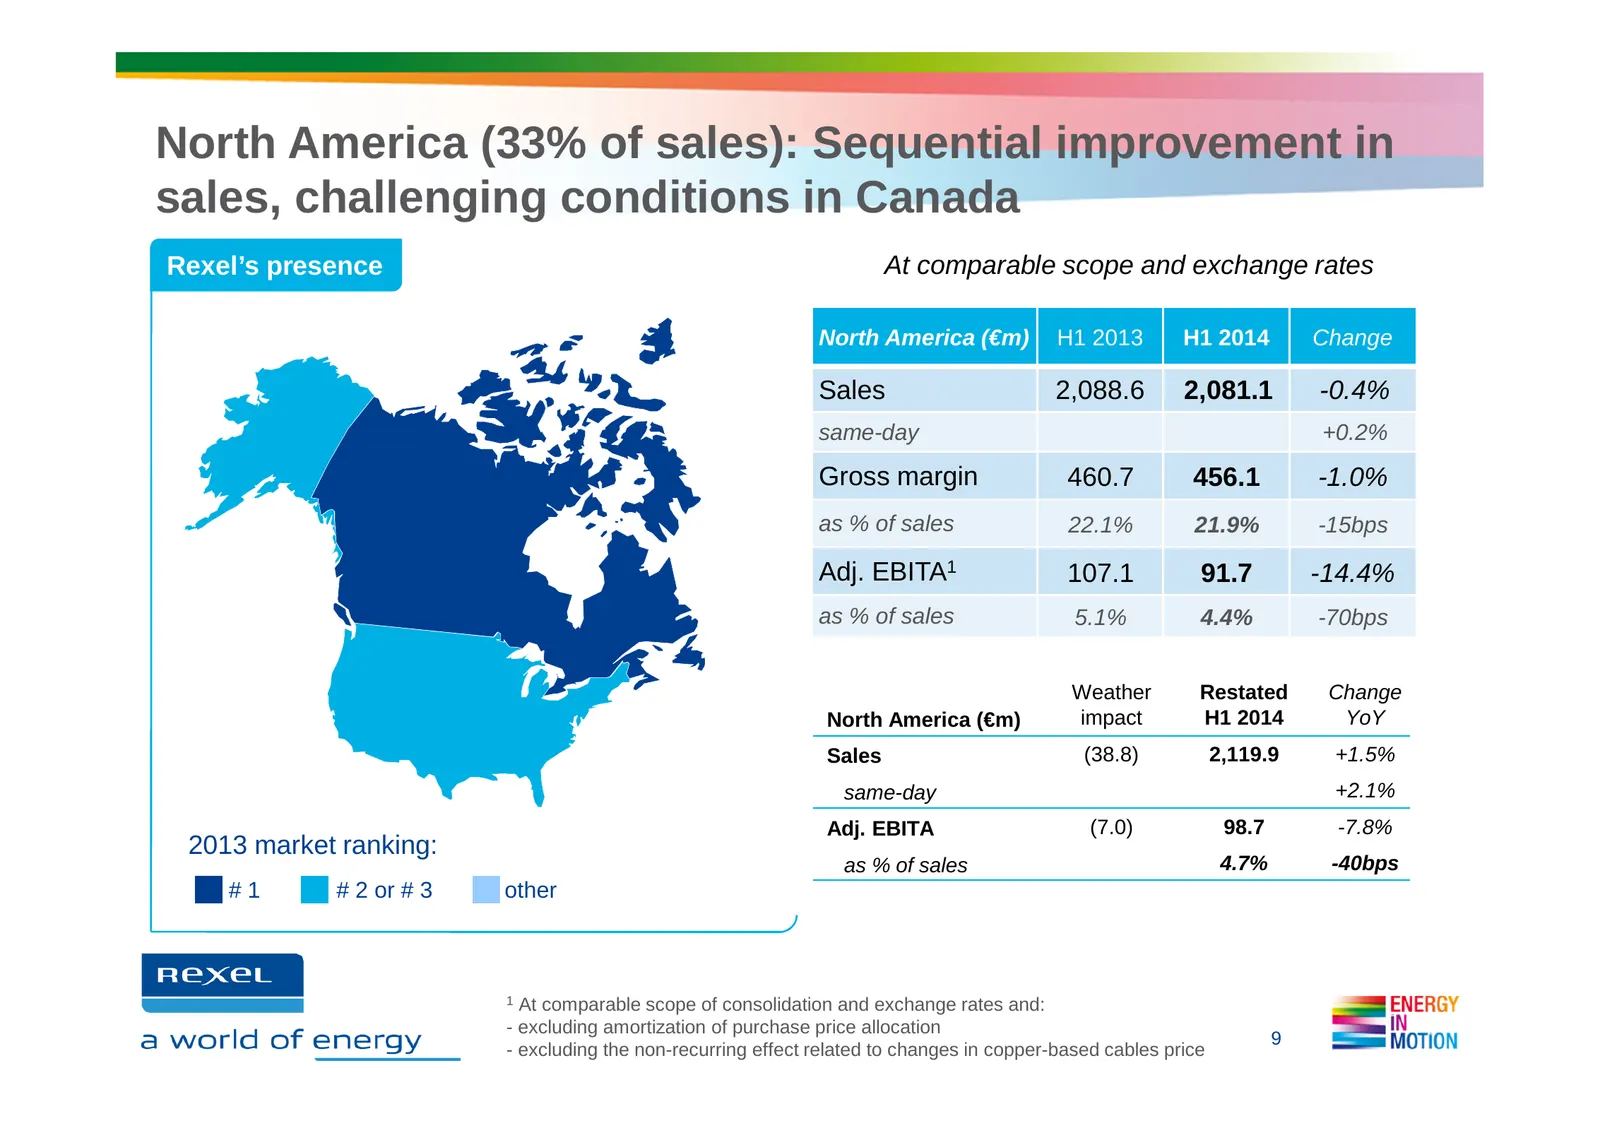
North America (33% of sales): Sequential improvement in sales, challenging conditions in Canada Rexel’s presence At comparable scope and exchange rates North America (€m) H1 2013 H1 2014 Change Sales 2,088.6 2,081.1 -0.4% same-day +0.2% Gross margin 460.7 456.1 -1.0% as % of sales 22.1% 21.9% -15bps
Slide 10: North America: Q2 2014 business highlights
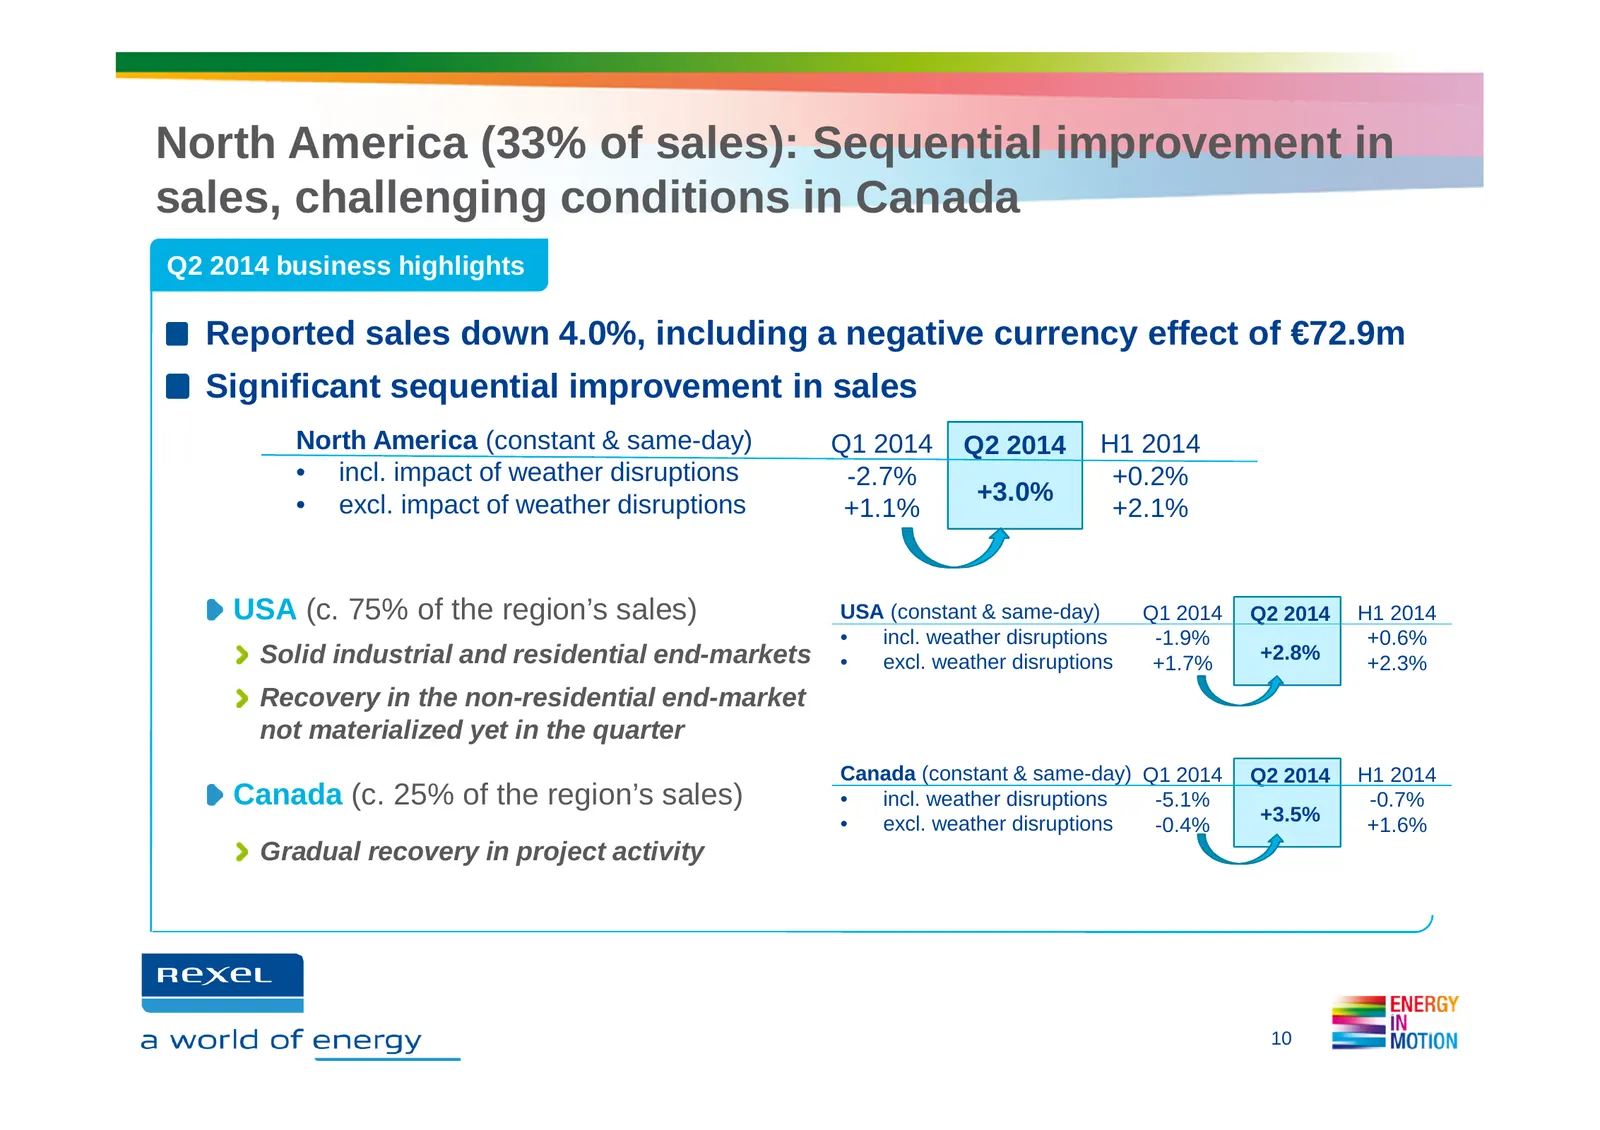
North America (33% of sales): Sequential improvement in sales, challenging conditions in Canada Q2 2014 business highlights Reported sales down 4.0%, including a negative currency effect of €72.9m Significant sequential improvement in sales North America (constant & same-day) Q1 2014 Q2 2014 H1 2014
Slide 11: Asia-Pacific: Solid performance in Asia offset by weakness in Australia
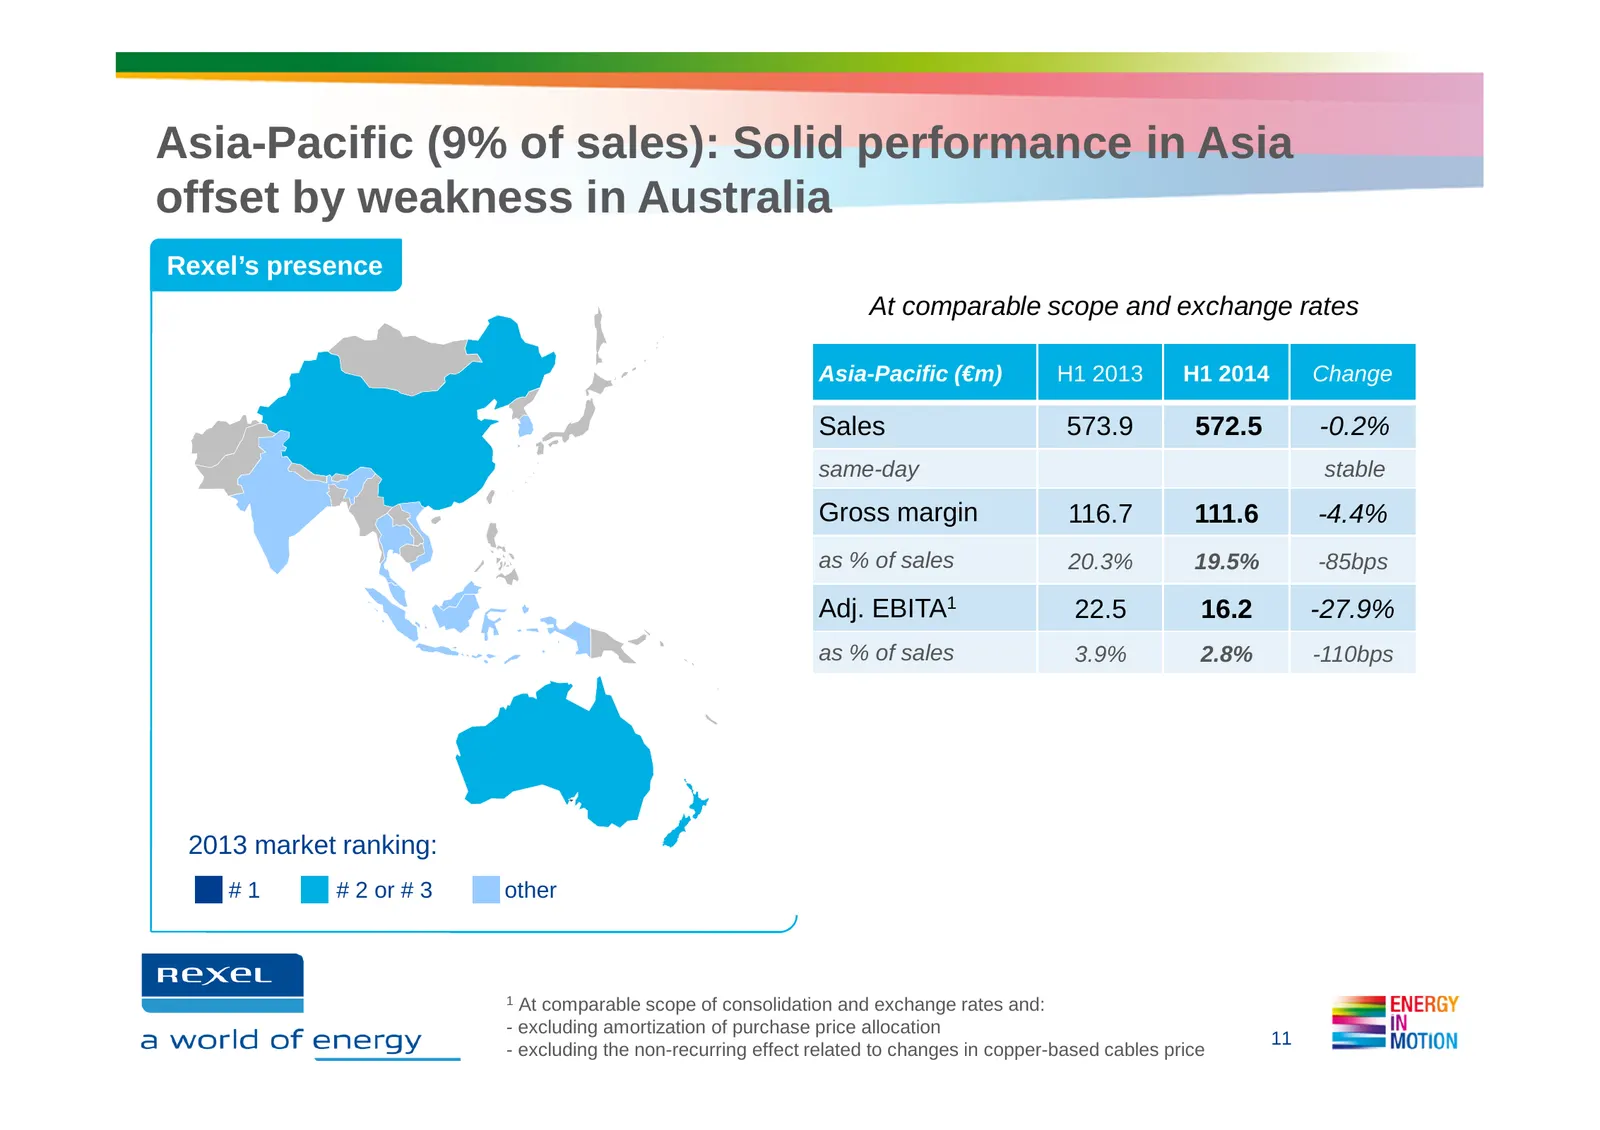
Asia-Pacific (9% of sales): Solid performance in Asia offset by weakness in Australia Rexel’s presence At comparable scope and exchange rates Asia-Pacific (€m) H1 2013 H1 2014 Change Sales 573.9 572.5 -0.2% same-day stable Gross margin 116.7 111.6 -4.4% as % of sales 20.3% 19.5% -85bps Adj. EBITA1 2
Slide 12: Asia-Pacific: Q2 2014 business highlights
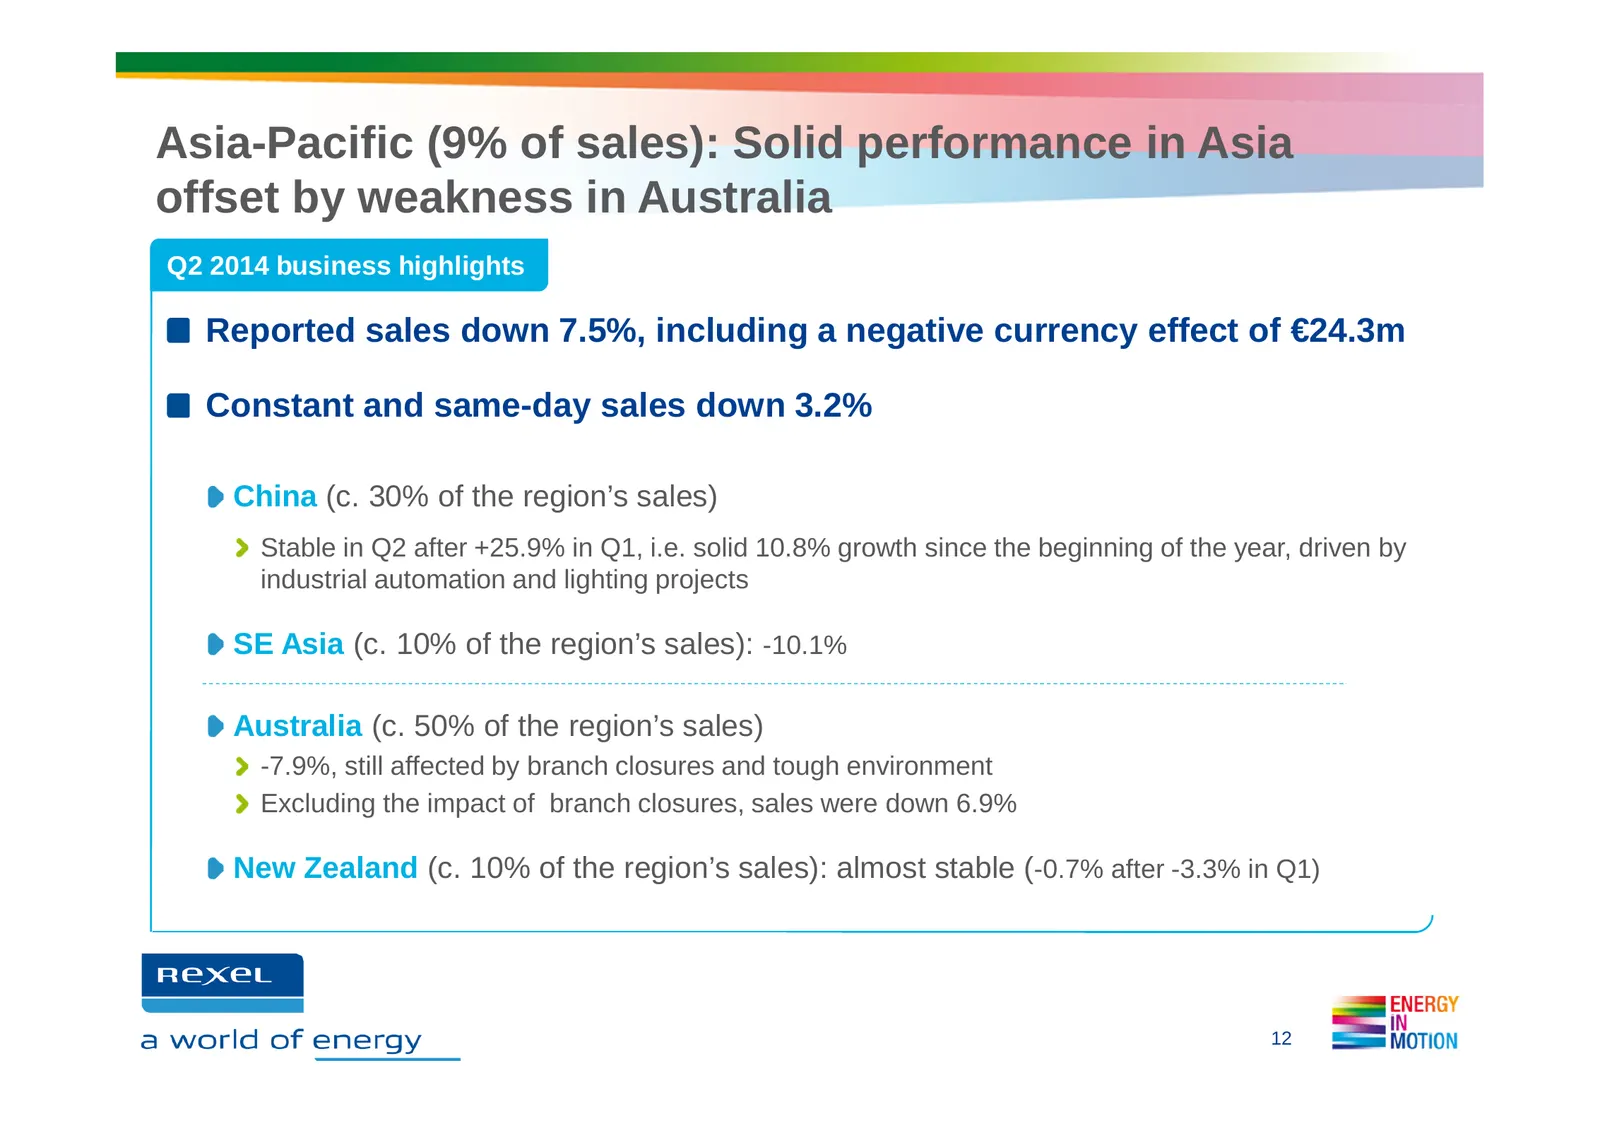
Asia-Pacific (9% of sales): Solid performance in Asia offset by weakness in Australia Q2 2014 business highlights Reported sales down 7.5%, including a negative currency effect of €24.3m Constant and same-day sales down 3.2% China (c. 30% of the region’s sales) Stable in Q2 after +25.9% in Q1, i.e.
Slide 13: Latin America: Double-digit sales growth in Chile and Peru
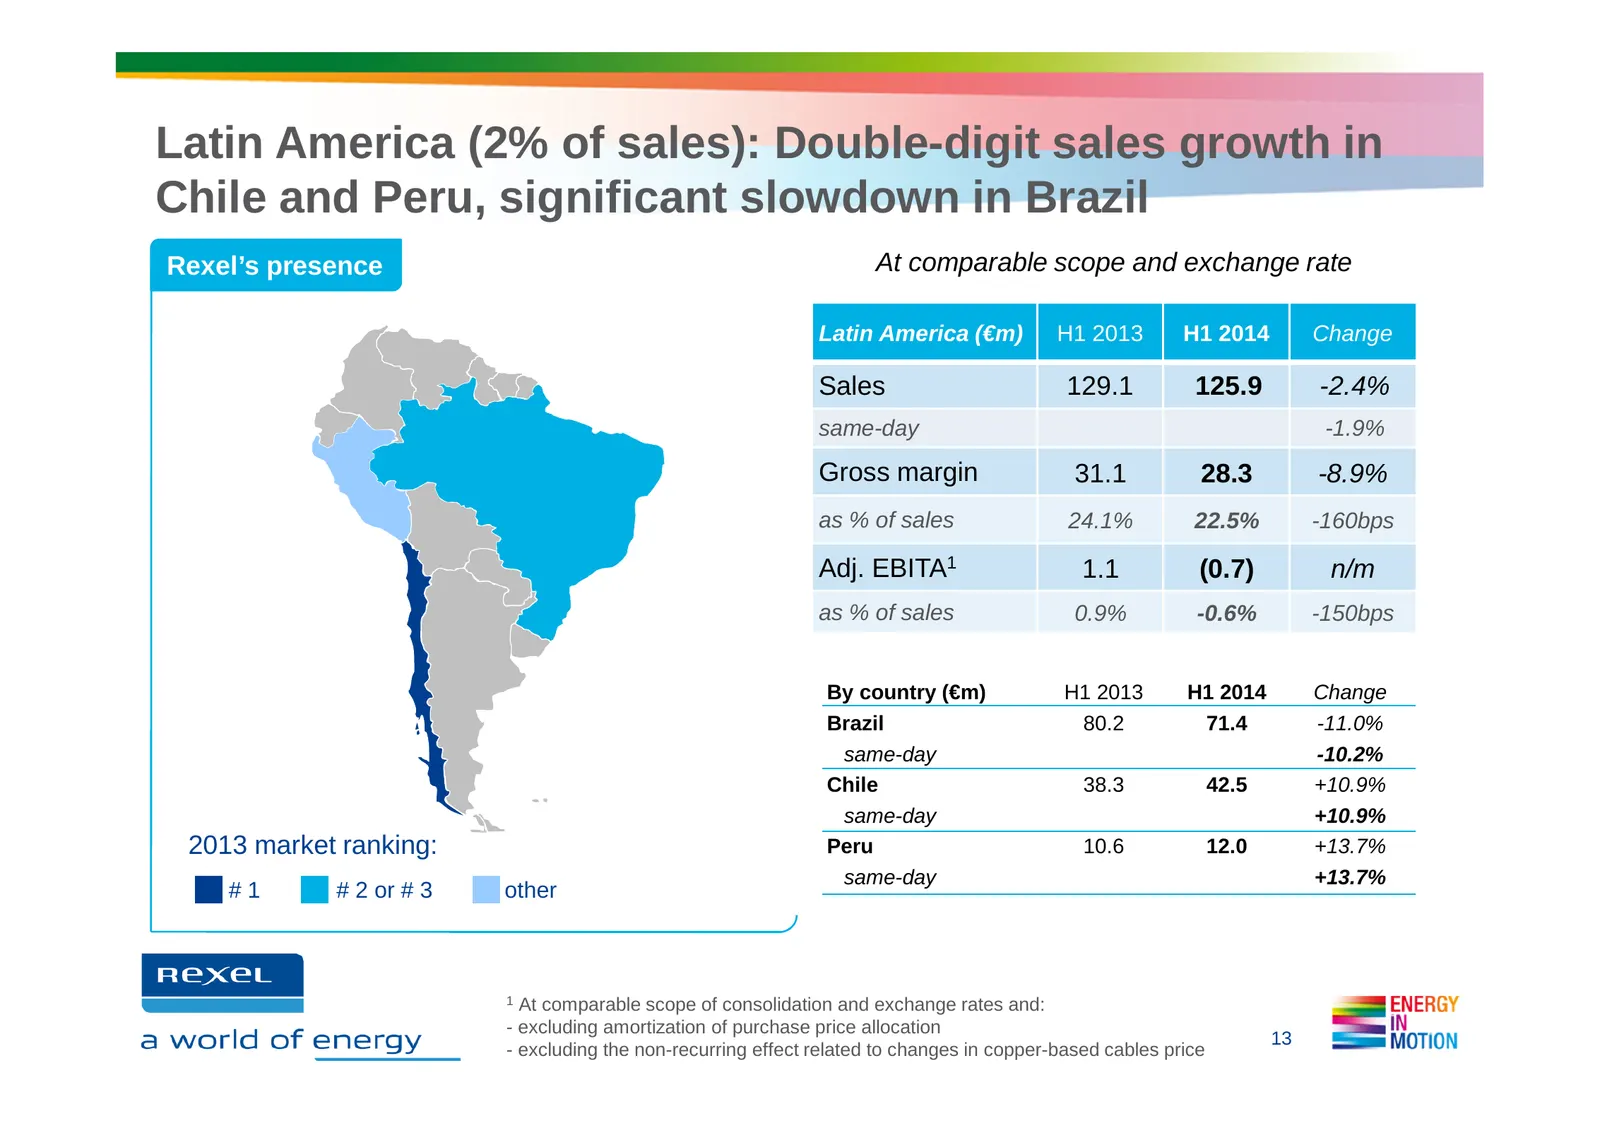
Latin America (2% of sales): Double-digit sales growth in Chile and Peru, significant slowdown in Brazil Rexel’s presence At comparable scope and exchange rate Latin America (€m) H1 2013 H1 2014 Change Sales 129.1 125.9 -2.4% same-day -1.9% Gross margin 31.1 28.3 -8.9% as % of sales 24.1% 22.5% -160
Slide 14: Latin America: Q2 2014 business highlights
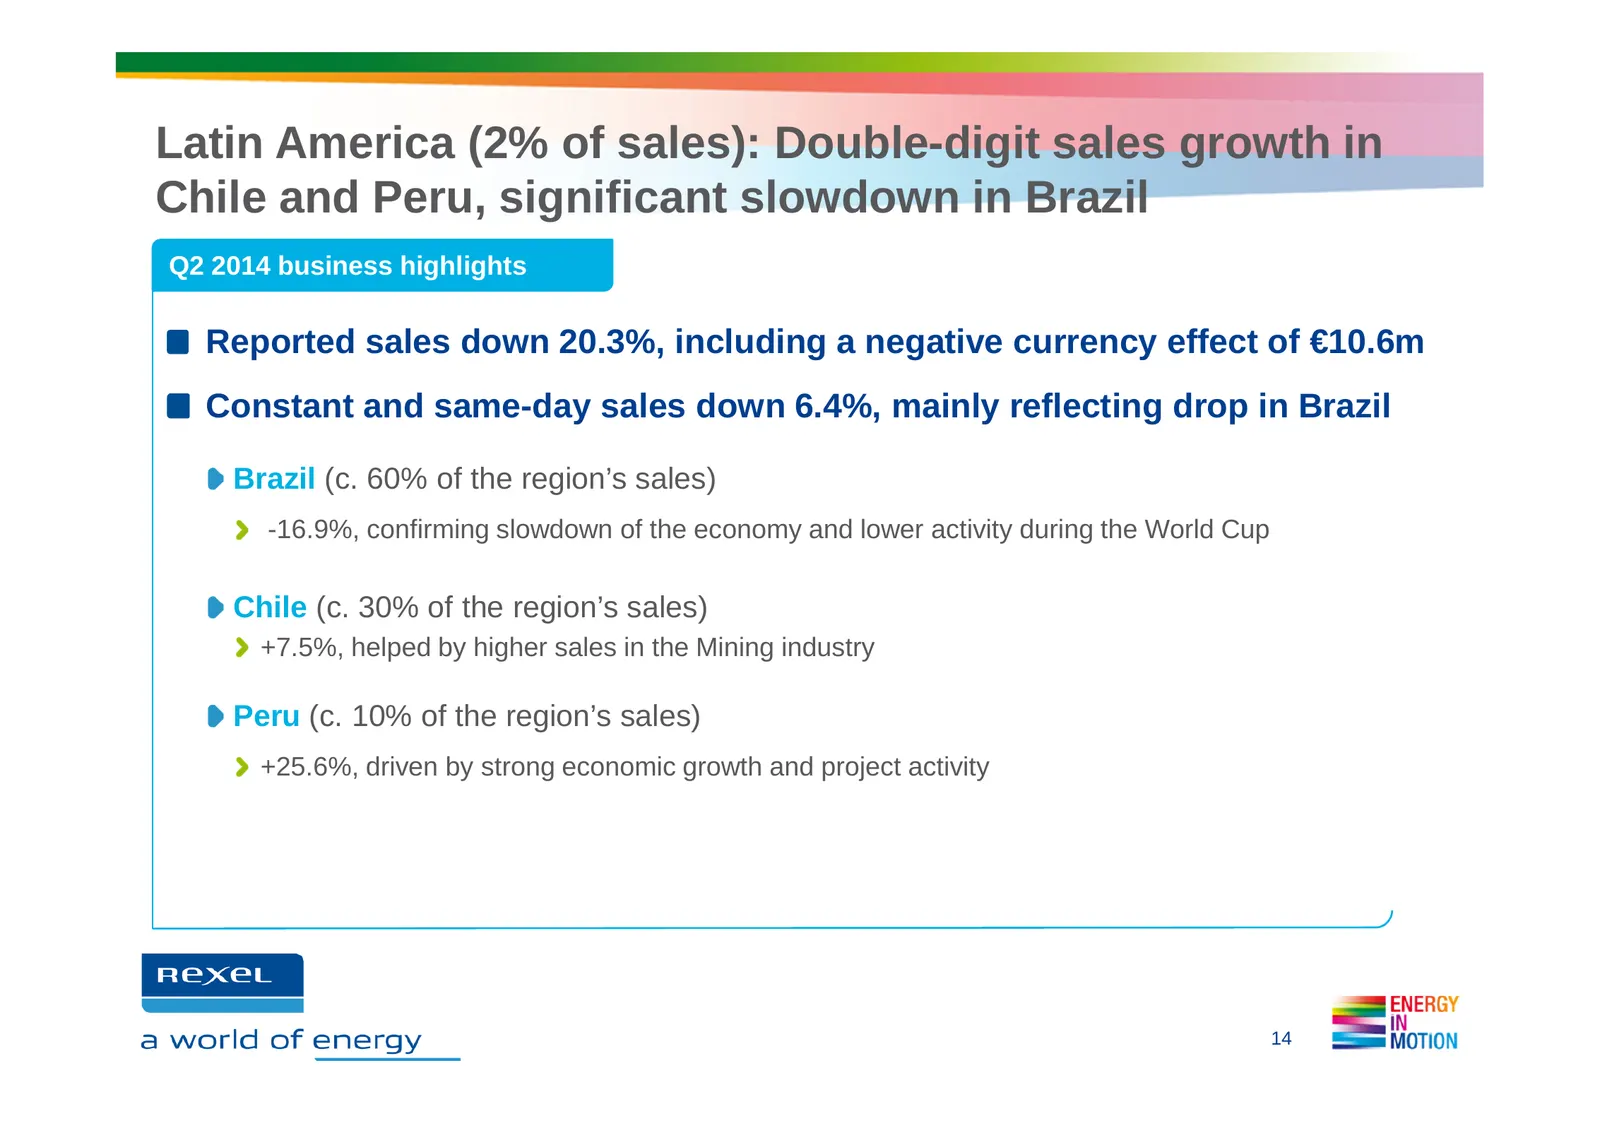
Latin America (2% of sales): Double-digit sales growth in Chile and Peru, significant slowdown in Brazil Q2 2014 business highlights Reported sales down 20.3%, including a negative currency effect of €10.6m Constant and same-day sales down 6.4%, mainly reflecting drop in Brazil Brazil (c. 60% of the
Slide 15: Financial review
FINANCIAL REVIEW Ce a world of energy = Flies MOTION
Slide 16: Organic same-day sales slightly up year-on-year
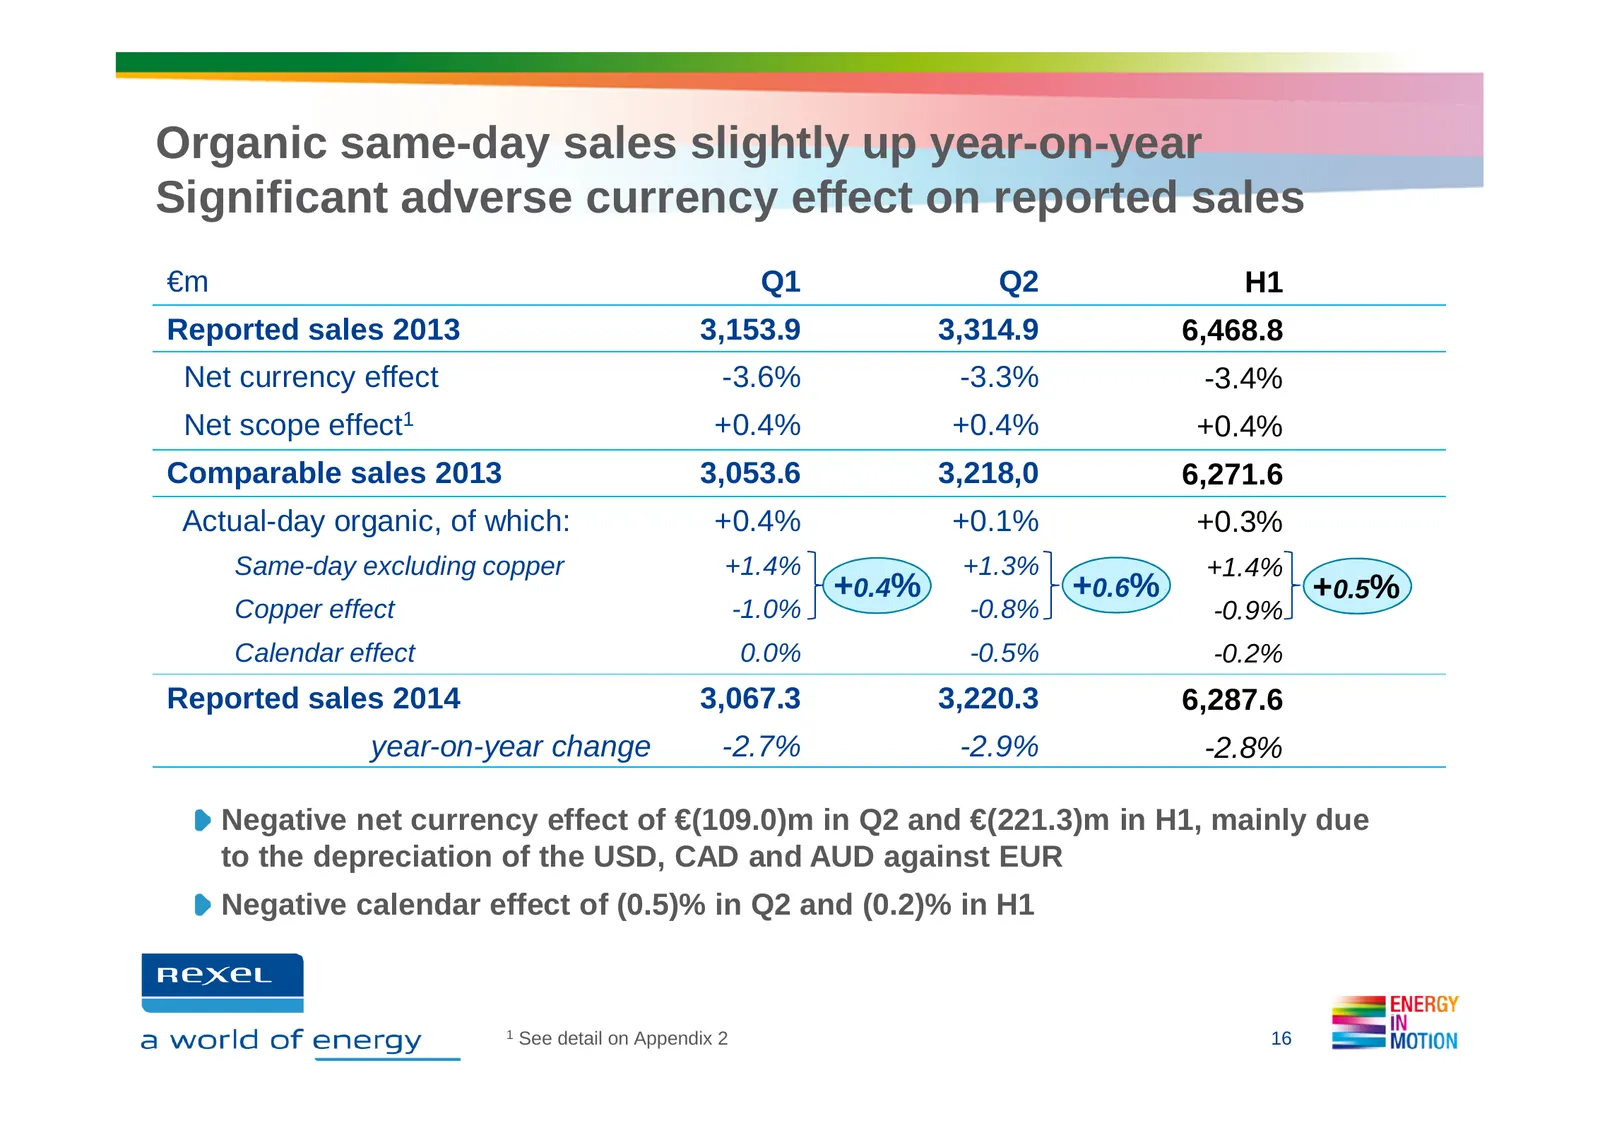
Organic same-day sales slightly up year-on-year Significant adverse currency effect on reported sales €m Q1 Q2 H1 Reported sales 2013 3,153.9 3,314.9 6,468.8 Net currency effect -3.6% -3.3% -3.4% Net scope effect1 +0.4% +0.4% +0.4% Comparable sales 2013 3,053.6 3,218,0 6,271.6 Actual-day organic, of
Slide 17: Profitability impacted by mix effects and transformation costs
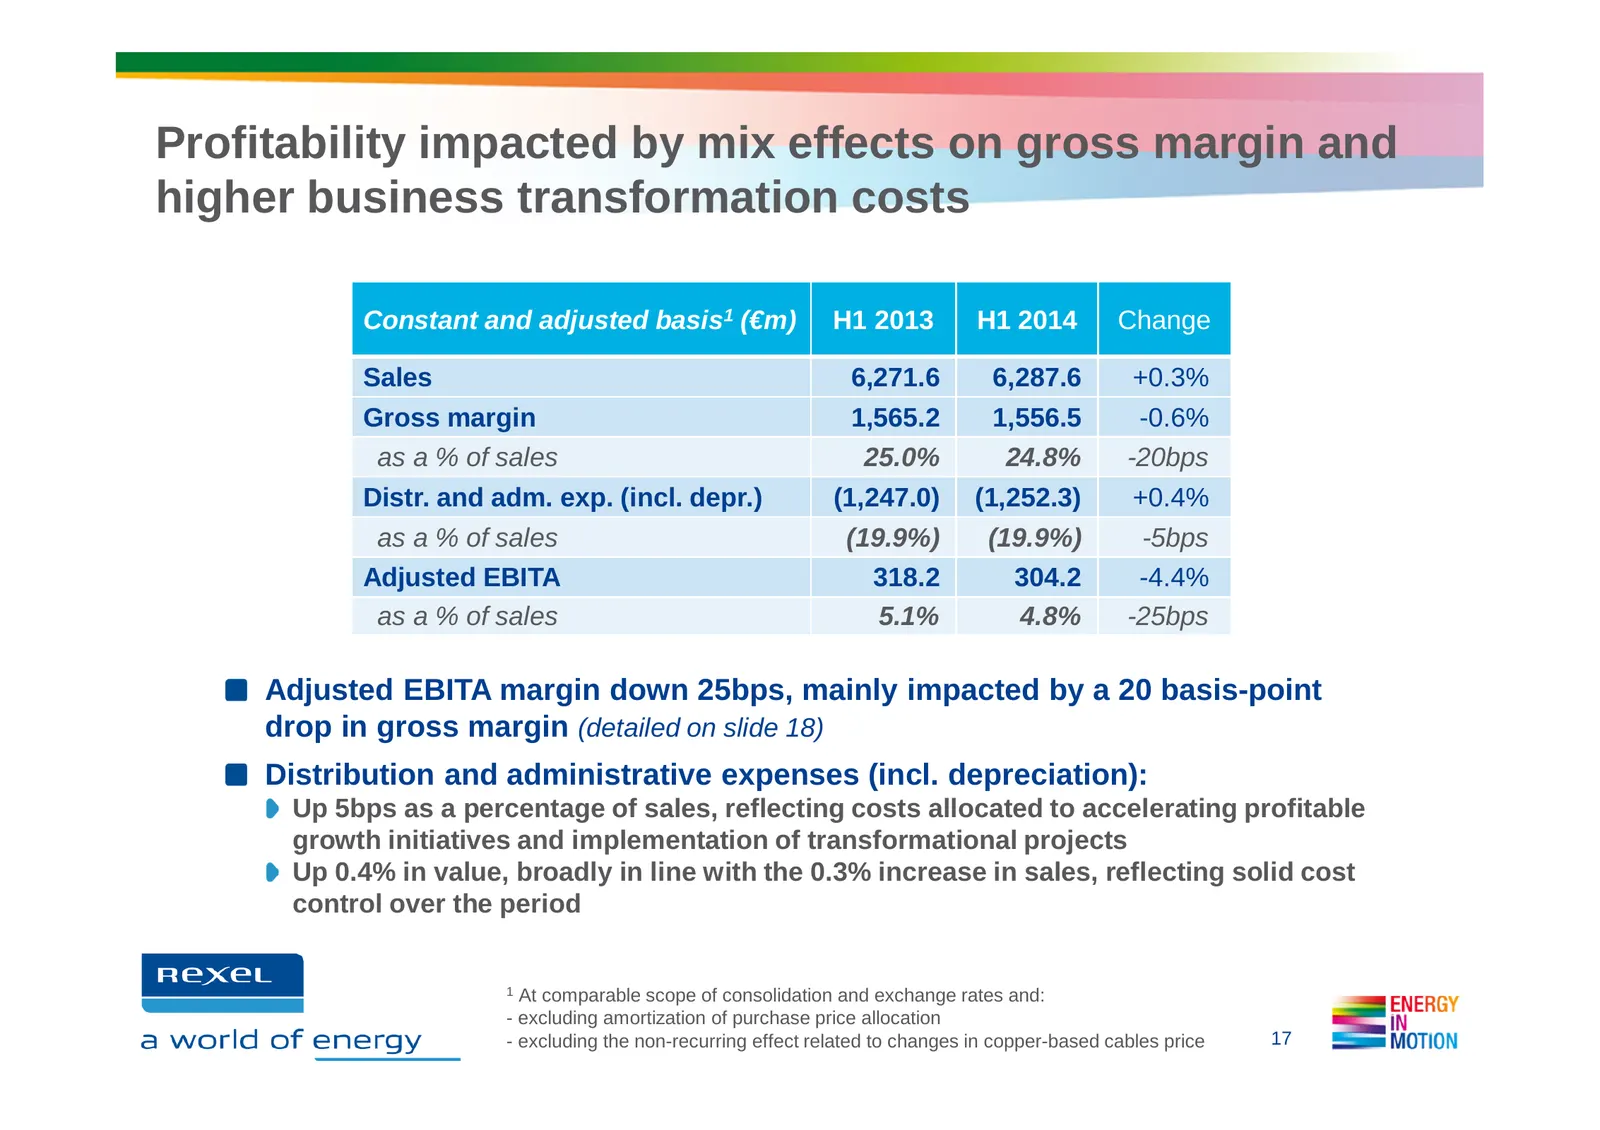
Profitability impacted by mix effects on gross margin and higher business transformation costs Constant and adjusted basis1 (€m) H1 2013 H1 2014 Change Sales 6,271.6 6,287.6 +0.3% Gross margin 1,565.2 1,556.5 -0.6% as a % of sales 25.0% 24.8% -20bps Distr. and adm. exp. (incl. depr.) (1,247.0) (1,25
Slide 18: Unfavorable mix effects on gross margin by geography
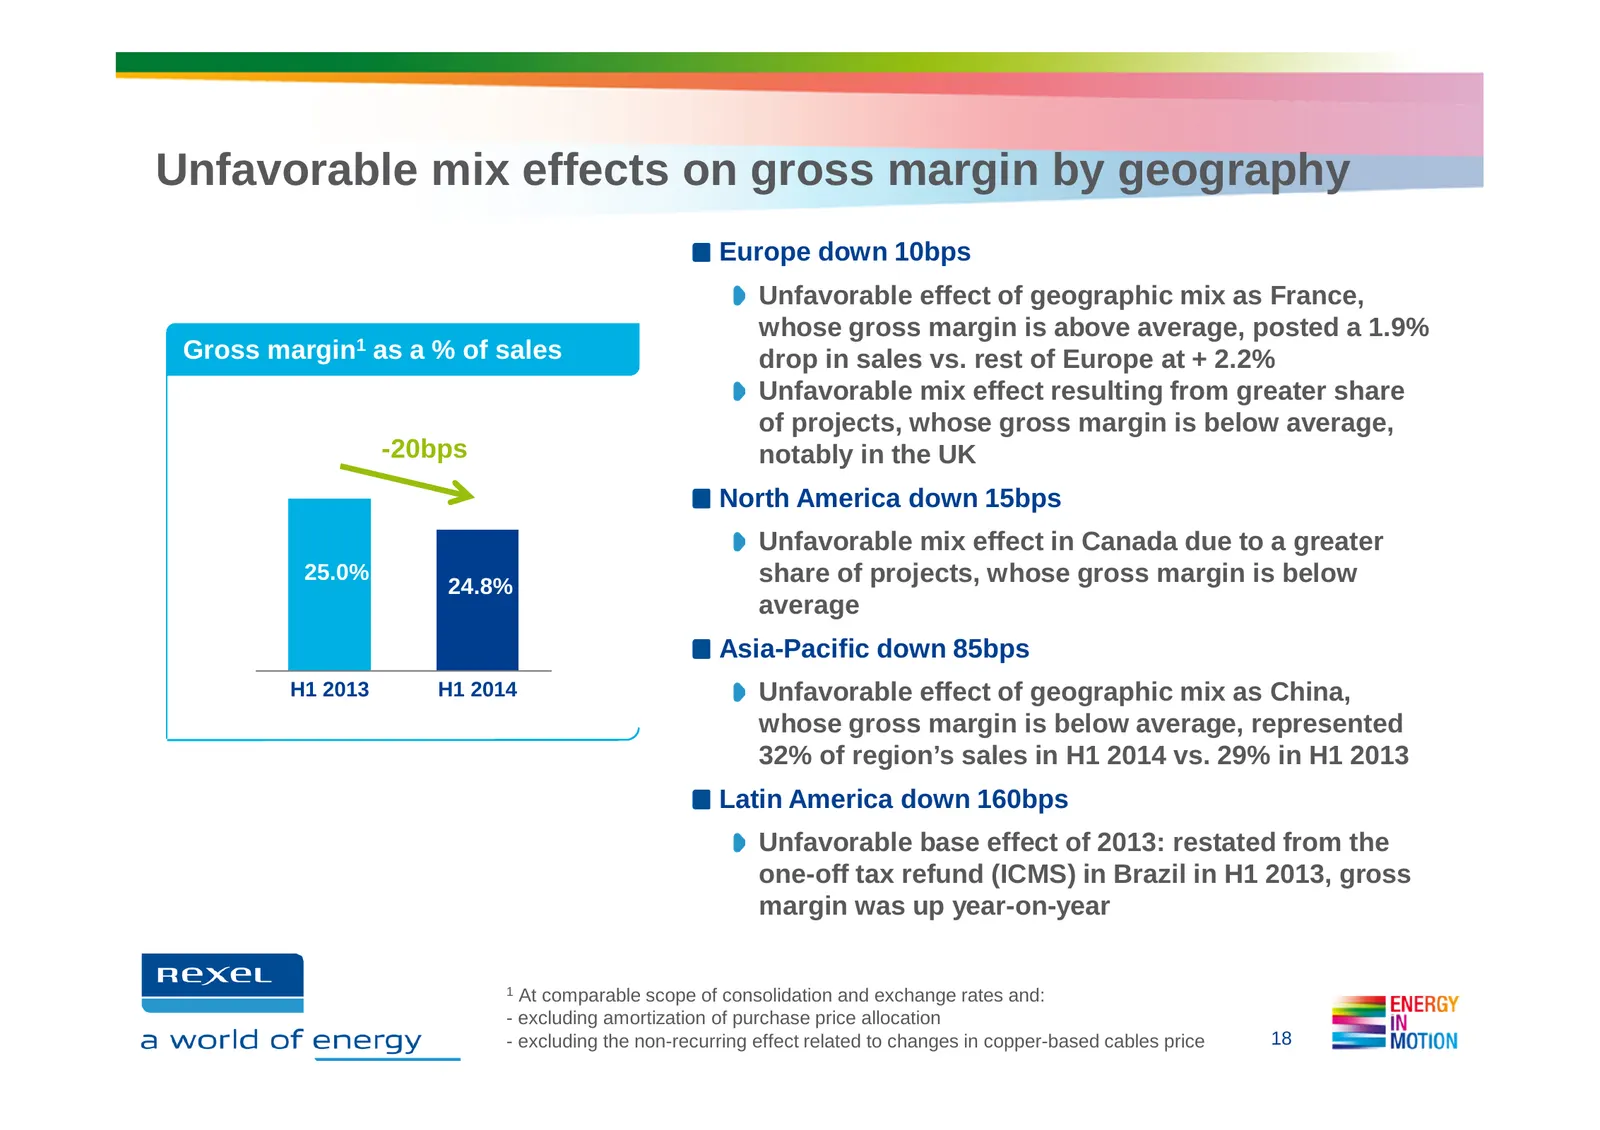
Unfavorable mix effects on gross margin by geography Europe down 10bps Unfavorable effect of geographic mix as France, whose gross margin is above average, posted a 1.9% Gross margin1 as a % of sales drop in sales vs. rest of Europe at + 2.2% Unfavorable mix effect resulting from greater share of pr
Slide 19: Reported net income up 26.6%
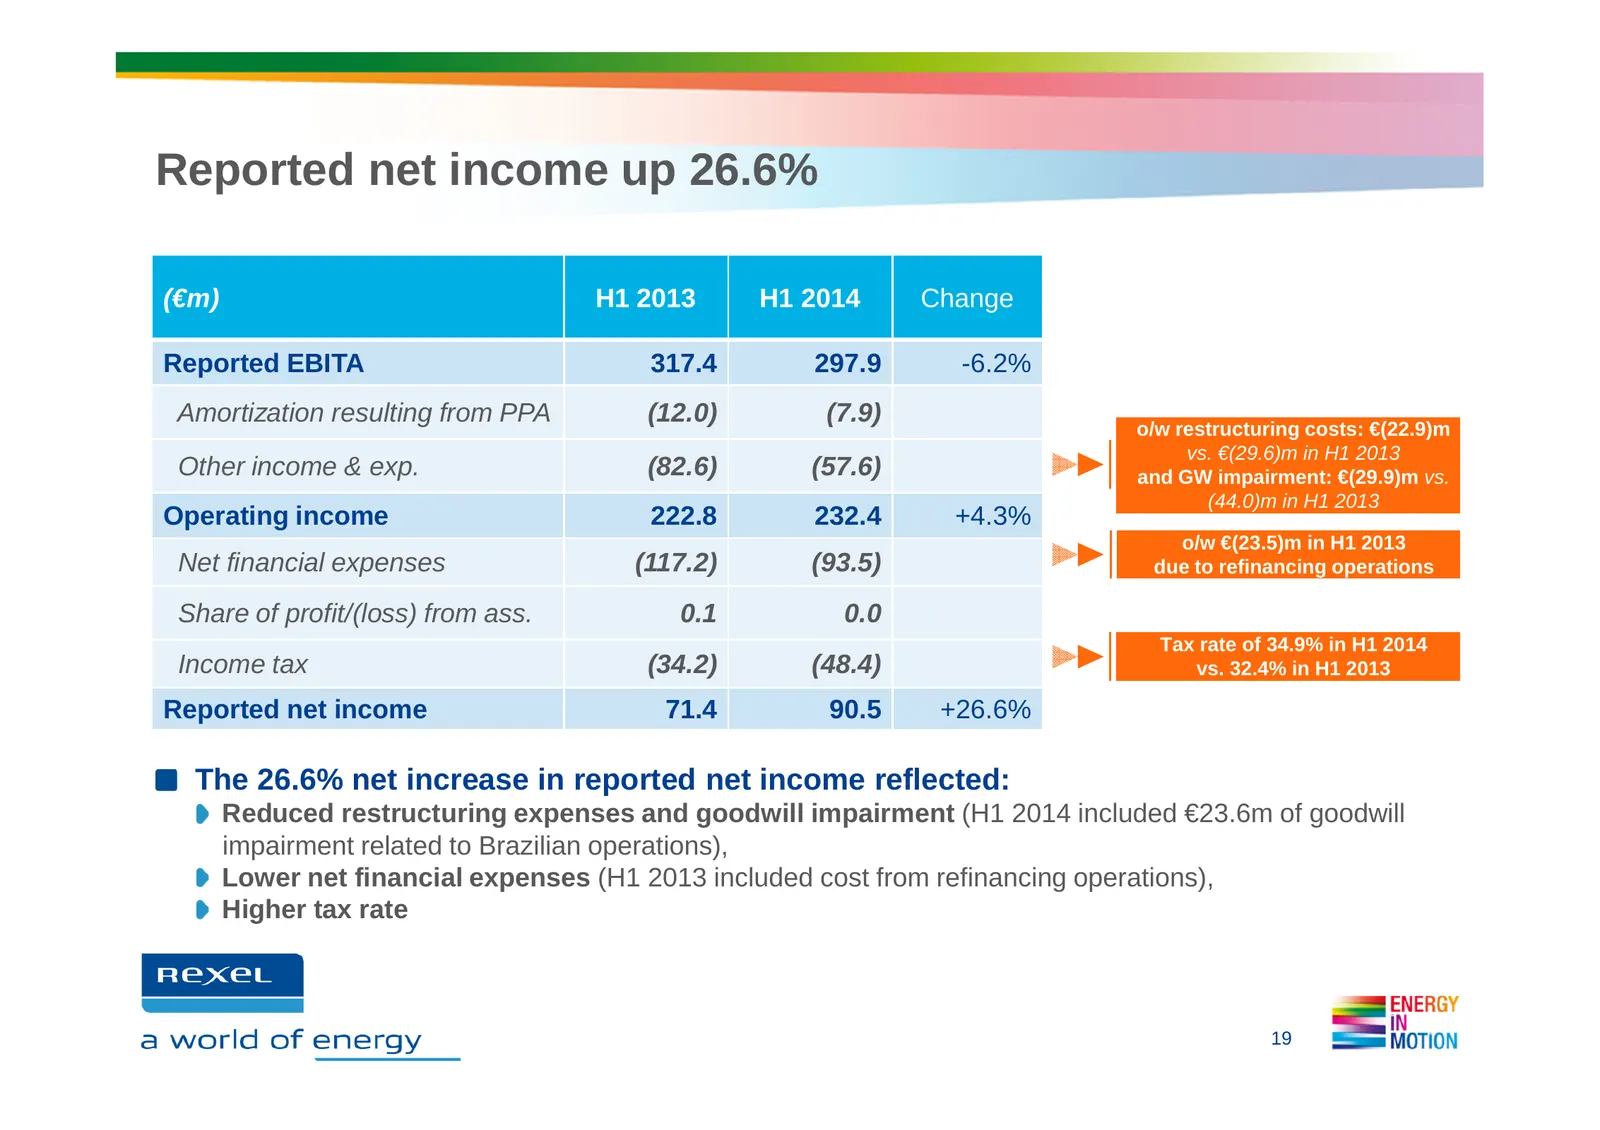
Reported net income up 26.6% (€m) H1 2013 H1 2014 Change Reported EBITA 317.4 297.9 -6.2% Amortization resulting from PPA (12.0) (7.9) o/w restructuring costs: €(22.9)m vs. €(29.6)m in H1 2013 Other income & exp. (82.6) (57.6) and GW impairment: €(29.9)m vs. (44.0)m in H1 2013 Operating income 222.8
Slide 20: FCF before interest and tax impacted by change in WCR
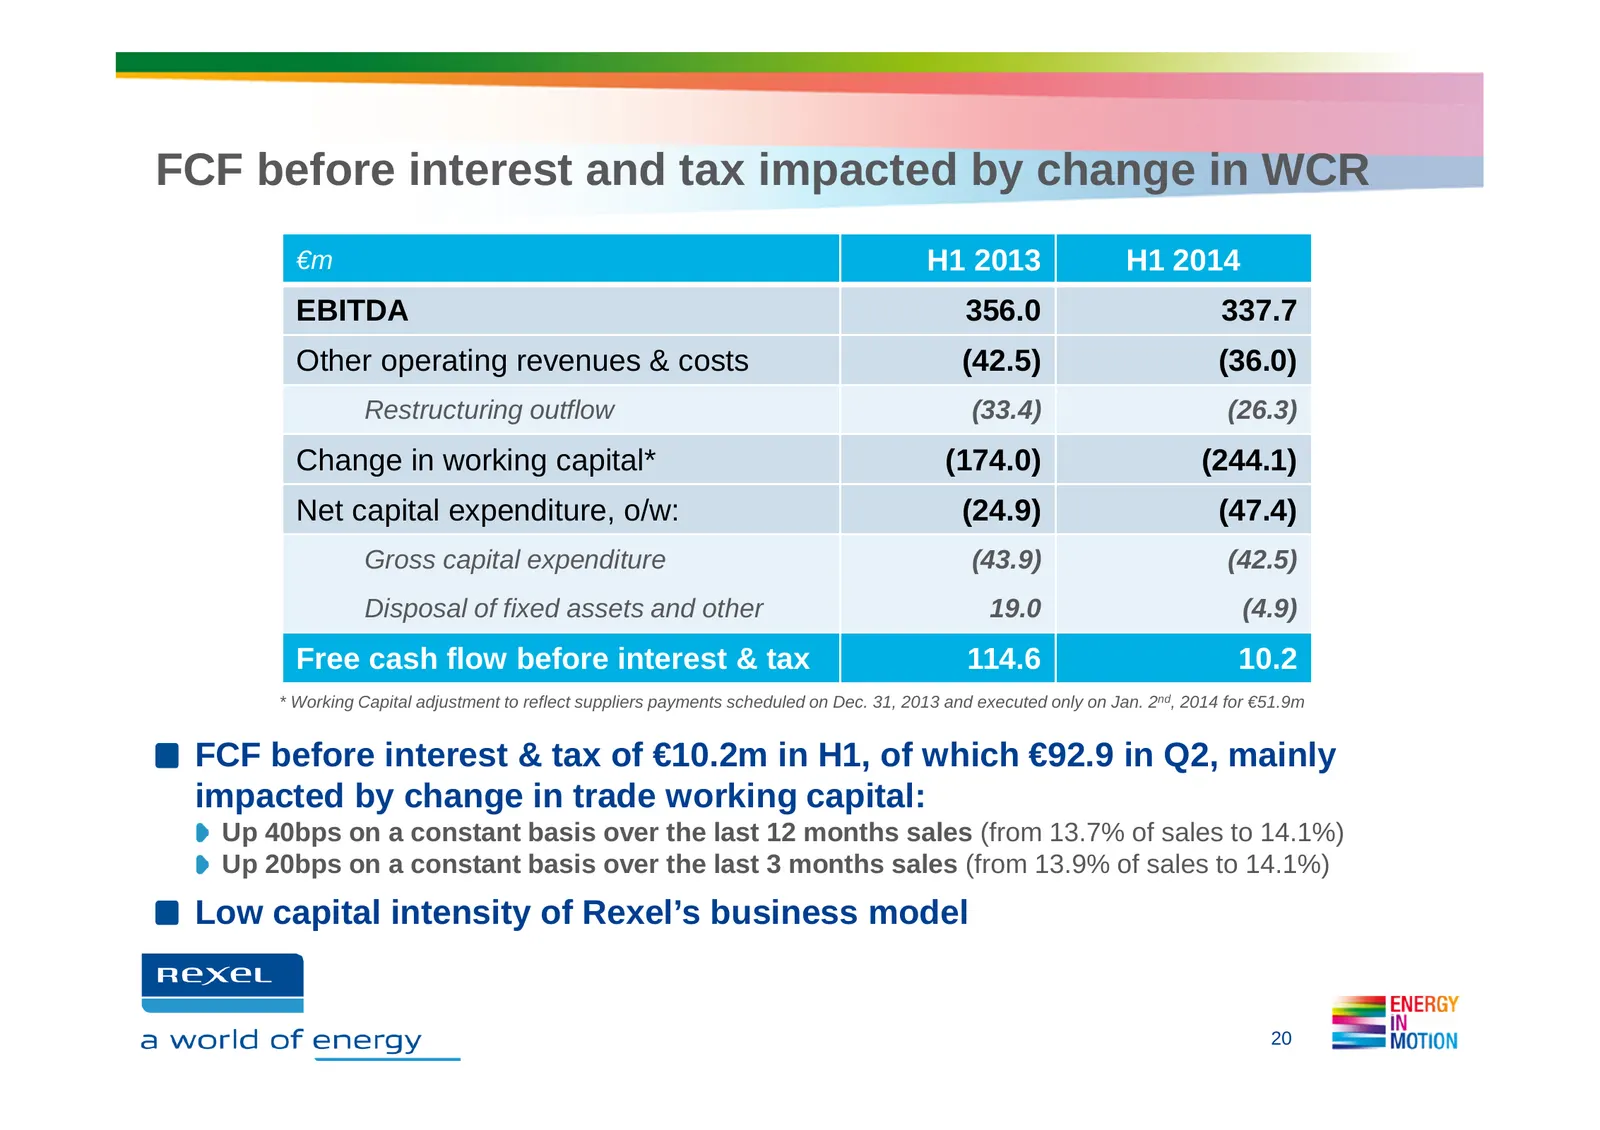
FCF before interest and tax impacted by change in WCR €m H1 2013 H1 2014 EBITDA 356.0 337.7 Other operating revenues & costs (42.5) (36.0) Restructuring outflow (33.4) (26.3) Change in working capital* (174.0) (244.1) Net capital expenditure, o/w: (24.9) (47.4) Gross capital expenditure (43.9) (42.5
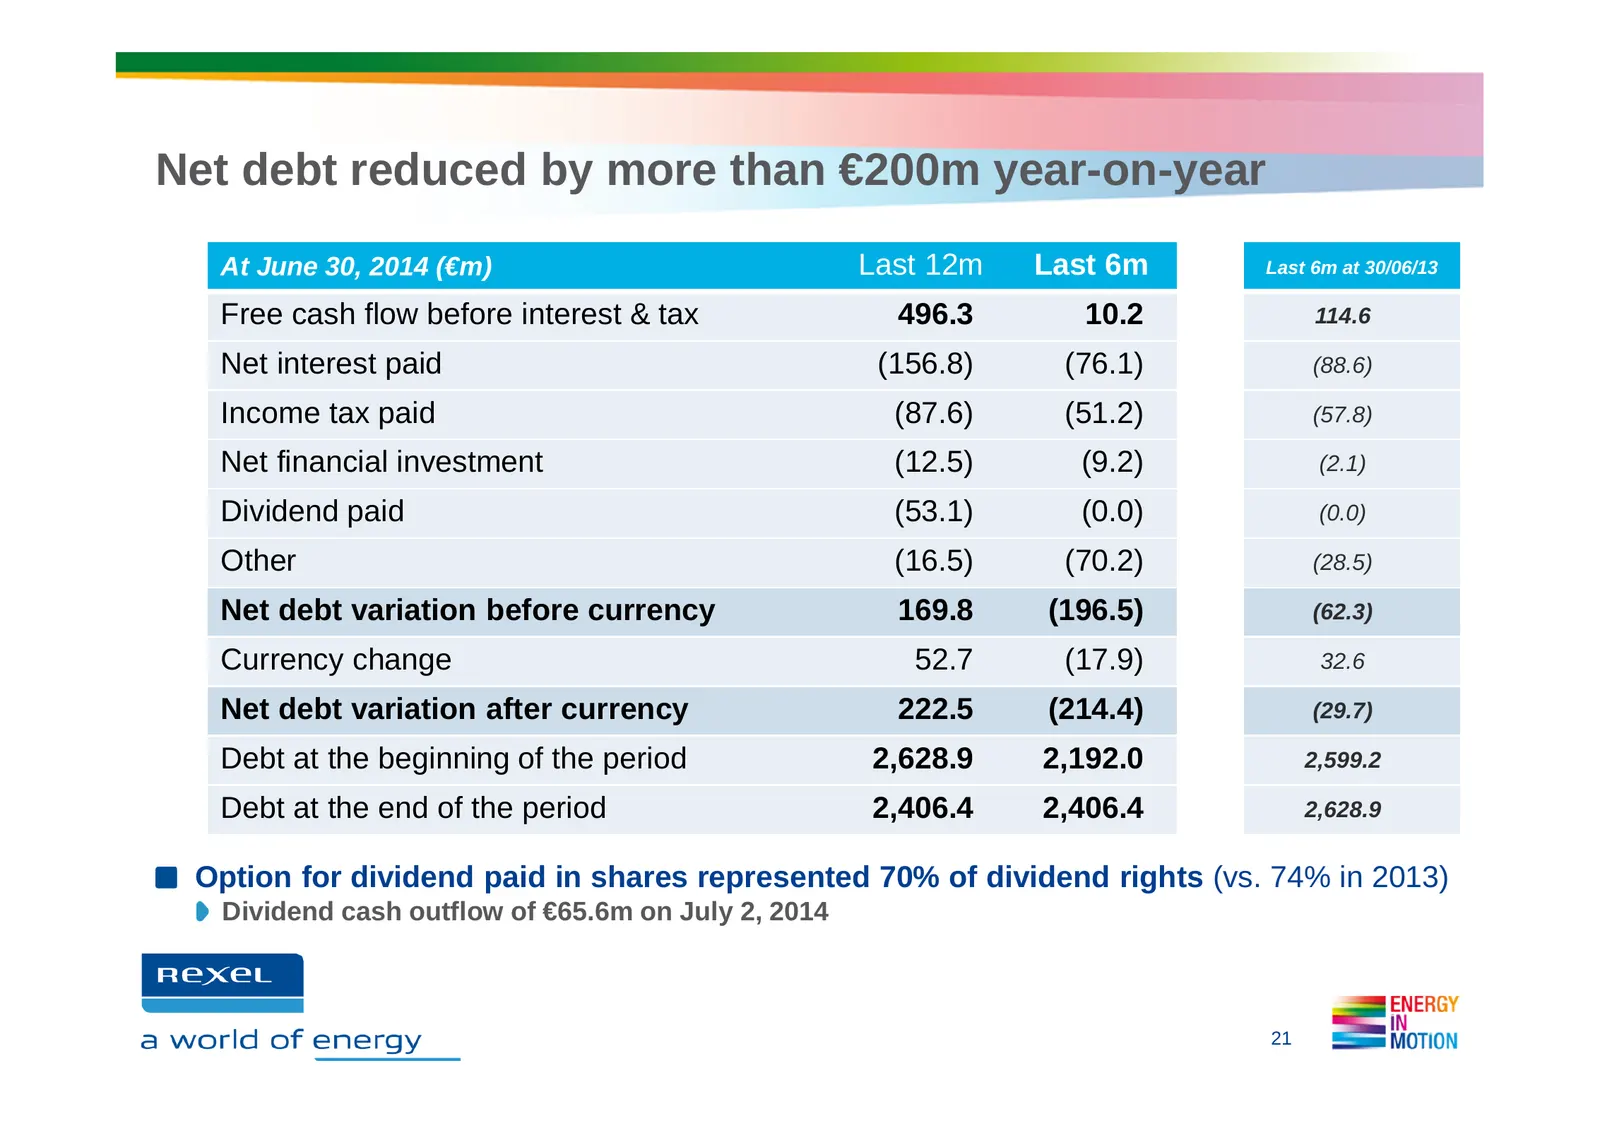
Slide 21: Net debt reduced by more than €200m year-on-year
Net debt reduced by more than €200m year-on-year At June 30, 2014 (€m) Last 12m Last 6m Last 6m at 30/06/13 Free cash flow before interest & tax 496.3 10.2 114.6 Net interest paid (156.8) (76.1) (88.6) Income tax paid (87.6) (51.2) (57.8) Net financial investment (12.5) (9.2) (2.1) Dividend paid (53
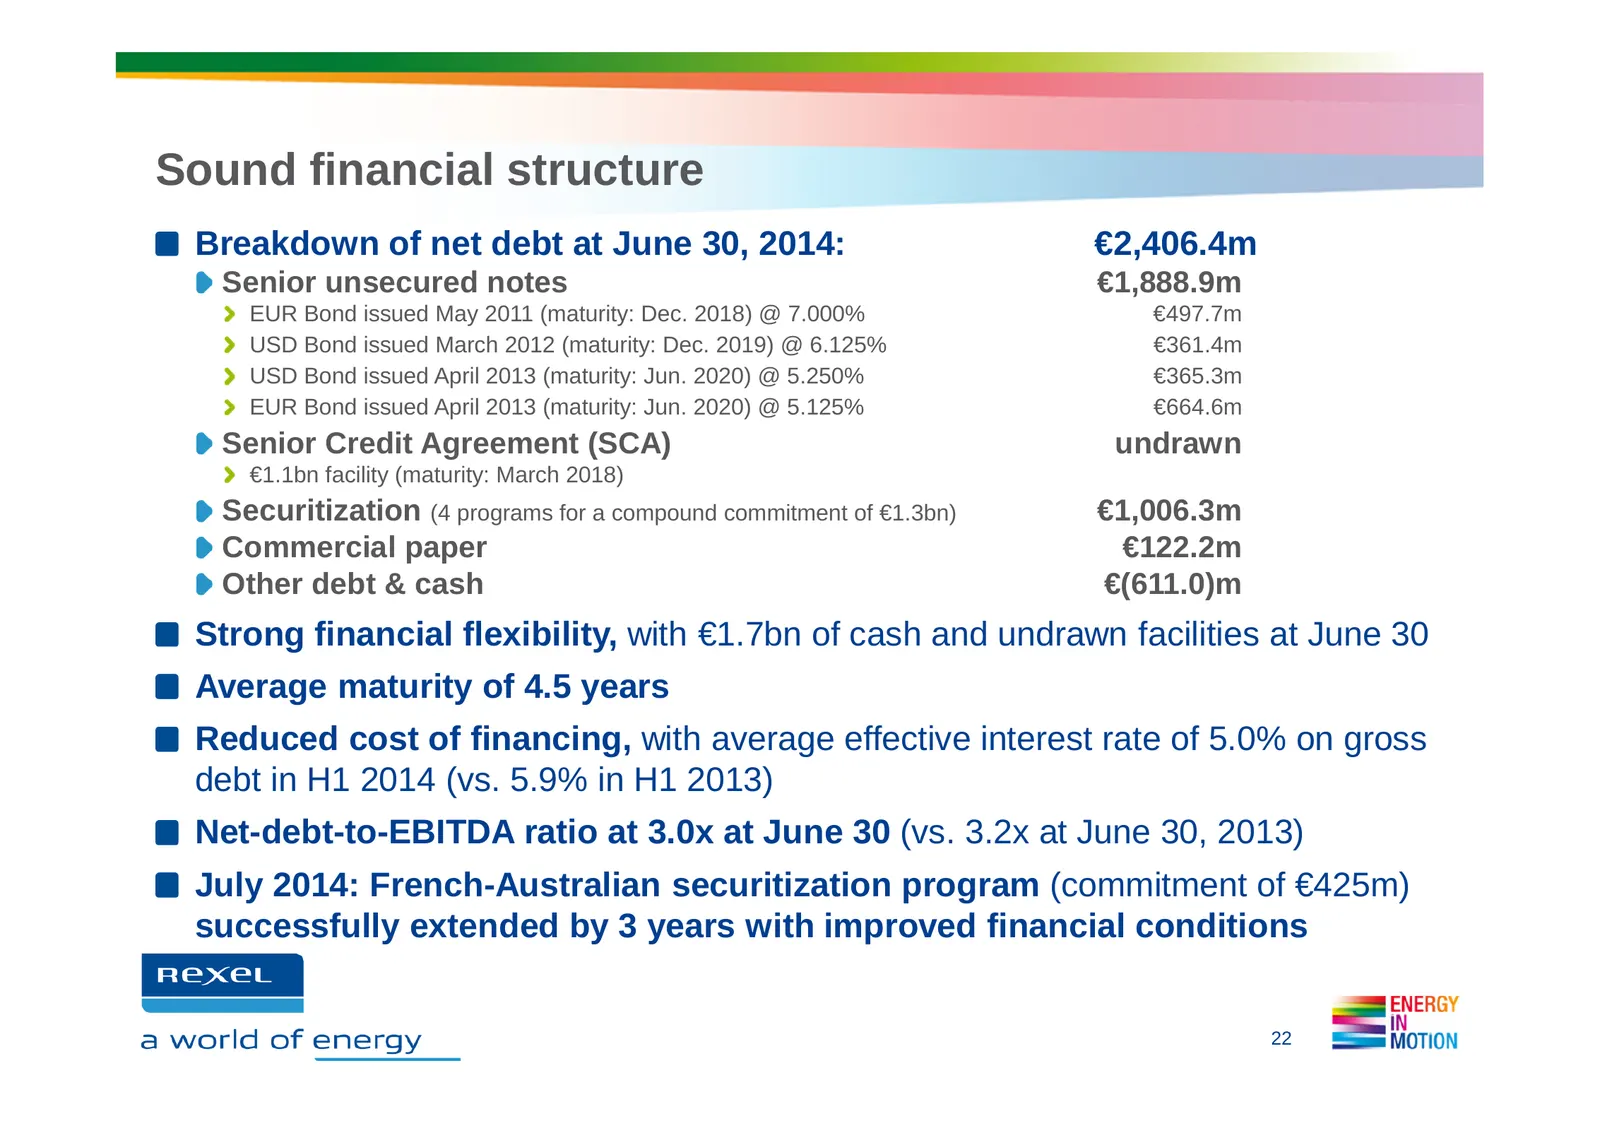
Slide 22: Sound financial structure
Sound financial structure Breakdown of net debt at June 30, 2014: €2,406.4m Senior unsecured notes €1,888.9m EUR Bond issued May 2011 (maturity: Dec. 2018) @ 7.000% €497.7m USD Bond issued March 2012 (maturity: Dec. 2019) @ 6.125% €361.4m USD Bond issued April 2013 (maturity: Jun. 2020) @ 5.250% €36
Slide 23: Outlook
OUTLOOK Ce a world of energy = Flies MOTION
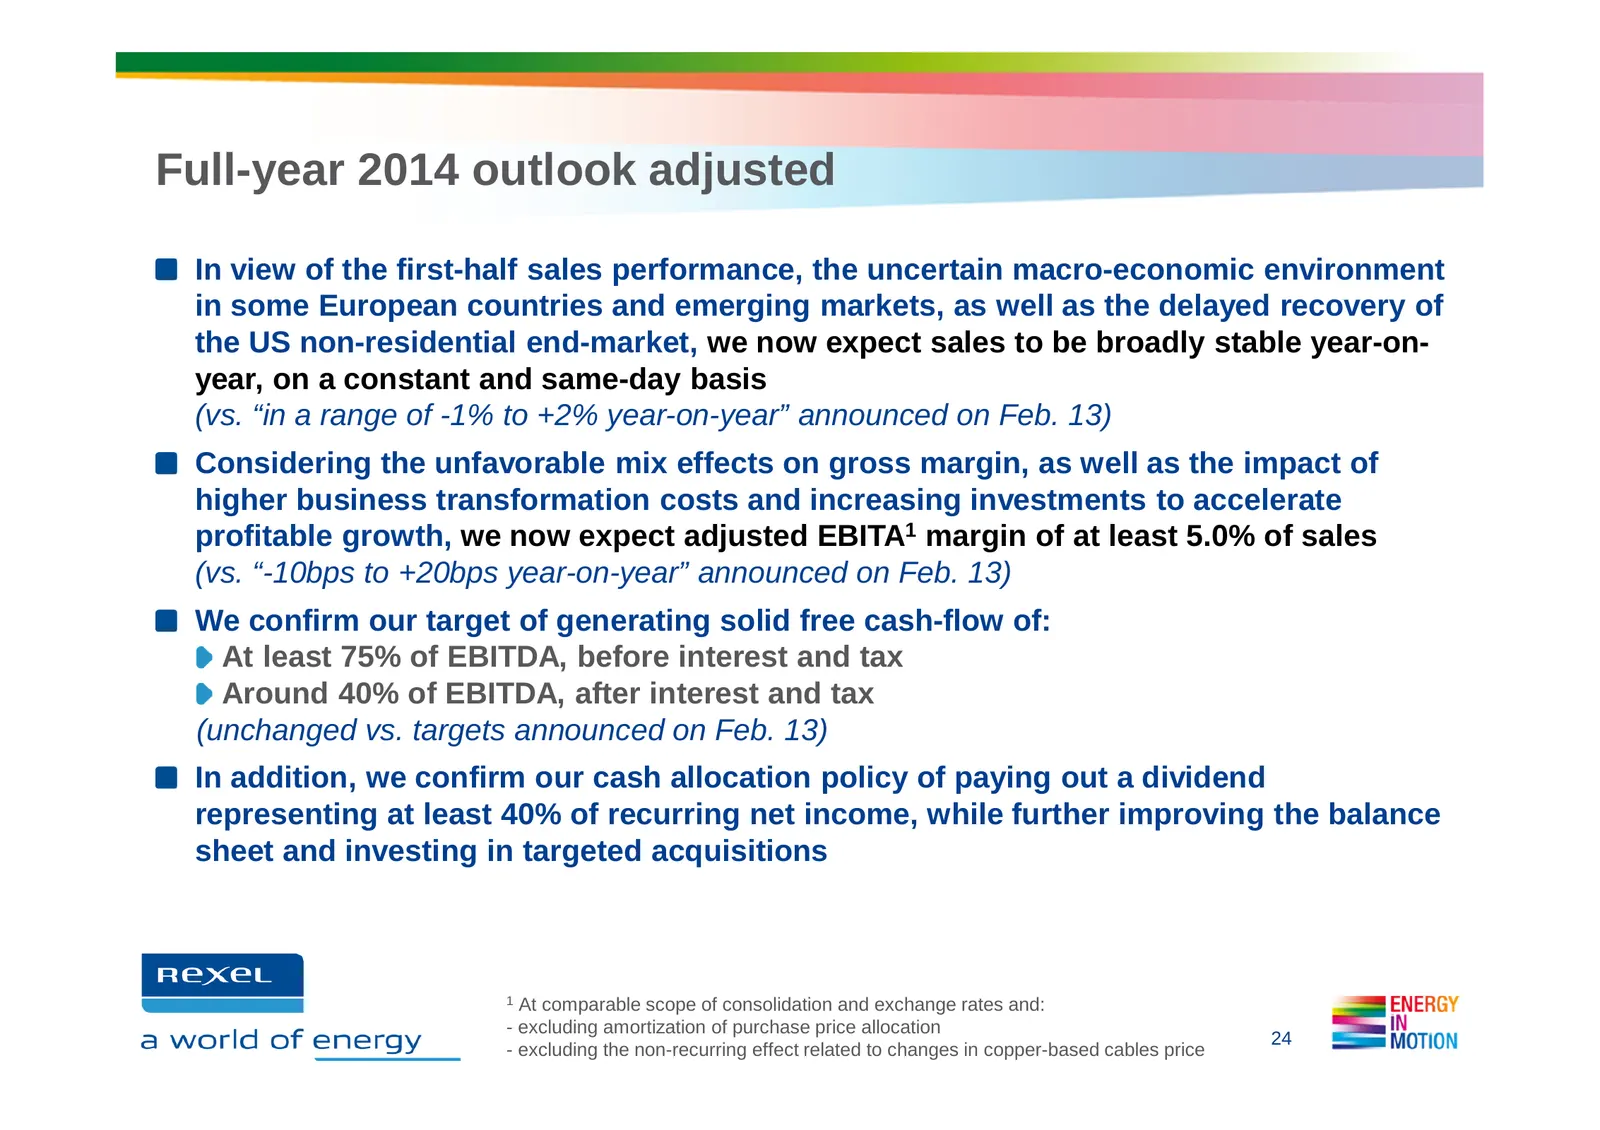
Slide 24: Full-year 2014 outlook adjusted
Full-year 2014 outlook adjusted In view of the first-half sales performance, the uncertain macro-economic environment in some European countries and emerging markets, as well as the delayed recovery of the US non-residential end-market, we now expect sales to be broadly stable year-on- year, on a co
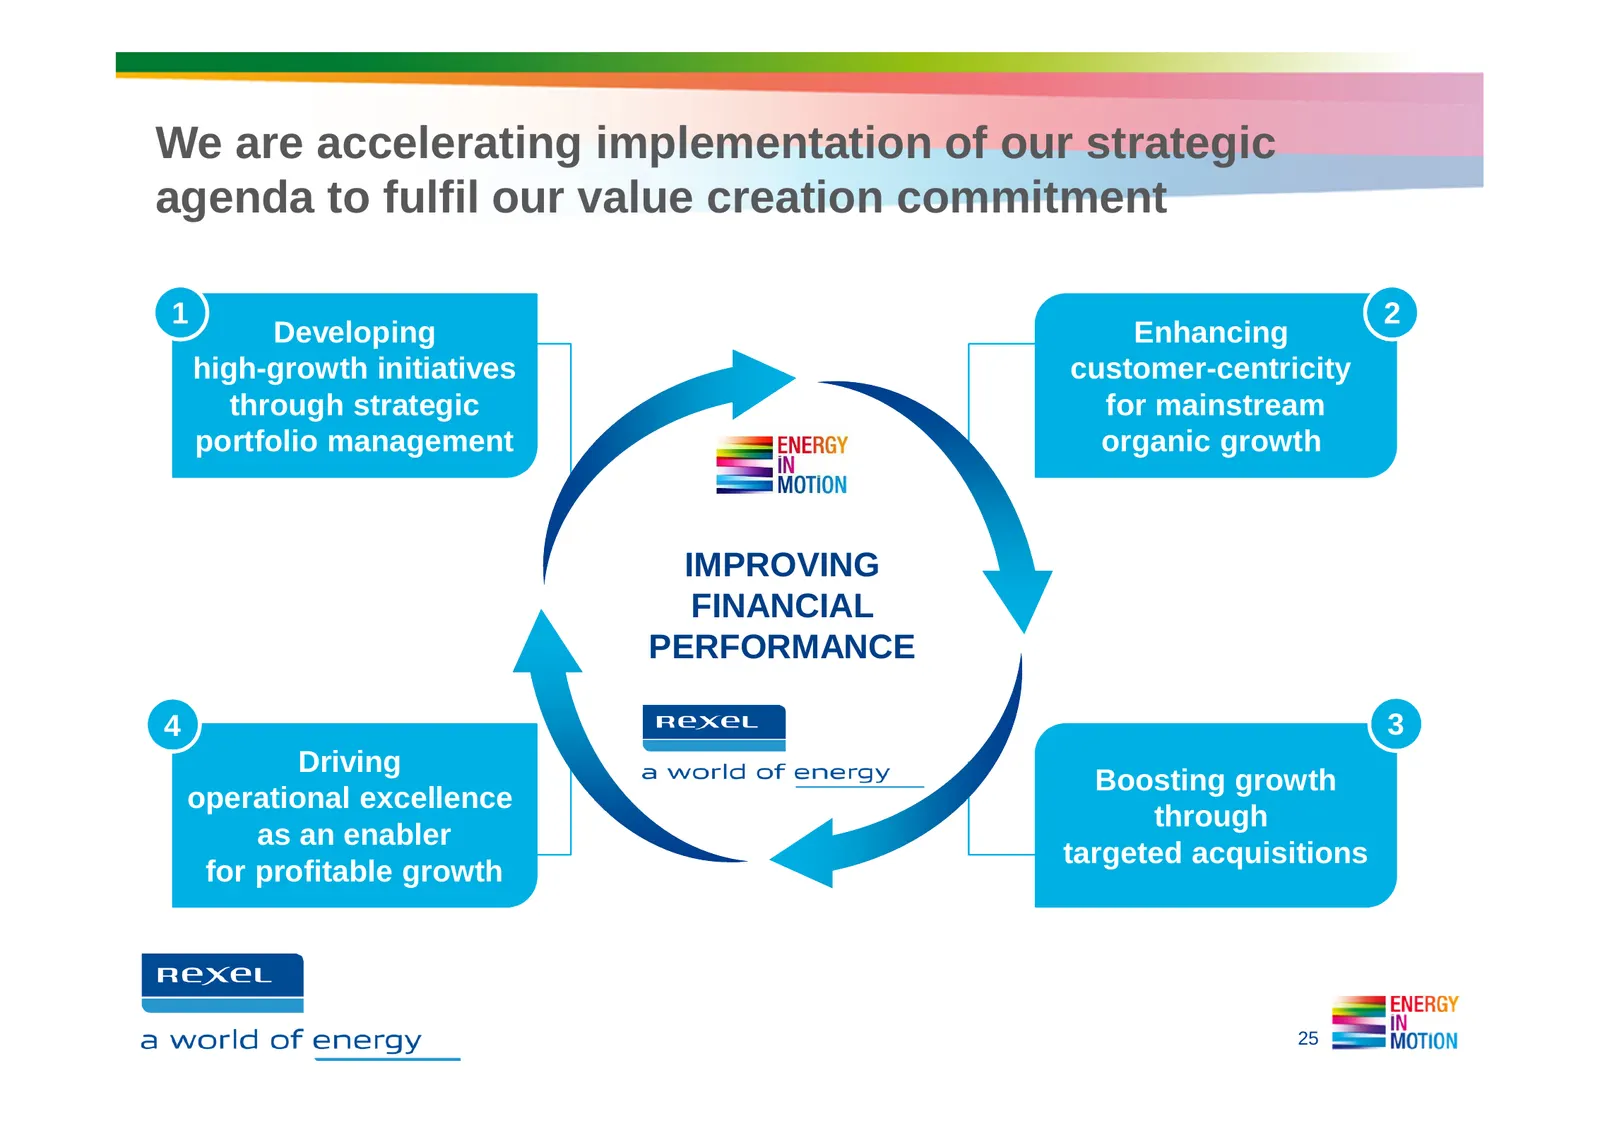
Slide 25: Accelerating implementation of our strategic agenda
We are accelerating implementation of our strategic agenda to fulfil our value creation commitment 1 2 Developing Enhancing high-growth initiatives customer-centricity through strategic for mainstream portfolio management organic growth IMPROVING FINANCIAL PERFORMANCE 4 3 Driving Boosting growth ope
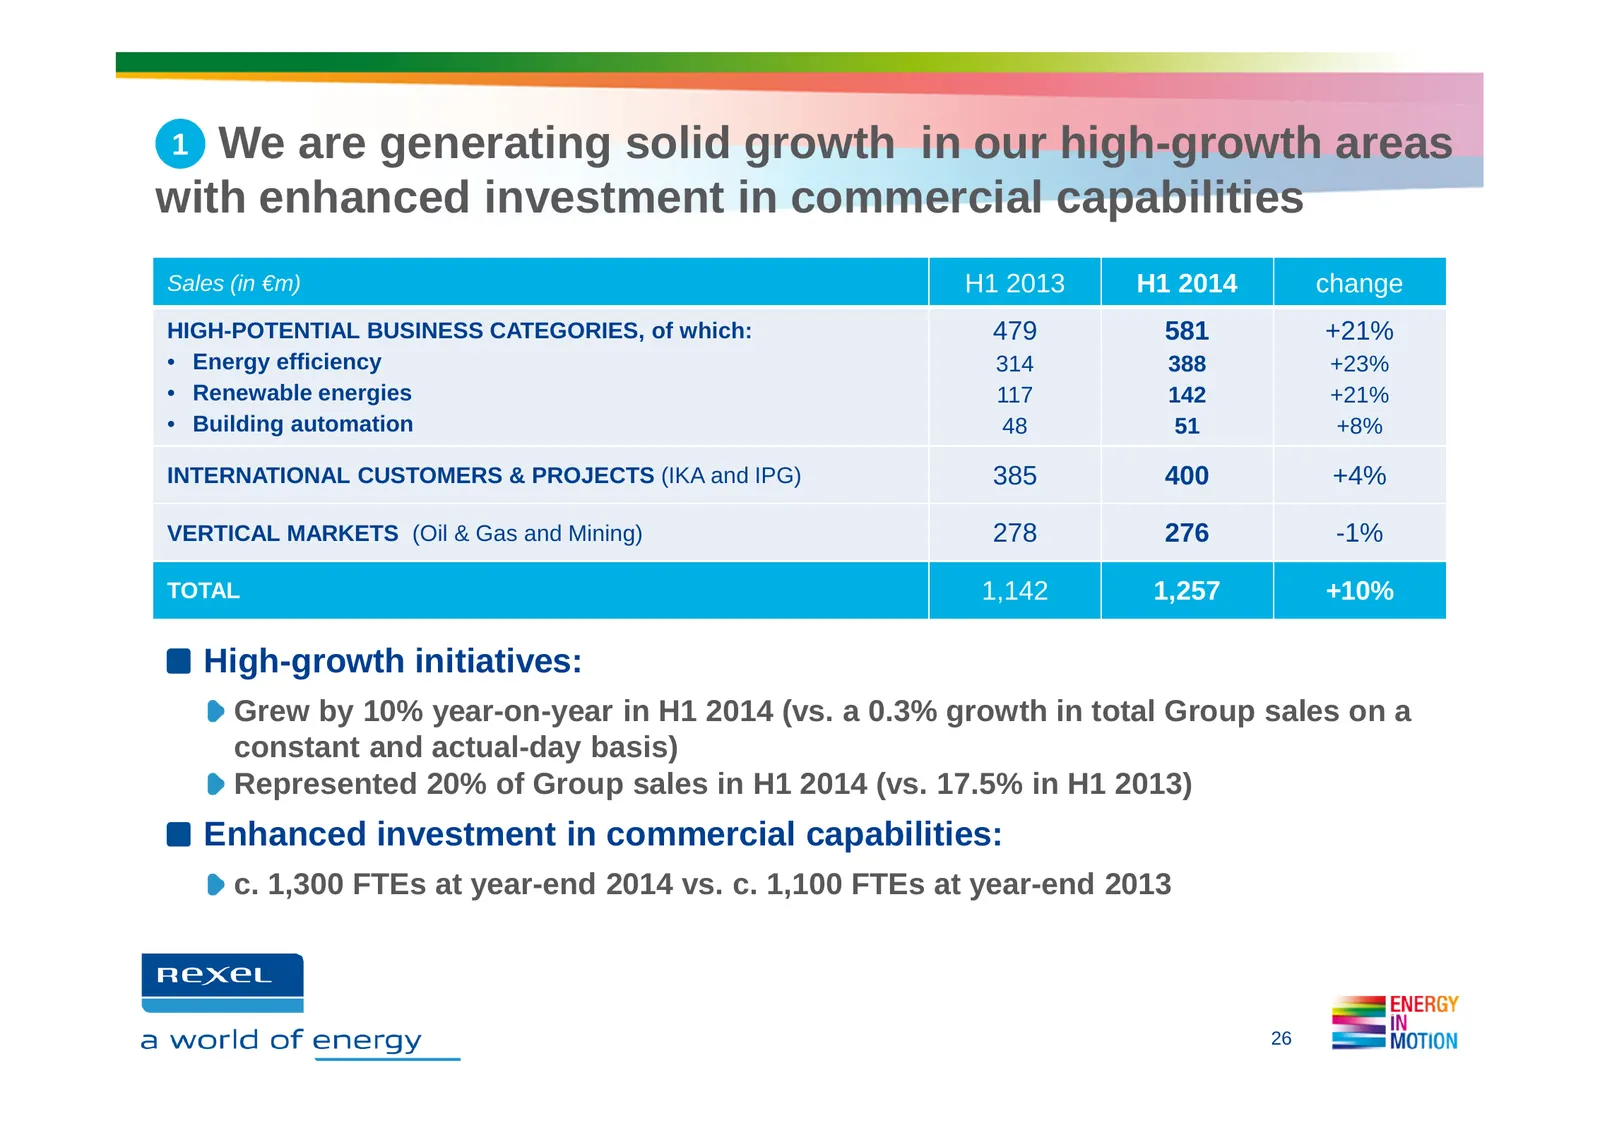
Slide 26: Solid growth in high-growth areas
1 We are generating solid growth in our high-growth areas with enhanced investment in commercial capabilities Sales (in €m) H1 2013 H1 2014 change HIGH-POTENTIAL BUSINESS CATEGORIES, of which: 479 581 +21% • Energy efficiency 314 388 +23% • Renewable energies 117 142 +21% • Building automation 48 51
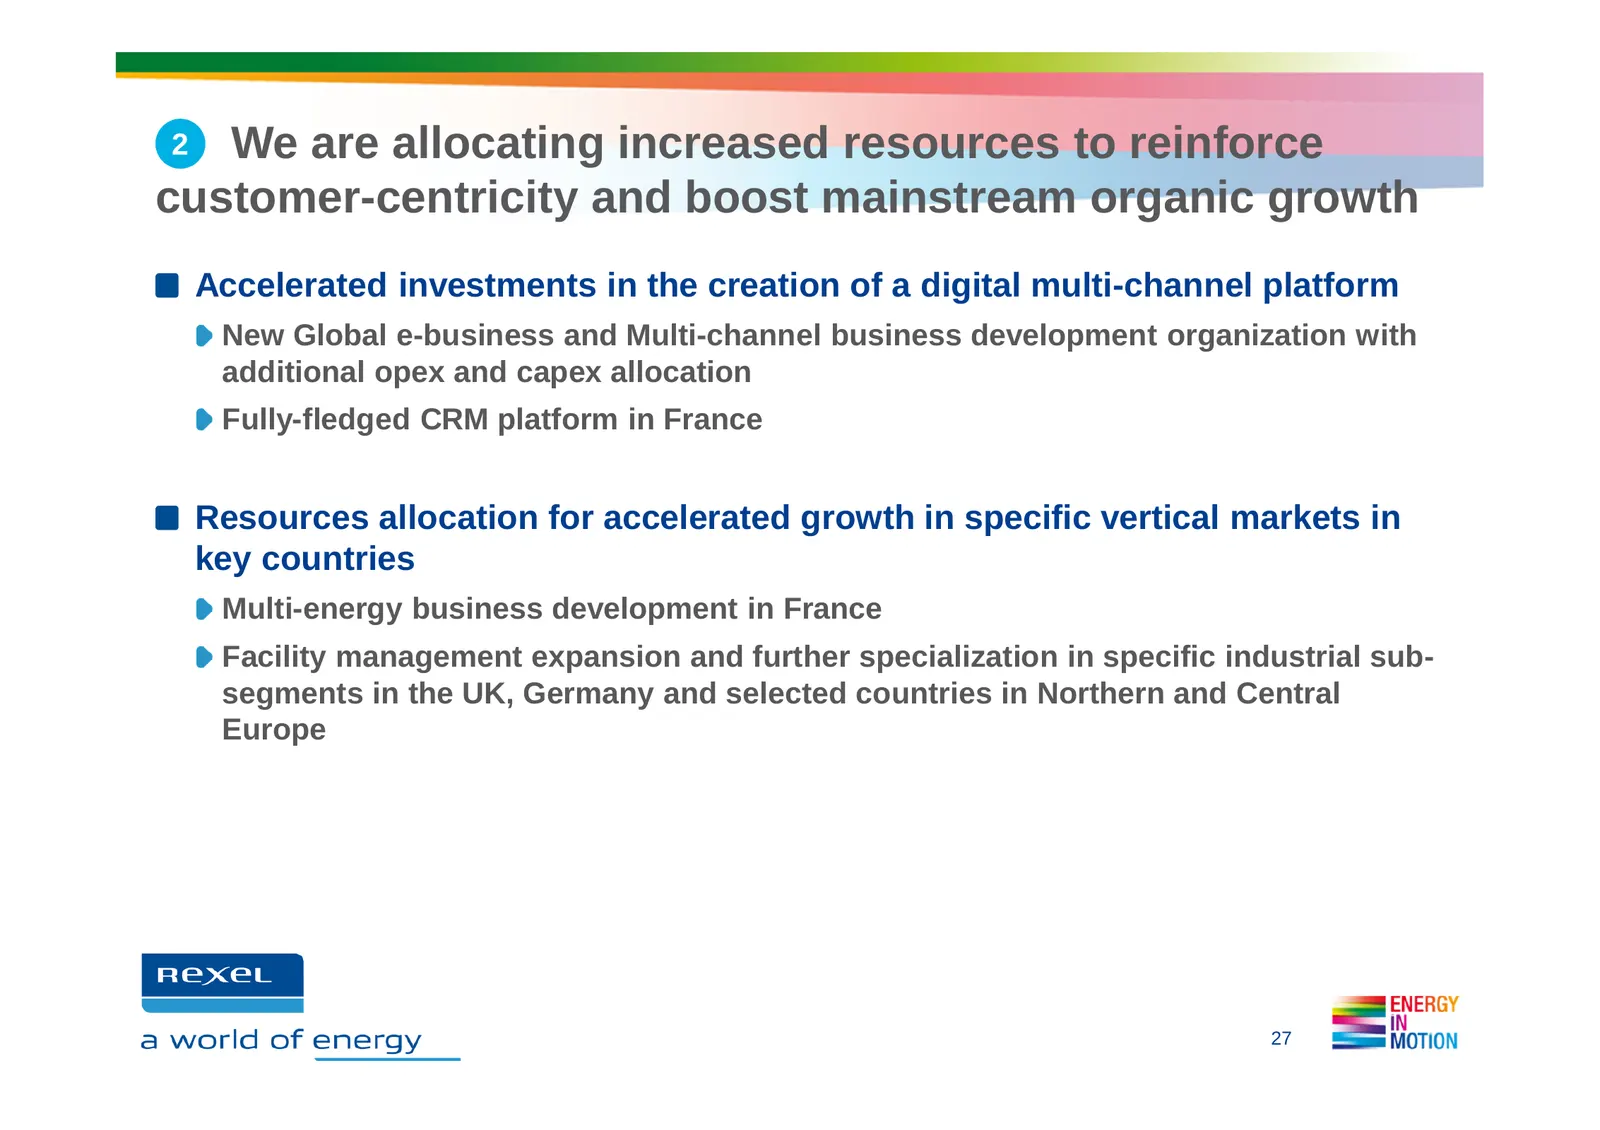
Slide 27: Resources to reinforce customer-centricity and boost organic growth
2 We are allocating increased resources to reinforce customer-centricity and boost mainstream organic growth Accelerated investments in the creation of a digital multi-channel platform New Global e-business and Multi-channel business development organization with additional opex and capex allocation
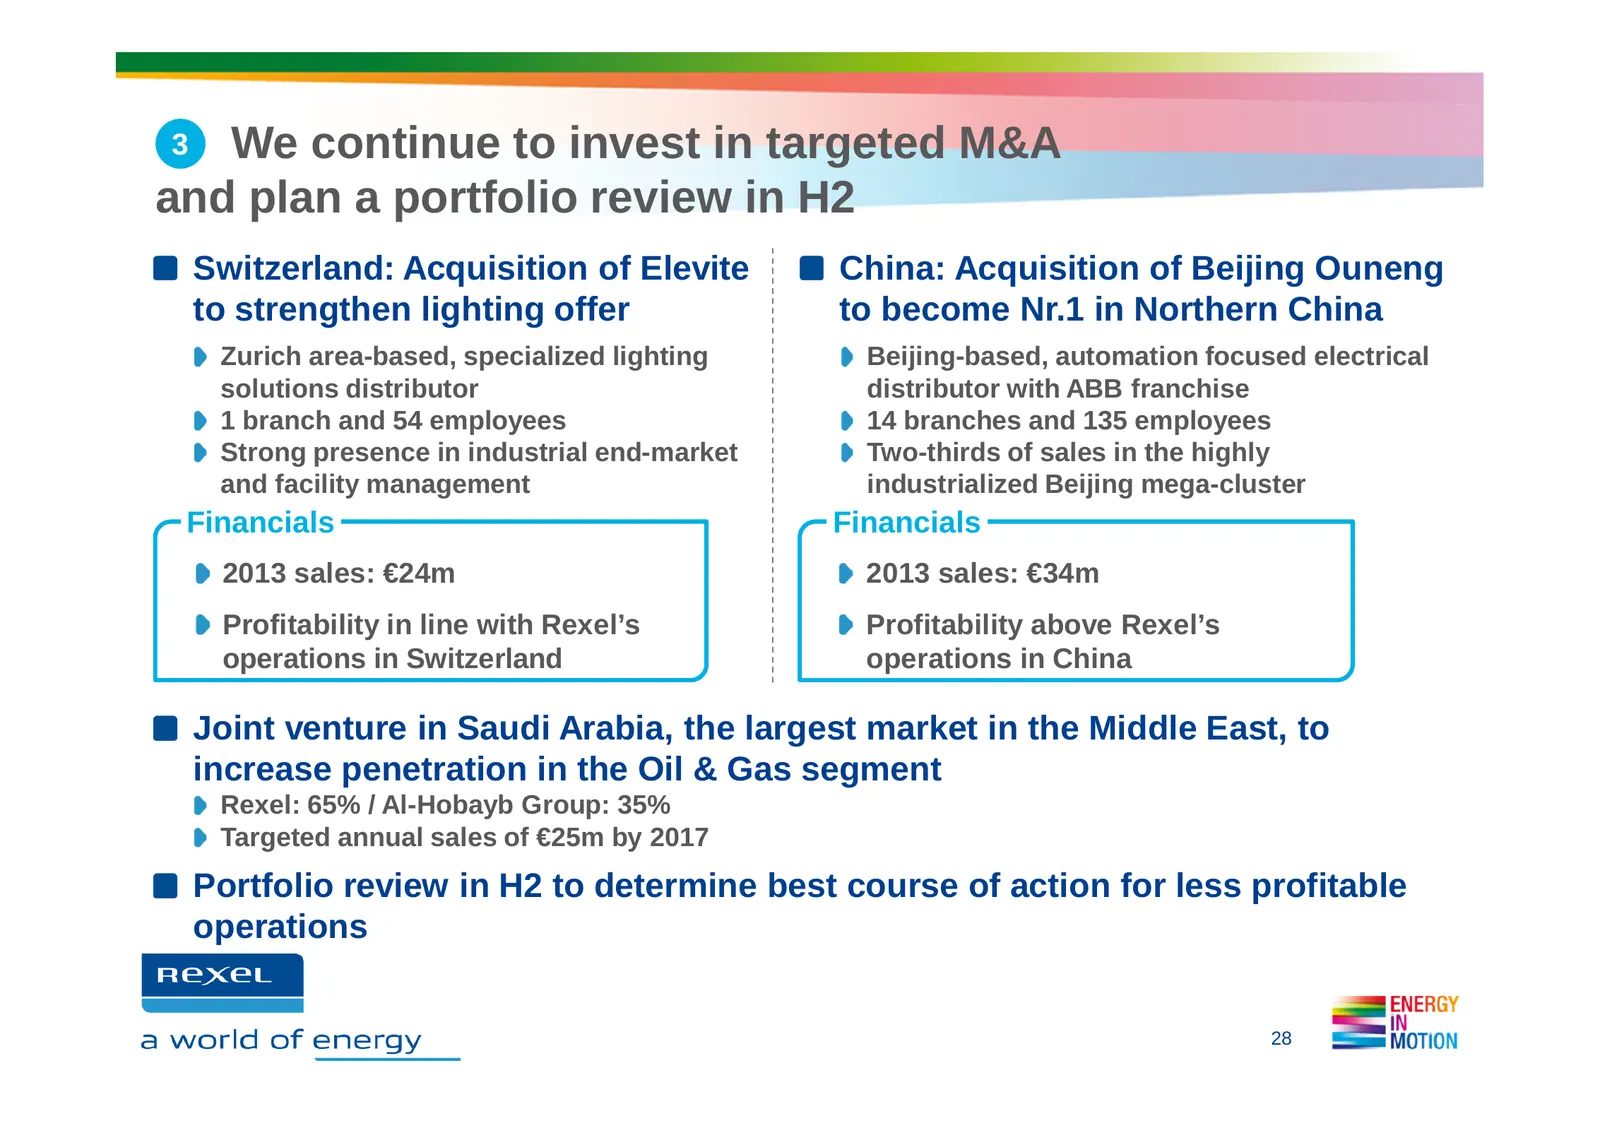
Slide 28: Targeted M&A and portfolio review in H2
3 We continue to invest in targeted M&A and plan a portfolio review in H2 Switzerland: Acquisition of Elevite China: Acquisition of Beijing Ouneng to strengthen lighting offer to become Nr.1 in Northern China Zurich area-based, specialized lighting Beijing-based, automation focused electrical soluti
Slide 29: Driving operational excellence as enabler for profitable growth
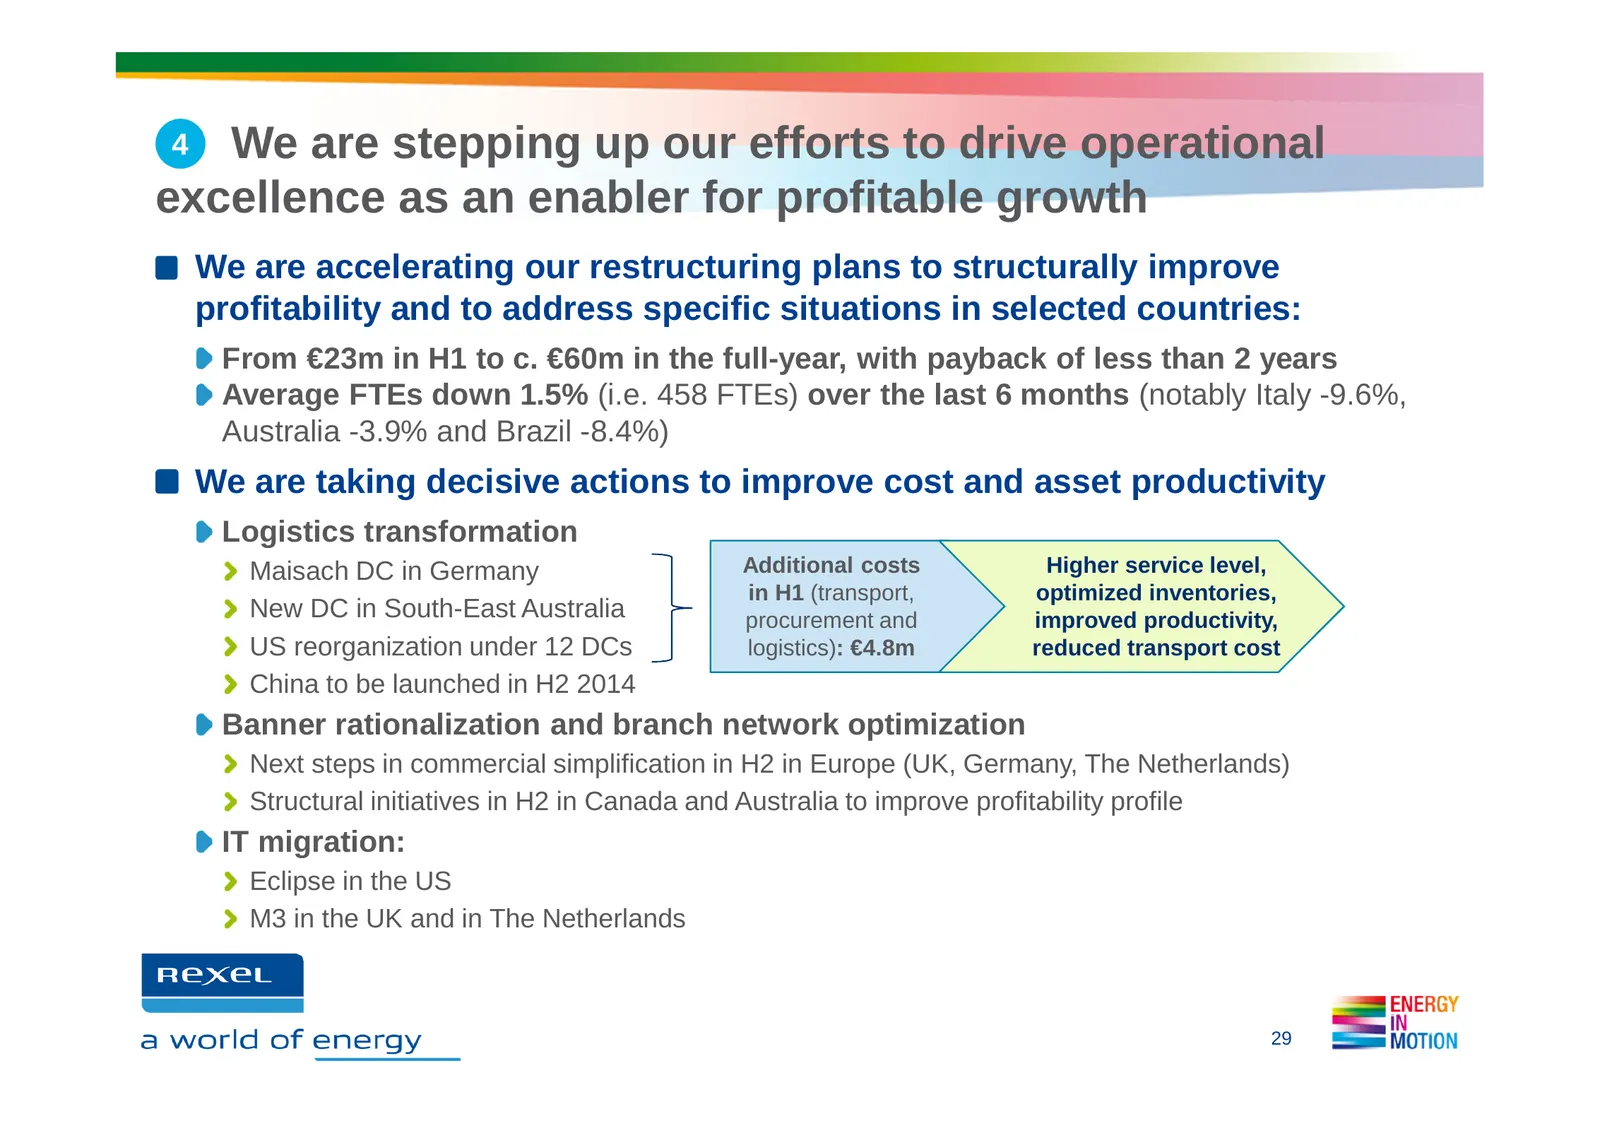
4 We are stepping up our efforts to drive operational excellence as an enabler for profitable growth We are accelerating our restructuring plans to structurally improve profitability and to address specific situations in selected countries: From €23m in H1 to c. €60m in the full-year, with payback o
Slide 30: Strengthening executive leadership and organizational capabilities
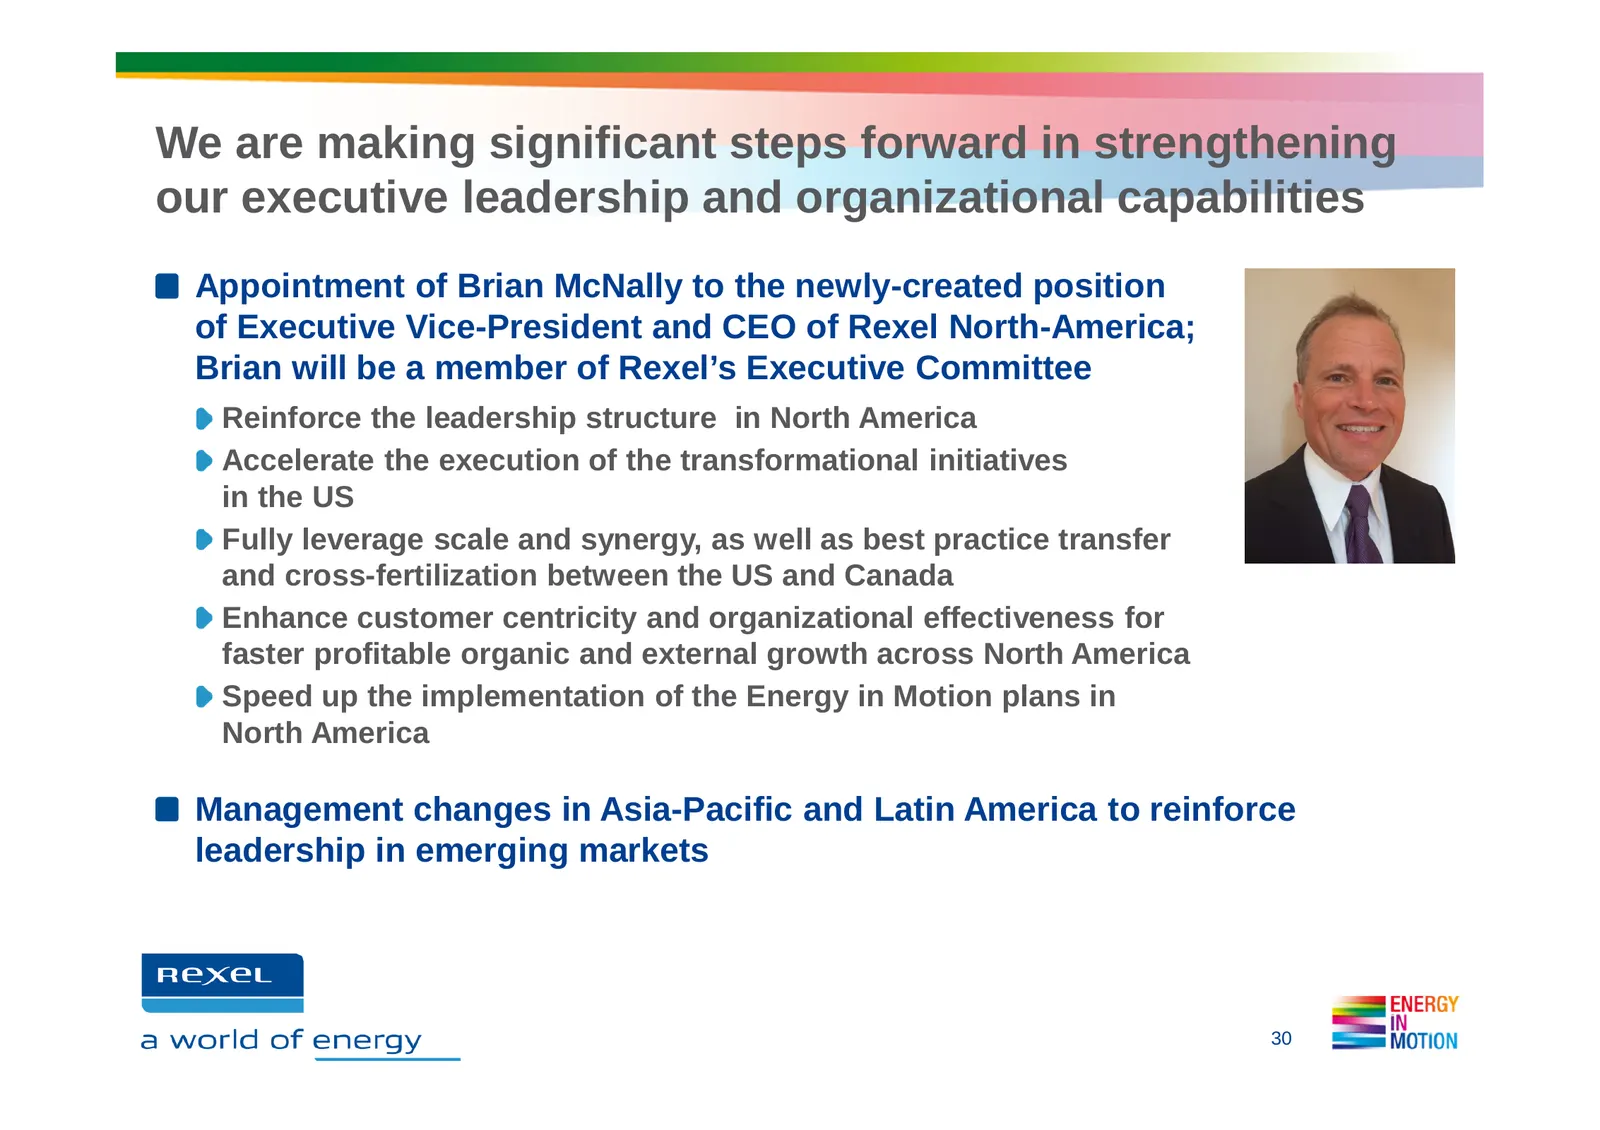
We are making significant steps forward in strengthening our executive leadership and organizational capabilities Appointment of Brian McNally to the newly-created position of Executive Vice-President and CEO of Rexel North-America; Brian will be a member of Rexel’s Executive Committee Reinforce the
Slide 31: Medium-term ambitions unchanged
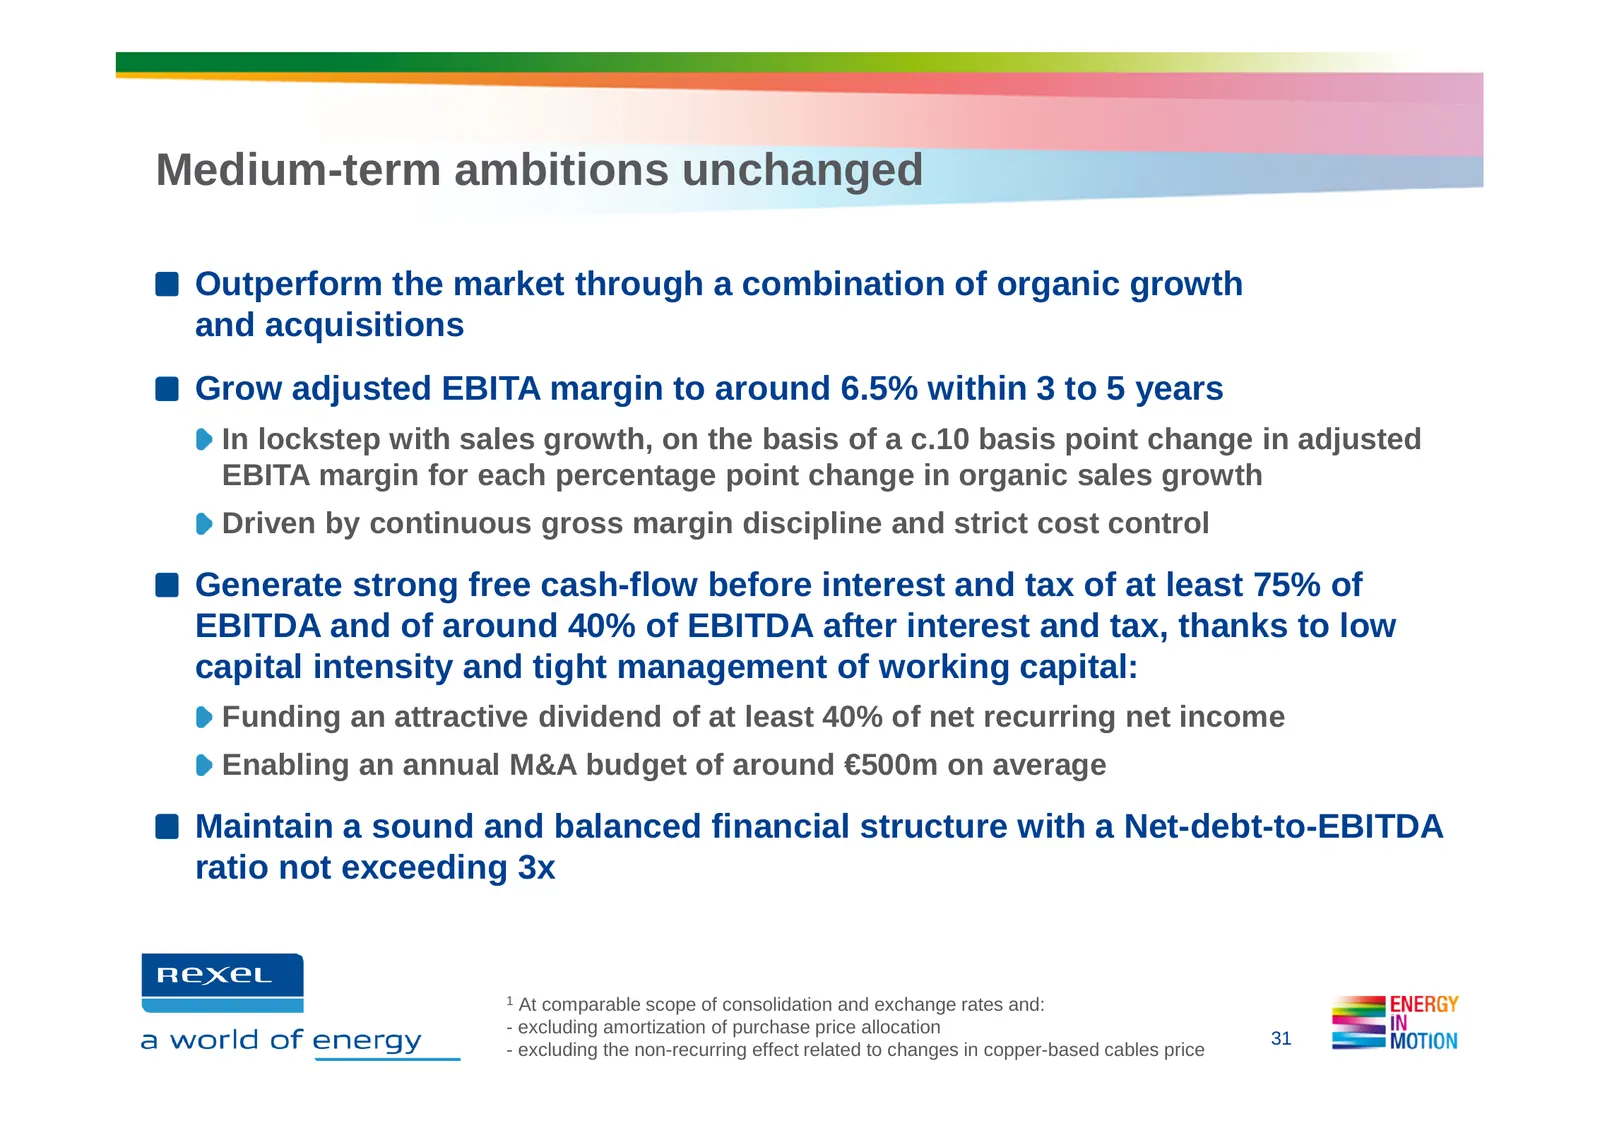
Medium-term ambitions unchanged Outperform the market through a combination of organic growth and acquisitions Grow adjusted EBITA margin to around 6.5% within 3 to 5 years In lockstep with sales growth, on the basis of a c.10 basis point change in adjusted EBITA margin for each percentage point cha
Slide 32: Appendices
APPENDICES Ce a world of energy = Flies MOTION
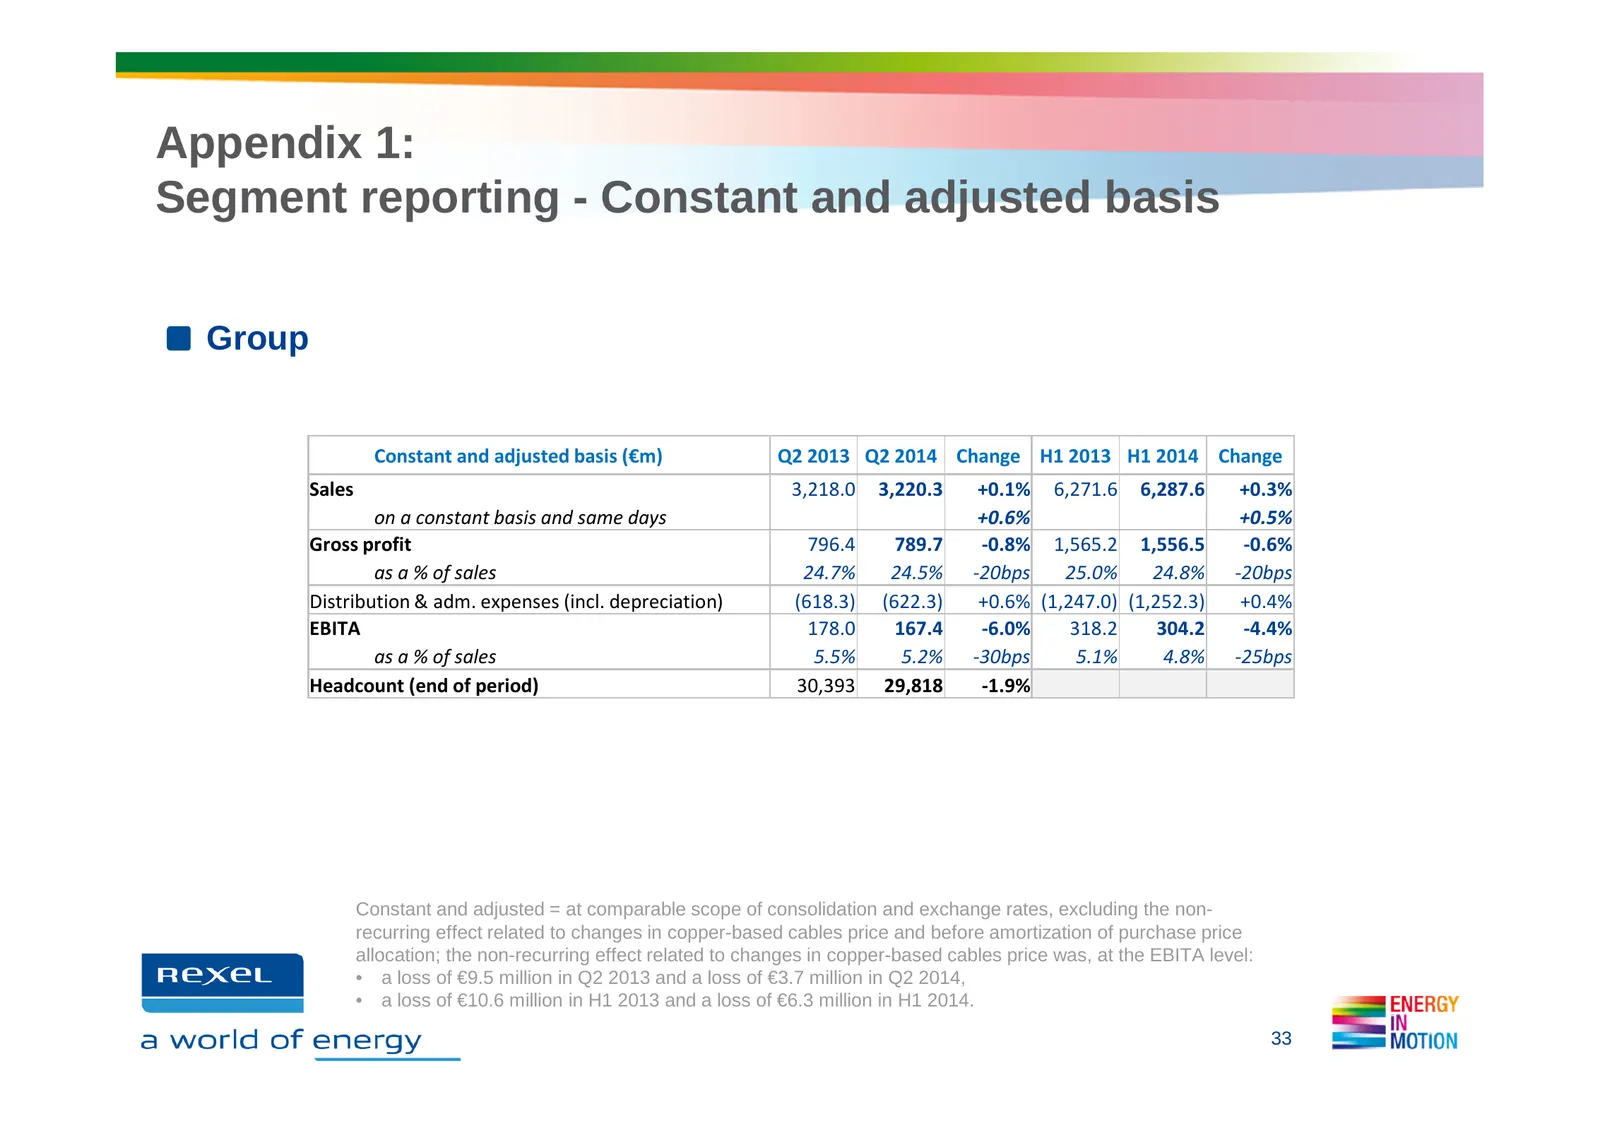
Slide 33: Appendix 1: Segment reporting - Group
Appendix 1: Segment reporting - Constant and adjusted basis Group Constant and adjusted basis (€m) Q2 2013 Q2 2014 Change H1 2013 H1 2014 Change Sales 3,218.0 3,220.3 +0.1% 6,271.6 6,287.6 +0.3% on a constant basis and same days +0.6% +0.5% Gross profit 796.4 789.7 -0.8% 1,565.2 1,556.5 -0.6% as a %
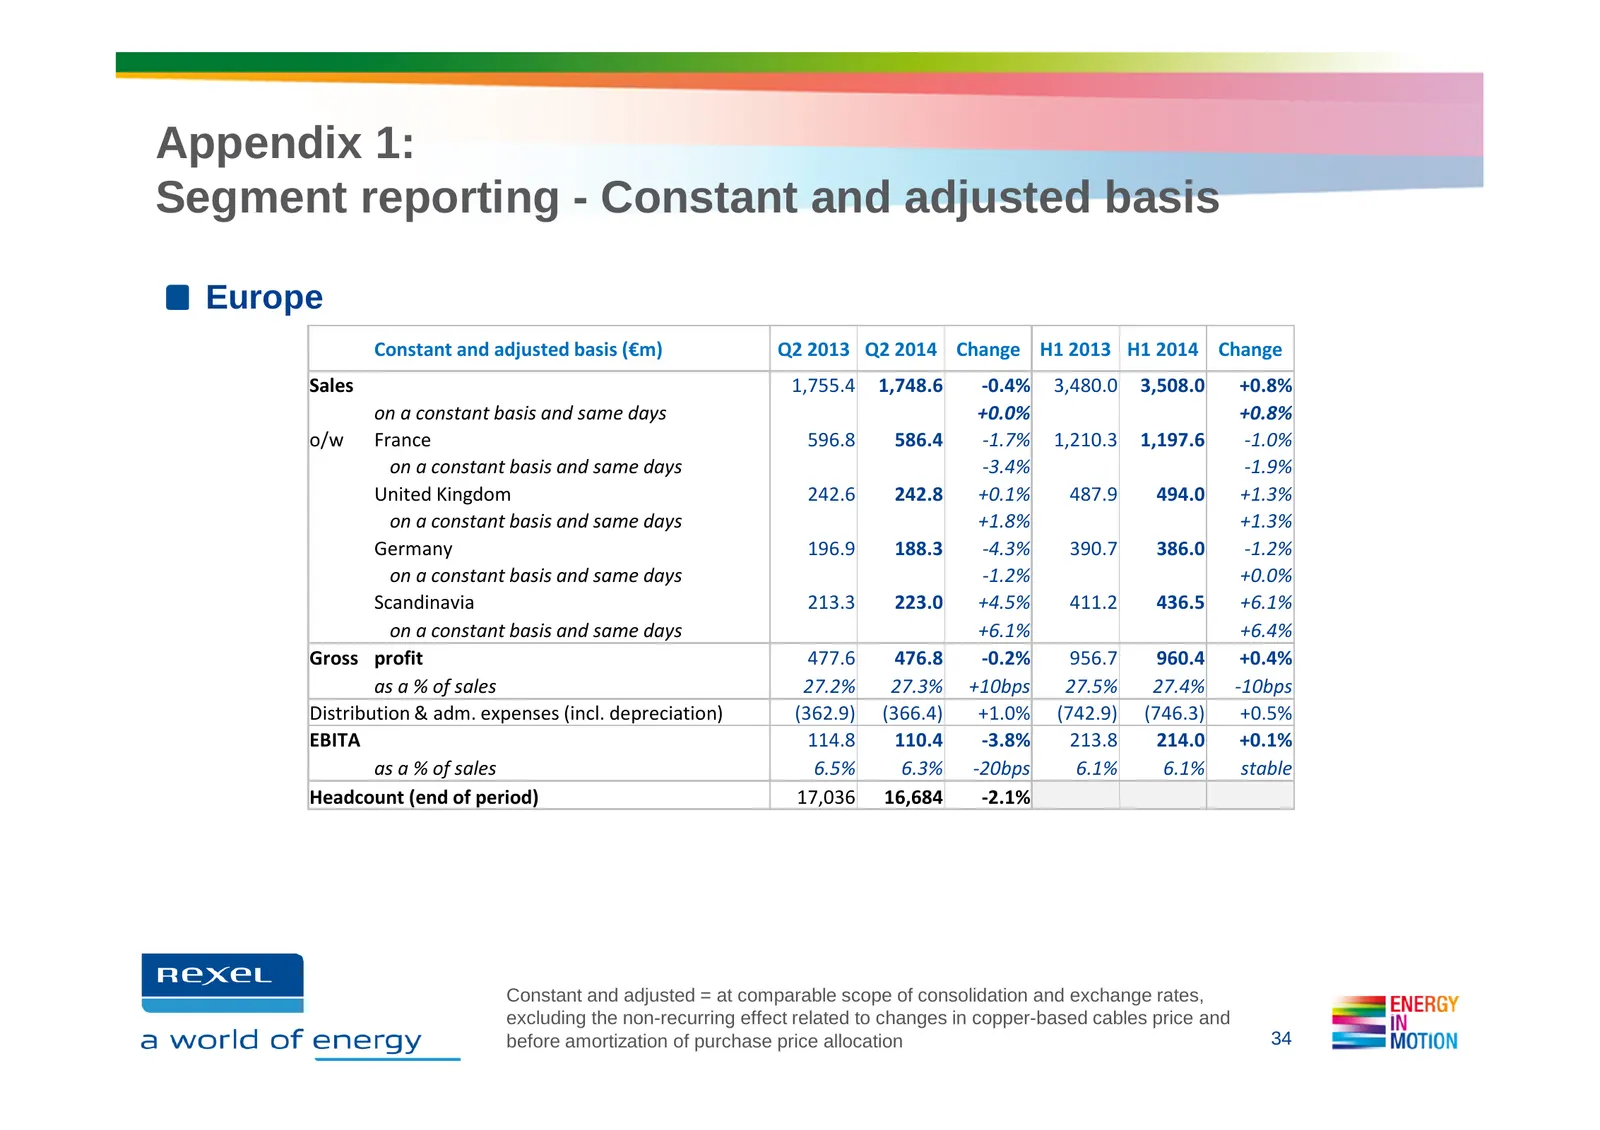
Slide 34: Appendix 1: Segment reporting - Europe
Appendix 1: Segment reporting - Constant and adjusted basis Europe Constant and adjusted basis (€m) Q2 2013 Q2 2014 Change H1 2013 H1 2014 Change Sales 1,755.4 1,748.6 -0.4% 3,480.0 3,508.0 +0.8% on a constant basis and same days +0.0% +0.8% o/w France 596.8 586.4 -1.7% 1,210.3 1,197.6 -1.0% on a co
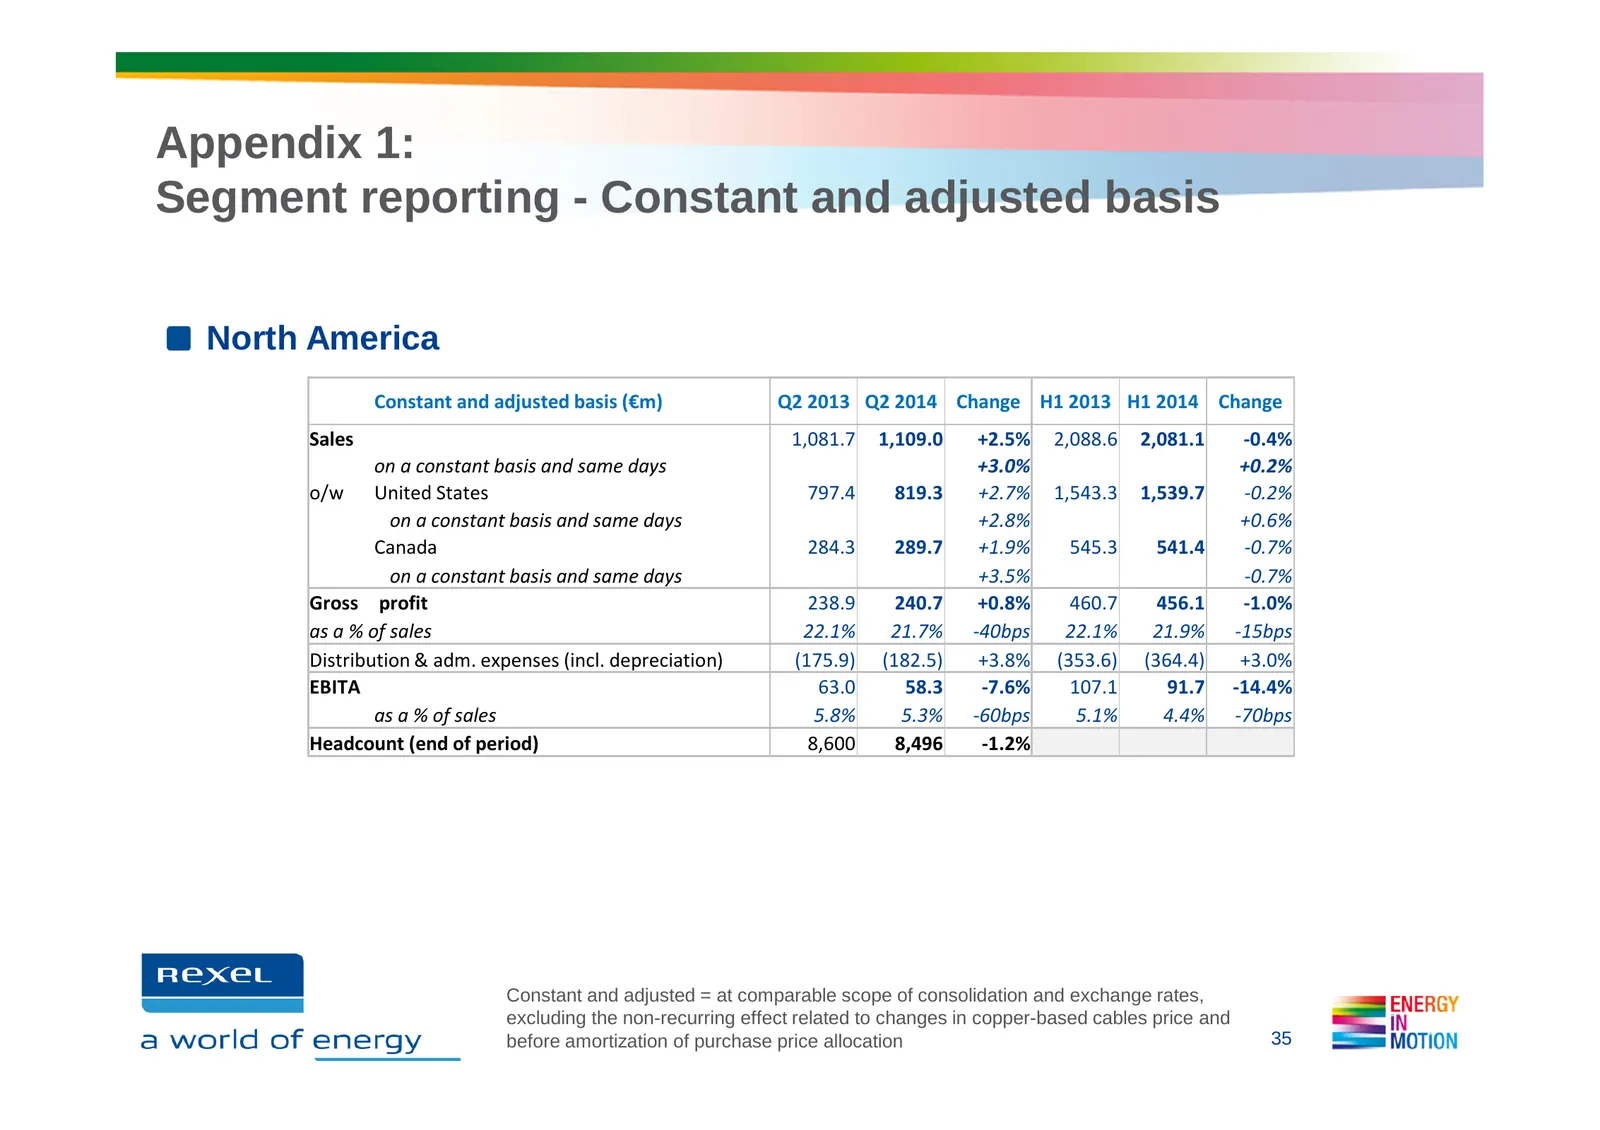
Slide 35: Appendix 1: Segment reporting - North America
Appendix 1: Segment reporting - Constant and adjusted basis North America Constant and adjusted basis (€m) Q2 2013 Q2 2014 Change H1 2013 H1 2014 Change Sales 1,081.7 1,109.0 +2.5% 2,088.6 2,081.1 -0.4% on a constant basis and same days +3.0% +0.2% o/w United States 797.4 819.3 +2.7% 1,543.3 1,539.7
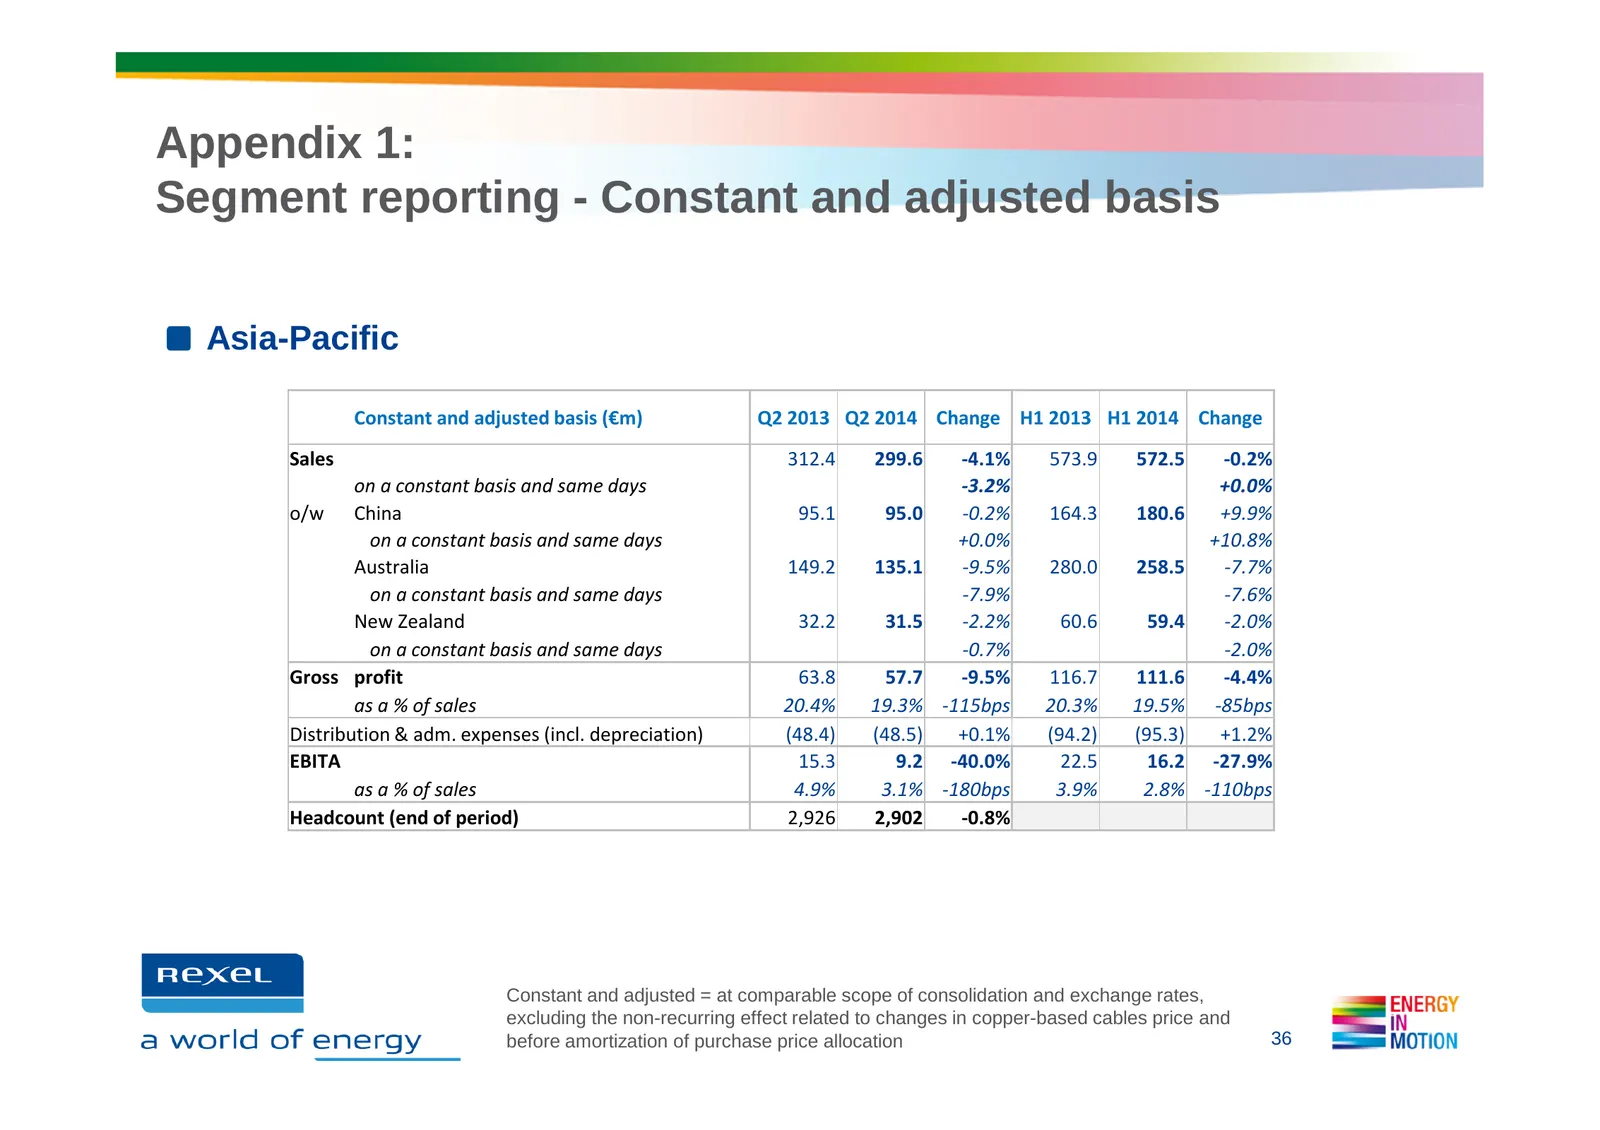
Slide 36: Appendix 1: Segment reporting - Asia-Pacific
Appendix 1: Segment reporting - Constant and adjusted basis Asia-Pacific Constant and adjusted basis (€m) Q2 2013 Q2 2014 Change H1 2013 H1 2014 Change Sales 312.4 299.6 -4.1% 573.9 572.5 -0.2% on a constant basis and same days -3.2% +0.0% o/w China 95.1 95.0 -0.2% 164.3 180.6 +9.9% on a constant ba
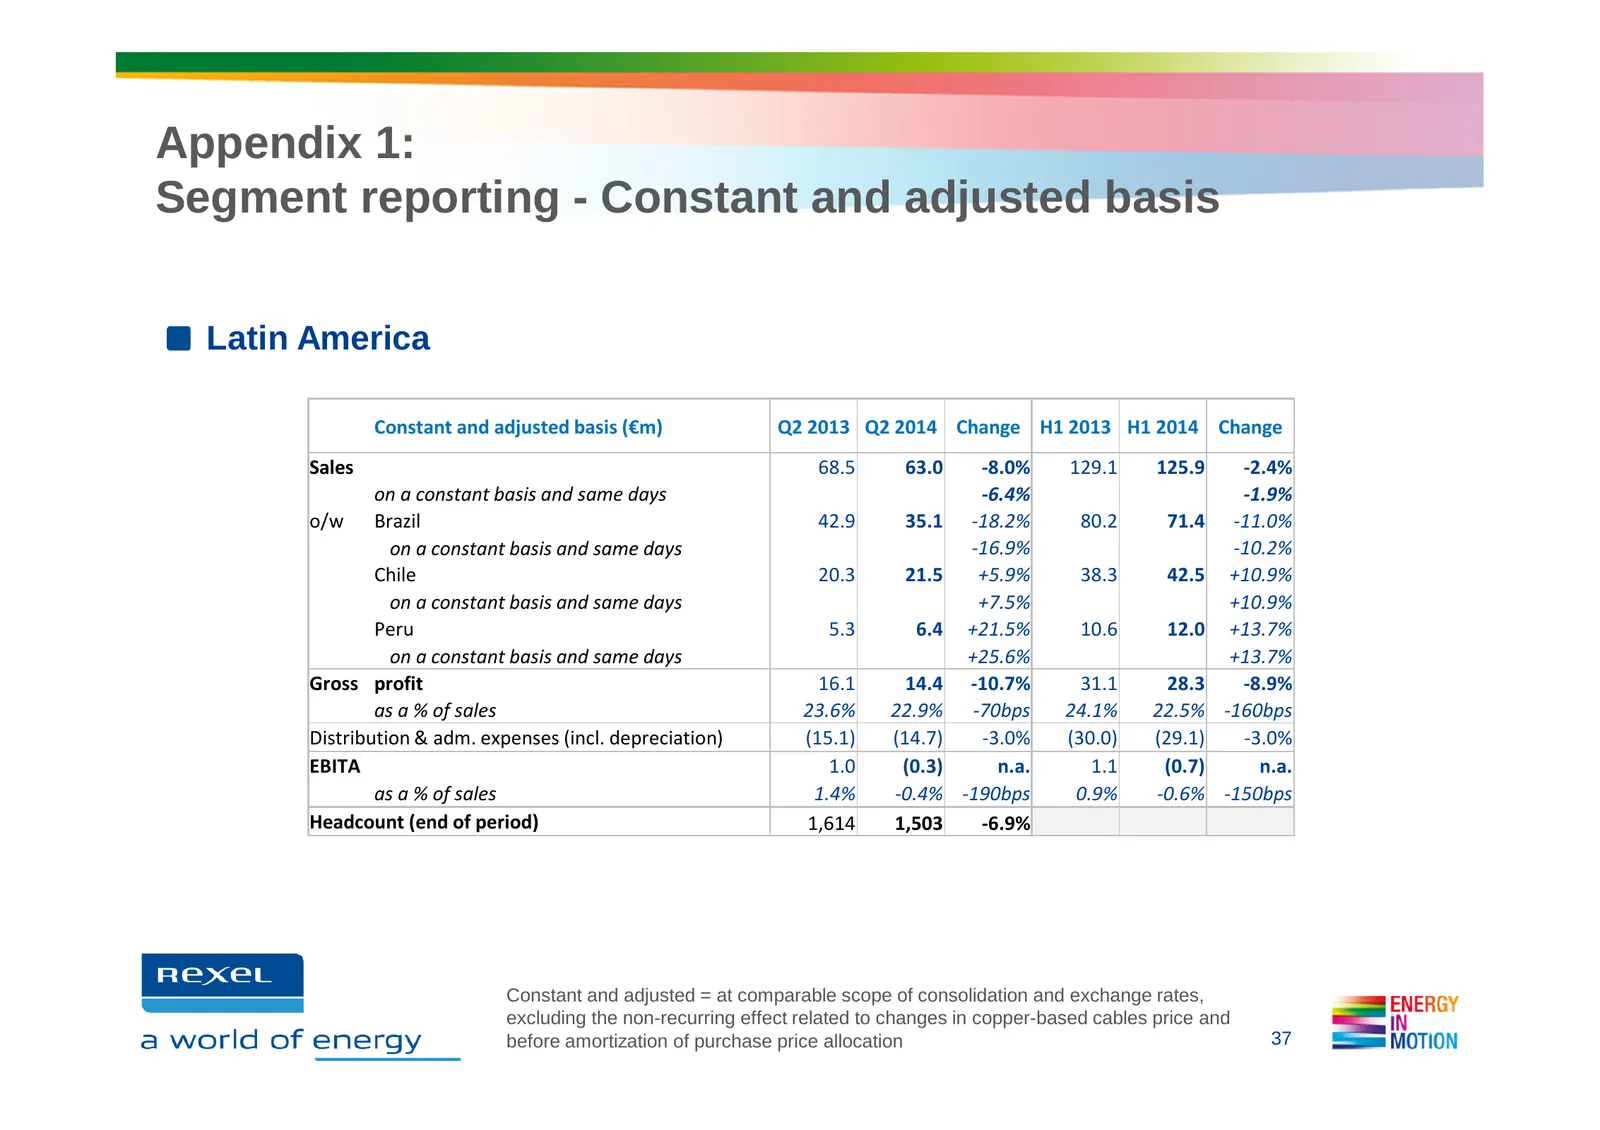
Slide 37: Appendix 1: Segment reporting - Latin America
Appendix 1: Segment reporting - Constant and adjusted basis Latin America Constant and adjusted basis (€m) Q2 2013 Q2 2014 Change H1 2013 H1 2014 Change Sales 68.5 63.0 -8.0% 129.1 125.9 -2.4% on a constant basis and same days -6.4% -1.9% o/w Brazil 42.9 35.1 -18.2% 80.2 71.4 -11.0% on a constant ba
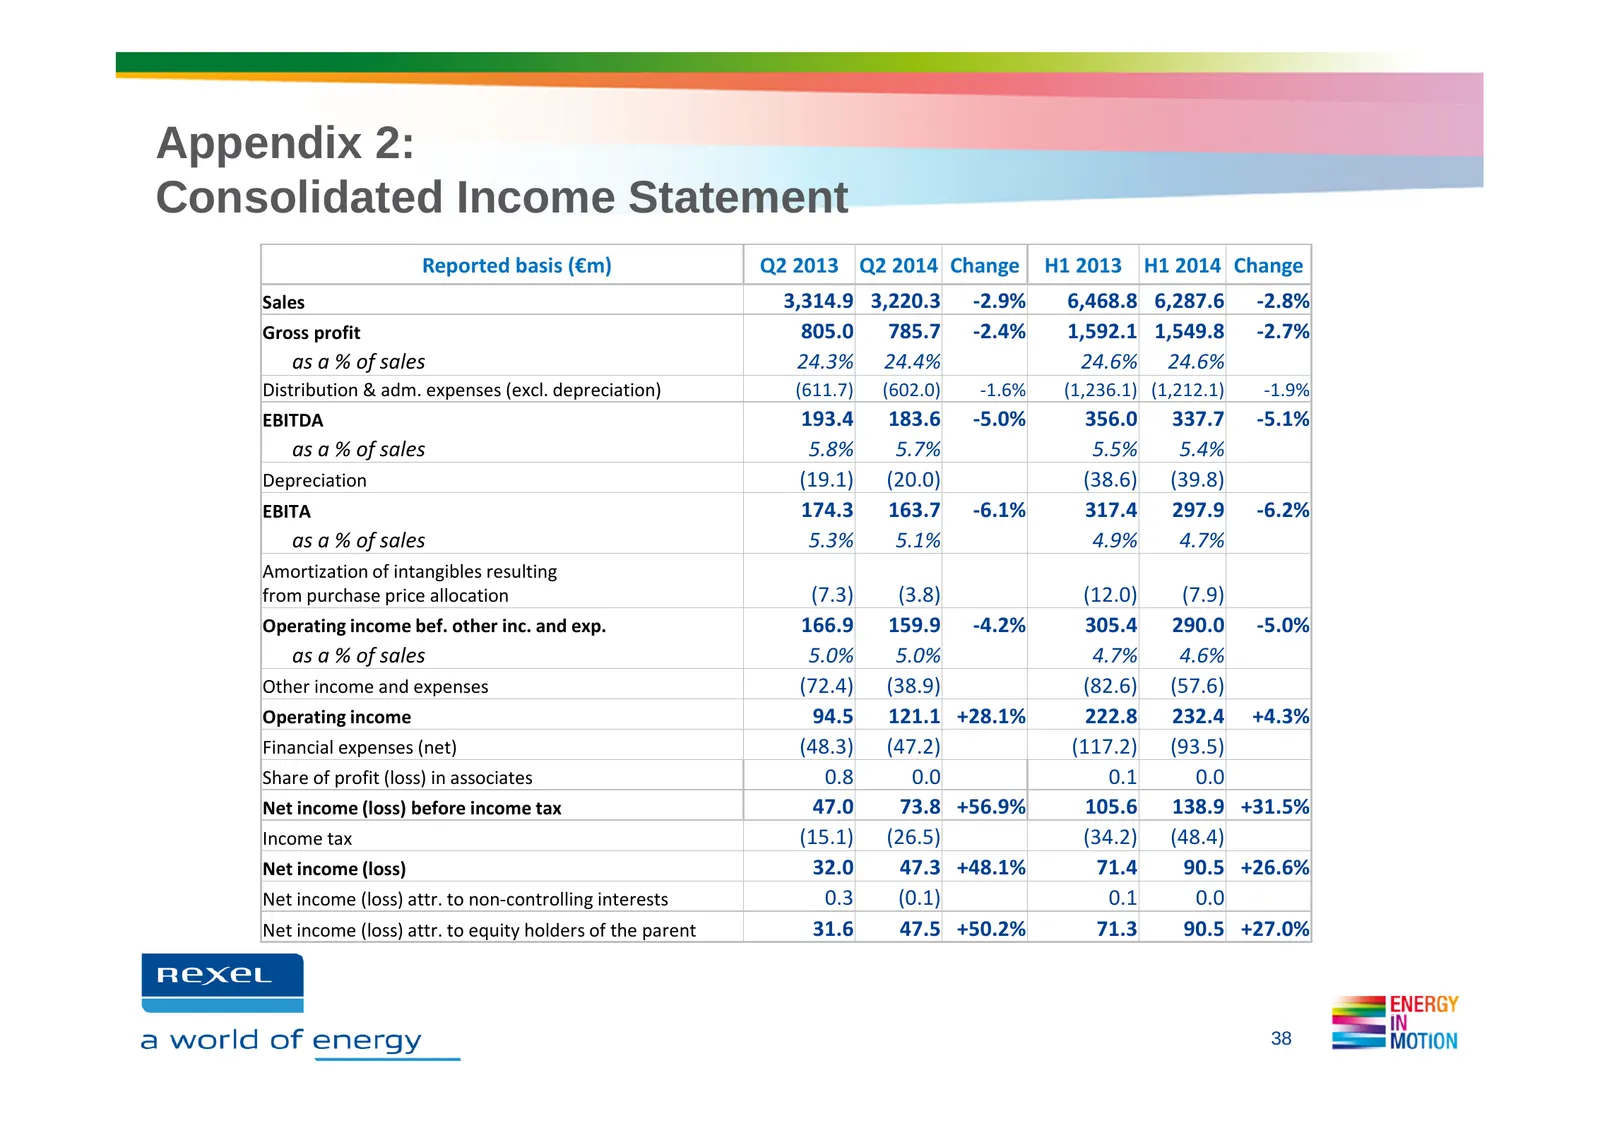
Slide 38: Appendix 2: Consolidated Income Statement
Appendix 2: Consolidated Income Statement Reported basis (€m) Q2 2013 Q2 2014 Change H1 2013 H1 2014 Change Sales 3,314.9 3,220.3 -2.9% 6,468.8 6,287.6 -2.8% Gross profit 805.0 785.7 -2.4% 1,592.1 1,549.8 -2.7% as a % of sales 24.3% 24.4% 24.6% 24.6% Distribution & adm. expenses (excl. depreciation)
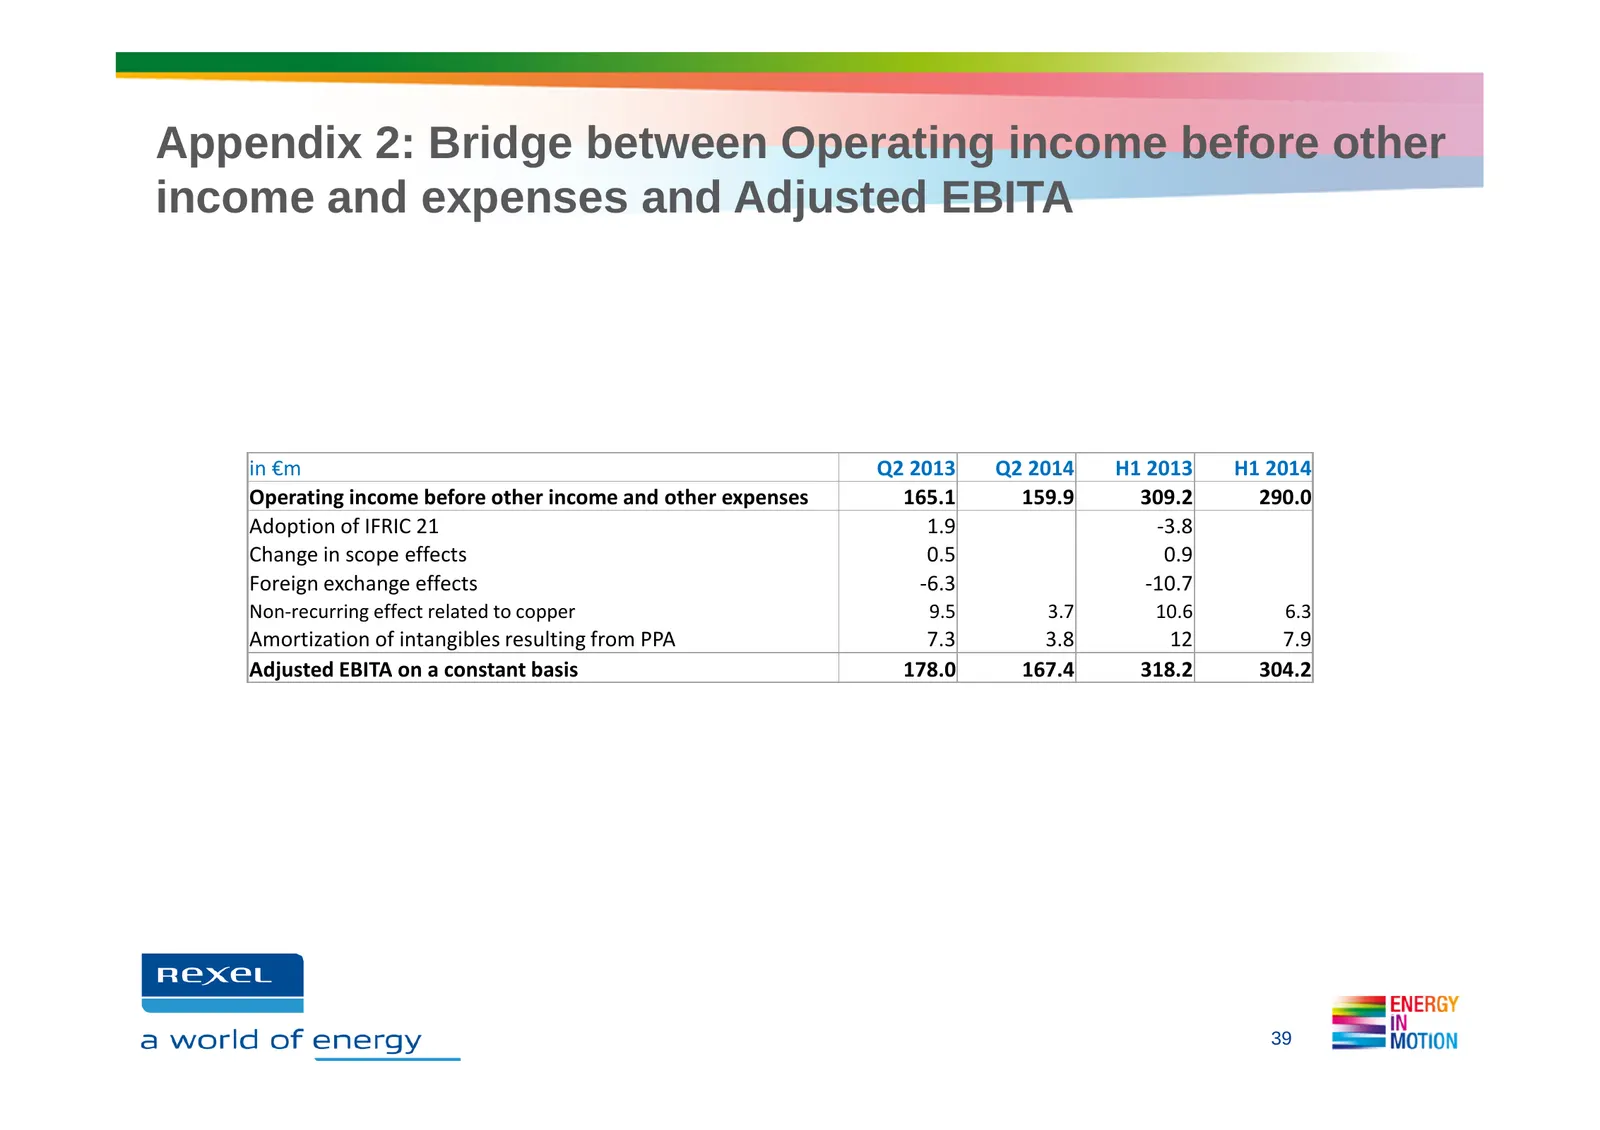
Slide 39: Appendix 2: Bridge to Adjusted EBITA
Appendix 2: Bridge between Operating income before other income and expenses and Adjusted EBITA in €m Q2 2013 Q2 2014 H1 2013 H1 2014 Operating income before other income and other expenses 165.1 159.9 309.2 290.0 Adoption of IFRIC 21 1.9 -3.8 Change in scope effects 0.5 0.9 Foreign exchange effects
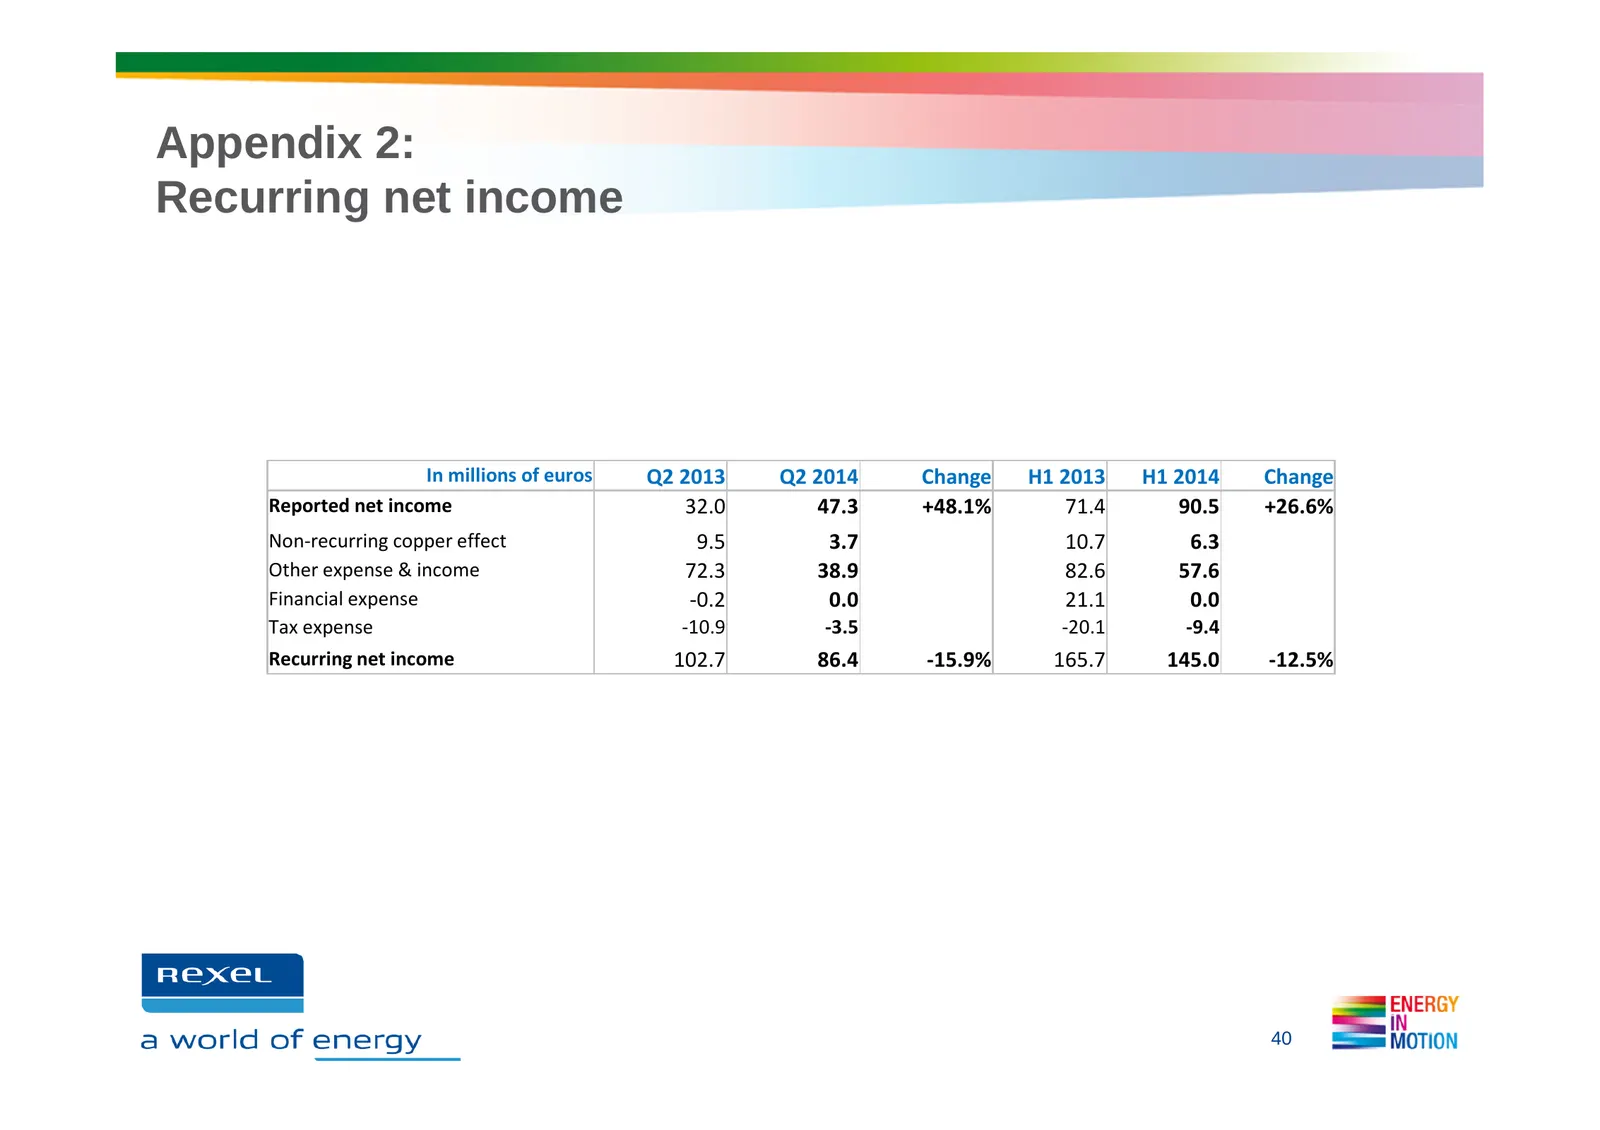
Slide 40: Appendix 2: Recurring net income
Appendix 2: Recurring net income In millions of euros Q2 2013 Q2 2014 Change H1 2013 H1 2014 Change Reported net income 32.0 47.3 +48.1% 71.4 90.5 +26.6% Non-recurring copper effect 9.5 3.7 10.7 6.3 Other expense & income 72.3 38.9 82.6 57.6 Financial expense -0.2 0.0 21.1 0.0 Tax expense -10.9 -3.5
Slide 41: Appendix 2: Sales and profitability by segment - Reported basis
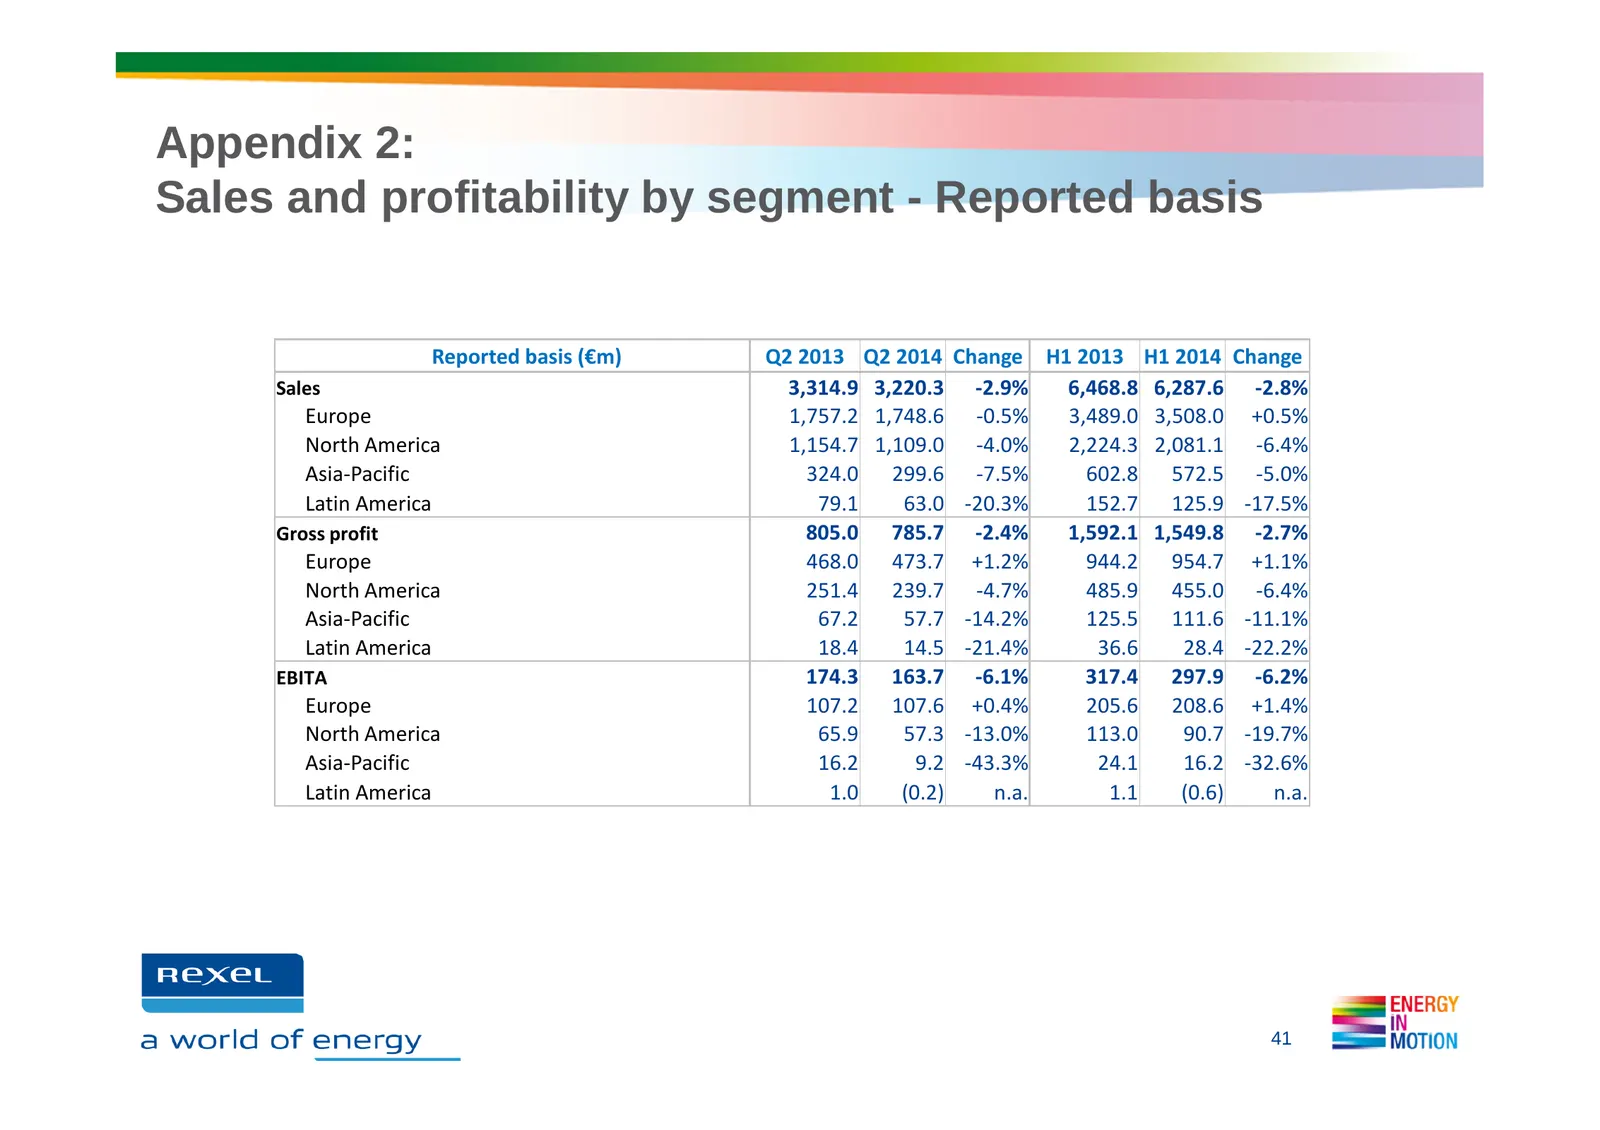
Appendix 2: Sales and profitability by segment - Reported basis Reported basis (€m) Q2 2013 Q2 2014 Change H1 2013 H1 2014 Change Sales 3,314.9 3,220.3 -2.9% 6,468.8 6,287.6 -2.8% Europe 1,757.2 1,748.6 -0.5% 3,489.0 3,508.0 +0.5% North America 1,154.7 1,109.0 -4.0% 2,224.3 2,081.1 -6.4% Asia-Pacifi
Slide 42: Appendix 2: Consolidated Balance Sheet
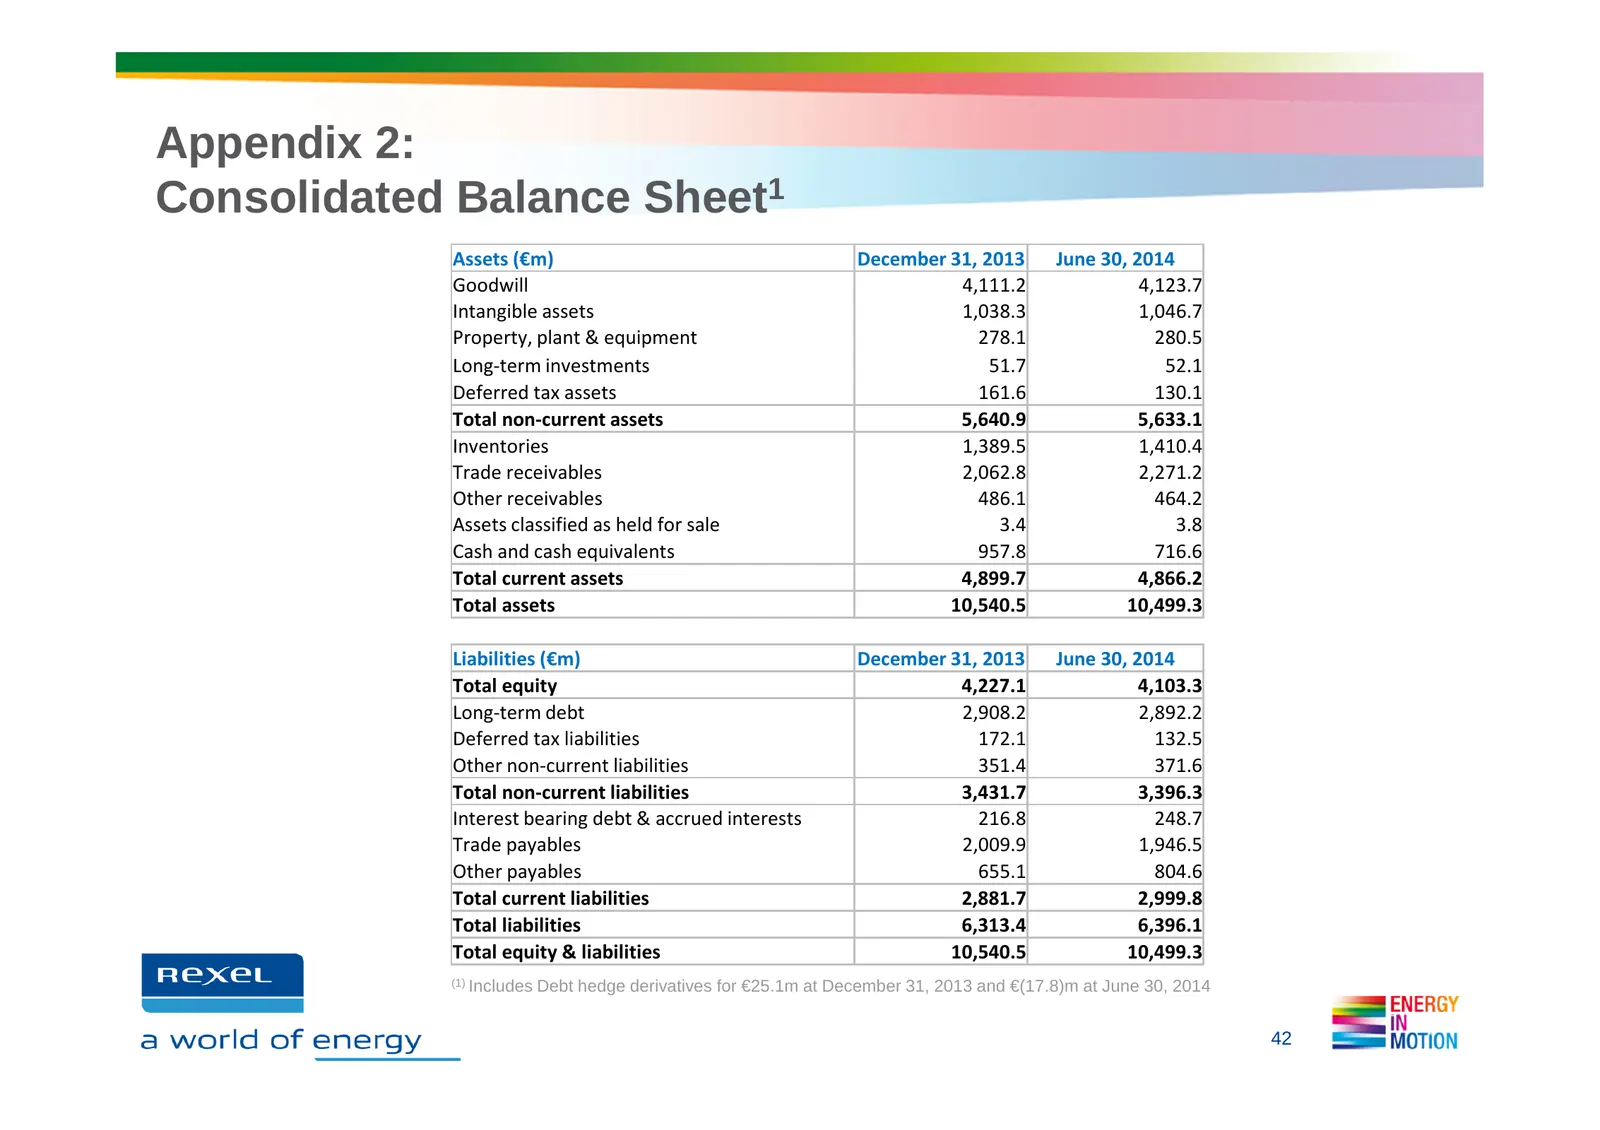
Appendix 2: Consolidated Balance Sheet1 Assets (€m) December 31, 2013 June 30, 2014 Goodwill 4,111.2 4,123.7 Intangible assets 1,038.3 1,046.7 Property, plant & equipment 278.1 280.5 Long-term investments 51.7 52.1 Deferred tax assets 161.6 130.1 Total non-current assets 5,640.9 5,633.1 Inventories
Slide 43: Appendix 2: Change in Net Debt
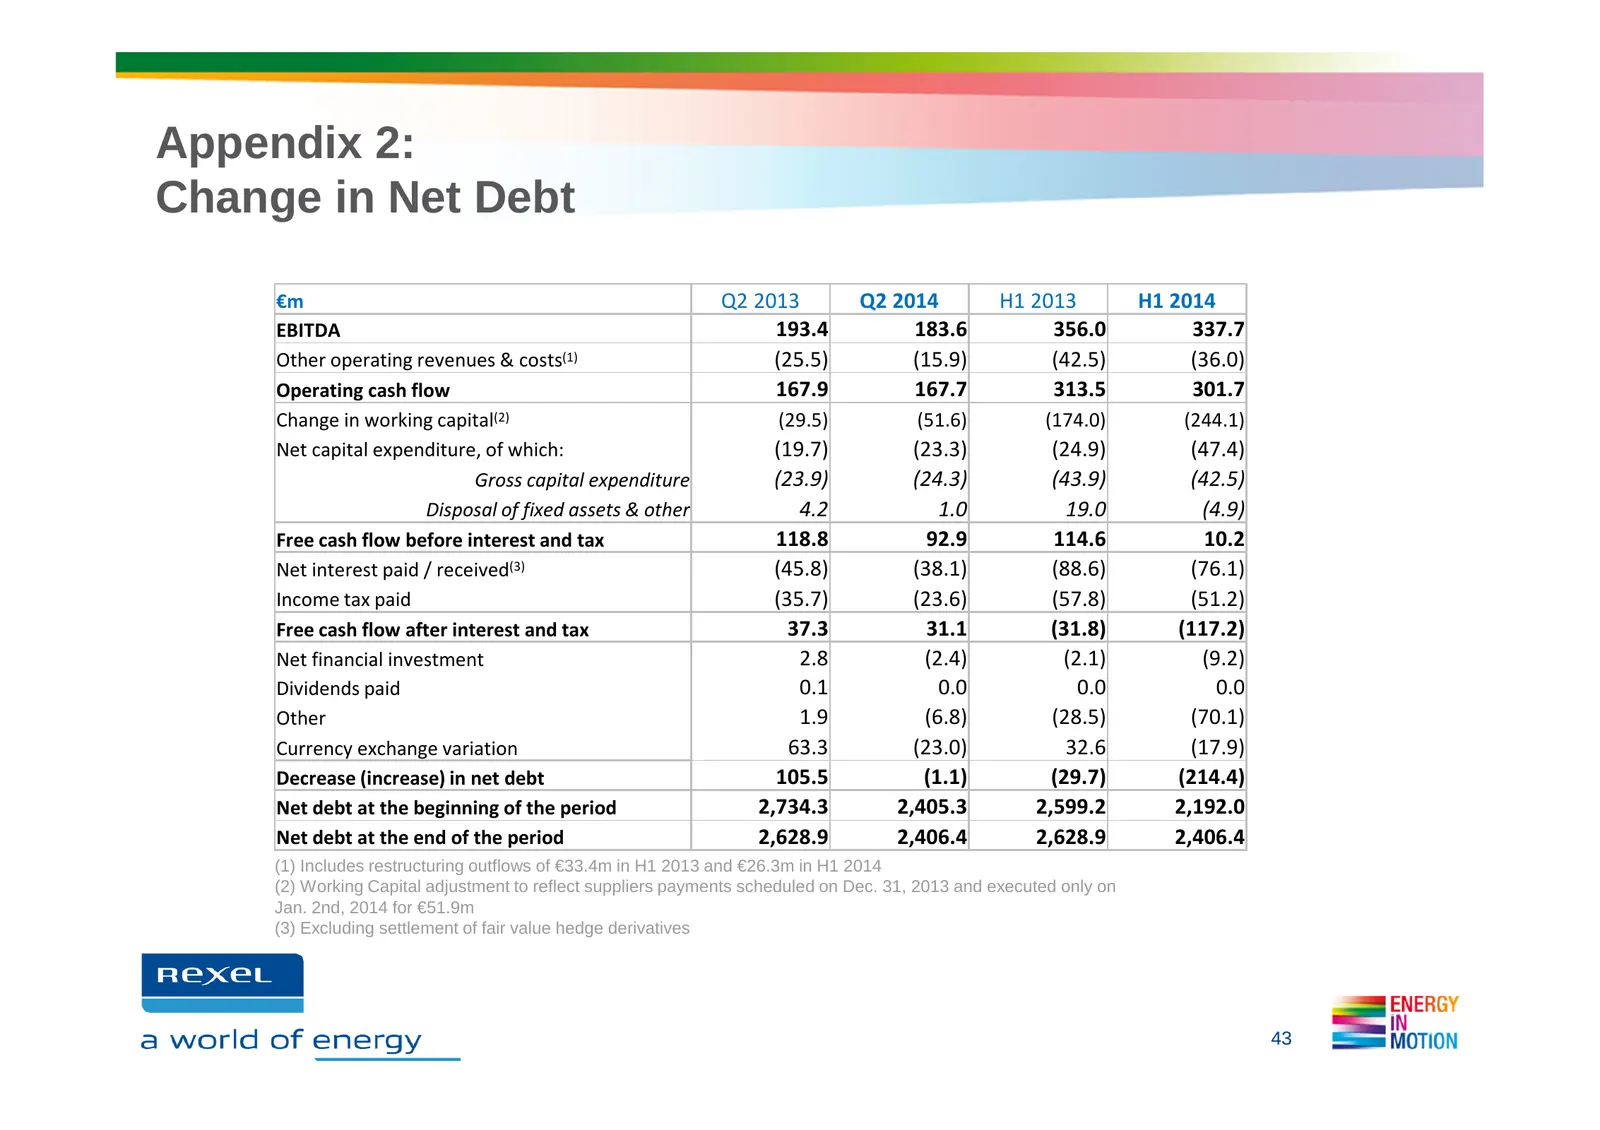
Appendix 2: Change in Net Debt €m Q2 2013 Q2 2014 H1 2013 H1 2014 EBITDA 193.4 183.6 356.0 337.7 Other operating revenues & costs(1) (25.5) (15.9) (42.5) (36.0) Operating cash flow 167.9 167.7 313.5 301.7 Change in working capital(2) (29.5) (51.6) (174.0) (244.1) Net capital expenditure, of which: (
Slide 44: Appendix 3: Working Capital
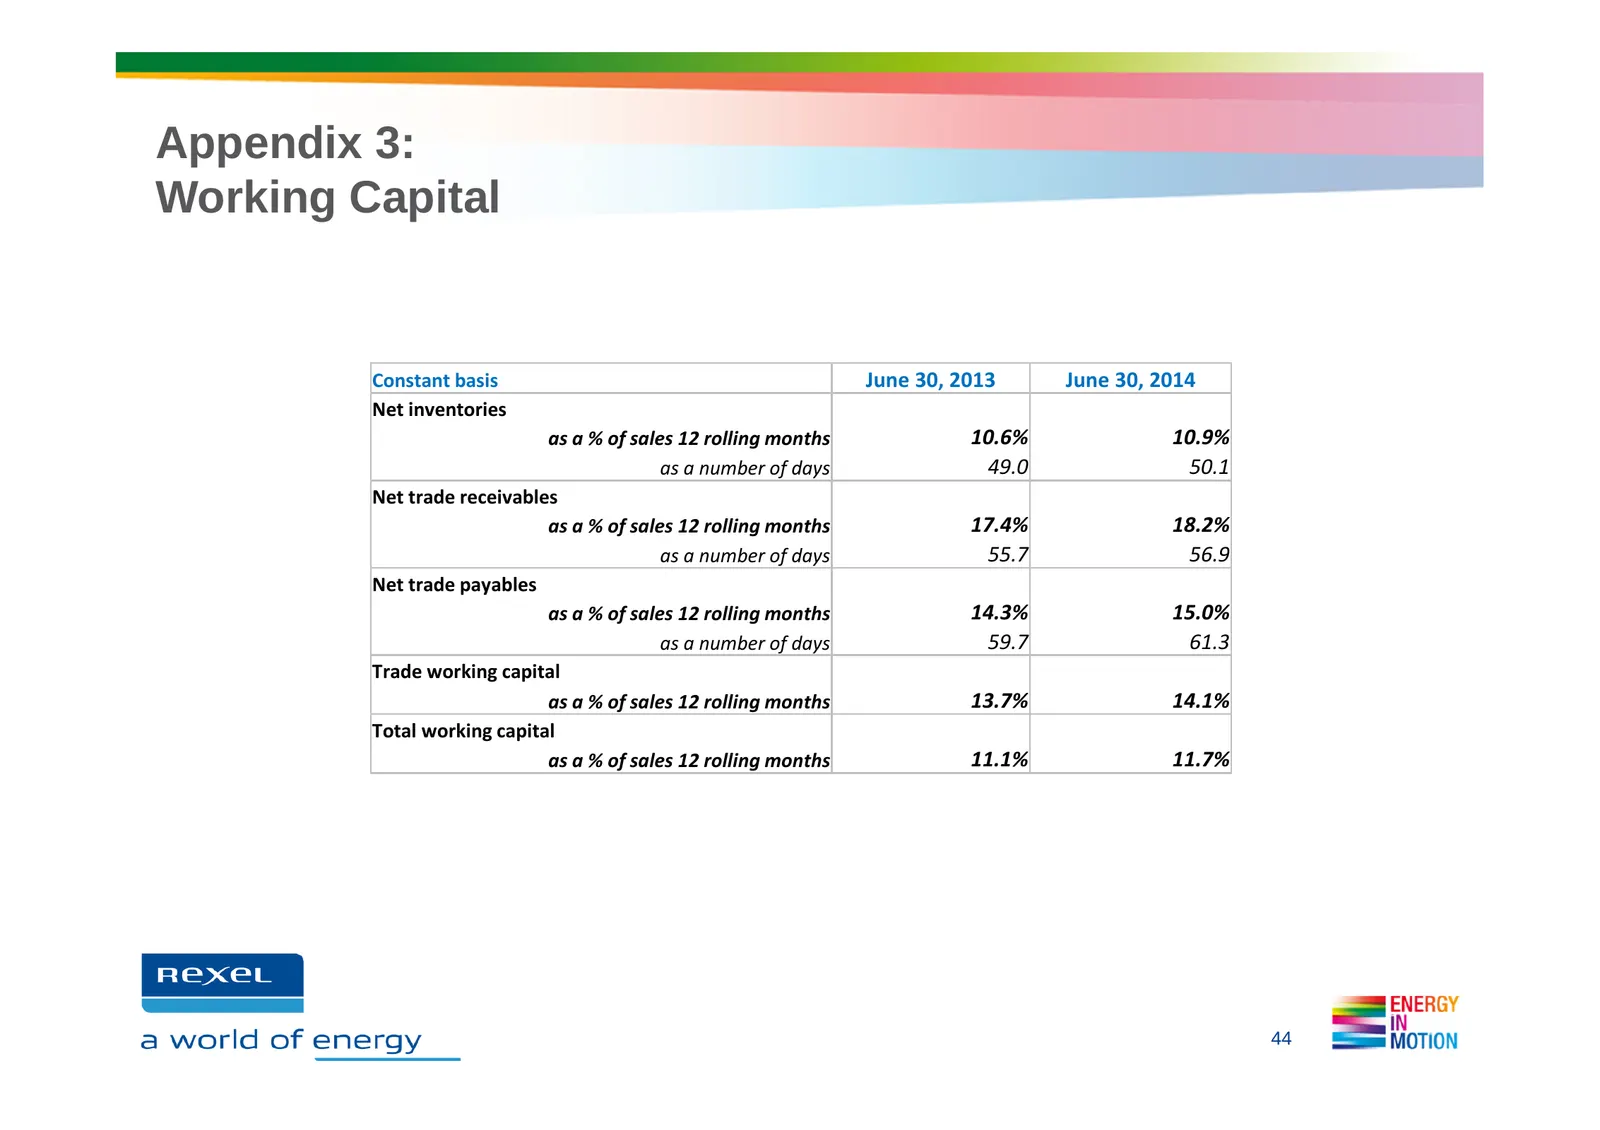
Appendix 3: Working Capital Constant basis June 30, 2013 June 30, 2014 Net inventories as a % of sales 12 rolling months 10.6% 10.9% as a number of days 49.0 50.1 Net trade receivables as a % of sales 12 rolling months 17.4% 18.2% as a number of days 55.7 56.9 Net trade payables as a % of sales 12 r
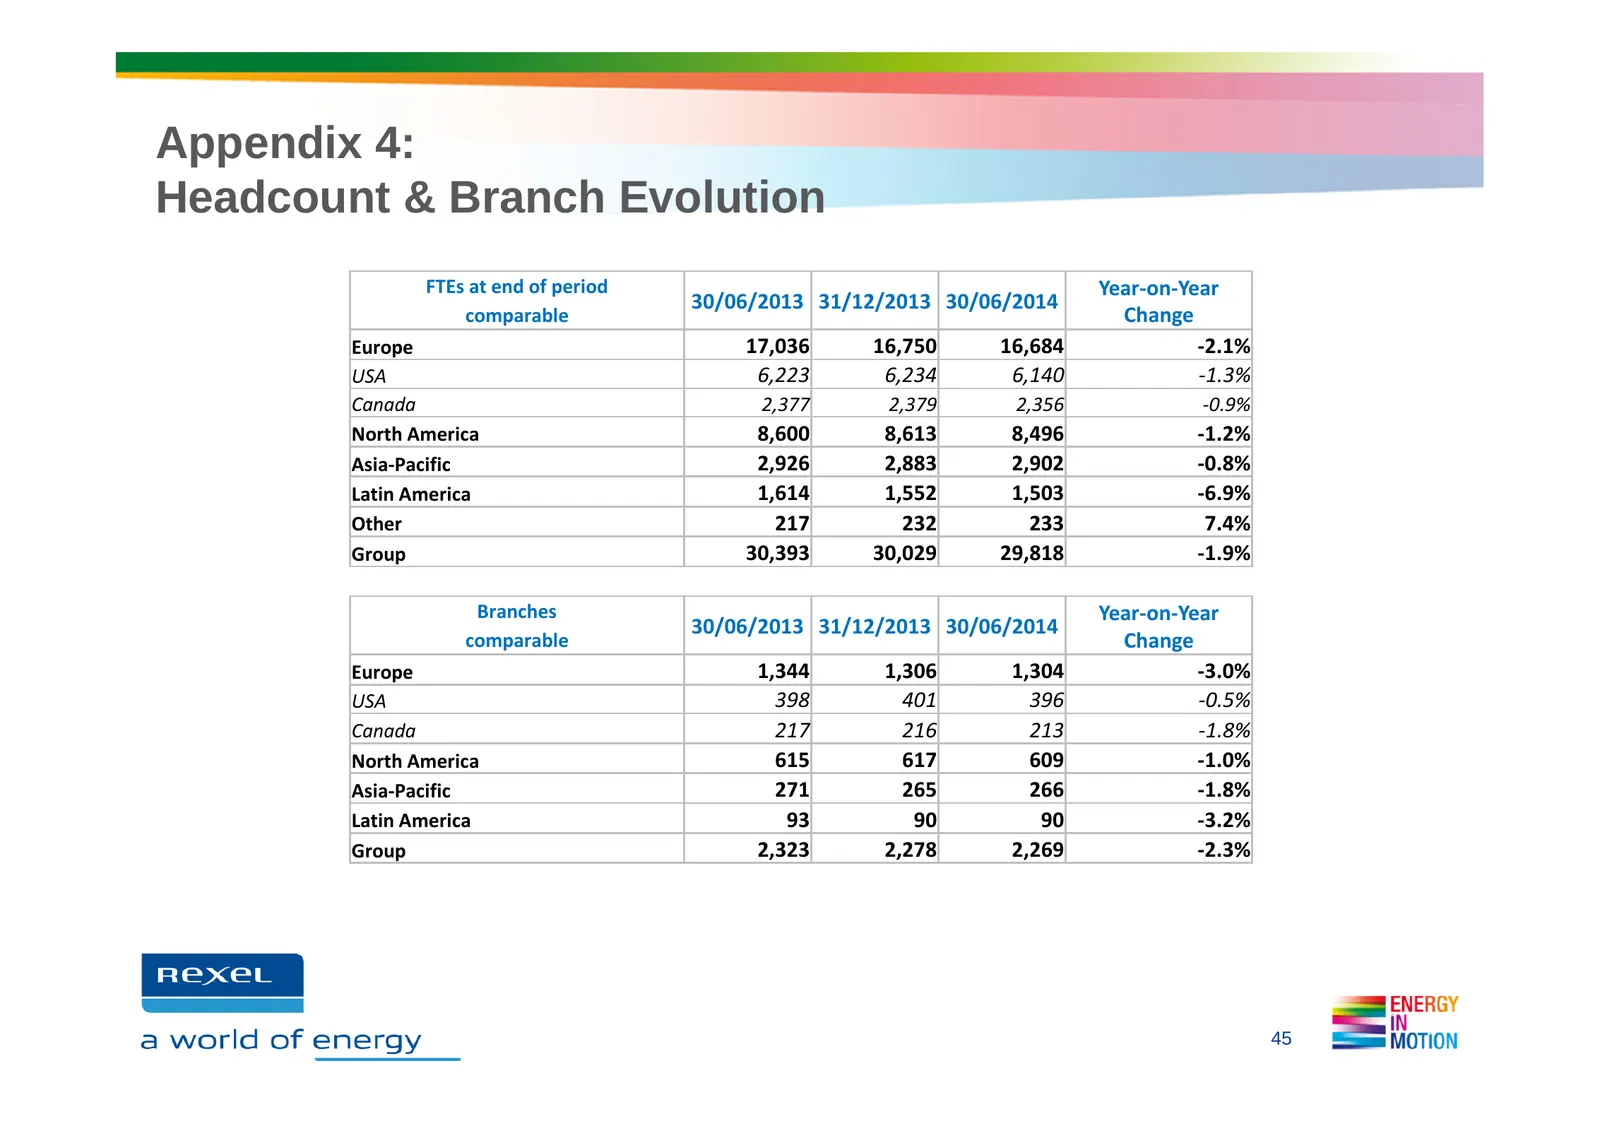
Slide 45: Appendix 4: Headcount & Branch Evolution
Appendix 4: Headcount & Branch Evolution FTEs at end of period Year-on-Year 30/06/2013 31/12/2013 30/06/2014 comparable Change Europe 17,036 16,750 16,684 -2.1% USA 6,223 6,234 6,140 -1.3% Canada 2,377 2,379 2,356 -0.9% North America 8,600 8,613 8,496 -1.2% Asia-Pacific 2,926 2,883 2,902 -0.8% Latin
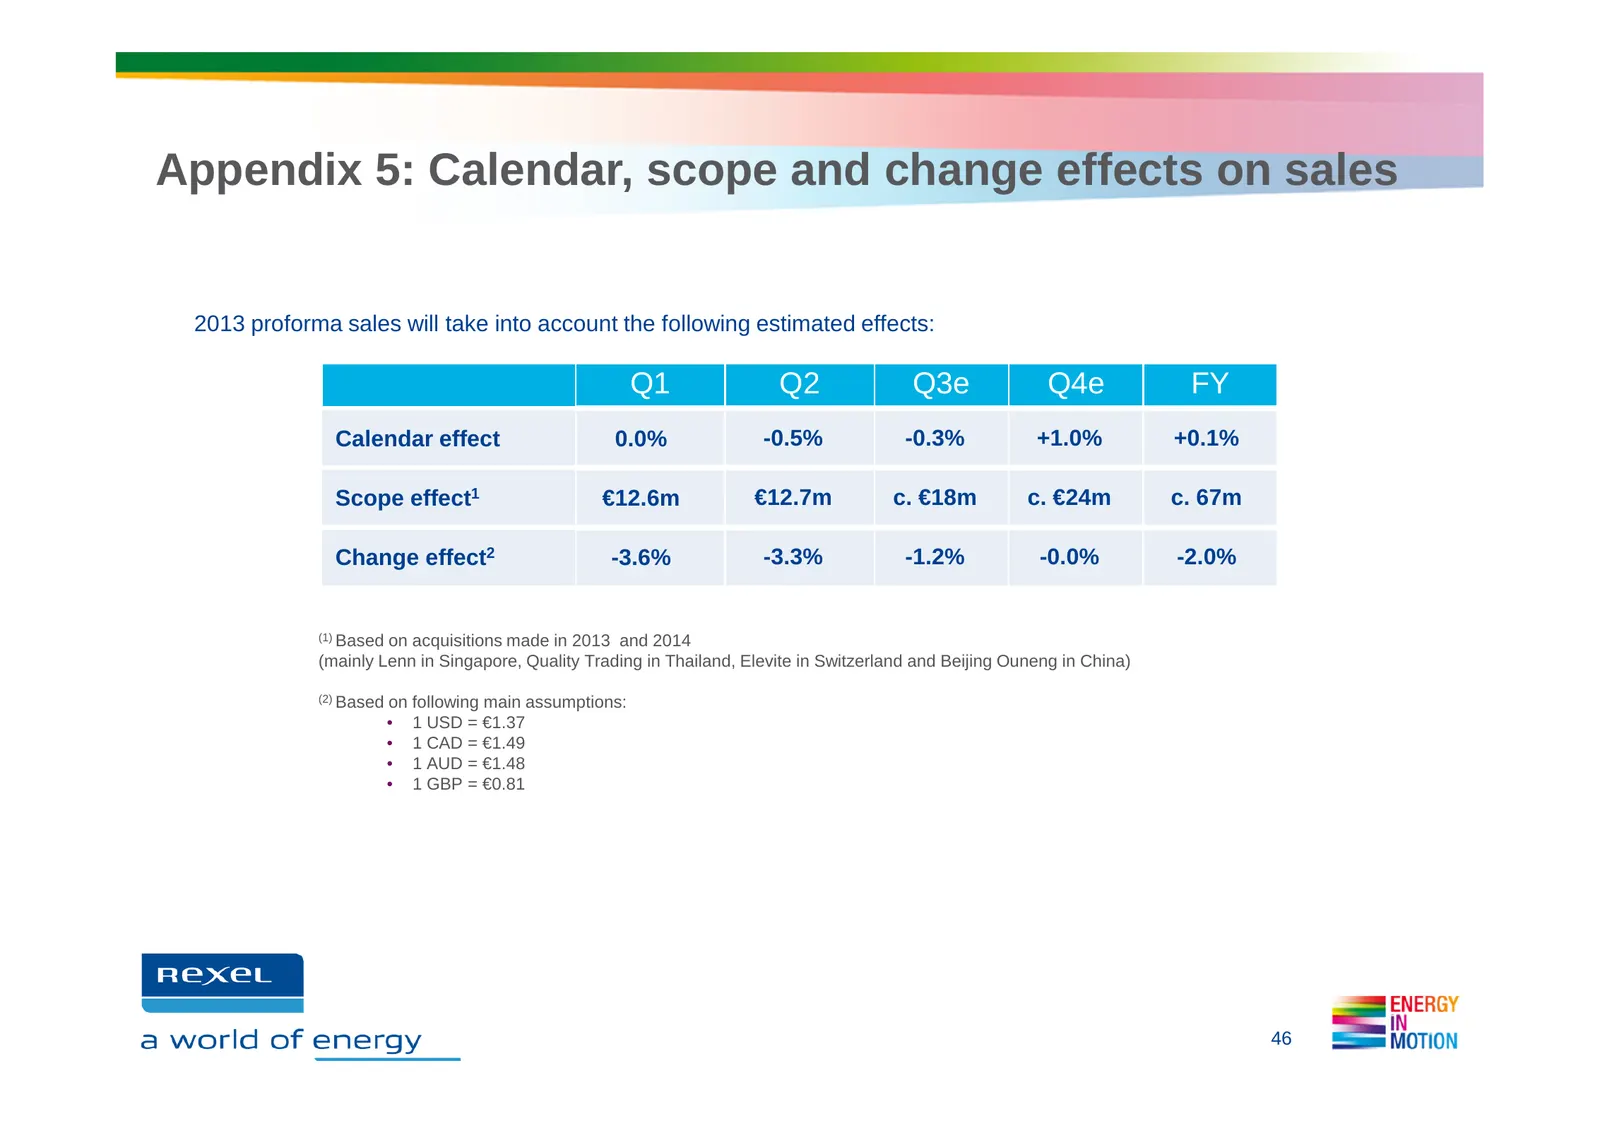
Slide 46: Appendix 5: Calendar, scope and change effects on sales
Appendix 5: Calendar, scope and change effects on sales 2013 proforma sales will take into account the following estimated effects: Q1 Q2 Q3e Q4e FY Calendar effect 0.0% -0.5% -0.3% +1.0% +0.1% Scope effect1 €12.6m €12.7m c. €18m c. €24m c. 67m Change effect2 -3.6% -3.3% -1.2% -0.0% -2.0% (1) Based
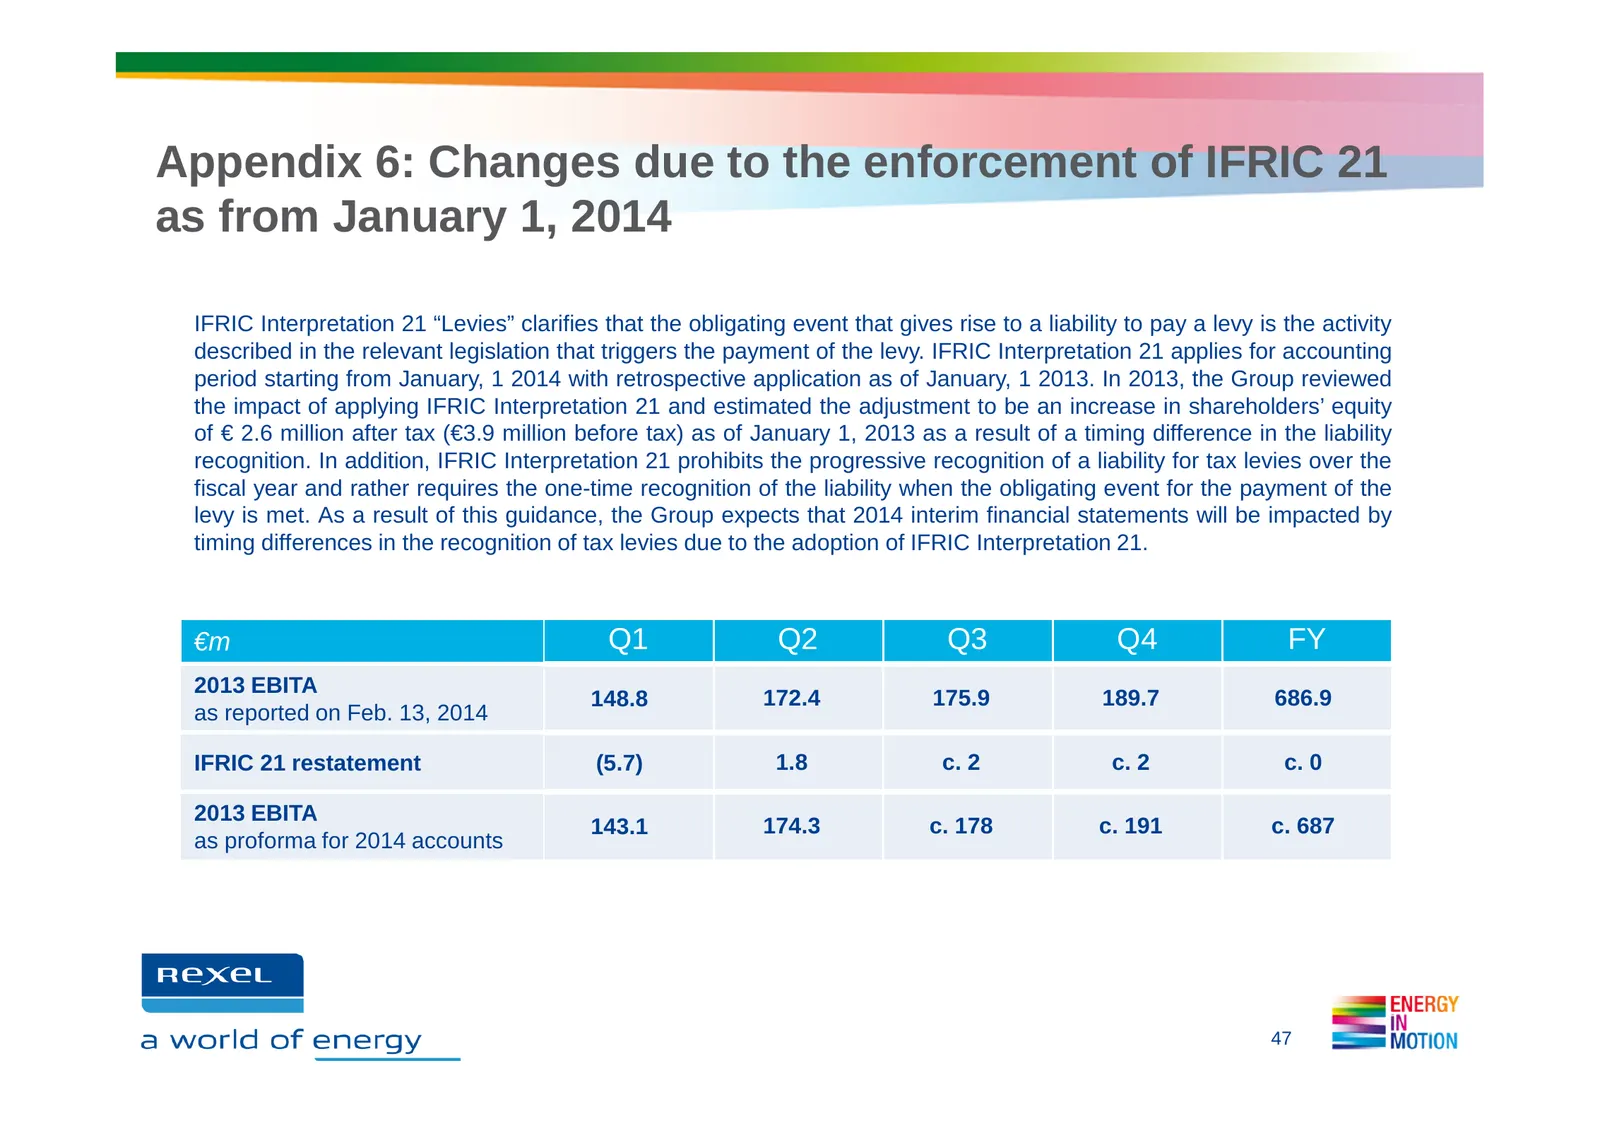
Slide 47: Appendix 6: Changes due to enforcement of IFRIC 21
Appendix 6: Changes due to the enforcement of IFRIC 21 as from January 1, 2014 IFRIC Interpretation 21 “Levies” clarifies that the obligating event that gives rise to a liability to pay a levy is the activity described in the relevant legislation that triggers the payment of the levy. IFRIC Interpre
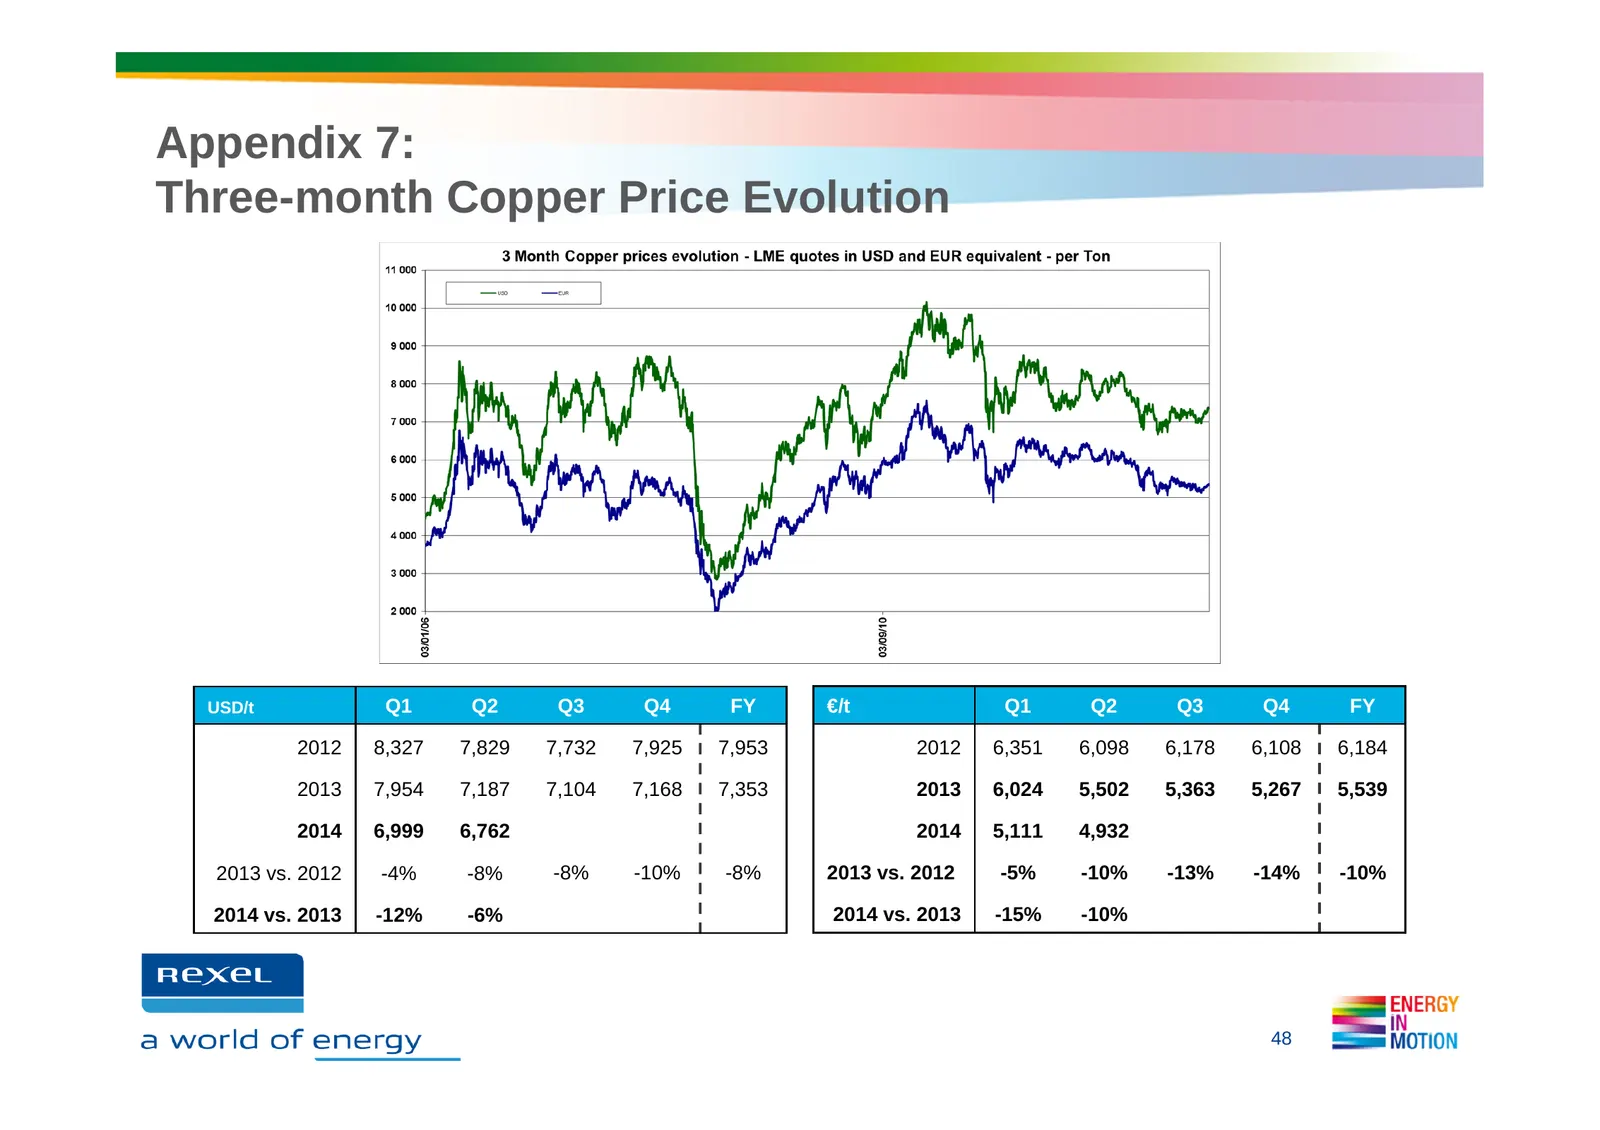
Slide 48: Appendix 7: Three-month Copper Price Evolution
Appendix 7: Three-month Copper Price Evolution USD/t Q1 Q2 Q3 Q4 FY €/t Q1 Q2 Q3 Q4 FY 2012 8,327 7,829 7,732 7,925 7,953 2012 6,351 6,098 6,178 6,108 6,184 2013 7,954 7,187 7,104 7,168 7,353 2013 6,024 5,502 5,363 5,267 5,539 2014 6,999 6,762 2014 5,111 4,932 2013 vs. 2012 -4% -8% -8% -10% -8% 2013
Slide 49: Financial Calendar and contacts
Financial Calendar and contacts Financial Calendar Contacts • October 29, 2014 • Investors & Analysts Q3 and 9m results Marc MAILLET Tel: +33 1 42 85 76 12 Email: marc.maillet@rexel.com Florence MEILHAC Tel: +33 1 42 85 57 61 Email: florence.meilhac@rexel.com • Press Pénélope LINAGE Tel: +33 1 42 85
Slide 50: Disclaimer
Disclaimer The Group is exposed to fluctuations in copper prices in connection with its distribution of cable products. Cables accounted for approximately 15% of the Group's sales, and copper accounts for approximately 60% of the composition of cables. This exposure is indirect since cable prices al
Source: Internet Archive copy of rexel.com
More decks from Rexel SA
 Q3 2026 Earnings Presentation13 slides · Oct 22, 2026
 Q2 2026 Earnings Presentation24 slides · Jul 27, 2026
 FY 2025 Earnings Presentation31 slides · Feb 11, 2026
 Q3 2025 Earnings Presentation15 slides · Oct 15, 2025
 Q2 2025 Earnings Presentation20 slides · Jul 28, 2025
 Q1 2025 Earnings Presentation16 slides · Apr 29, 2025