Health Net — Investor Day (November 2008)
25 slides from Health Net's investor day presentation, Nov 21, 2008
Slide 1: Operational Performance
Exhibit 99.1 2008 - 2009 Operational Performance Jim Woys Executive Vice President and Chief Operating Officer November 18, 2008

Slide 2: Cautionary Statement
Cautionary Statement All statements in this presentation, other than statements of historical information provided herein, including but not limited to the guidance for future periods included herein and the assumptions underlying such projections, may be deemed to be forward- looking statements and
Slide 3: Non-GAAP Measures
Non-GAAP Measures These presentations include quarterly and full-year income statement measurements that are not calculated and presented in accordance with Generally Accepted Accounting Principles. Audience participants should refer to the reconciliation table available in the company’s third quart
Slide 4: 2008 and 2009 Guidance
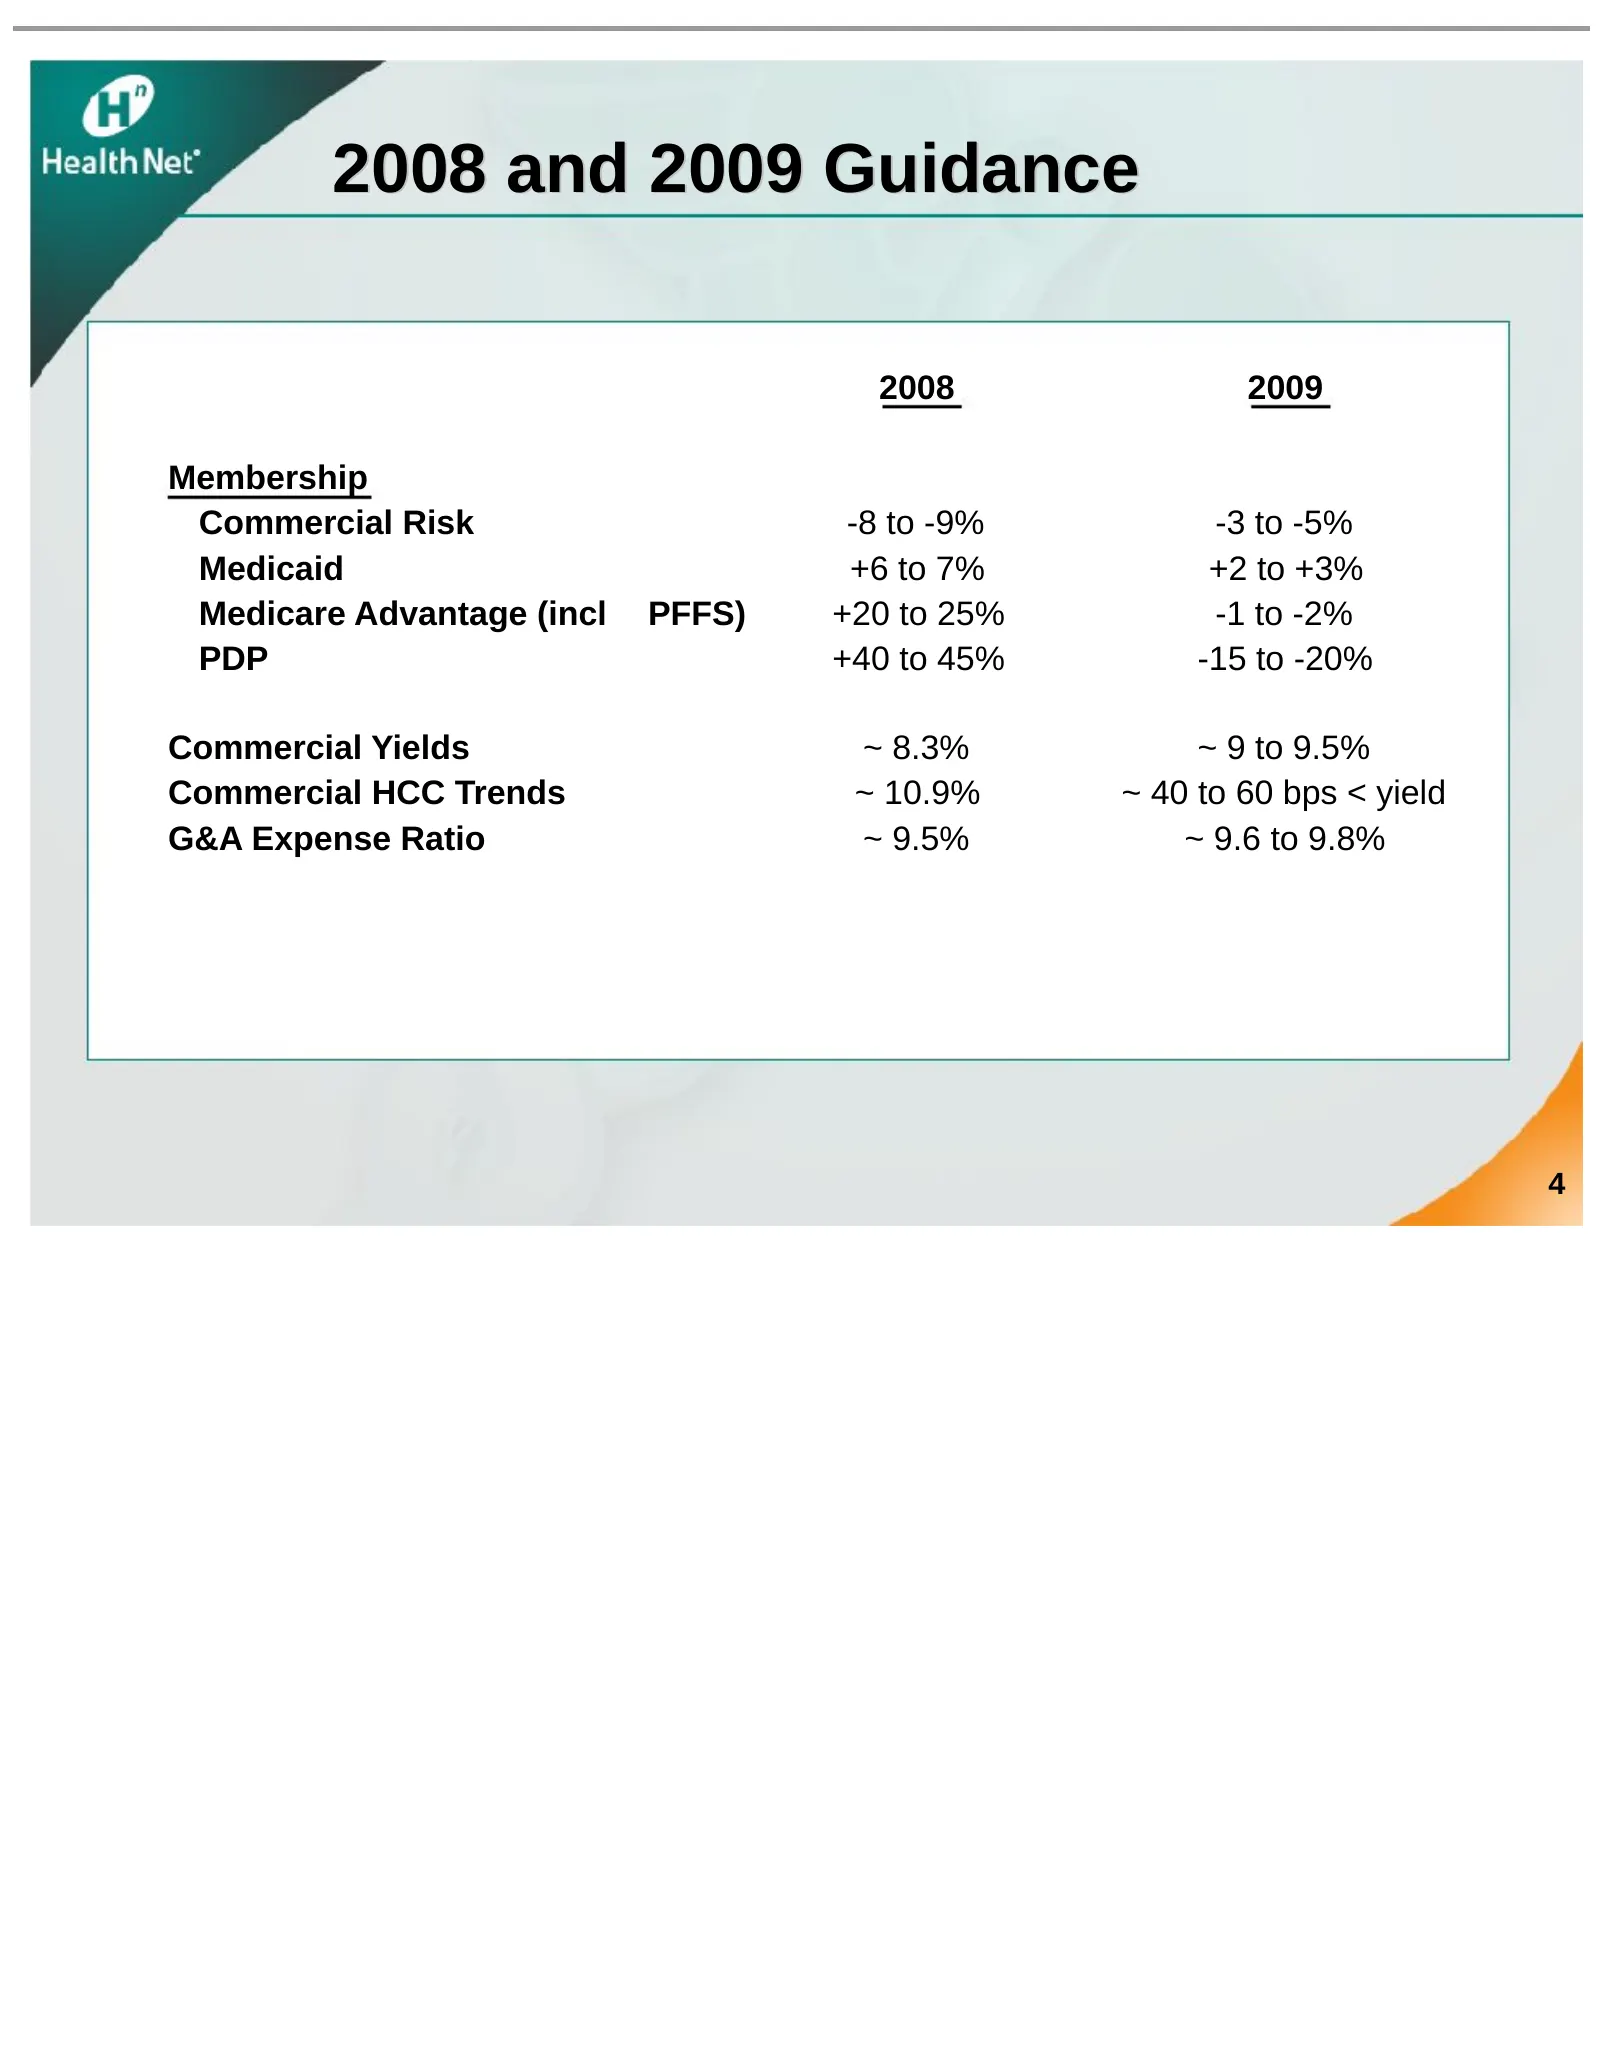
2008 and 2009 Guidance 2008 2009 Membership Commercial Risk -8 to -9% -3 to -5% Medicaid +6 to 7% +2 to +3% Medicare Advantage (incl PFFS) +20 to 25% -1 to -2% PDP +40 to 45% -15 to -20% Commercial Yields ~ 8.3% ~ 9 to 9.5% Commercial HCC Trends ~ 10.9% ~ 40 to 60 bps < yield G&A Expense Ratio ~ 9.5
Slide 5: Understanding the Underlying Trend
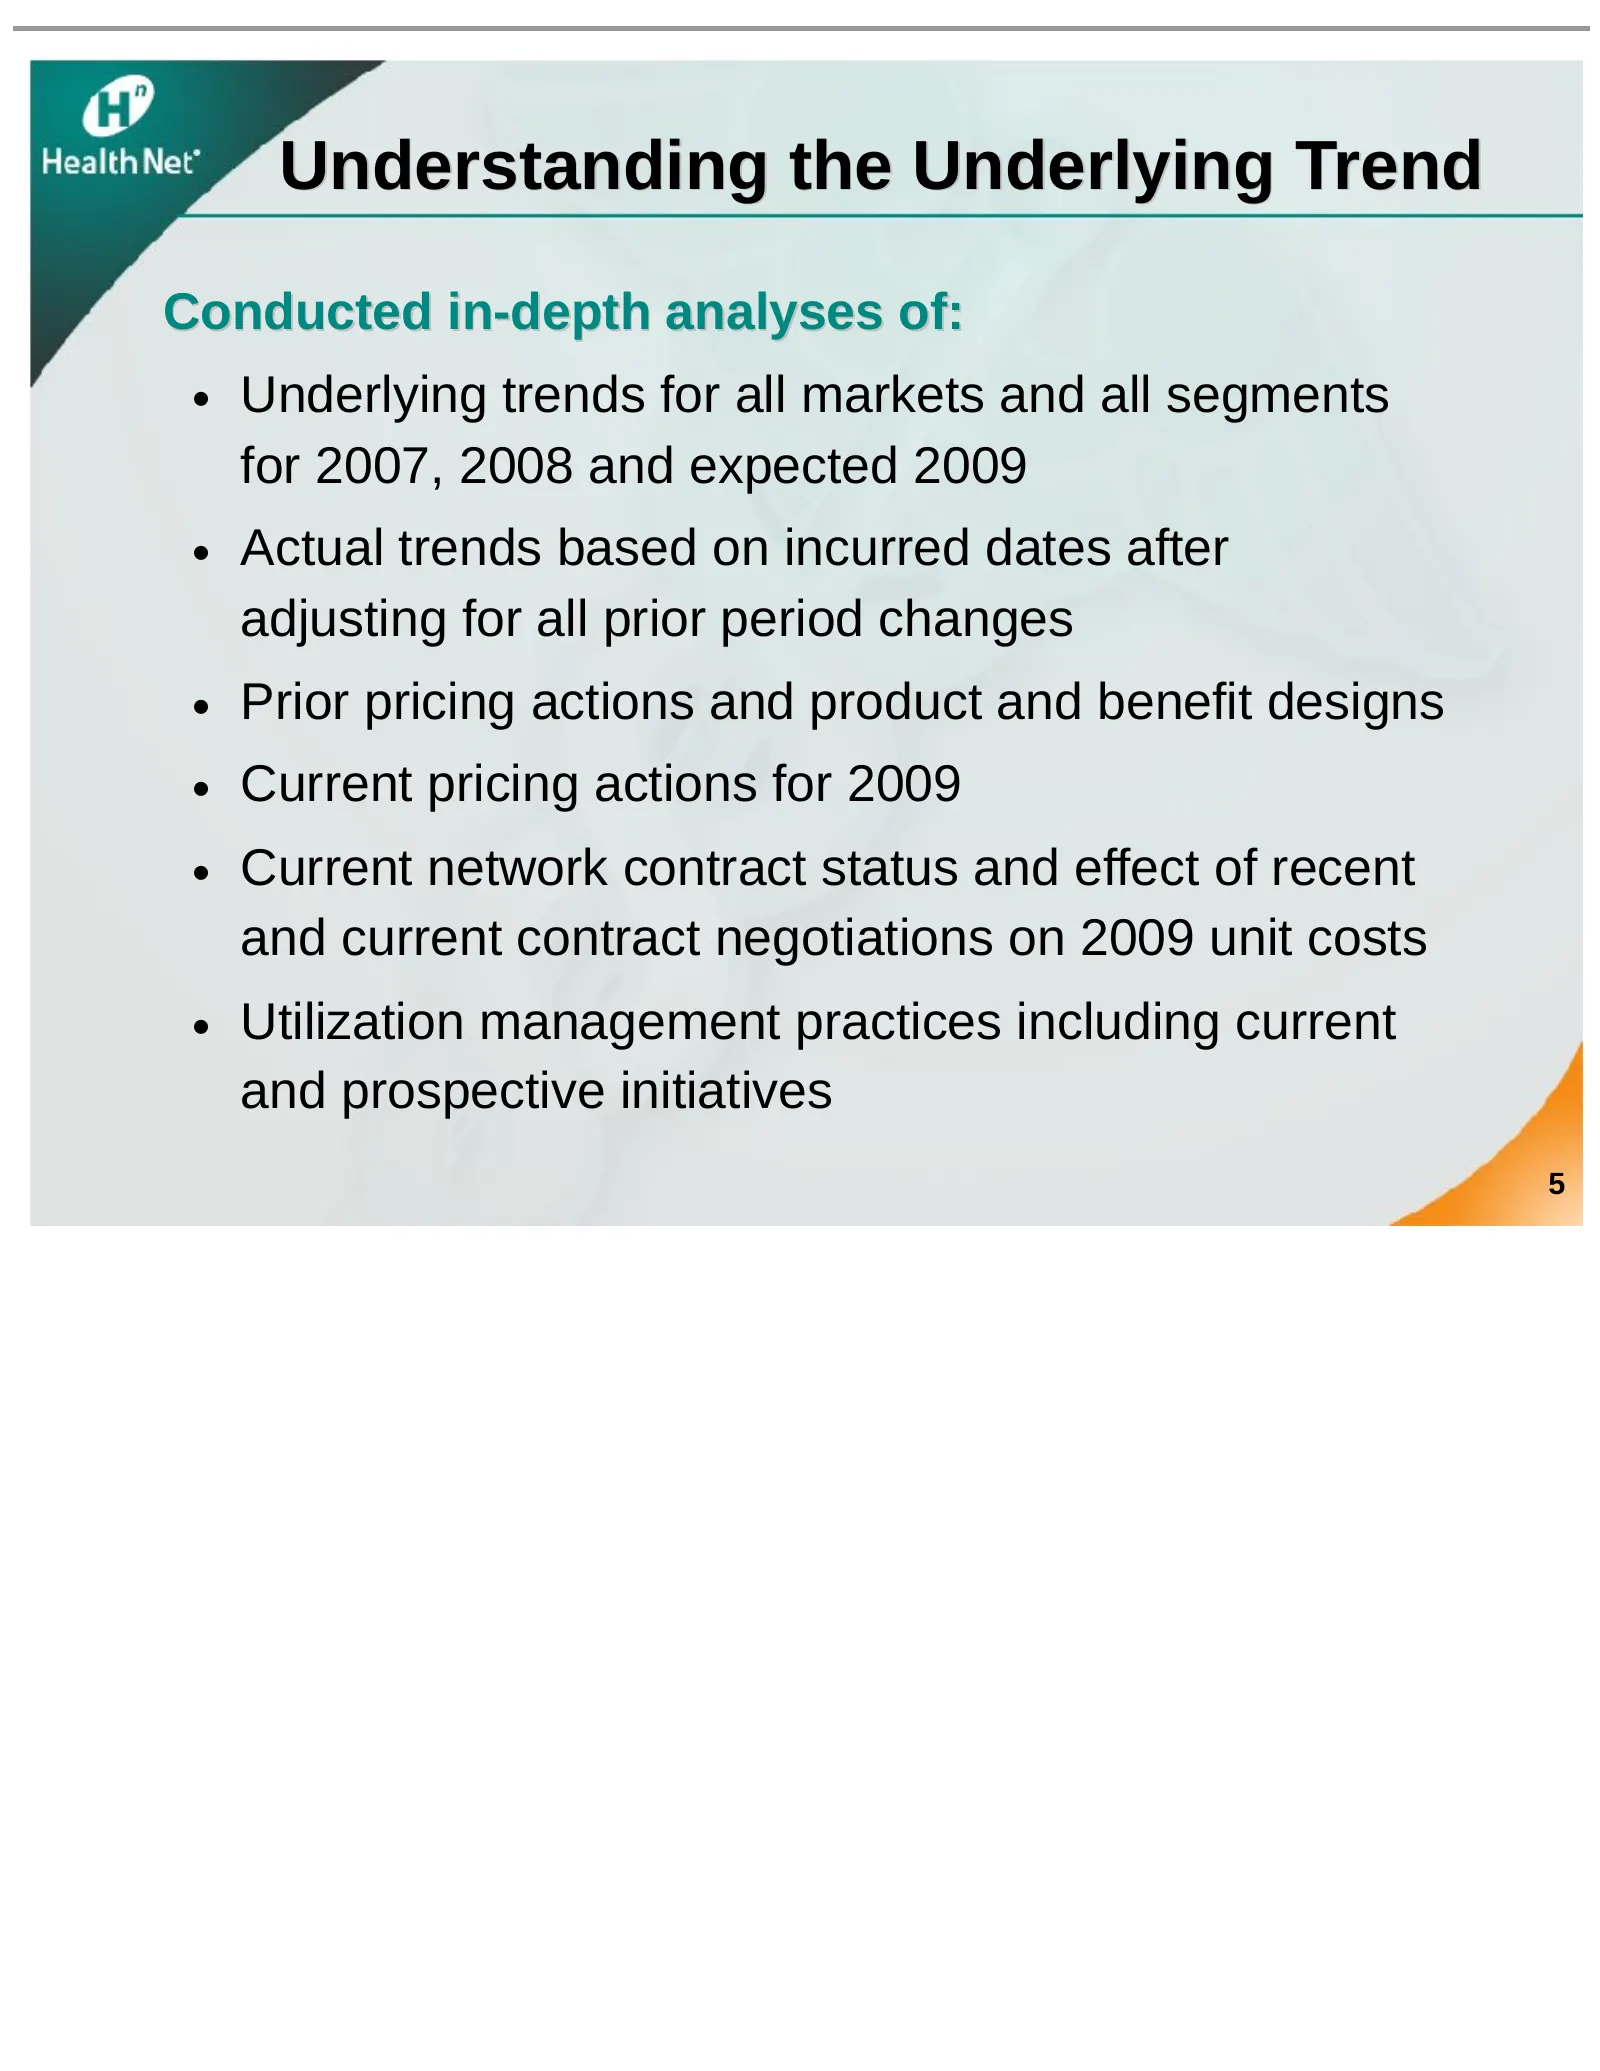
Understanding the Underlying Trend Conducted in-depth analyses of: • Underlying trends for all markets and all segments for 2007, 2008 and expected 2009 • Actual trends based on incurred dates after adjusting for all prior period changes • Prior pricing actions and product and benefit designs • Curr
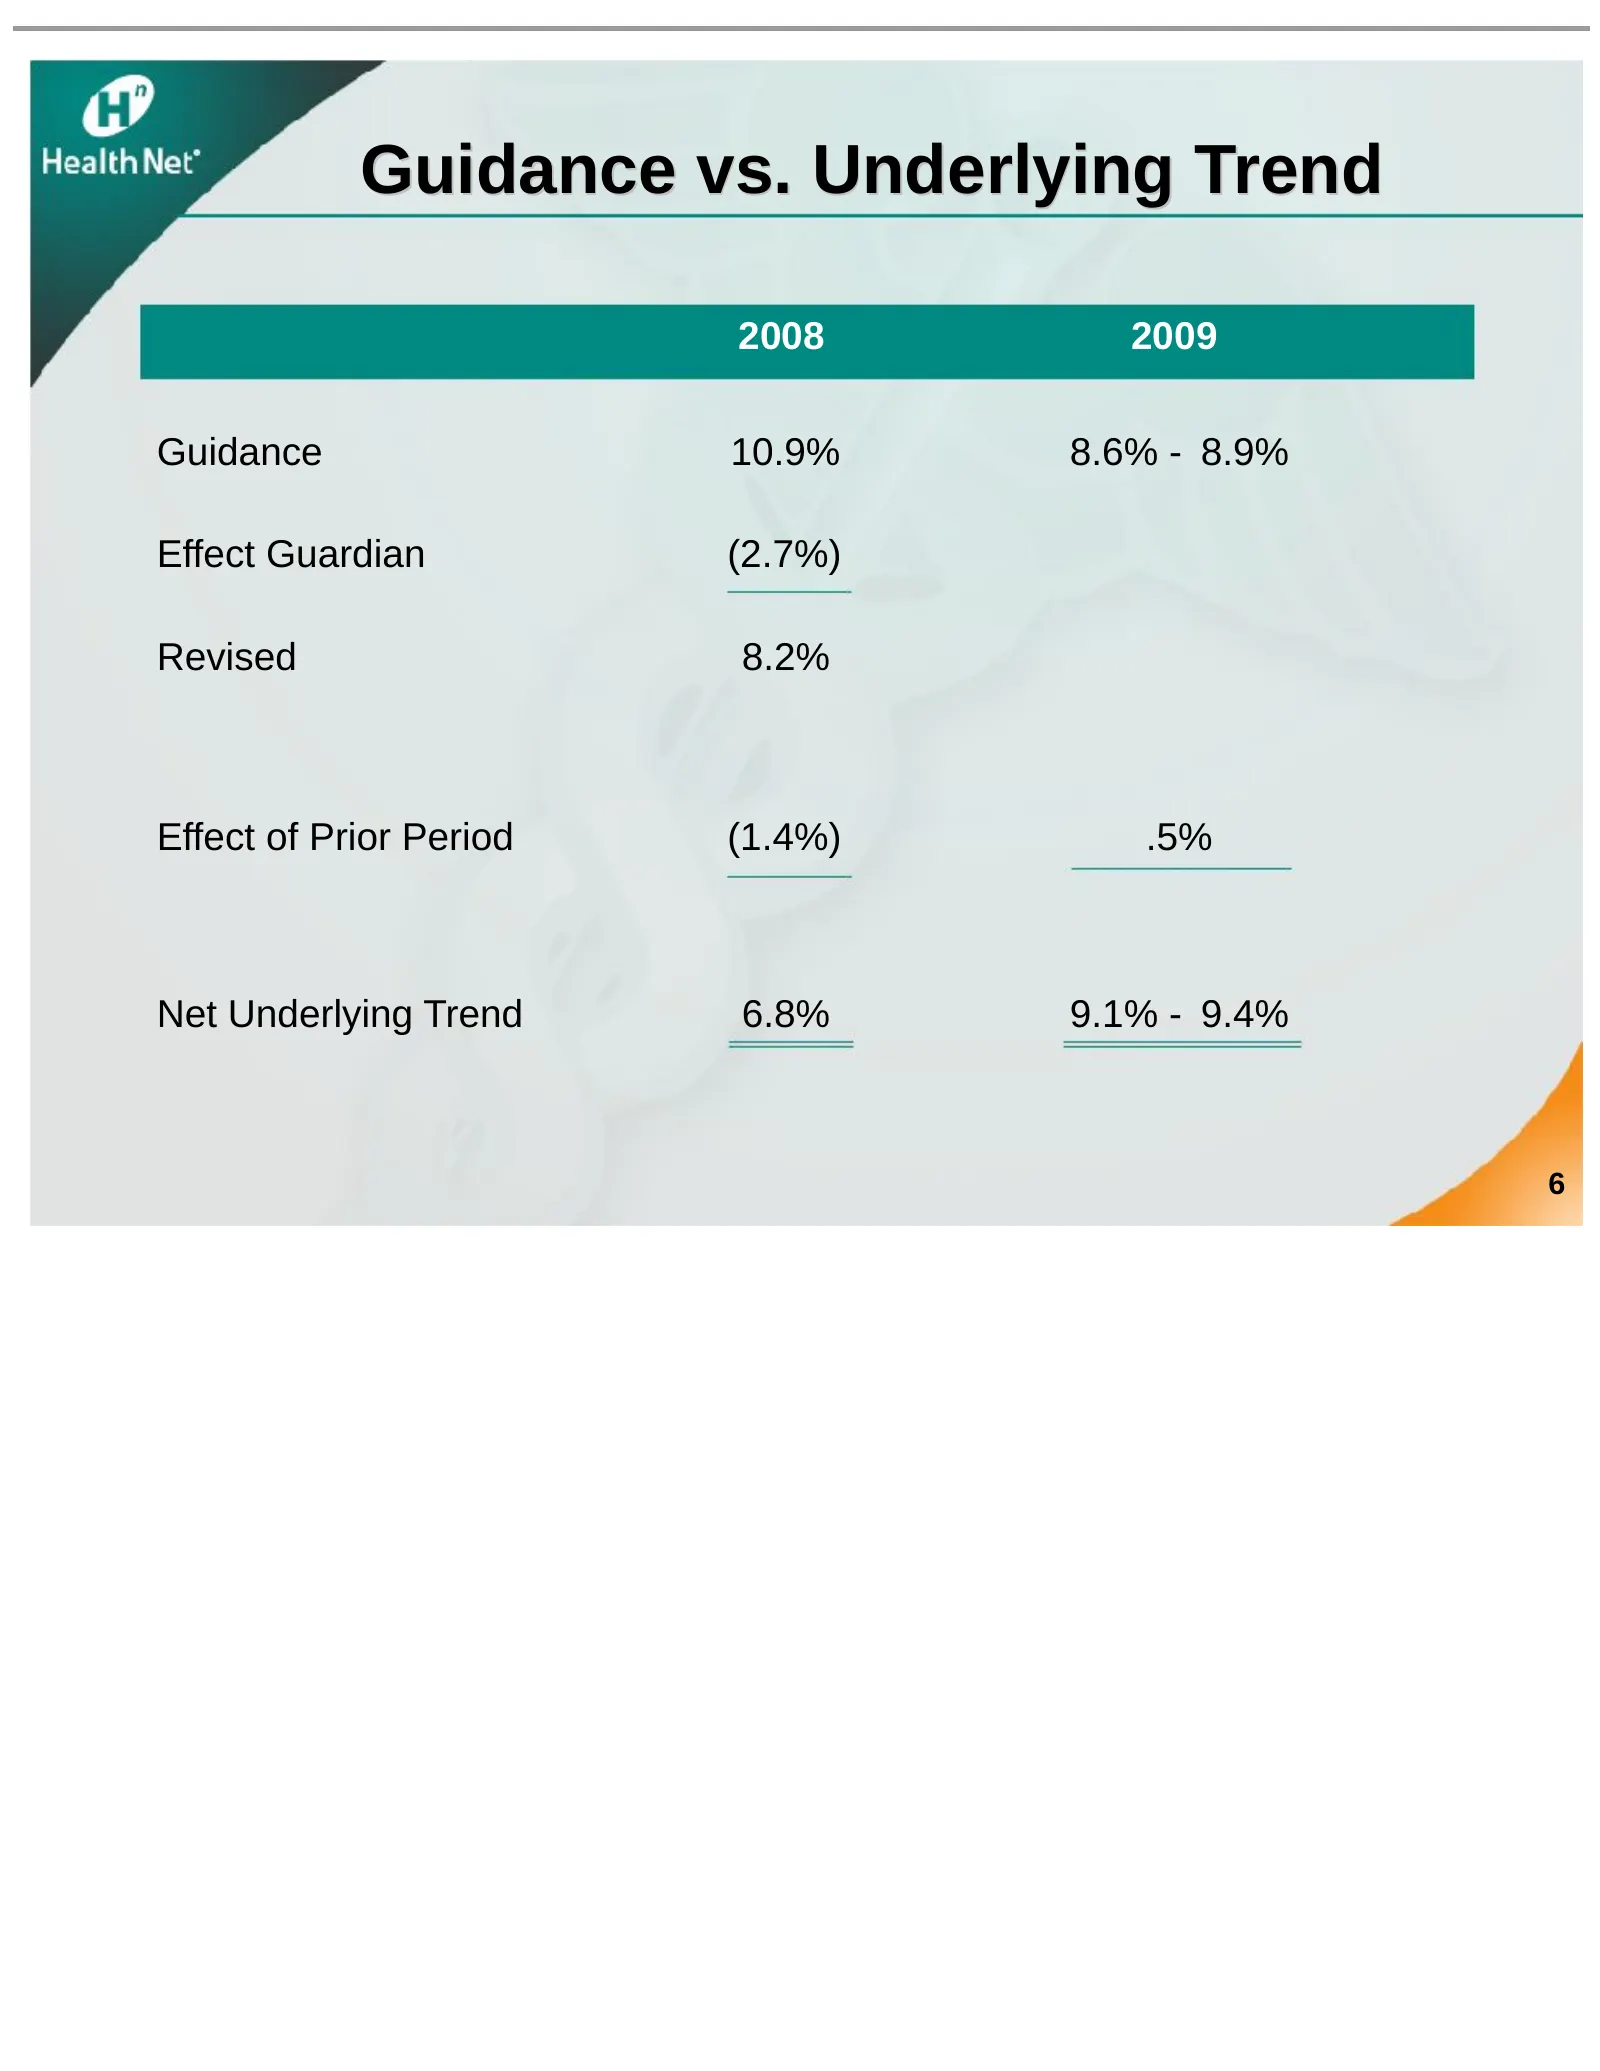
Slide 6: Guidance vs. Underlying Trend
Guidance vs. Underlying Trend 2008 2009 Guidance 10.9% 8.6% - 8.9% Effect Guardian (2.7%) Revised 8.2% Effect of Prior Period (1.4%) .5% Net Underlying Trend 6.8% 9.1% - 9.4% 6
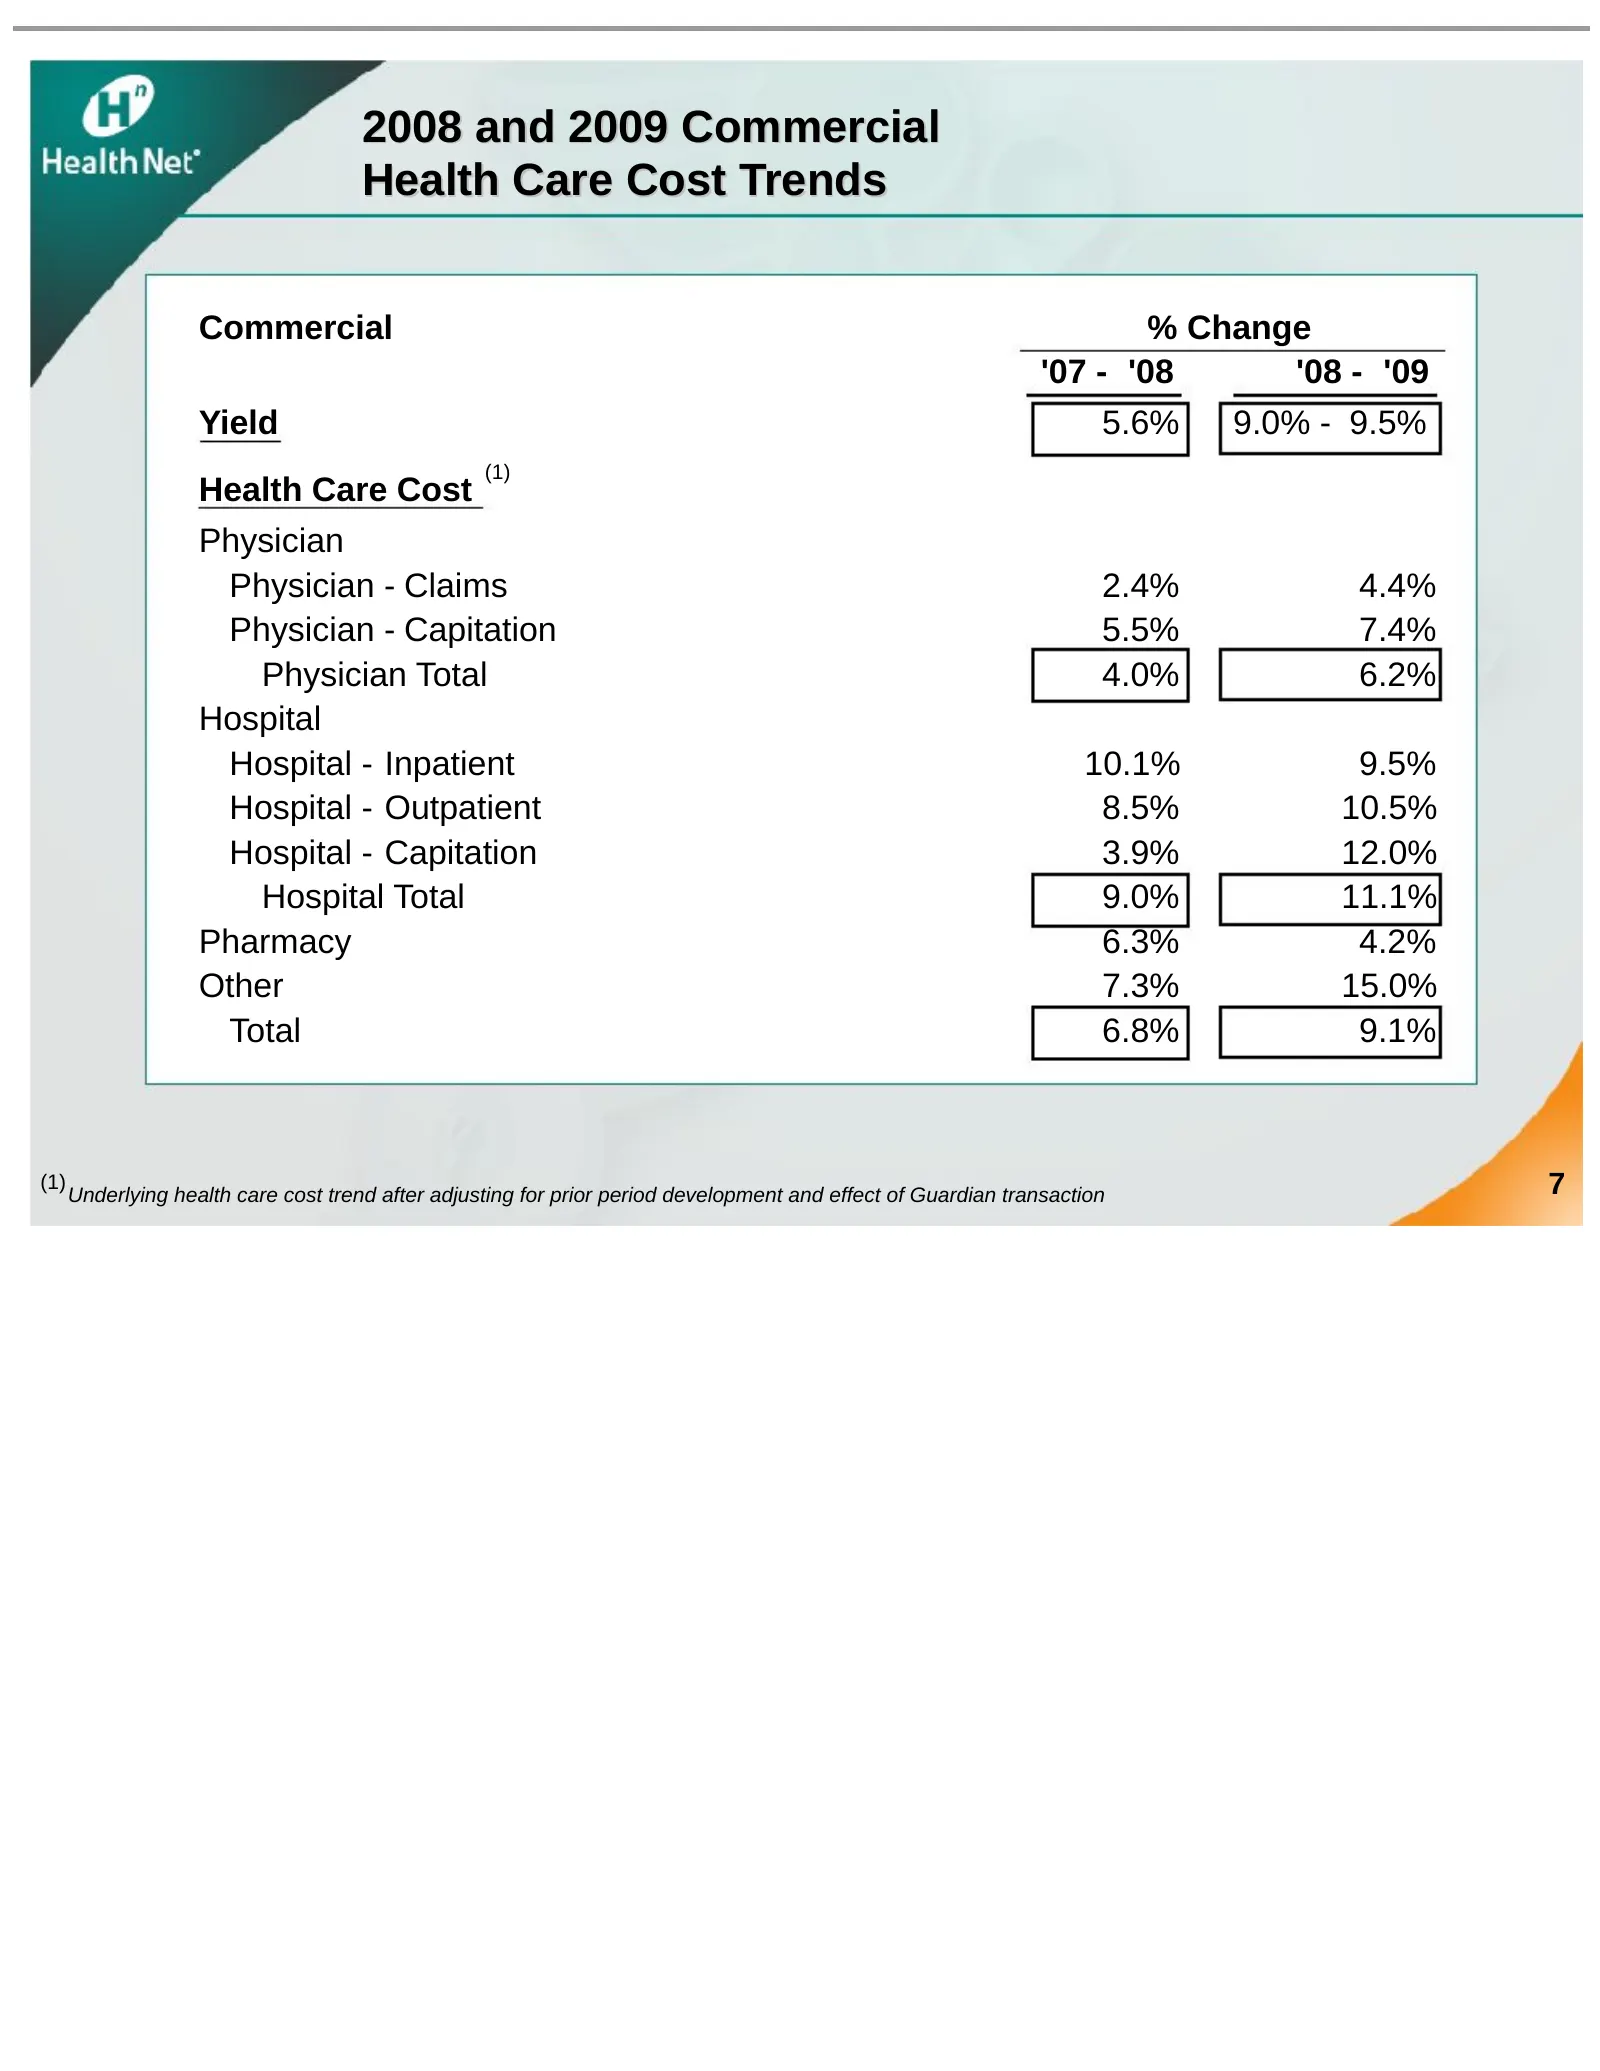
Slide 7: 2008 and 2009 Commercial Health Care Cost Trends
2008 and 2009 Commercial Health Care Cost Trends Commercial % Change '07 - '08 '08 - '09 Yield 5.6% 9.0% - 9.5% (1) Health Care Cost Physician Physician - Claims 2.4% 4.4% Physician - Capitation 5.5% 7.4% Physician Total 4.0% 6.2% Hospital Hospital - Inpatient 10.1% 9.5% Hospital - Outpatient 8.5% 1
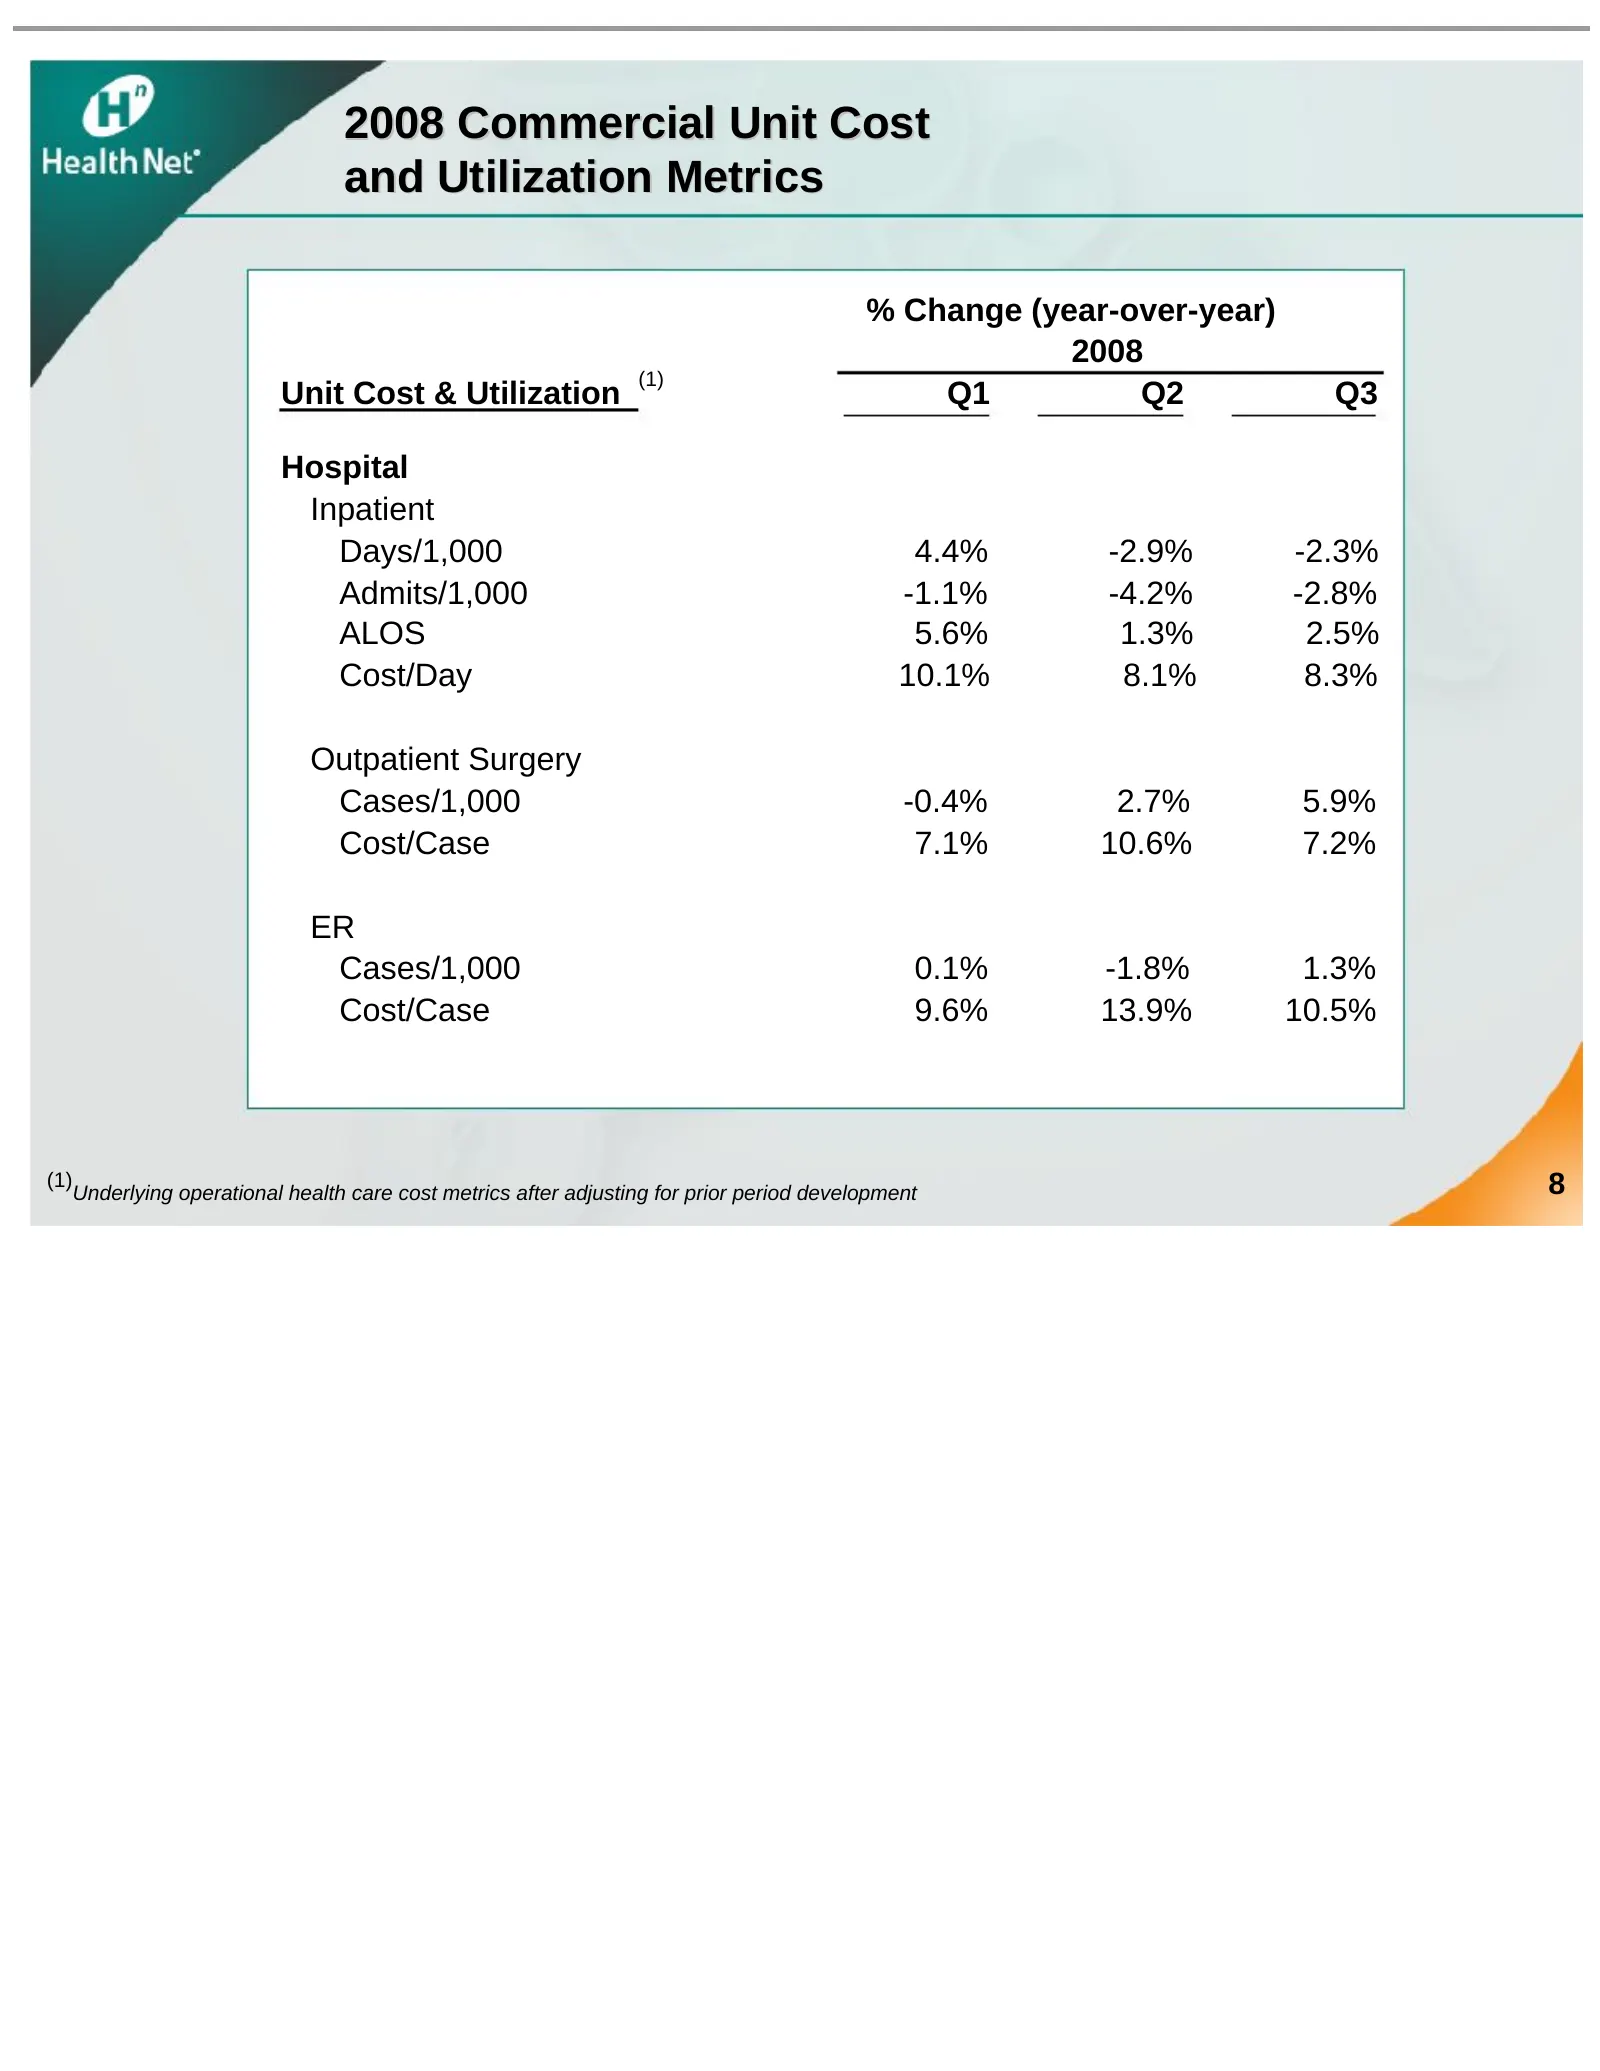
Slide 8: 2008 Commercial Unit Cost and Utilization Metrics
2008 Commercial Unit Cost and Utilization Metrics % Change (year-over-year) 2008 (1) Unit Cost & Utilization Q1 Q2 Q3 Hospital Inpatient Days/1,000 4.4% -2.9% -2.3% Admits/1,000 -1.1% -4.2% -2.8% ALOS 5.6% 1.3% 2.5% Cost/Day 10.1% 8.1% 8.3% Outpatient Surgery Cases/1,000 -0.4% 2.7% 5.9% Cost/Case 7.
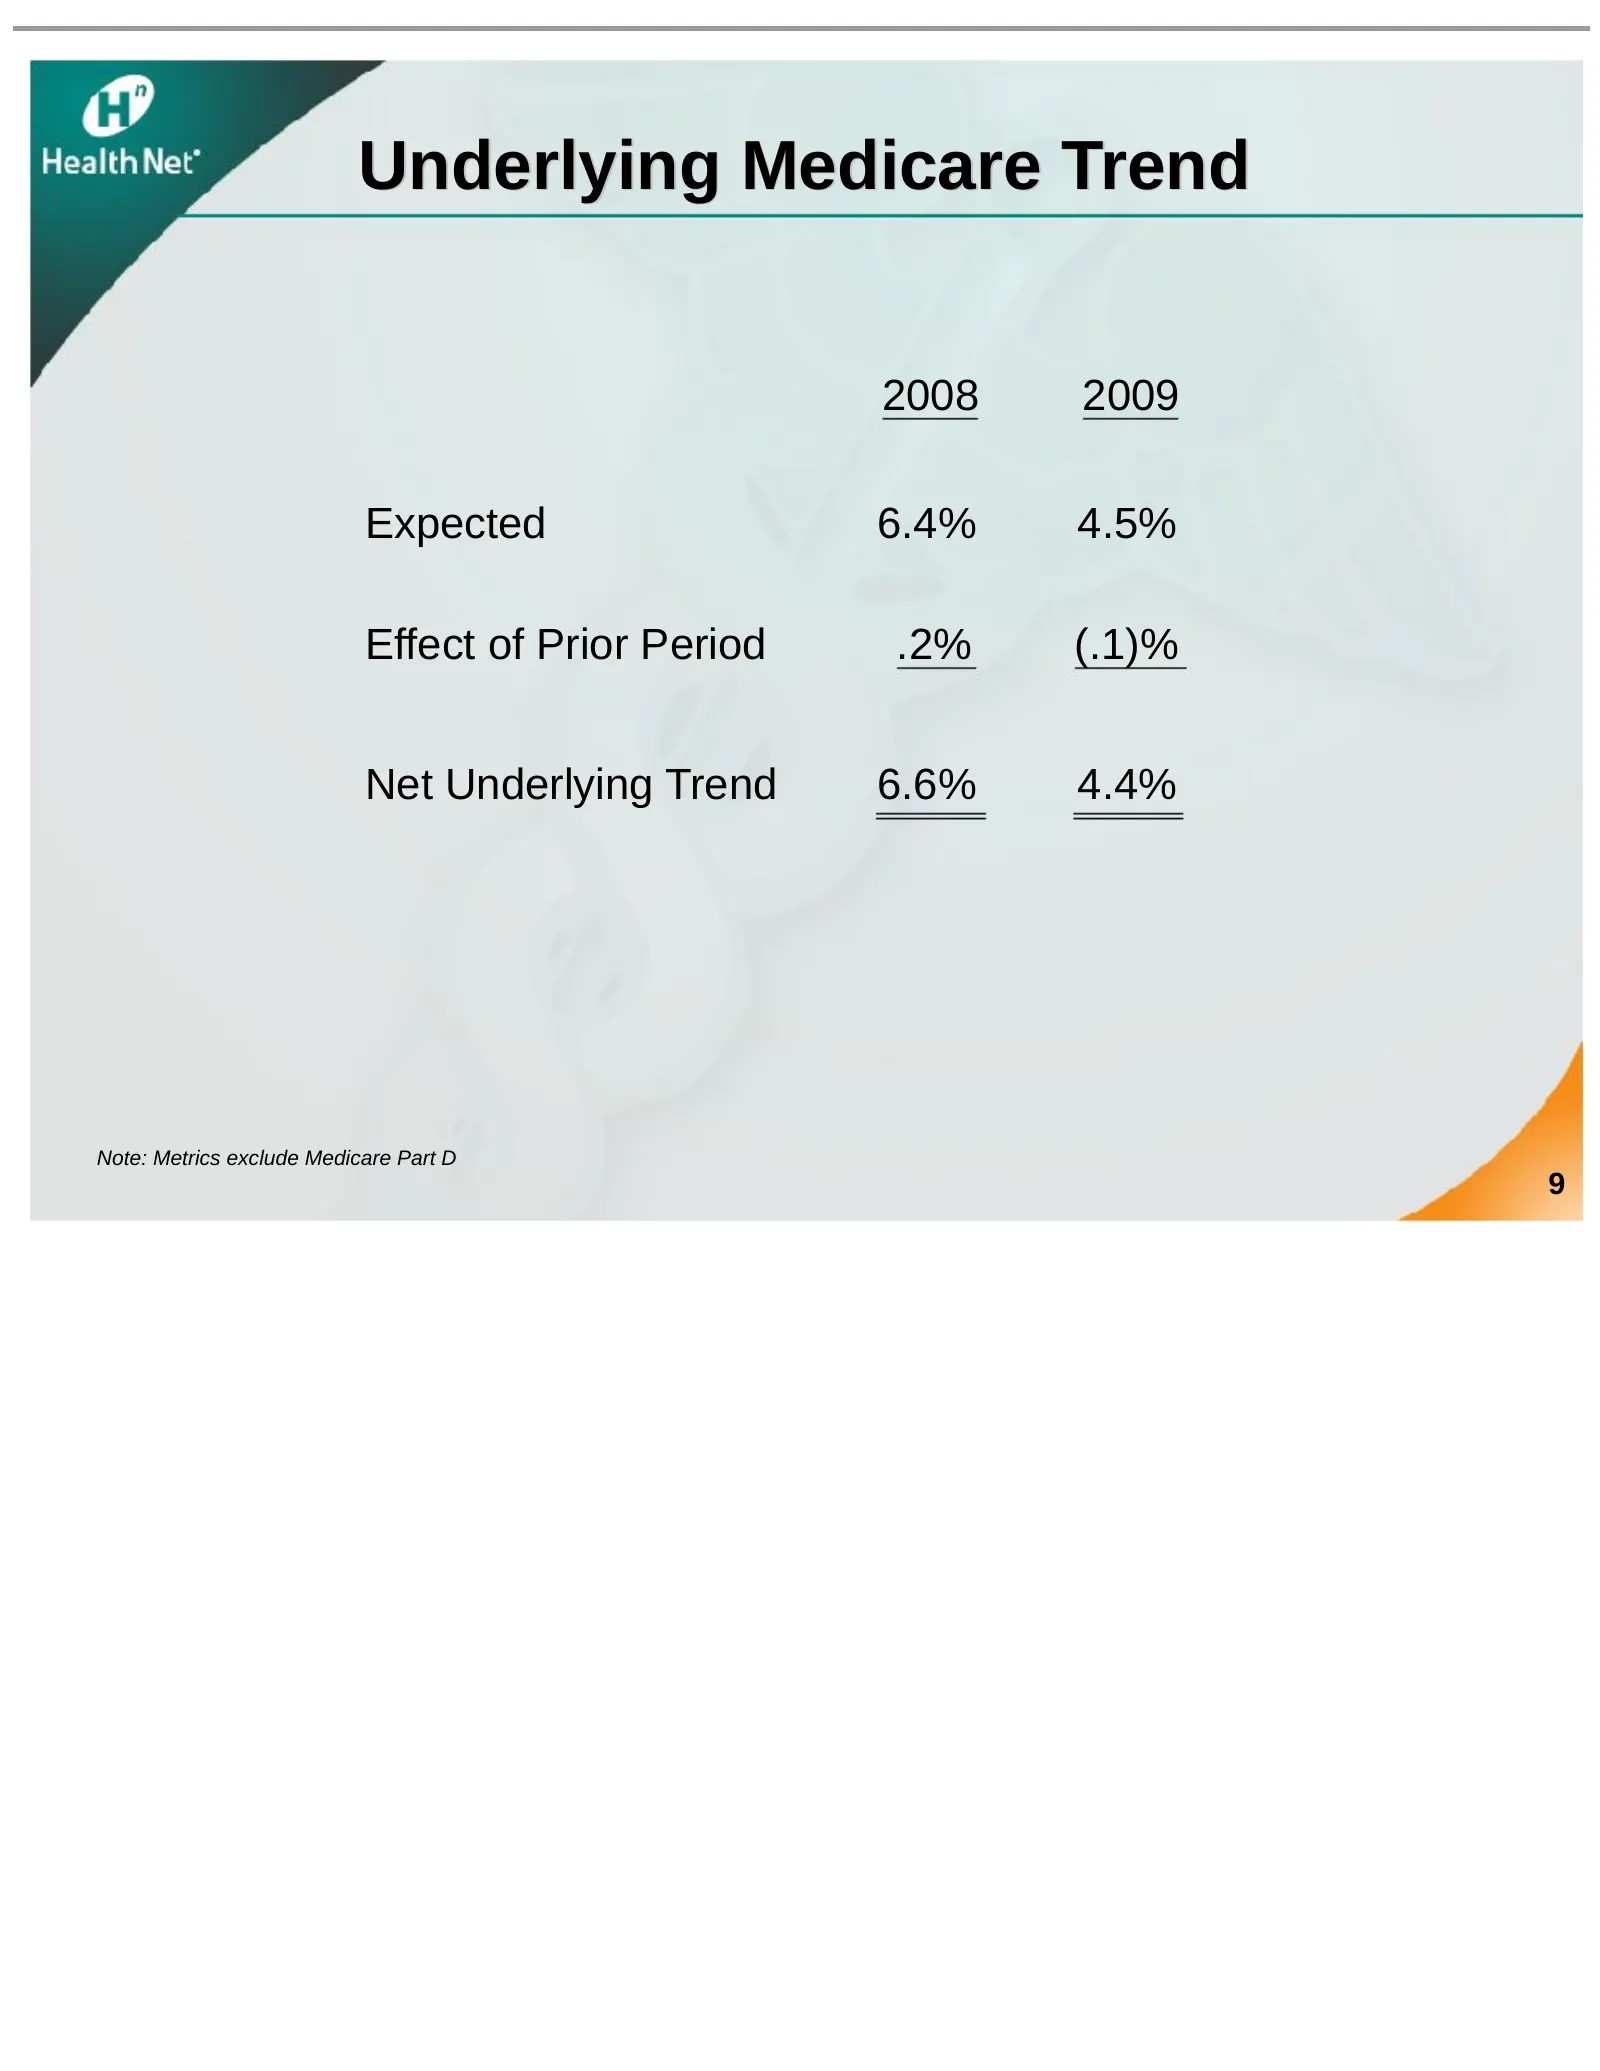
Slide 9: Underlying Medicare Trend
Underlying Medicare Trend 2008 2009 Expected 6.4% 4.5% Effect of Prior Period .2% (.1)% Net Underlying Trend 6.6% 4.4% Note: Metrics exclude Medicare Part D 9
Slide 10: 2007 to 2009 Medicare Health Care Costs
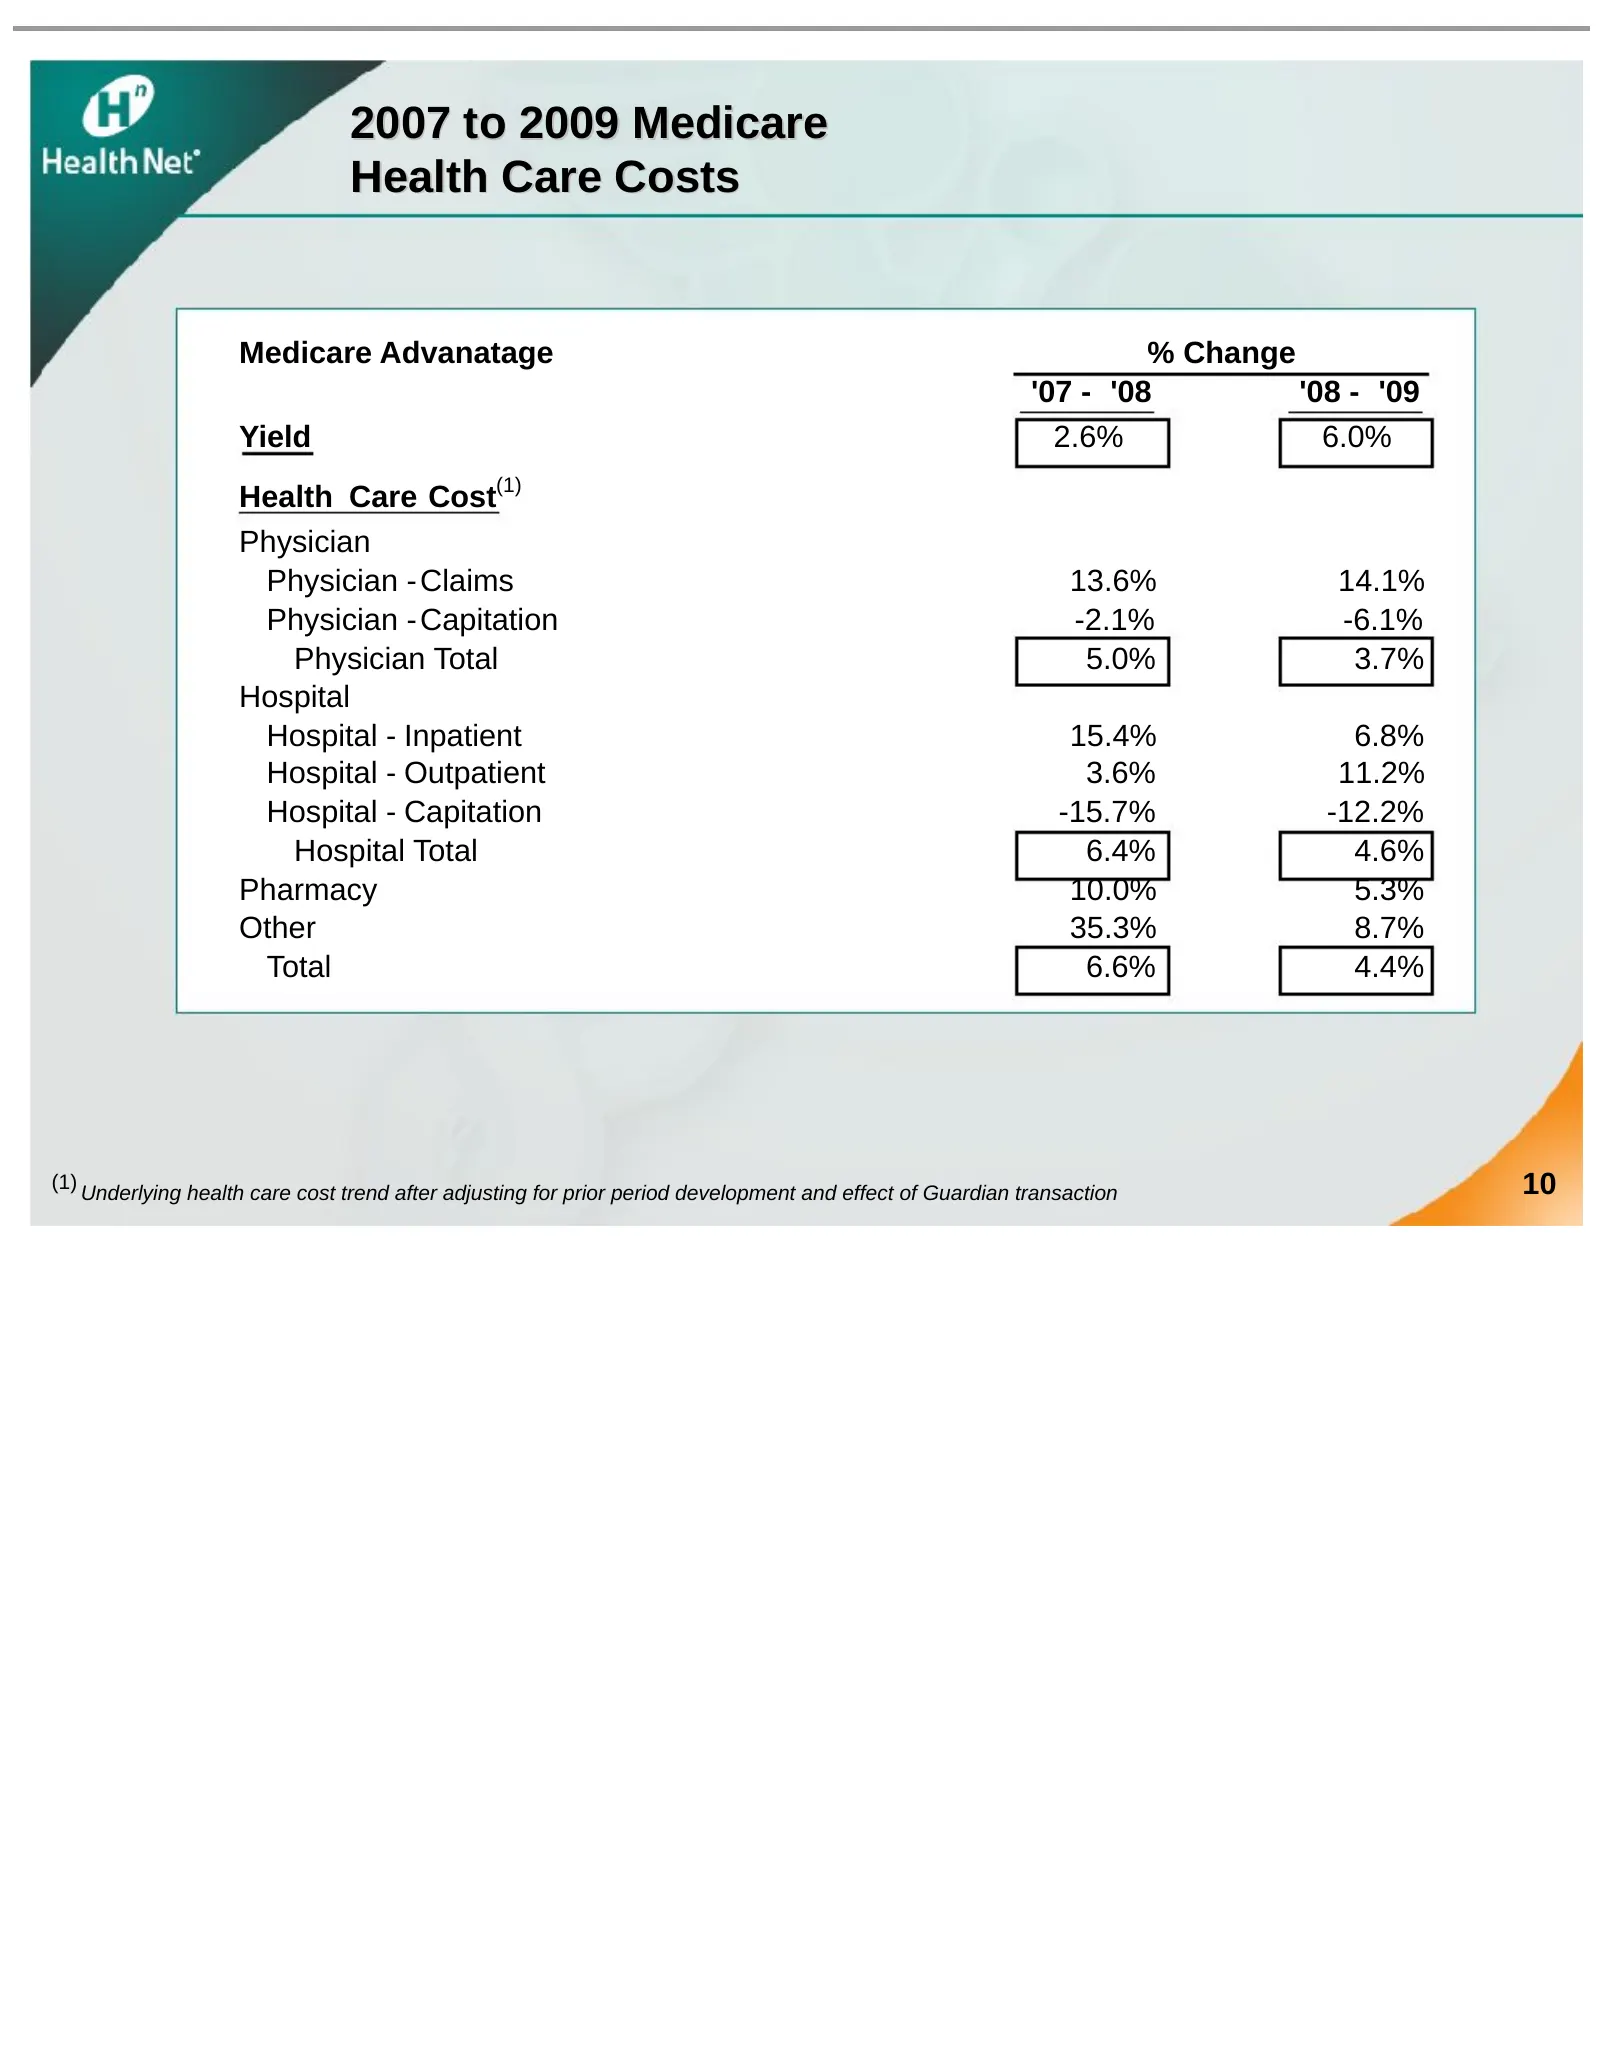
2007 to 2009 Medicare Health Care Costs Medicare Advanatage % Change '07 - '08 '08 - '09 Yield 2.6% 6.0% Health Care Cost(1) Physician Physician - Claims 13.6% 14.1% Physician - Capitation -2.1% -6.1% Physician Total 5.0% 3.7% Hospital Hospital - Inpatient 15.4% 6.8% Hospital - Outpatient 3.6% 11.2%

Slide 11: Commercial
Commercial tH Health Net"
Slide 12: 2009 Underlying Health Care Cost Trend: HNCA – Commercial
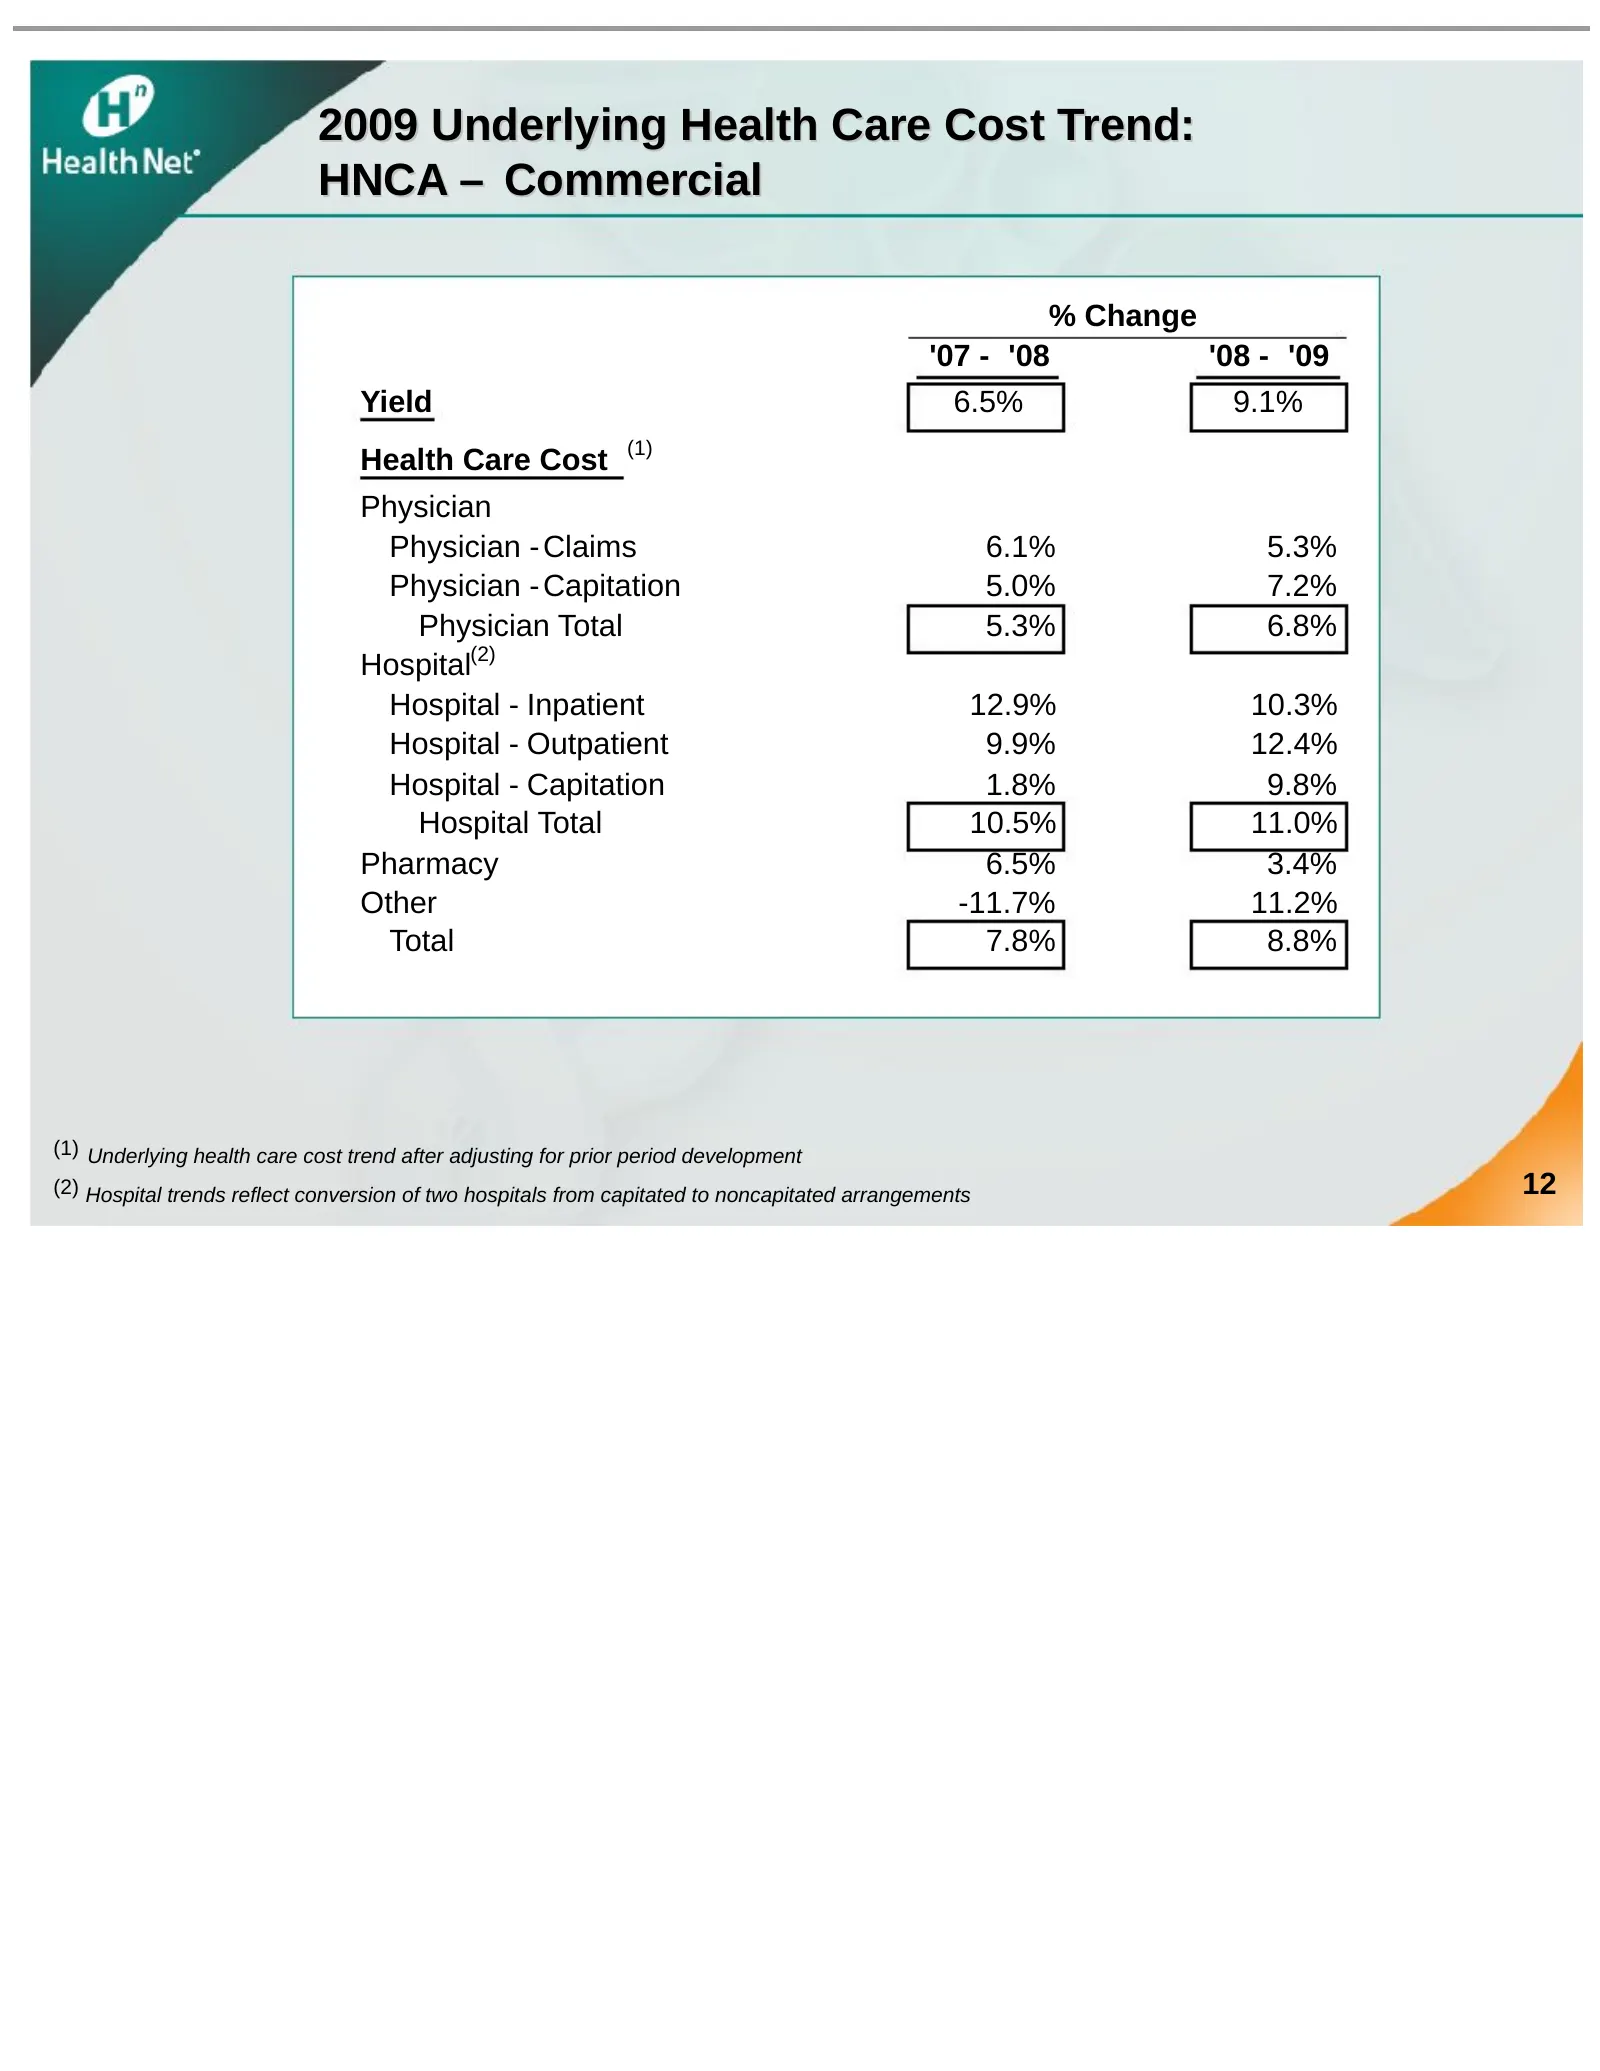
2009 Underlying Health Care Cost Trend: HNCA – Commercial % Change '07 - '08 '08 - '09 Yield 6.5% 9.1% Health Care Cost (1) Physician Physician - Claims 6.1% 5.3% Physician - Capitation 5.0% 7.2% Physician Total 5.3% 6.8% Hospital(2) Hospital - Inpatient 12.9% 10.3% Hospital - Outpatient 9.9% 12.4%
Slide 13: 2008 Financial Performance: HNCA – Commercial
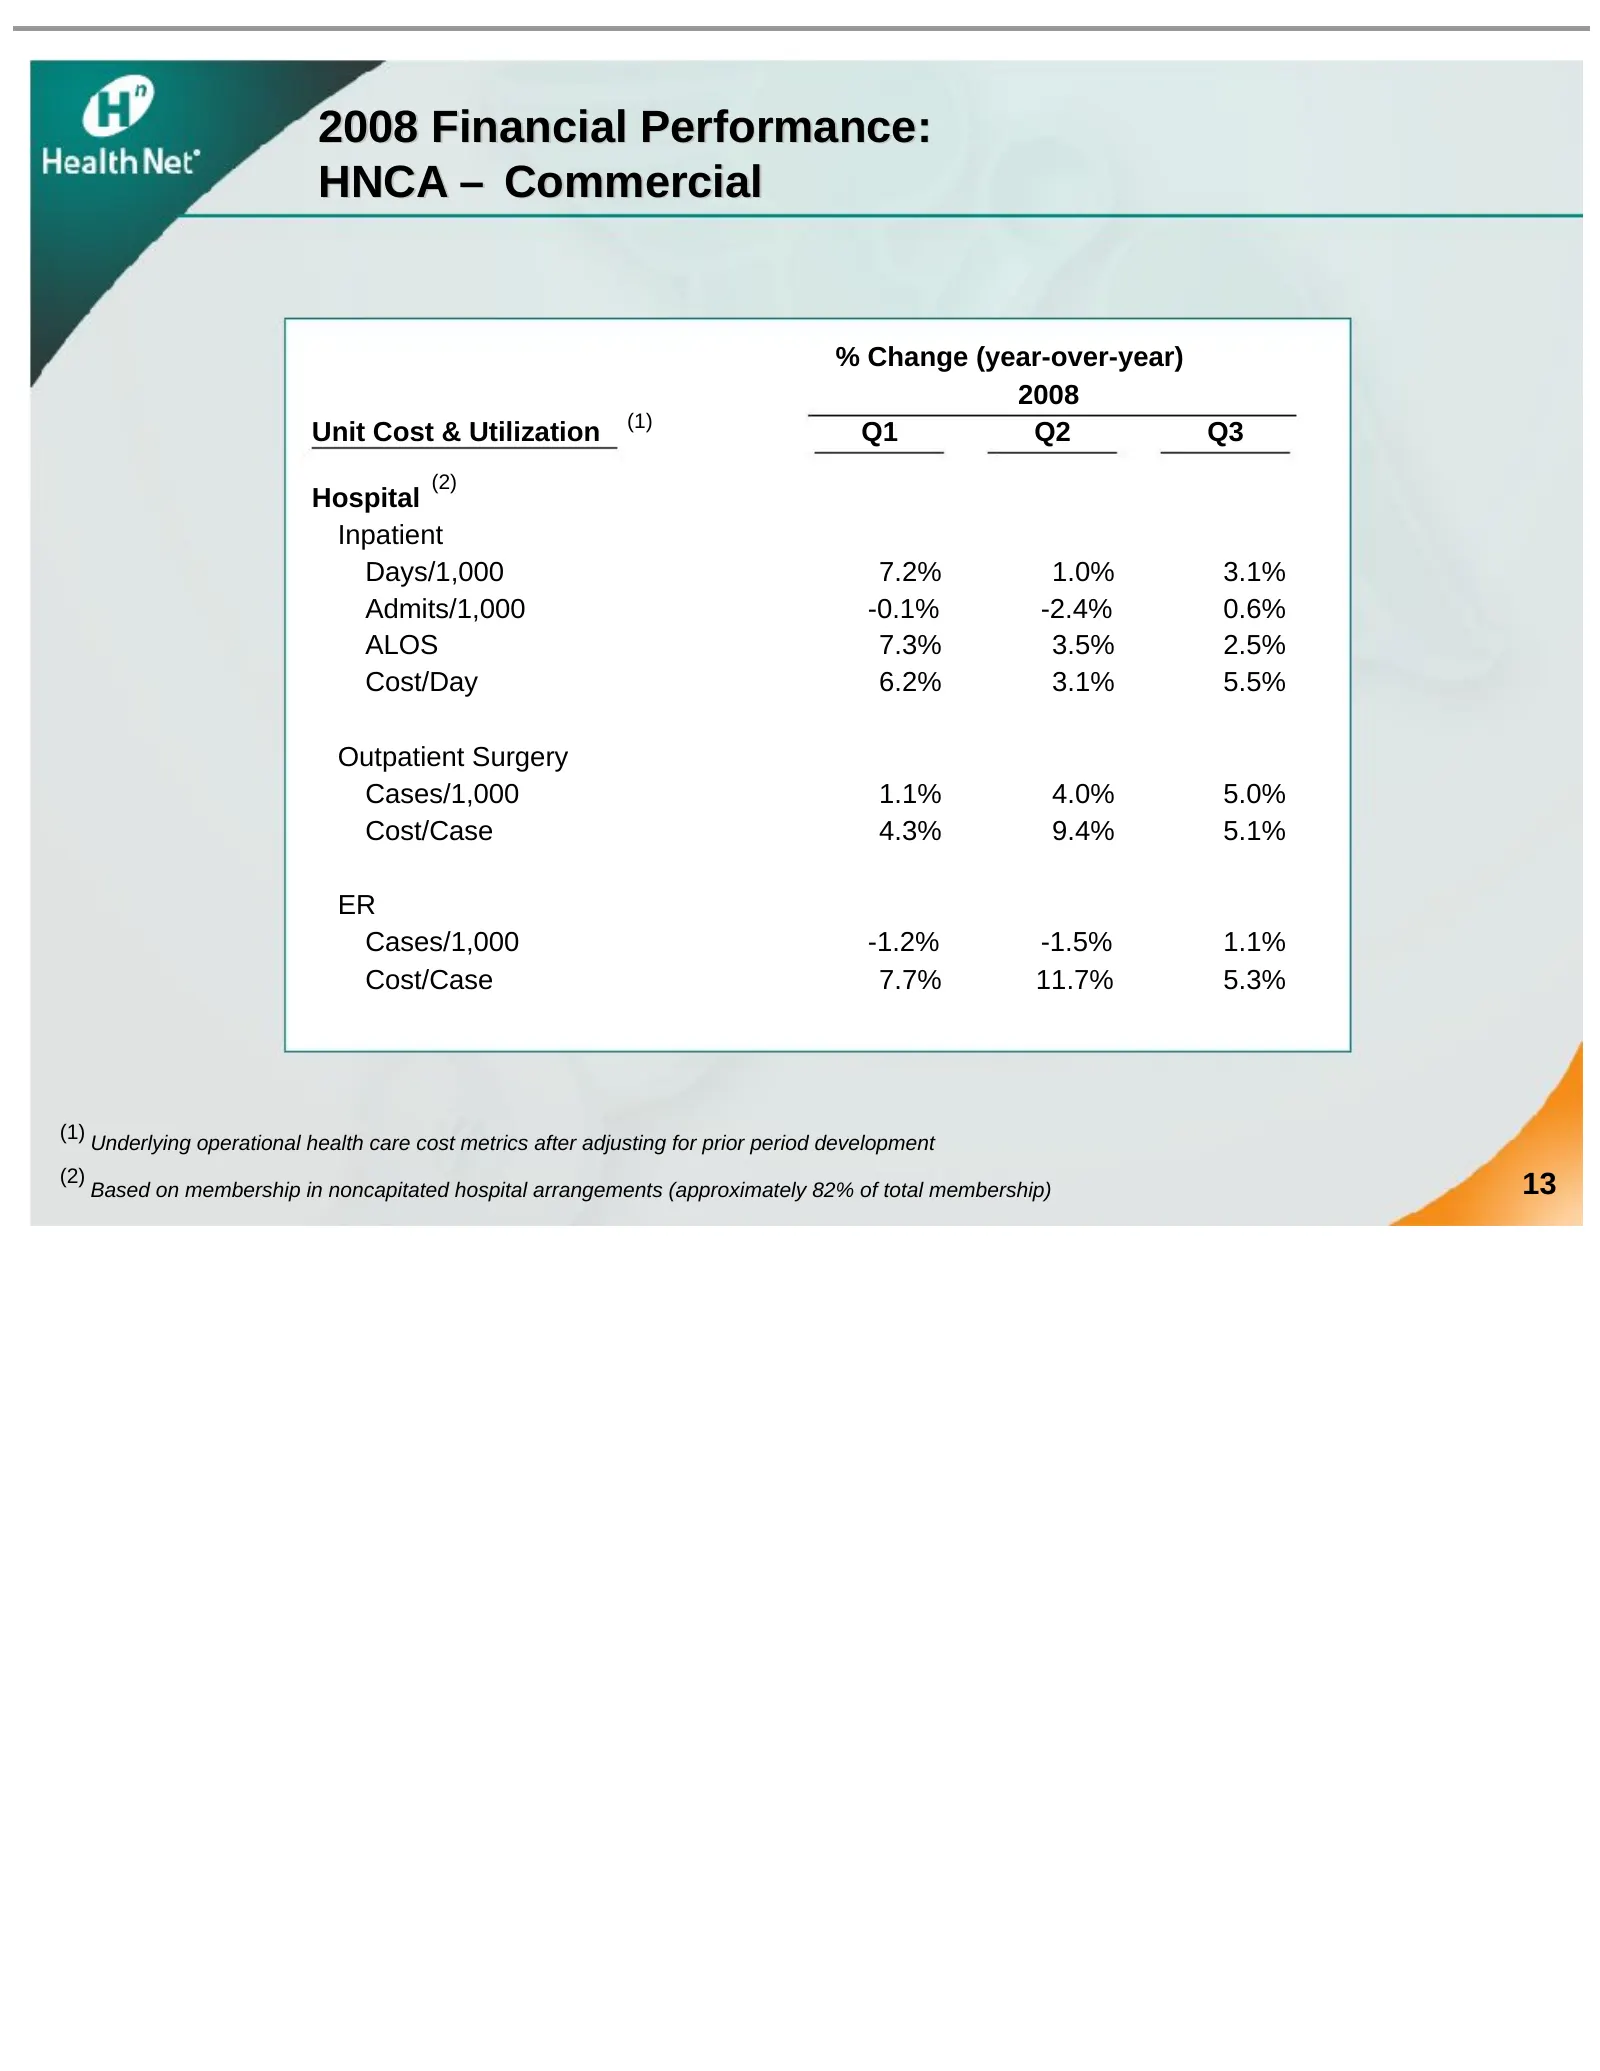
2008 Financial Performance: HNCA – Commercial % Change (year-over-year) 2008 (1) Unit Cost & Utilization Q1 Q2 Q3 (2) Hospital Inpatient Days/1,000 7.2% 1.0% 3.1% Admits/1,000 -0.1% -2.4% 0.6% ALOS 7.3% 3.5% 2.5% Cost/Day 6.2% 3.1% 5.5% Outpatient Surgery Cases/1,000 1.1% 4.0% 5.0% Cost/Case 4.3% 9.
Slide 14: 2008 Performance: HNCA – Commercial
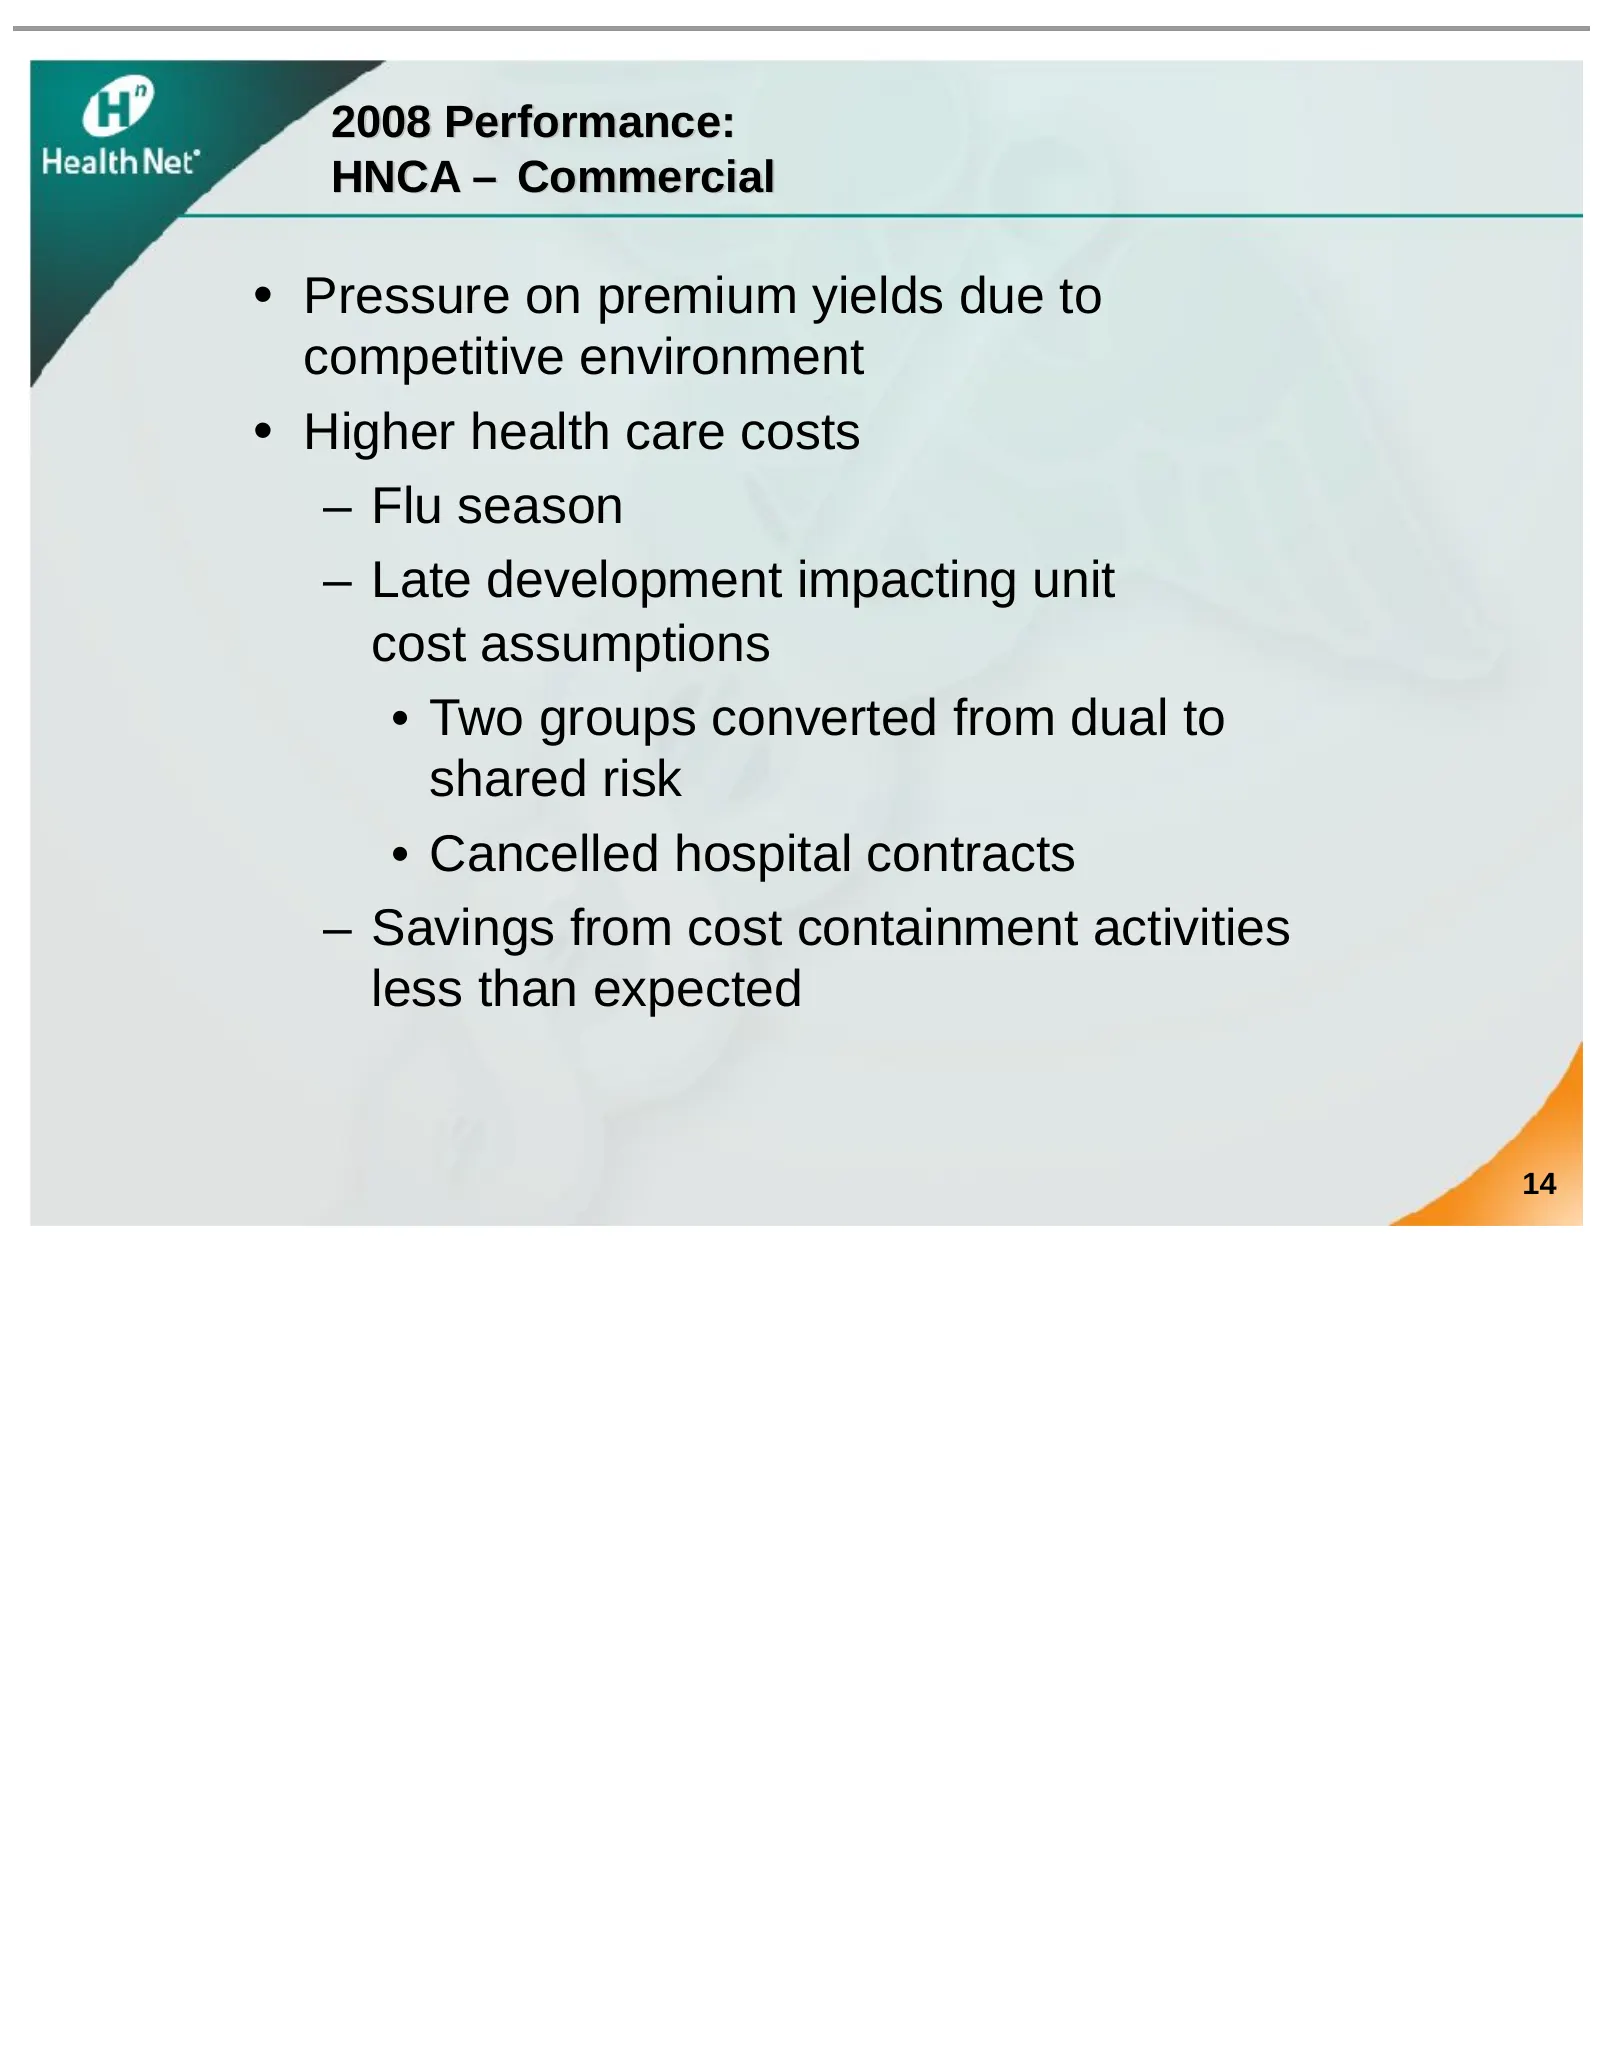
2008 Performance: HNCA – Commercial • Pressure on premium yields due to competitive environment • Higher health care costs – Flu season – Late development impacting unit cost assumptions • Two groups converted from dual to shared risk • Cancelled hospital contracts – Savings from cost containment ac
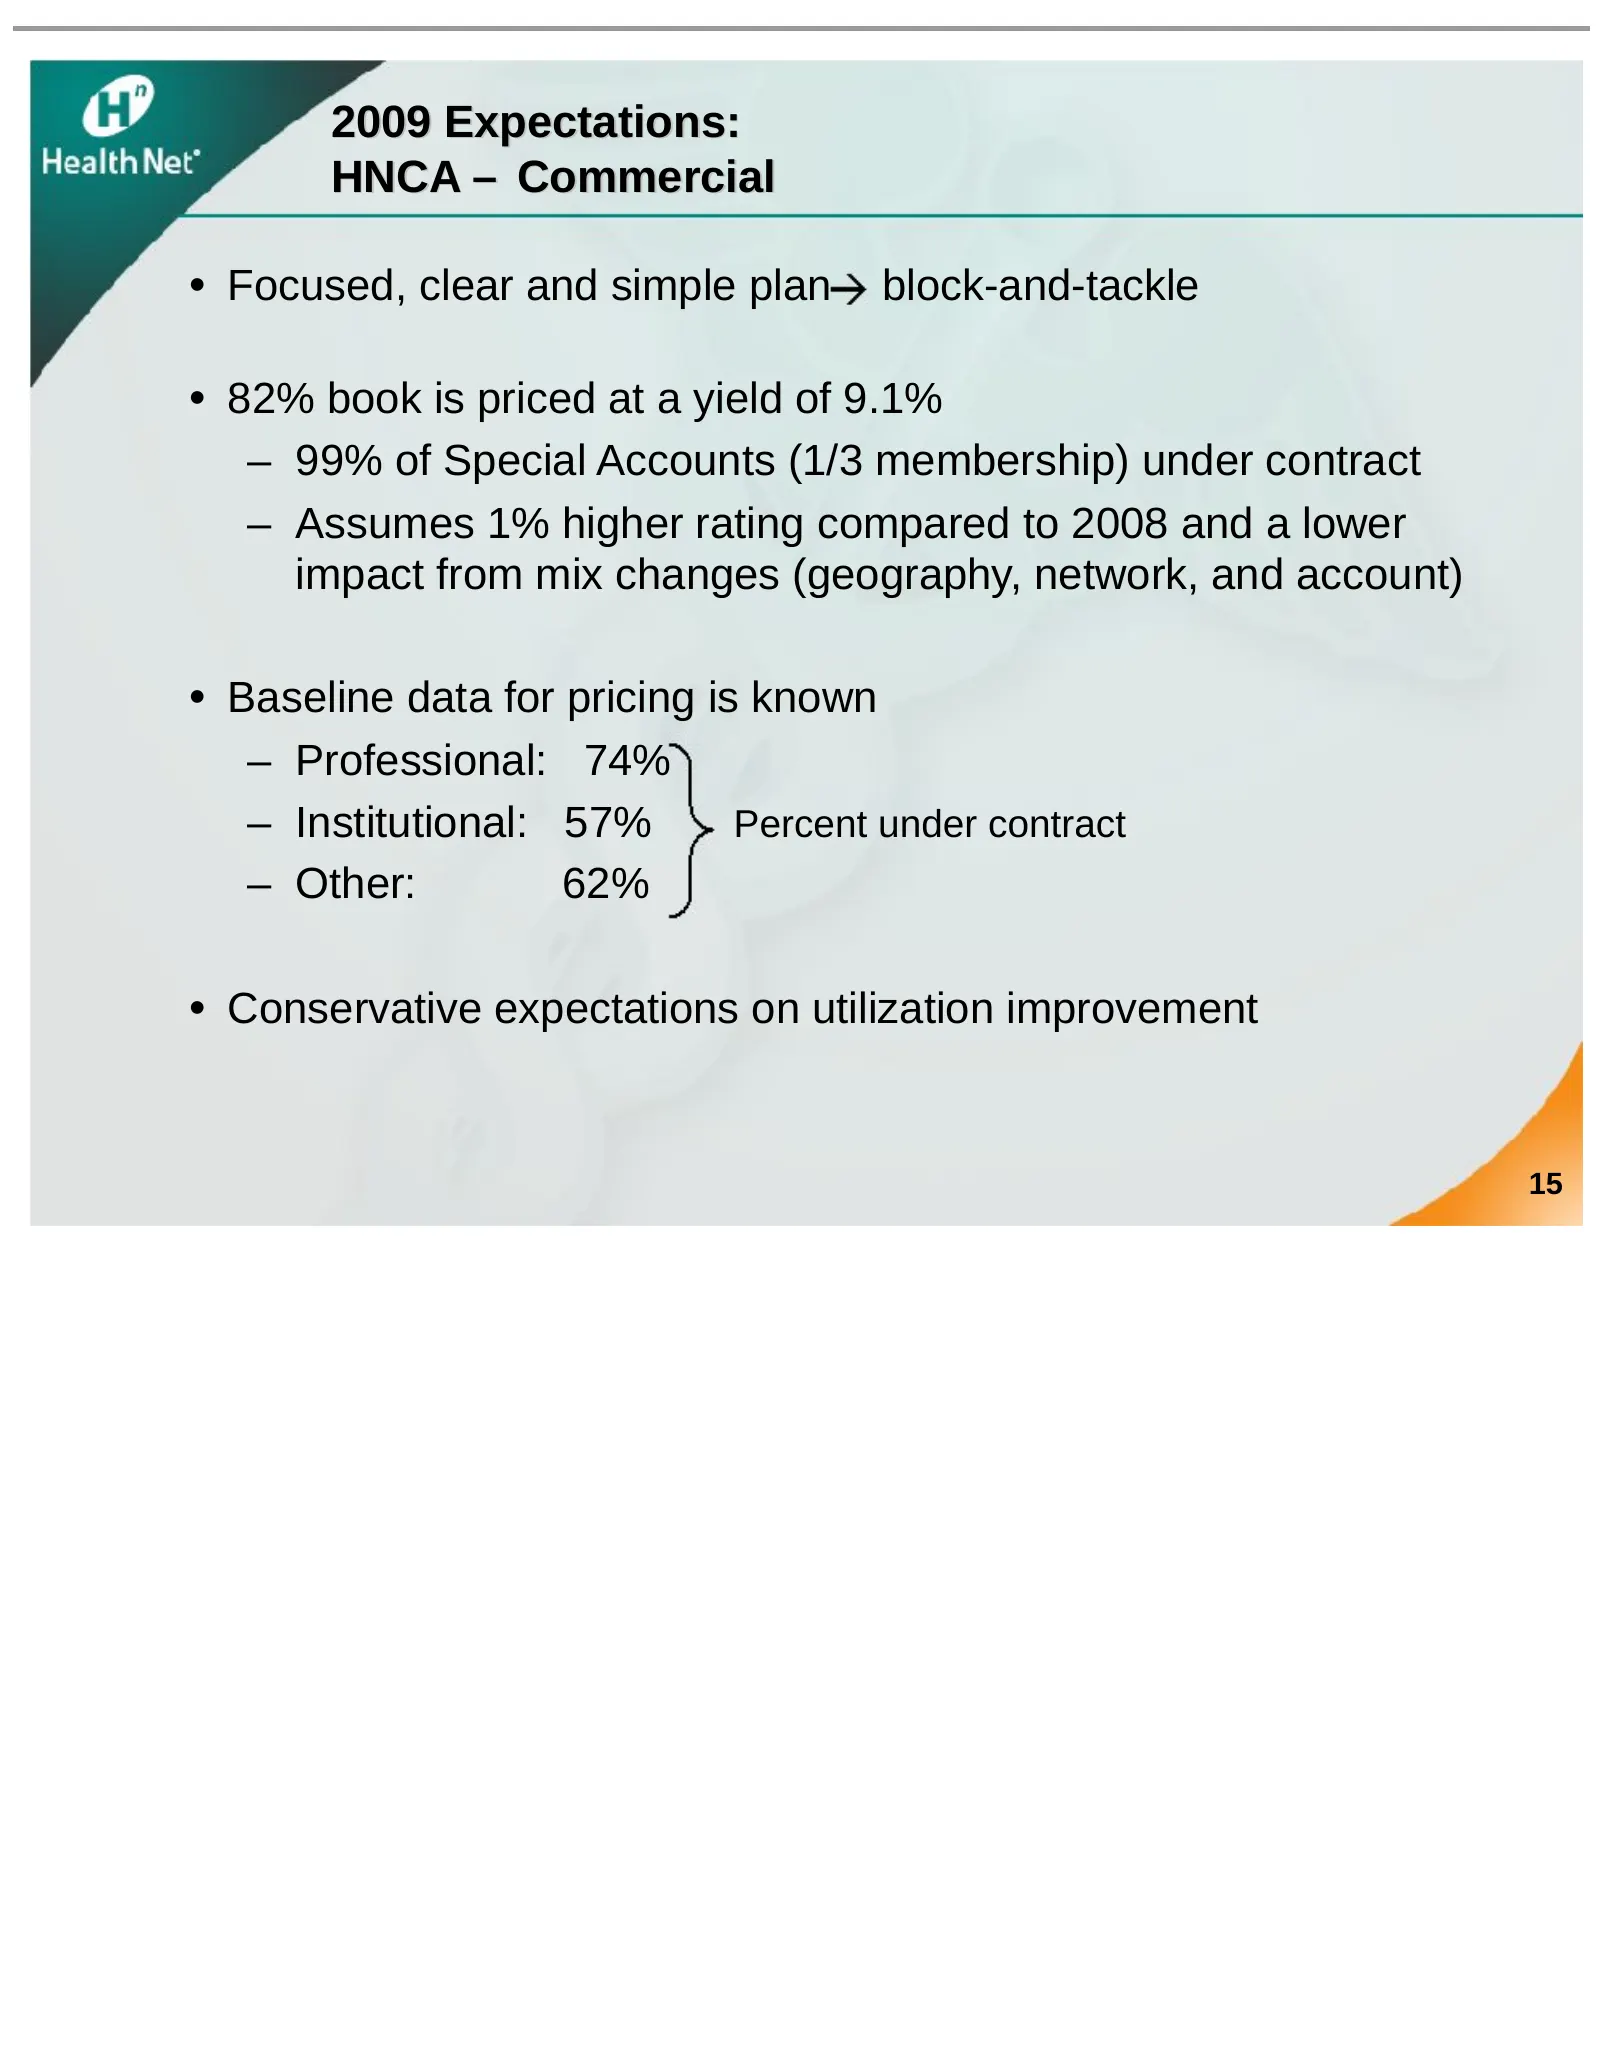
Slide 15: 2009 Expectations: HNCA – Commercial
2009 Expectations: HNCA – Commercial • Focused, clear and simple plan block-and-tackle • 82% book is priced at a yield of 9.1% – 99% of Special Accounts (1/3 membership) under contract – Assumes 1% higher rating compared to 2008 and a lower impact from mix changes (geography, network, and account) •
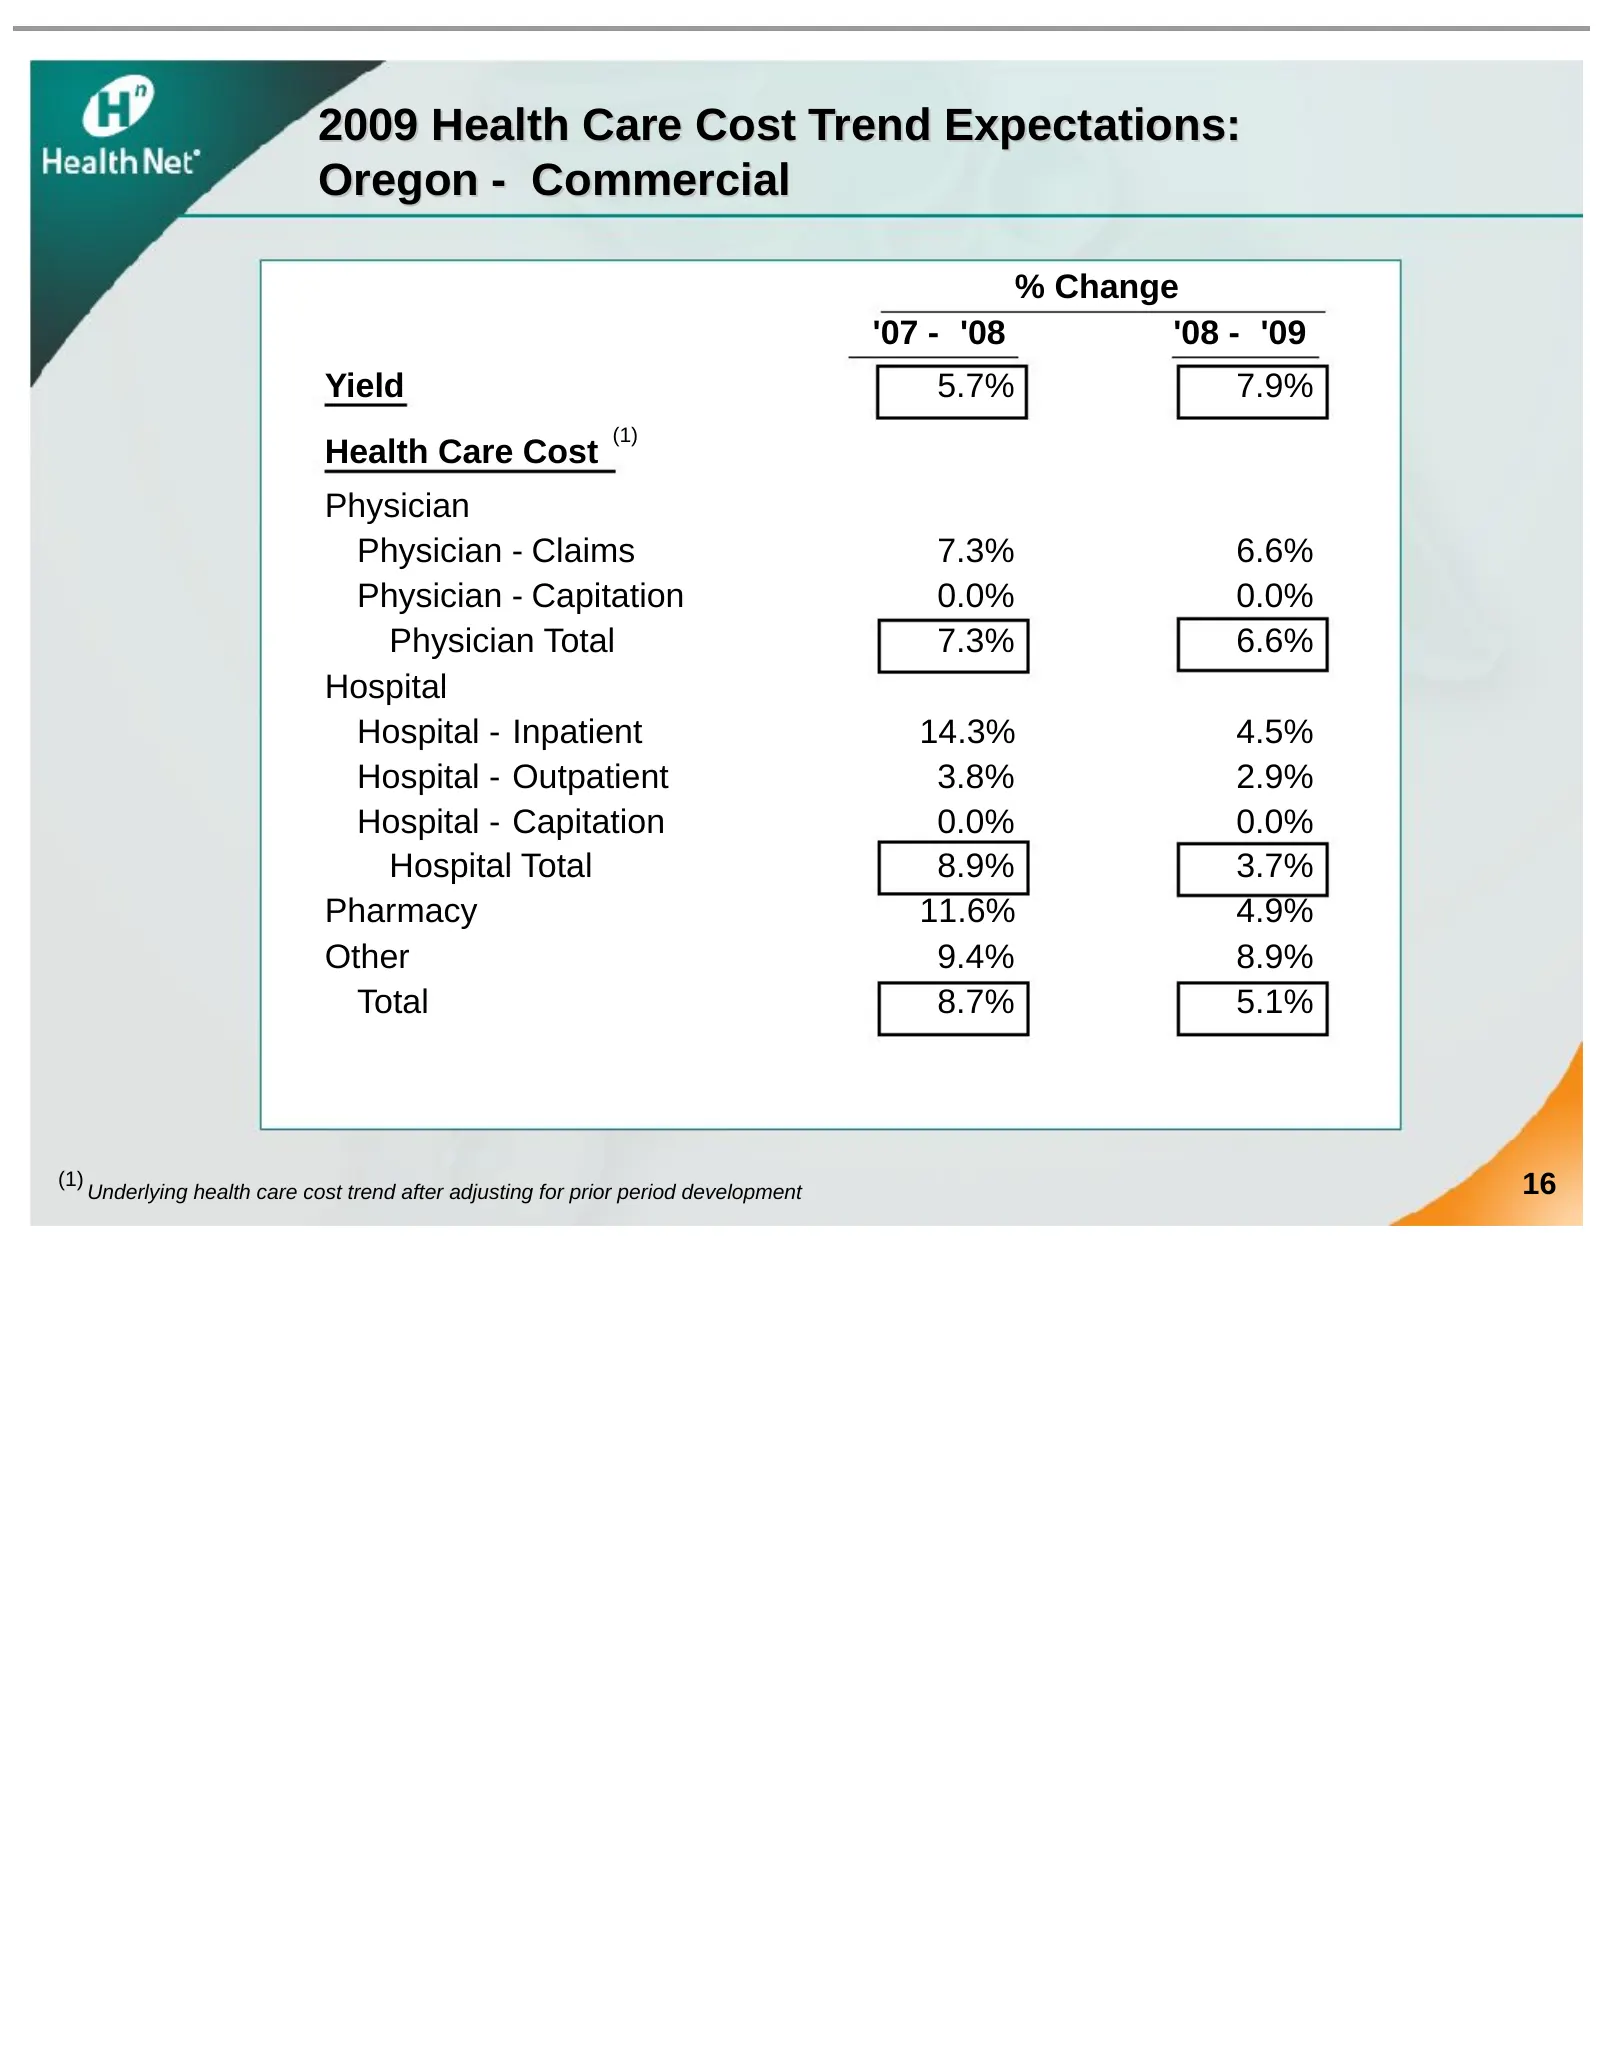
Slide 16: 2009 Health Care Cost Trend Expectations: Oregon - Commercial
2009 Health Care Cost Trend Expectations: Oregon - Commercial % Change '07 - '08 '08 - '09 Yield 5.7% 7.9% (1) Health Care Cost Physician Physician - Claims 7.3% 6.6% Physician - Capitation 0.0% 0.0% Physician Total 7.3% 6.6% Hospital Hospital - Inpatient 14.3% 4.5% Hospital - Outpatient 3.8% 2.9% H
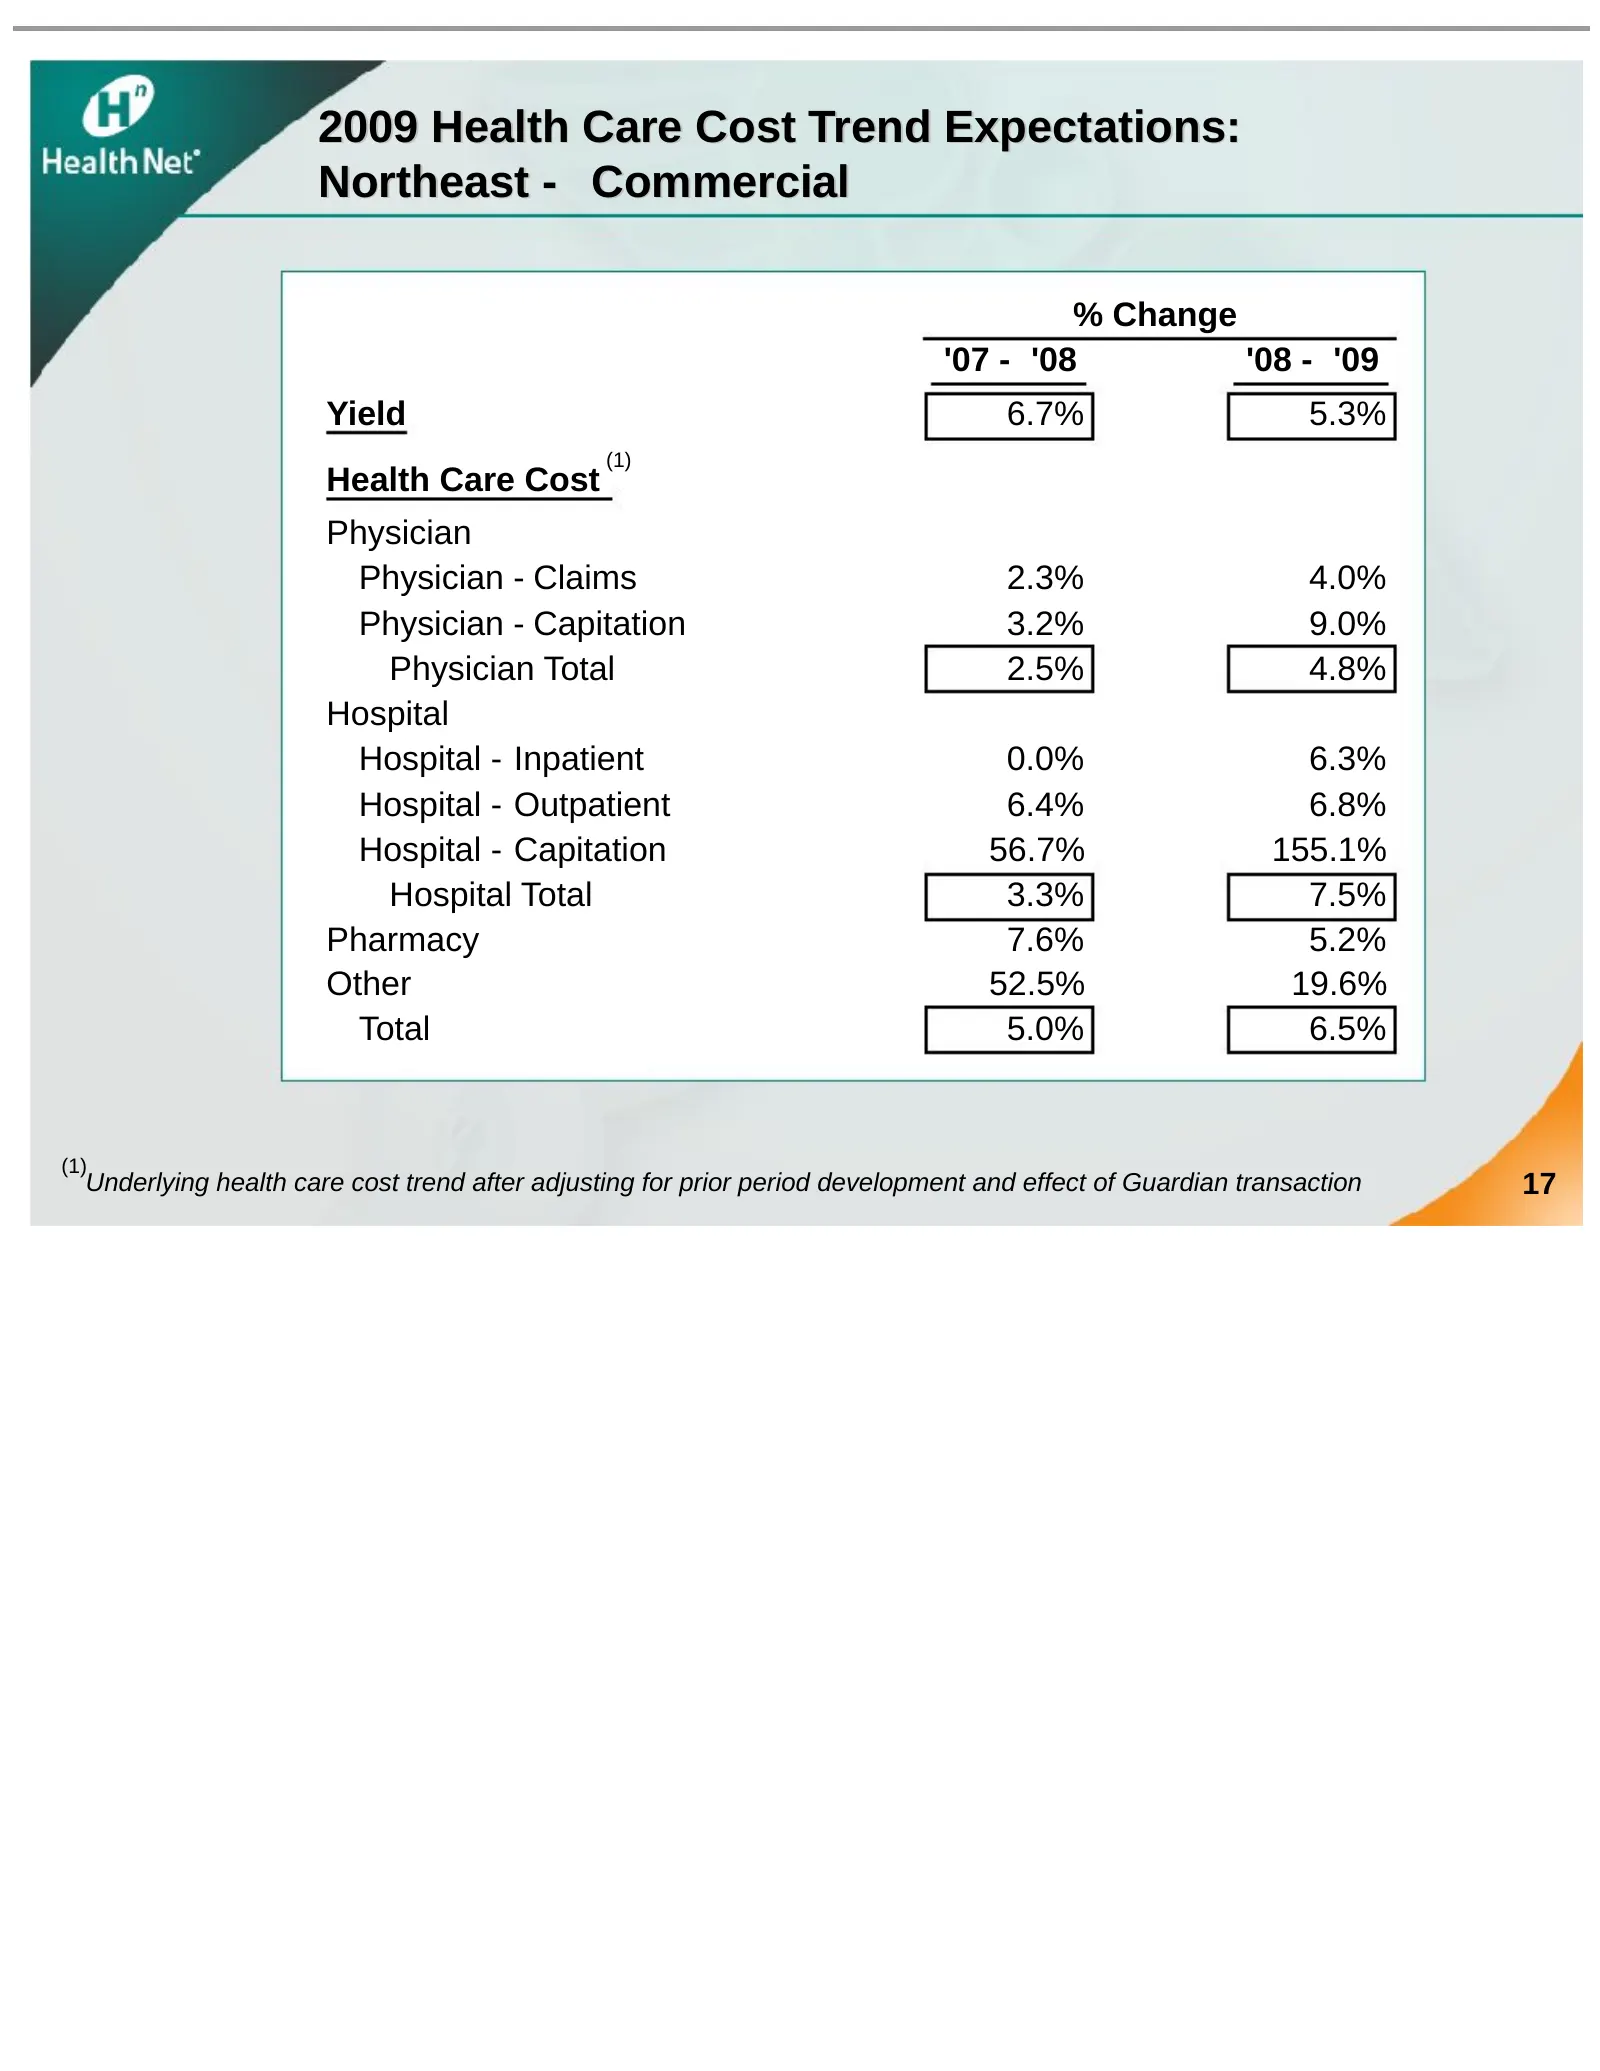
Slide 17: 2009 Health Care Cost Trend Expectations: Northeast - Commercial
2009 Health Care Cost Trend Expectations: Northeast - Commercial % Change '07 - '08 '08 - '09 Yield 6.7% 5.3% (1) Health Care Cost Physician Physician - Claims 2.3% 4.0% Physician - Capitation 3.2% 9.0% Physician Total 2.5% 4.8% Hospital Hospital - Inpatient 0.0% 6.3% Hospital - Outpatient 6.4% 6.8%
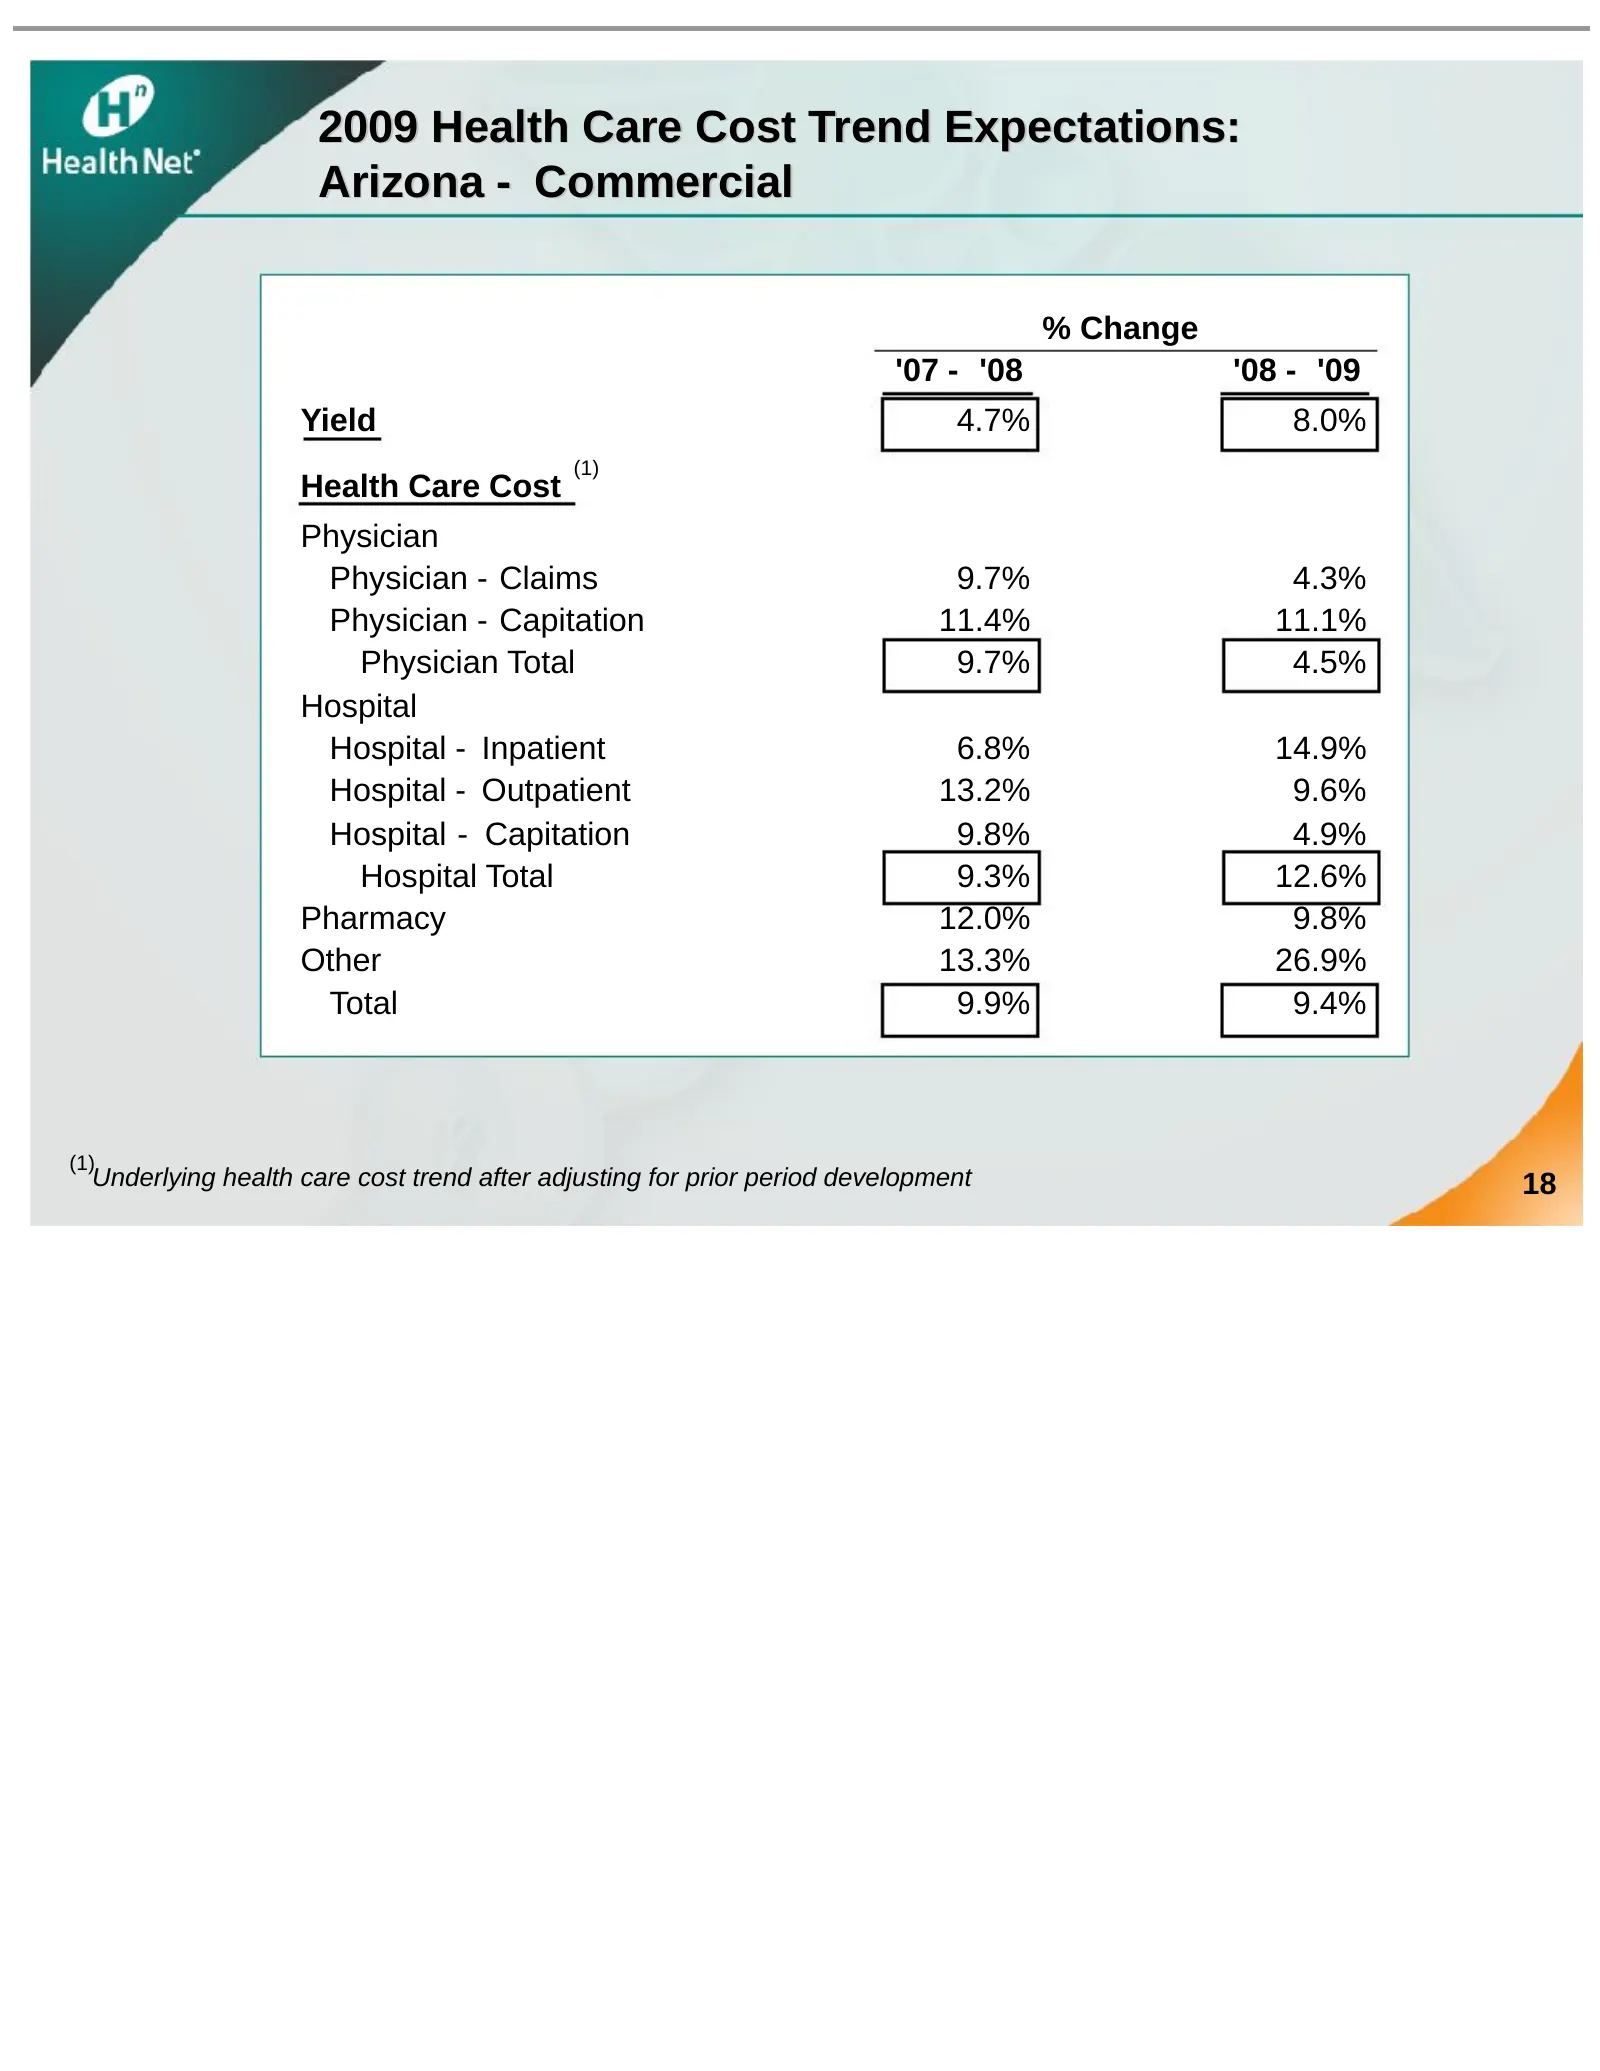
Slide 18: 2009 Health Care Cost Trend Expectations: Arizona - Commercial
2009 Health Care Cost Trend Expectations: Arizona - Commercial % Change '07 - '08 '08 - '09 Yield 4.7% 8.0% (1) Health Care Cost Physician Physician - Claims 9.7% 4.3% Physician - Capitation 11.4% 11.1% Physician Total 9.7% 4.5% Hospital Hospital - Inpatient 6.8% 14.9% Hospital - Outpatient 13.2% 9.
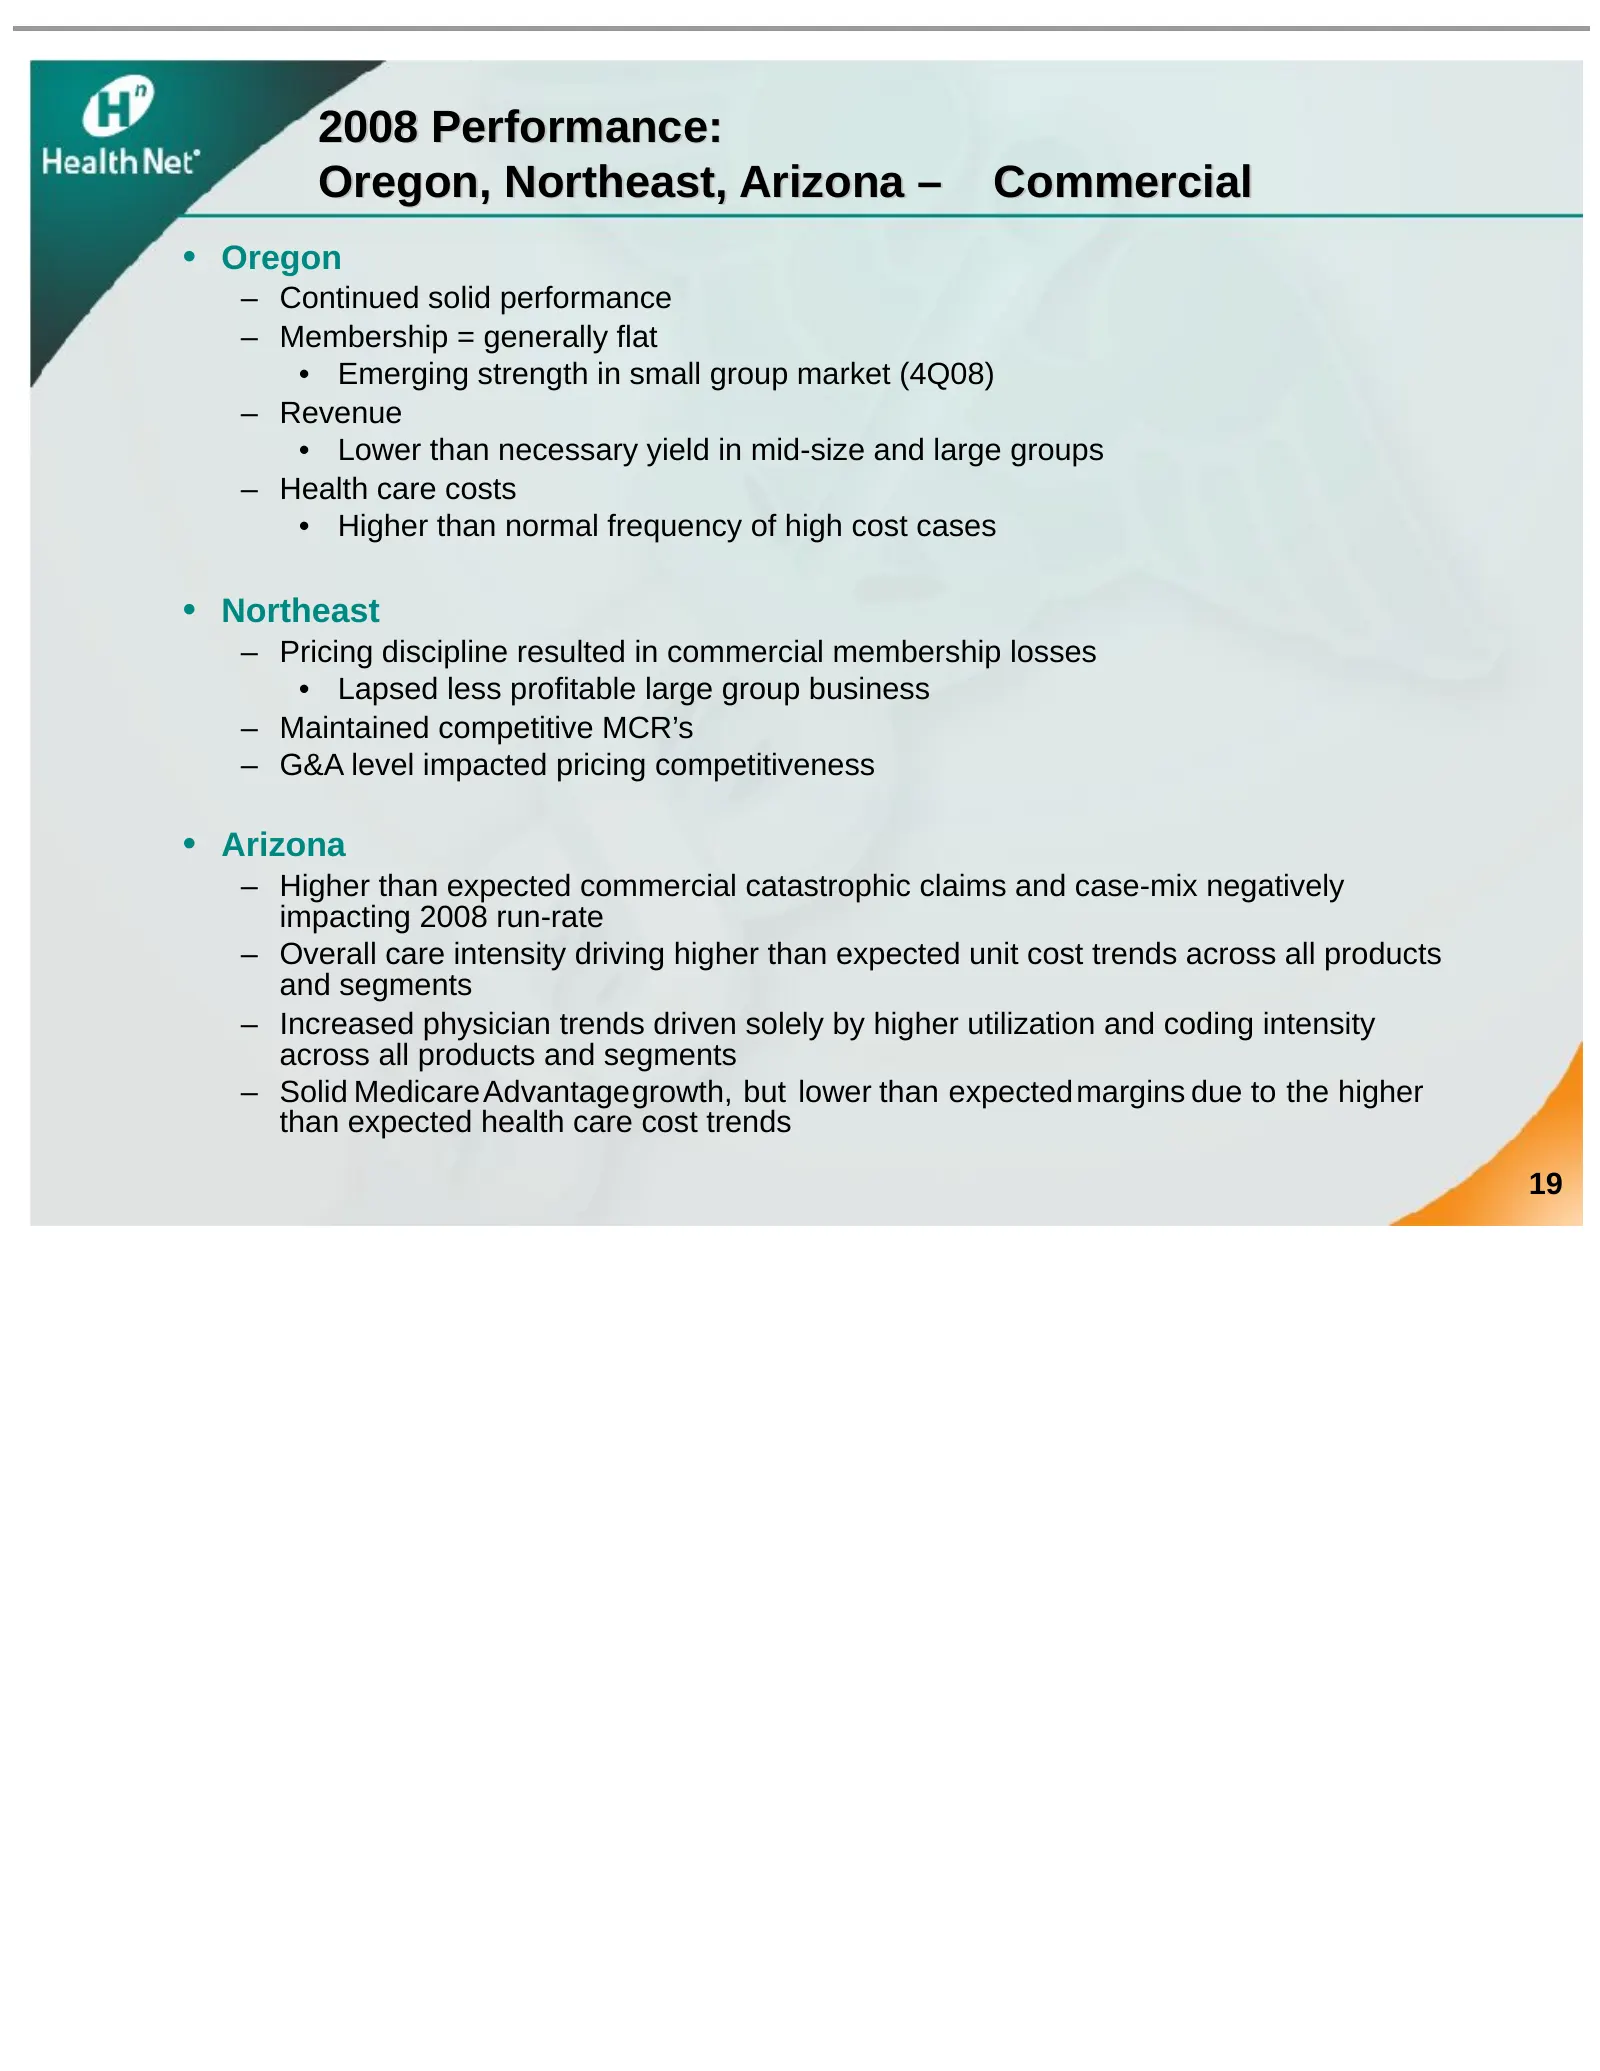
Slide 19: 2008 Performance: Oregon, Northeast, Arizona – Commercial
2008 Performance: Oregon, Northeast, Arizona – Commercial • Oregon – Continued solid performance – Membership = generally flat • Emerging strength in small group market (4Q08) – Revenue • Lower than necessary yield in mid-size and large groups – Health care costs • Higher than normal frequency of hi
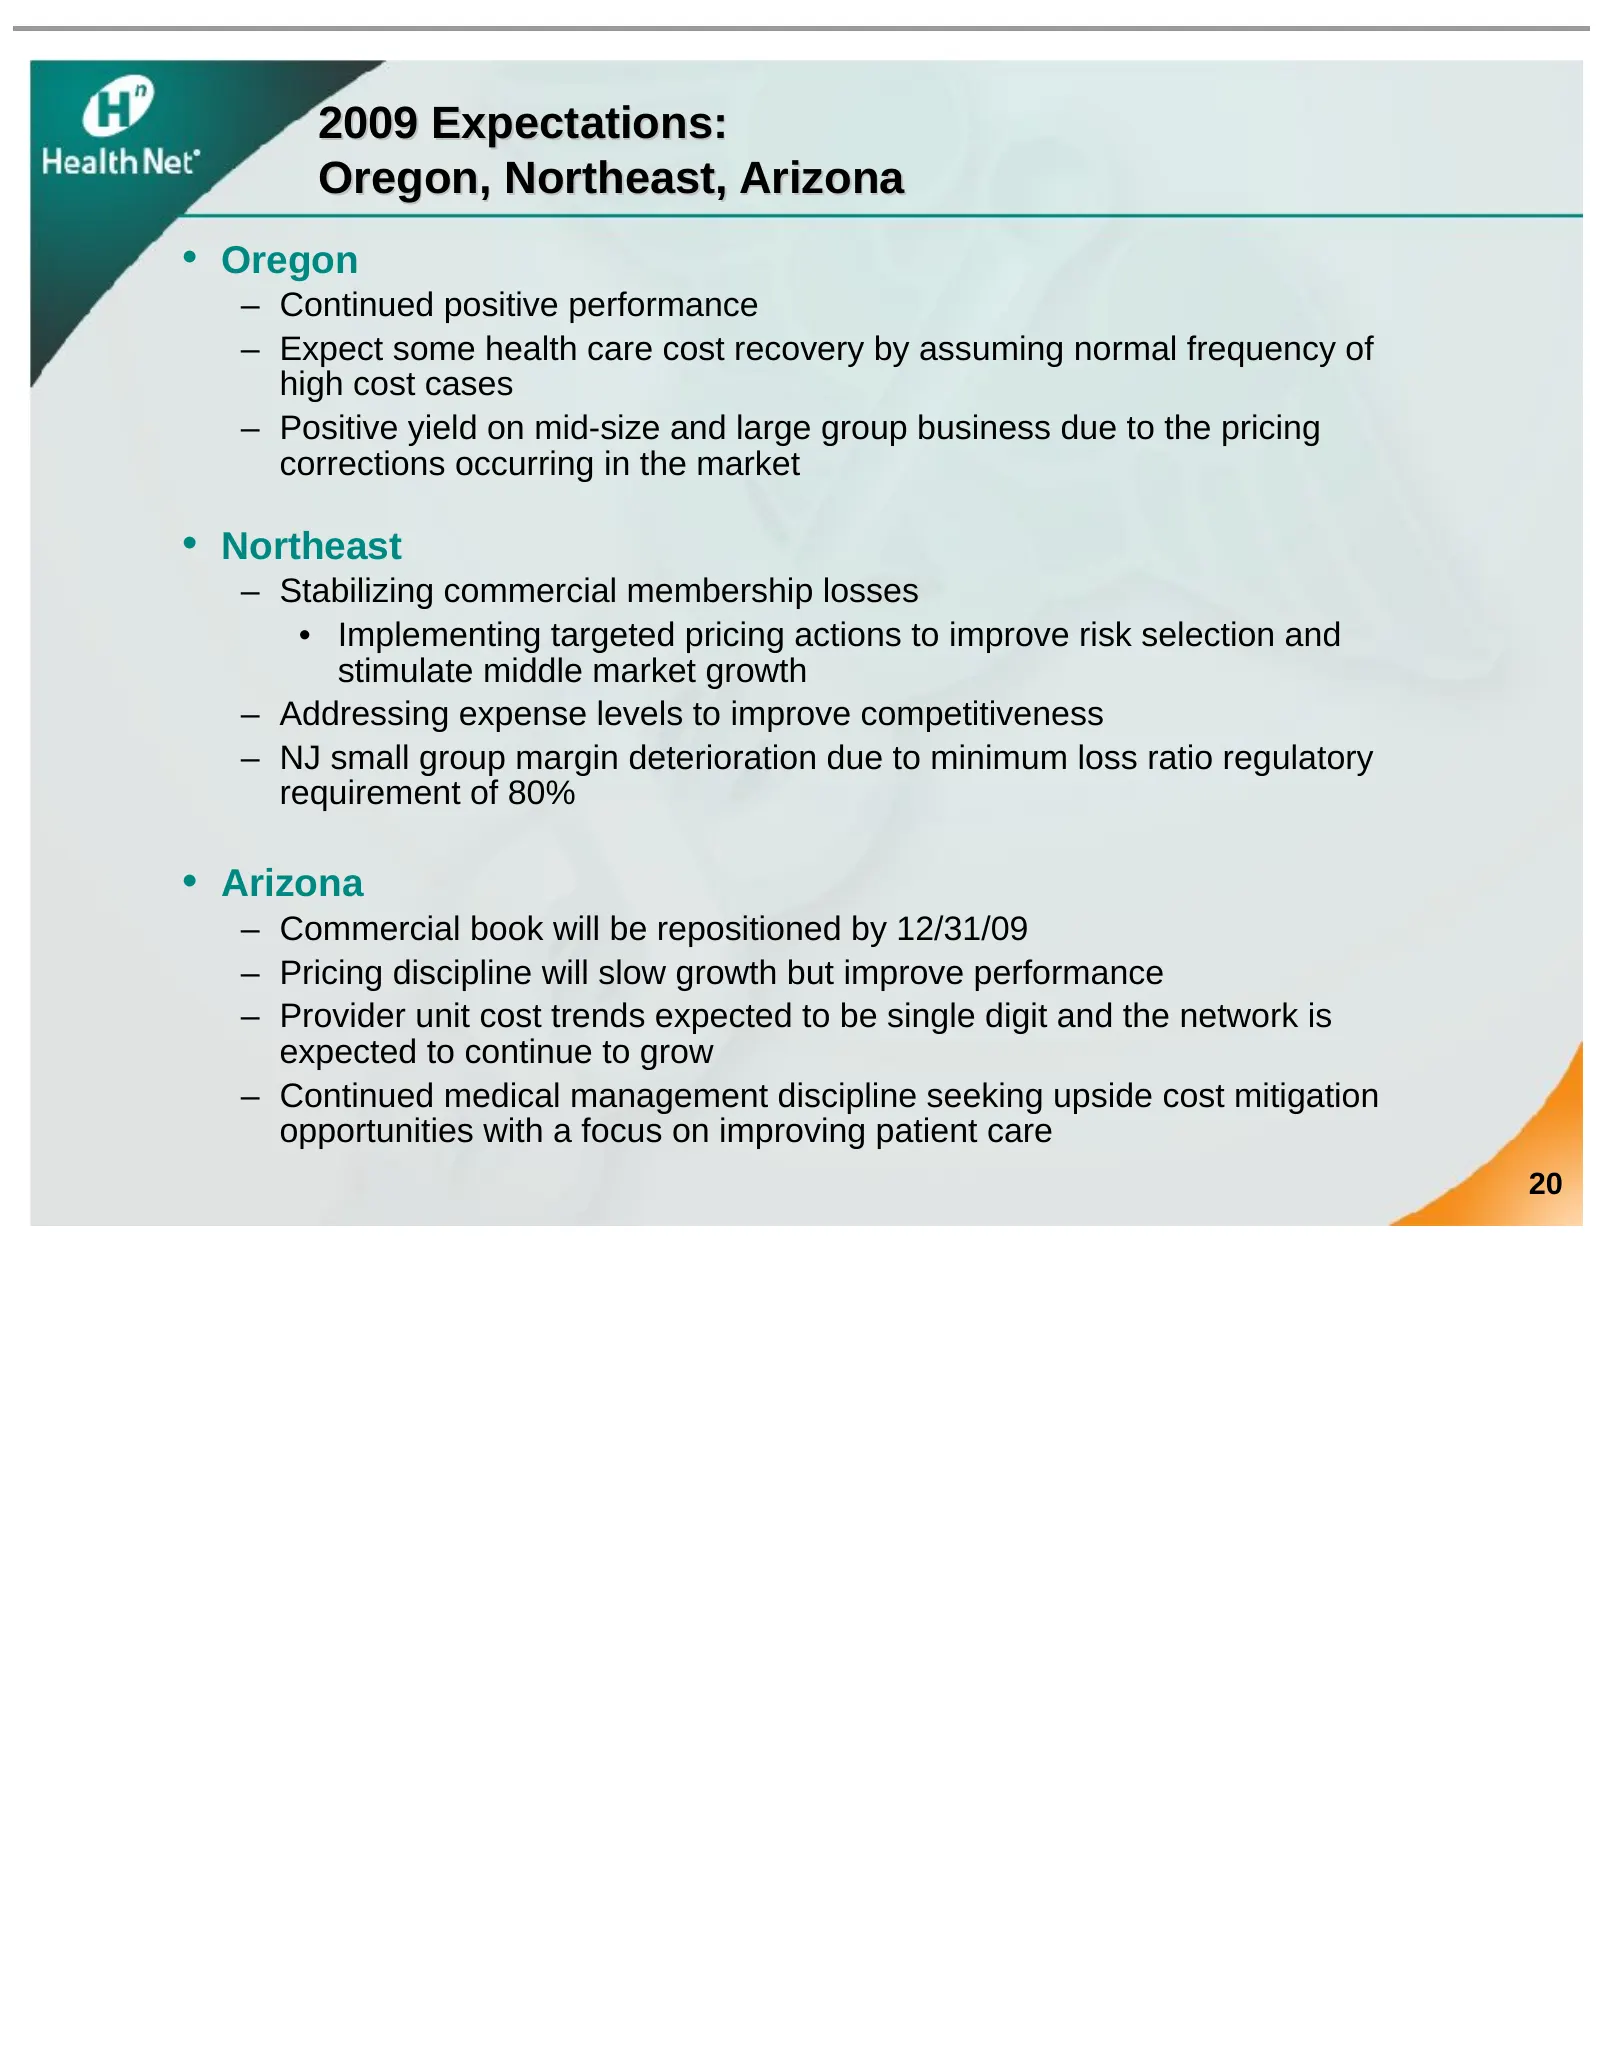
Slide 20: 2009 Expectations: Oregon, Northeast, Arizona
2009 Expectations: Oregon, Northeast, Arizona • Oregon – Continued positive performance – Expect some health care cost recovery by assuming normal frequency of high cost cases – Positive yield on mid-size and large group business due to the pricing corrections occurring in the market • Northeast – S
Slide 21: Medicare
Medicare tH Health Net"
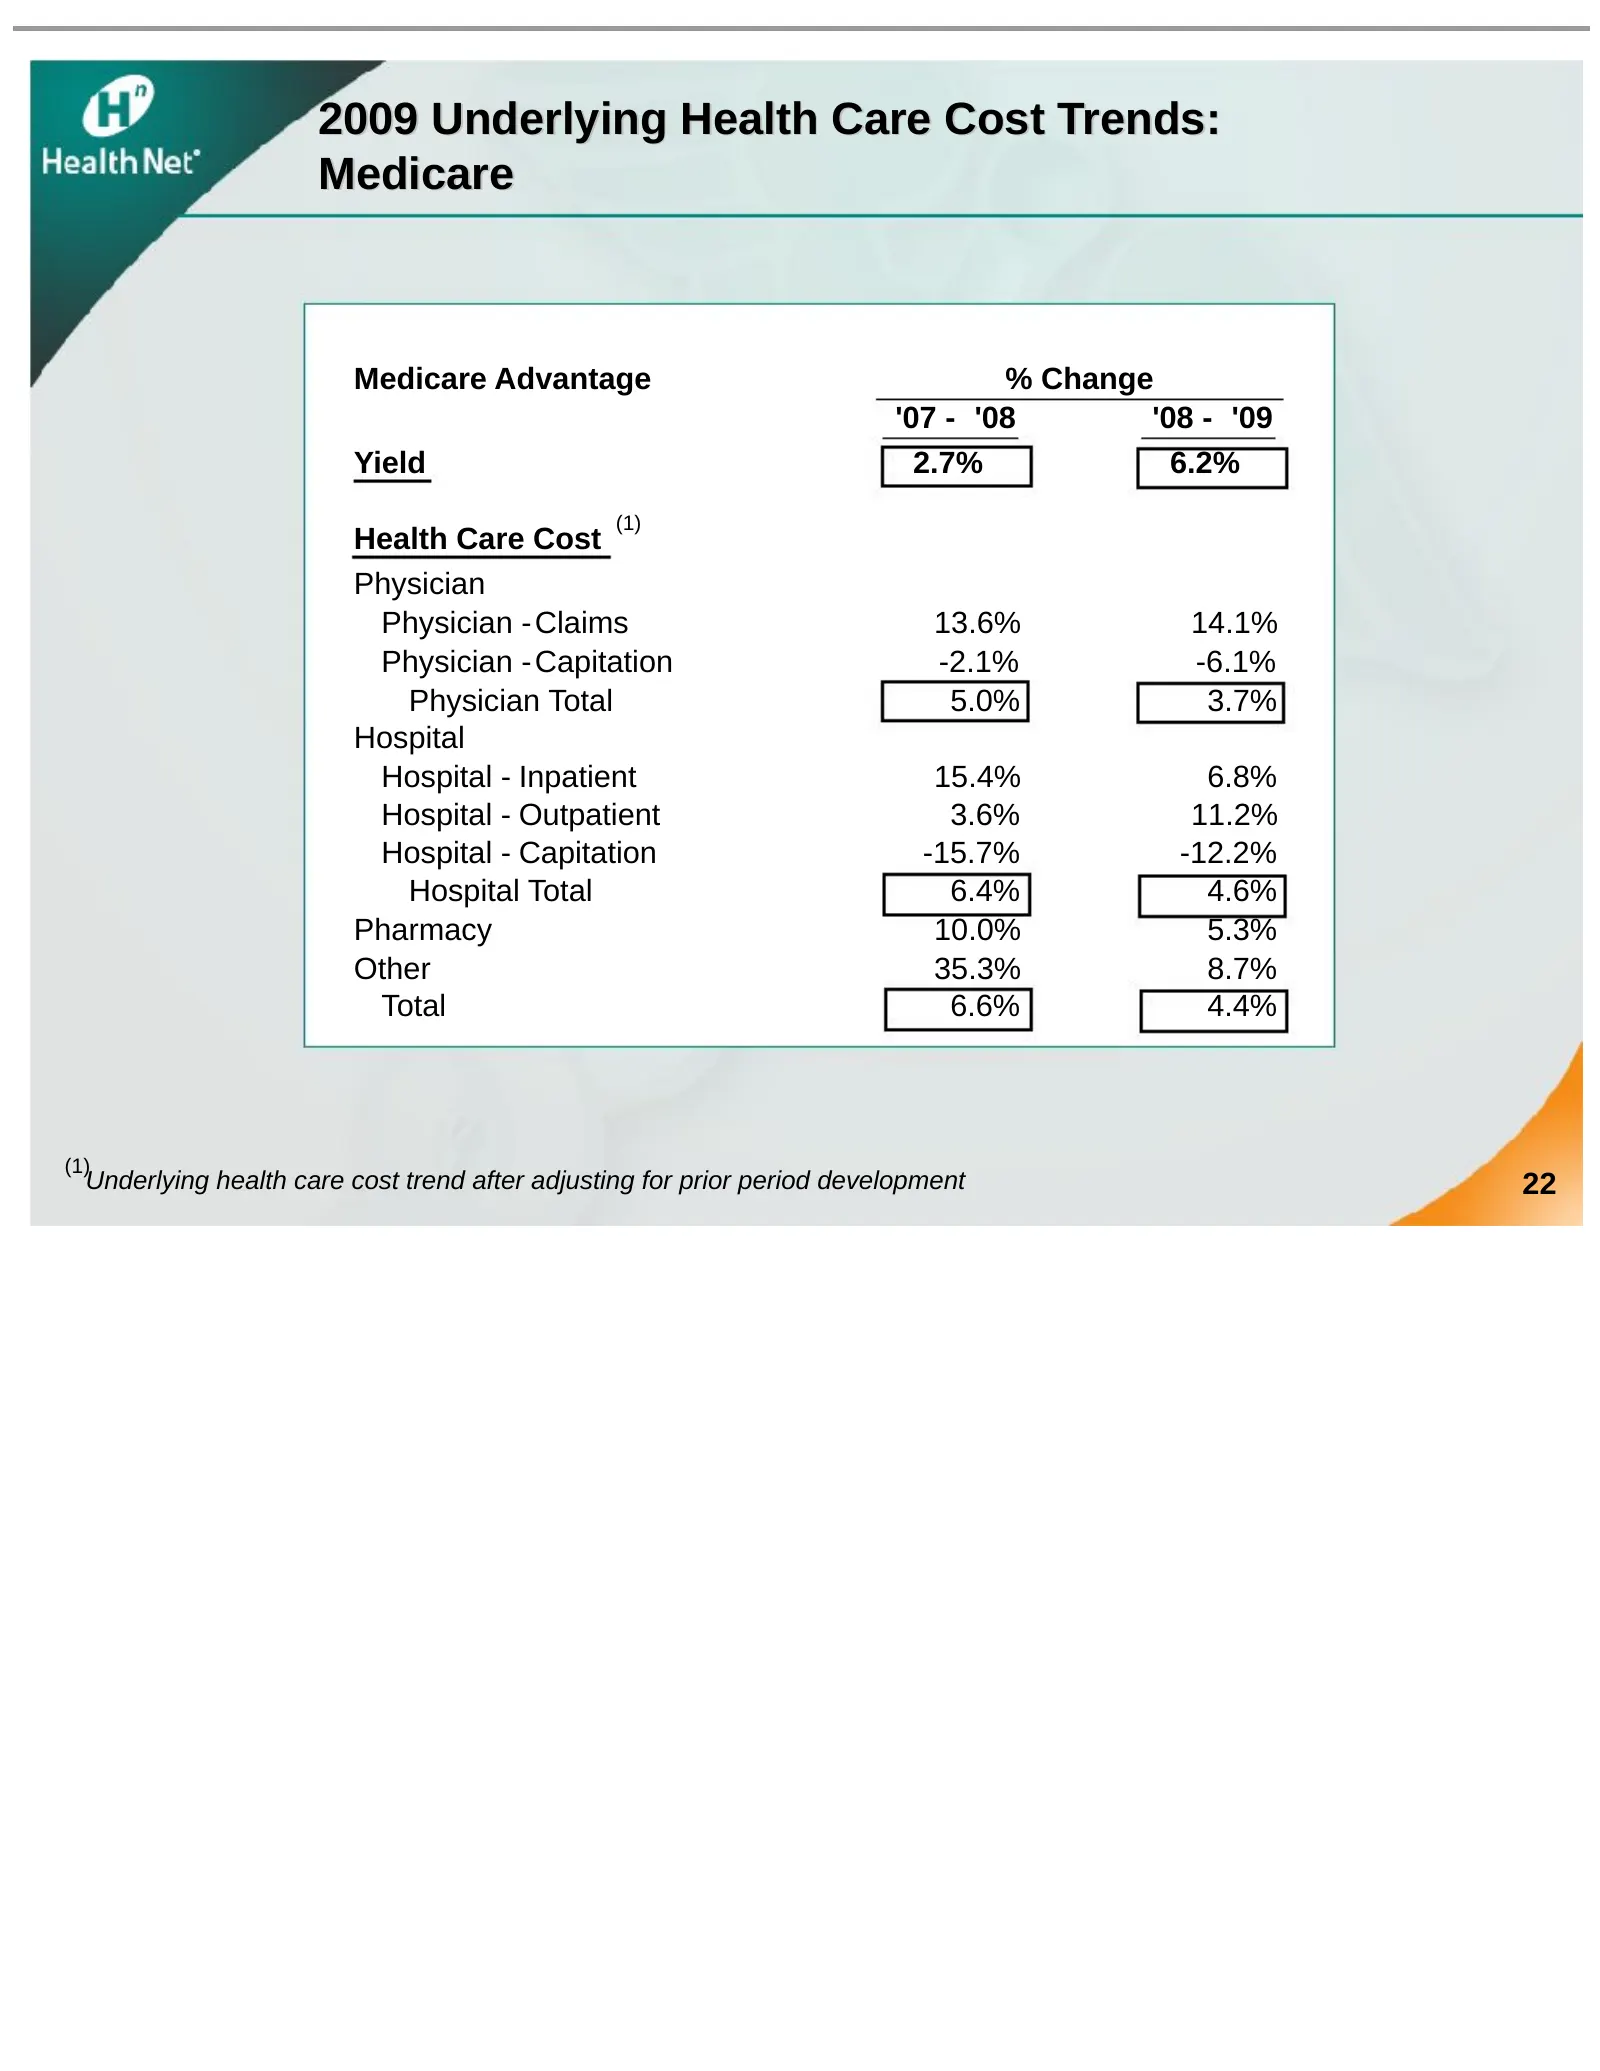
Slide 22: 2009 Underlying Health Care Cost Trends: Medicare
2009 Underlying Health Care Cost Trends: Medicare Medicare Advantage % Change '07 - '08 '08 - '09 Yield 2.7% 6.2% (1) Health Care Cost Physician Physician - Claims 13.6% 14.1% Physician - Capitation -2.1% -6.1% Physician Total 5.0% 3.7% Hospital Hospital - Inpatient 15.4% 6.8% Hospital - Outpatient
Slide 23: Medicare: What Happened in 2008?
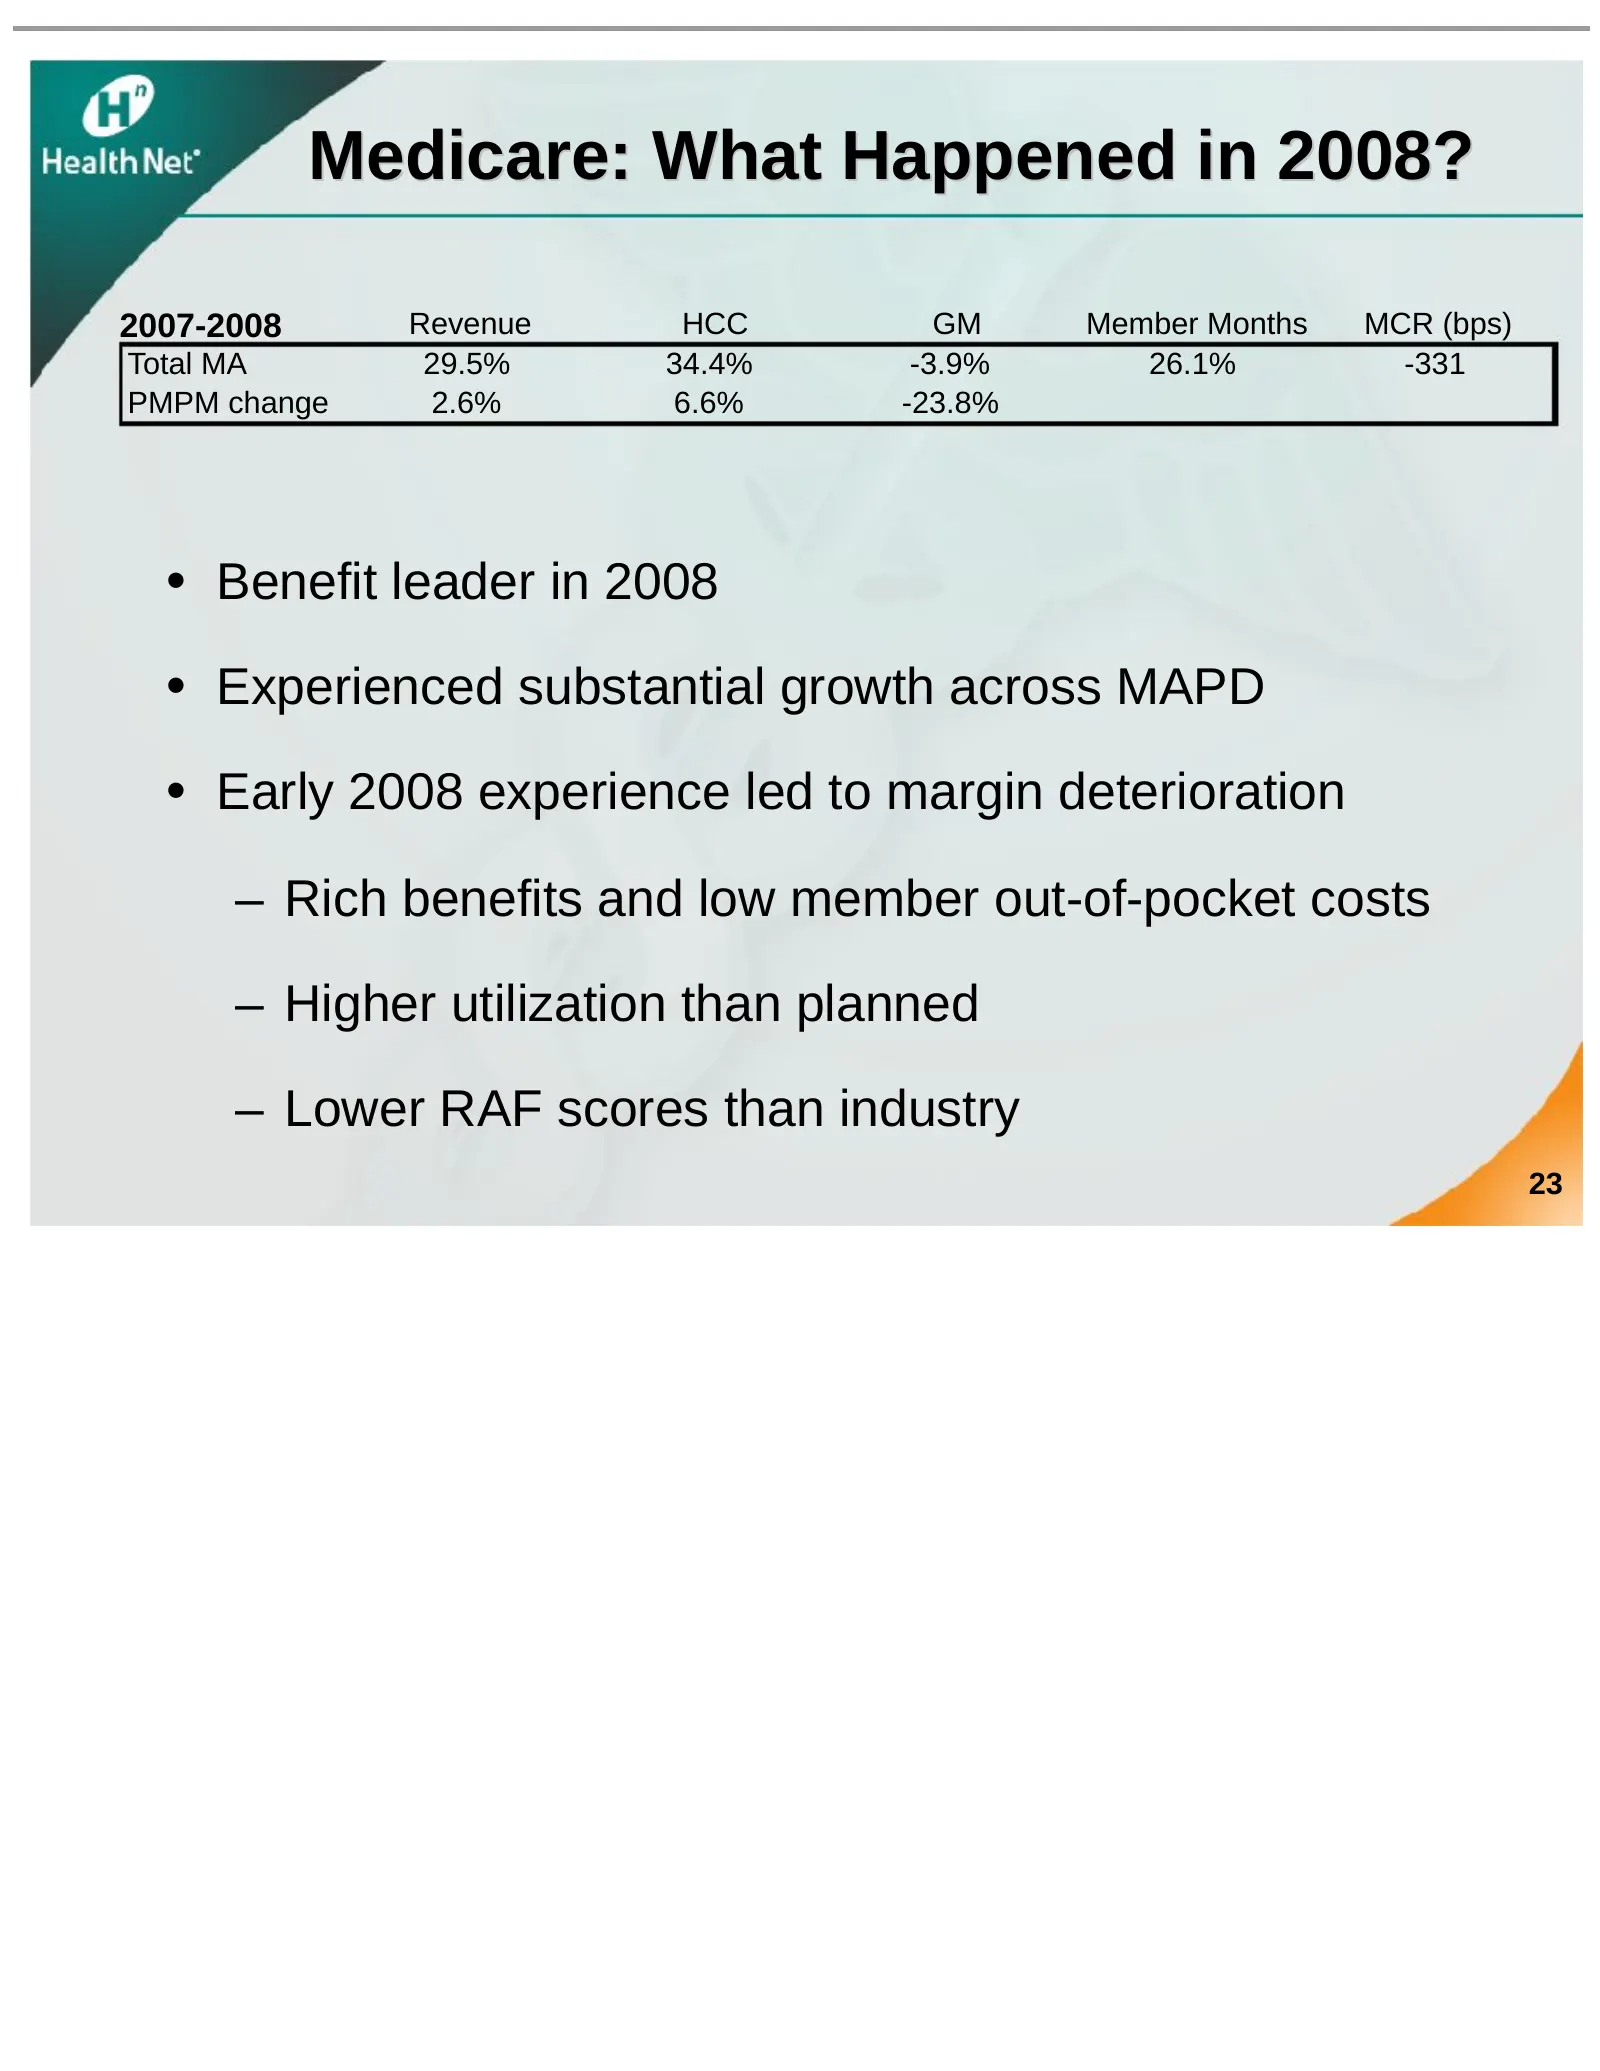
Medicare: What Happened in 2008? 2007-2008 Revenue HCC GM Member Months MCR (bps) Total MA 29.5% 34.4% -3.9% 26.1% -331 PMPM change 2.6% 6.6% -23.8% • Benefit leader in 2008 • Experienced substantial growth across MAPD • Early 2008 experience led to margin deterioration – Rich benefits and low membe
Slide 24: 2009 Expectations: Medicare
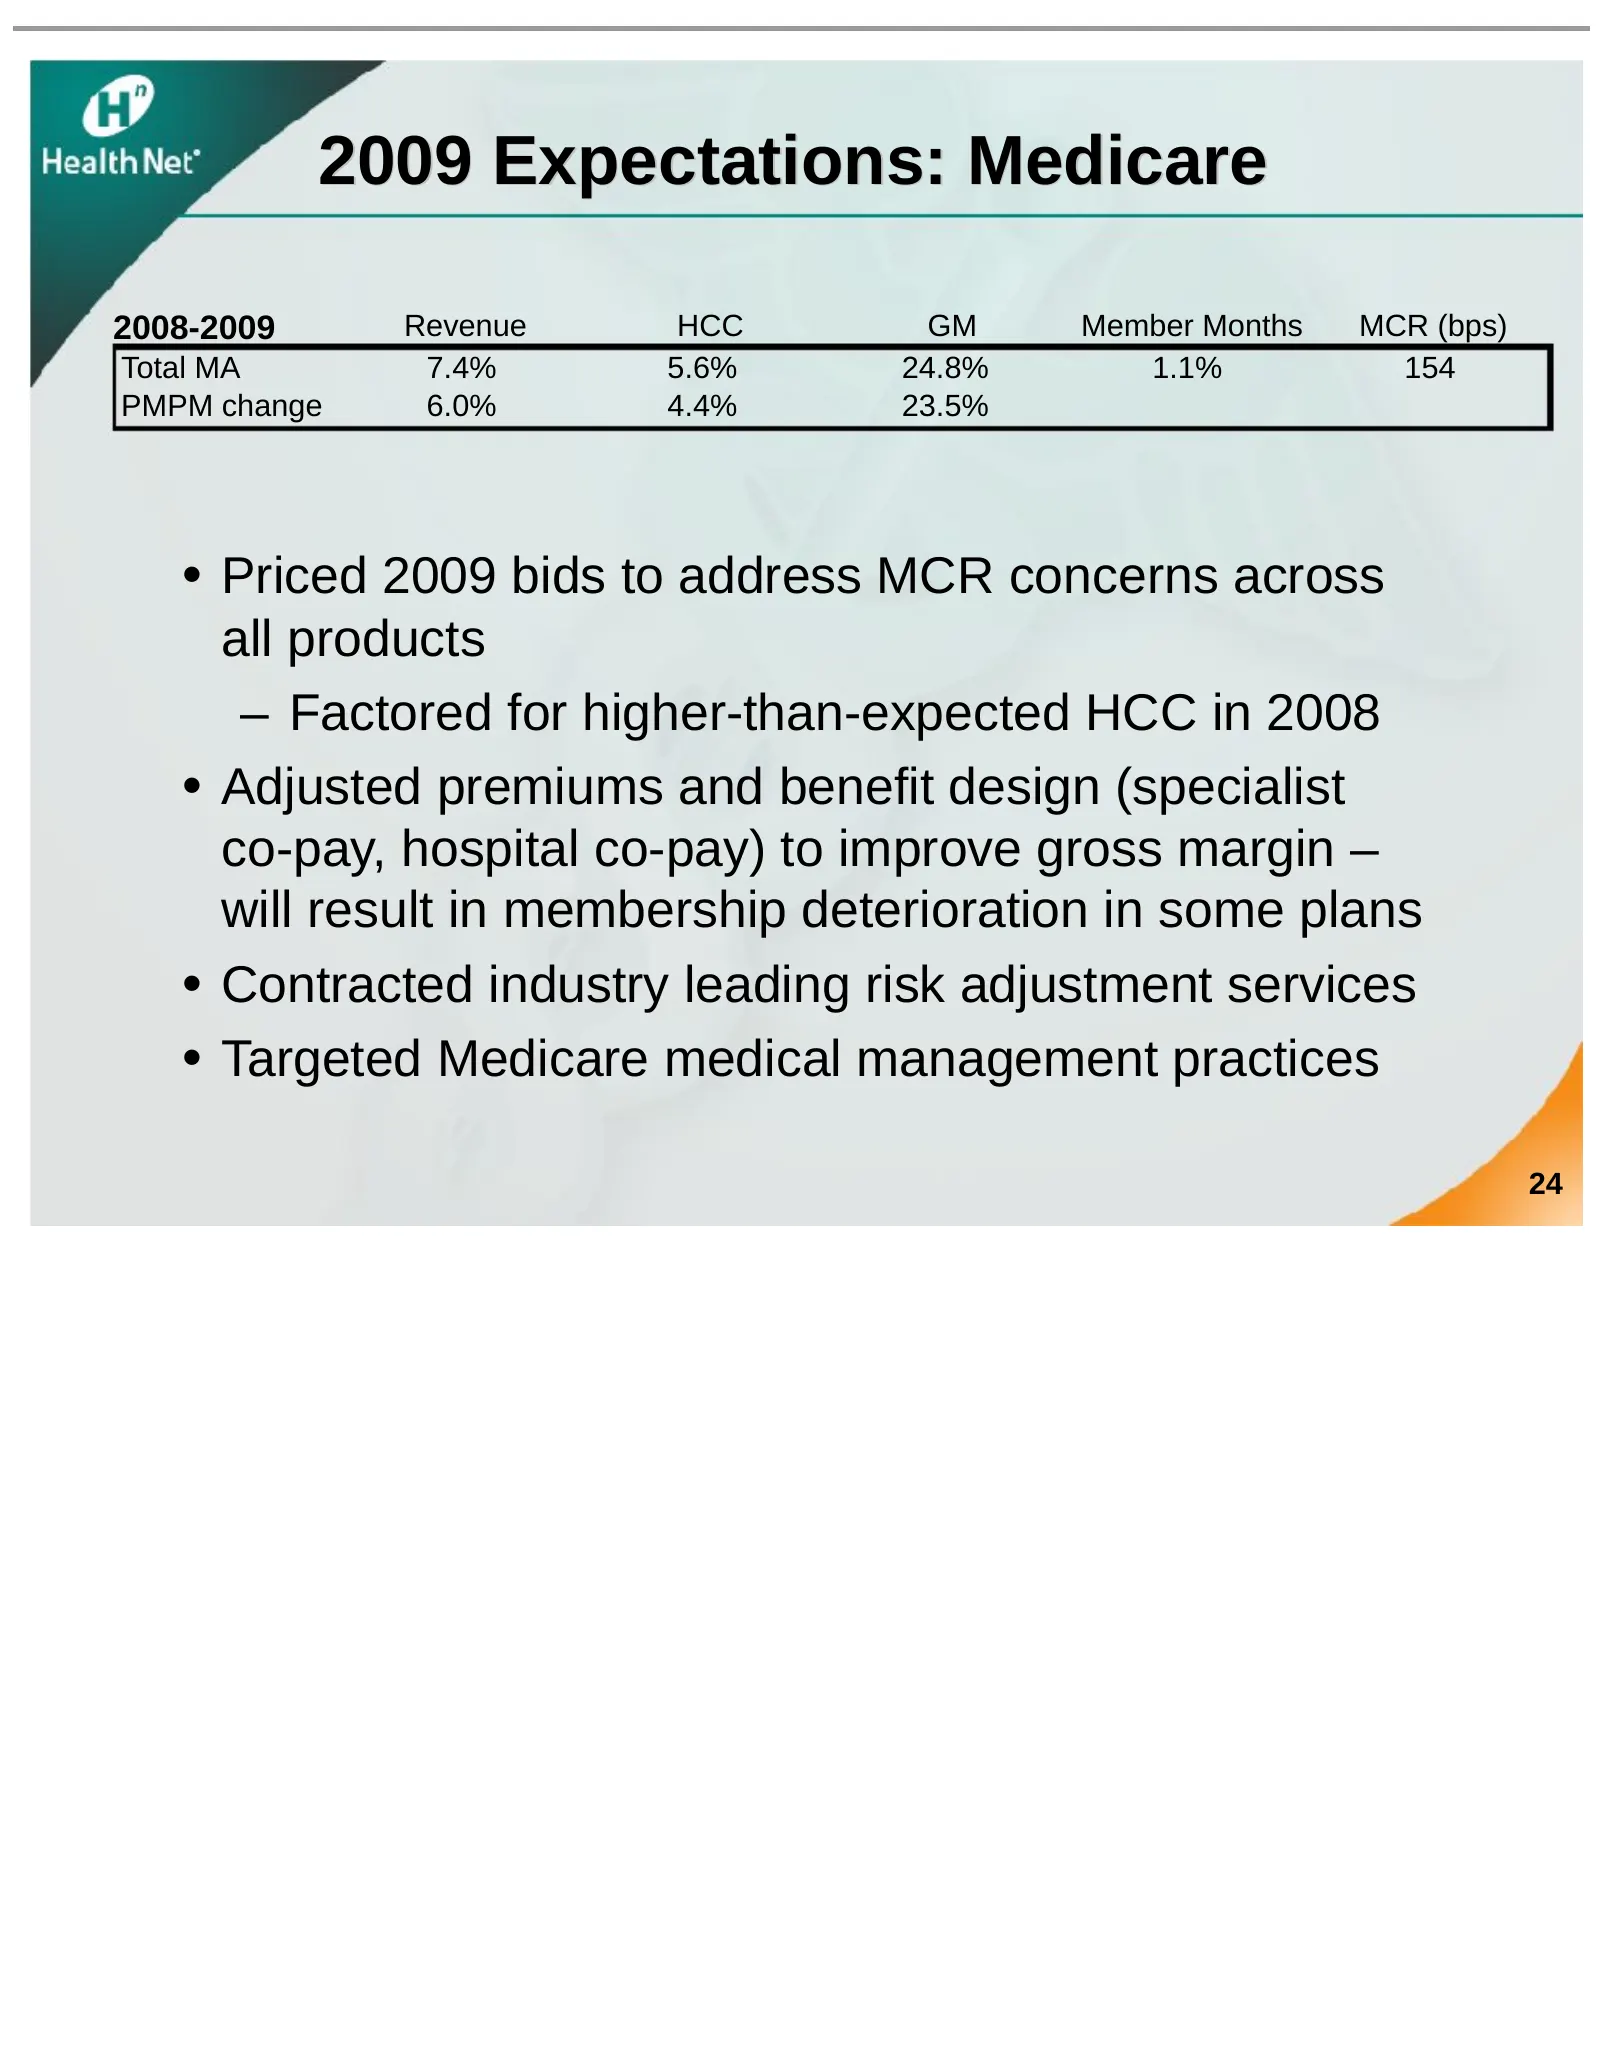
2009 Expectations: Medicare 2008-2009 Revenue HCC GM Member Months MCR (bps) Total MA 7.4% 5.6% 24.8% 1.1% 154 PMPM change 6.0% 4.4% 23.5% • Priced 2009 bids to address MCR concerns across all products – Factored for higher-than-expected HCC in 2008 • Adjusted premiums and benefit design (specialist

Slide 25: Health Net, Inc. Investor Conference
Health Net, Inc. Investor Conference
Source: SEC EDGAR · 8-K/A filed Nov 21, 2008
More decks from Health Net Inc
 Q2 2015 Earnings Presentation25 slides · Sep 23, 2015
 SPAC Merger (July 2015)18 slides · Jul 15, 2015
 SPAC Merger (July 2015)18 slides · Jul 14, 2015
 Merger or Acquisition (July 2015)13 slides · Jul 2, 2015
 Investor Day (February 2012)74 slides · Feb 16, 2012
 30th Annual J.P. Morgan Healthcare Conference (January 2012)13 slides · Jan 9, 2012