BSP · RUS:BSPB
BSP — Bank Saint Petersburg — Q2 2025 Earnings Presentation
20 slides from BSP's earnings presentation, Aug 22, 2025
Slide 1: 2Q 2025 IFRS Financial Results
2Q 2025 IFRS FINANCIAL RESULTS August 22, 2025
Slide 2: Disclaimer
DISCLAIMER This presentation contains forward-looking statements regarding future events and financial performance of PJSC “Bank Saint Petersburg" (hereinafter - the “Bank"). Such forward-looking statements are based on the current expectations and assumptions of the Bank's management, are made in g
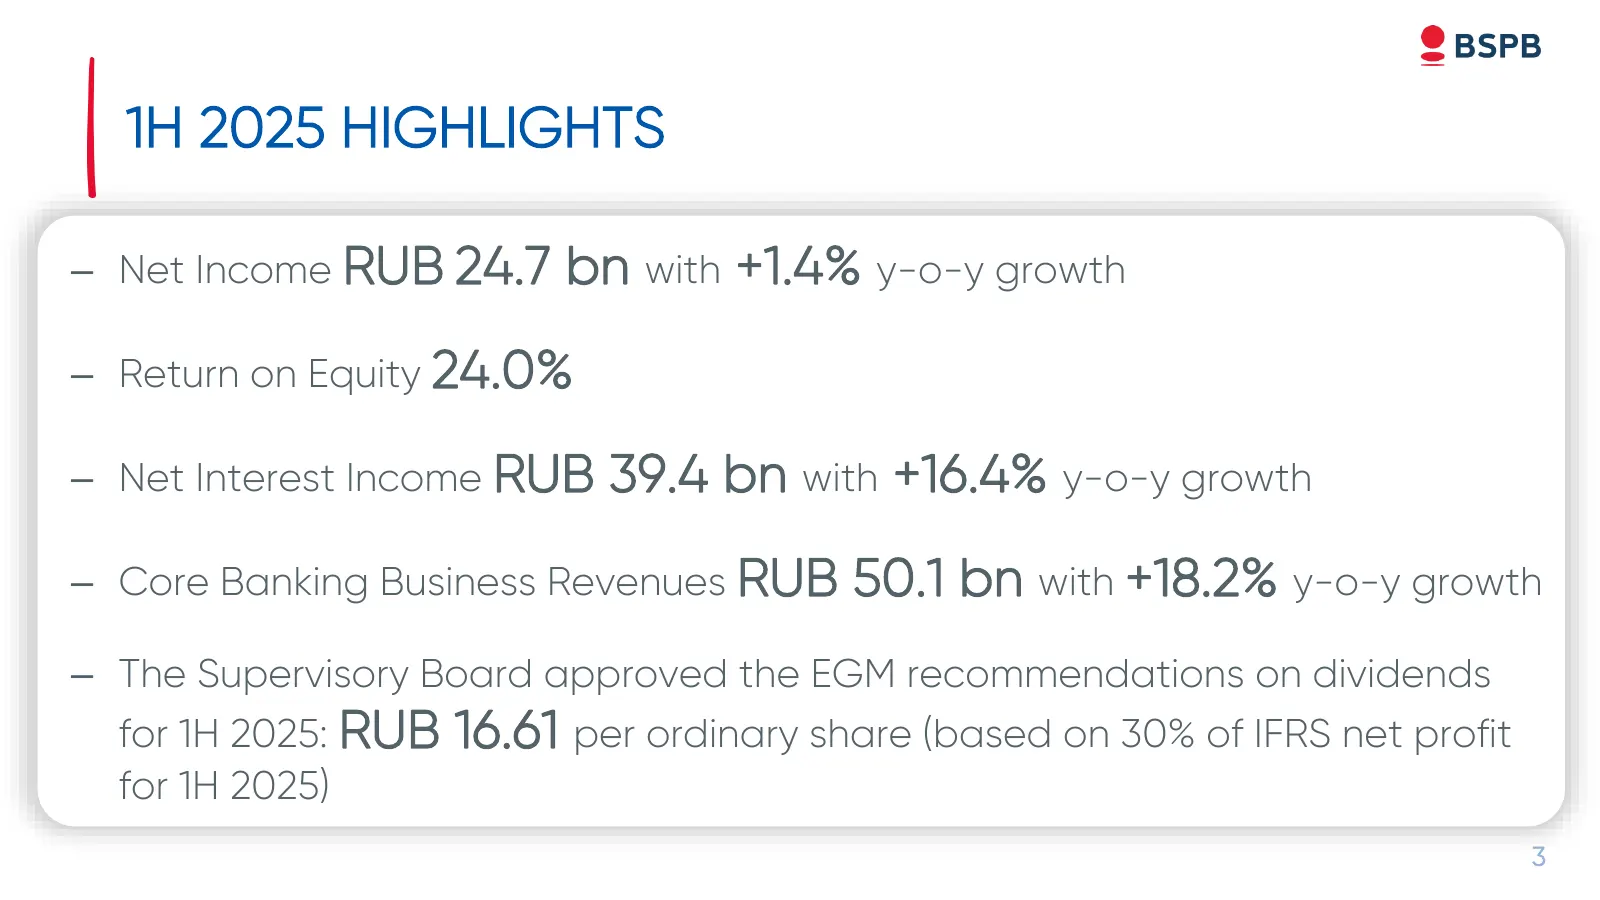
Slide 3: 1H 2025 Highlights
1H 2025 HIGHLIGHTS – Net Income RUB 24.7 bn with +1.4% y-o-y growth – Return on Equity 24.0% – Net Interest Income RUB 39.4 bn with +16.4% y-o-y growth – Core Banking Business Revenues RUB 50.1 bn with +18.2% y-o-y growth – The Supervisory Board approved the EGM recommendations on dividends for 1H 2
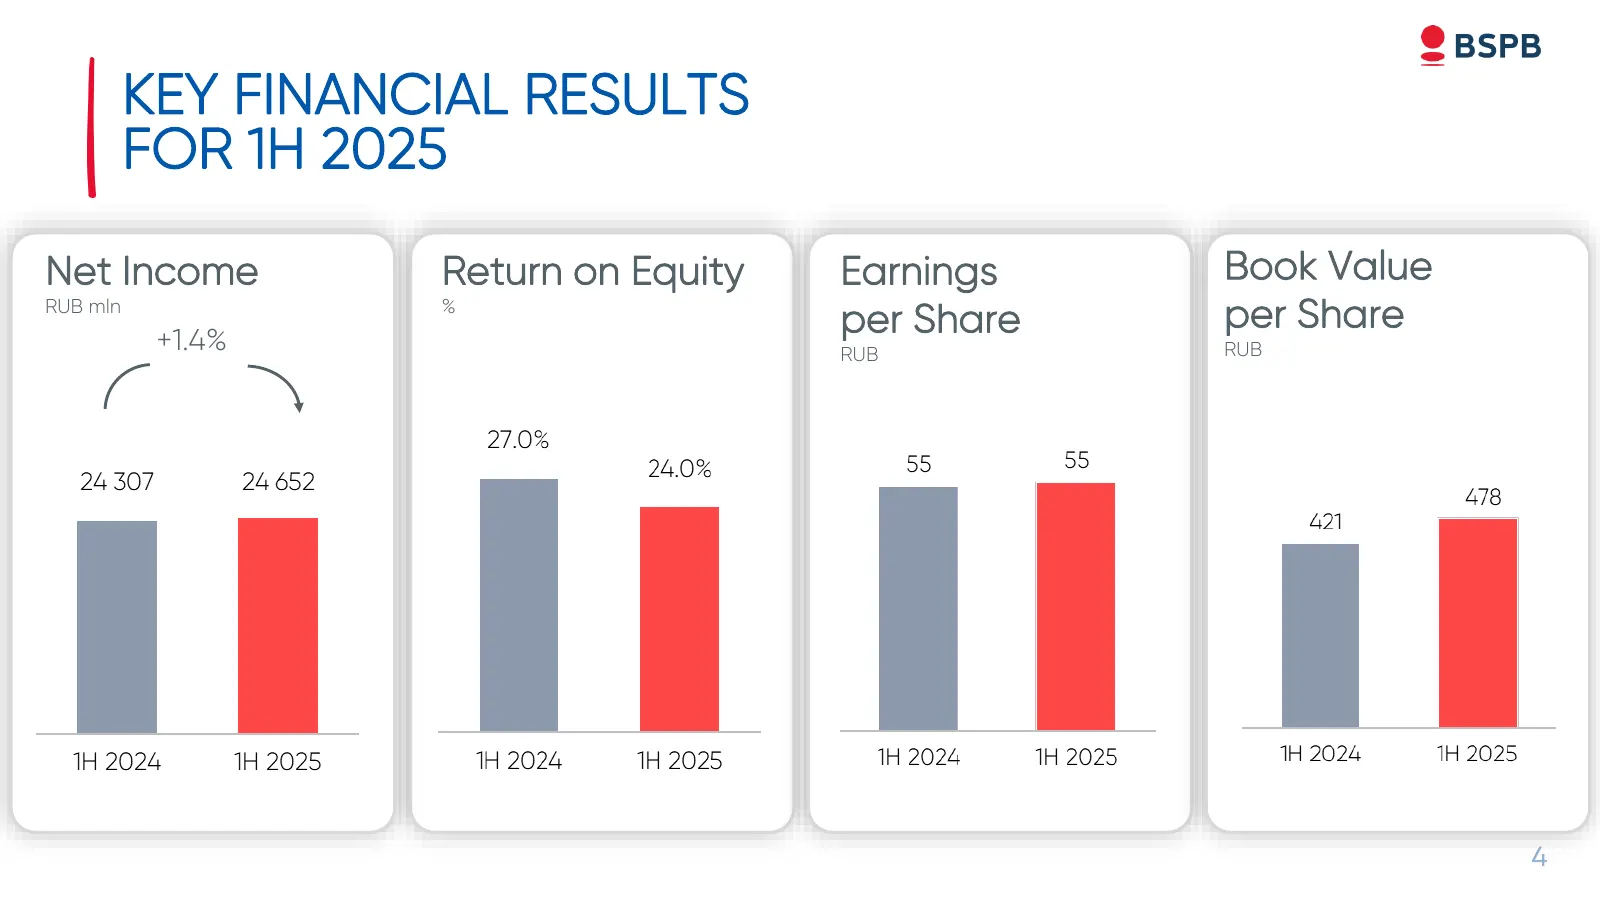
Slide 4: Key Financial Results for 1H 2025
KEY FINANCIAL RESULTS FOR 1H 2025 Net Income Return on Equity Earnings Book Value RUB mln % per Share per Share +1.4% RUB RUB 4
Slide 5: Key Financial Results for 2Q 2025
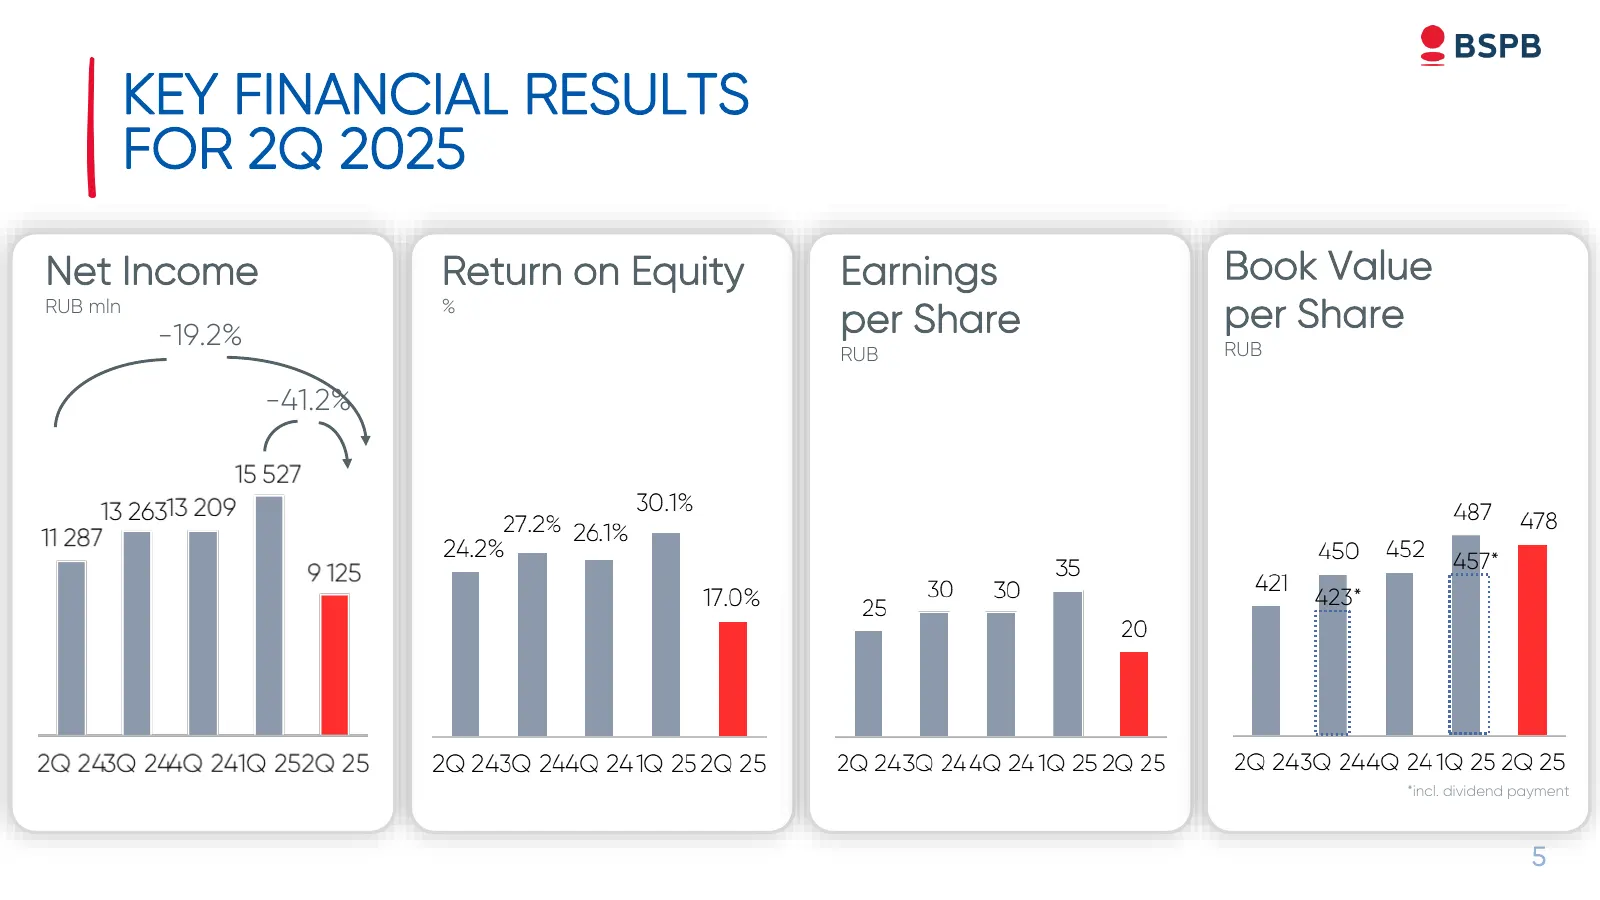
KEY FINANCIAL RESULTS FOR 2Q 2025 Net Income Return on Equity Earnings Book Value RUB mln -19.2% % per Share per Share RUB RUB -41.2% 457* 423* *incl. dividend payment 5
Slide 6: Financial Results for 1H 2025
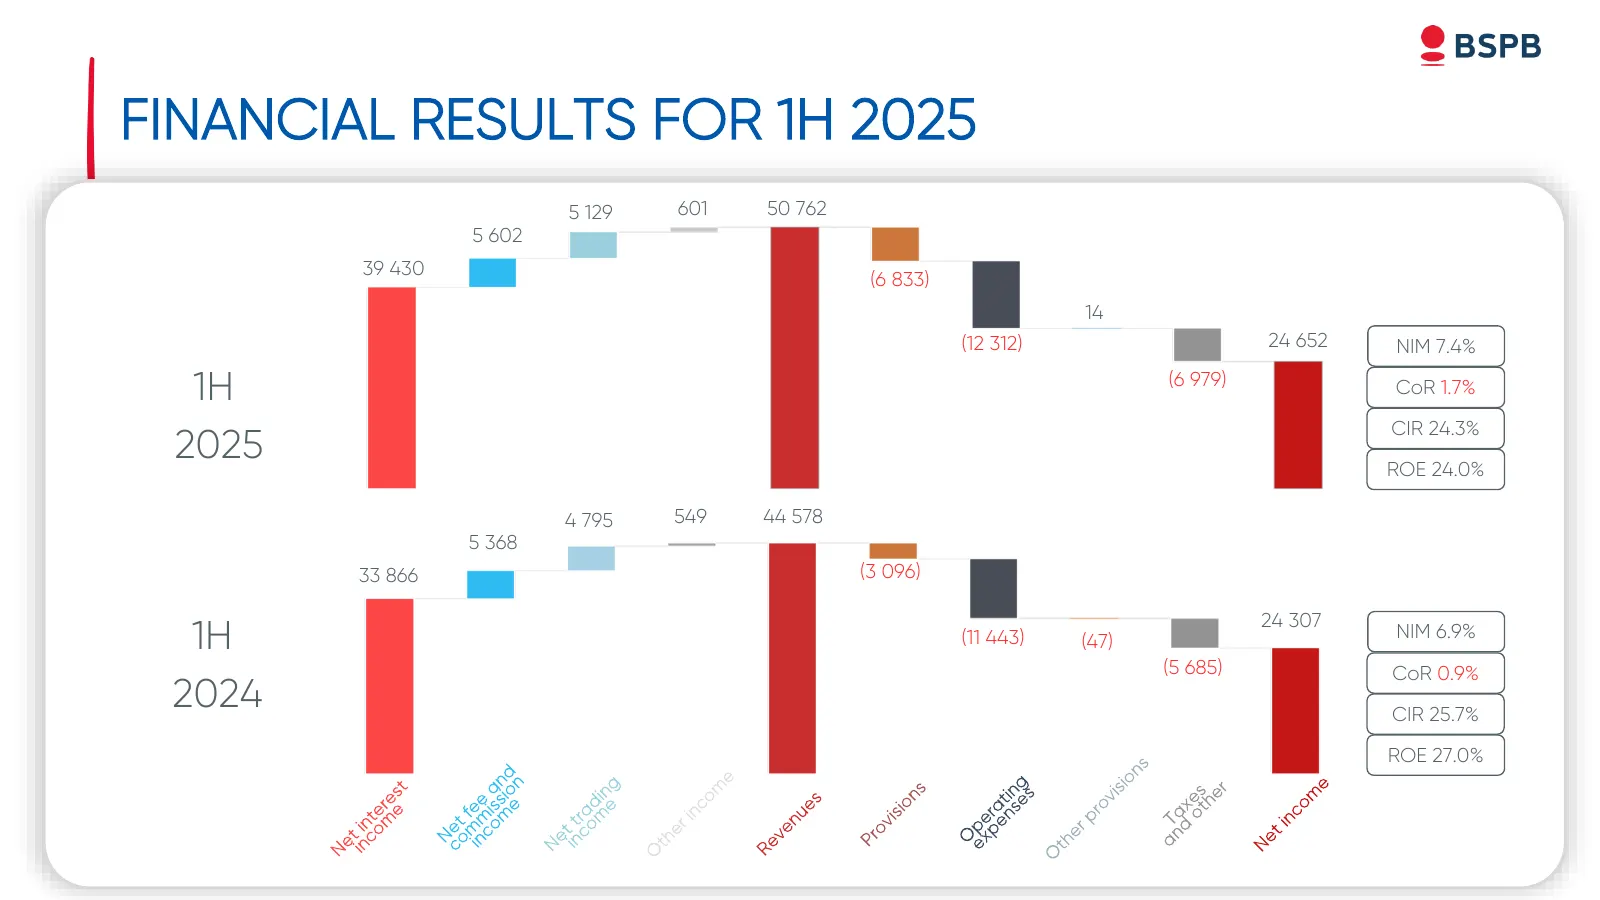
FINANCIAL RESULTS FOR 1H 2025 5 129 601 50 762 5 602 39 430 (6 833) 14 (12 312) 24 652 NIM 7.4% 1H (6 979) CoR 1.7% CIR 24.3% 2025 ROE 24.0% 4 795 549 44 578 5 368 33 866 (3 096) 24 307 1H (11 443) (47) NIM 6.9% (5 685) CoR 0.9% 2024 CIR 25.7% ROE 27.0% 6
Slide 7: Financial Results for 2Q 2025
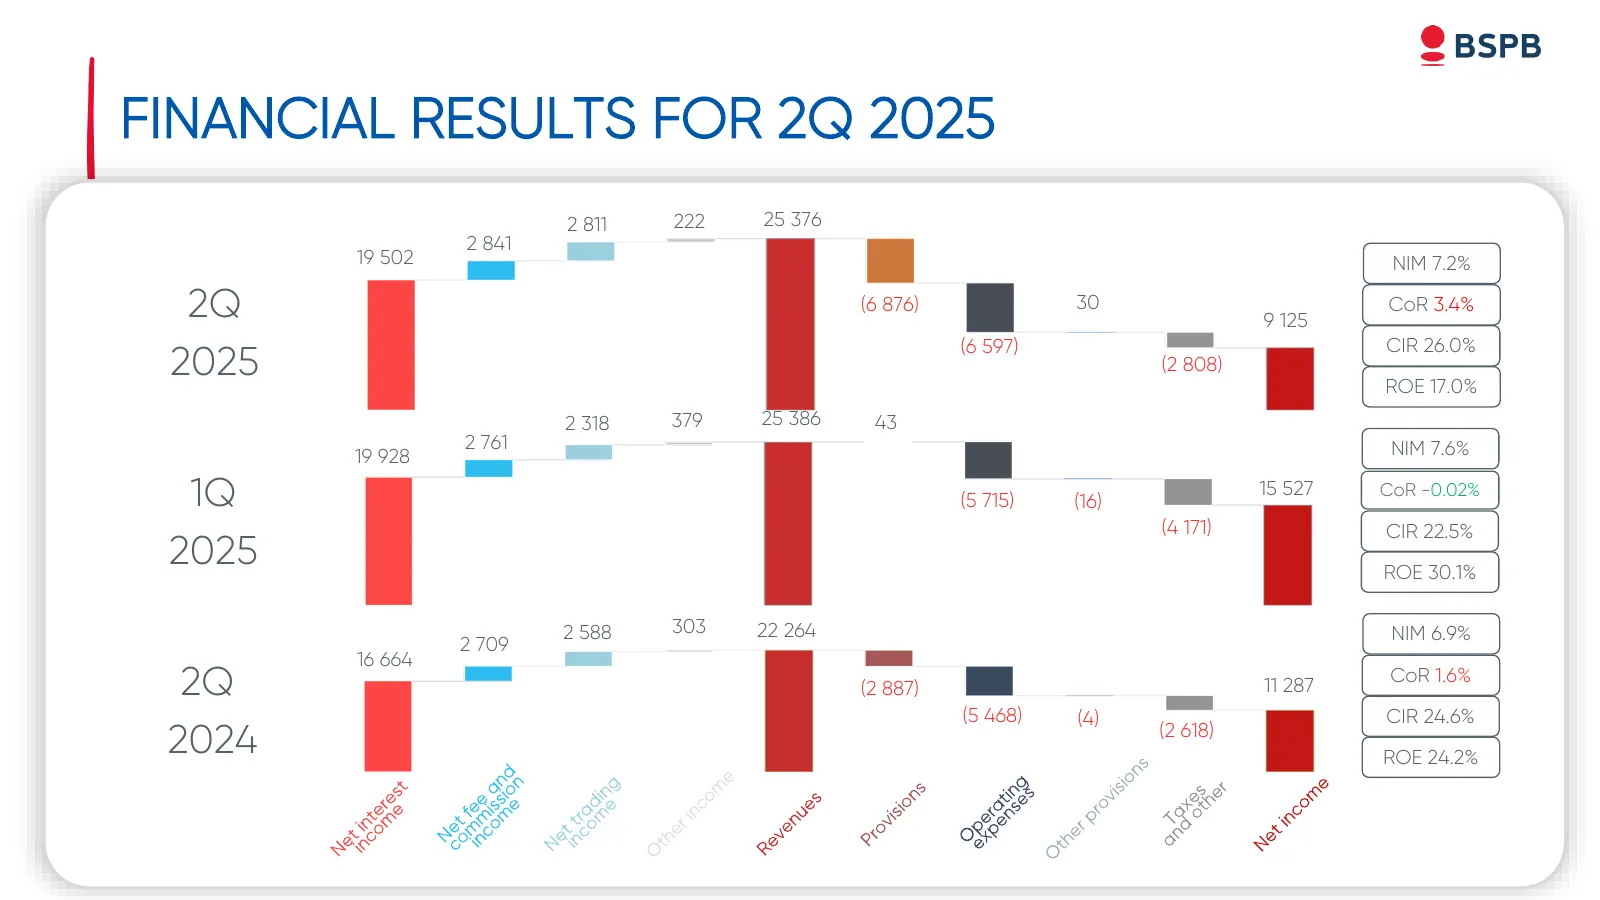
FINANCIAL RESULTS FOR 2Q 2025 2 811 222 25 376 2 841 19 502 NIM 7.2% 2Q (6 876) 30 9 125 CoR 3.4% (6 597) CIR 26.0% 2025 (2 808) ROE 17.0% 2 318 379 25 386 43 2 761 NIM 7.6% 19 928 1Q (5 715) (16) 15 527 CoR -0.02% (4 171) CIR 22.5% 2025 ROE 30.1% 2 588 303 22 264 NIM 6.9% 2 709 16 664 2Q (2 887) 11
Slide 8: Revenues Dynamics
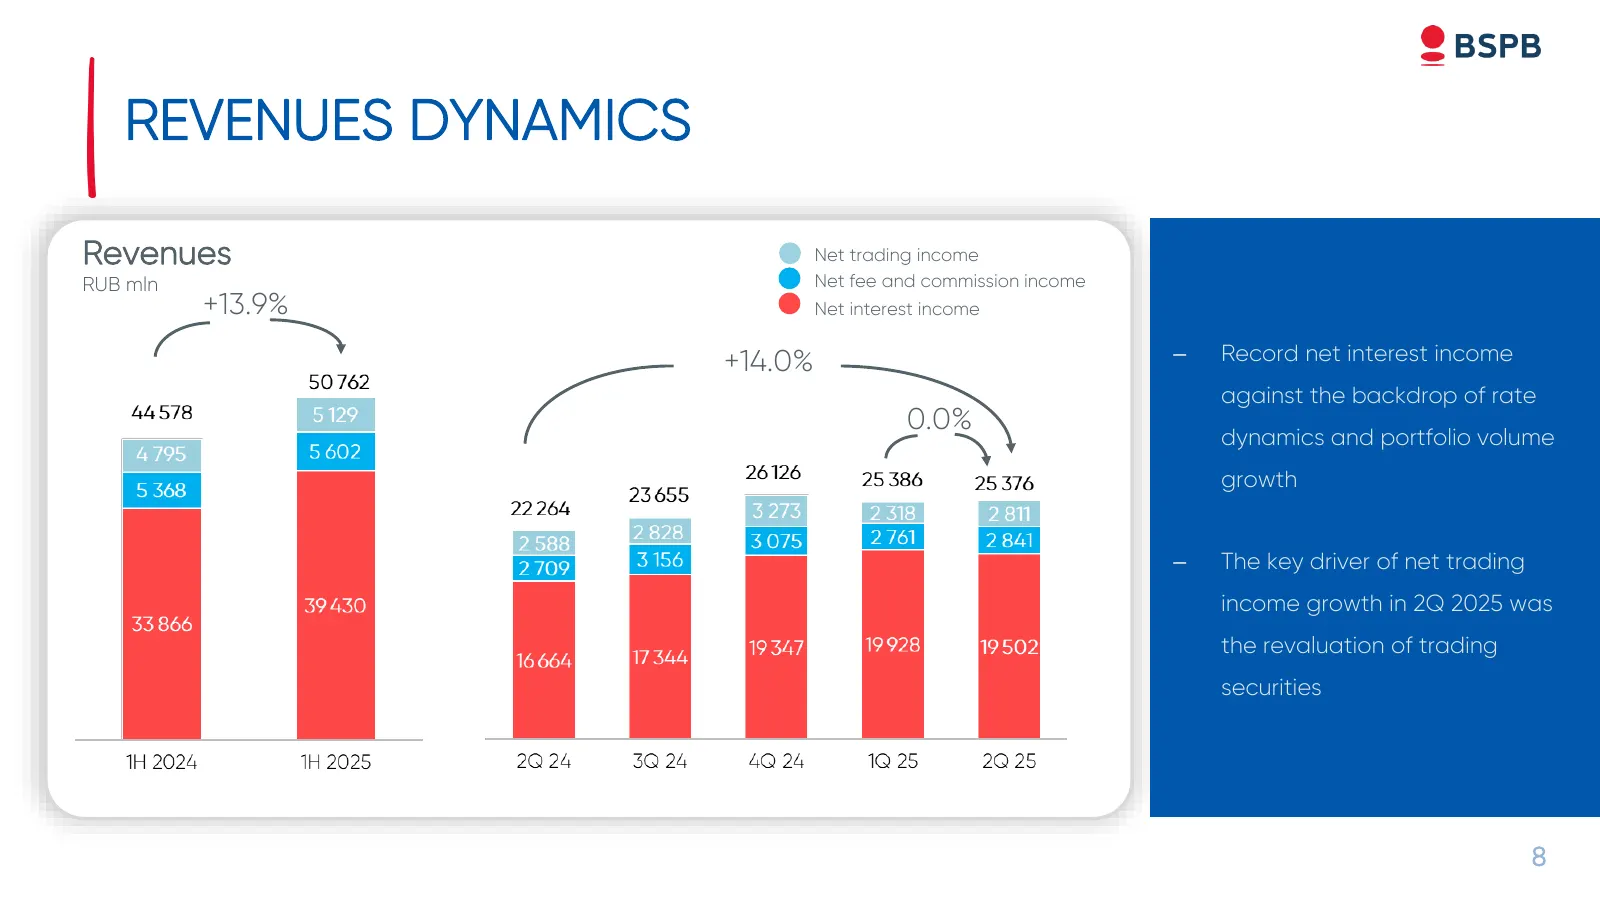
REVENUES DYNAMICS Revenues Net trading income RUB mln Net fee and commission income +13.9% Net interest income +14.0% – Record net interest income against the backdrop of rate 0.0% dynamics and portfolio volume growth – The key driver of net trading income growth in 2Q 2025 was the revaluation of tr
Slide 9: Core Banking Business Revenues Dynamics
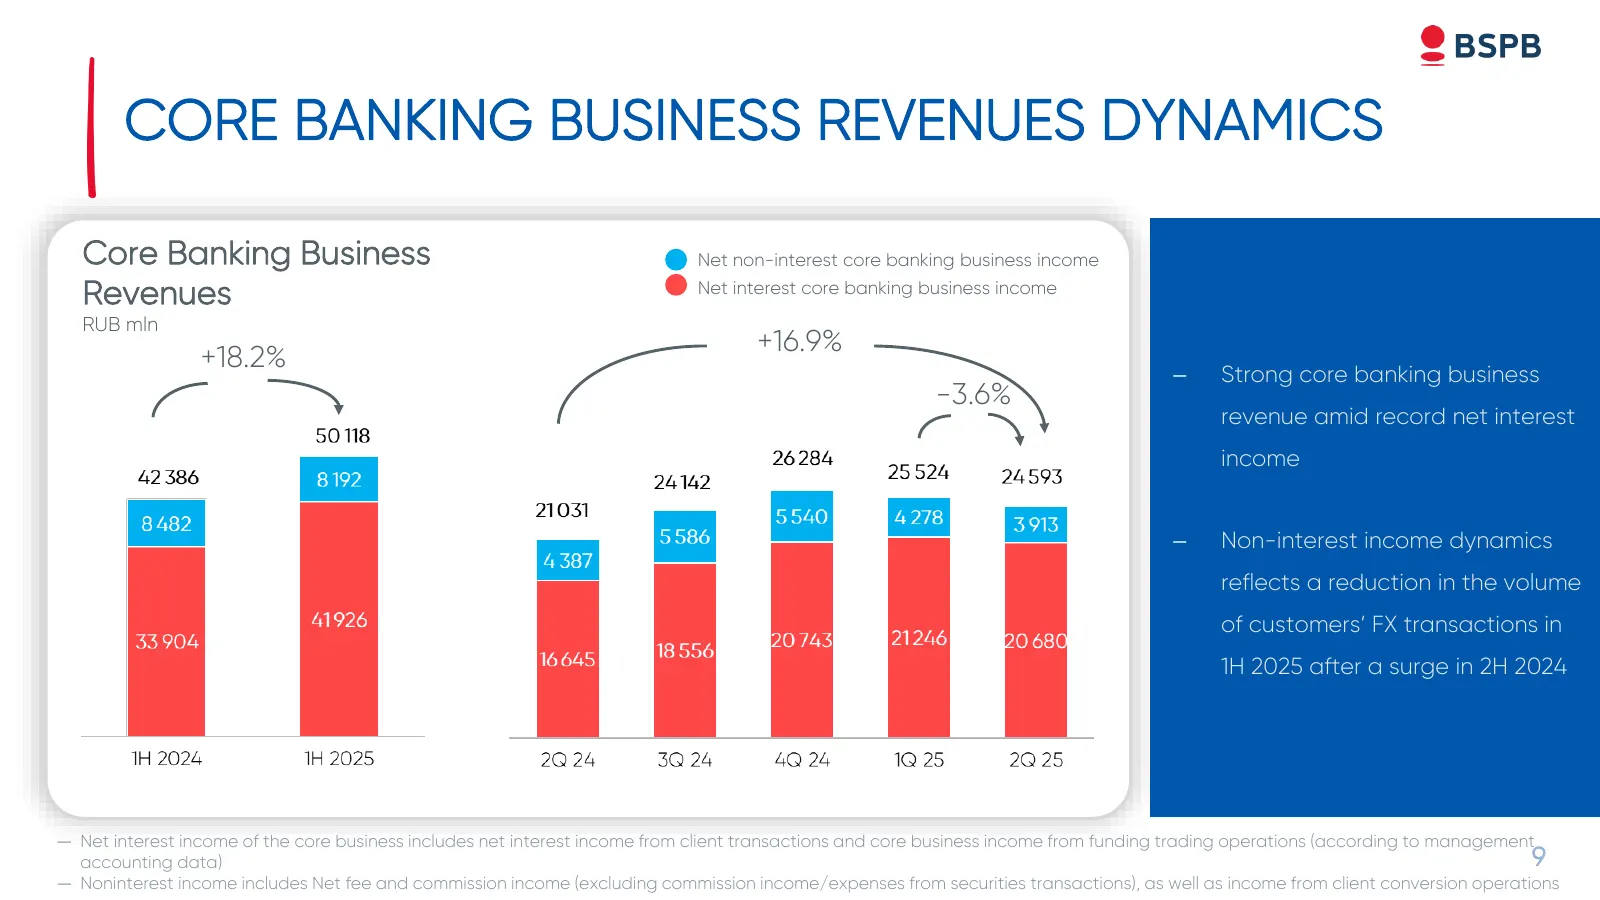
CORE BANKING BUSINESS REVENUES DYNAMICS Core Banking Business Net non-interest core banking business income Revenues Net interest core banking business income RUB mln +16.9% +18.2% – Strong core banking business -3.6% revenue amid record net interest income – Non-interest income dynamics reflects a
Slide 10: Sources of Funding
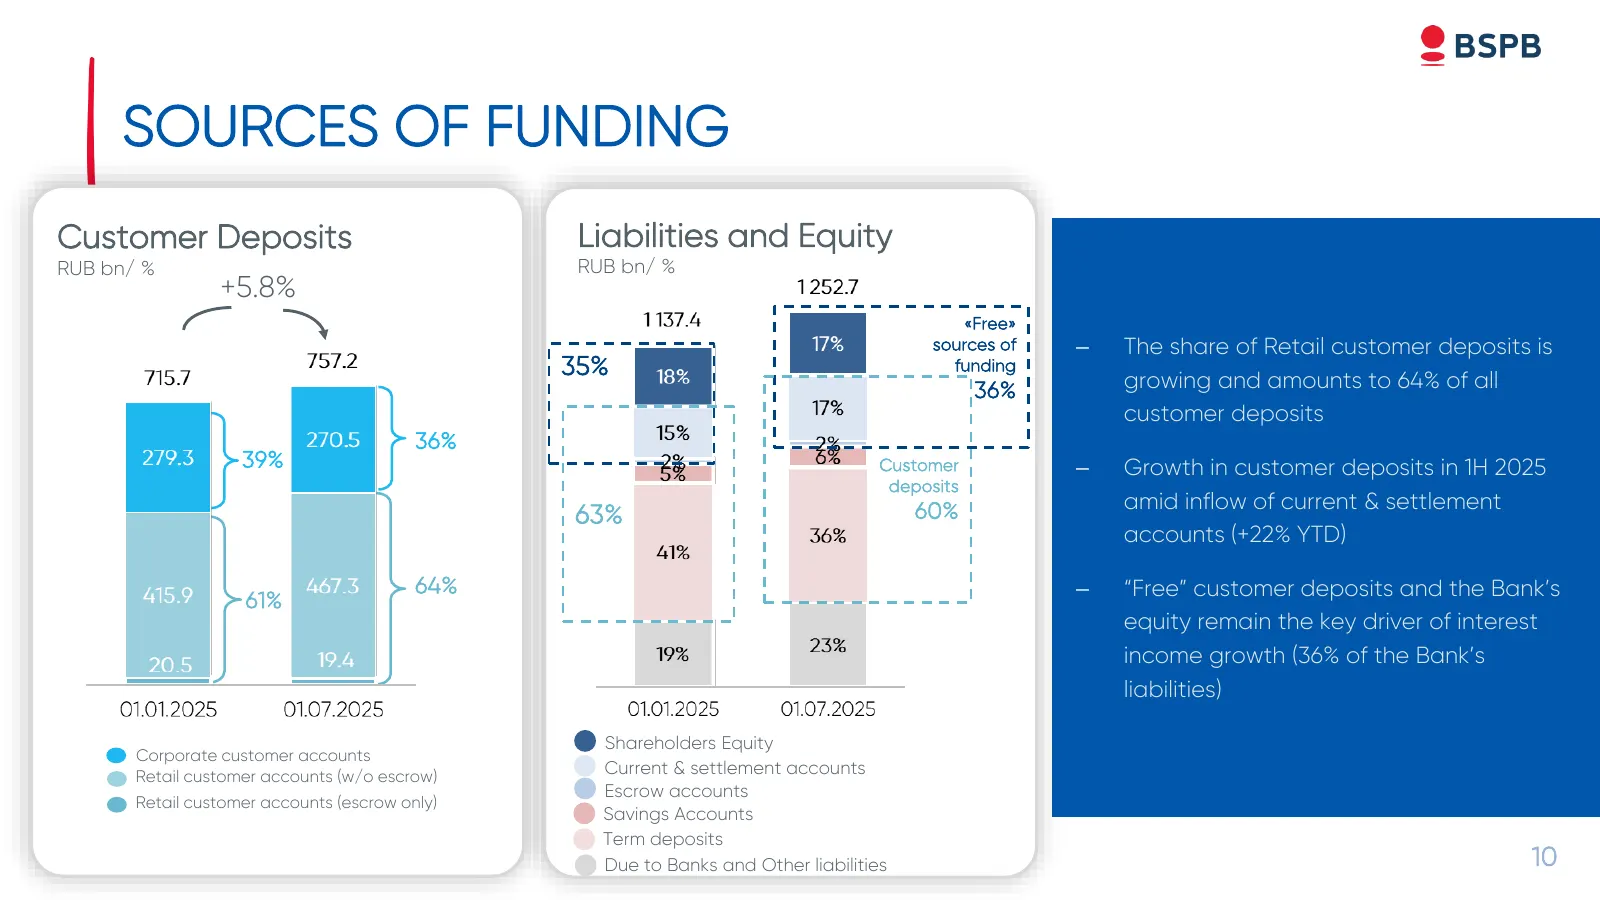
SOURCES OF FUNDING Customer Deposits Liabilities and Equity RUB bn/ % RUB bn/ % +5.8% «Free» sources of – The share of Retail customer deposits is 35% funding 36% growing and amounts to 64% of all customer deposits 36% 39% Customer – Growth in customer deposits in 1H 2025 deposits 60% amid inflow of
Slide 11: Net Interest Margin & Rates Dynamics
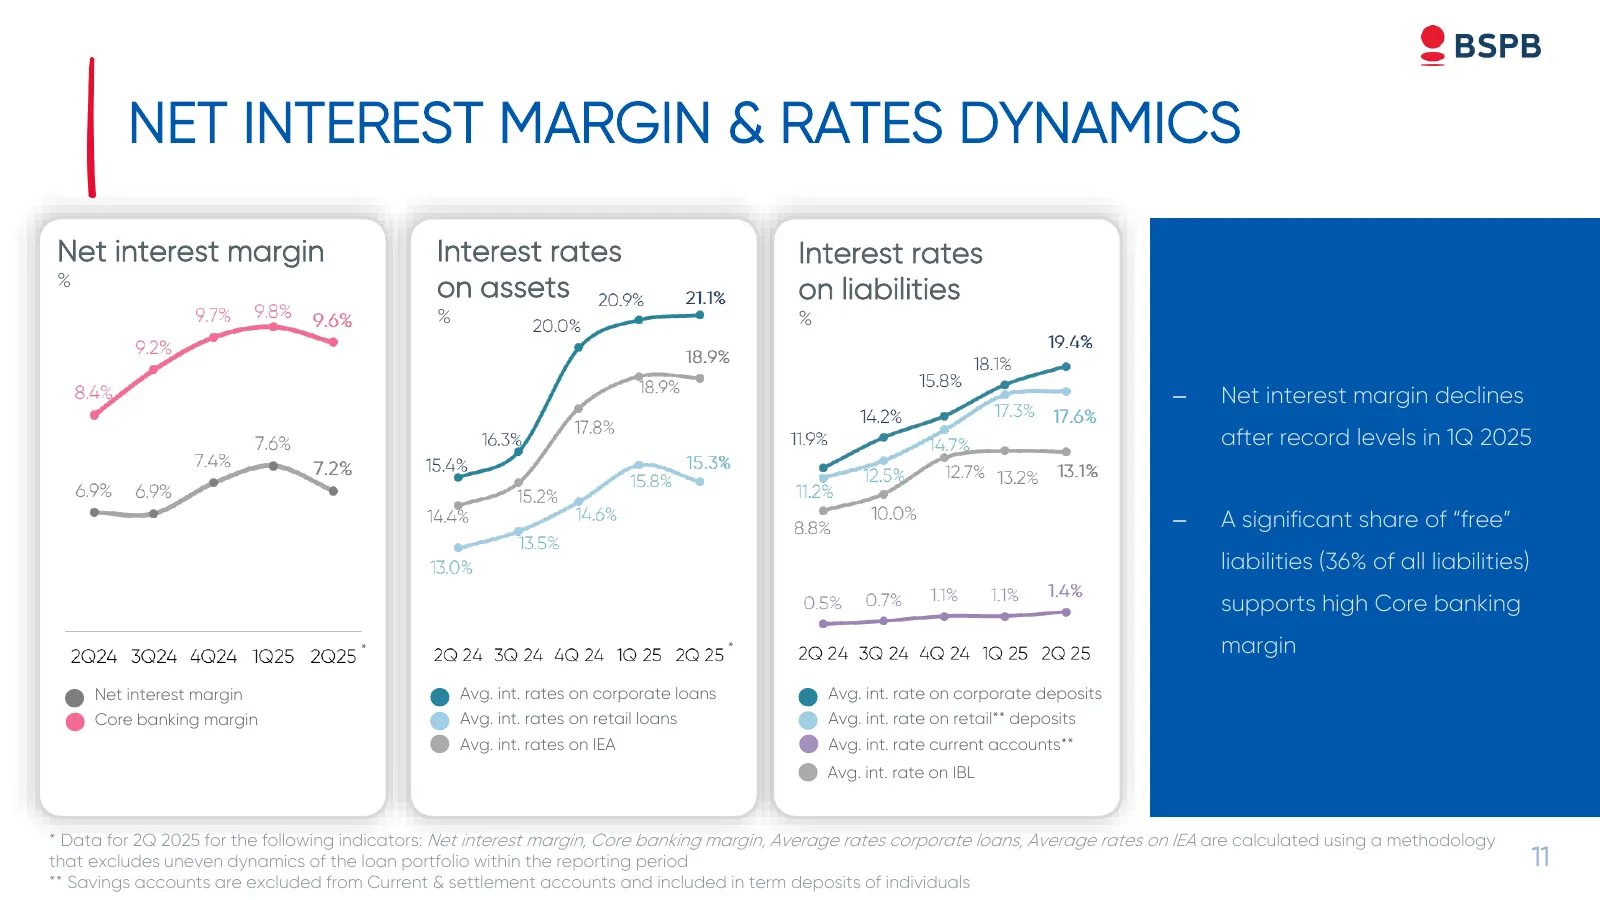
NET INTEREST MARGIN & RATES DYNAMICS Net interest margin Interest rates Interest rates % on assets on liabilities % % – Net interest margin declines after record levels in 1Q 2025 – A significant share of “free” liabilities (36% of all liabilities) supports high Core banking * * margin Net interest
Slide 12: Non-Interest Income
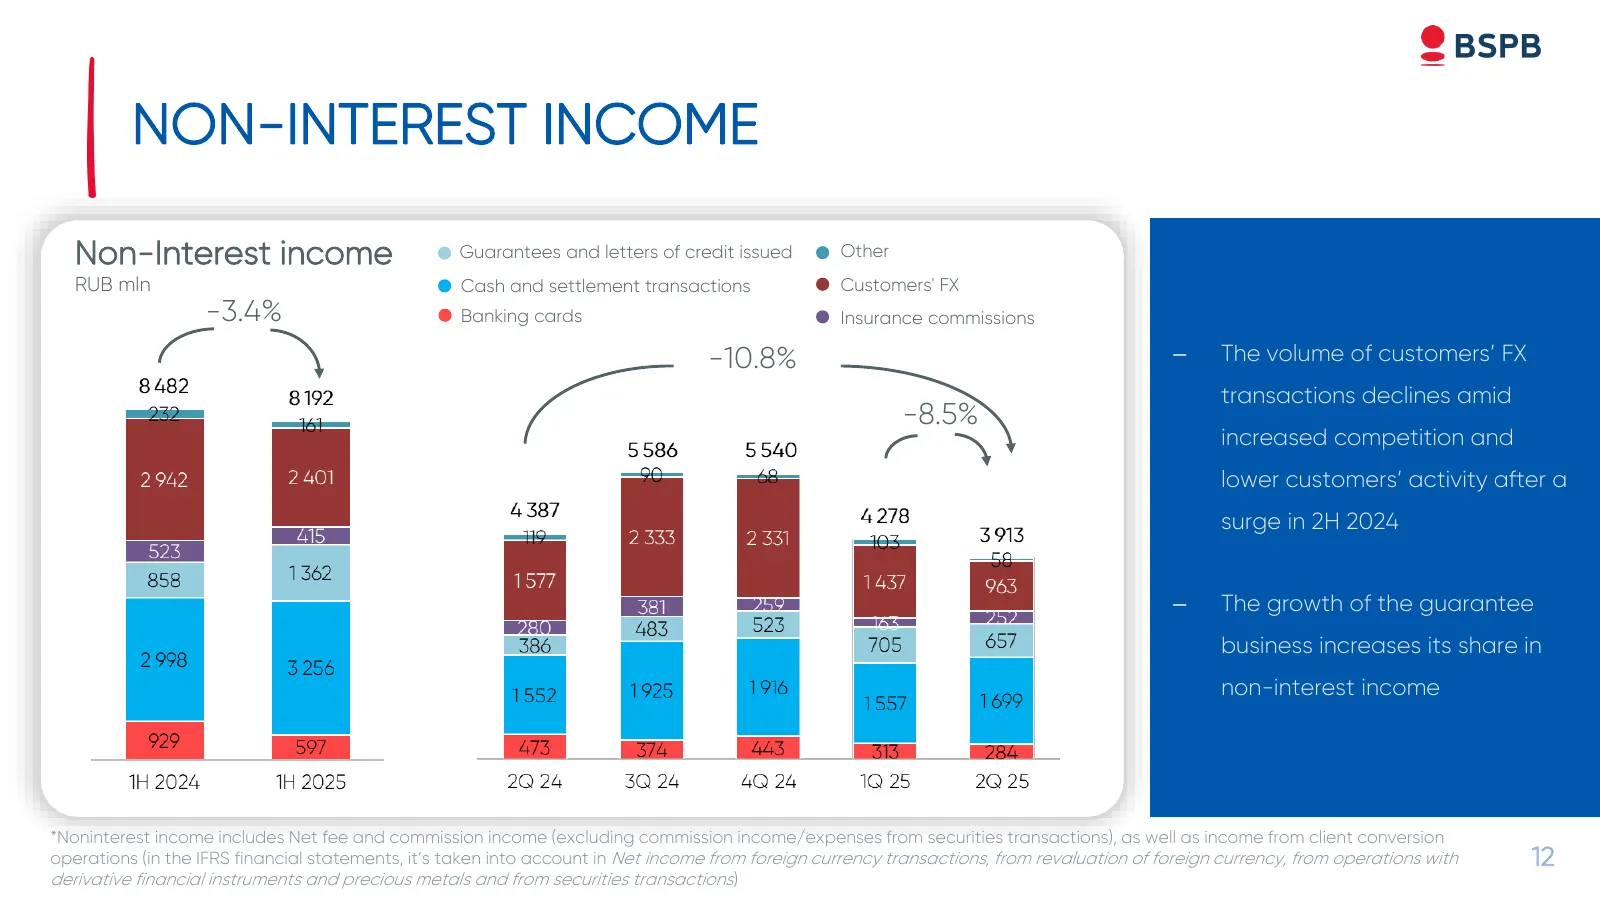
NON-INTEREST INCOME Non-Interest income Guarantees and letters of credit issued Other RUB mln Cash and settlement transactions Customers' FX -3.4% Banking cards Insurance commissions -10.8% – The volume of customers’ FX transactions declines amid -8.5% increased competition and lower customers’ acti
Slide 13: Loan Portfolio and Credit Quality 1/2
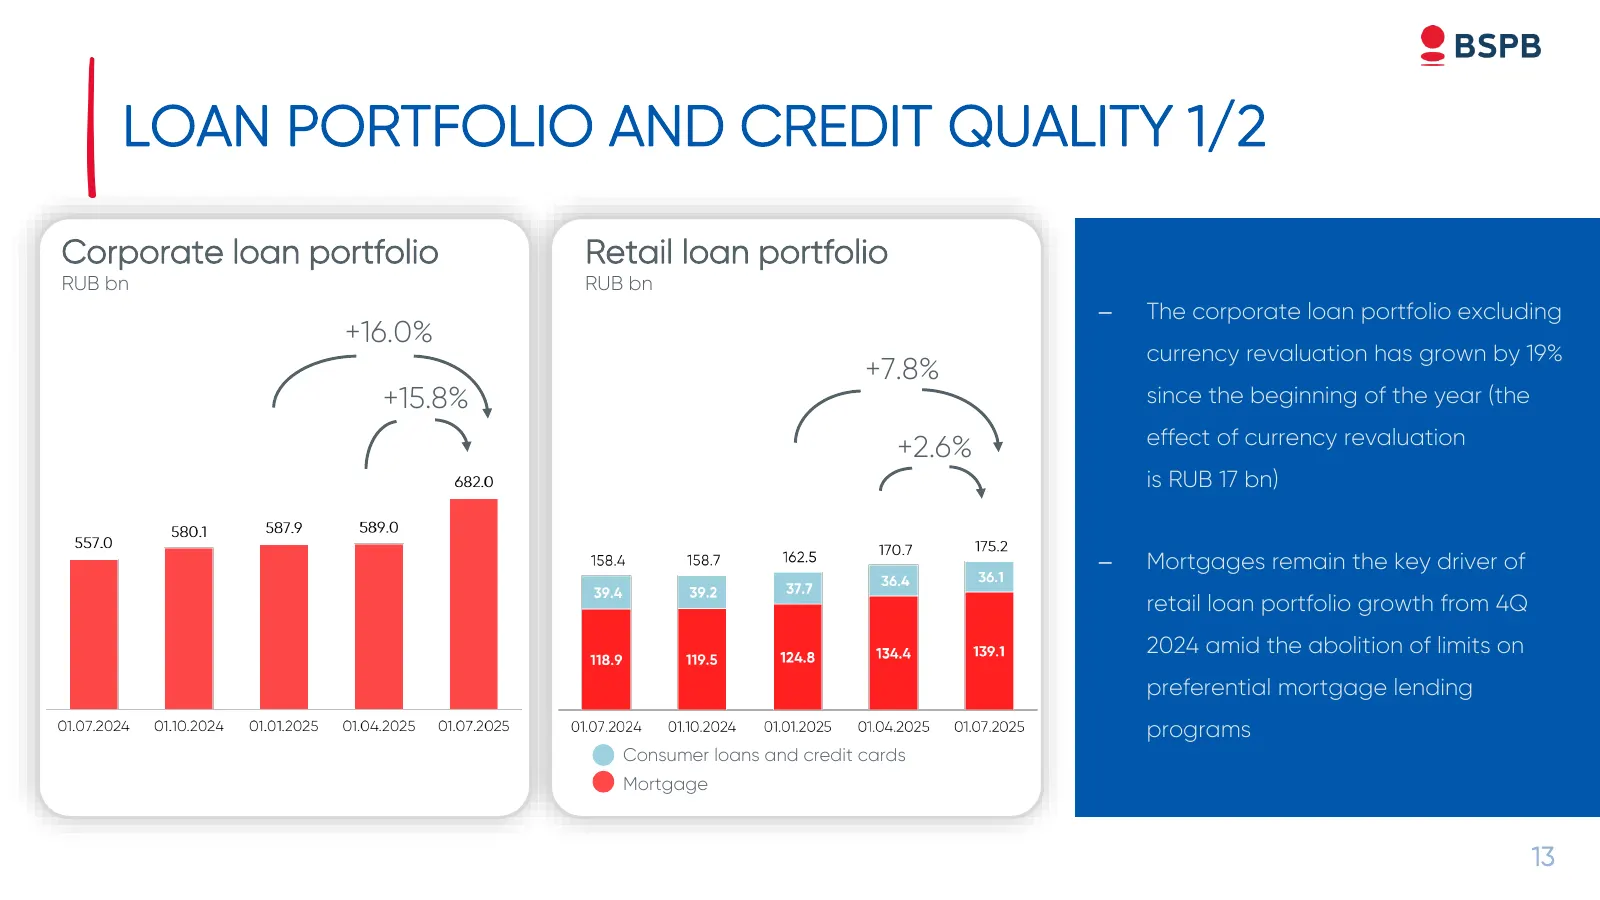
LOAN PORTFOLIO AND CREDIT QUALITY 1/2 Corporate loan portfolio Retail loan portfolio RUB bn RUB bn – The corporate loan portfolio excluding +16.0% currency revaluation has grown by 19% +7.8% +15.8% since the beginning of the year (the effect of currency revaluation +2.6% is RUB 17 bn) – Mortgages re
Slide 14: Loan Portfolio and Credit Quality 2/2
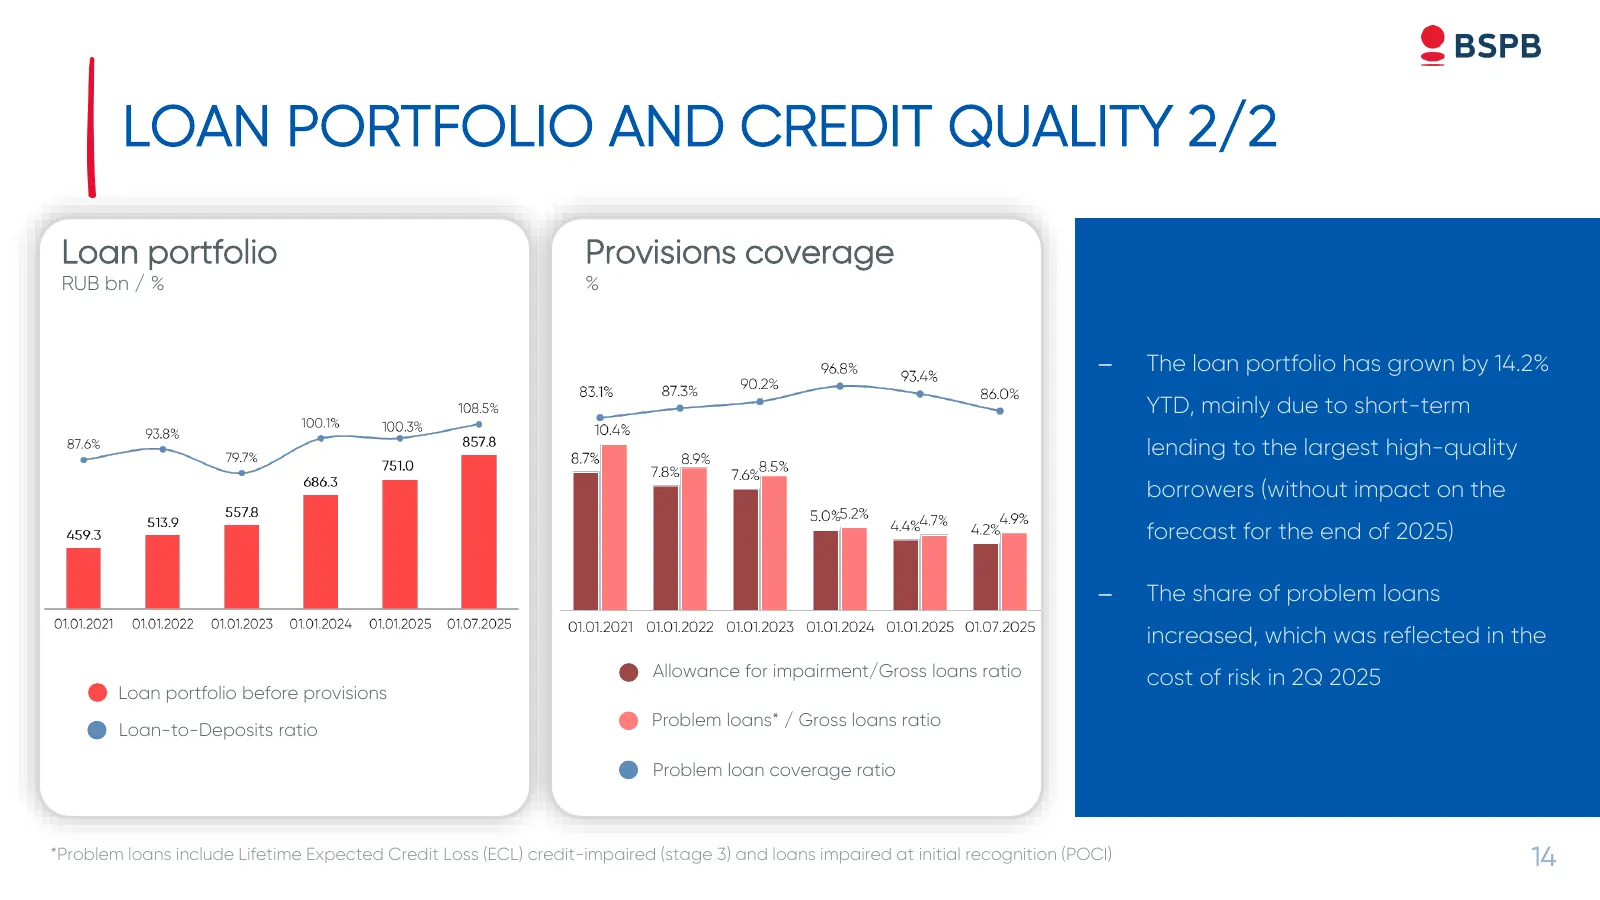
LOAN PORTFOLIO AND CREDIT QUALITY 2/2 Loan portfolio Provisions coverage RUB bn / % % – The loan portfolio has grown by 14.2% YTD, mainly due to short-term lending to the largest high-quality borrowers (without impact on the forecast for the end of 2025) – The share of problem loans increased, which
Slide 15: Cost of Risk
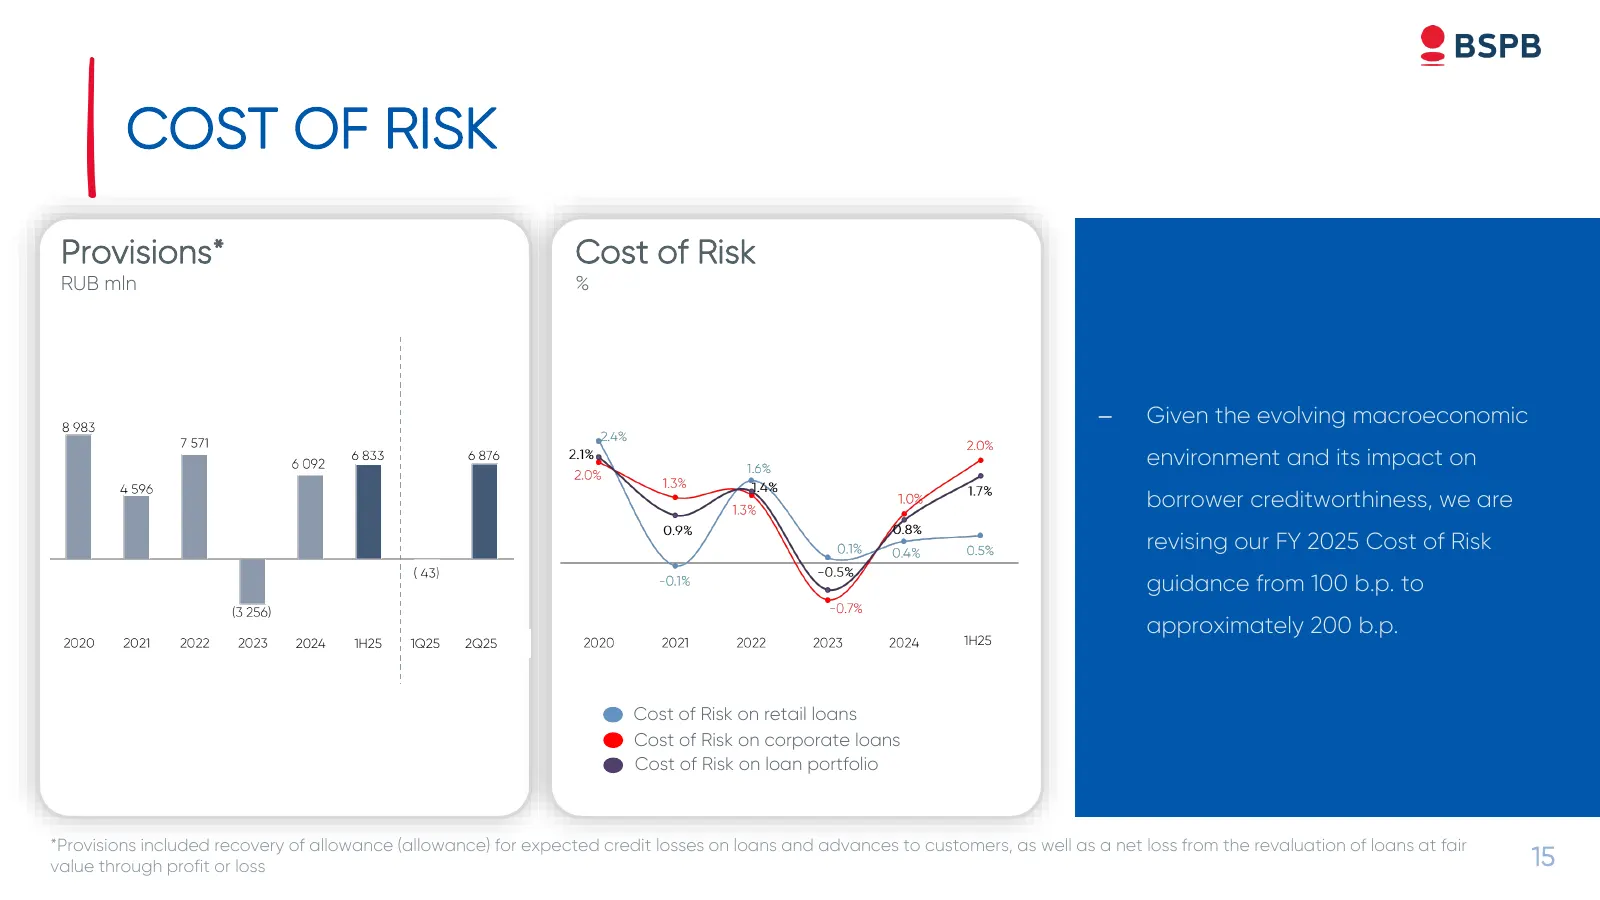
COST OF RISK Provisions* Cost of Risk RUB mln % – Given the evolving macroeconomic environment and its impact on borrower creditworthiness, we are revising our FY 2025 Cost of Risk guidance from 100 b.p. to approximately 200 b.p. 2024 1H25 1Q25 2Q25 1H25 Cost of Risk on retail loans Cost of Risk on
Slide 16: Capital & Capital Adequacy Ratios (RAS, Basel III)
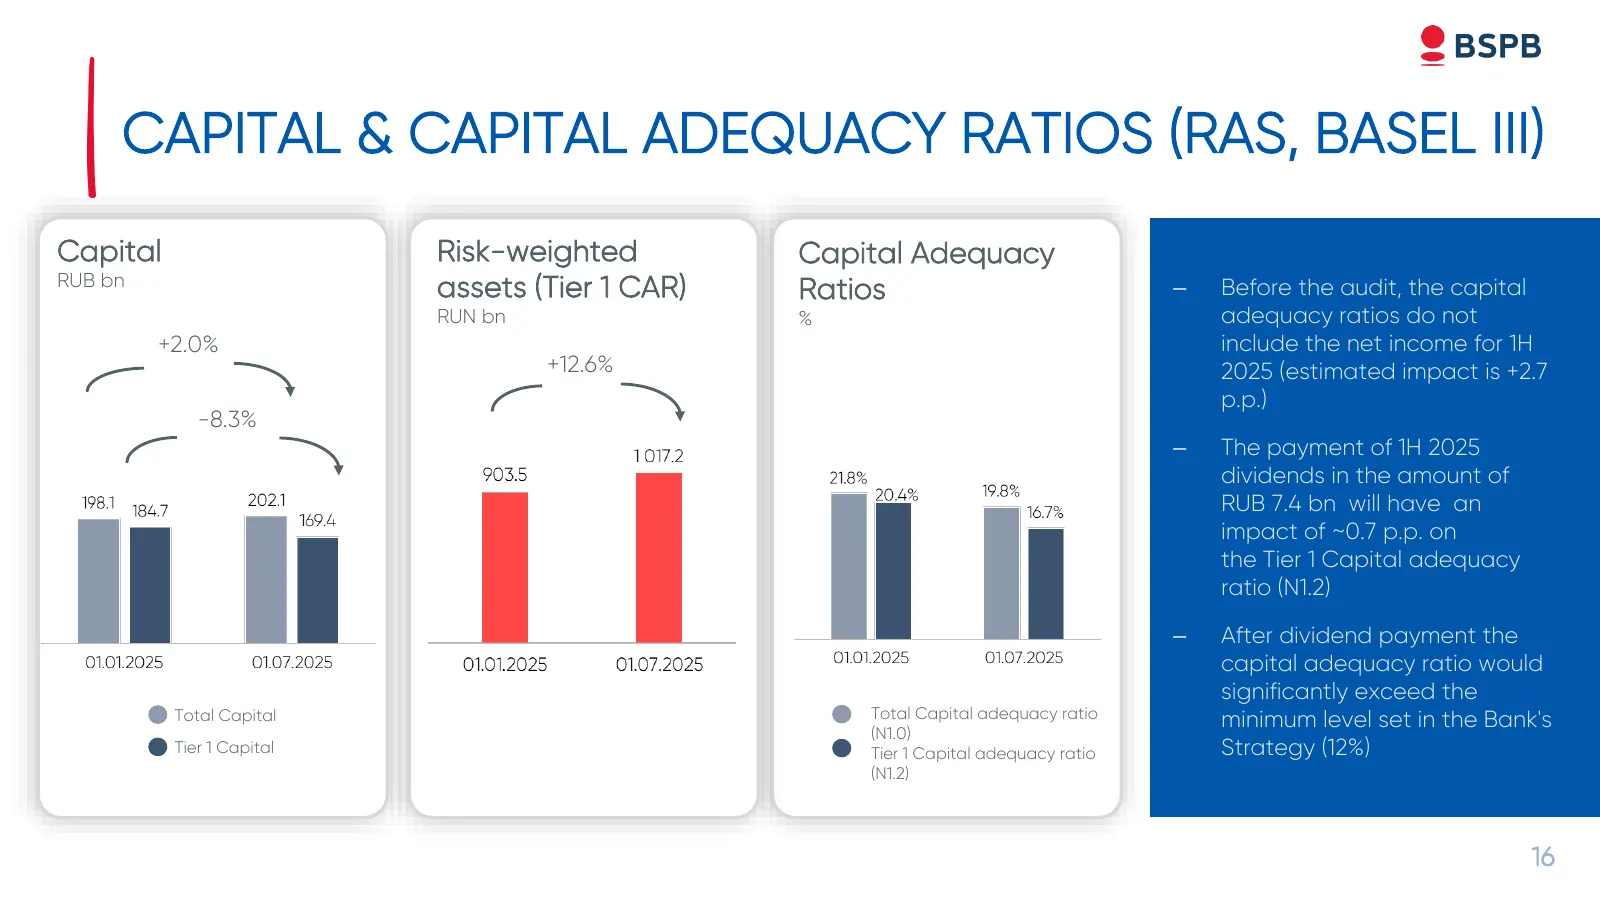
CAPITAL & CAPITAL ADEQUACY RATIOS (RAS, BASEL III) Capital Risk-weighted Capital Adequacy RUB bn assets (Tier 1 CAR) – Ratios Before the audit, the capital RUN bn % adequacy ratios do not +2.0% include the net income for 1H +12.6% 2025 (estimated impact is +2.7 p.p.) -8.3% – The payment of 1H 2025 d
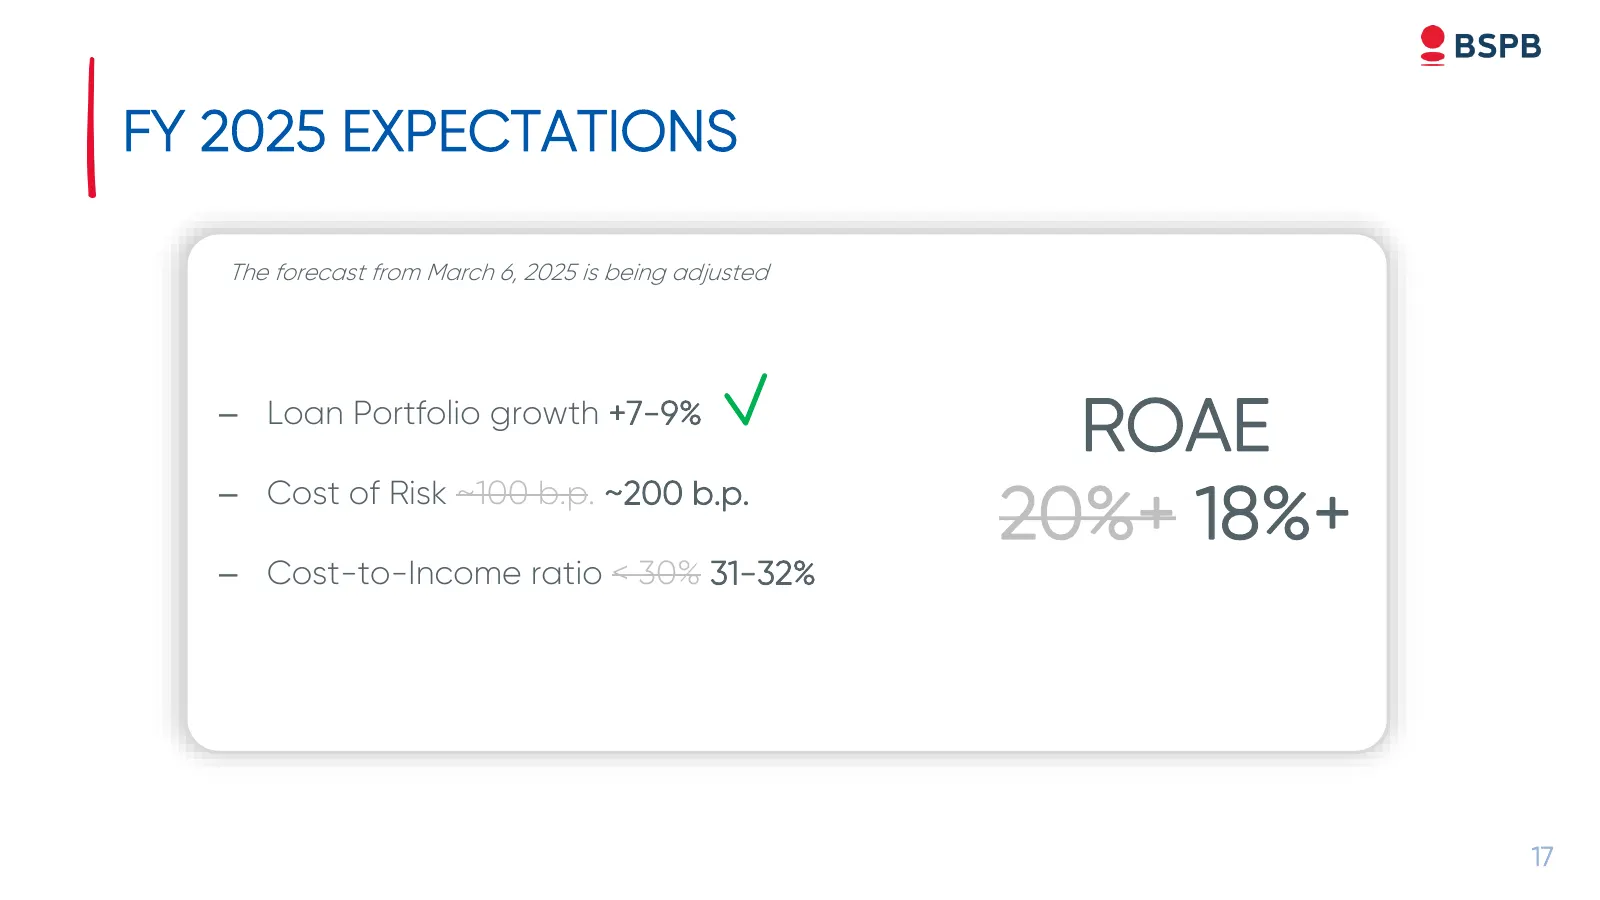
Slide 17: FY 2025 Expectations
FY 2025 EXPECTATIONS The forecast from March 6, 2025 is being adjusted – Loan Portfolio growth +7-9% ROAE – Cost of Risk ~100 b.p. ~200 b.p. 20%+ 18%+ – Cost-to-Income ratio < 30% 31-32% 17

Slide 18: Appendix
APPENDIX EE
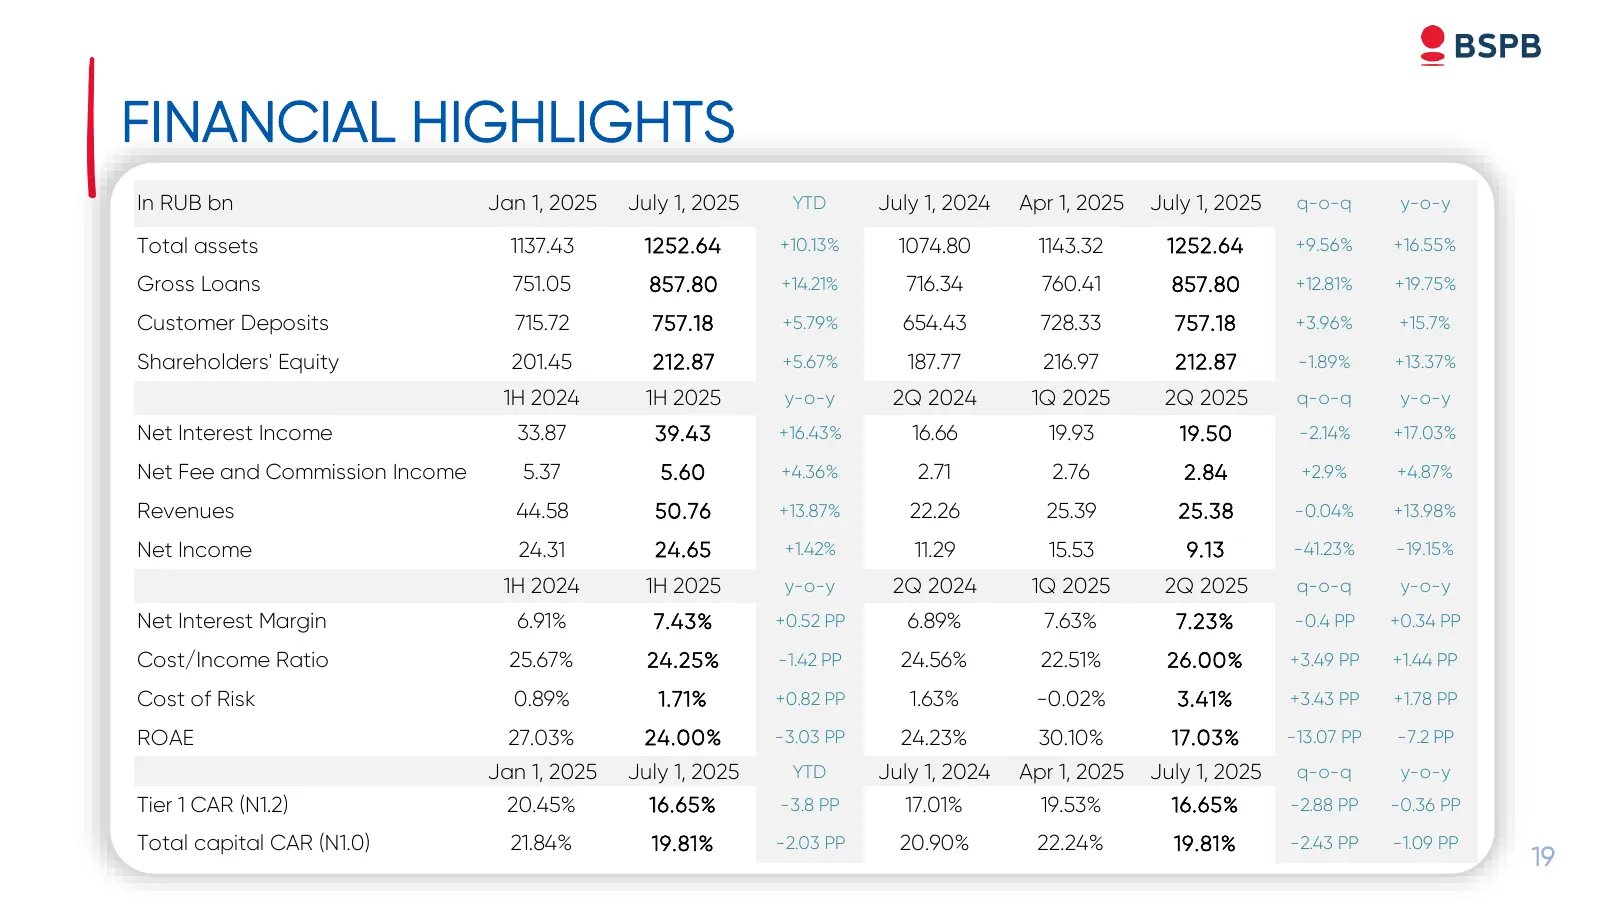
Slide 19: Financial Highlights
FINANCIAL HIGHLIGHTS In RUB bn Jan 1, 2025 July 1, 2025 YTD July 1, 2024 Apr 1, 2025 July 1, 2025 q-o-q y-o-y Total assets 1137.43 1252.64 +10.13% 1074.80 1143.32 1252.64 +9.56% +16.55% Gross Loans 751.05 857.80 +14.21% 716.34 760.41 857.80 +12.81% +19.75% Customer Deposits 715.72 757.18 +5.79% 654.
Slide 20: Contacts for Investors
CONTACTS FOR INVESTORS Information for investors is available on site: https://www.bspb.ru/en/investors/ Е-mail: ir@bspb.ru Tel.: +7 /812/ 332 78 36 20
Source: company website
More decks from BSP
 Investor Presentation (November 2026)30 slides · November 2026
 Bank Saint Petersburg — Q2 2026 Earnings Presentation18 slides · Aug 21, 2026
 Bank Saint Petersburg — Investor Presentation (August 2026)29 slides · August 2026
 Investor Presentation (August 2026)29 slides · August 2026
 Bank Saint Petersburg — Q1 2026 Earnings Presentation17 slides · May 15, 2026
 Bank Saint Petersburg — FY2025 Earnings Presentation19 slides · Mar 6, 2026