Anadolu Anonim Turk Sigorta Sirketi A.S. · BIST:ANSGR
Anadolu Anonim Turk Sigorta Sirketi A.S — Anadolu Sigorta — Q3 2023 Earnings Presentation
28 slides from Anadolu Anonim Turk Sigorta Sirketi A.S's earnings presentation, Sep 30, 2023
Slide 1: Investor Presentation 30.09.2023
INVESTOR PRESENTATION 30.09.2023 Copyright © 2021, Anadolu Sigorta. All rights reserved. Fund Management and Investor Relations Department 1
Slide 2: Content
CONTENT Company & Market Potential_____ 3 Company Overview_____________ 10 Financial Highlights _____________ 22 Copyright © 2021, Anadolu Sigorta. All rights reserved. Fund Management and Investor Relations Department 2
Slide 3: Company & Market Potential
Company & Market Potential Copyright © 2021, Anadolu Sigorta. All rights reserved. Fund Management and Investor Relations Department 3
Slide 4: Sector Data
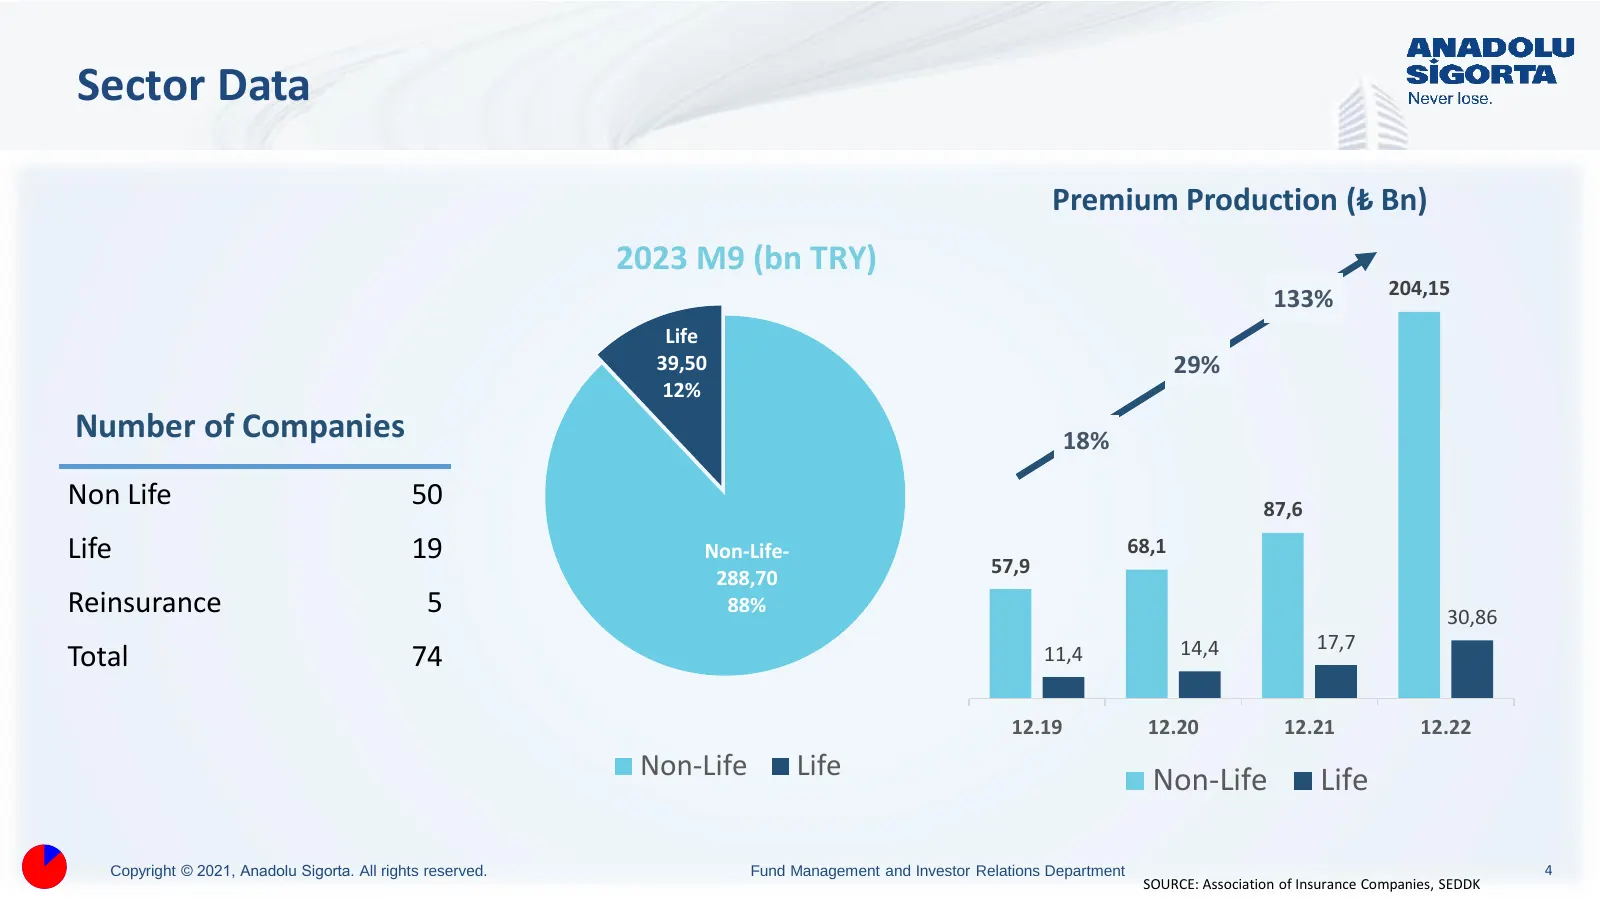
Sector Data Premium Production (₺ Bn) 2023 M9 (bn TRY) 204,15 133% Life 39,50 29% 12% Number of Companies 18% Non Life 50 87,6 Life 19 Non-Life- 57,9 68,1 288,70 Reinsurance 5 88% 30,86 14,4 17,7 Total 74 11,4 12.19 12.20 12.21 12.22 Non-Life Life Non-Life Life Copyright © 2021, Anadolu Sigorta. All
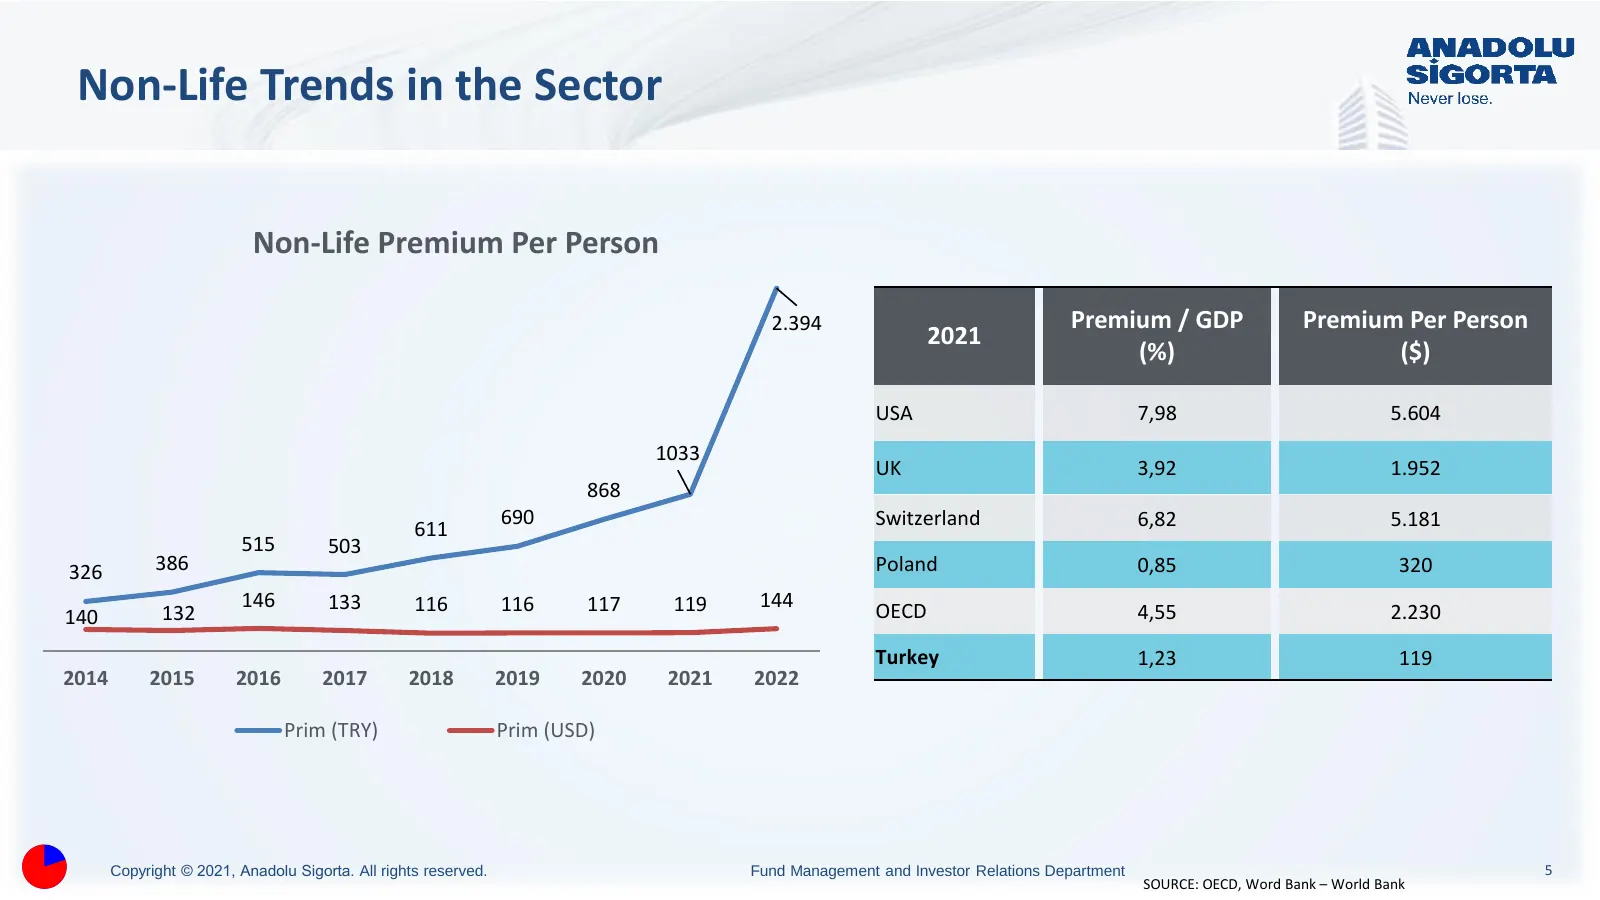
Slide 5: Non-Life Trends in the Sector
Non-Life Trends in the Sector Non-Life Premium Per Person 2.394 Premium / GDP Premium Per Person 2021 (%) ($) USA 7,98 5.604 1033 UK 3,92 1.952 868 690 Switzerland 6,82 5.181 611 515 503 326 386 Poland 0,85 320 146 133 116 116 117 119 144 140 132 OECD 4,55 2.230 Turkey 1,23 119 2014 2015 2016 2017 2
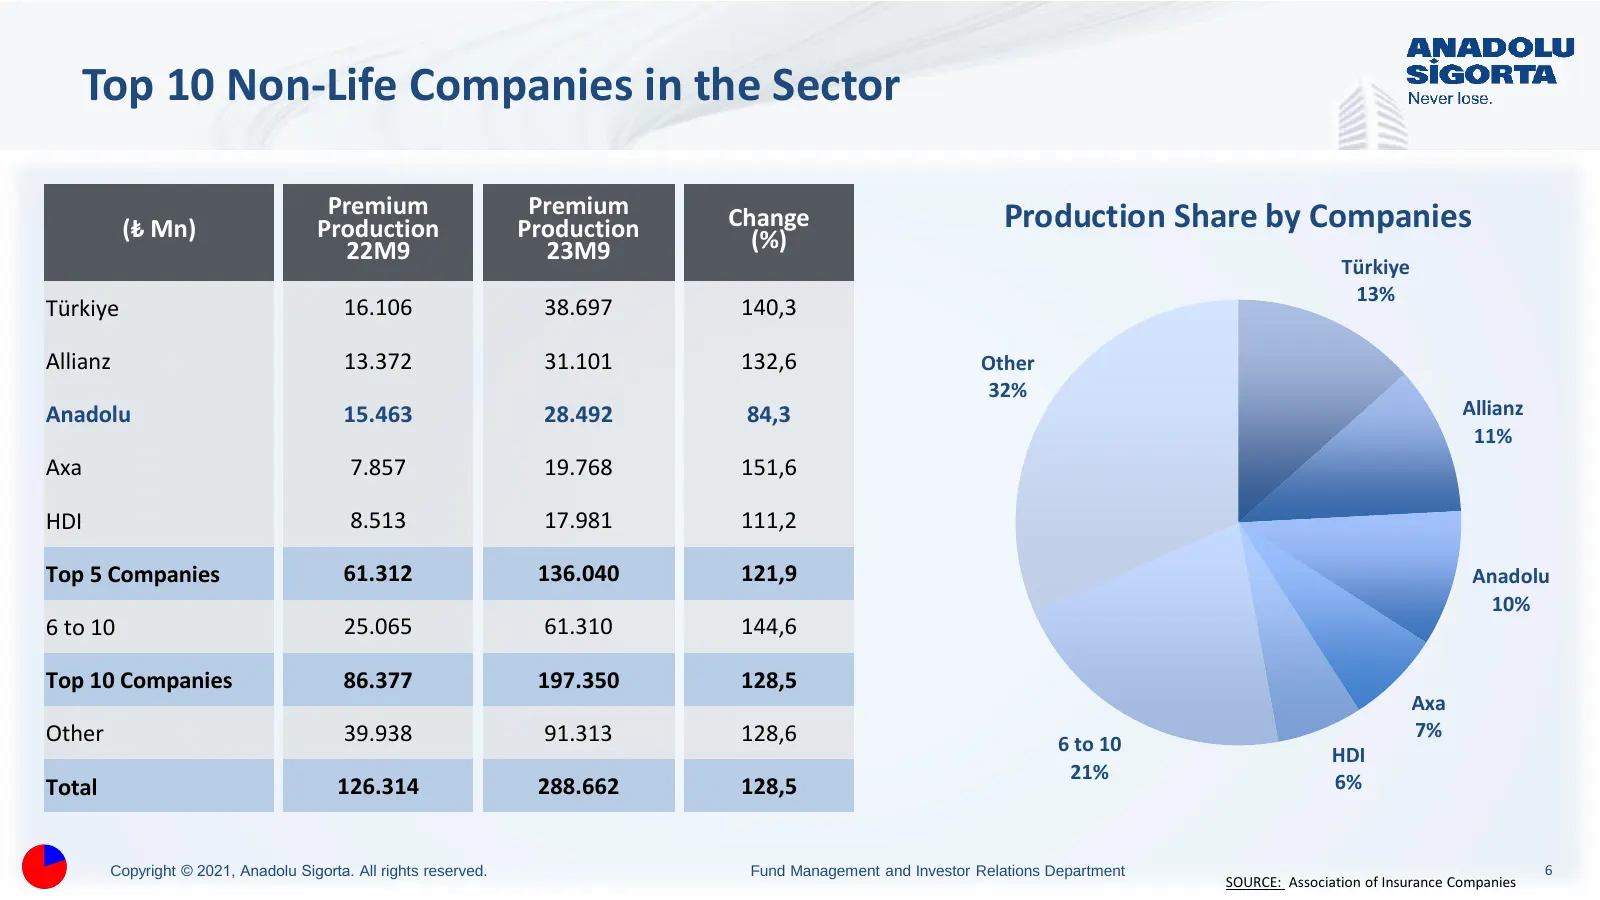
Slide 6: Top 10 Non-Life Companies in the Sector
Top 10 Non-Life Companies in the Sector Premium Premium Change Production Share by Companies (₺ Mn) Production Production (%) 22M9 23M9 Türkiye 13% Türkiye 16.106 38.697 140,3 Allianz 13.372 31.101 132,6 Other 32% Anadolu 15.463 28.492 84,3 Allianz 11% Axa 7.857 19.768 151,6 HDI 8.513 17.981 111,2 T
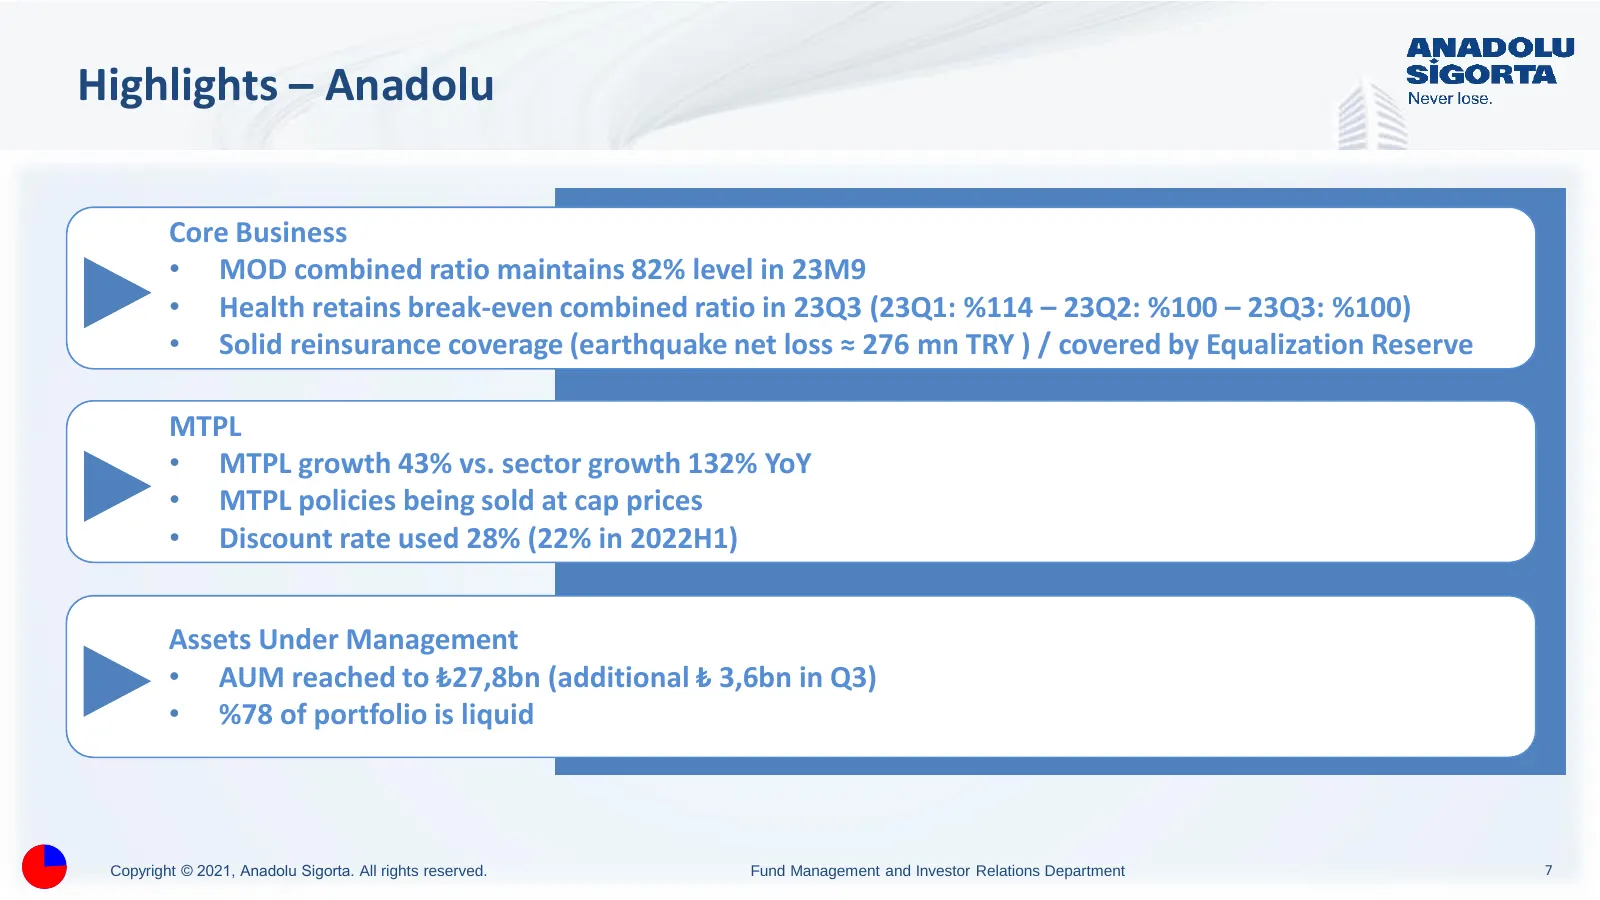
Slide 7: Highlights – Anadolu
Highlights – Anadolu Core Business • MOD combined ratio maintains 82% level in 23M9 • Health retains break-even combined ratio in 23Q3 (23Q1: %114 – 23Q2: %100 – 23Q3: %100) • Solid reinsurance coverage (earthquake net loss ≈ 276 mn TRY ) / covered by Equalization Reserve MTPL • MTPL growth 43% vs.
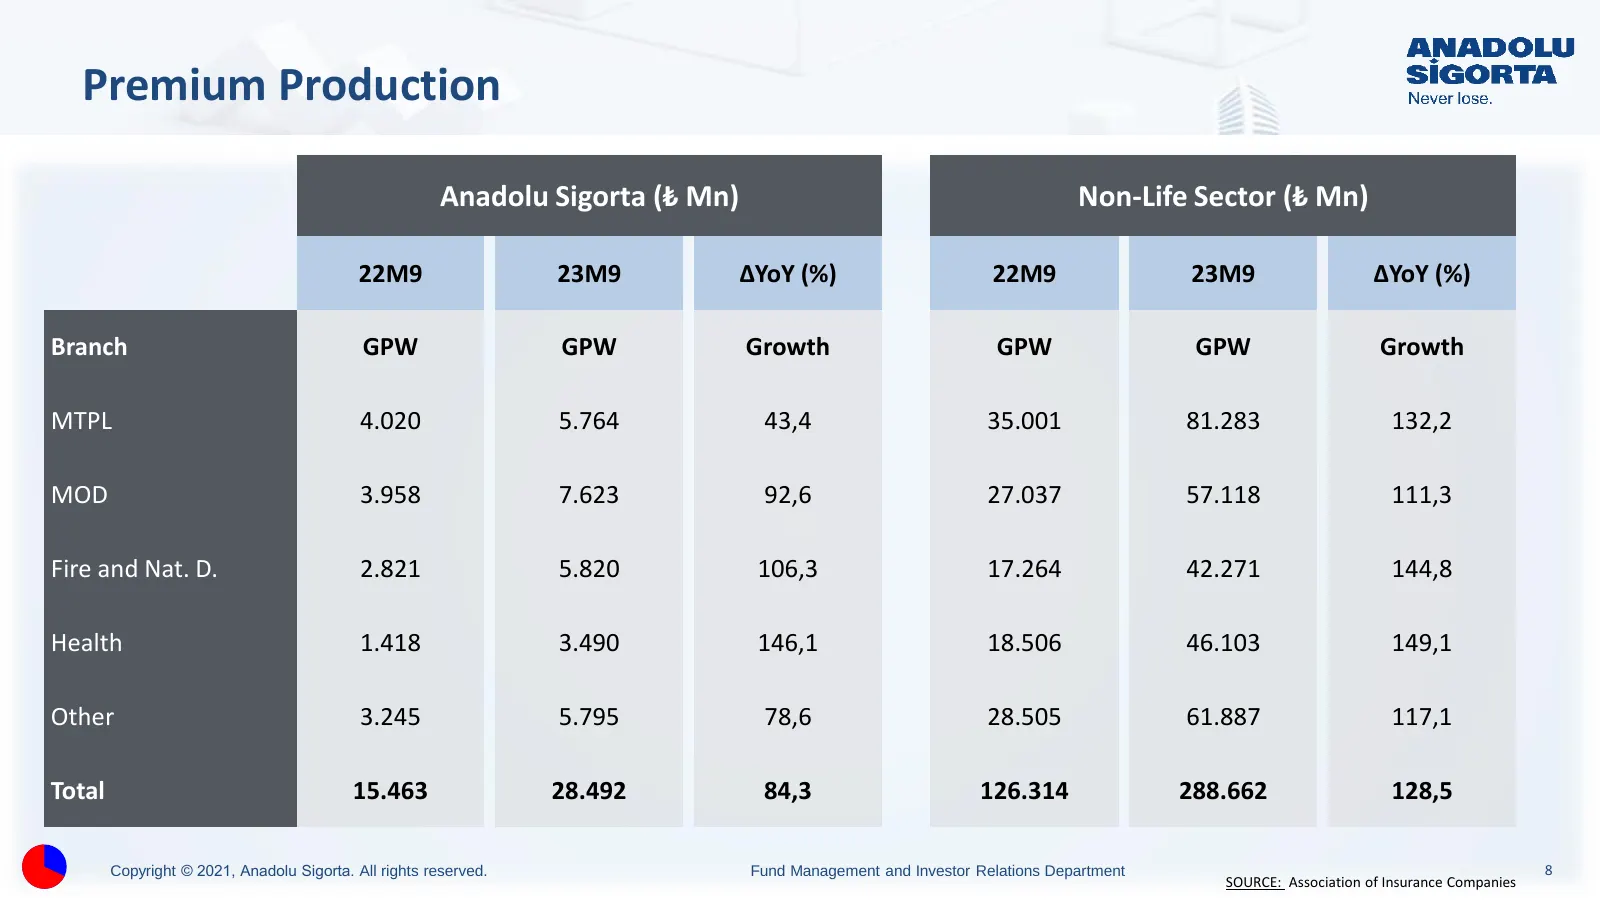
Slide 8: Premium Production
Premium Production Anadolu Sigorta (₺ Mn) Non-Life Sector (₺ Mn) 22M9 23M9 ΔYoY (%) 22M9 23M9 ΔYoY (%) Branch GPW GPW Growth GPW GPW Growth MTPL 4.020 5.764 43,4 35.001 81.283 132,2 MOD 3.958 7.623 92,6 27.037 57.118 111,3 Fire and Nat. D. 2.821 5.820 106,3 17.264 42.271 144,8 Health 1.418 3.490 146
Slide 9: Company Overview
Company Overview Copyright © 2021, Anadolu Sigorta. All rights reserved. Fund Management and Investor Relations Department 9
Slide 10: History
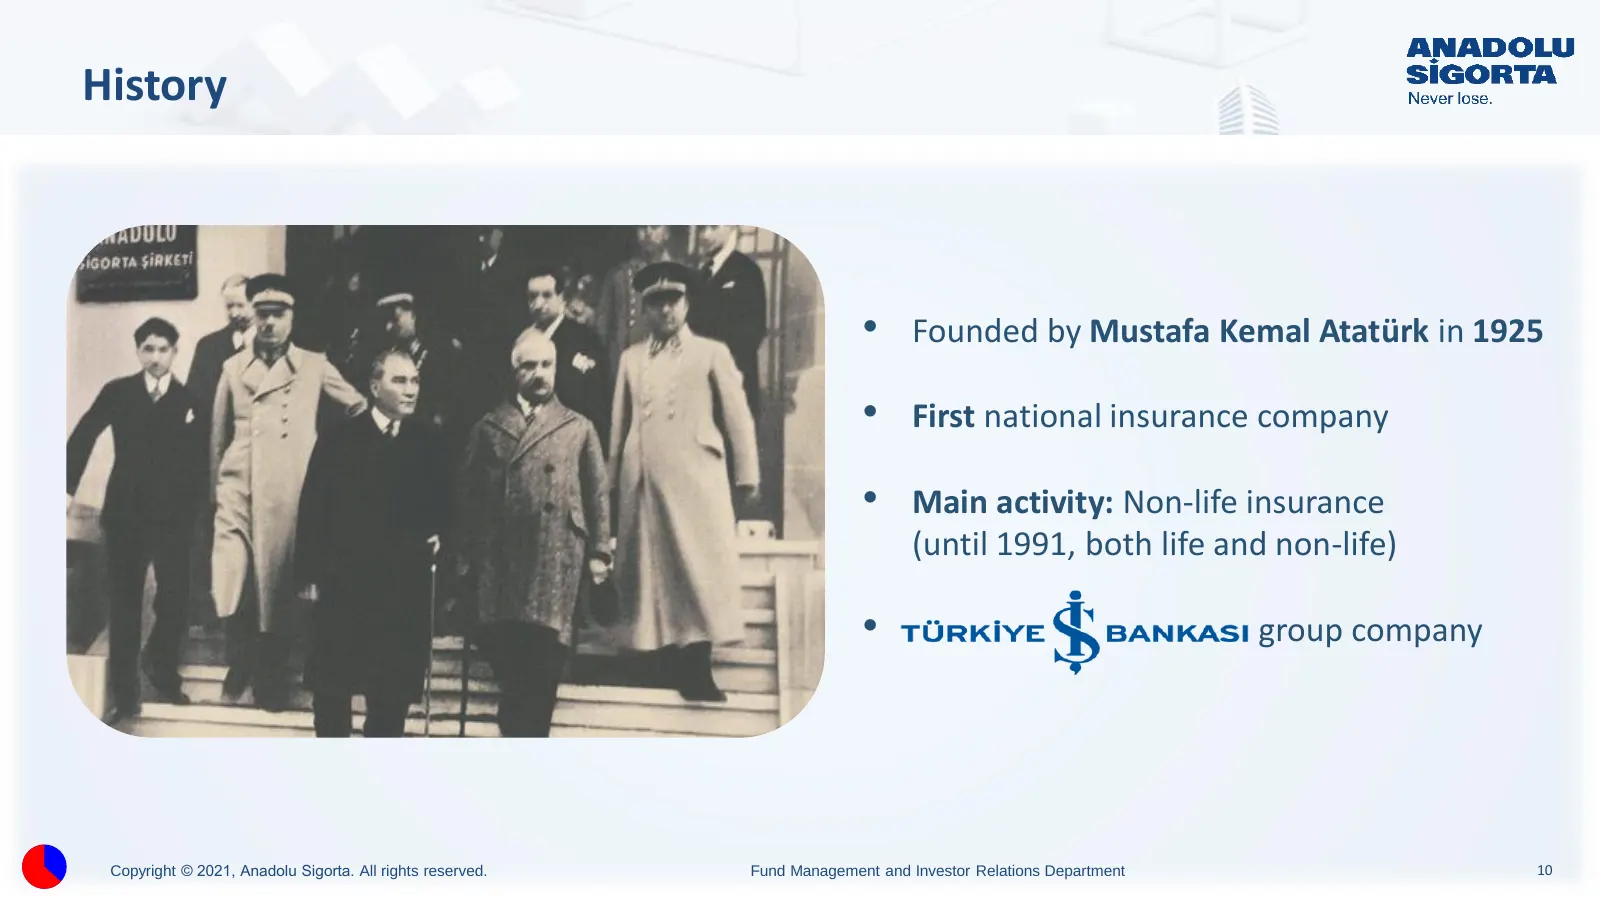
History • Founded by Mustafa Kemal Atatürk in 1925 • First national insurance company • Main activity: Non-life insurance (until 1991, both life and non-life) • group company Copyright © 2021, Anadolu Sigorta. All rights reserved. Fund Management and Investor Relations Department 10
Slide 11: Distribution Channels – FY22
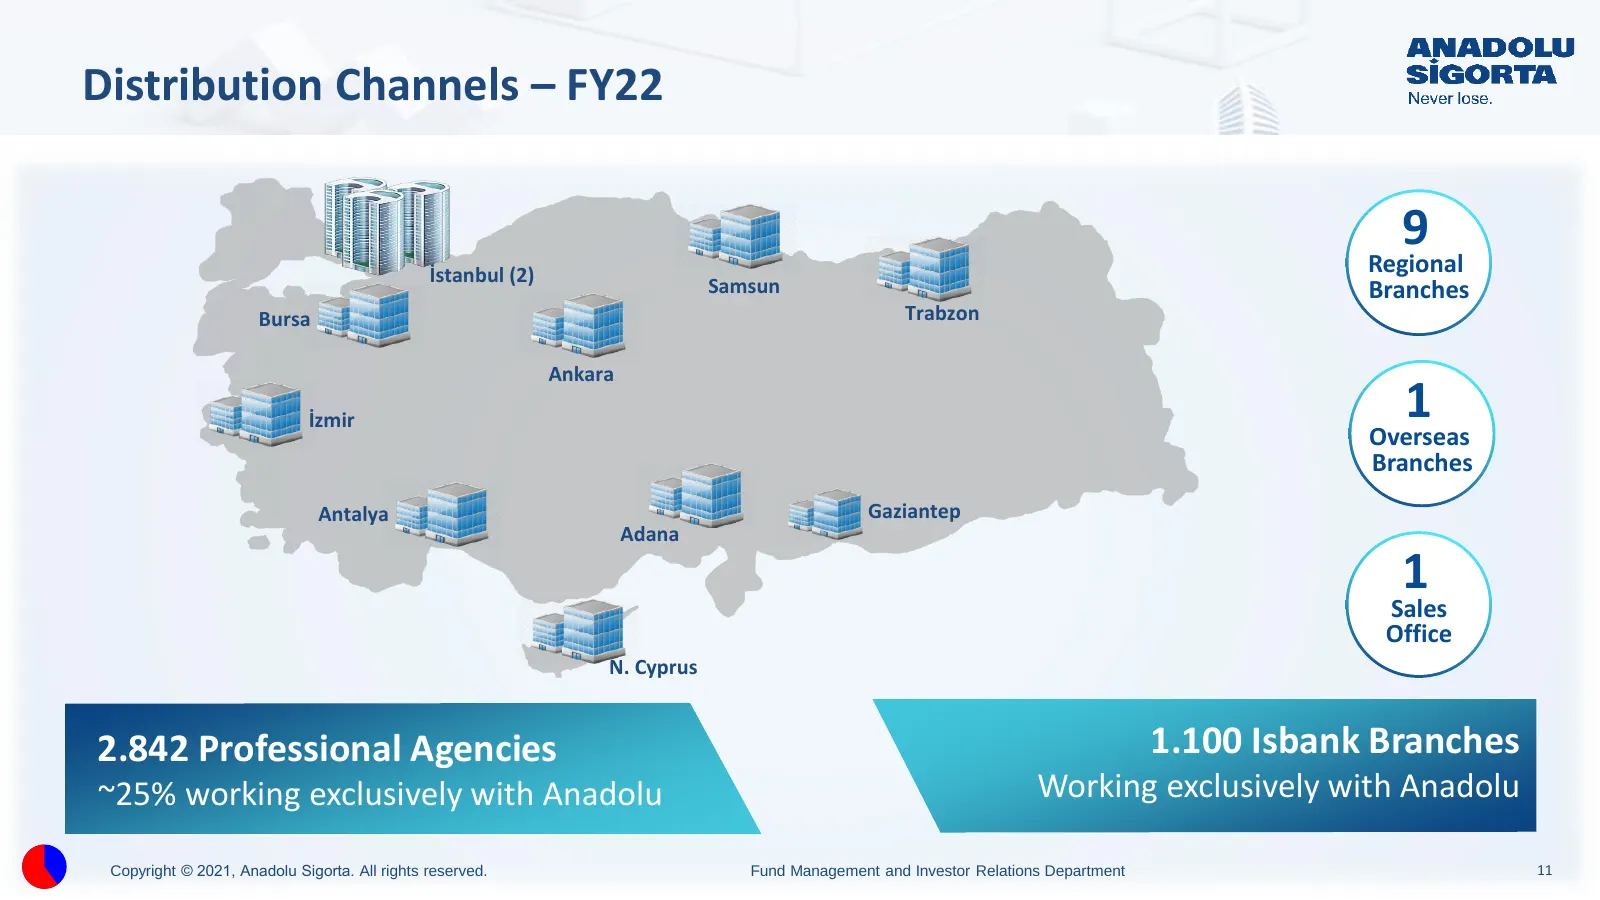
Distribution Channels – FY22 9 İstanbul (2) Regional Samsun Branches Bursa Trabzon Ankara İzmir 1 Overseas Branches Antalya Gaziantep Adana 1 Sales Office N. Cyprus 2.842 Professional Agencies 1.100 Isbank Branches ~25% working exclusively with Anadolu Working exclusively with Anadolu Copyright © 20
Slide 12: Distribution Channels
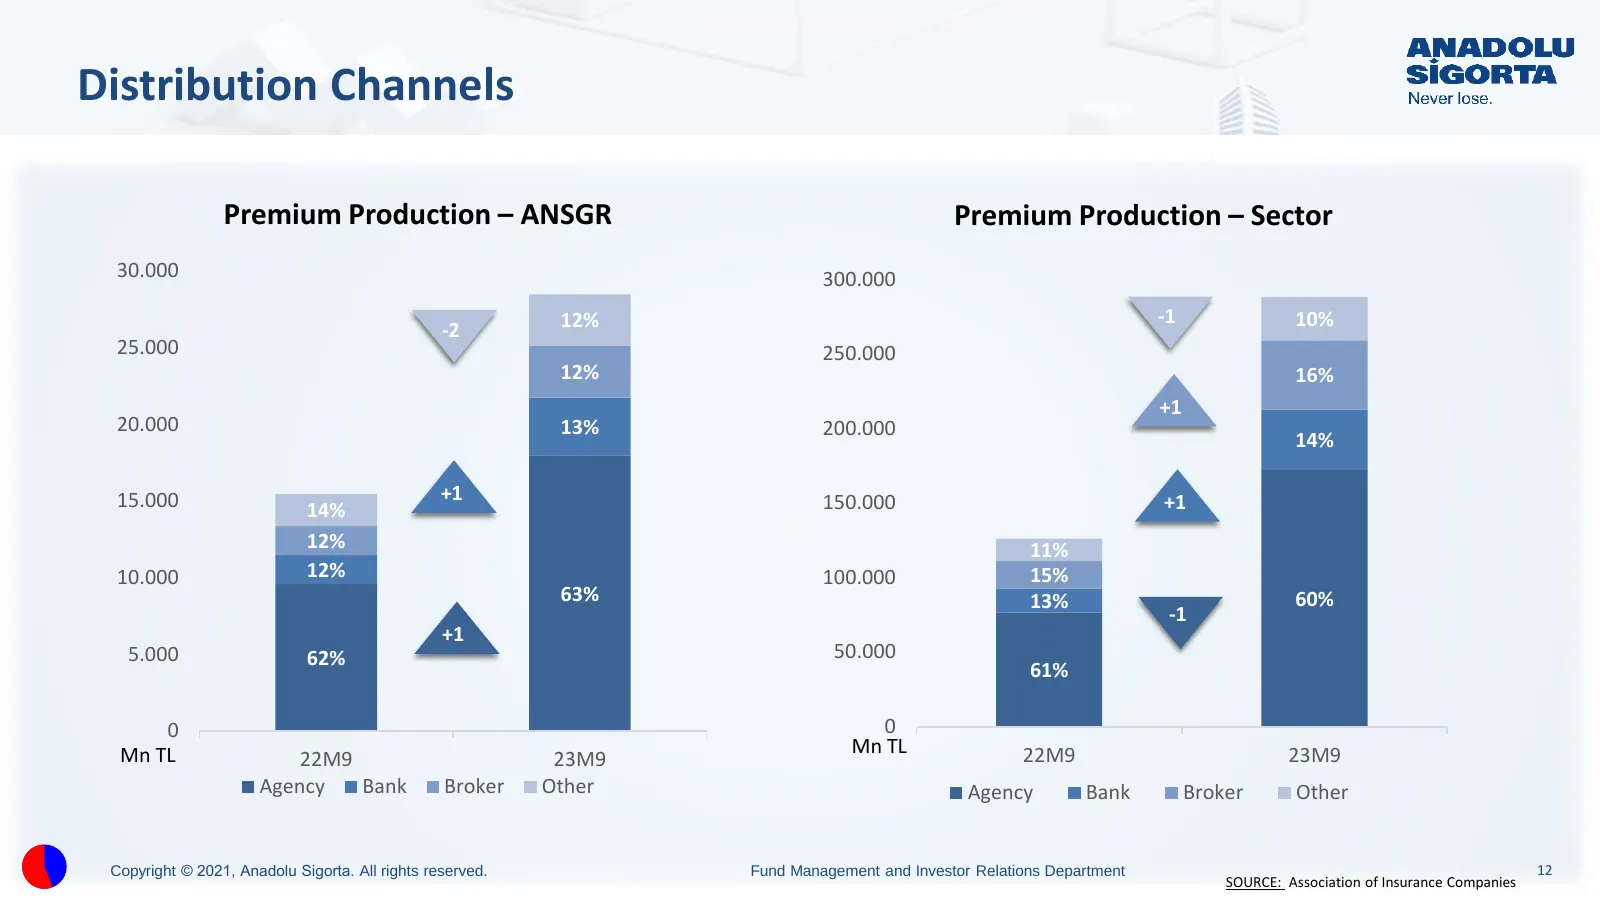
Distribution Channels Premium Production – ANSGR Premium Production – Sector 30.000 300.000 Millions 12% -1 10% -2 25.000 250.000 12% 16% +1 20.000 13% 200.000 14% 15.000 +1 150.000 +1 14% 12% 11% 10.000 12% 100.000 15% 63% 13% 60% -1 +1 5.000 62% 50.000 61% 0 0 Mn TL Mn TL 22M9 23M9 22M9 23M9 Agenc
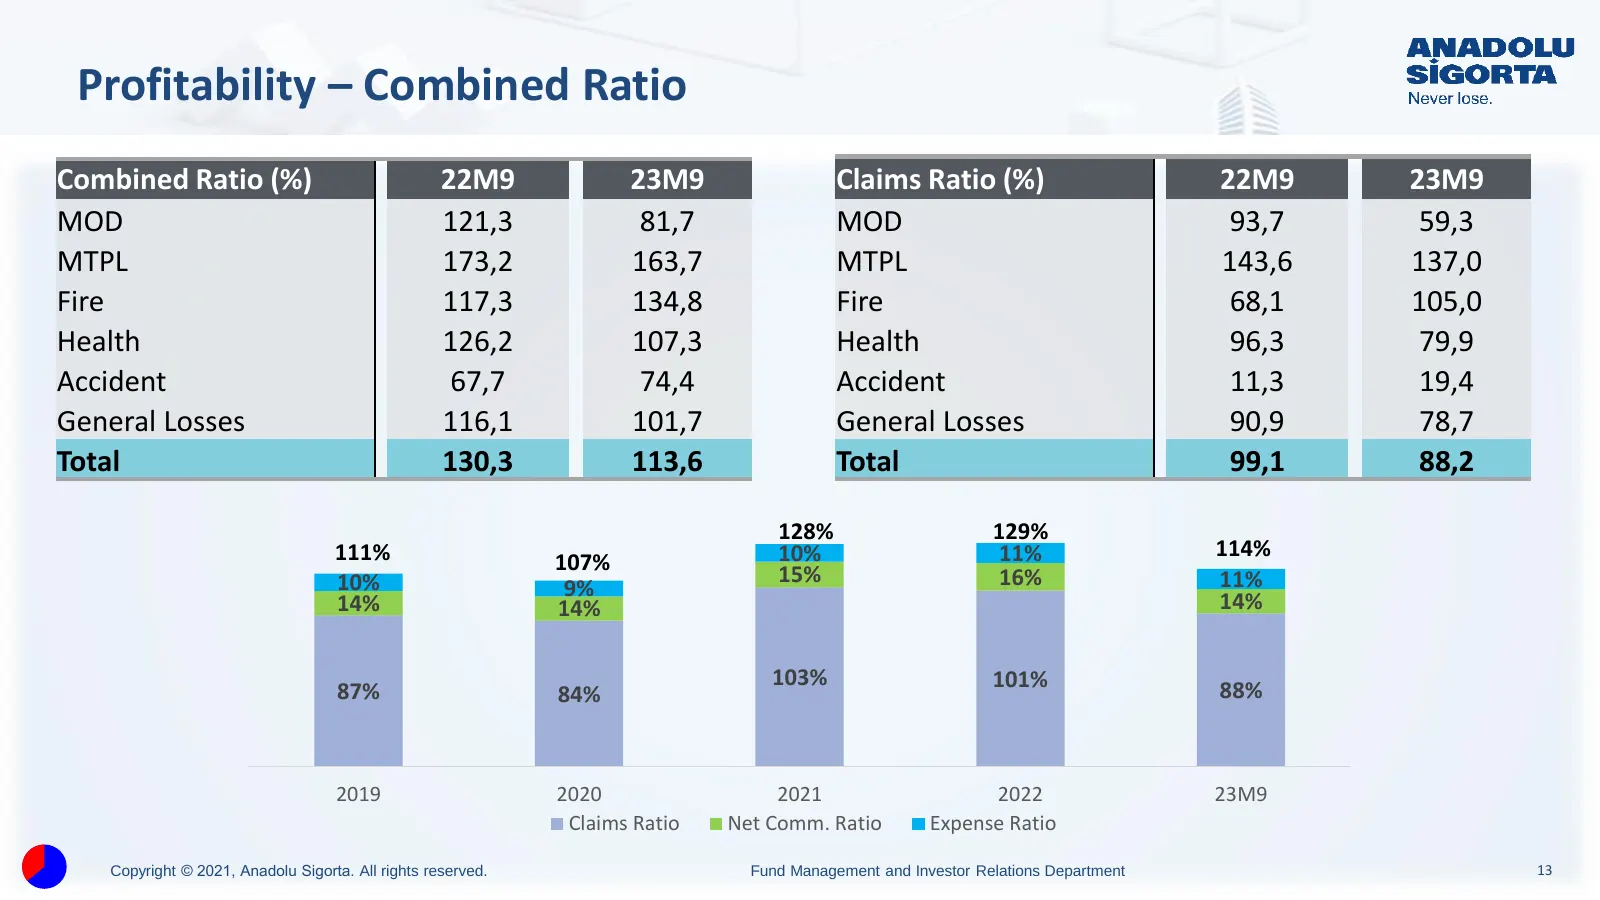
Slide 13: Profitability – Combined Ratio
Profitability – Combined Ratio Combined Ratio (%) 22M9 23M9 Claims Ratio (%) 22M9 23M9 MOD 121,3 81,7 MOD 93,7 59,3 MTPL 173,2 163,7 MTPL 143,6 137,0 Fire 117,3 134,8 Fire 68,1 105,0 Health 126,2 107,3 Health 96,3 79,9 Accident 67,7 74,4 Accident 11,3 19,4 General Losses 116,1 101,7 General Losses 9
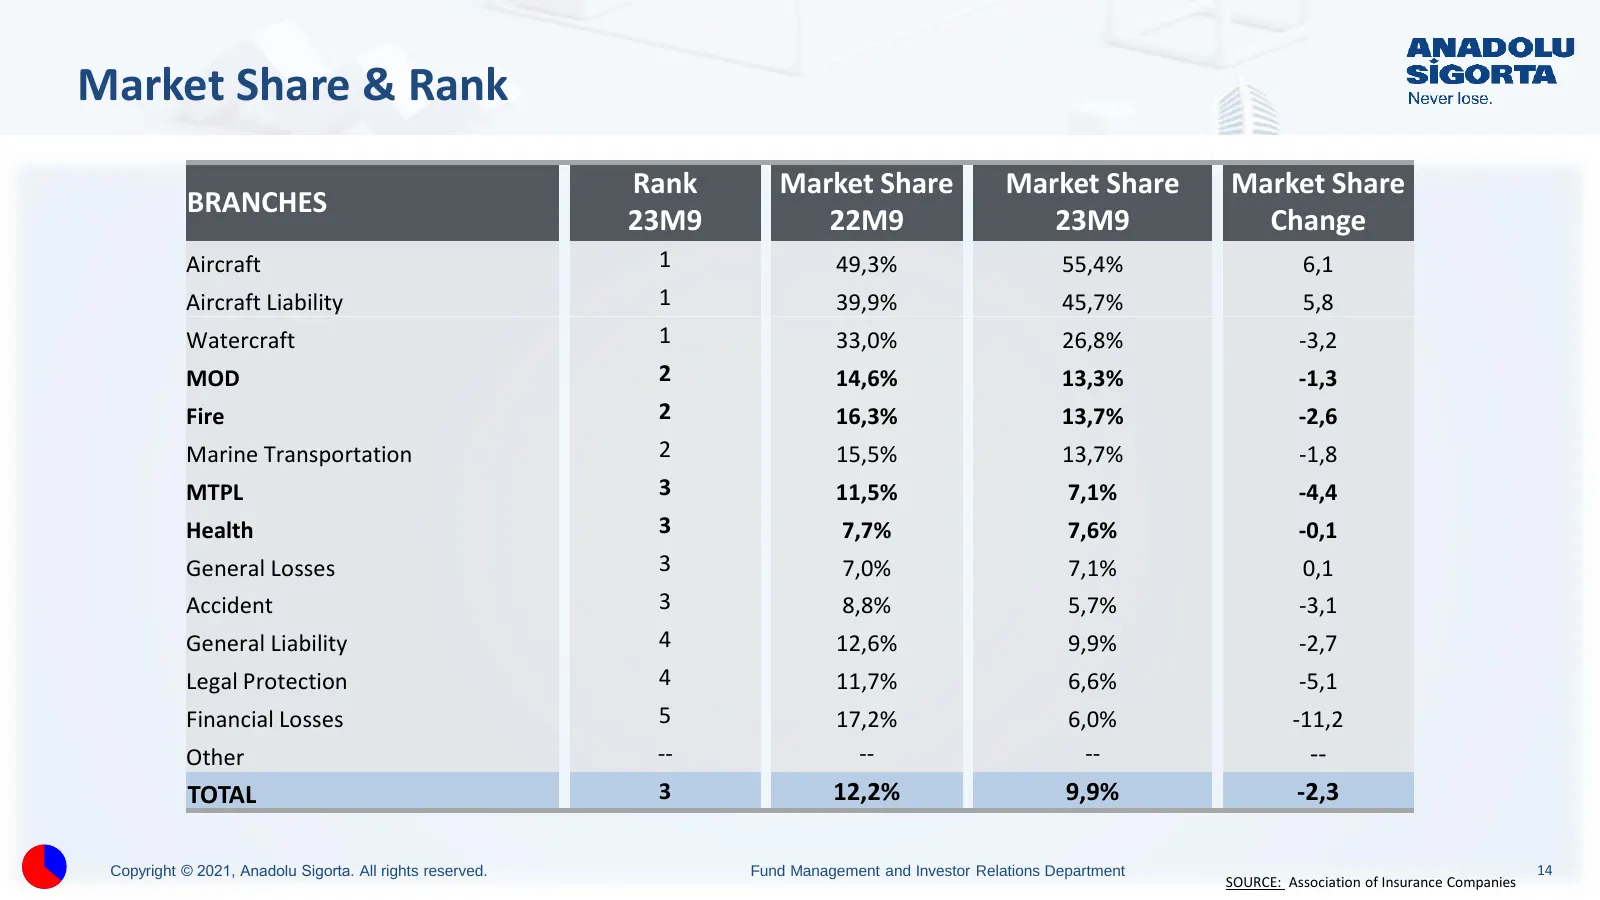
Slide 14: Market Share & Rank
Market Share & Rank Rank Market Share Market Share Market Share BRANCHES 23M9 22M9 23M9 Change Aircraft 1 49,3% 55,4% 6,1 Aircraft Liability 1 39,9% 45,7% 5,8 Watercraft 1 33,0% 26,8% -3,2 MOD 2 14,6% 13,3% -1,3 Fire 2 16,3% 13,7% -2,6 Marine Transportation 2 15,5% 13,7% -1,8 MTPL 3 11,5% 7,1% -4,4
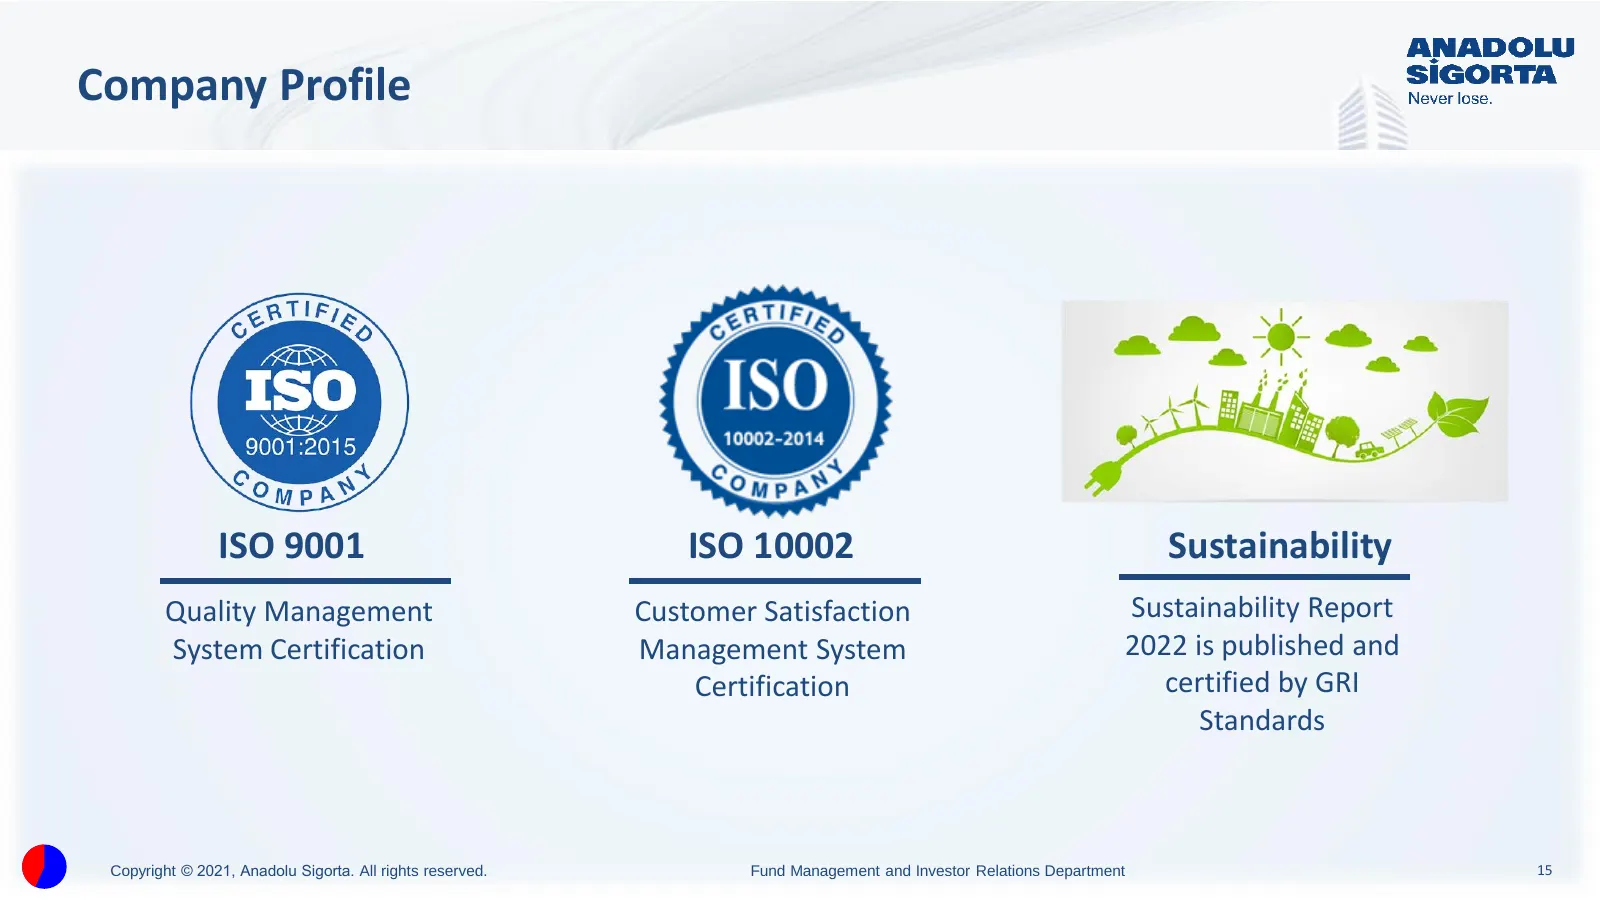
Slide 15: Company Profile
Company Profile ISO 9001 ISO 10002 Sustainability Quality Management Customer Satisfaction Sustainability Report System Certification Management System 2022 is published and Certification certified by GRI Standards Copyright © 2021, Anadolu Sigorta. All rights reserved. Fund Management and Investor
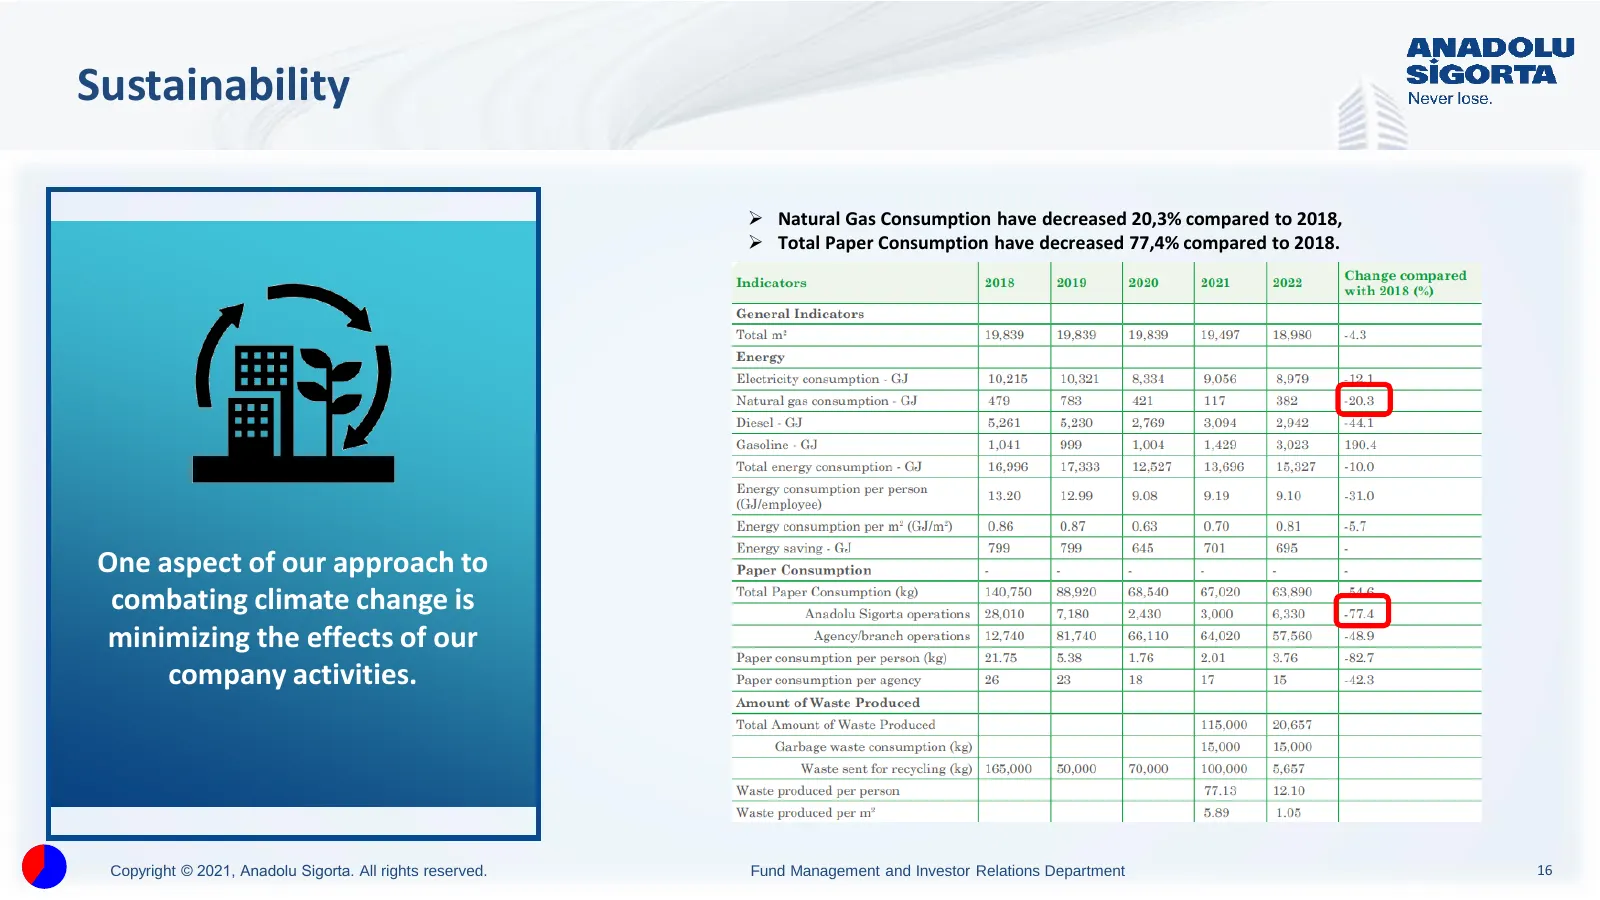
Slide 16: Sustainability
Sustainability ➢ Natural Gas Consumption have decreased 20,3% compared to 2018, ➢ Total Paper Consumption have decreased 77,4% compared to 2018. One aspect of our approach to combating climate change is minimizing the effects of our company activities. Copyright © 2021, Anadolu Sigorta. All rights r
Slide 17: Sustainability
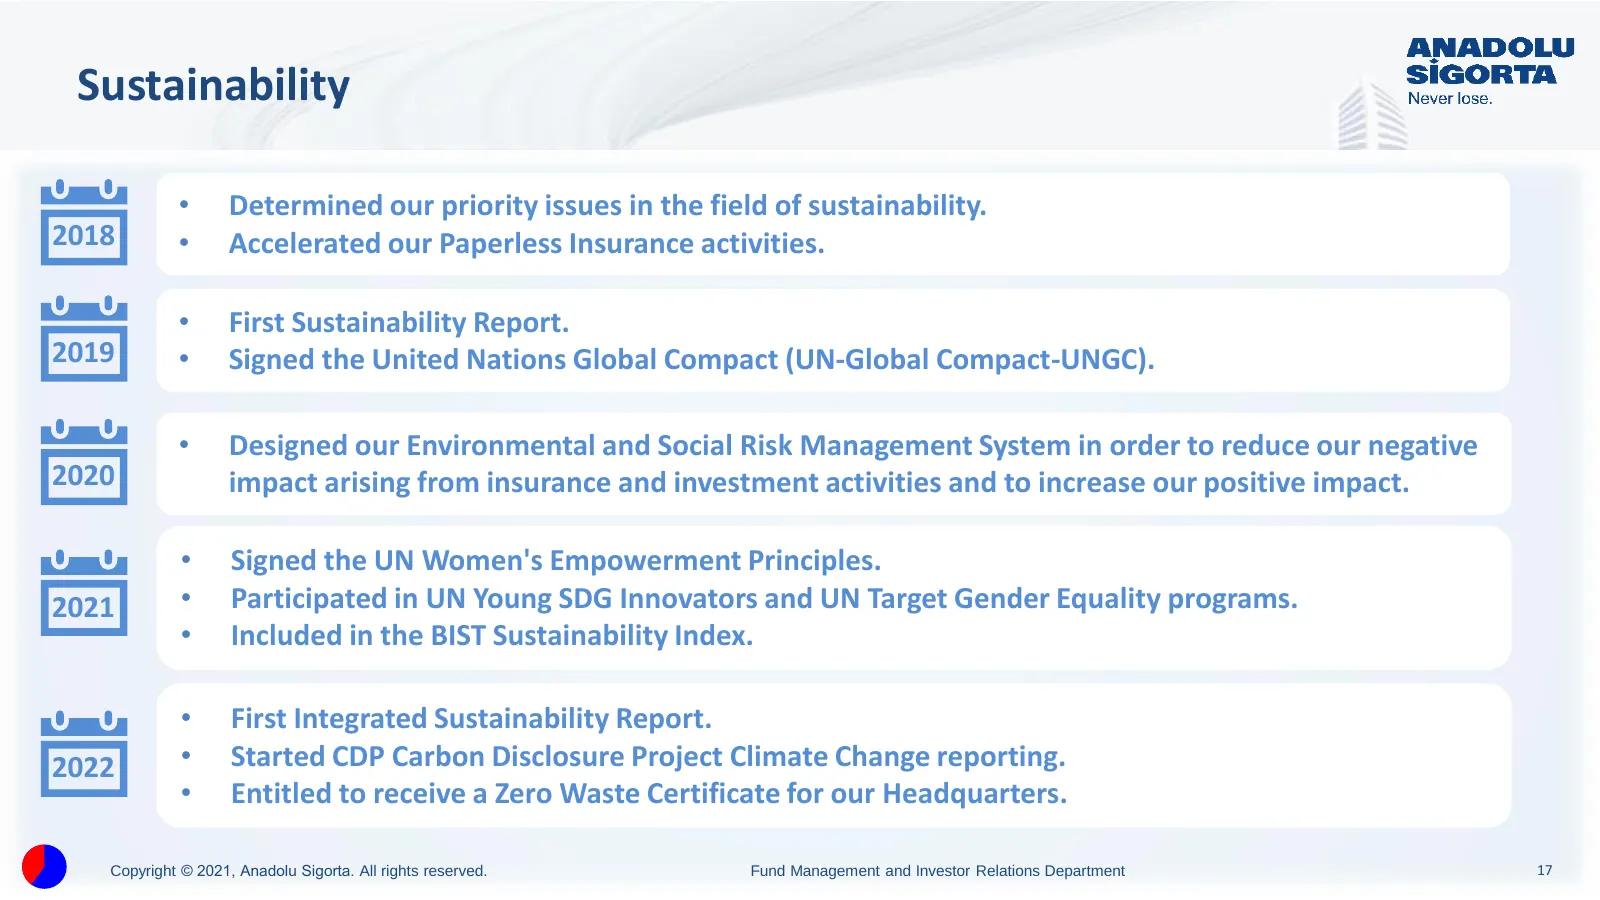
Sustainability • Determined our priority issues in the field of sustainability. 2018 • Accelerated our Paperless Insurance activities. • First Sustainability Report. 2019 • Signed the United Nations Global Compact (UN-Global Compact-UNGC). • Designed our Environmental and Social Risk Management Syst
Slide 18: Company Ratings
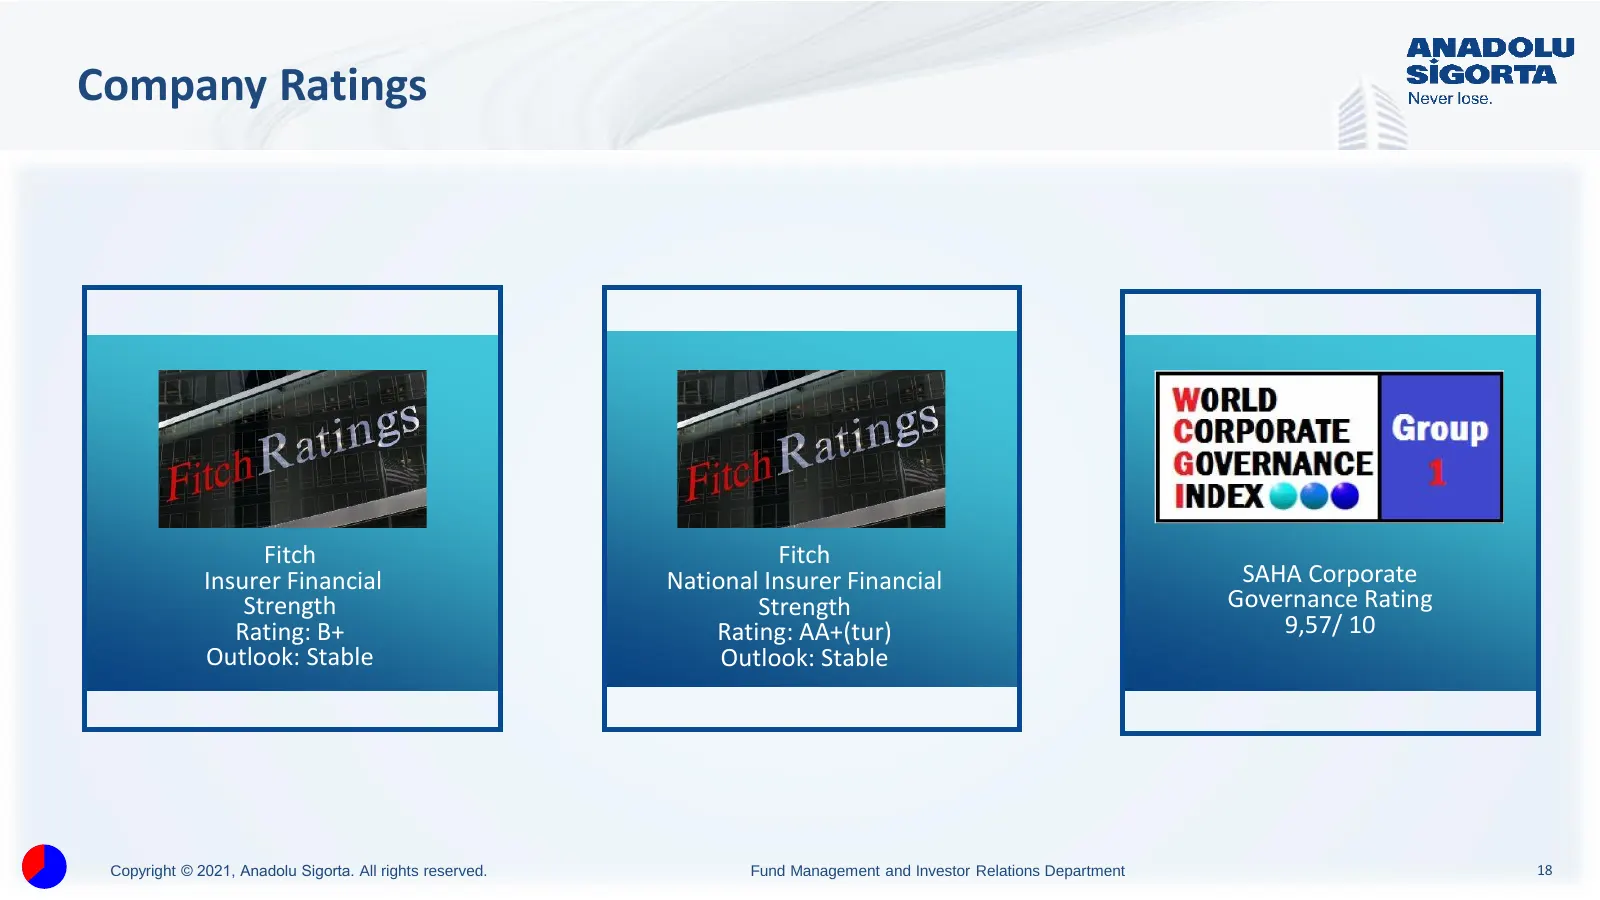
Company Ratings Fitch Fitch Insurer Financial National Insurer Financial SAHA Corporate Strength Strength Governance Rating Rating: B+ Rating: AA+(tur) 9,57/ 10 Outlook: Stable Outlook: Stable Copyright © 2021, Anadolu Sigorta. All rights reserved. Fund Management and Investor Relations Department 1
Slide 19: Shareholder Structure – 2023 Q3
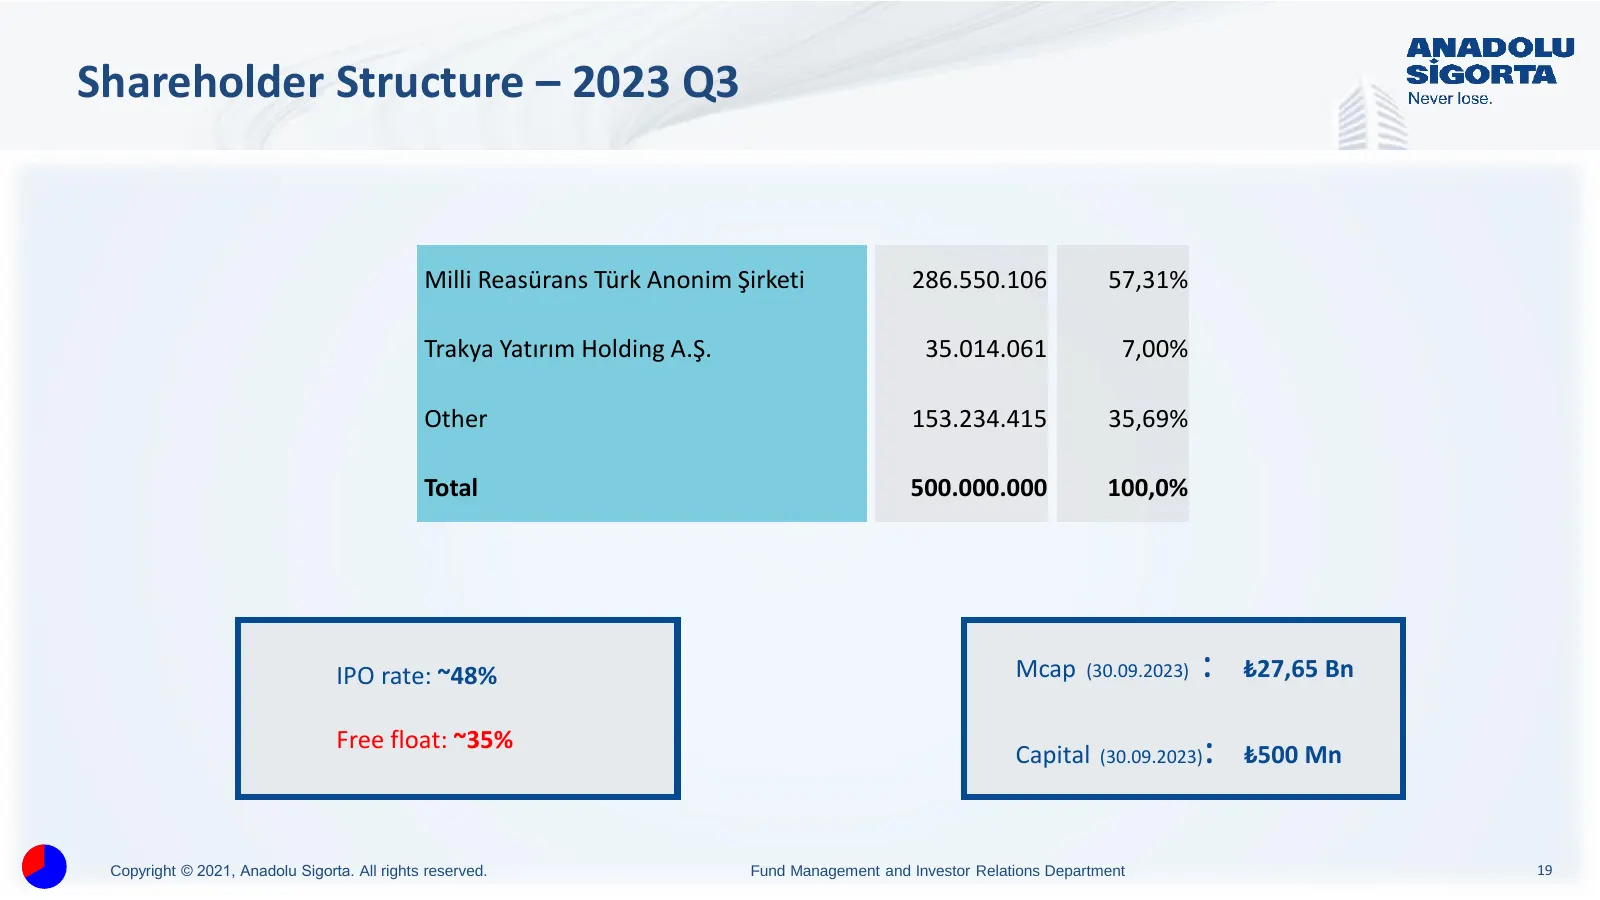
Shareholder Structure – 2023 Q3 Milli Reasürans Türk Anonim Şirketi 286.550.106 57,31% Trakya Yatırım Holding A.Ş. 35.014.061 7,00% Other 153.234.415 35,69% Total 500.000.000 100,0% IPO rate: ~48% Mcap (30.09.2023) : ₺27,65 Bn Free float: ~35% Capital (30.09.2023) : ₺500 Mn Copyright © 2021, Anadolu
Slide 20: Financial Highlights
Financial Highlights Copyright © 2021, Anadolu Sigorta. All rights reserved. Fund Management and Investor Relations Department 20
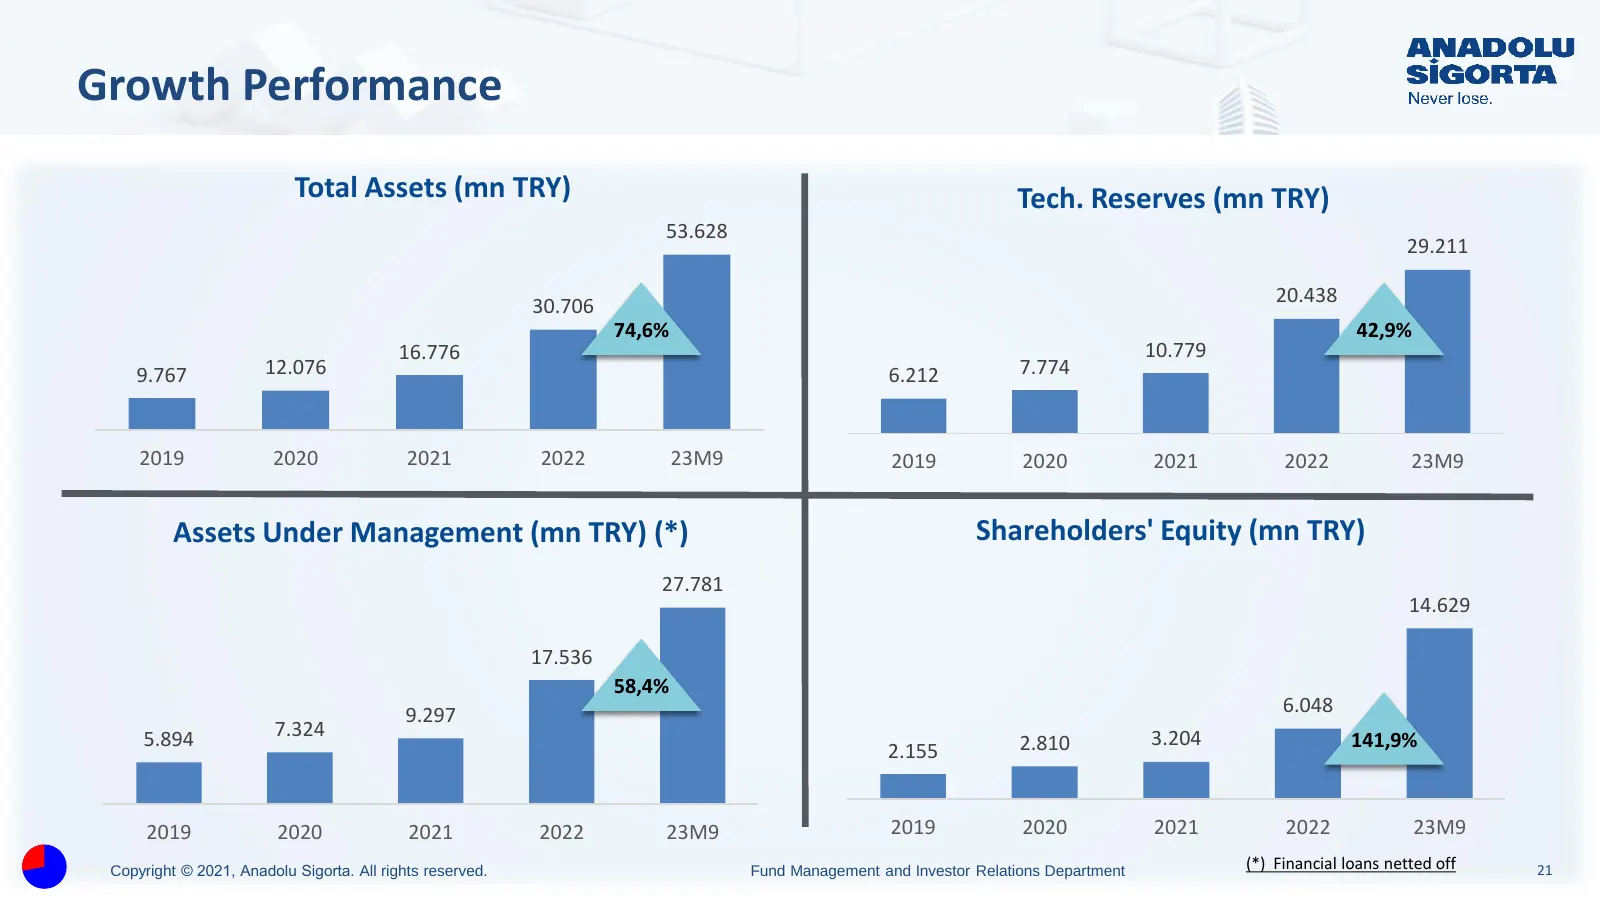
Slide 21: Growth Performance
Growth Performance Total Assets (mn TRY) Tech. Reserves (mn TRY) 53.628 29.211 30.706 20.438 74,6% 42,9% 16.776 10.779 9.767 12.076 6.212 7.774 2019 2020 2021 2022 23M9 2019 2020 2021 2022 23M9 Assets Under Management (mn TRY) (*) Shareholders' Equity (mn TRY) 27.781 14.629 17.536 58,4% 9.297 6.048
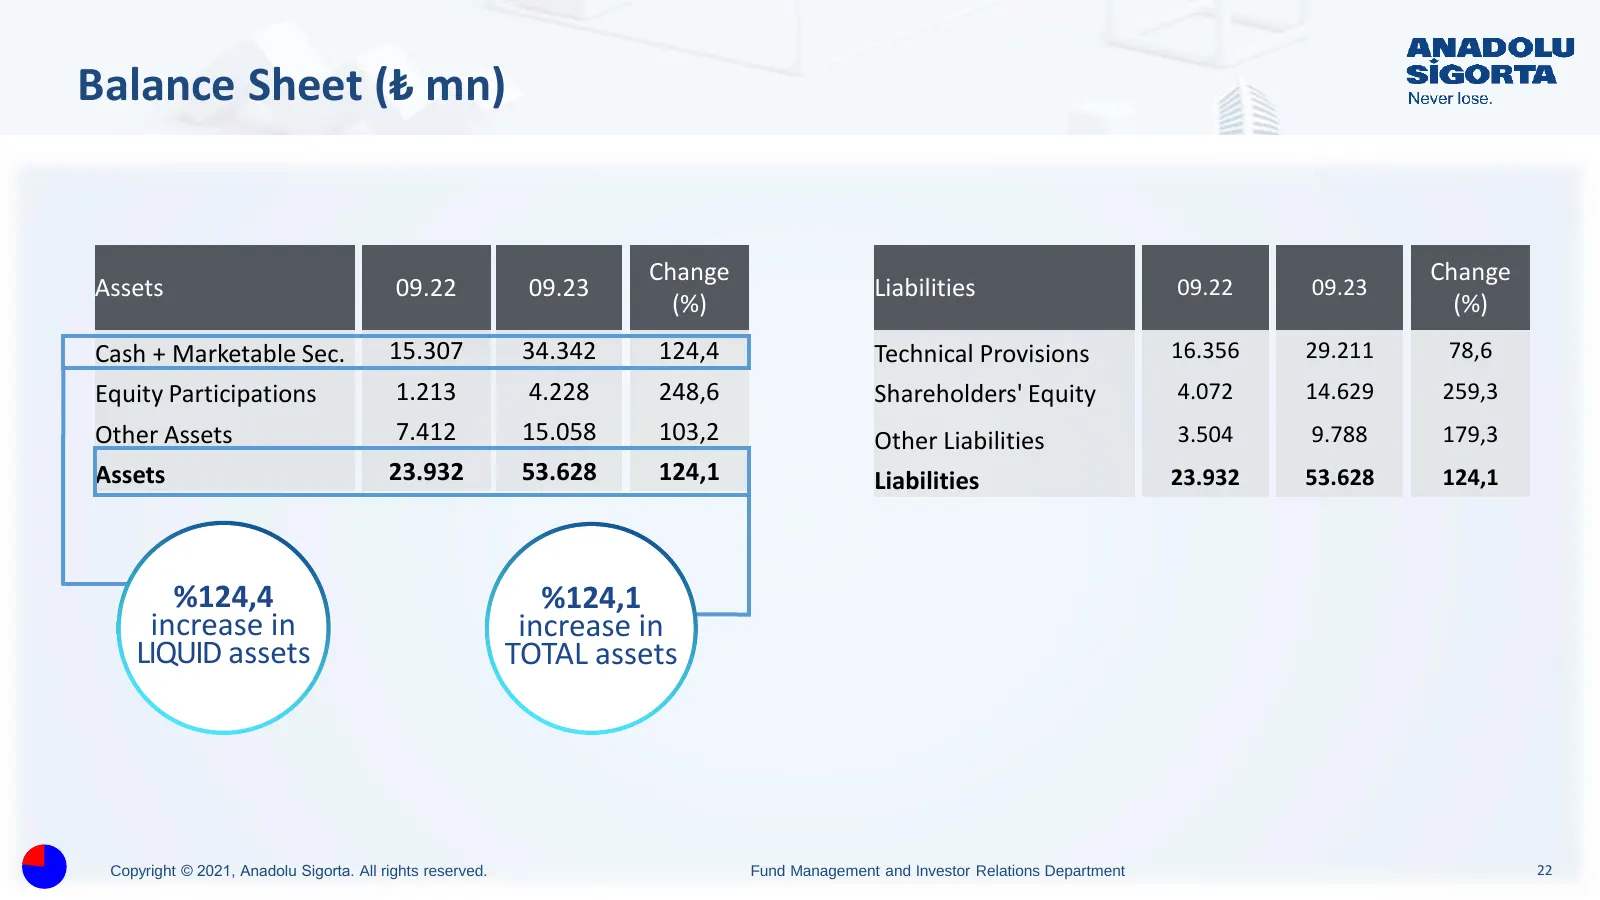
Slide 22: Balance Sheet (₺ mn)
Balance Sheet (₺ mn) Change Change Assets 09.22 09.23 Liabilities 09.22 09.23 (%) (%) Cash + Marketable Sec. 15.307 34.342 124,4 Technical Provisions 16.356 29.211 78,6 Equity Participations 1.213 4.228 248,6 Shareholders' Equity 4.072 14.629 259,3 Other Assets 7.412 15.058 103,2 Other Liabilities 3
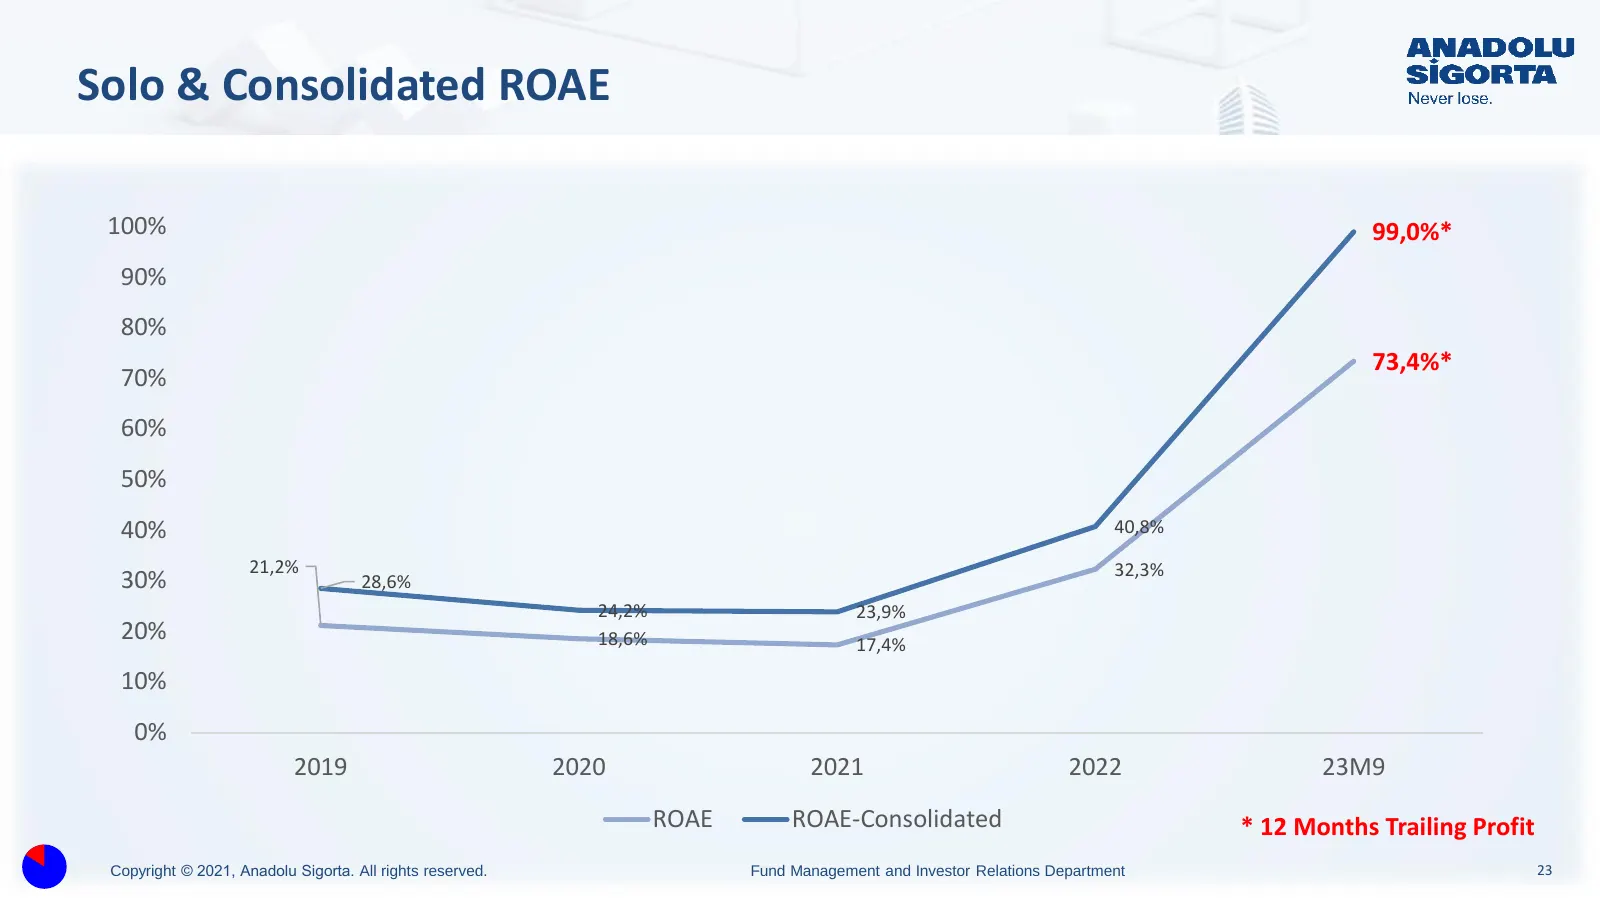
Slide 23: Solo & Consolidated ROAE
Solo & Consolidated ROAE 100% 99,0%* 90% 80% 73,4%* 70% 60% 50% 40% 40,8% 21,2% 32,3% 30% 28,6% 24,2% 23,9% 20% 18,6% 17,4% 10% 0% 2019 2020 2021 2022 23M9 ROAE ROAE-Consolidated * 12 Months Trailing Profit Copyright © 2021, Anadolu Sigorta. All rights reserved. Fund Management and Investor Relation
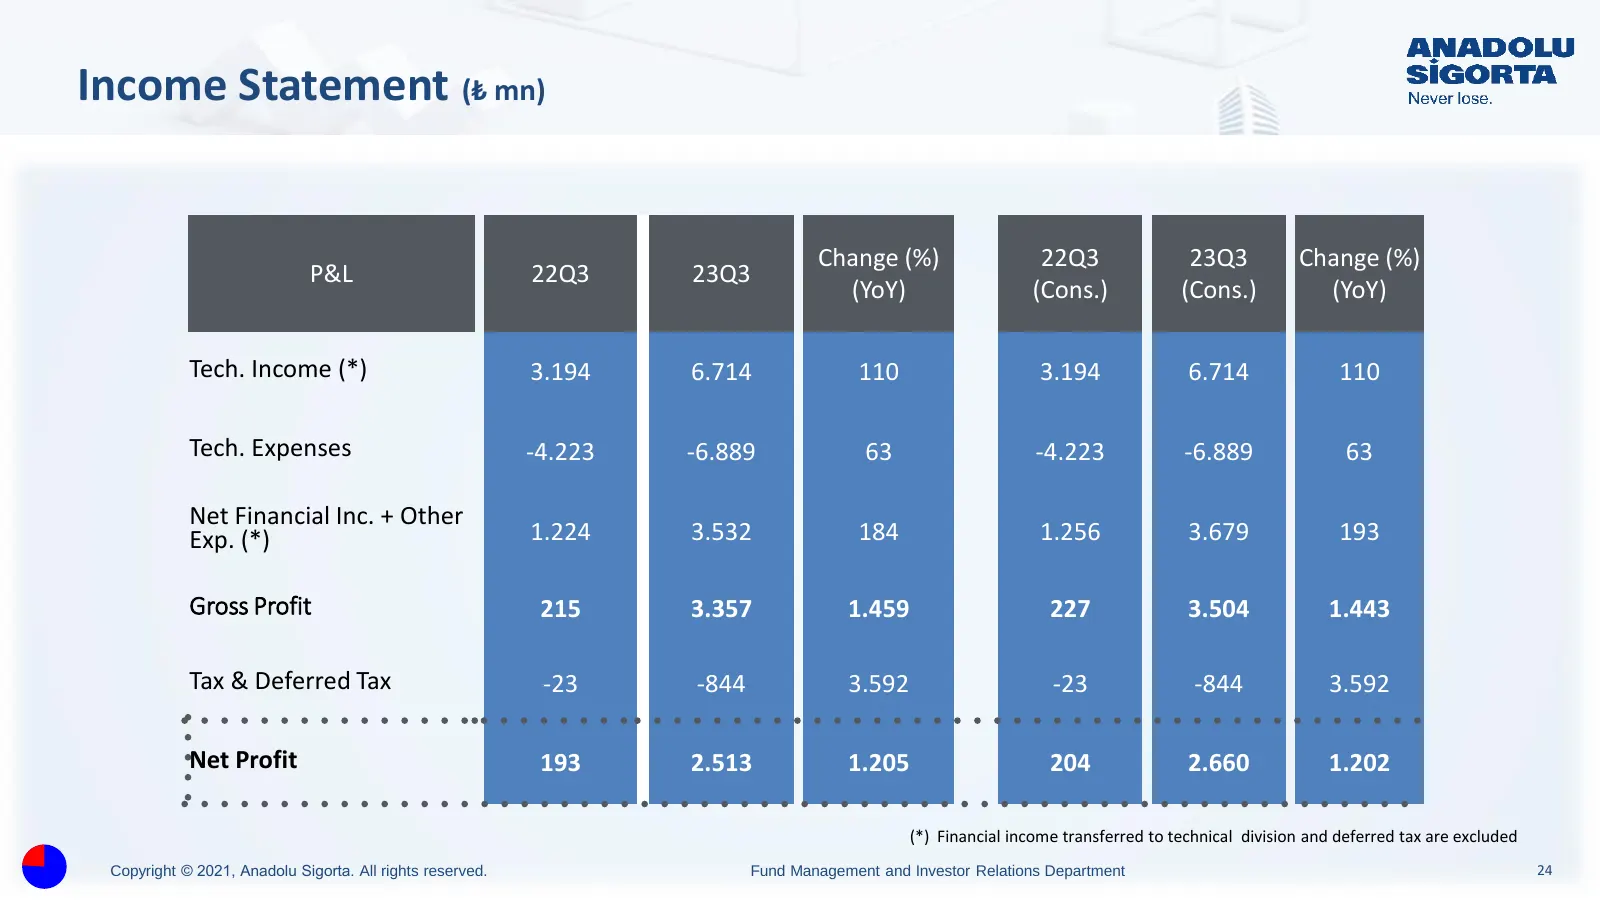
Slide 24: Income Statement (₺ mn)
Income Statement (₺ mn) Change (%) 22Q3 23Q3 Change (%) P&L 22Q3 23Q3 (YoY) (Cons.) (Cons.) (YoY) Tech. Income (*) 3.194 6.714 110 3.194 6.714 110 Tech. Expenses -4.223 -6.889 63 -4.223 -6.889 63 Net Financial Inc. + Other Exp. (*) 1.224 3.532 184 1.256 3.679 193 Gross Profit 215 3.357 1.459 227 3.5
Slide 25: Investment Portfolio
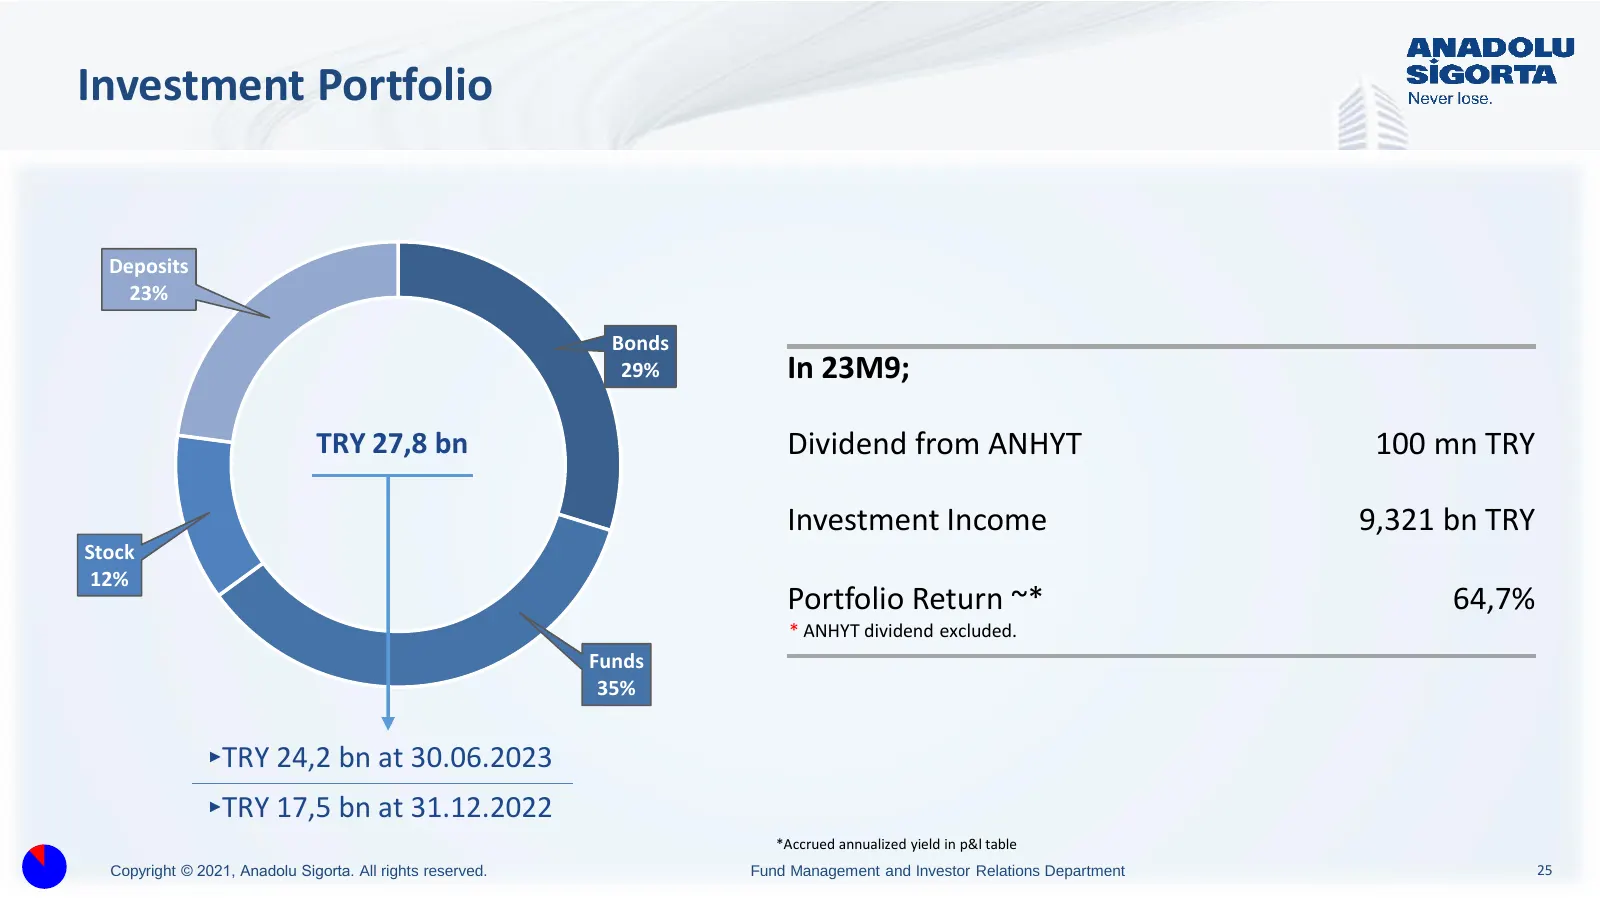
Investment Portfolio Deposits 23% Bonds 29% In 23M9; TRY 27,8 bn Dividend from ANHYT 100 mn TRY Investment Income 9,321 bn TRY Stock 12% Portfolio Return ~* 64,7% * ANHYT dividend excluded. Funds 35% ‣TRY 24,2 bn at 30.06.2023 ‣TRY 17,5 bn at 31.12.2022 *Accrued annualized yield in p&l table Copyrig
Slide 26: Investment Portfolio Breakdown
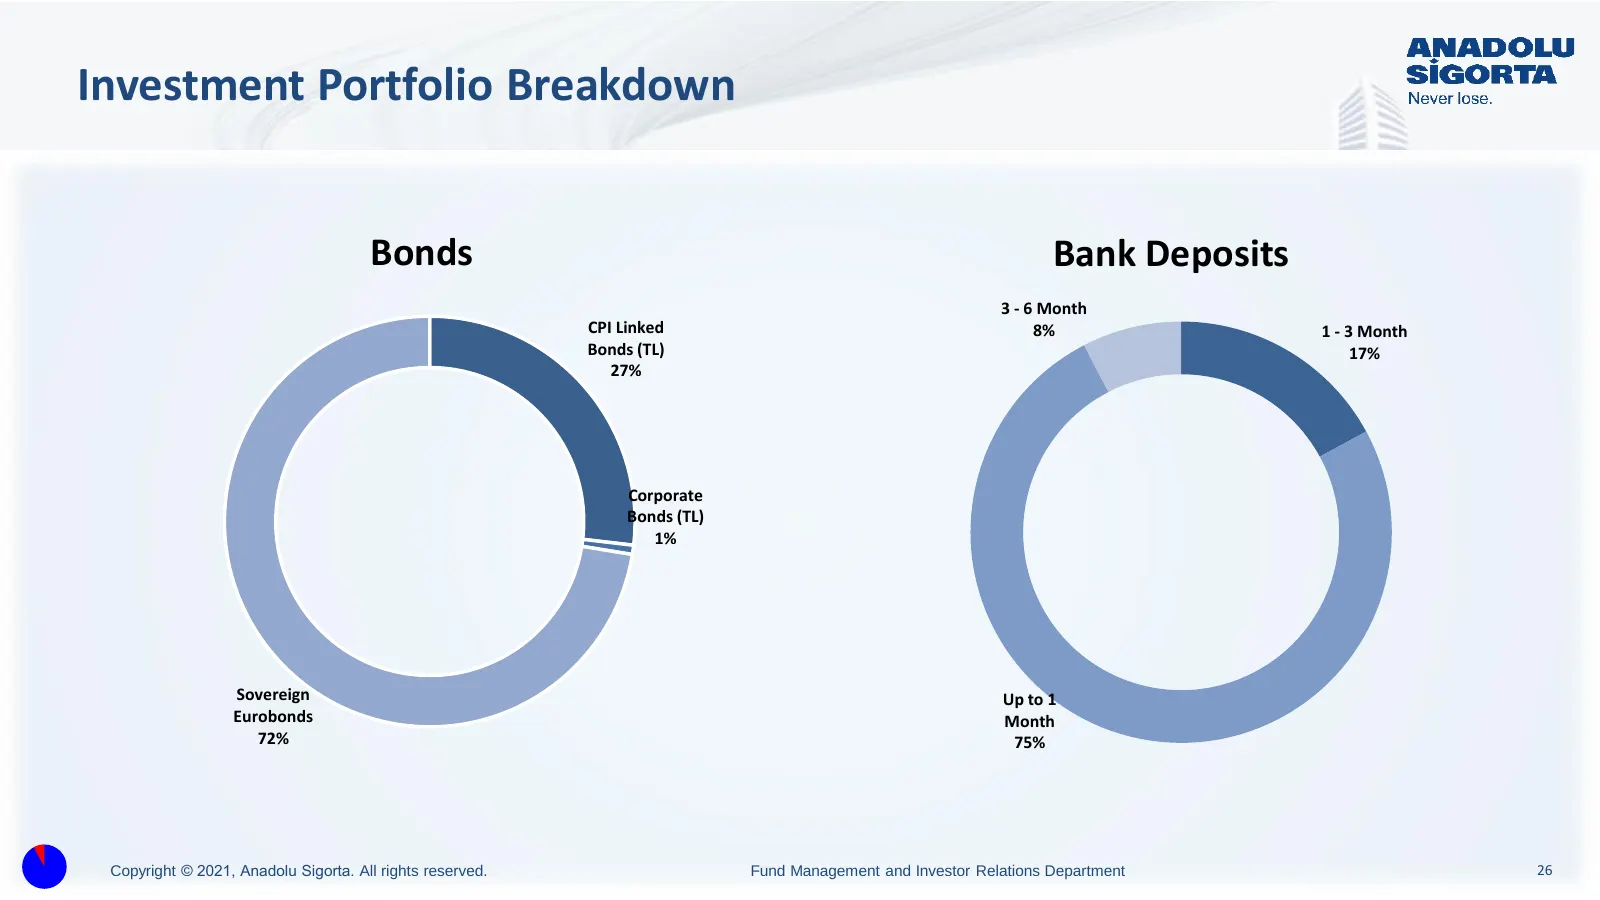
Investment Portfolio Breakdown Bonds Bank Deposits 3 - 6 Month CPI Linked 8% 1 - 3 Month Bonds (TL) 17% 27% Corporate Bonds (TL) 1% Sovereign Up to 1 Eurobonds Month 72% 75% Copyright © 2021, Anadolu Sigorta. All rights reserved. Fund Management and Investor Relations Department 26
Slide 27: Disclaimer Statement
Disclaimer Statement This presentation contains forward-looking statements and information on the business development of Anadolu Sigorta. These statements may be spoken or written and can be recognized by terms such as “expects”, “anticipates”, “intends”, “plans”, “seeks” or words with similar mean
Slide 28: Thanks
THANKS Copyright © 2021, Anadolu Sigorta. All rights reserved. Fund Management and Investor Relations Department 28
Source: company website
More decks from Anadolu Anonim Turk Sigorta Sirketi A.S.
 Q2 2026 Earnings Presentation16 slides · July 2026
 Anadolu Sigorta — FY2025 Earnings Presentation16 slides · January 2026
 Anadolu Sigorta — Q1 2026 Earnings Presentation15 slides · 2026
 Anadolu Sigorta — FY2025 Earnings Presentation26 slides · January 2026
 Anadolu Sigorta — Q2 2025 Earnings Presentation17 slides · Aug 5, 2025
 Anadolu Sigorta — Q1 2025 Earnings Presentation16 slides · Apr 29, 2025