Transat A.T. Inc. · TSX:TRZ
Transat A.T — Q1 2020 Earnings Presentation
30 slides from Transat A.T's earnings presentation, March 2020

Slide 1: Results for first quarter 2020
Results for first quarter 2020 Adjusted net loss cut by half; Outlook overshadowed by COVID-19 TRANSACTION WITH AIR CANADA: The transaction is expected to be completed in mid-2020 subject to regulatory approvals and other closing conditions usual in this type of transaction INVESTOR’S PRESENTATION M
Slide 2: Forward-looking statements / Non-IFRS financial measures
Forward-looking statements / Non-IFRS financial measures This presentation contains certain forward-looking statements regarding the Corporation's expectation that travel reservations will follow the trends. In making these statements, the Corporation has assumed that the trends in reservations and
Slide 3: Table of contents
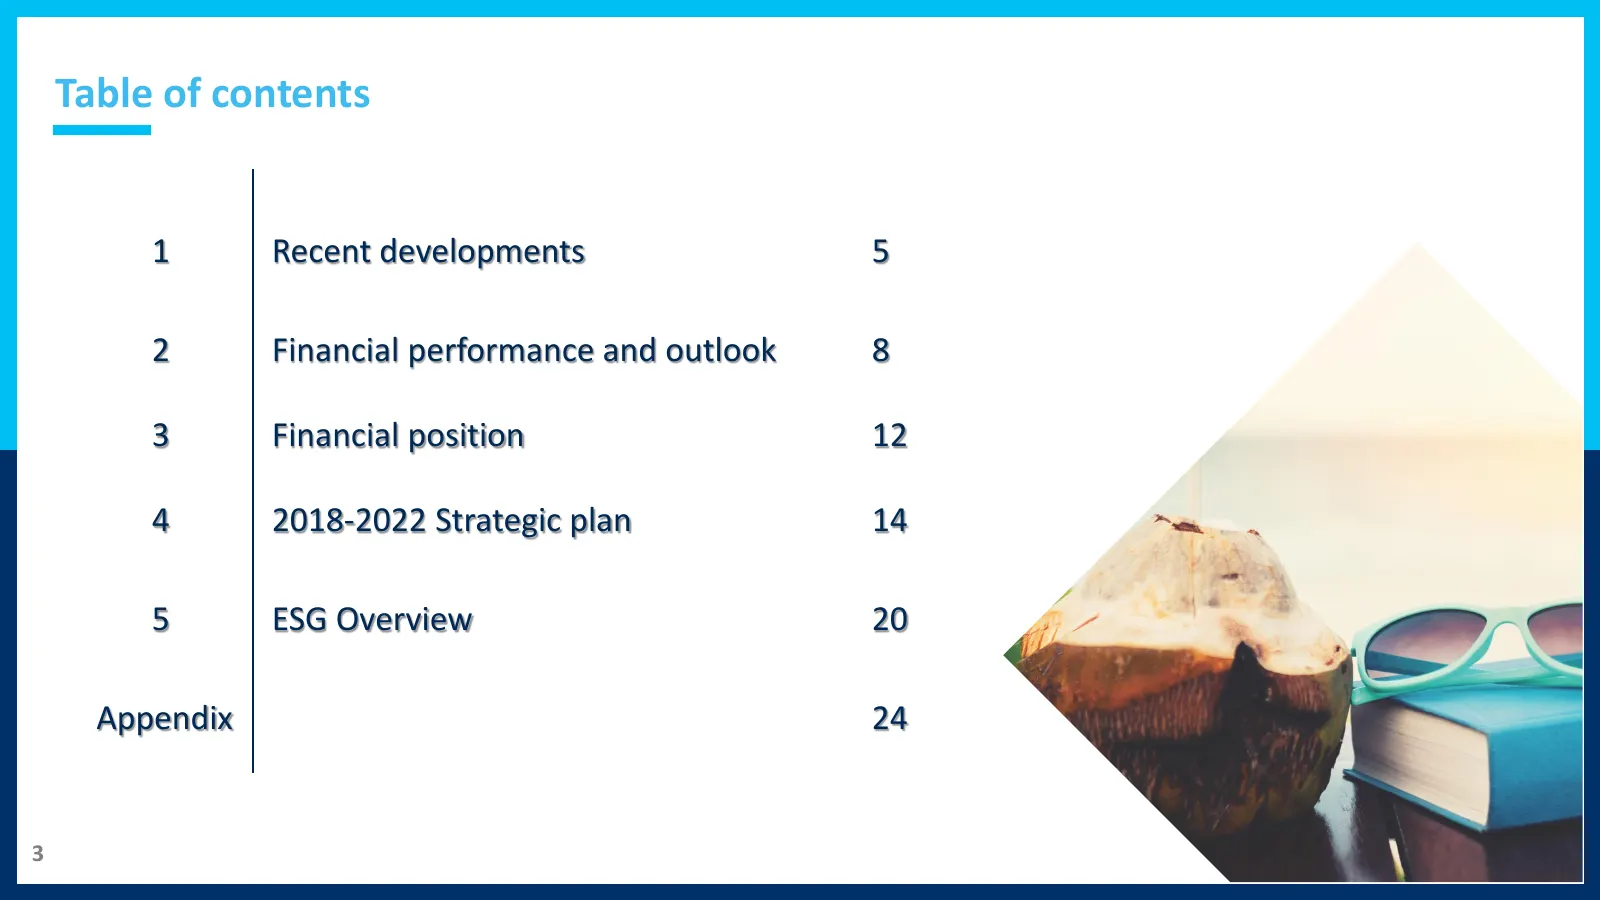
Table of contents 1 Recent developments 5 2 Financial performance and outlook 8 3 Financial position 12 4 2018-2022 Strategic plan 14 5 ESG Overview 20 Appendix 24 3
Slide 4: Recent Developments
Recent Developments
Slide 5: Transaction with Air Canada – Key dates
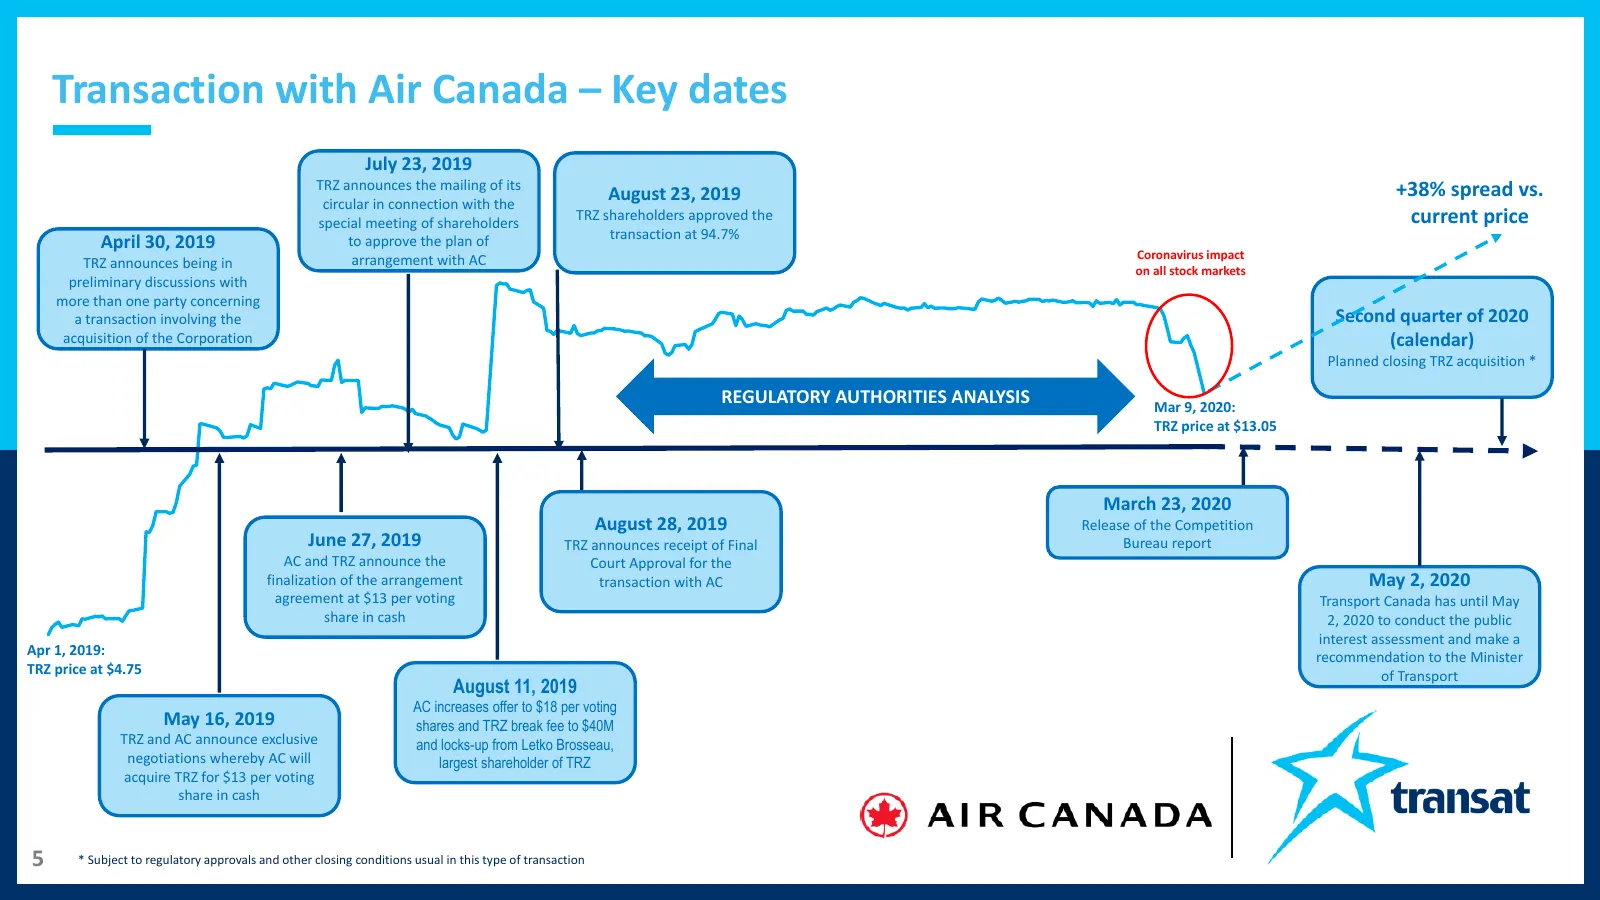
Transaction with Air Canada – Key dates July 23, 2019 TRZ announces the mailing of its +38% spread vs. circular in connection with the August 23, 2019 special meeting of shareholders TRZ shareholders approved the current price transaction at 94.7% April 30, 2019 to approve the plan of arrangement wi
Slide 6: Growing our integrated business model
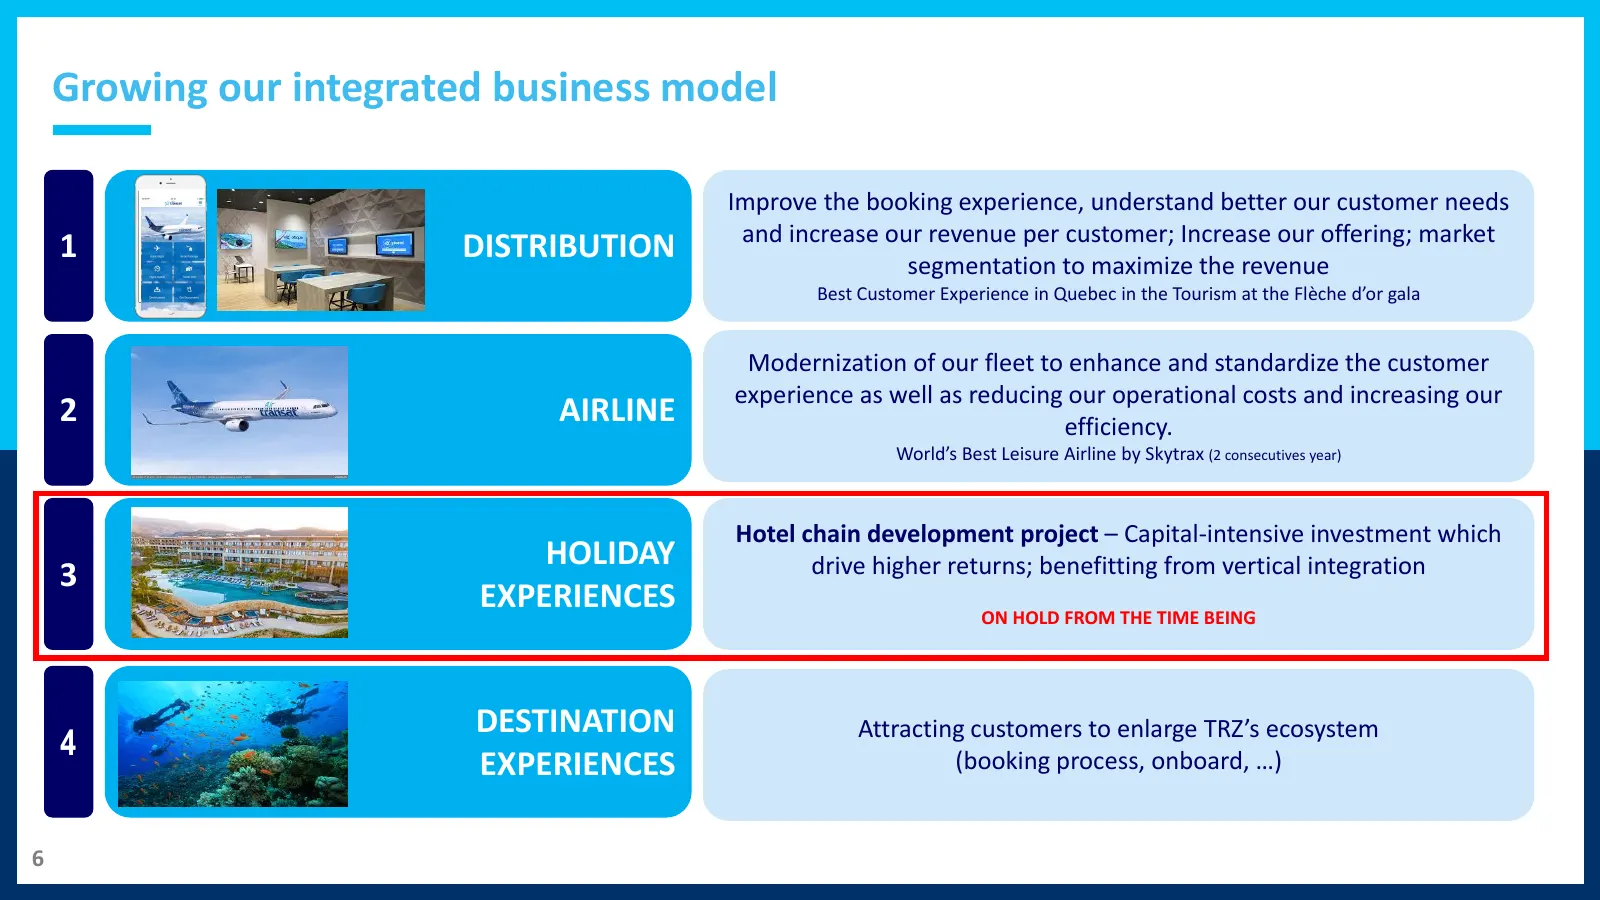
Growing our integrated business model Improve the booking experience, understand better our customer needs and increase our revenue per customer; Increase our offering; market 1 DISTRIBUTION segmentation to maximize the revenue Best Customer Experience in Quebec in the Tourism at the Flèche d’or gal
Slide 7: Financial Performance & Outlook
Financial Performance & Outlook
Slide 8: Sun destinations capacity breakdown, Winter 2019-20
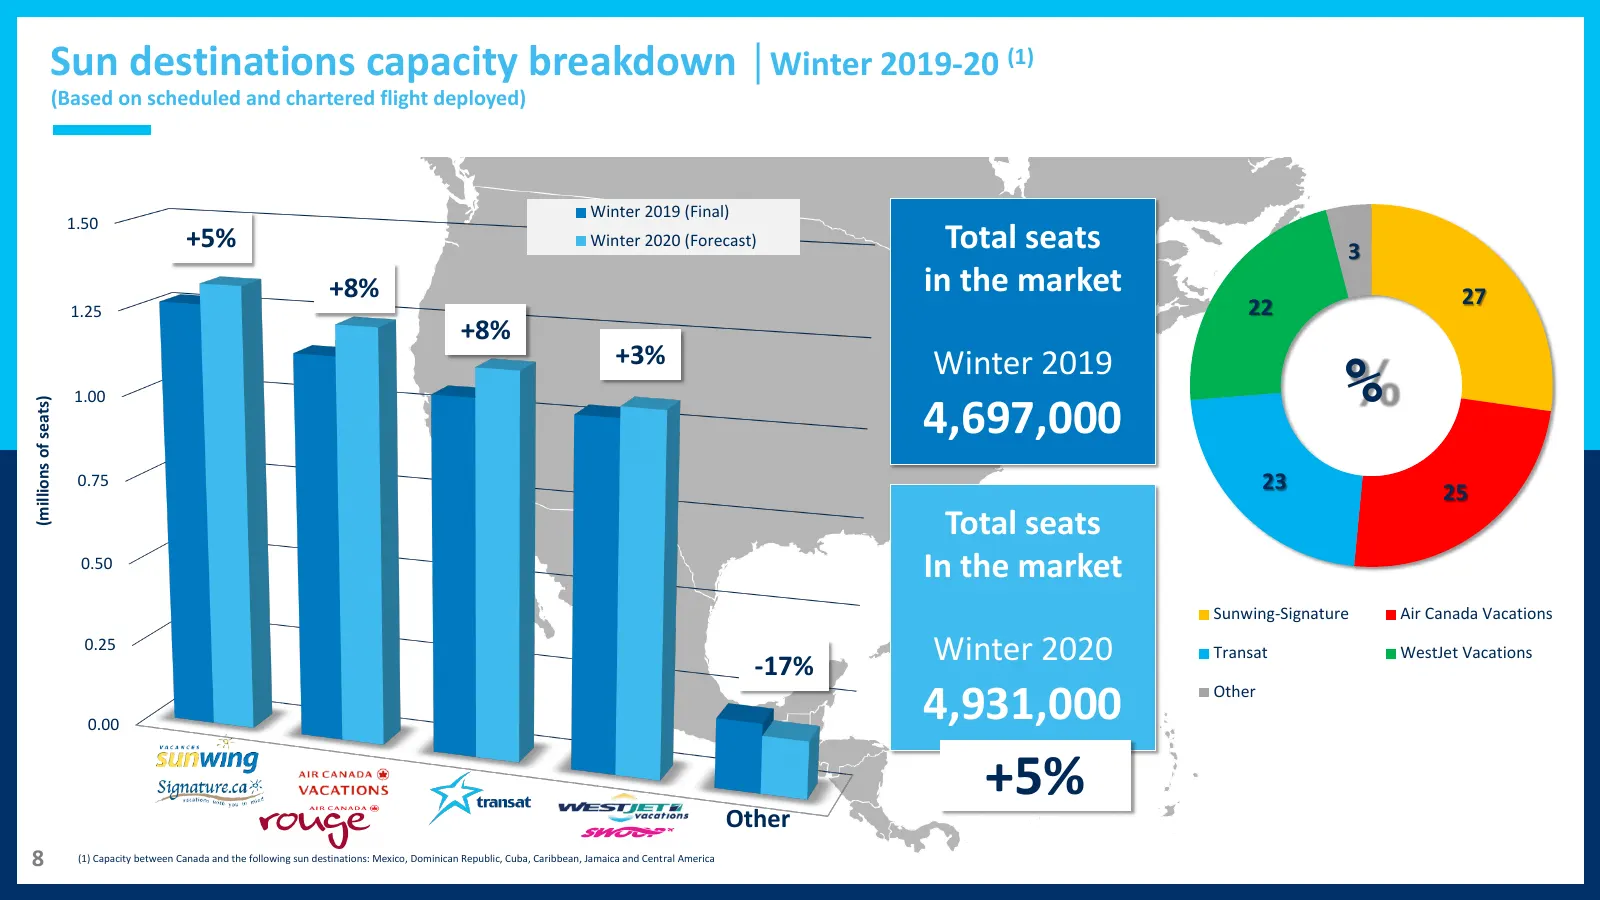
Sun destinations capacity breakdown │Winter 2019-20 (1) (Based on scheduled and chartered flight deployed) Winter 2019 (Final) 1.50 +5% Winter 2020 (Forecast) Total seats 3 +8% in the market 27 1.25 22 +8% +3% Winter 2019 1.00 % (millions of seats) 4,697,000 0.75 23 25 Total seats 0.50 In the market
Slide 9: First quarter financial performance
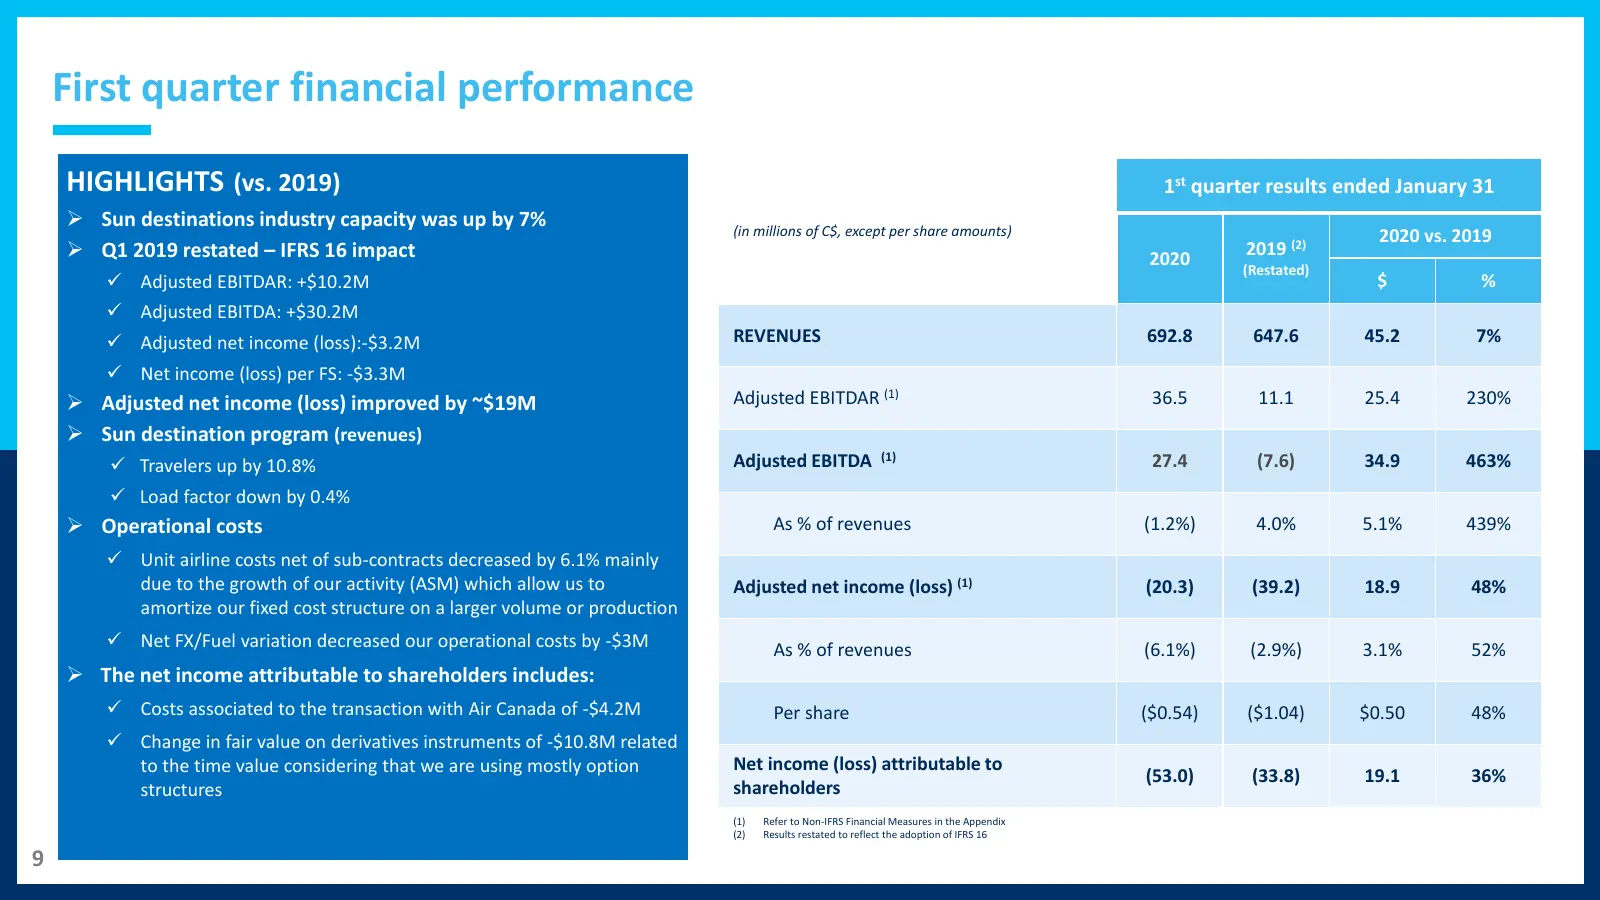
First quarter financial performance HIGHLIGHTS (vs. 2019) 1st quarter results ended January 31 ➢ Sun destinations industry capacity was up by 7% (in millions of C$, except per share amounts) 2020 vs. 2019 ➢ Q1 2019 restated – IFRS 16 impact 2020 2019 (2) (Restated) ✓ Adjusted EBITDAR: +$10.2M $ % ✓
Slide 10: Outlook – Current bookings
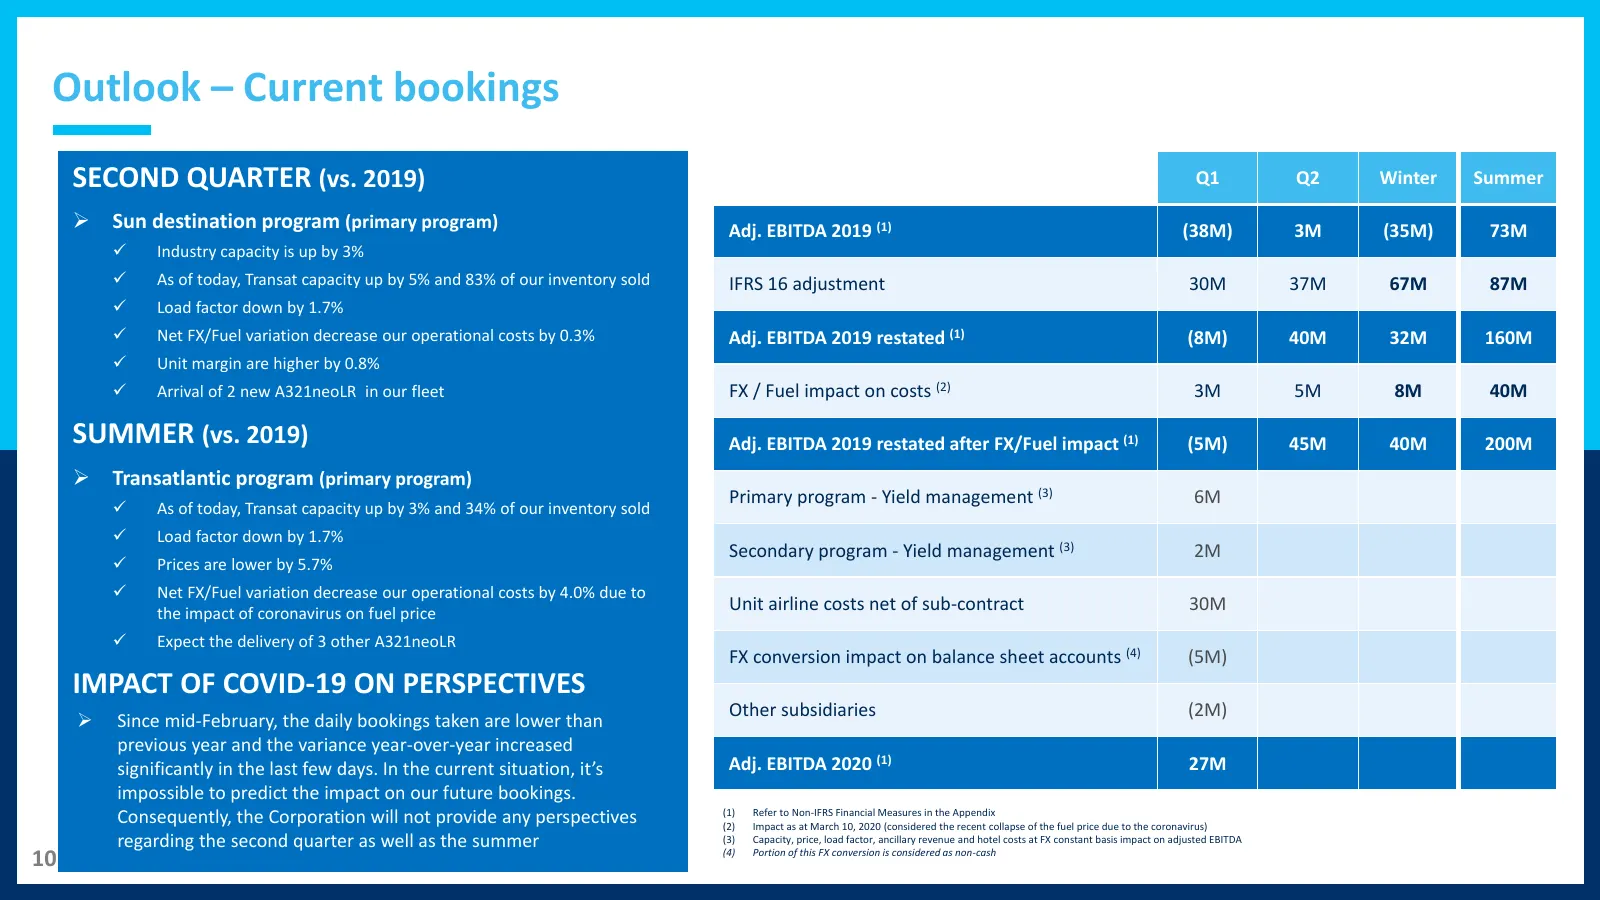
Outlook – Current bookings SECOND QUARTER (vs. 2019) Q1 Q2 Winter Summer ➢ Sun destination program (primary program) Adj. EBITDA 2019 (1) (38M) 3M (35M) 73M ✓ Industry capacity is up by 3% ✓ As of today, Transat capacity up by 5% and 83% of our inventory sold IFRS 16 adjustment 30M 37M 67M 87M ✓ Loa
Slide 11: Financial Position
Financial Position
Slide 12: Current financial position
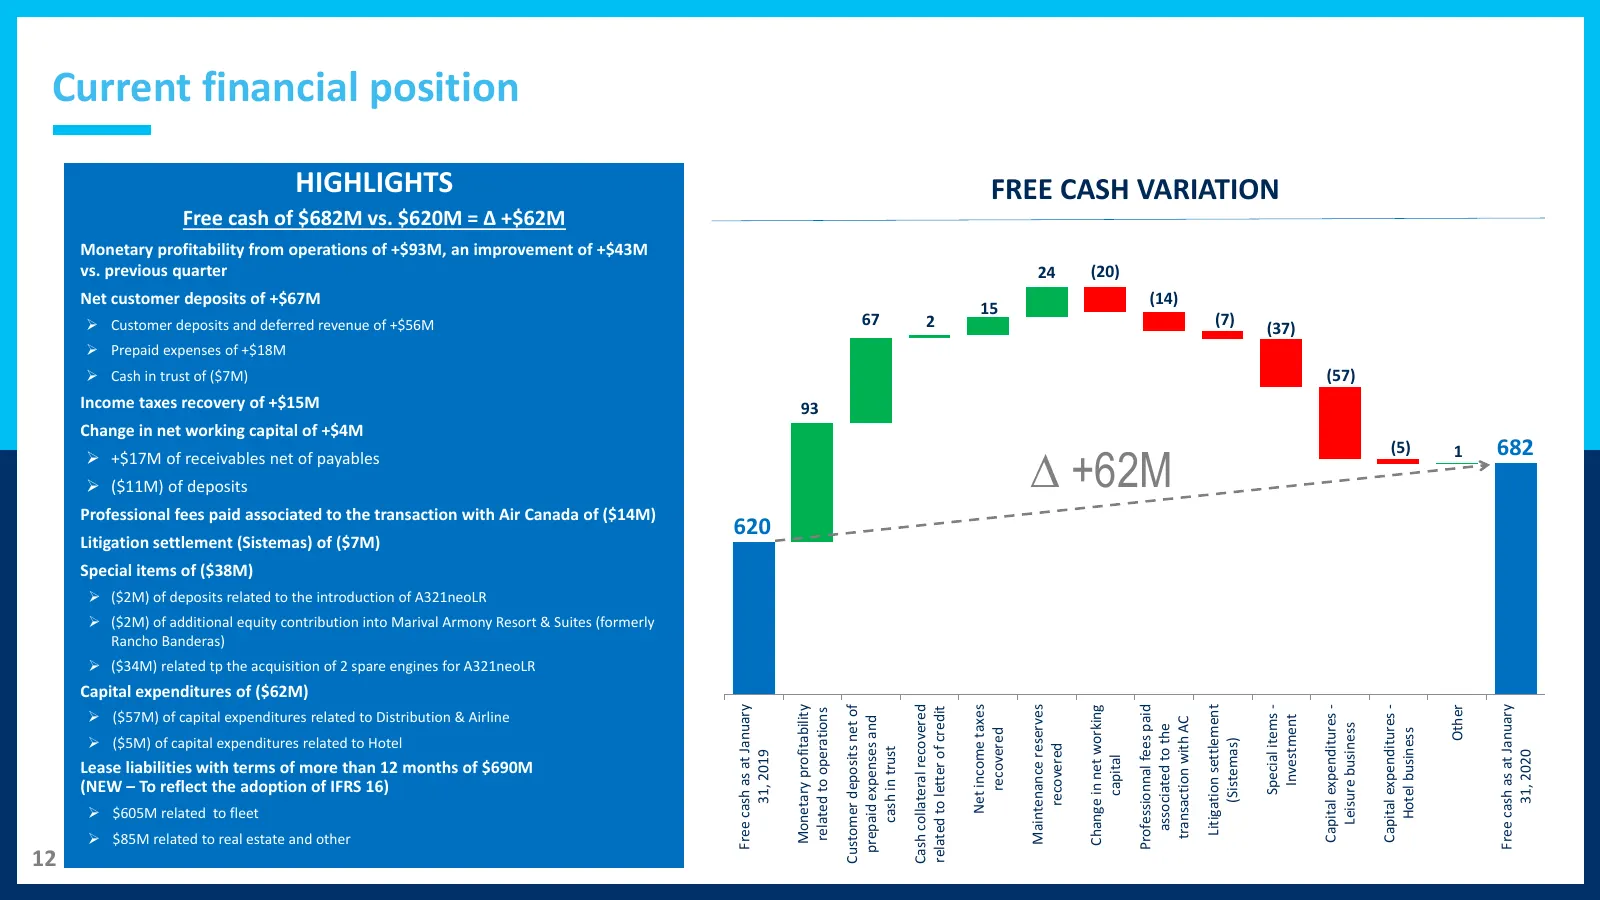
Current financial position HIGHLIGHTS FREE CASH VARIATION Free cash of $682M vs. $620M = ∆ +$62M Monetary profitability from operations of +$93M, an improvement of +$43M vs. previous quarter 24 (20) Net customer deposits of +$67M (14) 15 ➢ Customer deposits and deferred revenue of +$56M 67 2 (7) (37
Slide 13: 2018-2022 Strategic Plan
2018-2022 Strategic Plan
Slide 14: Distribution & Airline: cost-reduction and margin-improvement initiatives
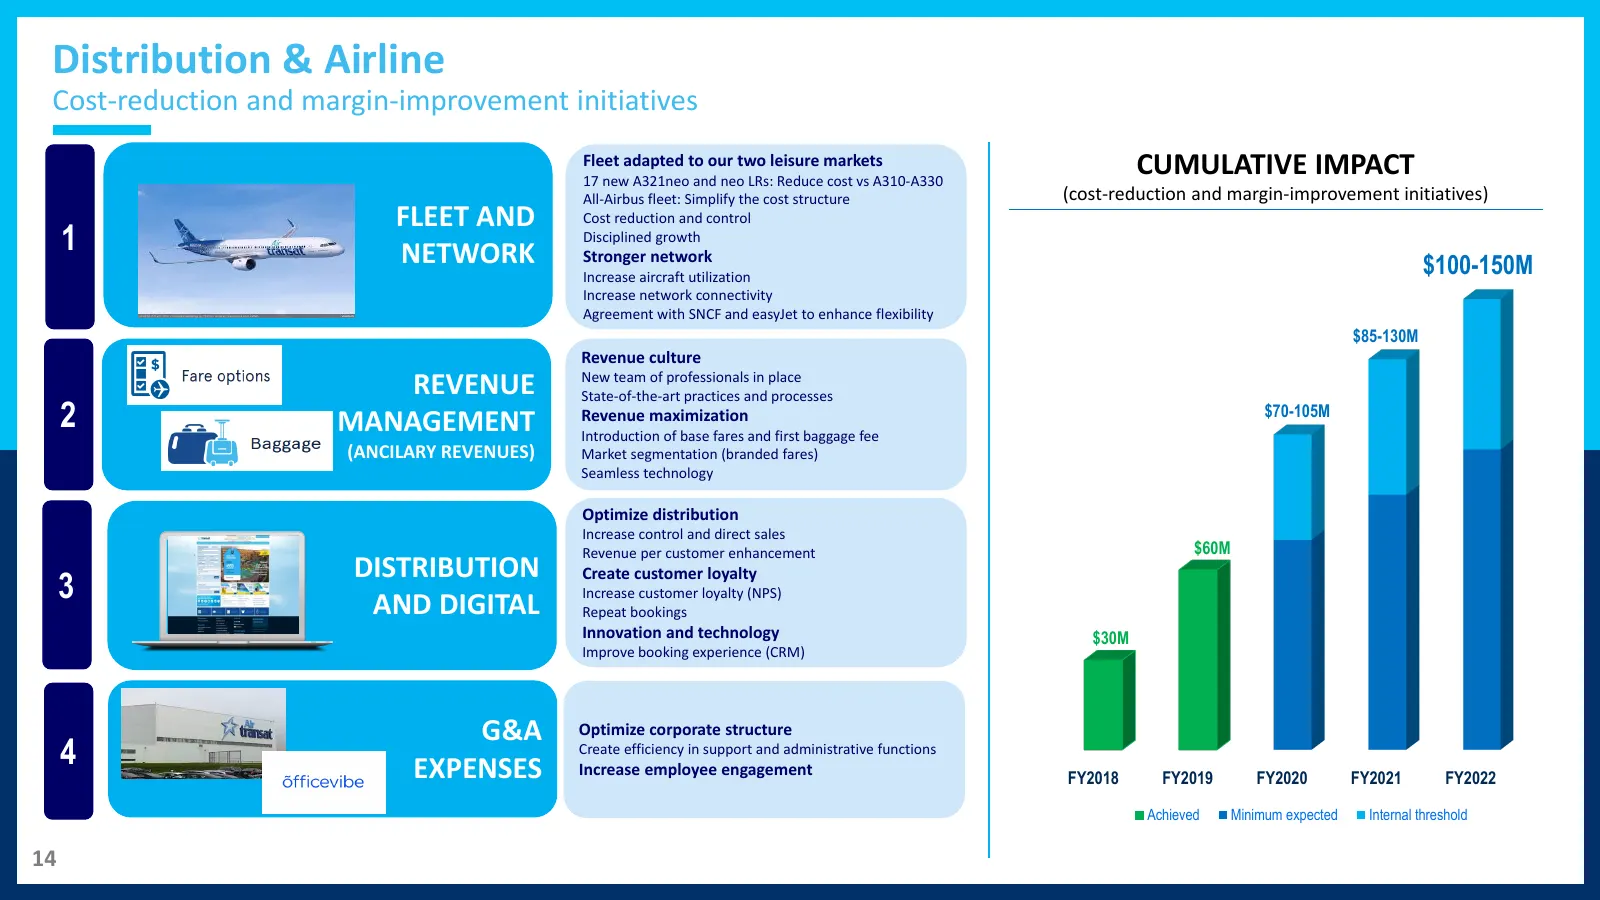
Distribution & Airline Cost-reduction and margin-improvement initiatives Fleet adapted to our two leisure markets 17 new A321neo and neo LRs: Reduce cost vs A310-A330 CUMULATIVE IMPACT All-Airbus fleet: Simplify the cost structure (cost-reduction and margin-improvement initiatives) FLEET AND Cost re
Slide 15: Distribution & Airline: Fleet and network optimization
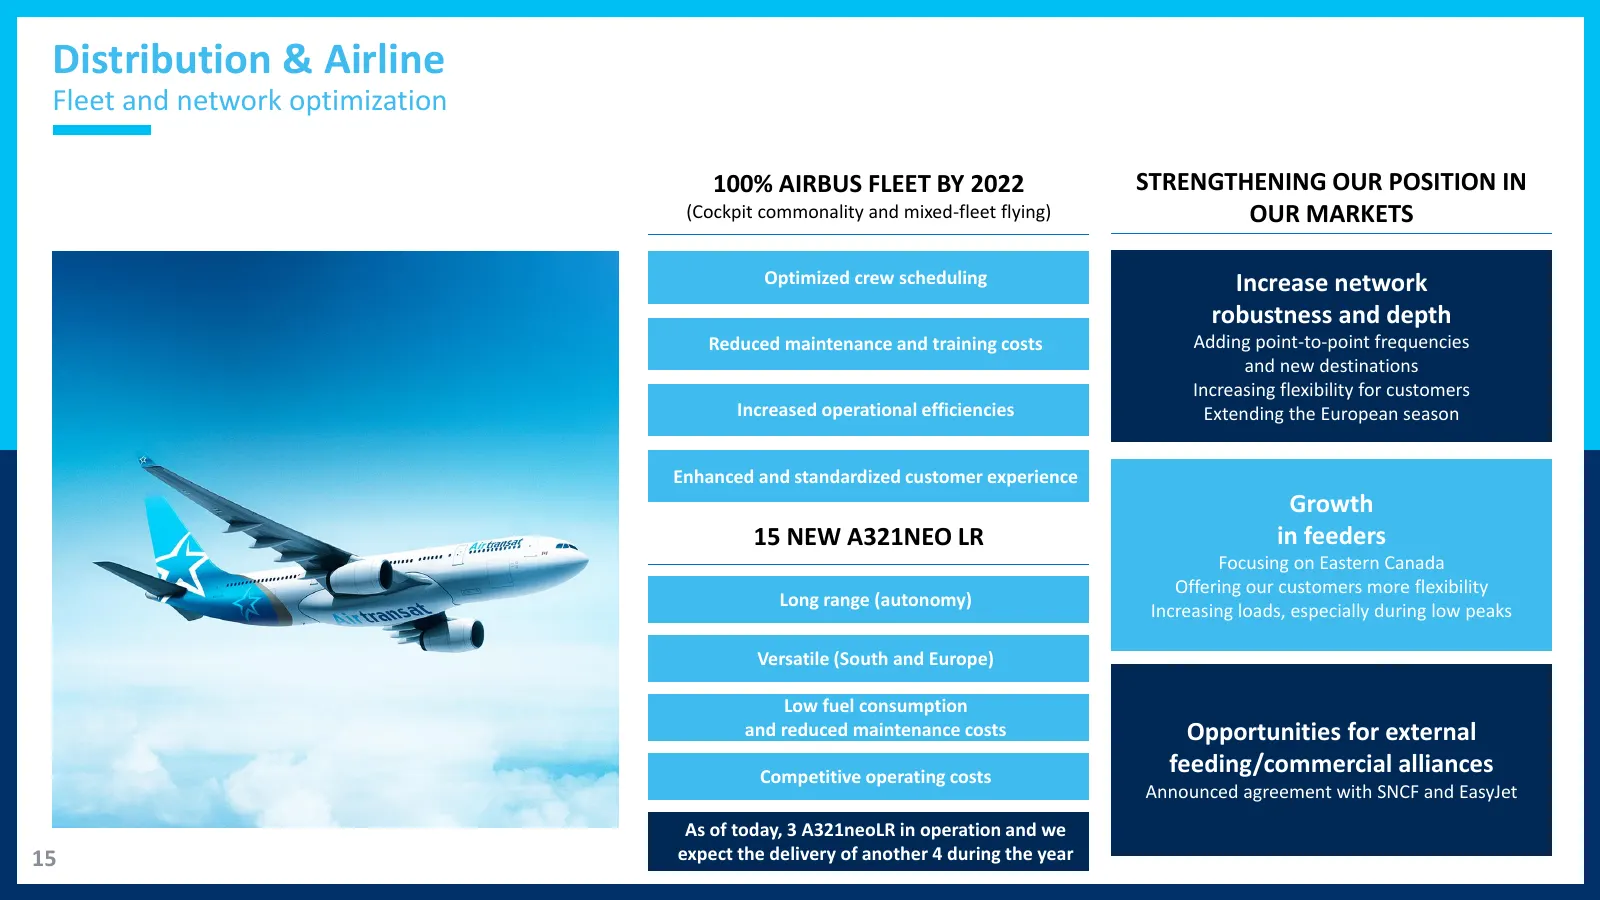
Distribution & Airline Fleet and network optimization 100% AIRBUS FLEET BY 2022 STRENGTHENING OUR POSITION IN (Cockpit commonality and mixed-fleet flying) OUR MARKETS Optimized crew scheduling Increase network robustness and depth Reduced maintenance and training costs Adding point-to-point frequenc
Slide 16: Distribution & Airline: Ancillary revenues
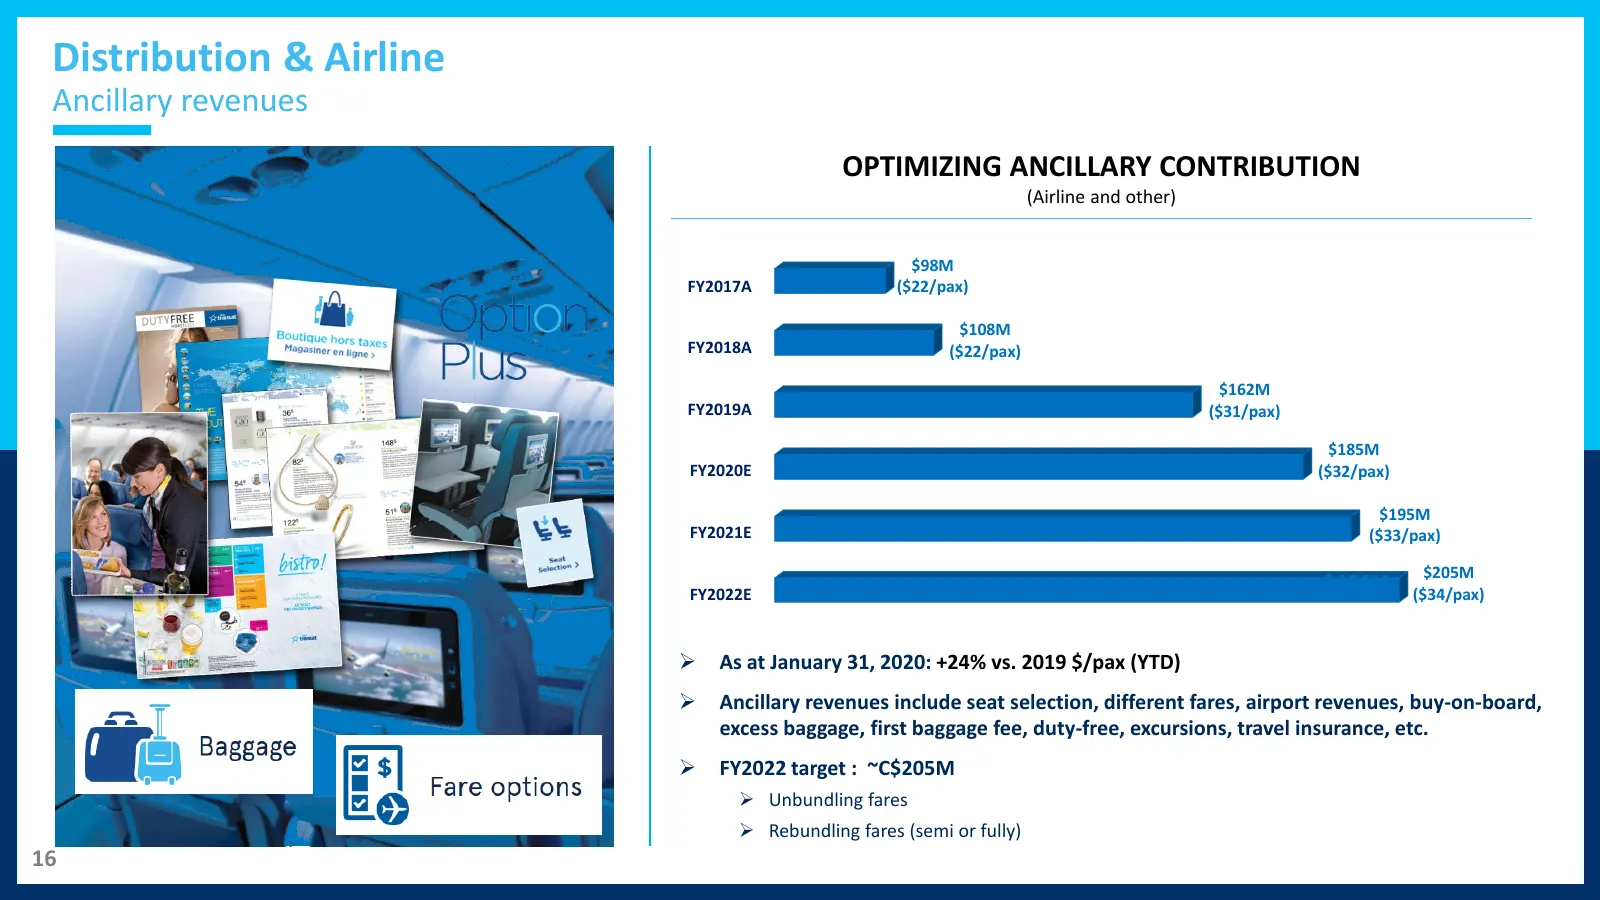
Distribution & Airline Ancillary revenues OPTIMIZING ANCILLARY CONTRIBUTION (Airline and other) $98M FY2017A ($22/pax) $108M FY2018A ($22/pax) $162M FY2019A ($31/pax) $185M FY2020E ($32/pax) $195M FY2021E ($33/pax) $205M FY2022E $150M ($34/pax) ➢ As at January 31, 2020: +24% vs. 2019 $/pax (YTD) ➢ A
Slide 17: Optimizing our distribution and extending our digital footprint
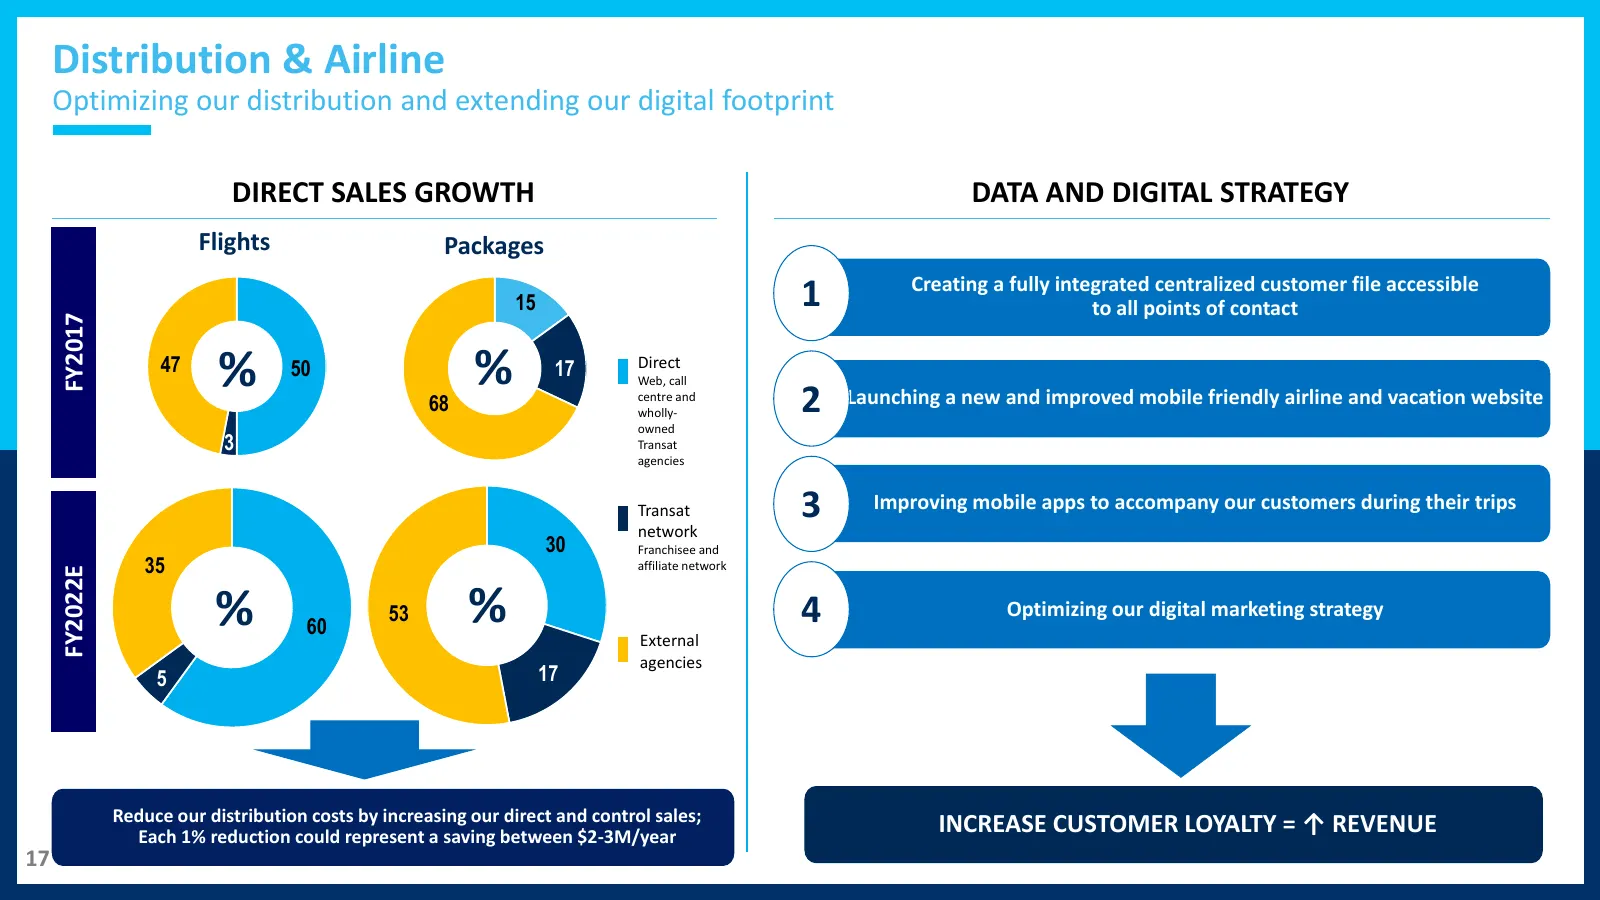
Distribution & Airline Optimizing our distribution and extending our digital footprint DIRECT SALES GROWTH DATA AND DIGITAL STRATEGY Flights Packages Creating a fully integrated centralized customer file accessible 15 1 to all points of contact FY2017 47 % 50 % 17 Direct Web, call 68 centre and whol
Slide 18: Holiday experiences (hotel development strategy) on hold
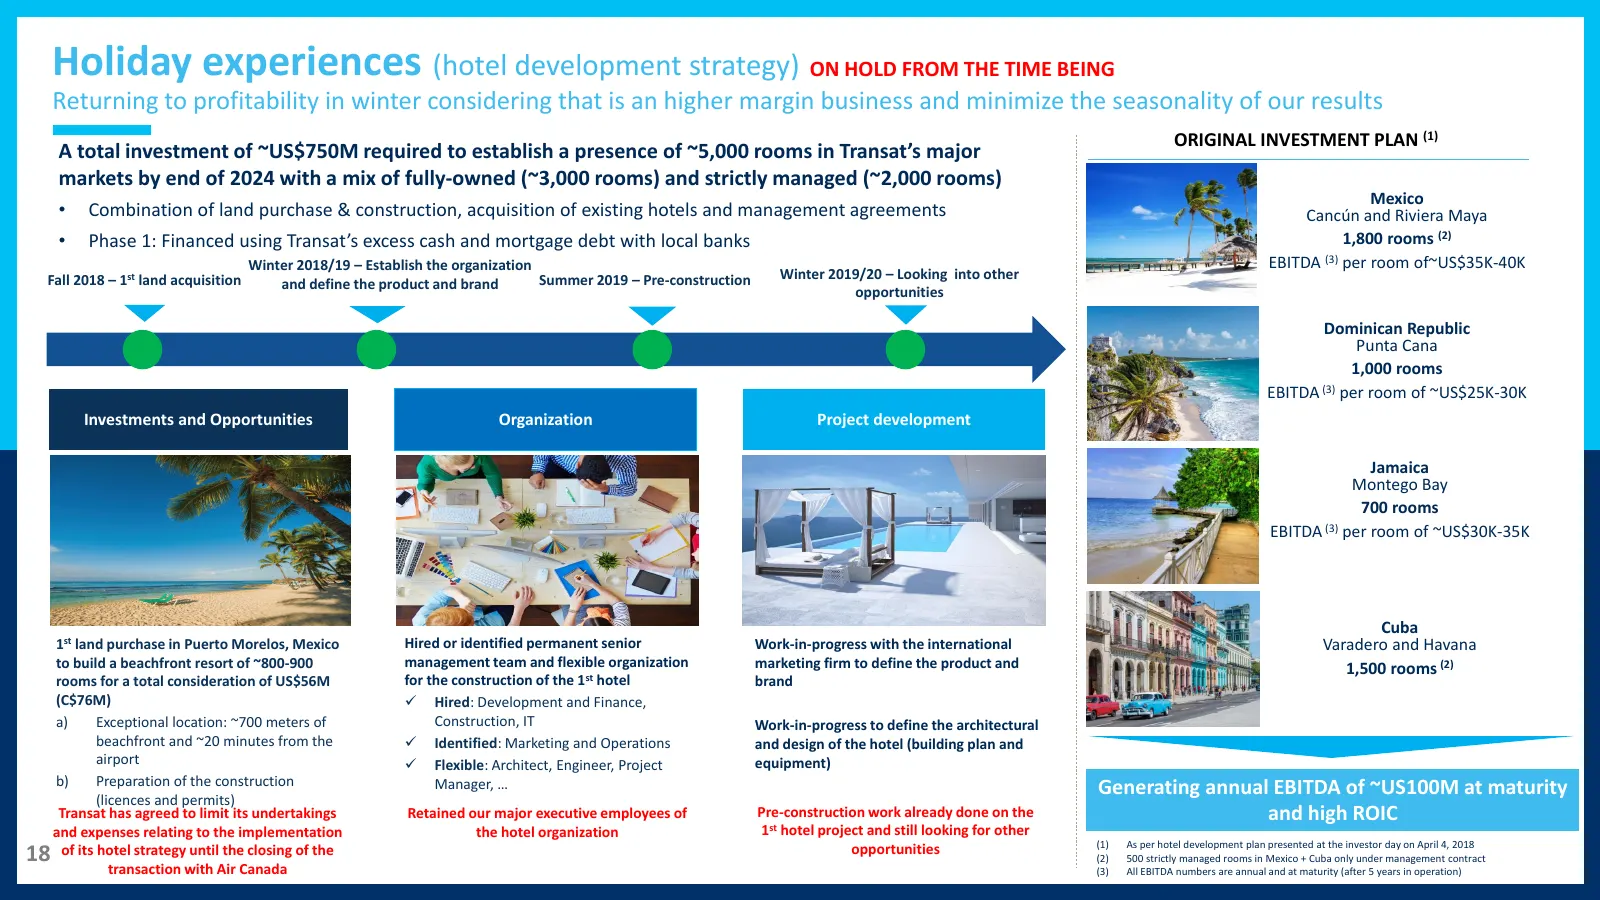
Holiday experiences (hotel development strategy) ON HOLD FROM THE TIME BEING Returning to profitability in winter considering that is an higher margin business and minimize the seasonality of our results ORIGINAL INVESTMENT PLAN (1) A total investment of ~US$750M required to establish a presence of

Slide 19: ESG Overview
ESG Overview

Slide 20: Excellence in sustainability
Excellence in sustainability resp.transat.com
Slide 21: Environment and social
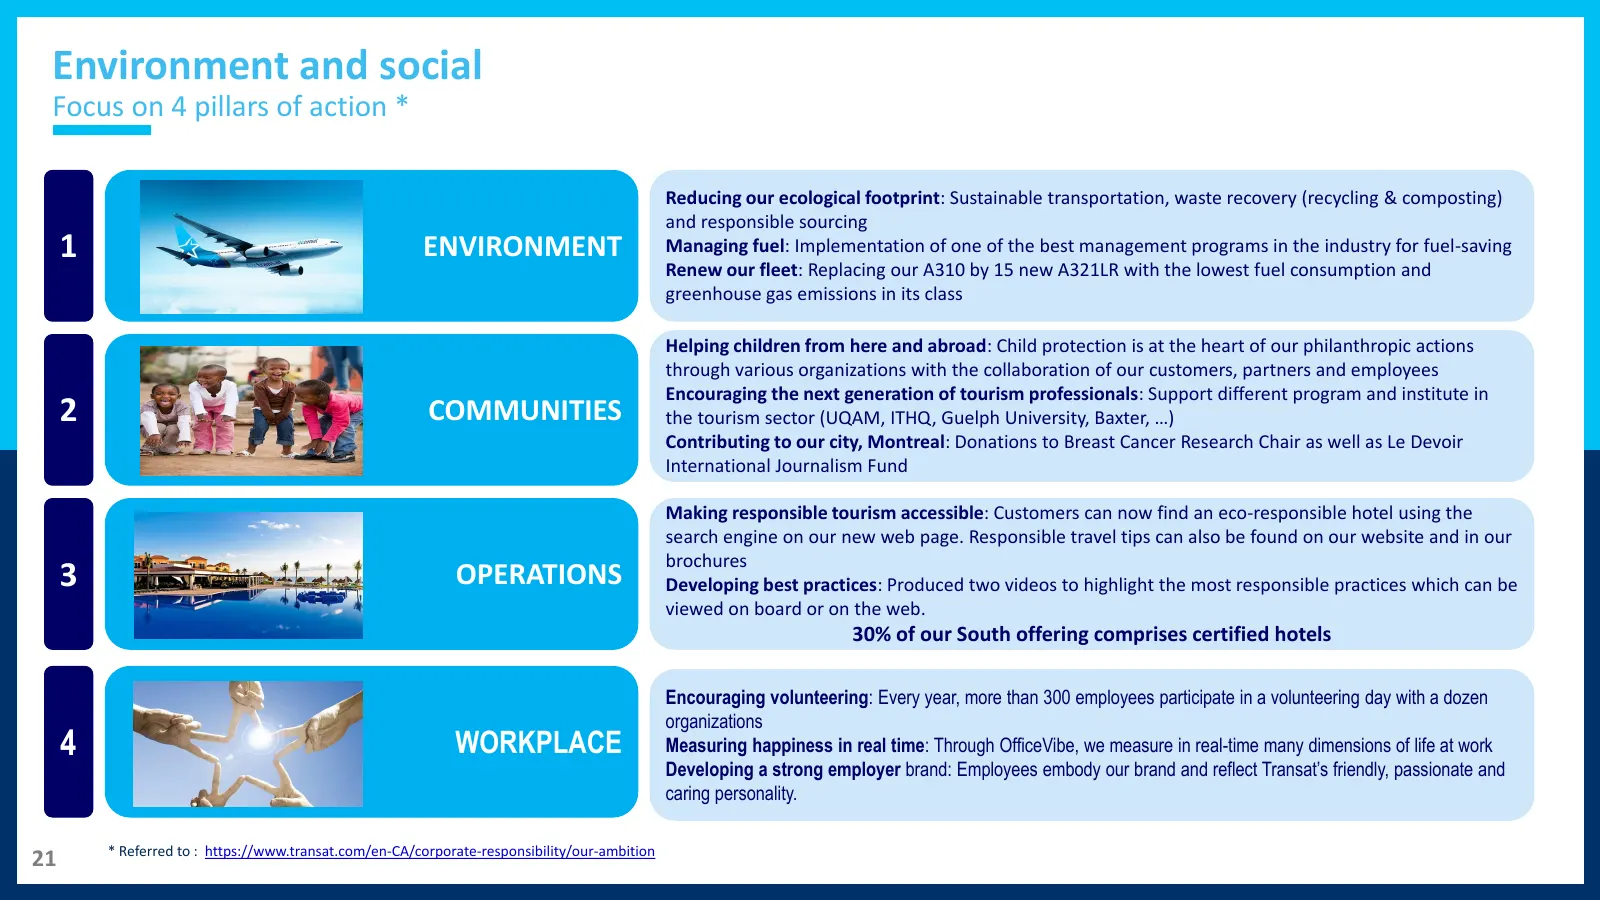
Environment and social Focus on 4 pillars of action * Reducing our ecological footprint: Sustainable transportation, waste recovery (recycling & composting) and responsible sourcing 1 ENVIRONMENT Managing fuel: Implementation of one of the best management programs in the industry for fuel-saving Ren
Slide 22: Governance
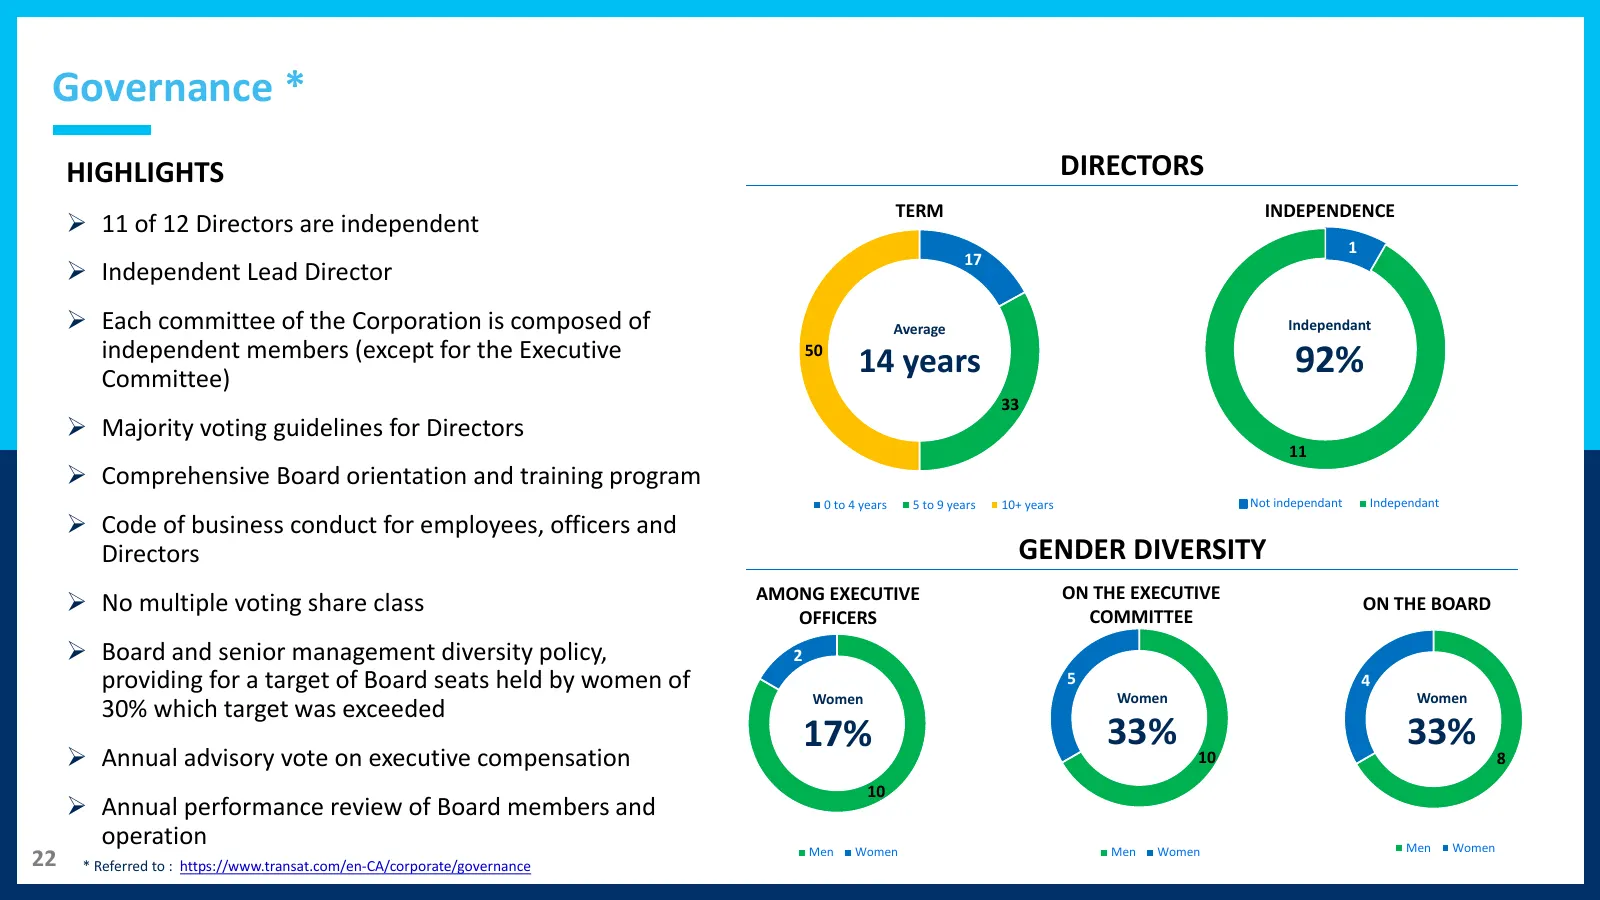
Governance * HIGHLIGHTS DIRECTORS TERM INDEPENDENCE ➢ 11 of 12 Directors are independent 1 17 ➢ Independent Lead Director ➢ Each committee of the Corporation is composed of Average Independant independent members (except for the Executive Committee) 50 14 years 92% 33 ➢ Majority voting guidelines fo

Slide 23: Appendix
Appendix
Slide 24: Historical financial position
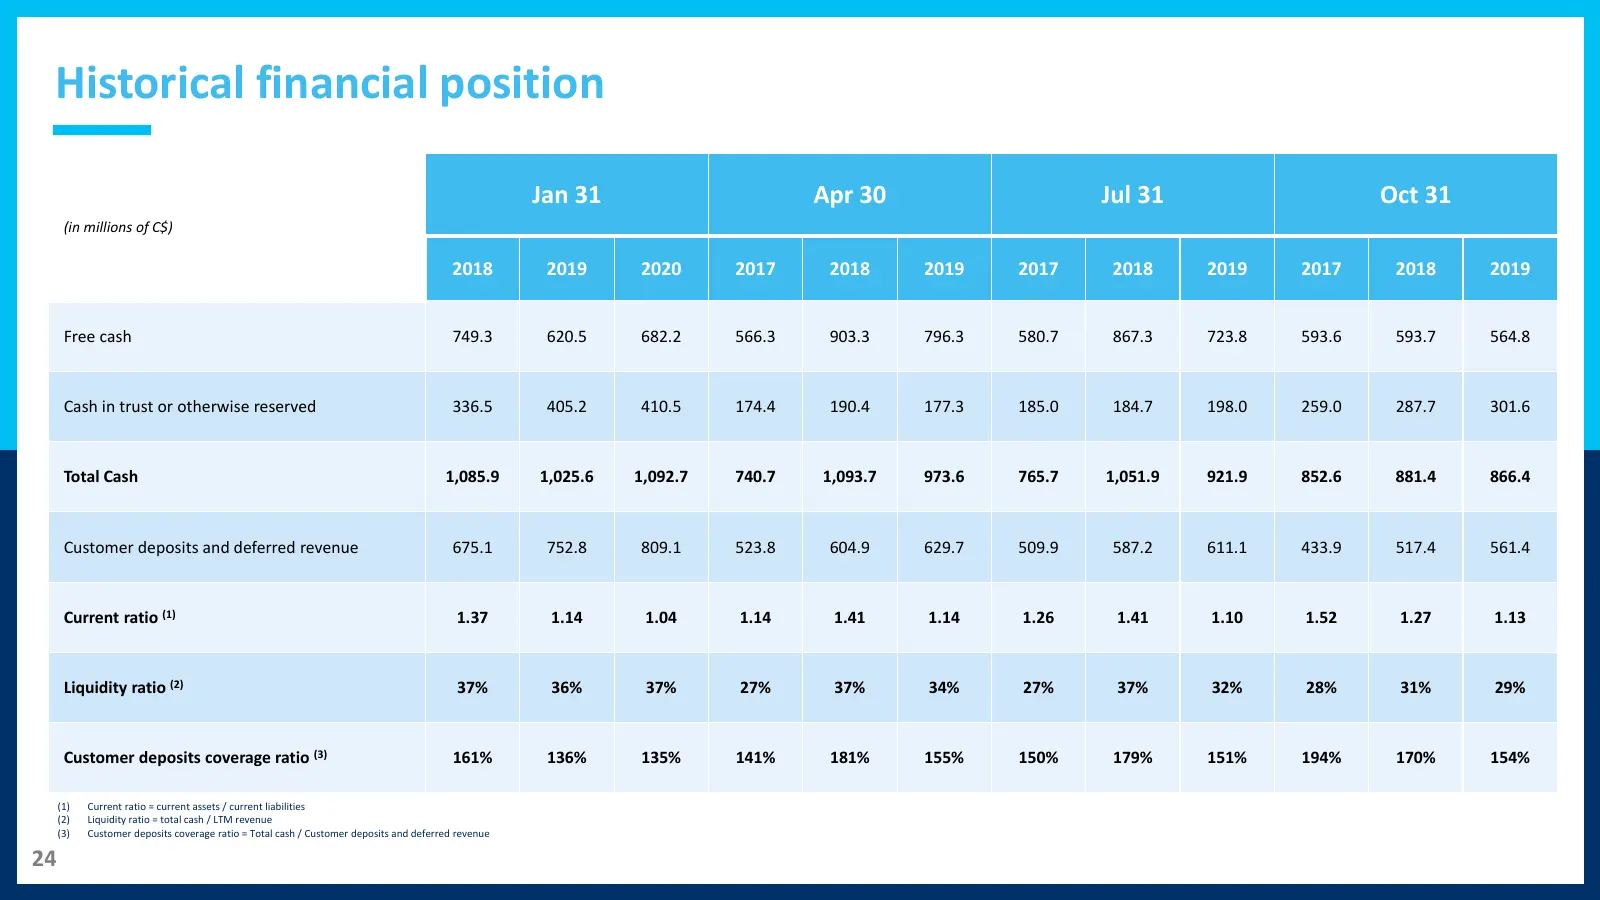
Historical financial position Jan 31 Apr 30 Jul 31 Oct 31 (in millions of C$) 2018 2019 2020 2017 2018 2019 2017 2018 2019 2017 2018 2019 Free cash 749.3 620.5 682.2 566.3 903.3 796.3 580.7 867.3 723.8 593.6 593.7 564.8 Cash in trust or otherwise reserved 336.5 405.2 410.5 174.4 190.4 177.3 185.0 18
Slide 25: IFRS 16
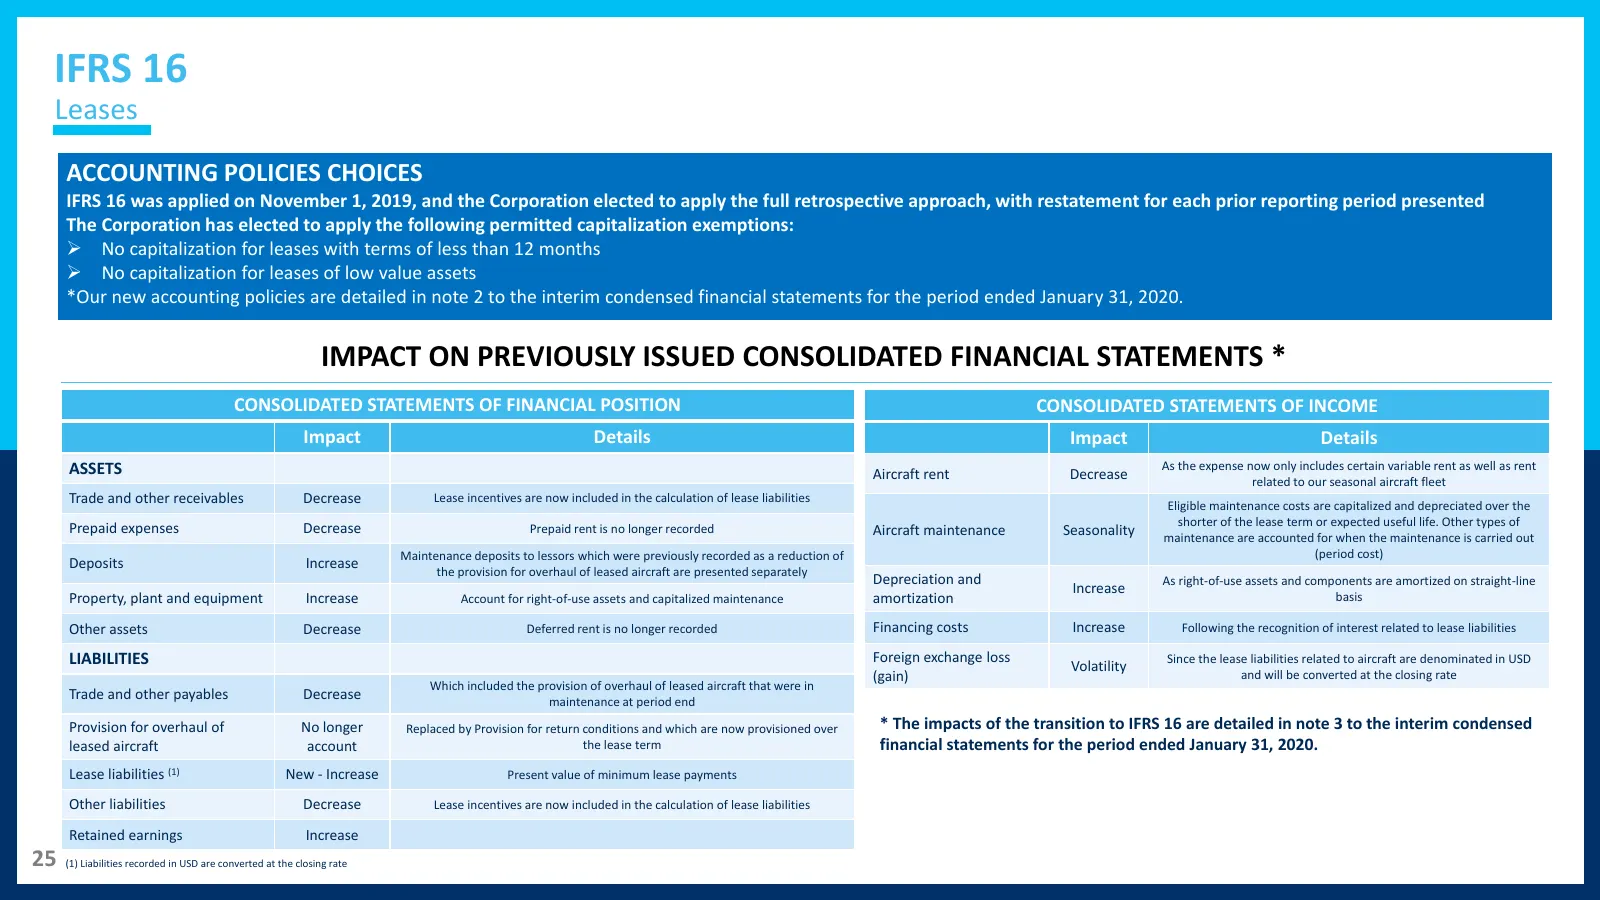
IFRS 16 Leases ACCOUNTING POLICIES CHOICES IFRS 16 was applied on November 1, 2019, and the Corporation elected to apply the full retrospective approach, with restatement for each prior reporting period presented The Corporation has elected to apply the following permitted capitalization exemptions:
Slide 26: 2019 financial results – IFRS 16 impact
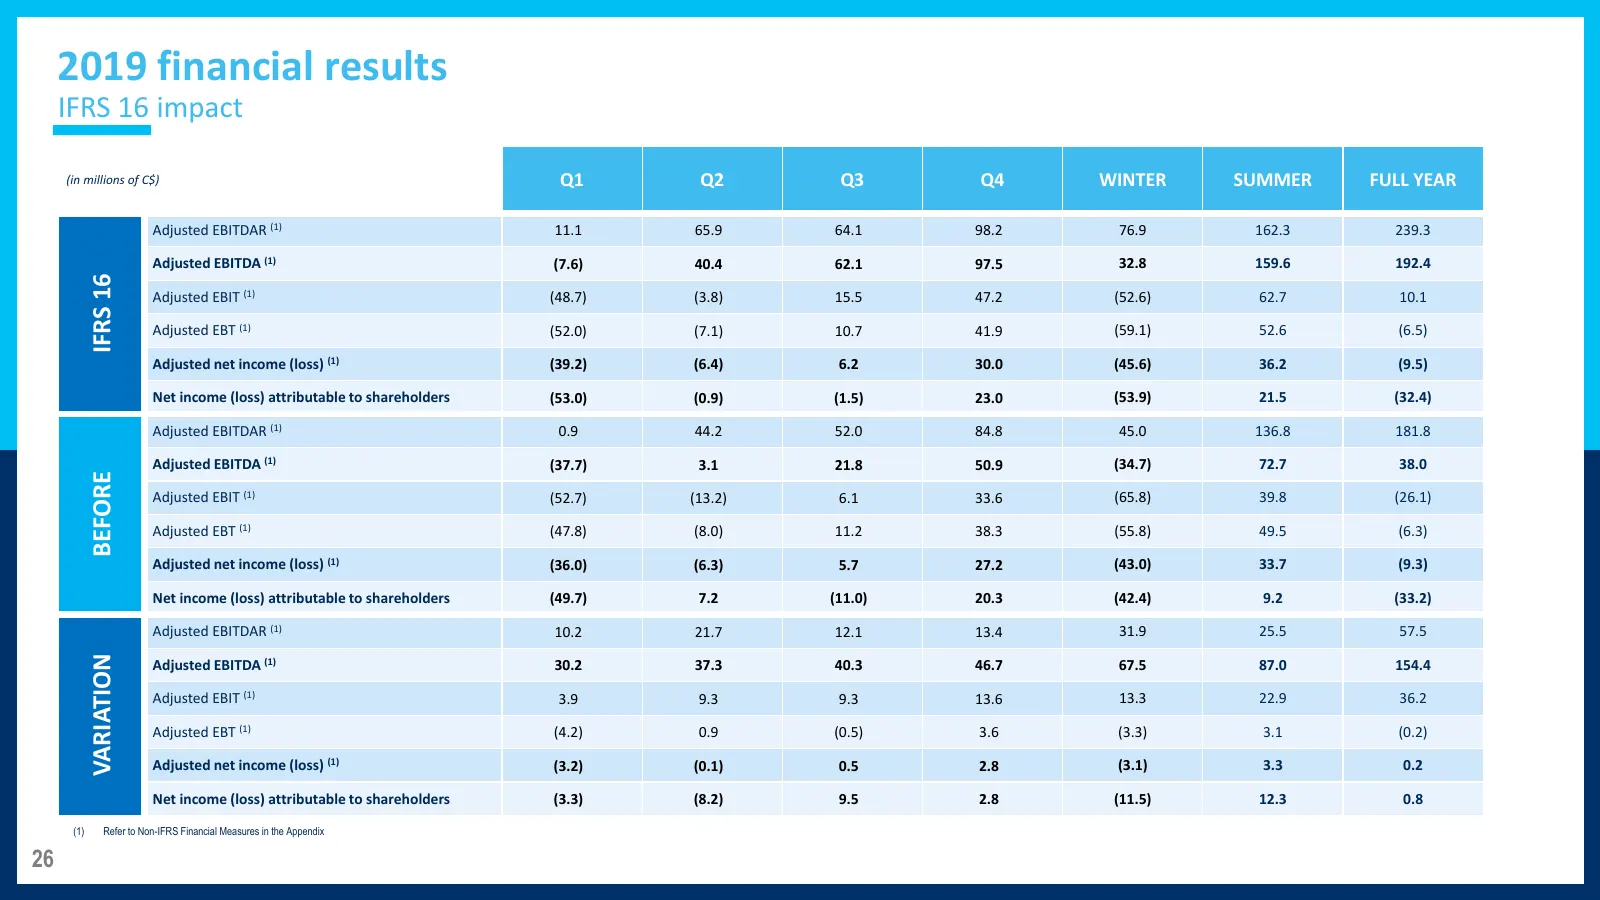
2019 financial results IFRS 16 impact (in millions of C$) Q1 Q2 Q3 Q4 WINTER SUMMER FULL YEAR Adjusted EBITDAR (1) 11.1 65.9 64.1 98.2 76.9 162.3 239.3 Adjusted EBITDA (1) (7.6) 40.4 62.1 97.5 32.8 159.6 192.4 IFRS 16 Adjusted EBIT (1) (48.7) (3.8) 15.5 47.2 (52.6) 62.7 10.1 Adjusted EBT (1) (52.0)
Slide 27: Financial position – IFRS 16 impact
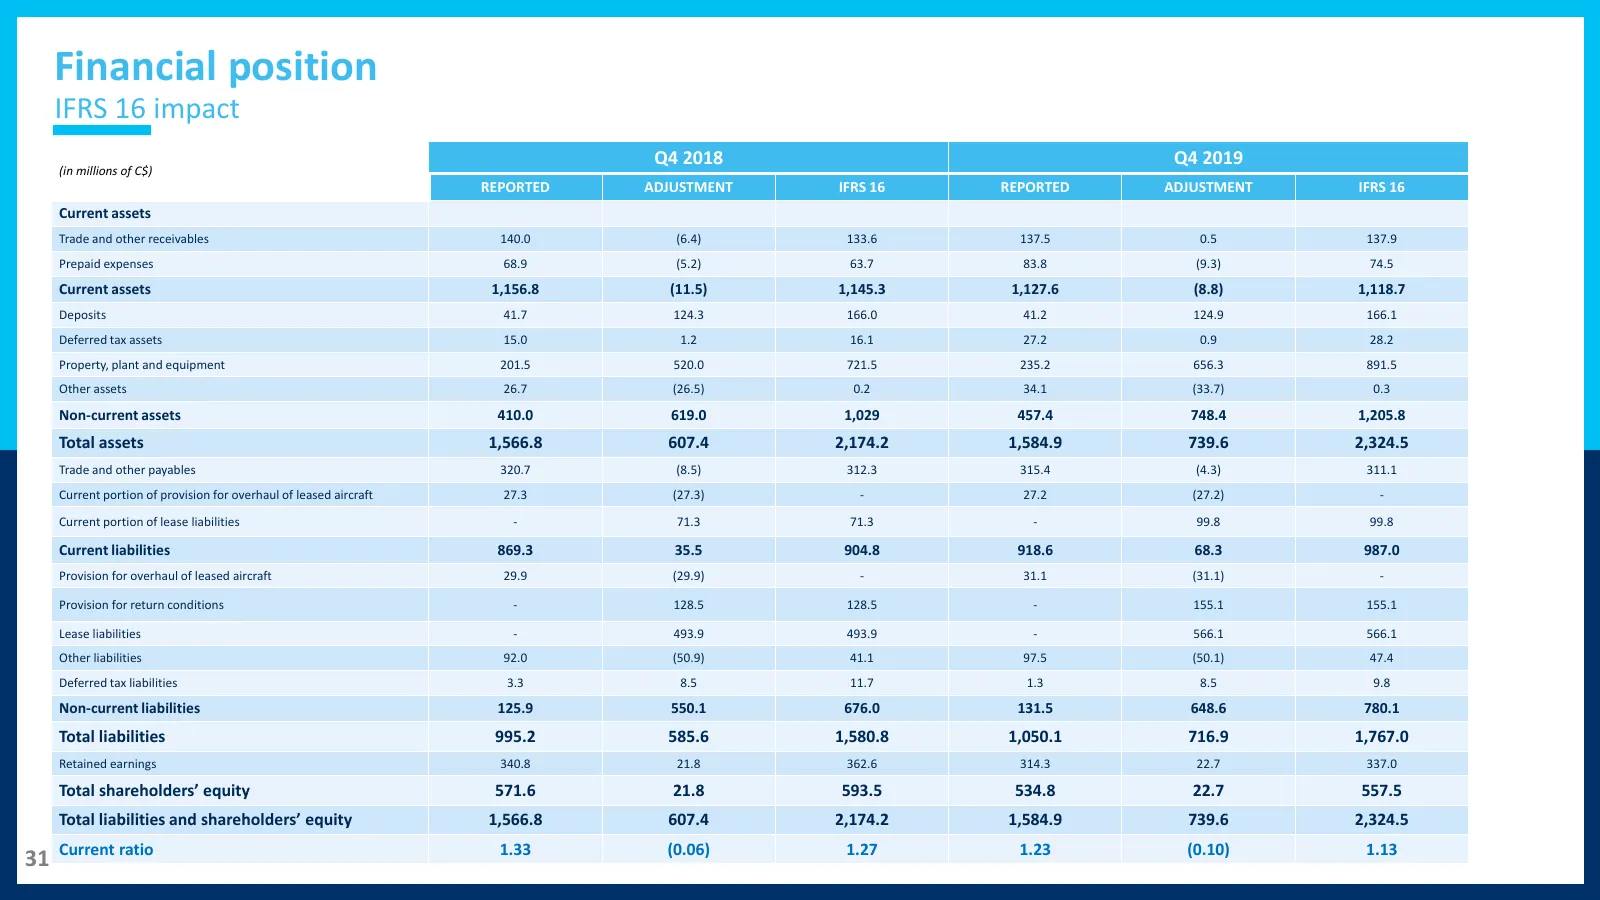
Financial position IFRS 16 impact Q4 2018 Q4 2019 (in millions of C$) REPORTED ADJUSTMENT IFRS 16 REPORTED ADJUSTMENT IFRS 16 Current assets Trade and other receivables 140.0 (6.4) 133.6 137.5 0.5 137.9 Prepaid expenses 68.9 (5.2) 63.7 83.8 (9.3) 74.5 Current assets 1,156.8 (11.5) 1,145.3 1,127.6 (8
Slide 28: Non-IFRS financial measures
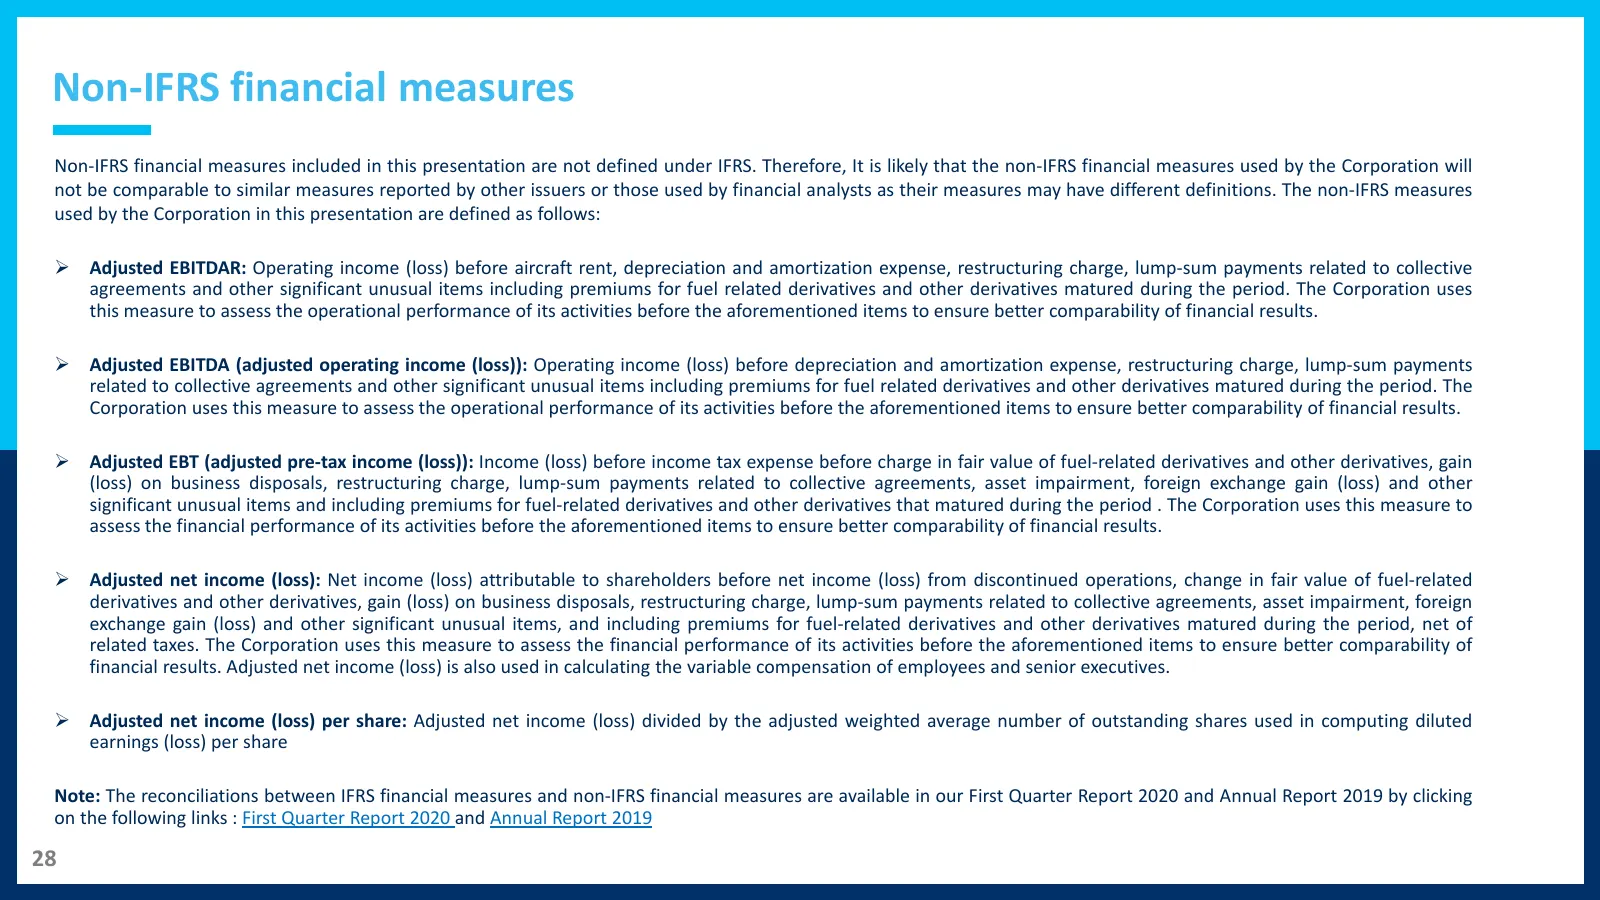
Non-IFRS financial measures Non-IFRS financial measures included in this presentation are not defined under IFRS. Therefore, It is likely that the non-IFRS financial measures used by the Corporation will not be comparable to similar measures reported by other issuers or those used by financial analy
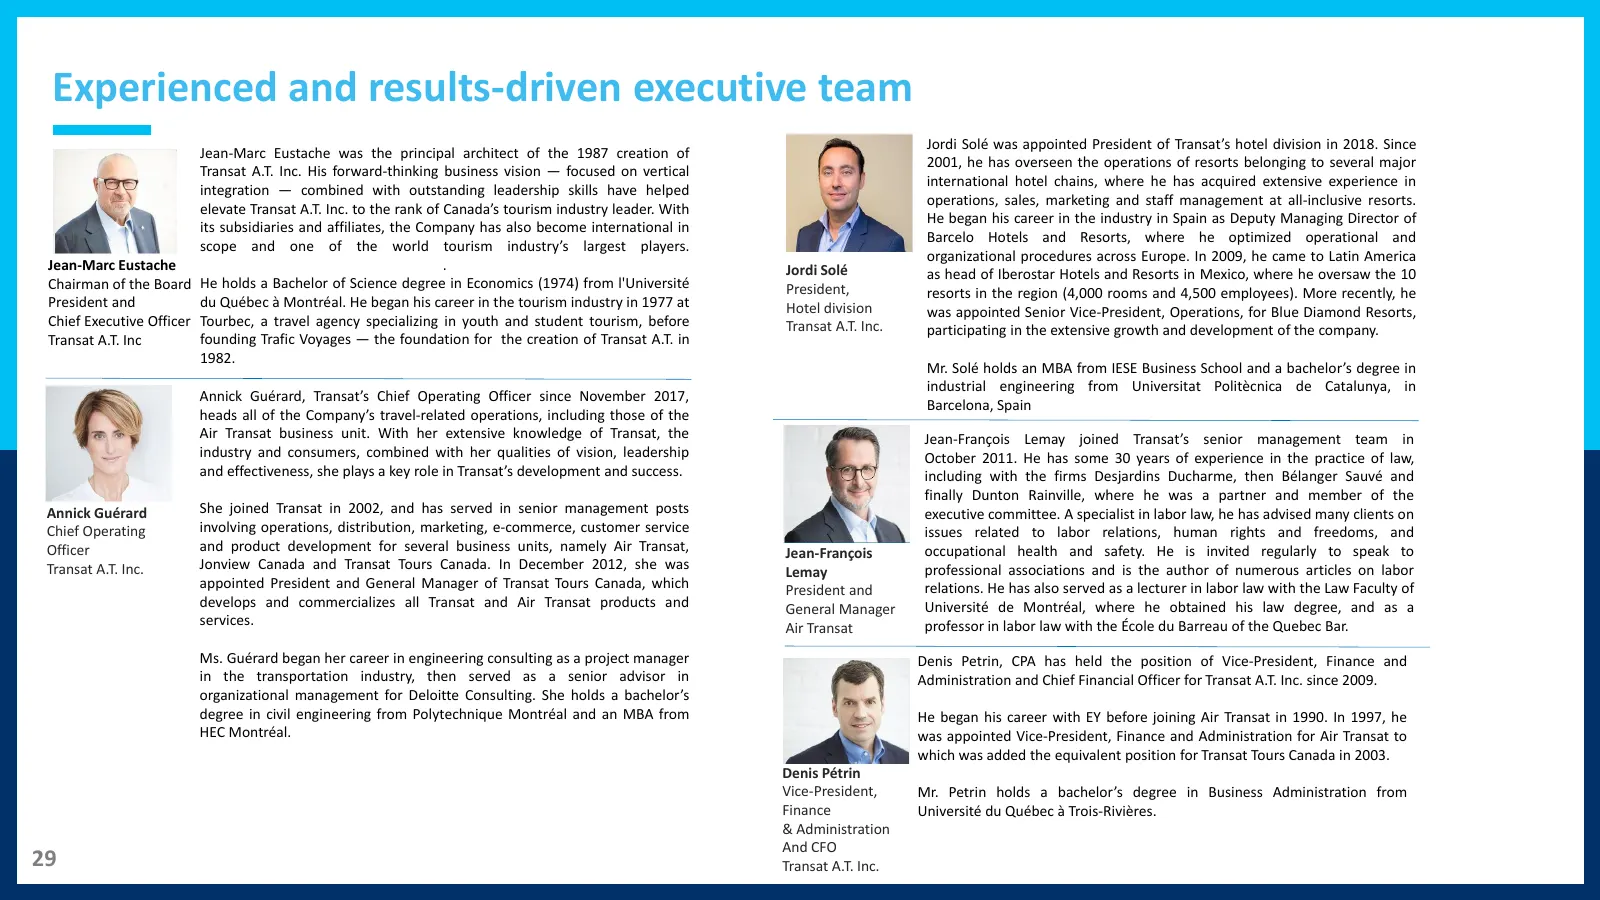
Slide 29: Experienced and results-driven executive team
Experienced and results-driven executive team Jordi Solé was appointed President of Transat’s hotel division in 2018. Since Jean-Marc Eustache was the principal architect of the 1987 creation of 2001, he has overseen the operations of resorts belonging to several major Transat A.T. Inc. His forward-

Slide 30: Results for first quarter 2020 – Thank you
Results for first quarter 2020 THANK YOU TO OUR CUSTOMERS, EMPLOYEES, INVESTORS AND PARTNERS Cut our income loss by half on a like-for-like basis Continue to expect the deal to close in Q2/20 (calendar), subject to regulatory approvals INVESTOR’S PRESENTATION MARCH 2020
Source: Internet Archive copy of transat.com
More decks from Transat A.T. Inc.
 Q3 2026 Earnings Presentation14 slides · Sep 10, 2026
 Q1 2026 Earnings Presentation15 slides · Mar 10, 2026
 Q4 2025 Earnings Presentation16 slides · Dec 18, 2025
 Q3 2025 Earnings Presentation16 slides · Sep 11, 2025
 Q1 2024 Earnings Presentation19 slides · March 2024
 Q4 2023 Earnings Presentation20 slides · December 2023