Harvard Bioscience, Inc. · NASDAQ:HBIO
Harvard Bioscience — Investor Presentation (August 2006)
27 slides from Harvard Bioscience's investor presentation, August 2006
Slide 1: Tools to Advance Life Science Research
Tools to Advance Life Science Research NASDAQ HBIO August 2006 Copyright © Harvard Bioscience 2006
Slide 2: Safe Harbor Statement
Safe Harbor Statement This presentation contains forward-looking statements within the meaning of the federal securities laws. You can identify these statements by our use of the words “guidance,” “expects,” “plans,” “estimates,” “projects,” “intends,” “believes” and similar expressions that do not
Slide 3: Use of Non-GAAP Information
Use of Non-GAAP Information In this presentation, we have included non-GAAP financial information including adjusted operating income and adjusted net income per diluted share. We believe that this non-GAAP financial information provides investors with an enhanced understanding of the underlying ope
Slide 4: Investment Highlights
Investment Highlights • Tools to Advance Life Science Research • Strong Track Record of Growth and Profitability • Currently Divesting Volatile Capital Equipment Business • Currently Trading at a Discount to Comparable Companies • Experienced Management Team • Commitment to Stockholder Value Creatio
Slide 5: Overview
Overview • Financial Performance Overview • Valuation • Business Strategy • Growth Model • Management Team • Commitment to Stockholder Value Copyright © Harvard Bioscience 2006 Tools to Advance Life Science Research
Slide 6: Financial Overview – Strong Revenue Growth
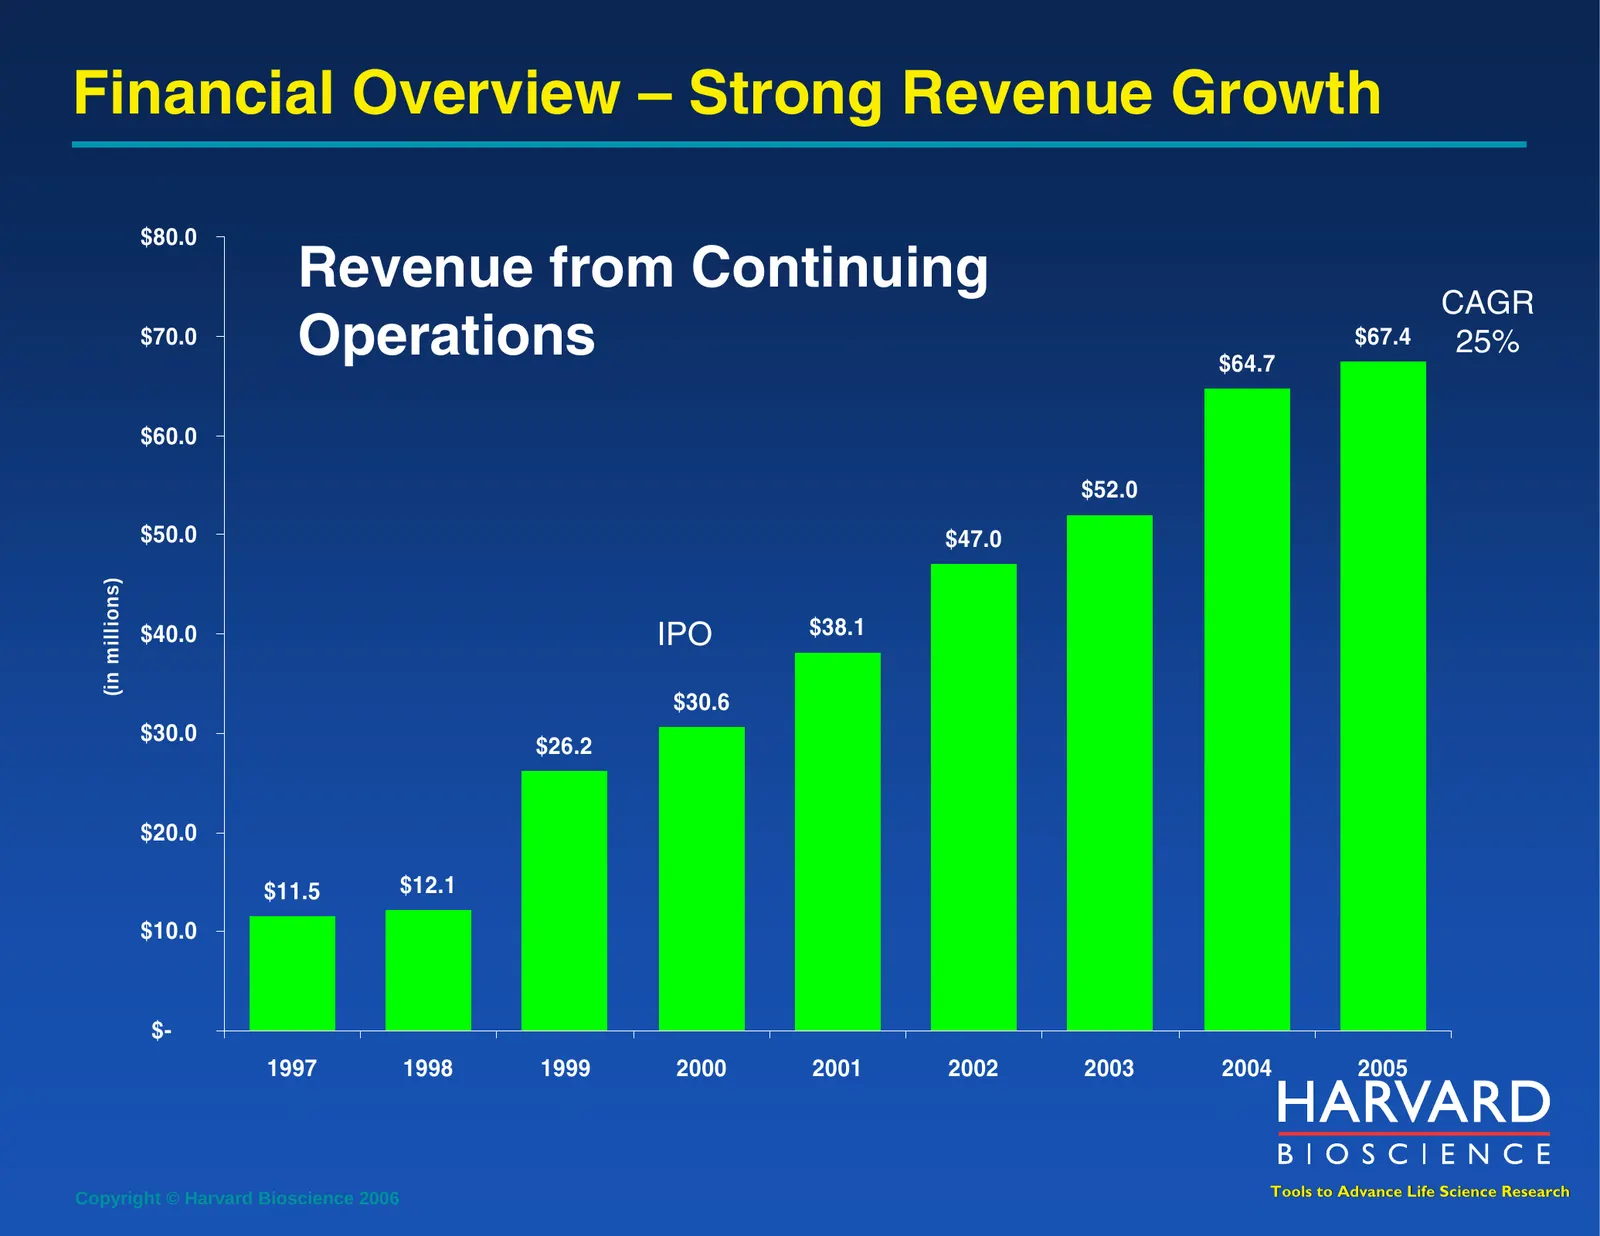
Financial Overview – Strong Revenue Growth $80.0 Revenue from Continuing CAGR $70.0 Operations $64.7 $67.4 25% $60.0 $52.0 $50.0 $47.0 (in millions) $40.0 IPO $38.1 $30.6 $30.0 $26.2 $20.0 $11.5 $12.1 $10.0 $- 1997 1998 1999 2000 2001 2002 2003 2004 2005 Copyright © Harvard Bioscience 2006 Tools to
Slide 7: Financial Overview – Strong Profitability
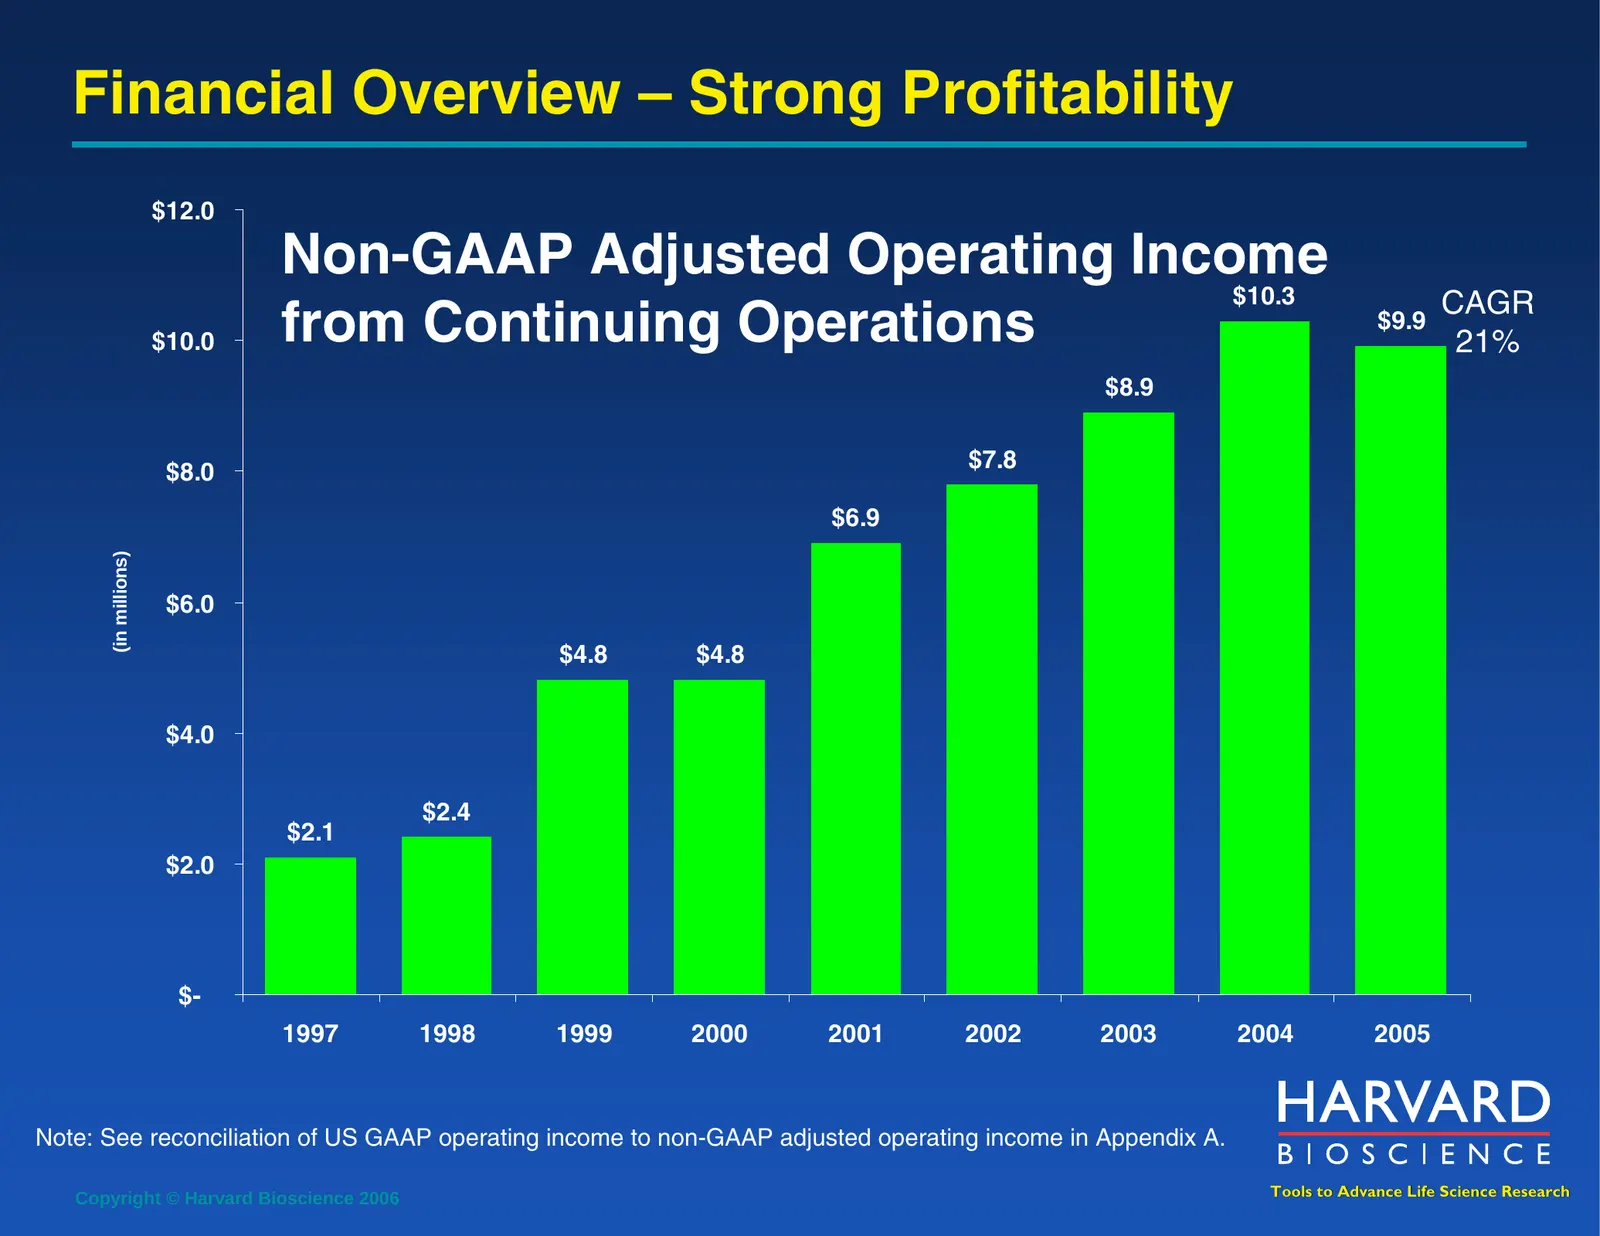
Financial Overview – Strong Profitability $12.0 Non-GAAP Adjusted Operating Income $10.3 CAGR $10.0 from Continuing Operations $9.9 21% $8.9 $8.0 $7.8 $6.9 (in millions) $6.0 $4.8 $4.8 $4.0 $2.4 $2.1 $2.0 $- 1997 1998 1999 2000 2001 2002 2003 2004 2005 Note: See reconciliation of US GAAP operating i
Slide 8: Financial Overview – Strong Diluted EPS Growth
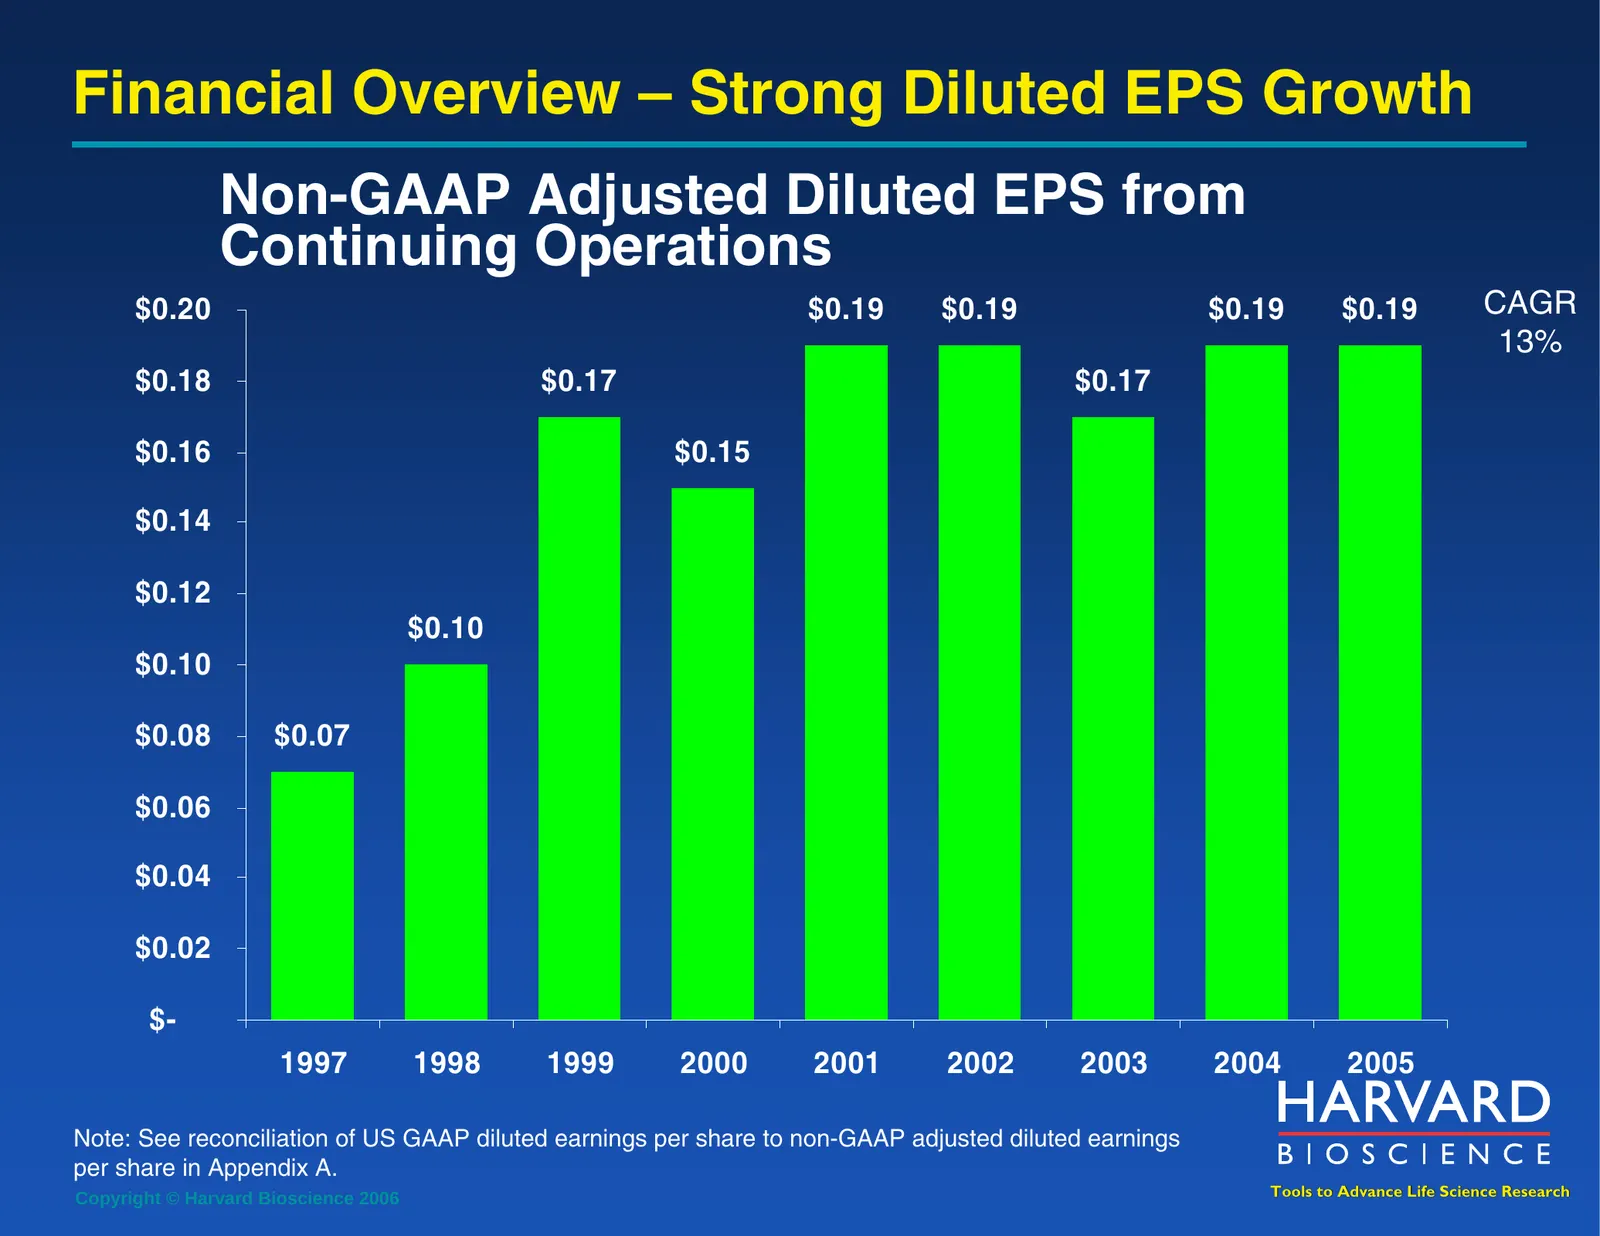
Financial Overview – Strong Diluted EPS Growth Non-GAAP Adjusted Diluted EPS from Continuing Operations $0.20 $0.19 $0.19 $0.19 $0.19 CAGR 13% $0.18 $0.17 $0.17 $0.16 $0.15 $0.14 $0.12 $0.10 $0.10 $0.08 $0.07 $0.06 $0.04 $0.02 $- 1997 1998 1999 2000 2001 2002 2003 2004 2005 Note: See reconciliation
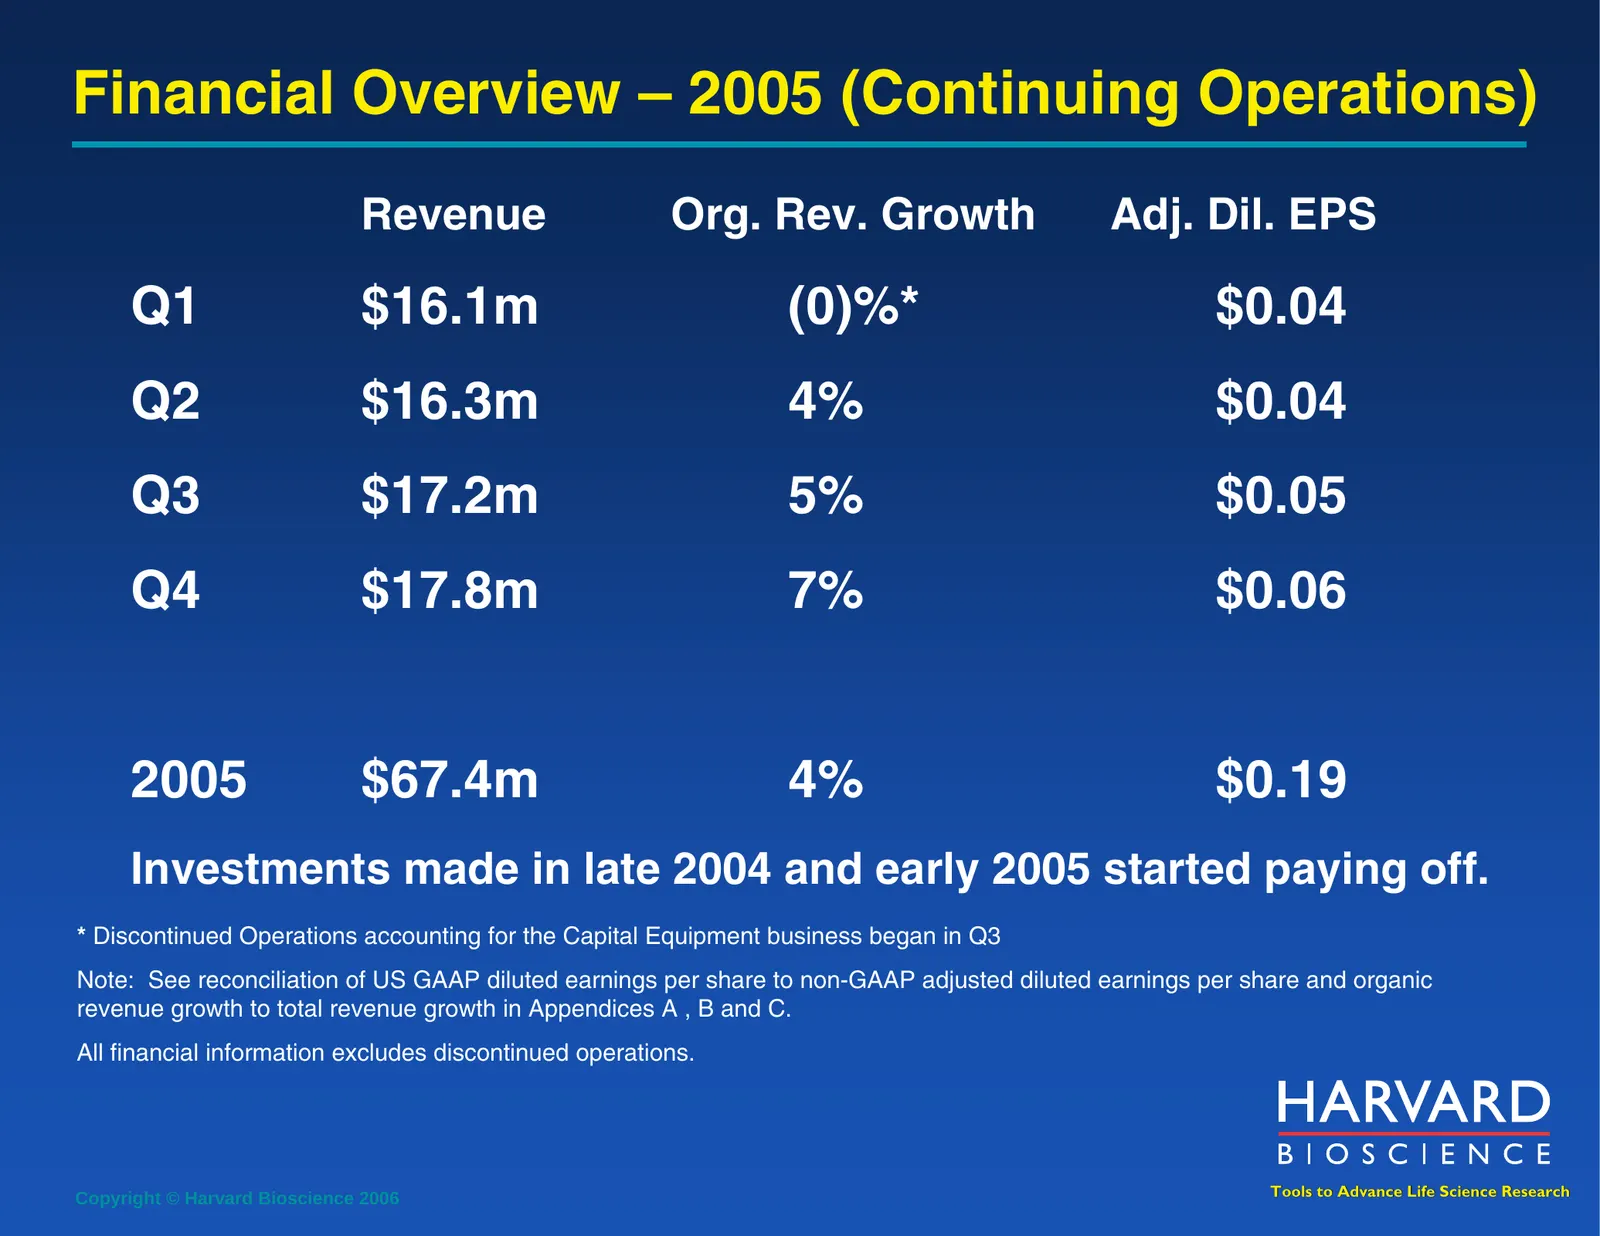
Slide 9: Financial Overview – 2005 (Continuing Operations)
Financial Overview – 2005 (Continuing Operations) Revenue Org. Rev. Growth Adj. Dil. EPS Q1 $16.1m (0)%* $0.04 Q2 $16.3m 4% $0.04 Q3 $17.2m 5% $0.05 Q4 $17.8m 7% $0.06 2005 $67.4m 4% $0.19 Investments made in late 2004 and early 2005 started paying off. * Discontinued Operations accounting for the C
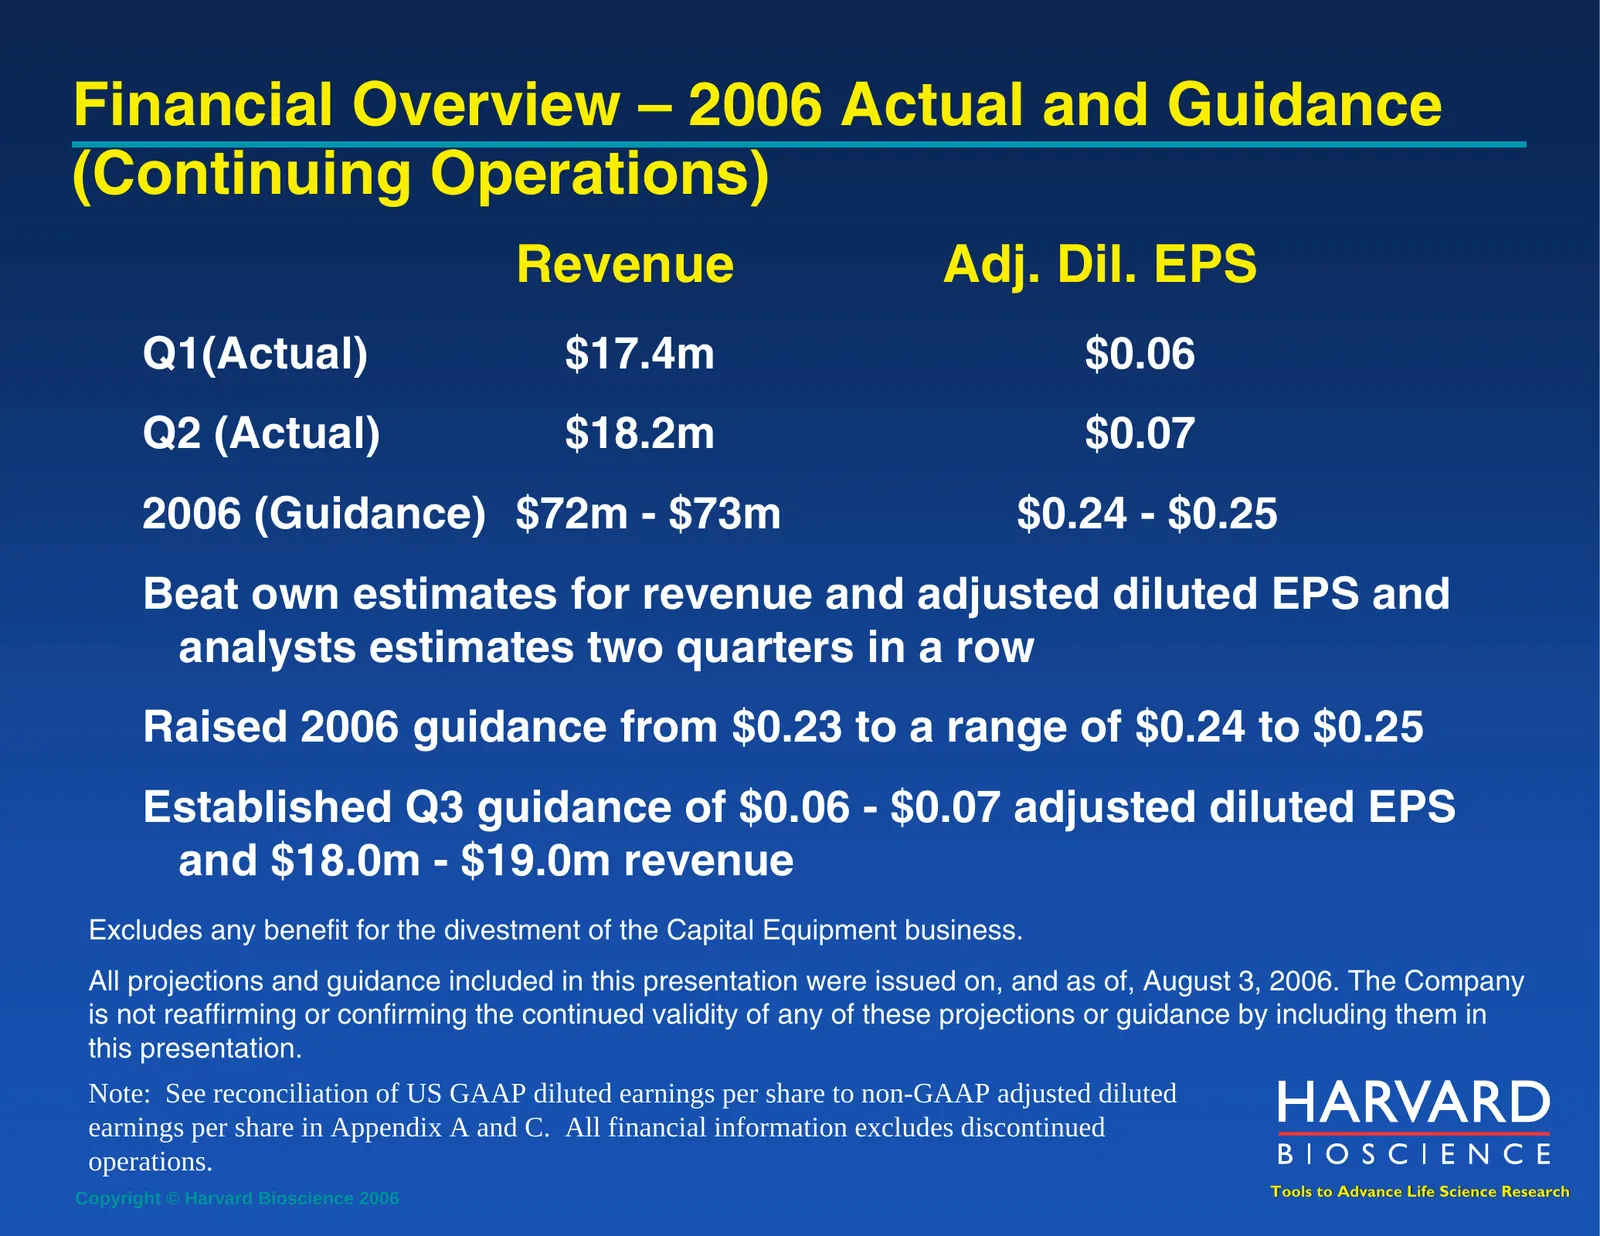
Slide 10: Financial Overview – 2006 Actual and Guidance
Financial Overview – 2006 Actual and Guidance (Continuing Operations) Revenue Adj. Dil. EPS Q1(Actual) $17.4m $0.06 Q2 (Actual) $18.2m $0.07 2006 (Guidance) $72m - $73m $0.24 - $0.25 Beat own estimates for revenue and adjusted diluted EPS and analysts estimates two quarters in a row Raised 2006 guid
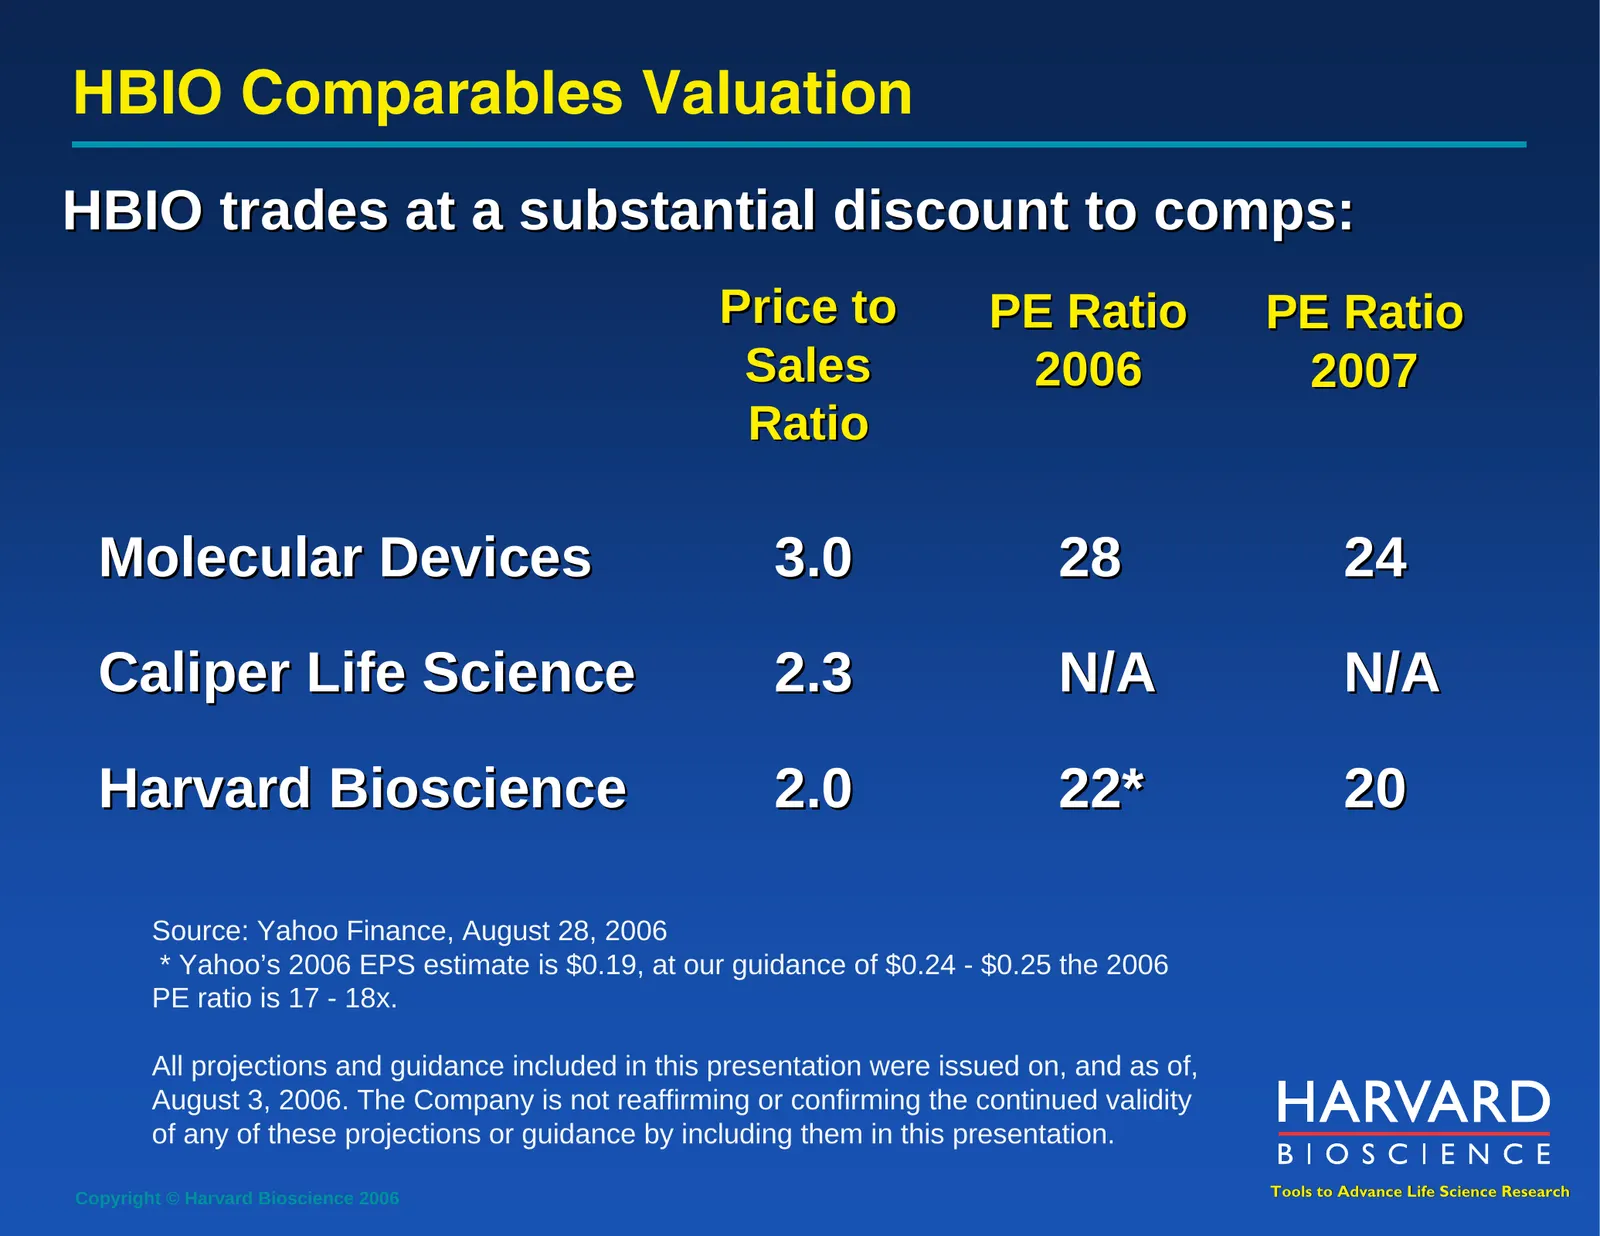
Slide 11: HBIO Comparables Valuation
HBIO Comparables Valuation HBIO trades at a substantial discount to comps: Price to PE Ratio PE Ratio Sales 2006 2007 Ratio Molecular Devices 3.0 28 24 Caliper Life Science 2.3 N/A N/A Harvard Bioscience 2.0 22* 20 Source: Yahoo Finance, August 28, 2006 * Yahoo’s 2006 EPS estimate is $0.19, at our g
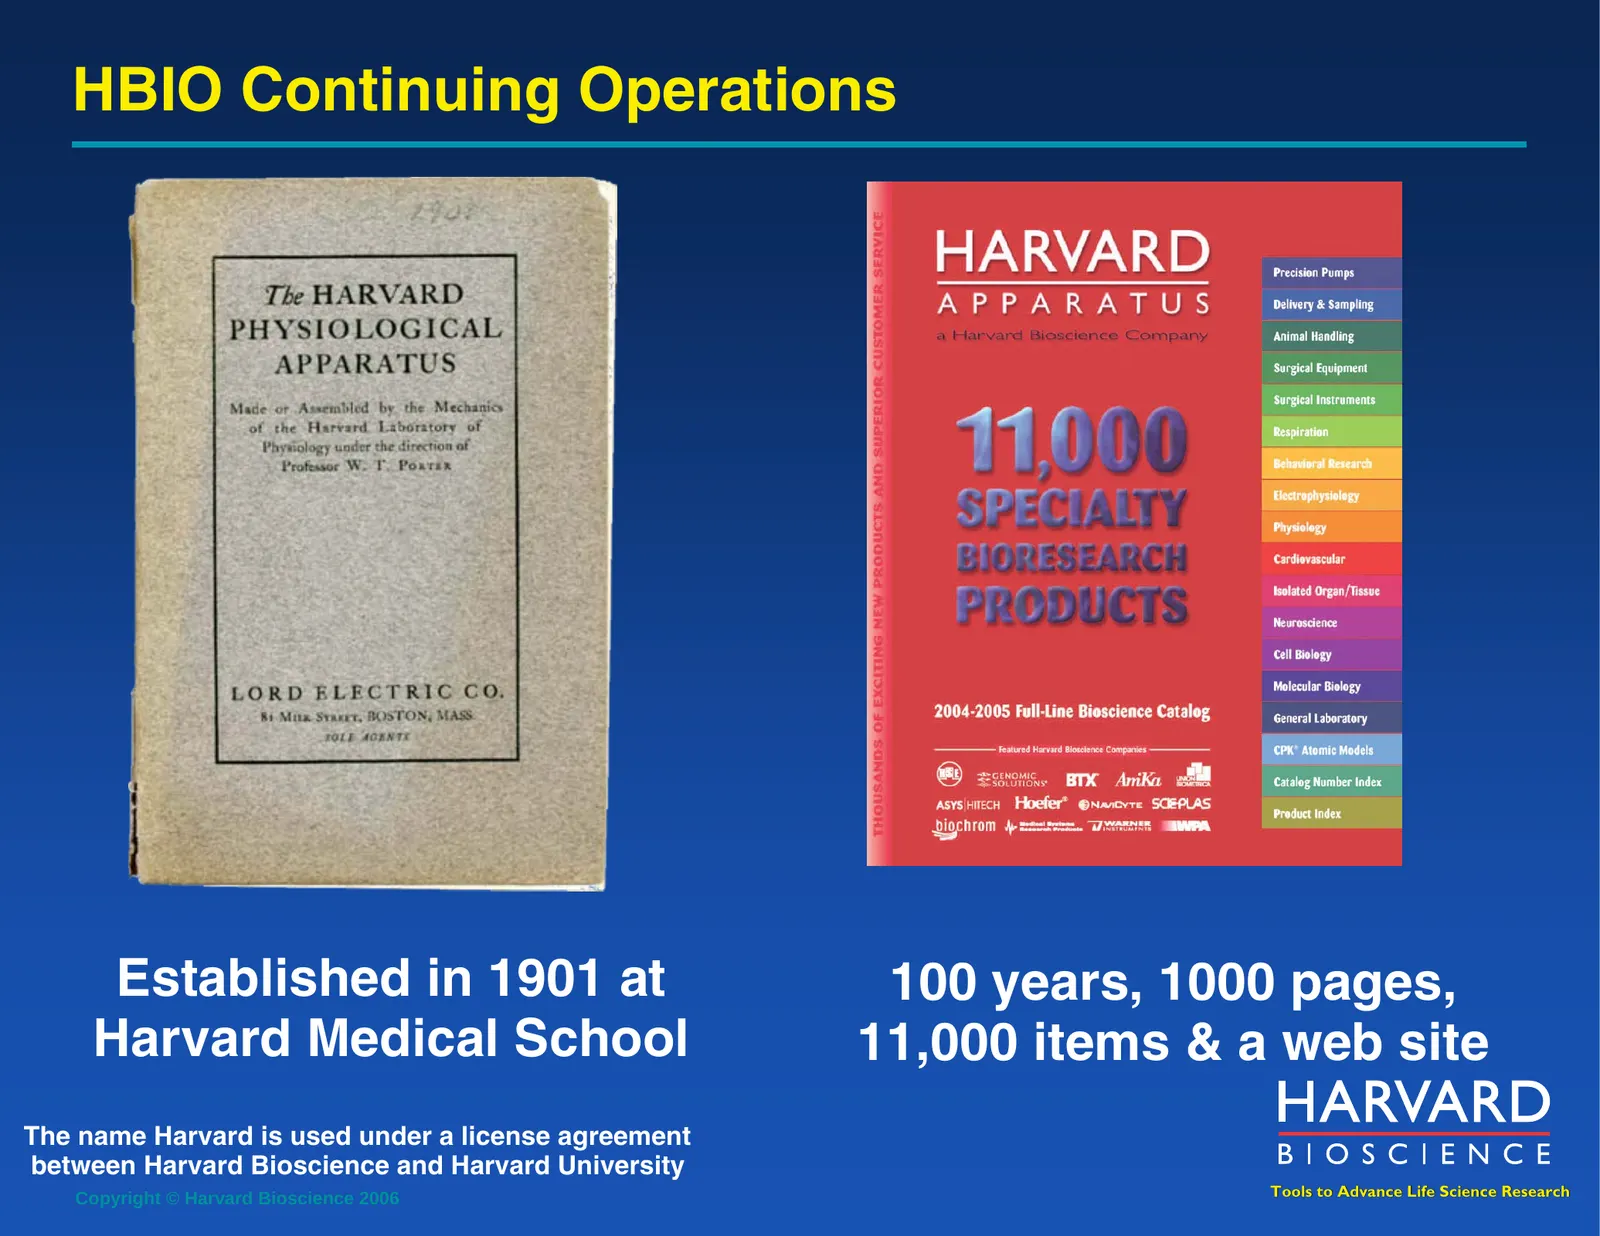
Slide 12: HBIO Continuing Operations
HBIO Continuing Operations Established in 1901 at 100 years, 1000 pages, Harvard Medical School 11,000 items & a web site The name Harvard is used under a license agreement between Harvard Bioscience and Harvard University Copyright © Harvard Bioscience 2006 Tools to Advance Life Science Research
Slide 13: Physiology Products
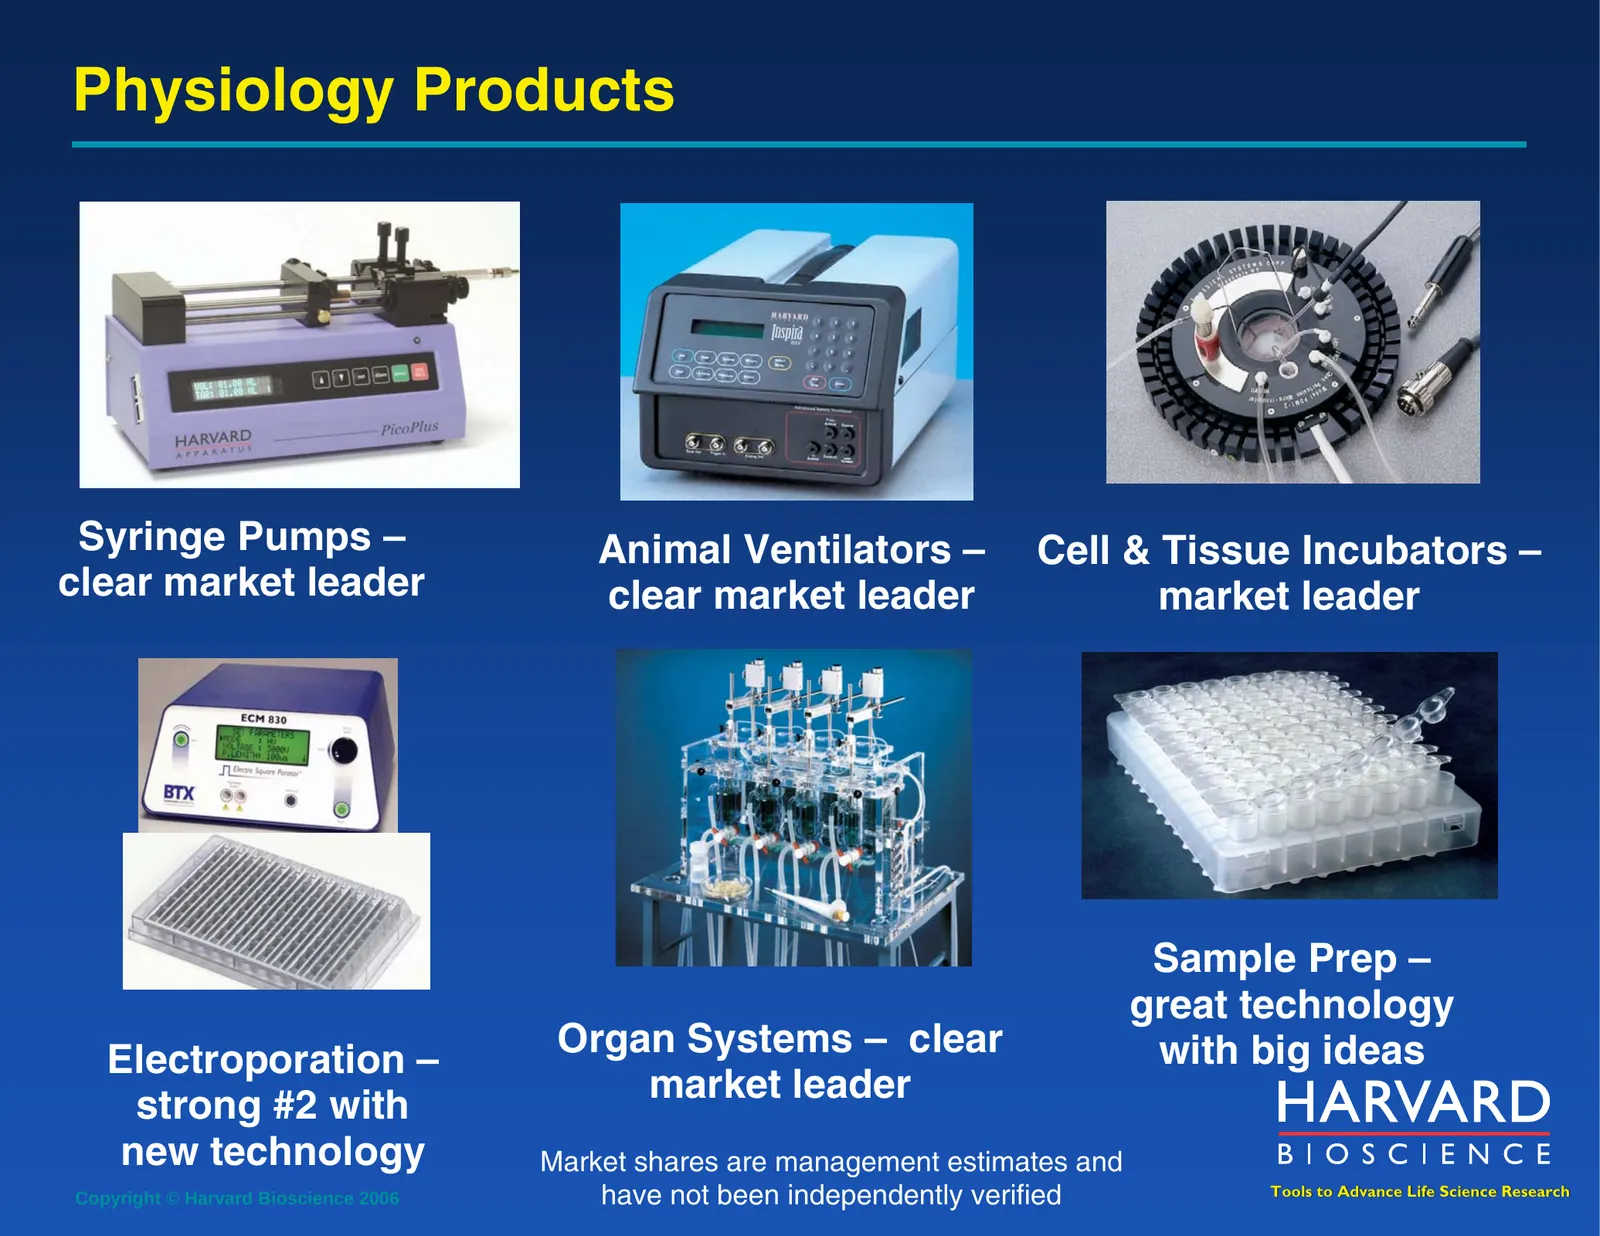
Physiology Products Syringe Pumps – Animal Ventilators – Cell & Tissue Incubators – clear market leader clear market leader market leader Sample Prep – great technology Organ Systems – clear with big ideas Electroporation – market leader strong #2 with new technology Market shares are management est
Slide 14: Molecular Biology Products
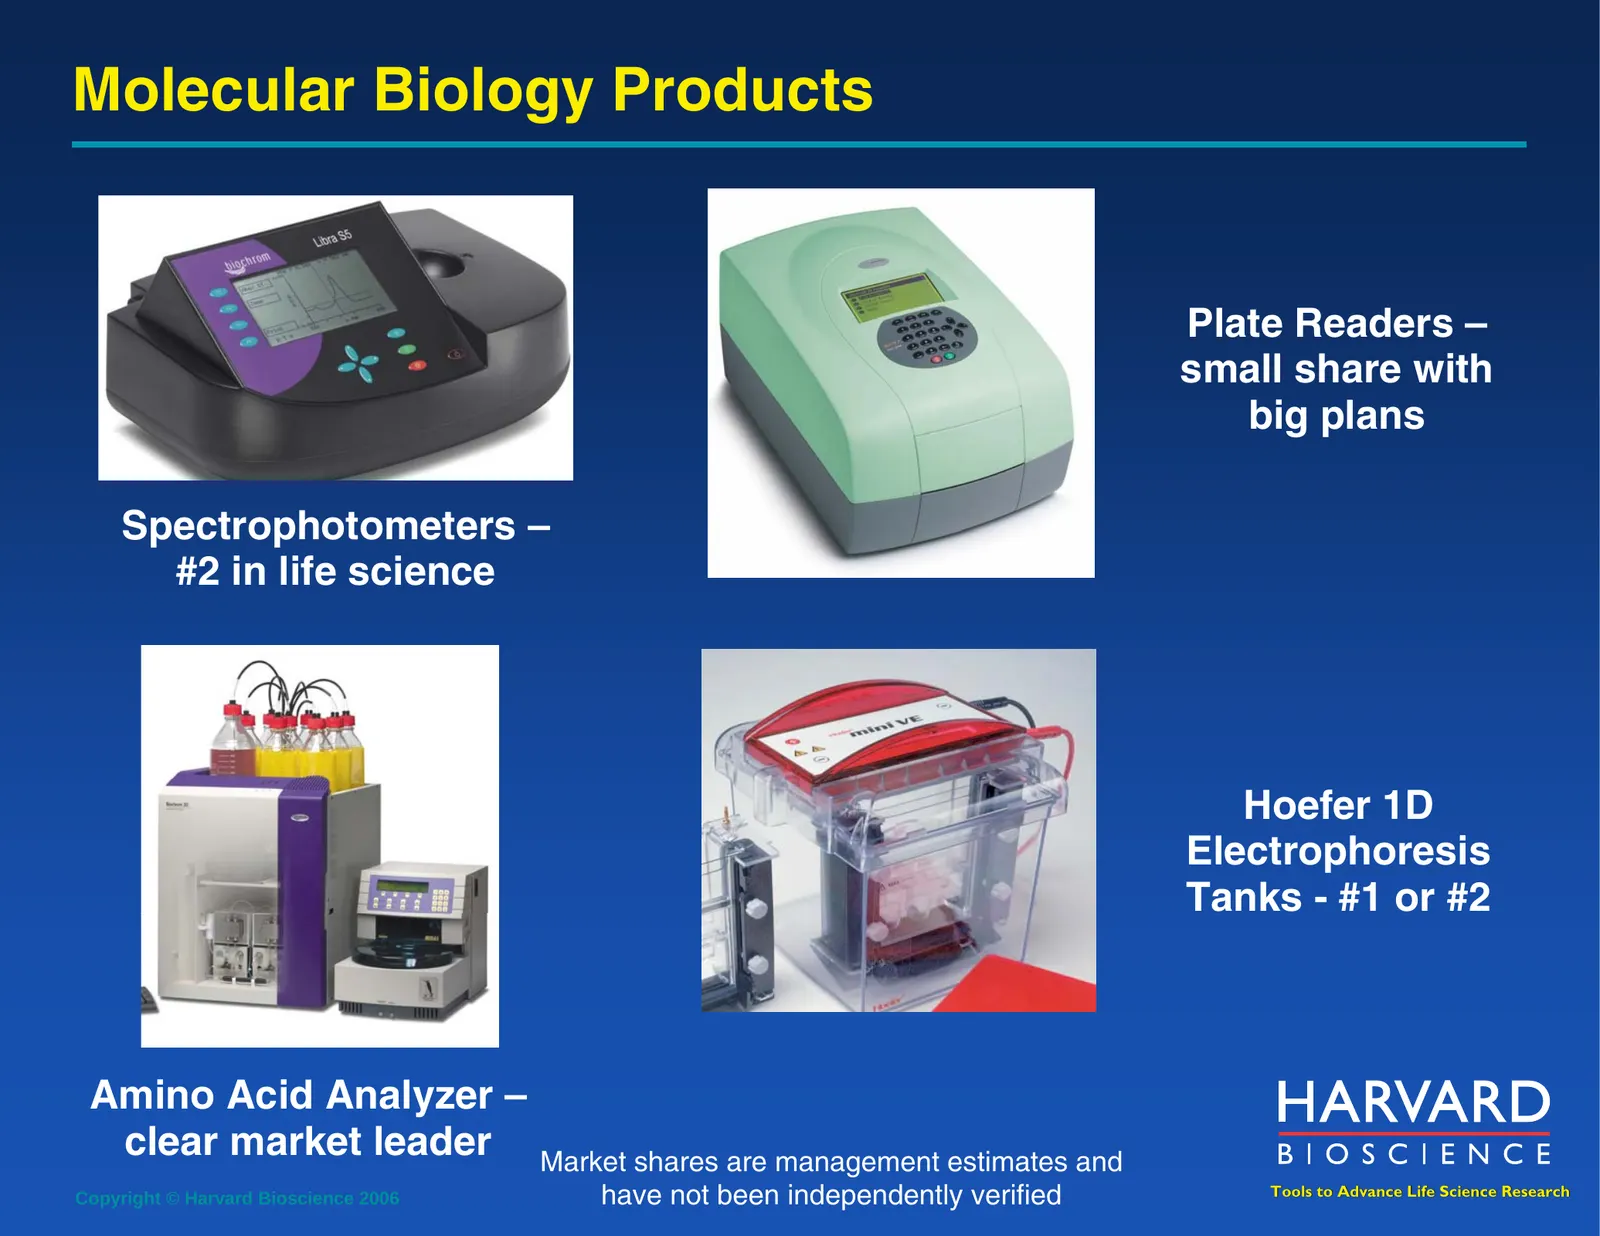
Molecular Biology Products Plate Readers – small share with big plans Spectrophotometers – #2 in life science Hoefer 1D Electrophoresis Tanks - #1 or #2 Amino Acid Analyzer – clear market leader Market shares are management estimates and Copyright © Harvard Bioscience 2006 have not been independentl
Slide 15: Established Distribution Channels
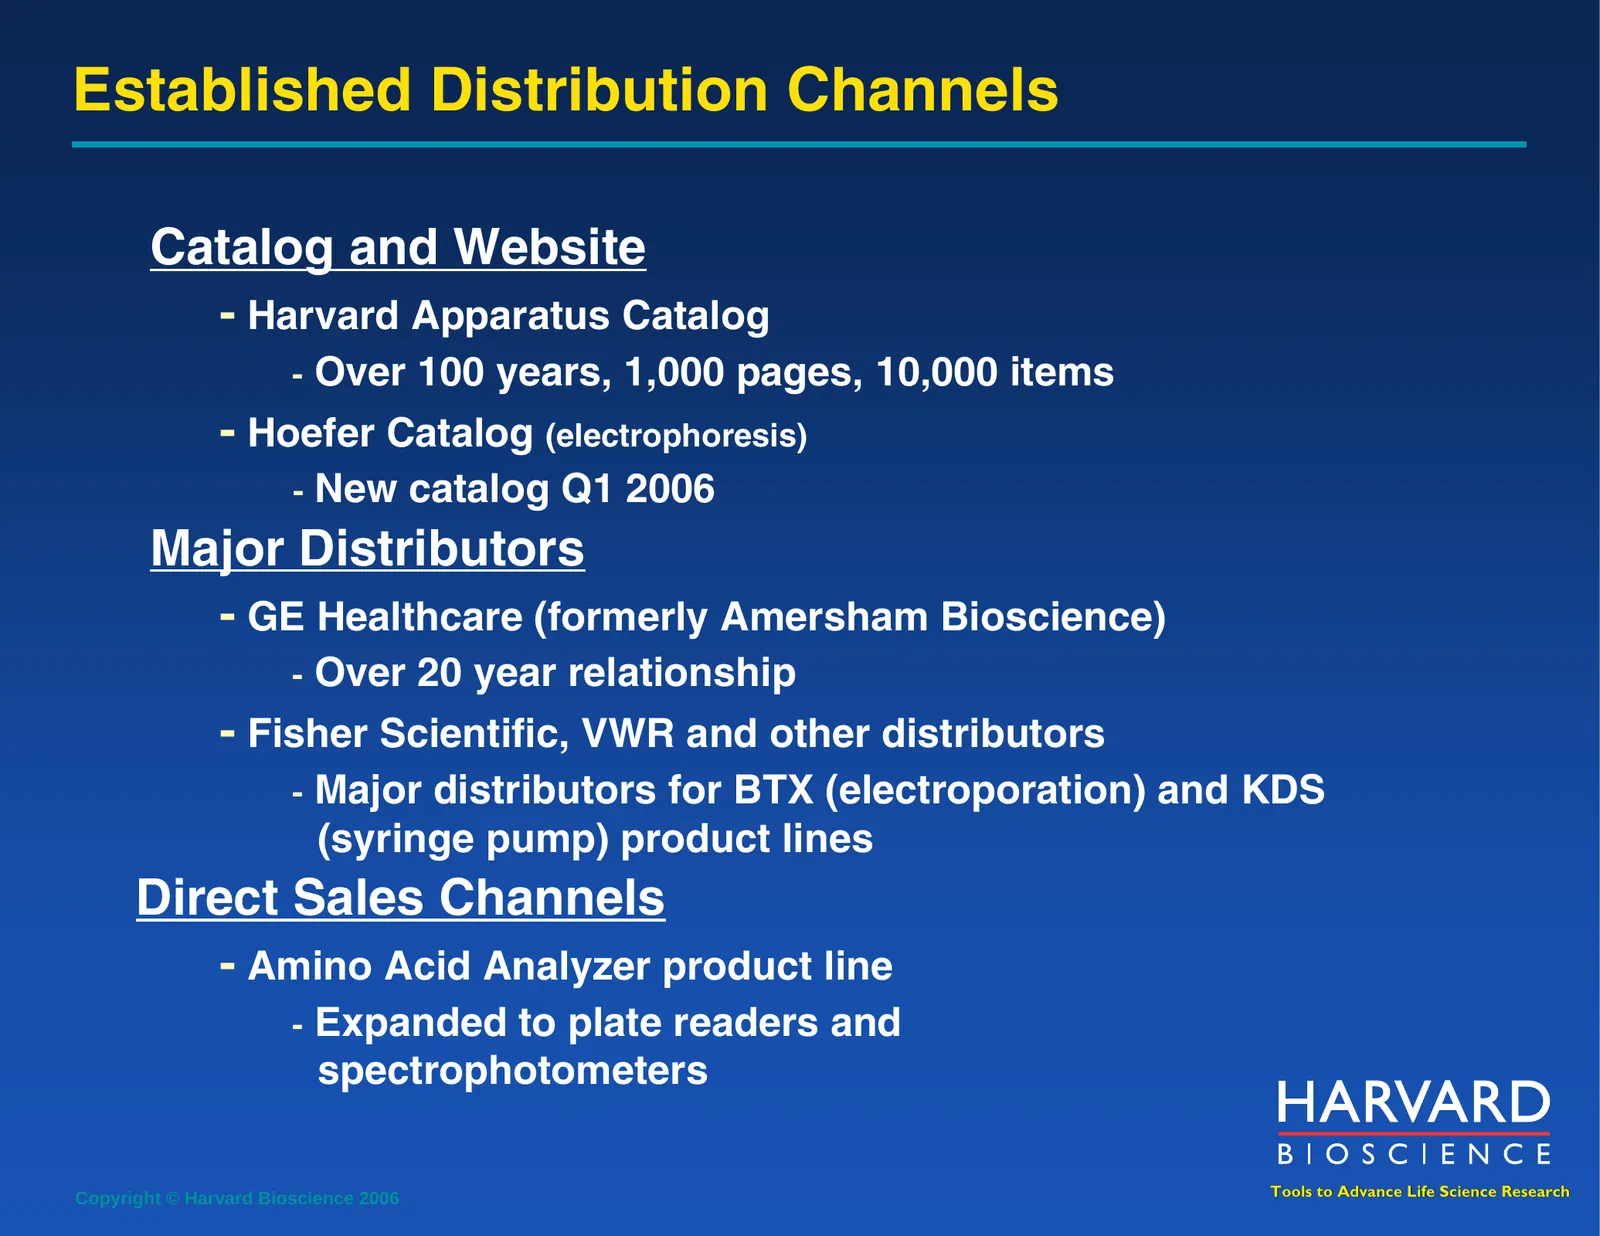
Established Distribution Channels Catalog and Website - Harvard Apparatus Catalog - Over 100 years, 1,000 pages, 10,000 items - Hoefer Catalog (electrophoresis) - New catalog Q1 2006 Major Distributors - GE Healthcare (formerly Amersham Bioscience) - Over 20 year relationship - Fisher Scientific, VW
Slide 16: Established Customer Base
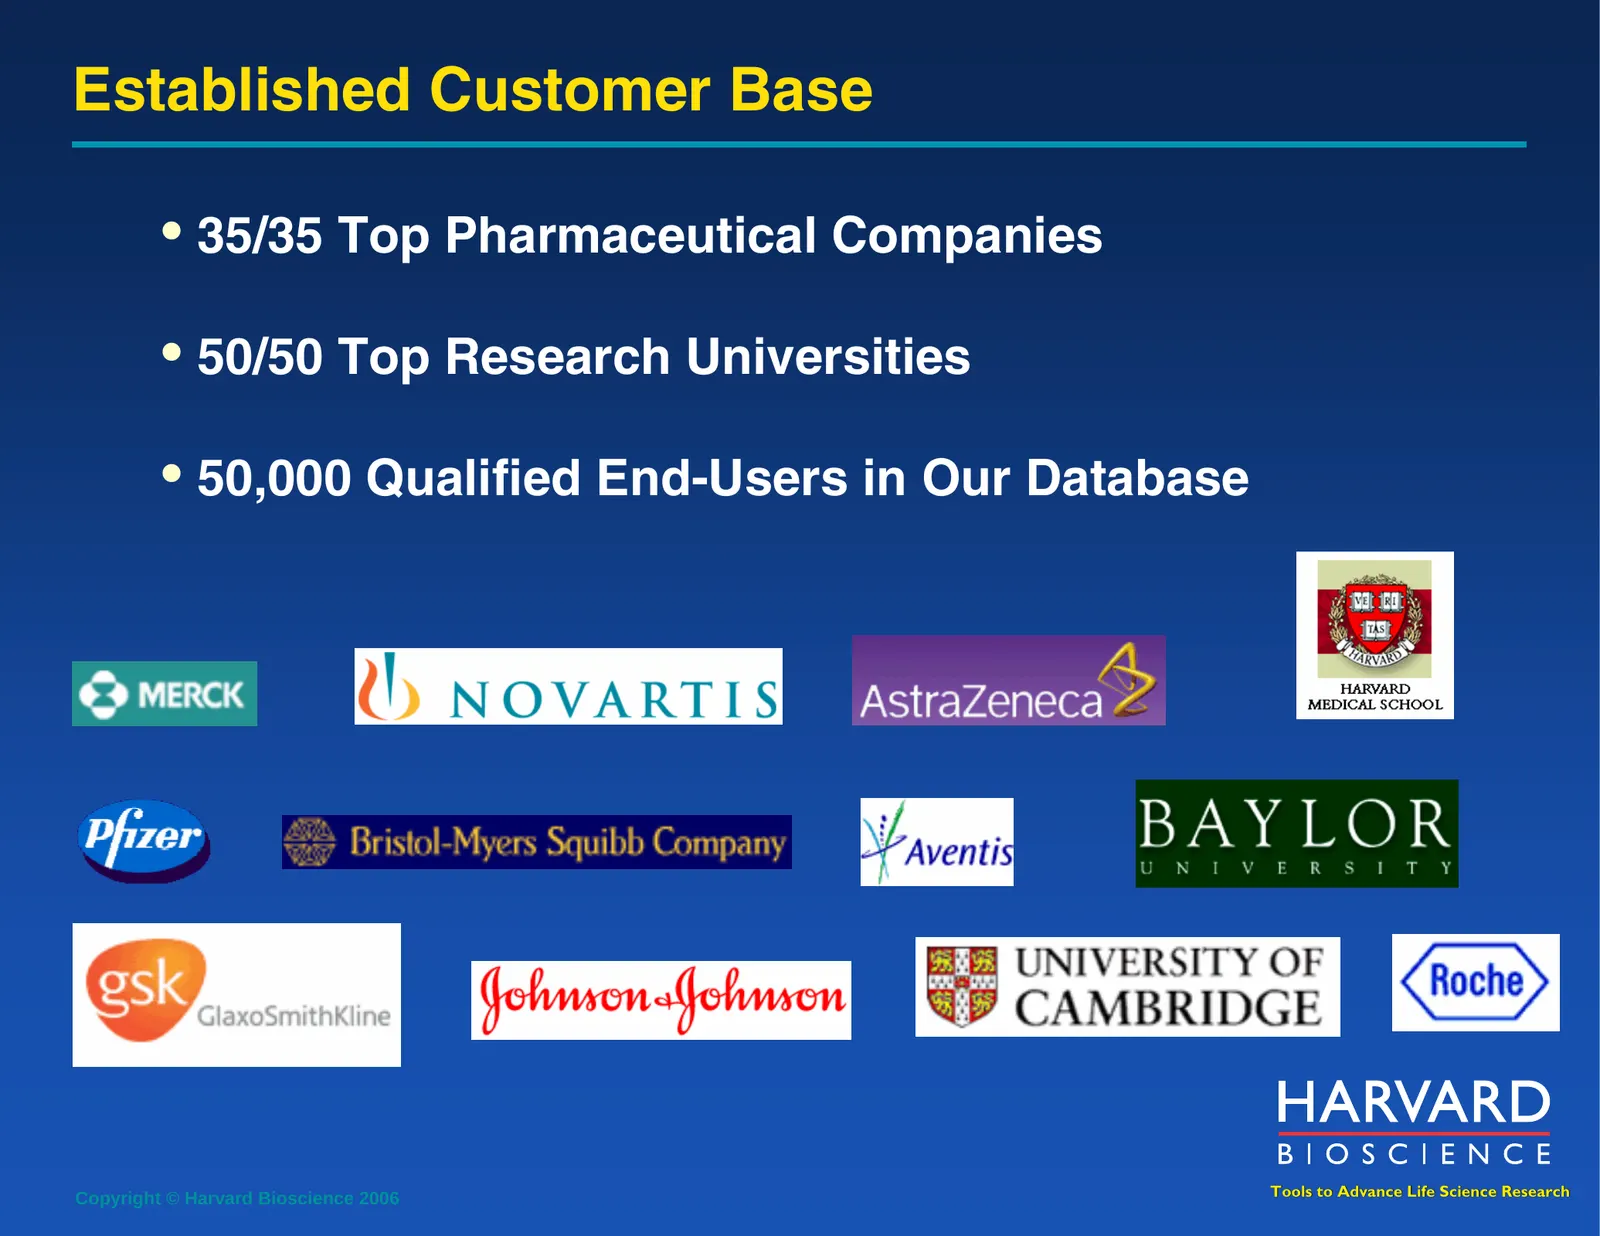
Established Customer Base • 35/35 Top Pharmaceutical Companies • 50/50 Top Research Universities • 50,000 Qualified End-Users in Our Database Copyright © Harvard Bioscience 2006 Tools to Advance Life Science Research
Slide 17: Business Strategy
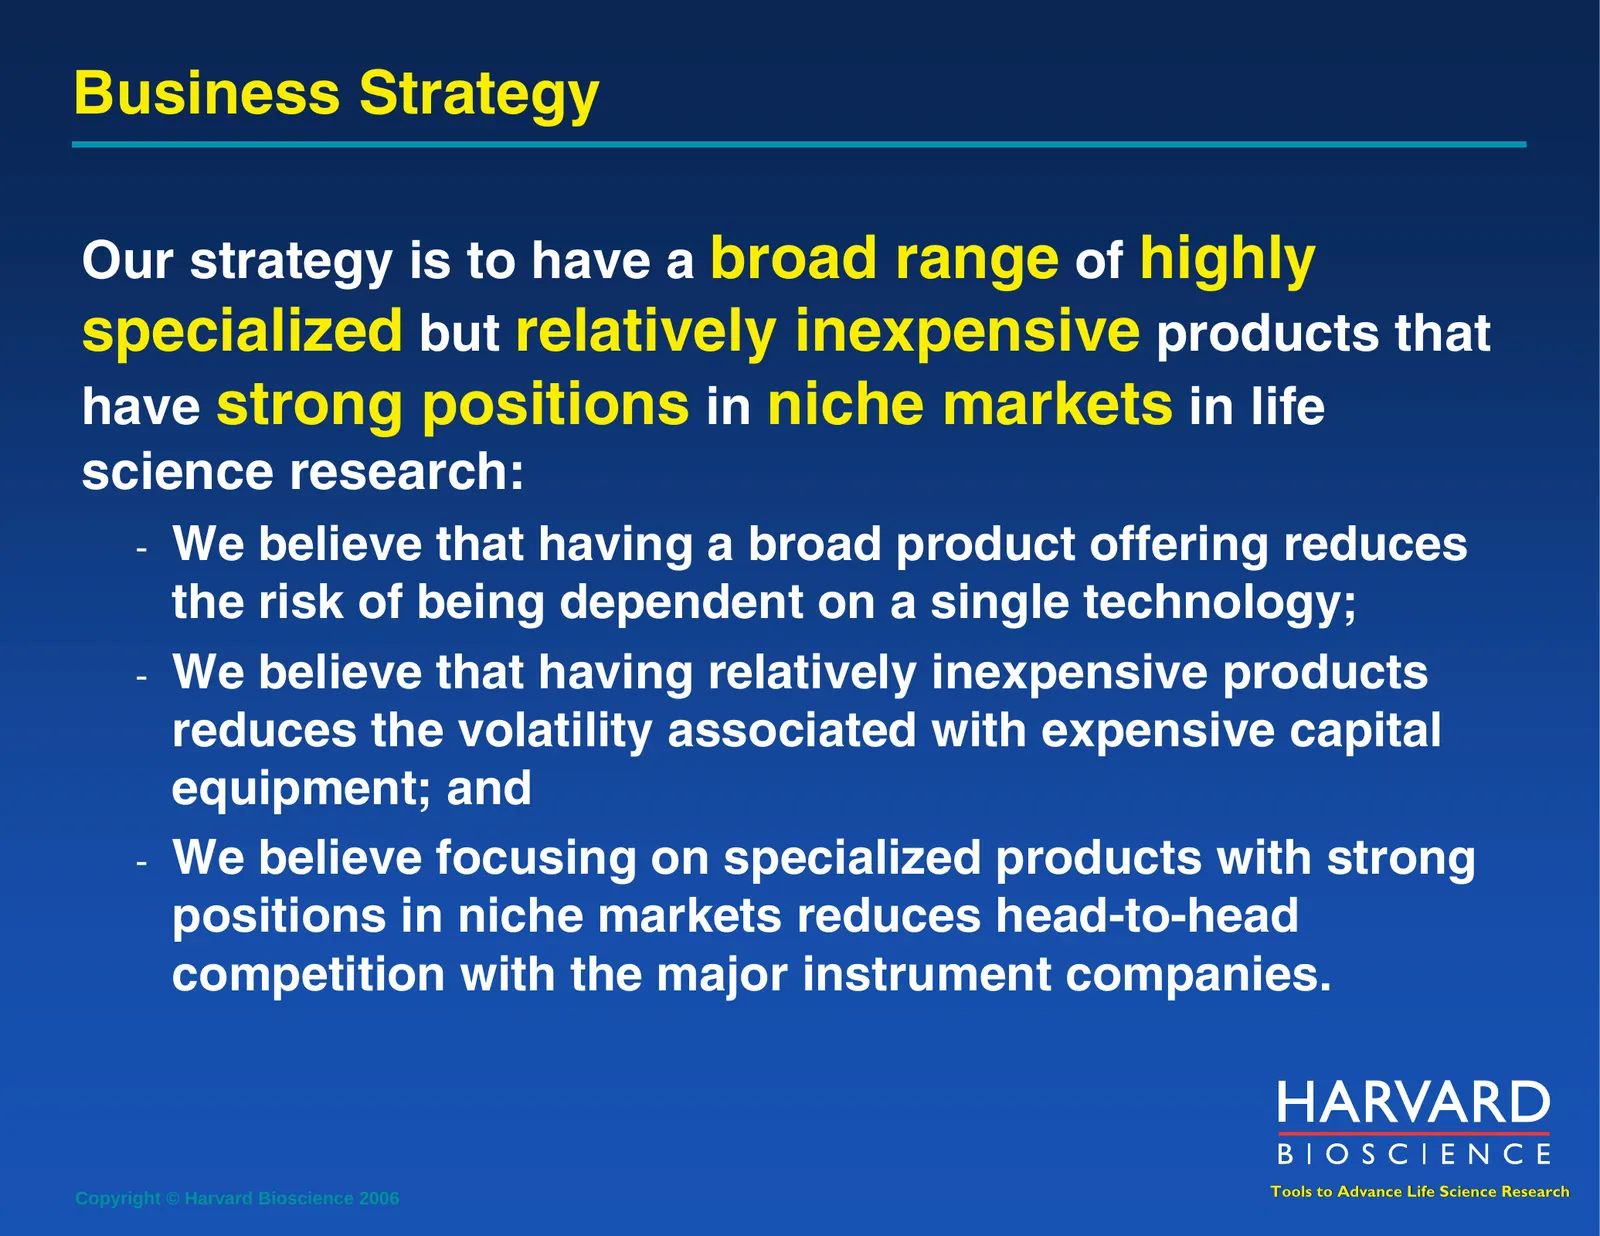
Business Strategy Our strategy is to have a broad range of highly specialized but relatively inexpensive products that have strong positions in niche markets in life science research: - We believe that having a broad product offering reduces the risk of being dependent on a single technology; - We b
Slide 18: Growth Strategy
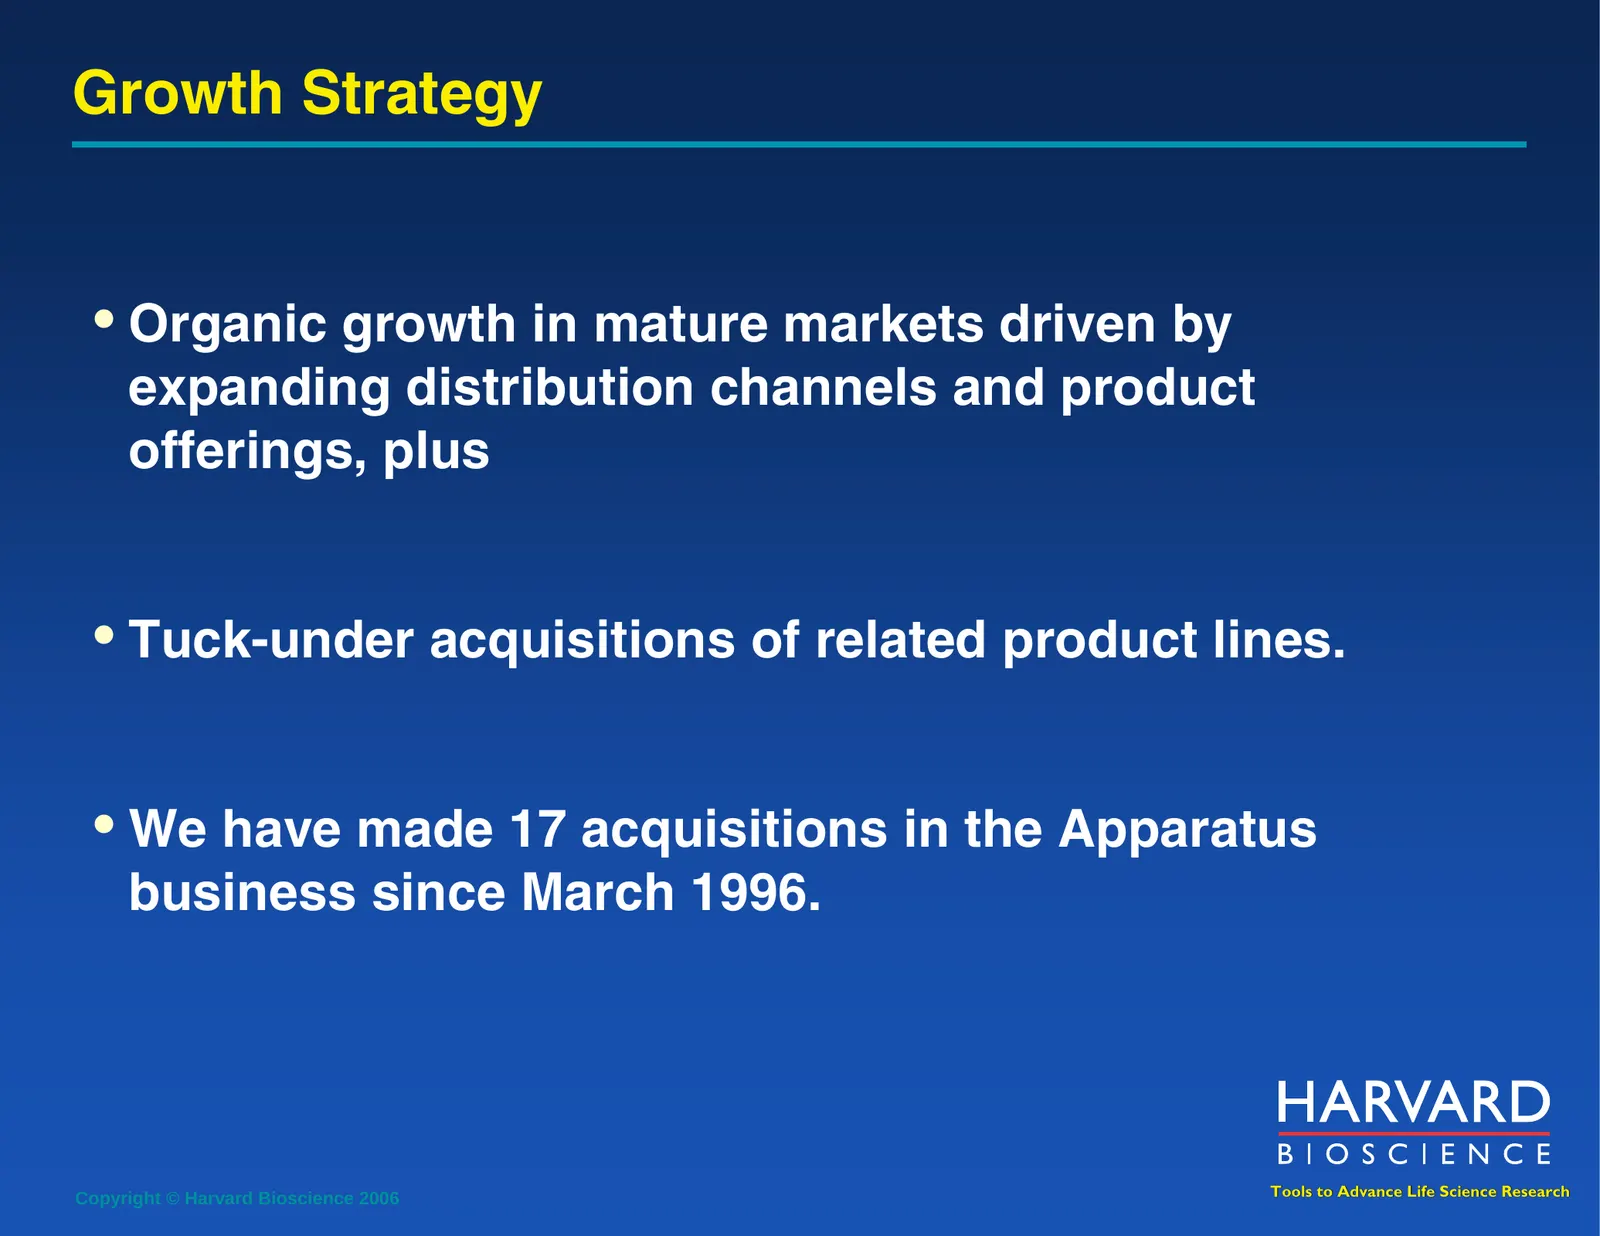
Growth Strategy • Organic growth in mature markets driven by expanding distribution channels and product offerings, plus • Tuck-under acquisitions of related product lines. • We have made 17 acquisitions in the Apparatus business since March 1996. Copyright © Harvard Bioscience 2006 Tools to Advance
Slide 19: Growth Model
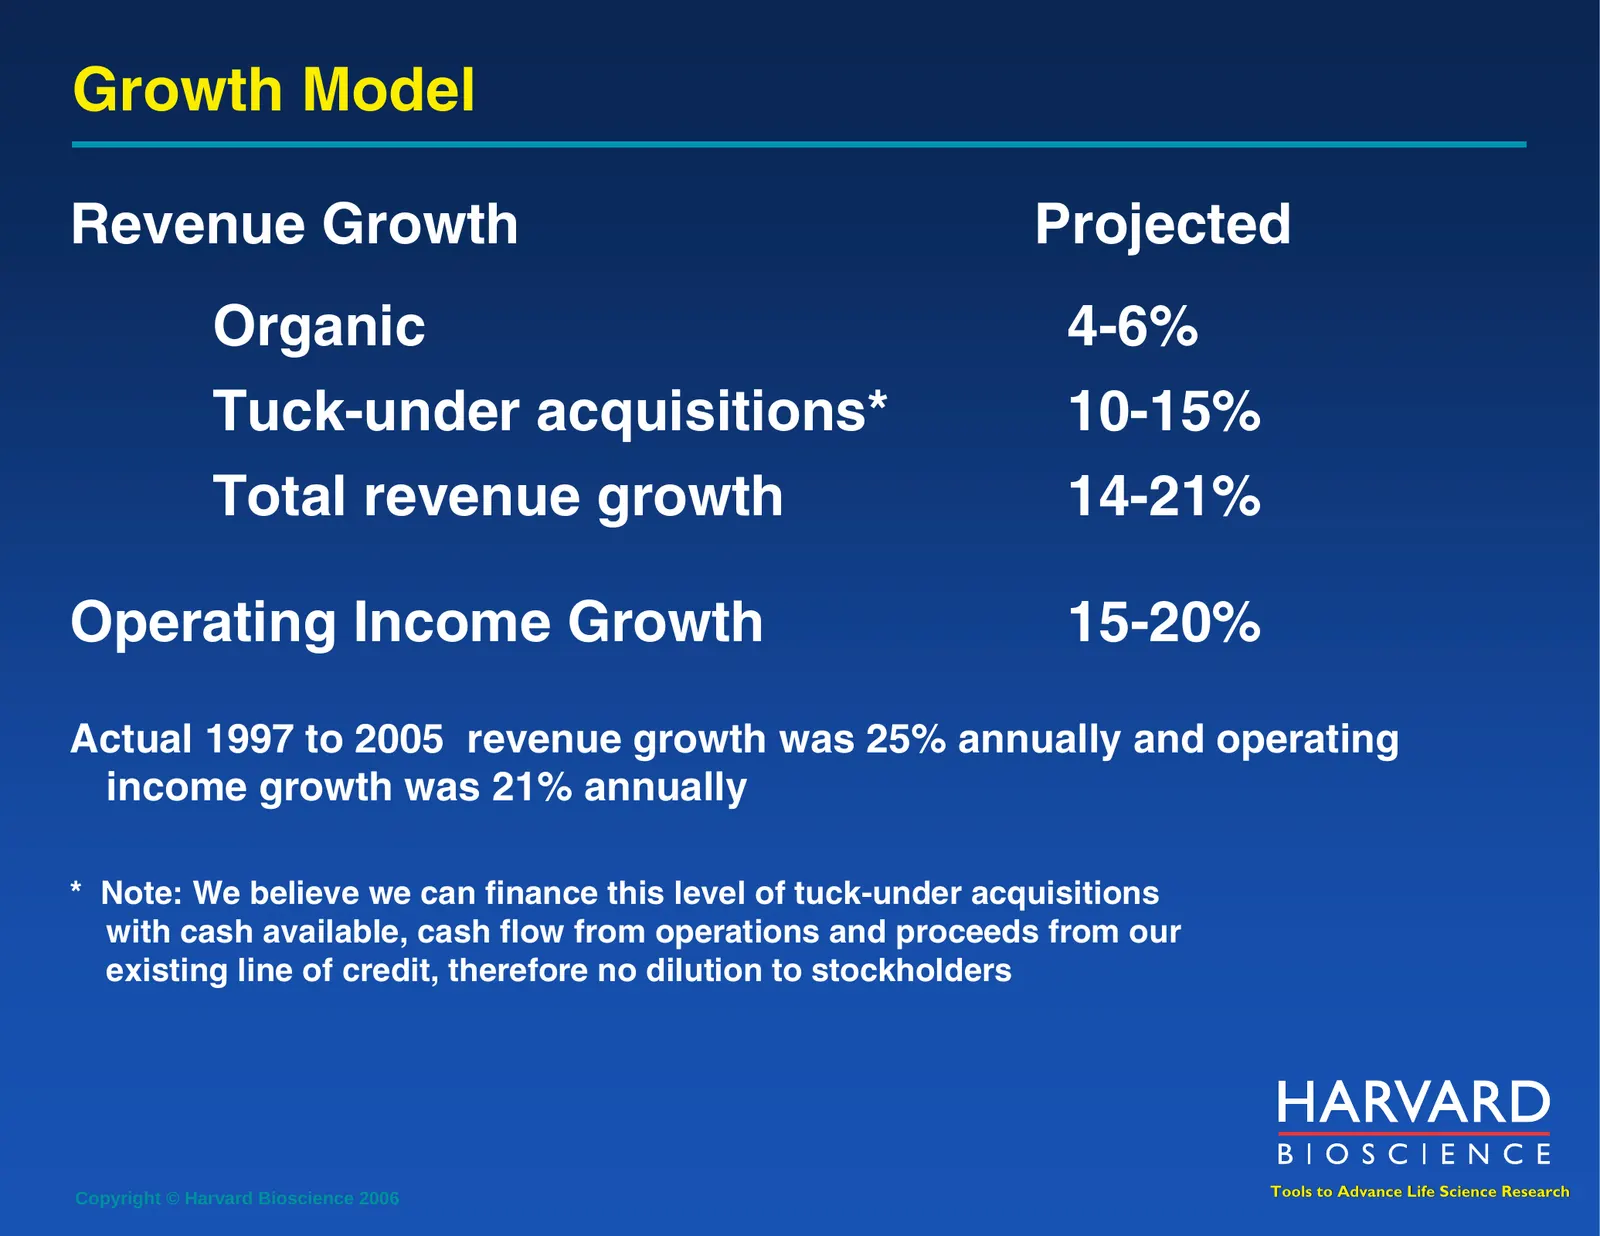
Growth Model Revenue Growth Projected Organic 4-6% Tuck-under acquisitions* 10-15% Total revenue growth 14-21% Operating Income Growth 15-20% Actual 1997 to 2005 revenue growth was 25% annually and operating income growth was 21% annually * Note: We believe we can finance this level of tuck-under ac
Slide 20: Experienced Management Team
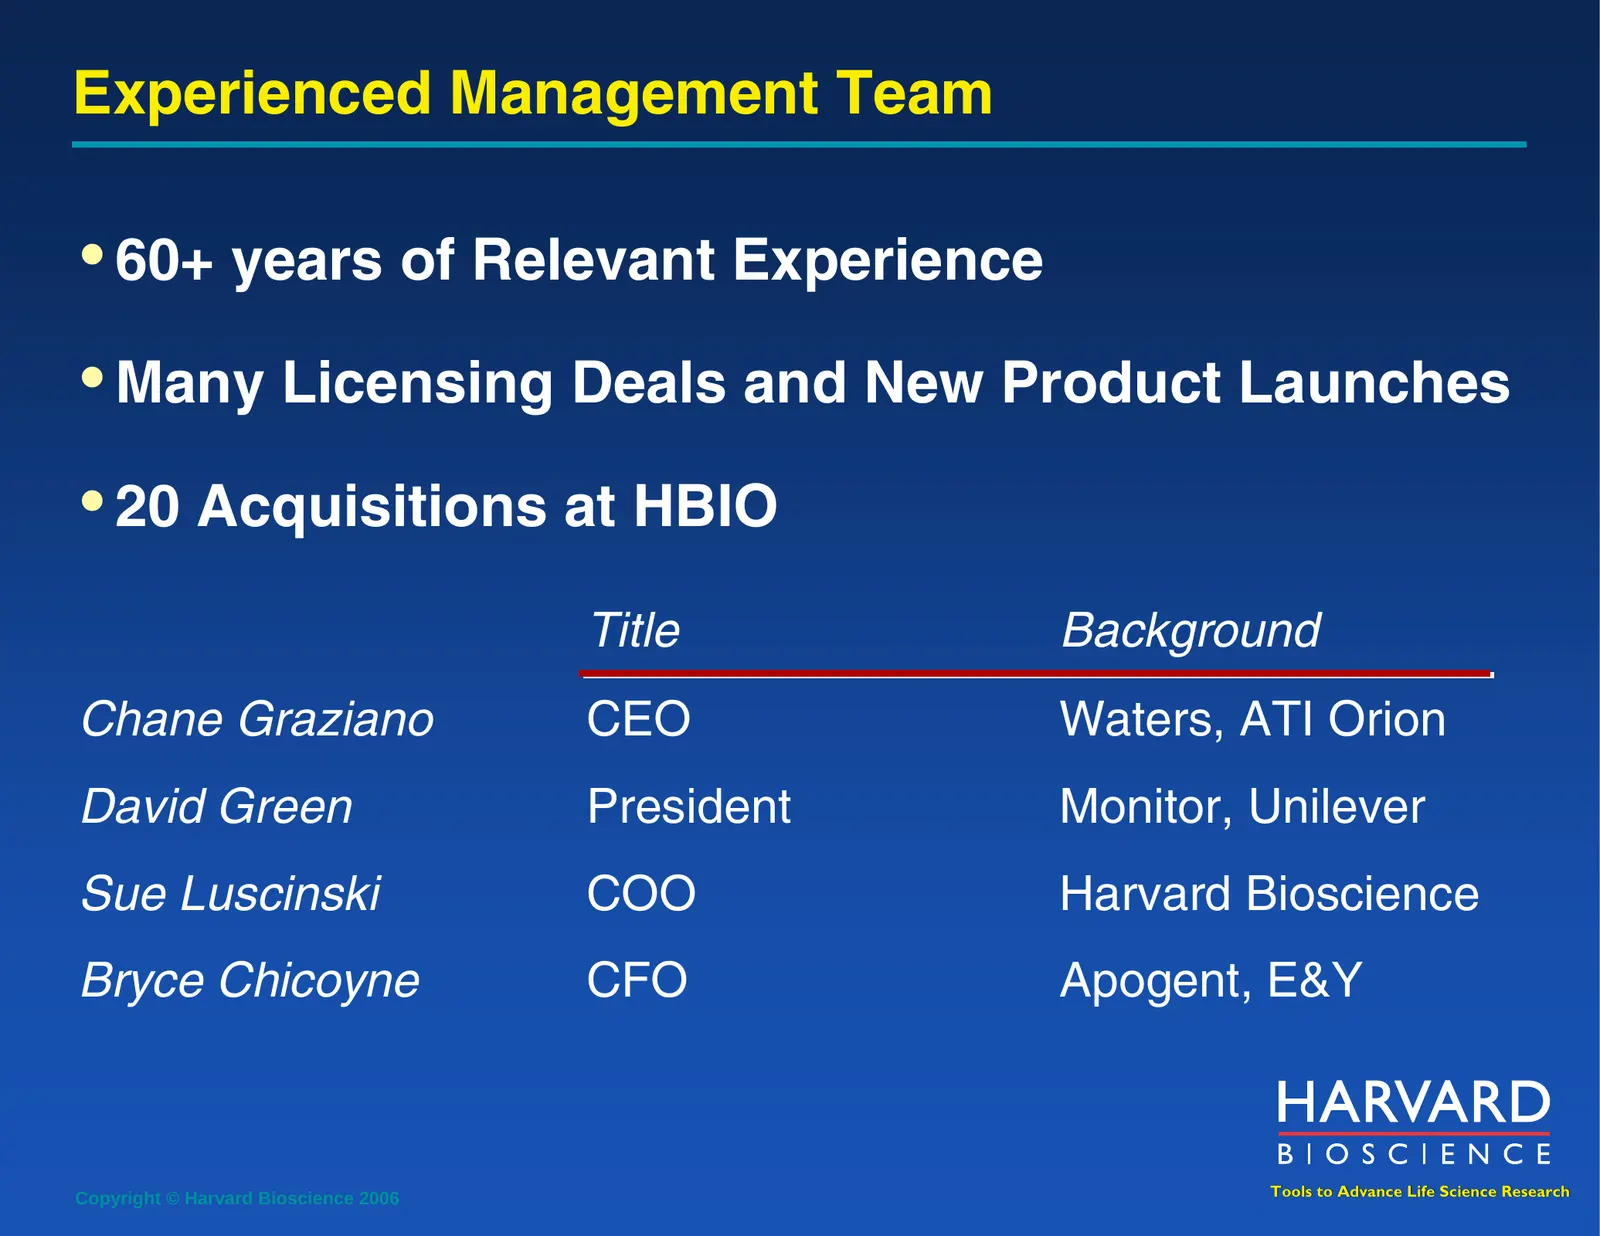
Experienced Management Team • 60+ years of Relevant Experience • Many Licensing Deals and New Product Launches • 20 Acquisitions at HBIO Title Background Chane Graziano CEO Waters, ATI Orion David Green President Monitor, Unilever Sue Luscinski COO Harvard Bioscience Bryce Chicoyne CFO Apogent, E&Y
Slide 21: Commitment to Stockholder Value
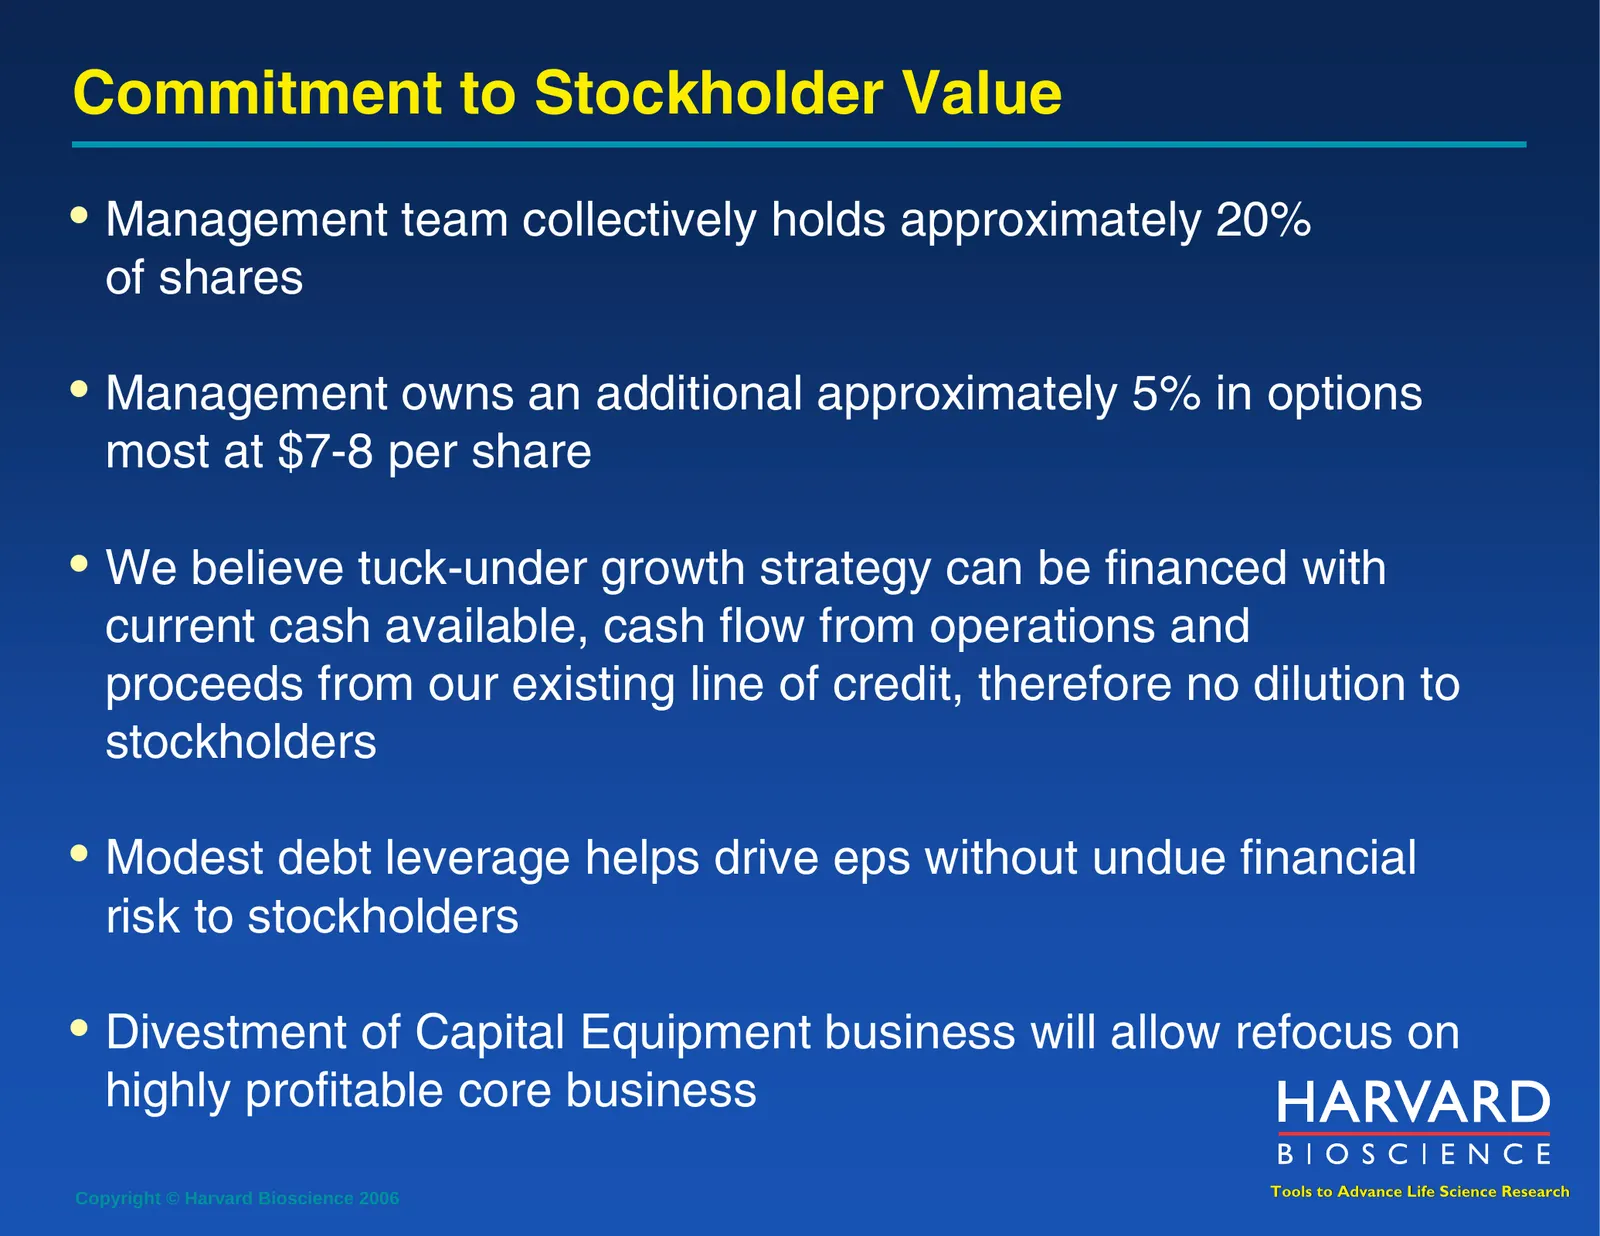
Commitment to Stockholder Value • Management team collectively holds approximately 20% of shares • Management owns an additional approximately 5% in options most at $7-8 per share • We believe tuck-under growth strategy can be financed with current cash available, cash flow from operations and proce
Slide 22: Investment Highlights
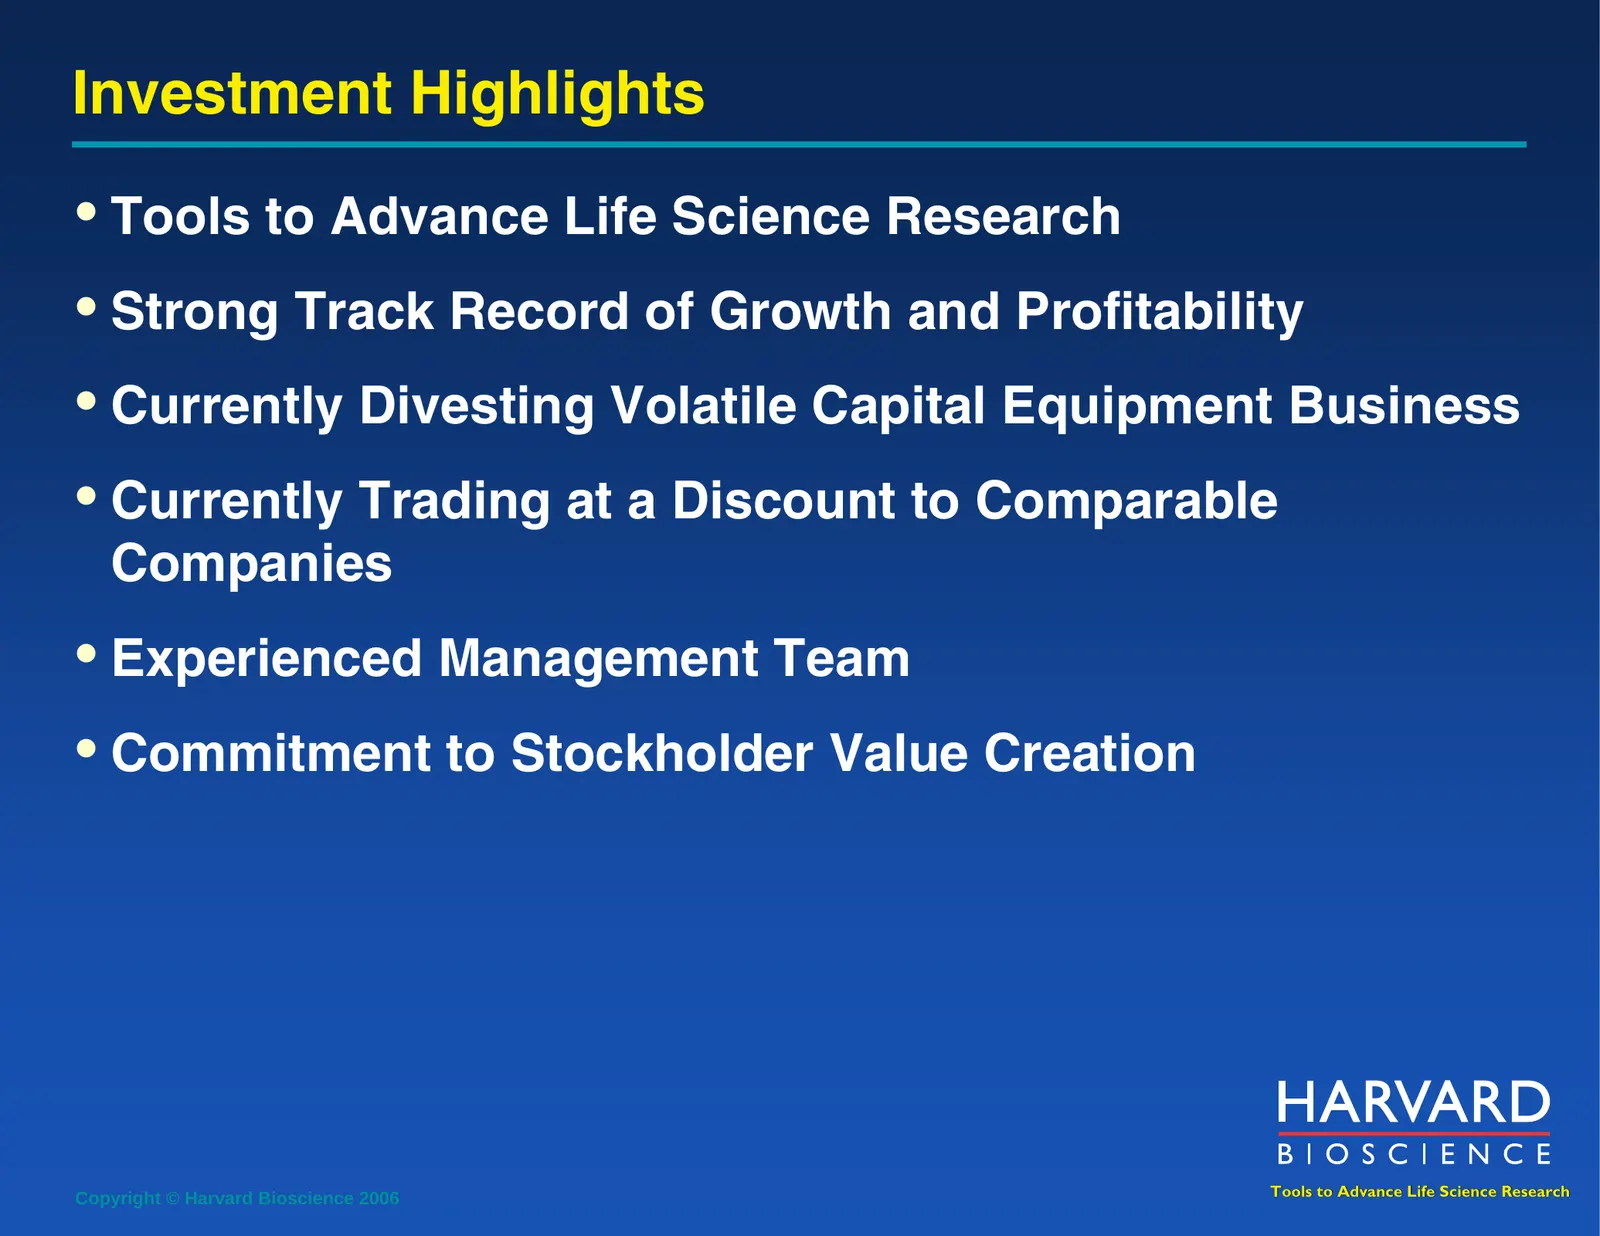
Investment Highlights • Tools to Advance Life Science Research • Strong Track Record of Growth and Profitability • Currently Divesting Volatile Capital Equipment Business • Currently Trading at a Discount to Comparable Companies • Experienced Management Team • Commitment to Stockholder Value Creatio
Slide 23: Tools to Advance Life Science Research
Tools to Advance Life Science Research NASDAQ HBIO Copyright © Harvard Bioscience 2006
Slide 24: Appendix A
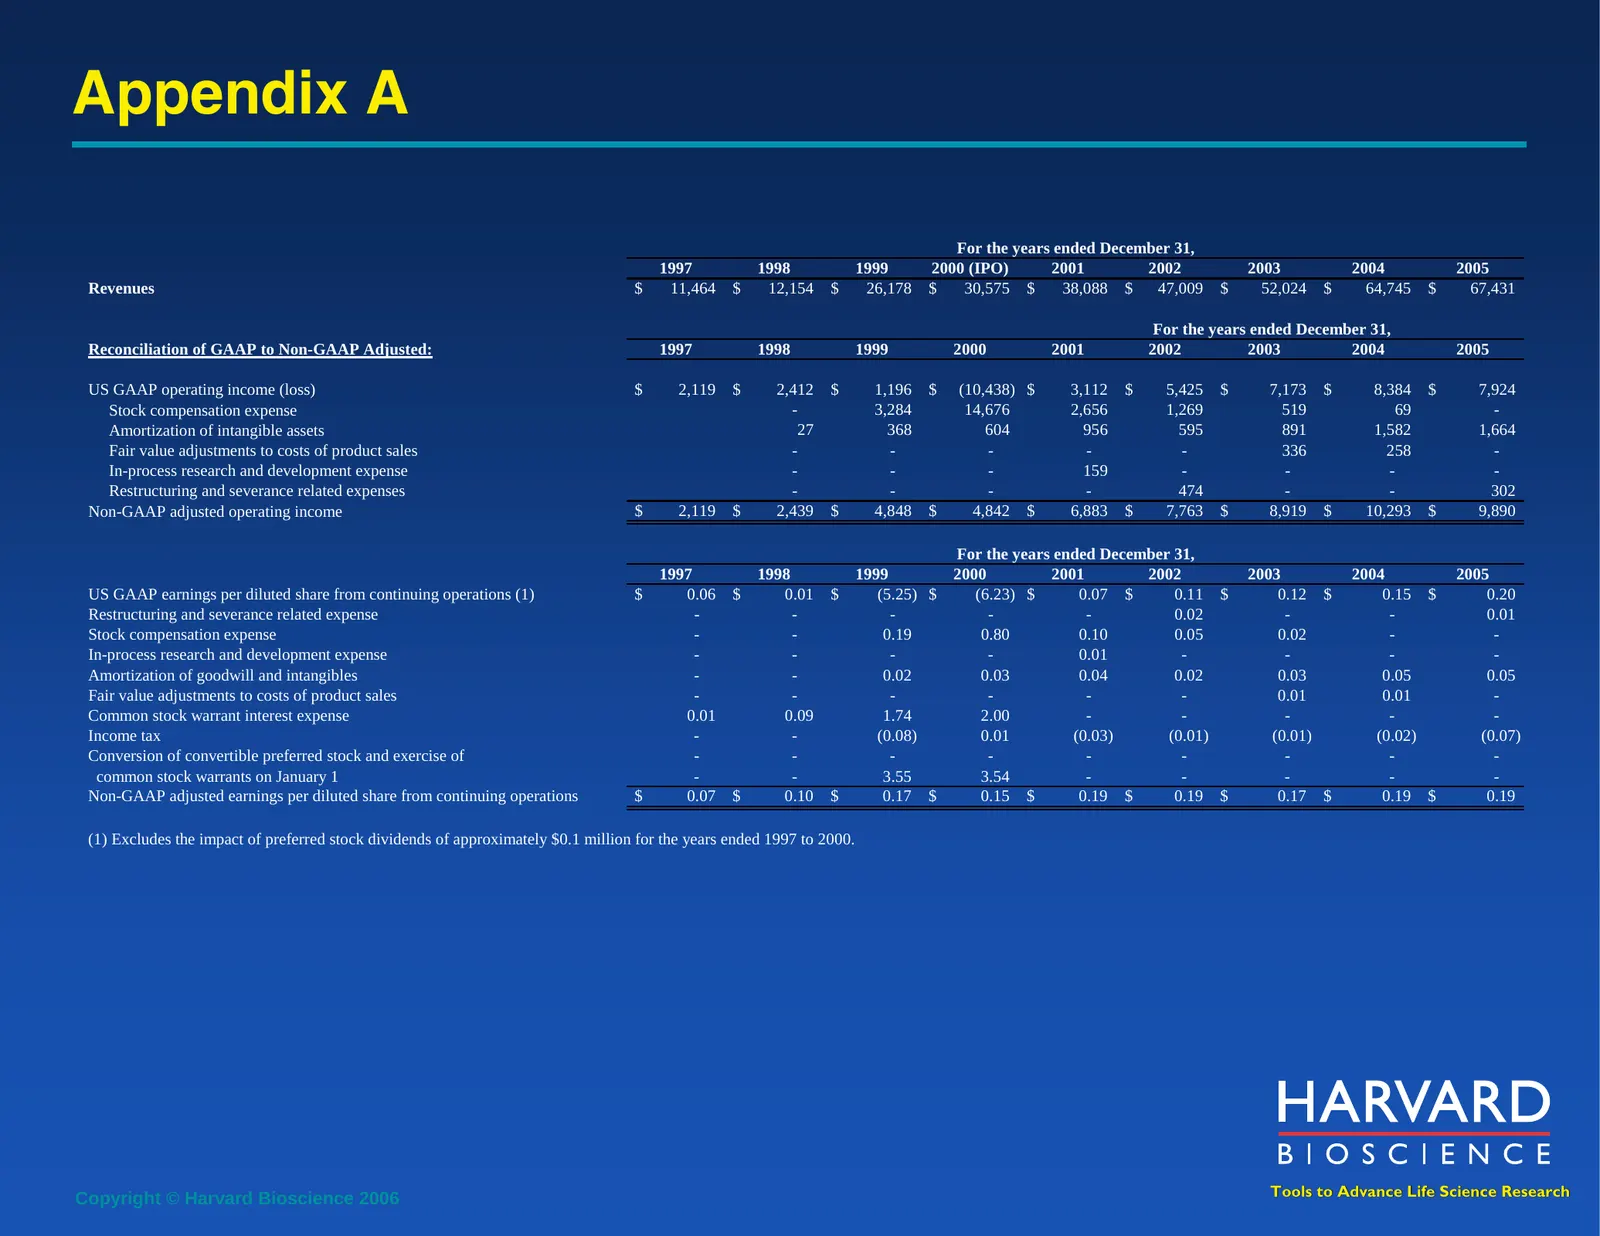
Appendix A For the years ended December 31, 1997 1998 1999 2000 (IPO) 2001 2002 2003 2004 2005 Revenues $ 11,464 $ 12,154 $ 26,178 $ 30,575 $ 38,088 $ 47,009 $ 52,024 $ 64,745 $ 67,431 For the years ended December 31, Reconciliation of GAAP to Non-GAAP Adjusted: 1997 1998 1999 2000 2001 2002 2003 20
Slide 25: Appendix B
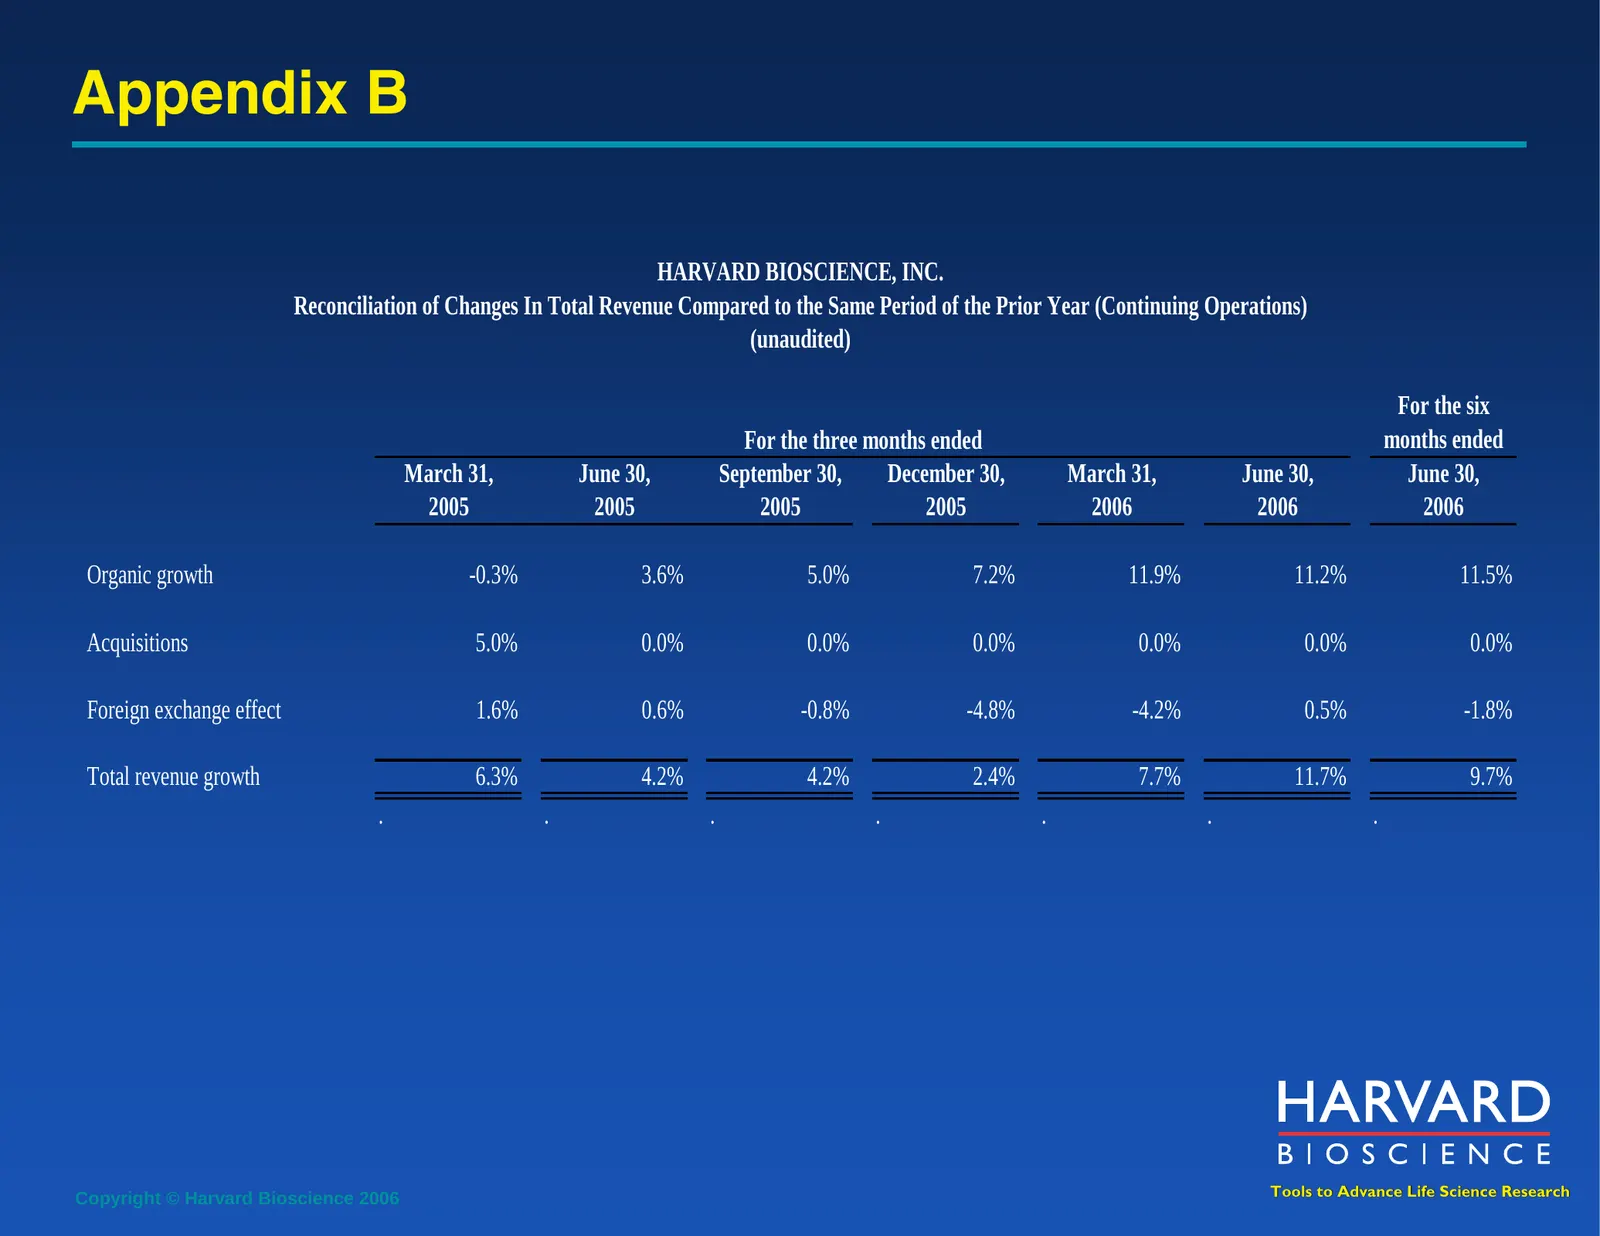
Appendix B HARVARD BIOSCIENCE, INC. Reconciliation of Changes In Total Revenue Compared to the Same Period of the Prior Year (Continuing Operations) (unaudited) For the six For the three months ended months ended March 31, June 30, September 30, December 30, March 31, June 30, June 30, 2005 2005 200
Slide 26: Appendix C
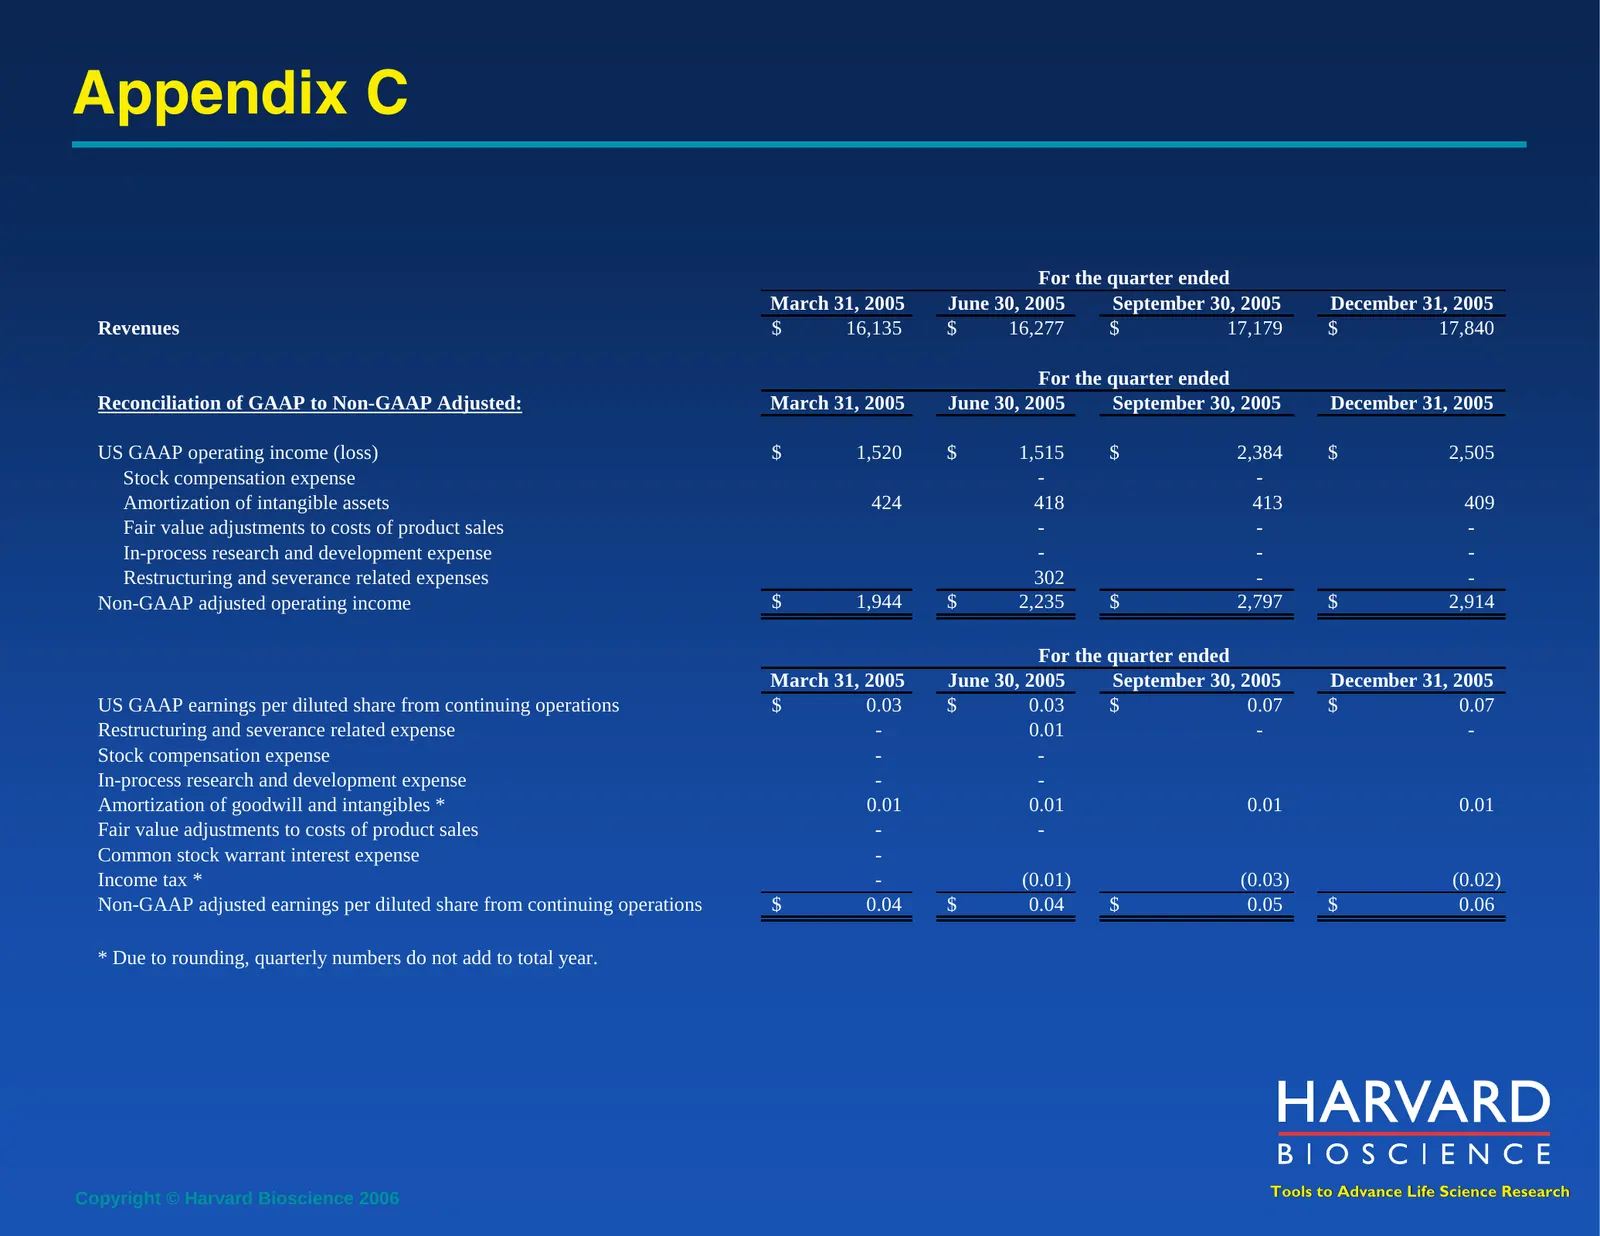
Appendix C For the quarter ended March 31, 2005 June 30, 2005 September 30, 2005 December 31, 2005 Revenues $ 16,135 $ 16,277 $ 17,179 $ 17,840 For the quarter ended Reconciliation of GAAP to Non-GAAP Adjusted: March 31, 2005 June 30, 2005 September 30, 2005 December 31, 2005 US GAAP operating incom
Slide 27: Appendix D
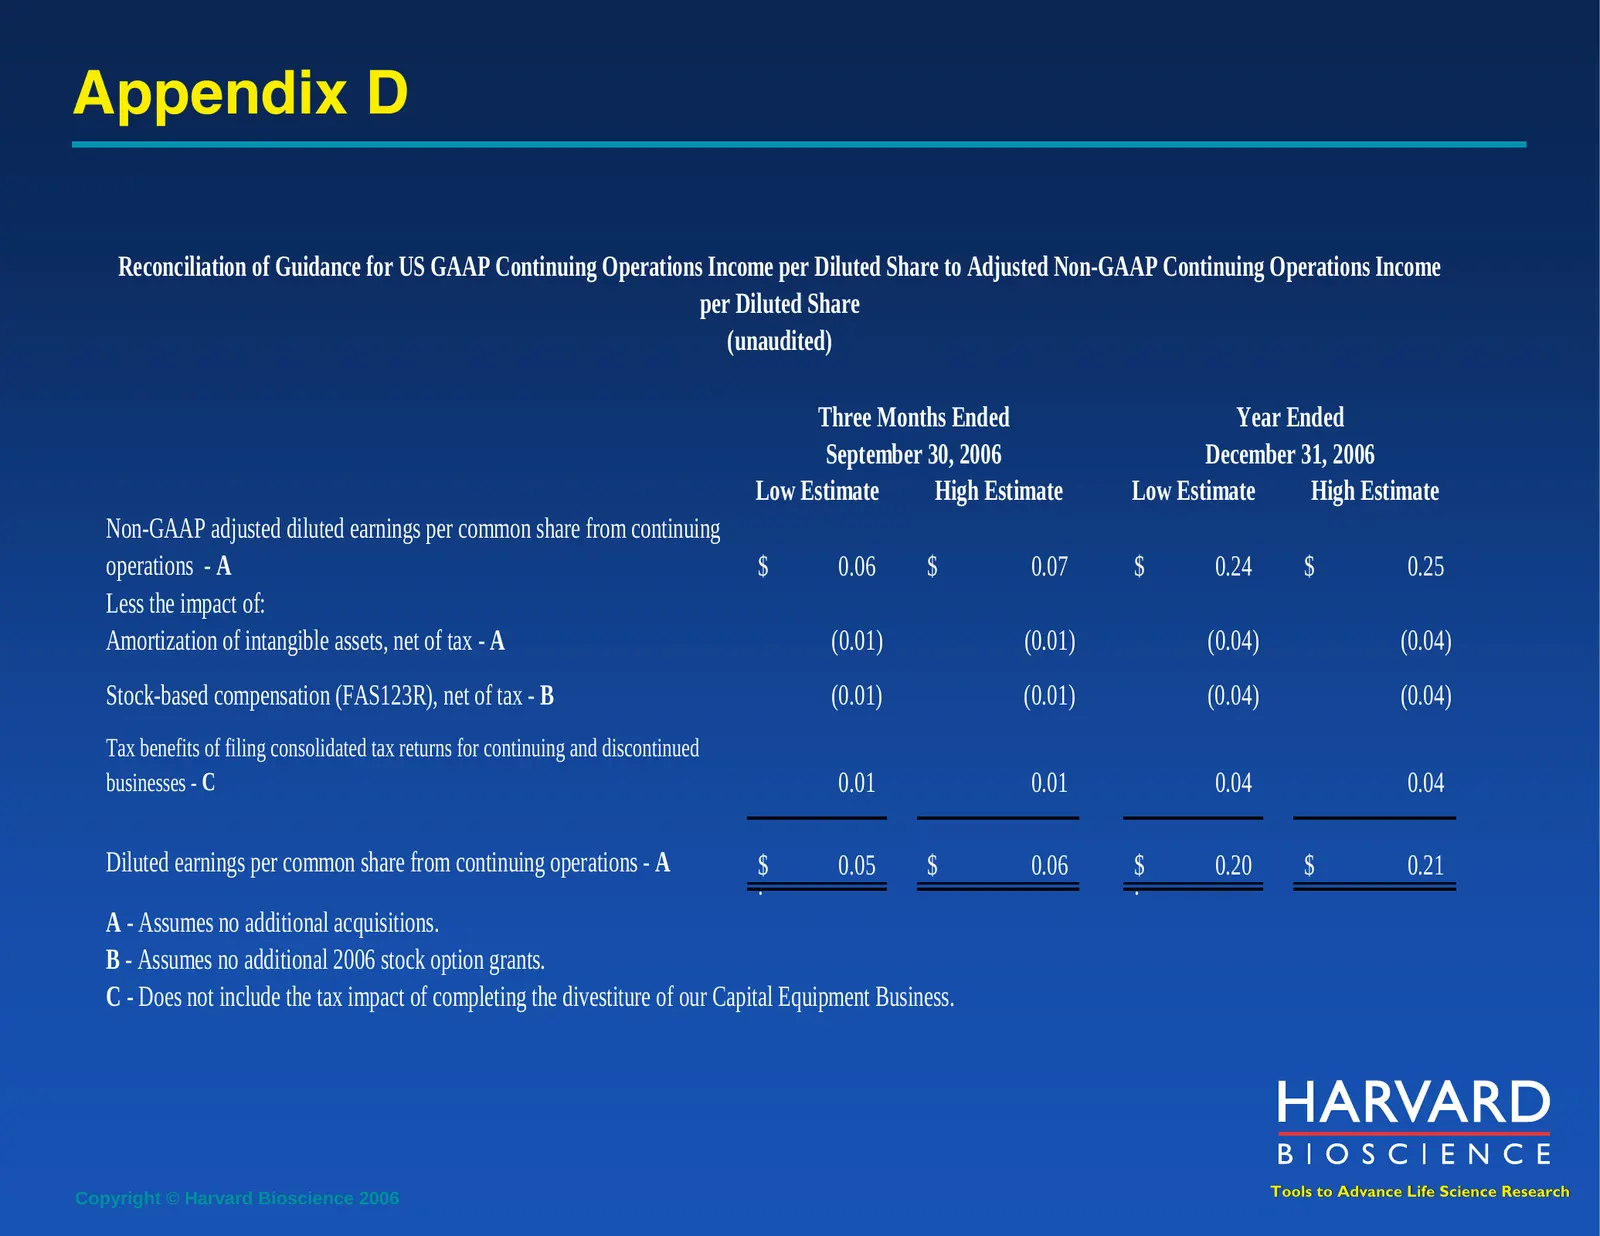
Appendix D Reconciliation of Guidance for US GAAP Continuing Operations Income per Diluted Share to Adjusted Non-GAAP Continuing Operations Income per Diluted Share (unaudited) Three Months Ended Year Ended September 30, 2006 December 31, 2006 Low Estimate High Estimate Low Estimate High Estimate No
Source: Internet Archive copy of harvardbioscience.com
More decks from Harvard Bioscience, Inc.
 Q3 2026 Earnings Presentation15 slides · Nov 10, 2026
 Investor Presentation (November 2026)32 slides · Nov 10, 2026
 Q2 2026 Earnings Presentation15 slides · Aug 11, 2026
 Investor Presentation (August 2026)32 slides · August 2026
 Investor Presentation (May 2026)31 slides · May 12, 2026
 Q1 2026 Earnings Presentation13 slides · May 12, 2026