Harvard Bioscience, Inc. · NASDAQ:HBIO
Harvard Bioscience — Investor Presentation (November 2026)
32 slides from Harvard Bioscience's investor presentation, Nov 10, 2026

Slide 1: Harvard Bioscience Investor Overview November 2026
NASDAQ: HBIO Harvard Bioscience Investor Overview November 202 6
Slide 2: Forward-Looking Statements
Forward - Looking Statements This document contains forward - looking statements within the meaning of the federal securities laws, including the Private Securities Litigation Reform Act of 1995 . Forward - looking statements may be identified by the use of words such as “may,” “will,” “expect,” “pl
Slide 3: Vision: Accelerating drug development through human-relevant translational tools
“Accelerating drug development through human - relevant translational tools” Vision 3
Slide 4: Harvard Bioscience By The Numbers – FY2025
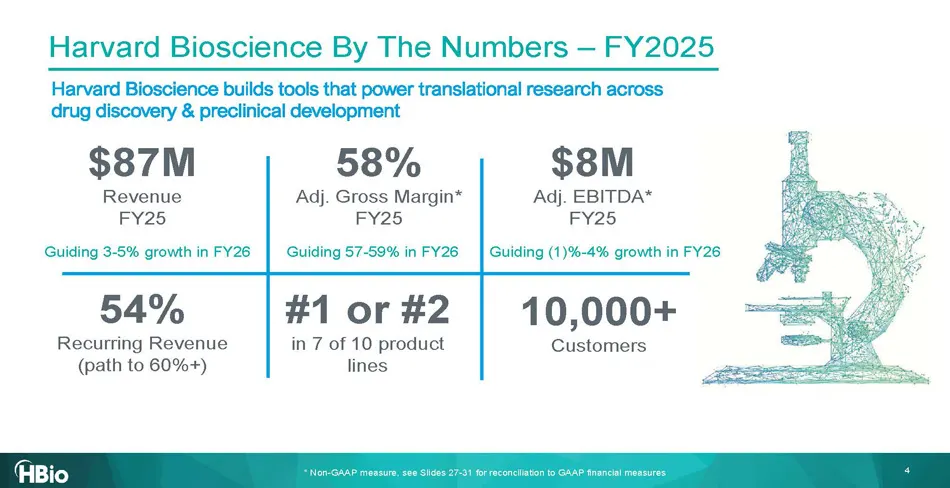
Harvard Bioscience By The Numbers – FY2025 $ 87 M Revenue FY25 58 % Adj. Gross Margin * FY25 $ 8M Adj . EBITDA * FY25 5 4 % R ecurring R evenue (path to 60%+) #1 or #2 in 7 of 10 product lines 10,000+ C ustomers Harvard Bioscience builds tools that power translational research across drug discovery
Slide 5: Harvard Bioscience Growth Catalysts
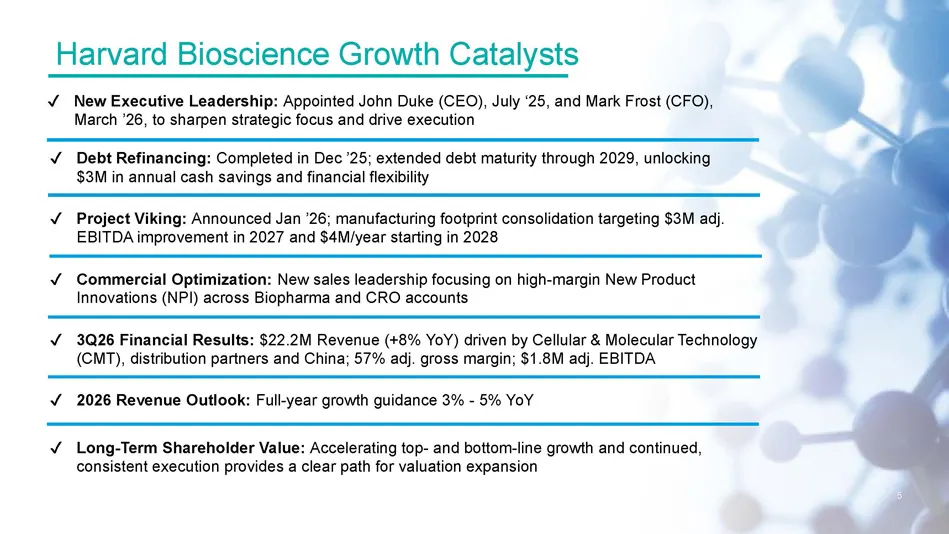
✔ Project Viking: Announced Jan ’26; manufacturing footprint consolidation targeting $3M adj. EBITDA improvement in 2027 and $4M/year starting in 2028 5 ✔ Commercial Optimization: New s ales leadership focusing on high - margin New Product Innovations (NPI) across Biopharma and CRO accounts ✔ 3Q26 F
Slide 6: Project Viking: Strategic Manufacturing Consolidation
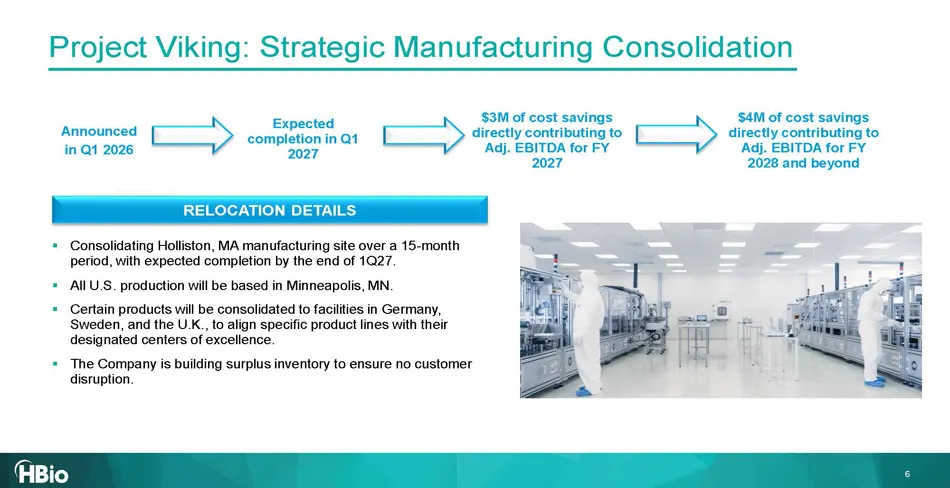
6 Project Viking: Strategic Manufacturing Consolidation Announced in Q1 2026 Expected completion in Q1 2027 $3M of cost savings directly contributing to Adj. EBITDA for FY 2027 $4M of cost savings directly contributing to Adj. EBITDA for FY 2028 and beyond ▪ Consolidating Holliston, MA manufacturing
Slide 7: Key Strategic Pillars: The New Harvard Bioscience
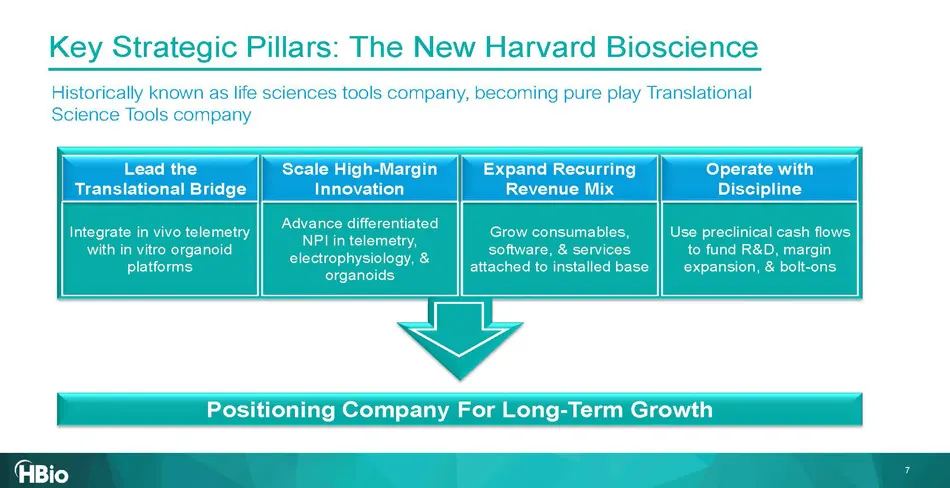
Key Strategic Pillars: The New Harvard Bioscience Historically known as life sciences tools company, becoming pure play Translational Science Tools company Positioning Company For Long - Term Growth Integrate in vivo telemetry with in vitro organoid platforms Scale High - Margin Innovation Advance d
Slide 8: An Evolving Translational Science Market
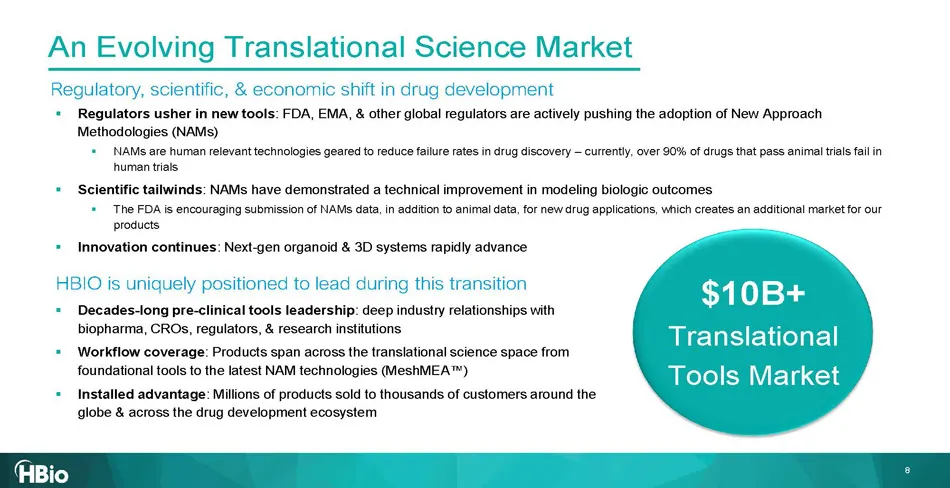
An Evolving Translational Science Market ▪ Regulators usher in new tools : FDA, EMA, & other global regulators are actively pushing the adoption of New Approach Methodologies (NAMs) ▪ NAMs are human relevant technologies geared to reduce failure rates in drug discovery – currently, over 90% of drugs
Slide 9: A global operating platform with embedded growth leverage
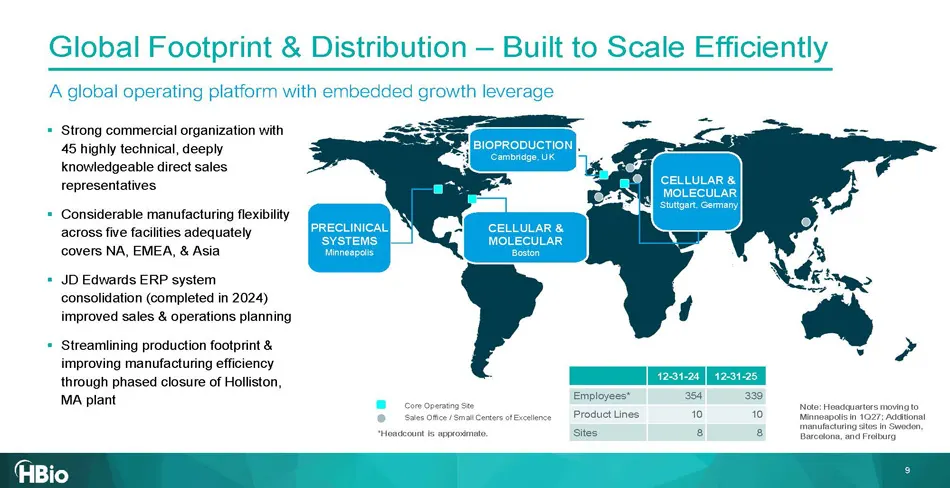
CELLULAR & MOLECULA R Boston PRECLINICAL SYSTEMS Minneapolis Core Operating Site Sales Office / Small Centers of Excellence *Headcount is approximate. Note: Headquarters moving to Minneapolis in 1Q27; Additional manufacturing sites in Sweden, Barcelona, and Freiburg 12 - 3 1 - 25 12 - 31 - 24 3 39 3
Slide 10: Blue-Chip Customers Across Multiple End Markets
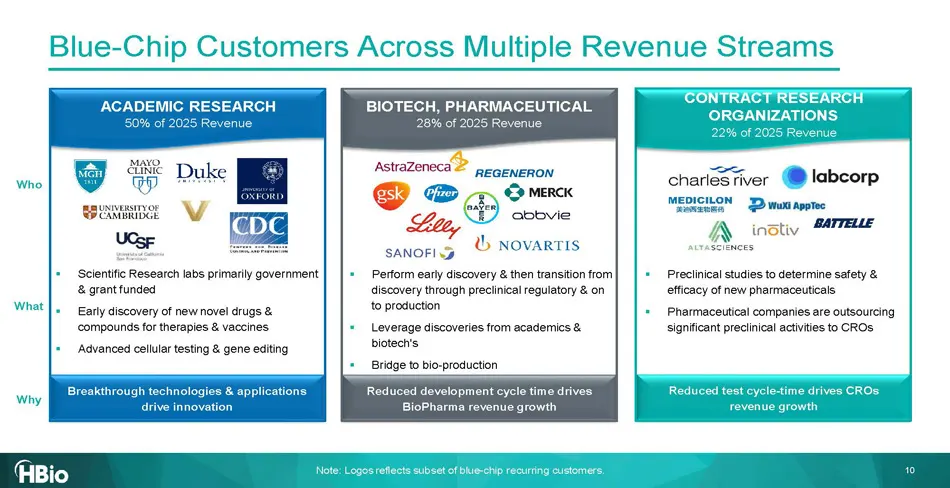
ACADEMIC RESEARCH 50% of 2025 Revenue BIOTECH, PHARMACEUTICAL 28% of 2025 Revenue Note: Logos r eflects subset of blue - chip recurring customers. ▪ Scientific Research labs primarily government & grant funded ▪ Early discovery of new novel drugs & compounds for therapies & vaccines ▪ Advanced cellu
Slide 11: Direct Sales Force Complemented by Key Distributors for Global Reach
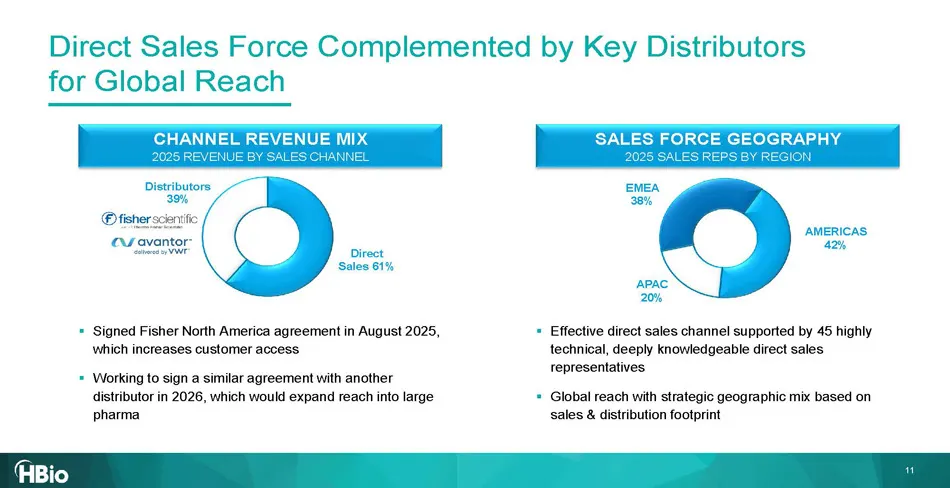
CHANNEL REVENUE MIX 2025 REVENUE BY SALES CHANNEL Direct Sales 6 1 % Distributors 3 9 % EMEA 38 % APAC 20 % SALES FORCE GEOGRAPHY 2025 SALES REPS BY REGION Direct Sales Force Complemented by Key Distributors for Global Reach ▪ Effective direct sales channel supported by 45 highly technical, deeply k
Slide 12: Drug Discovery Life Cycle & Where We Fit In
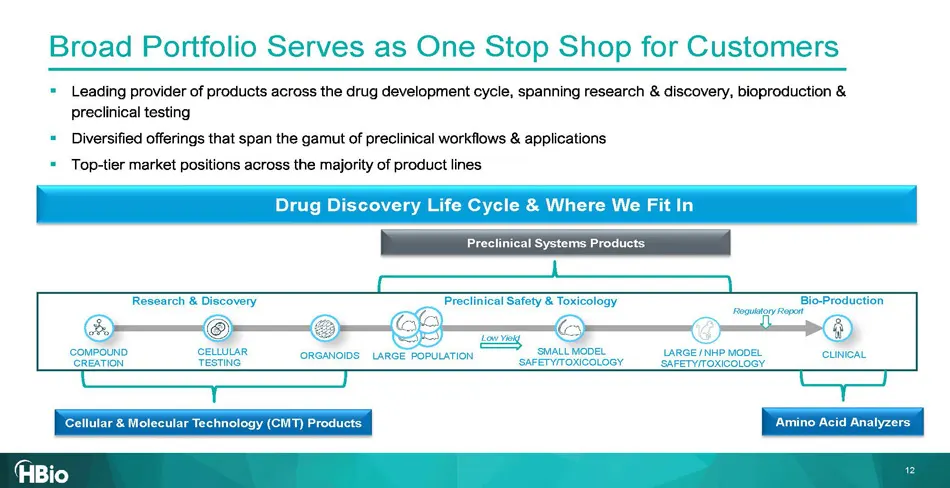
▪ Leading provider of products across the drug development cycle, spanning research & discovery, bioproduction & preclinical testing ▪ Diversified offerings that span the gamut of preclinical workflows & applications ▪ Top - tier market positions across the majority of product lines Research & Disco
Slide 13: Organoids & MeshMEA: Powering Shift to Human-Relevant Discovery
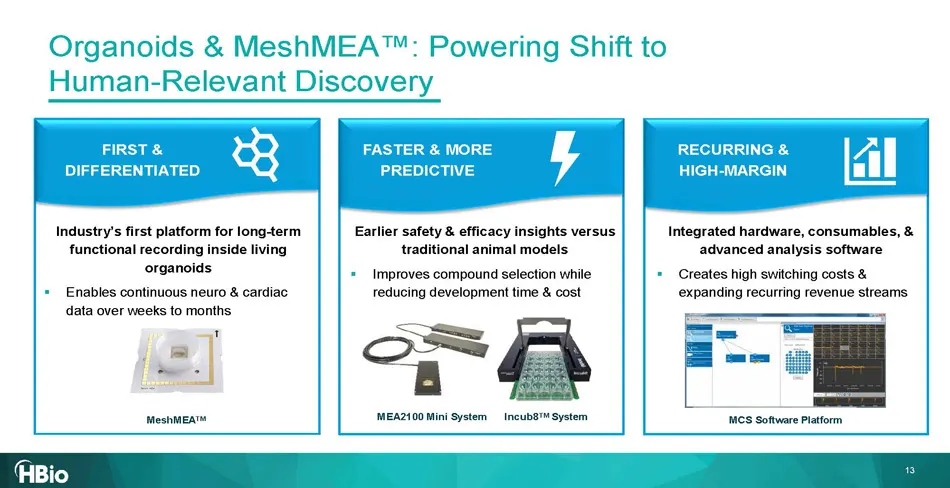
Industry’s first platform for long - term functional recording inside living organoids ▪ Enables continuous neuro & cardiac data over weeks to months Earlier safety & efficacy insights versus traditional animal models ▪ Improves compound selection while reducing development time & cost Integrated ha
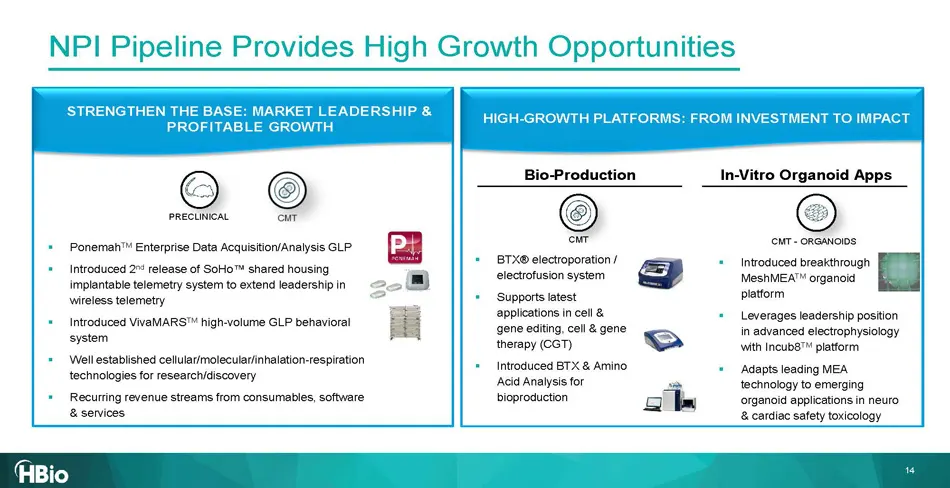
Slide 14: NPI Pipeline Provides High Growth Opportunities
STRENGTHEN THE BASE: MARKET LEADERSHIP & PROFITABLE GROWTH HIGH - GROWTH PLATFORMS: FROM INVESTMENT TO IMPACT CMT - ORGANOIDS CMT PRECLINICAL Bio - Production In - Vitro Organoid Apps NPI Pipeline Provides High Growth Opportunities ▪ Ponemah TM Enterprise Data Acquisition/Analysis GLP ▪ Introduced 2
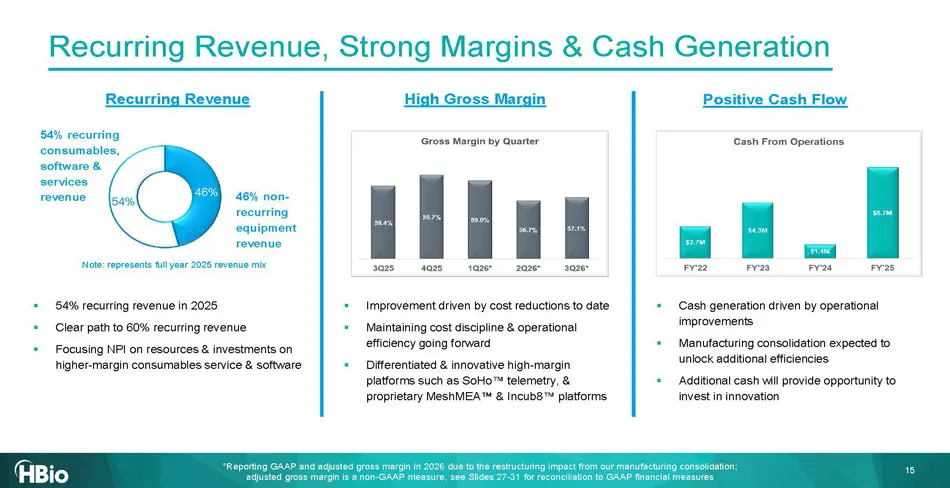
Slide 15: Recurring Revenue, Strong Margins & Cash Generation
▪ 54% recurring revenue in 2025 ▪ Clear path to 60% recurring revenue ▪ Focusing NPI on resources & investments on higher - margin consumables service & software 46% 54% ▪ Improvement d riven by cost reductions to date ▪ Maintaining cost discipline & operational efficiency going forward ▪ Differenti
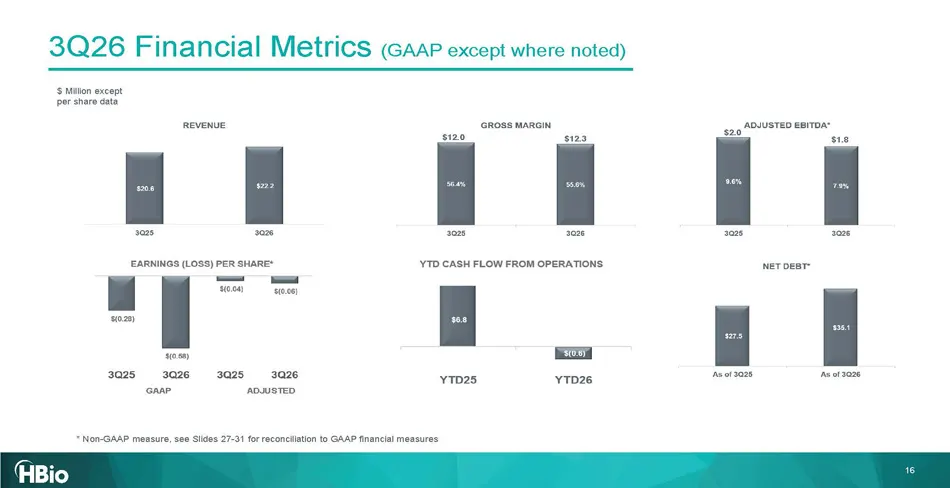
Slide 16: 3Q26 Financial Metrics
$ Million except per share data * Non - GAAP measure, see Slides 27 - 31 for reconciliation to GAAP financial measures 3Q26 Financial Metrics (GAAP except where noted) $12.0 $12.3 $2.0 $1.8 16 GAAP ADJUSTED
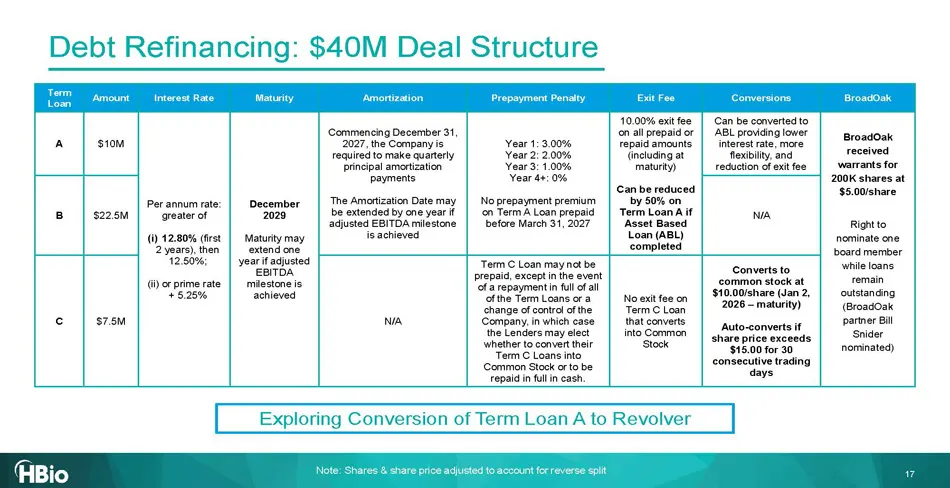
Slide 17: Debt Refinancing: $40M Deal Structure
17 Debt Refinancing: $40M Deal Structure Note: Shares & share price adjusted to account for reverse split BroadOak Conversions Exit Fee Prepayment Penalty Amortization Maturity Interest Rate Amount Term Loan BroadOak received warrants for 200K shares at $5.00/share Right to nominate one board member
Slide 18: Outlook
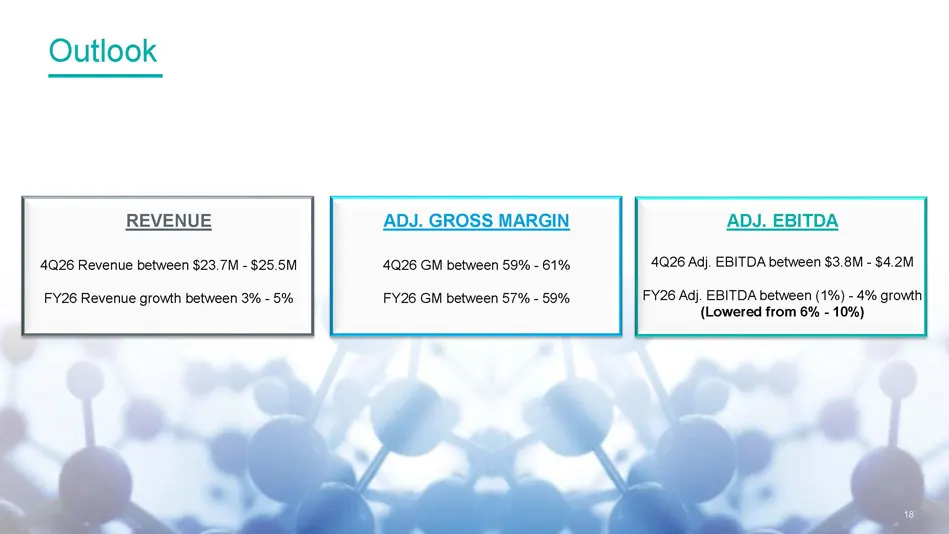
REVENUE ADJ. EBITDA ADJ. GROSS MARGIN 4Q26 Revenue between $23.7M - $25.5M FY26 Revenue growth between 3% - 5% 4Q26 GM between 59% - 61% FY26 GM between 57% - 59% 4Q26 Adj. EBITDA between $3.8M - $4.2M FY26 Adj. EBITDA between (1%) - 4% growth (Lowered from 6% - 10%) Outlook 18
Slide 19: Investment Highlights: Strong Foundation Poised for Growth
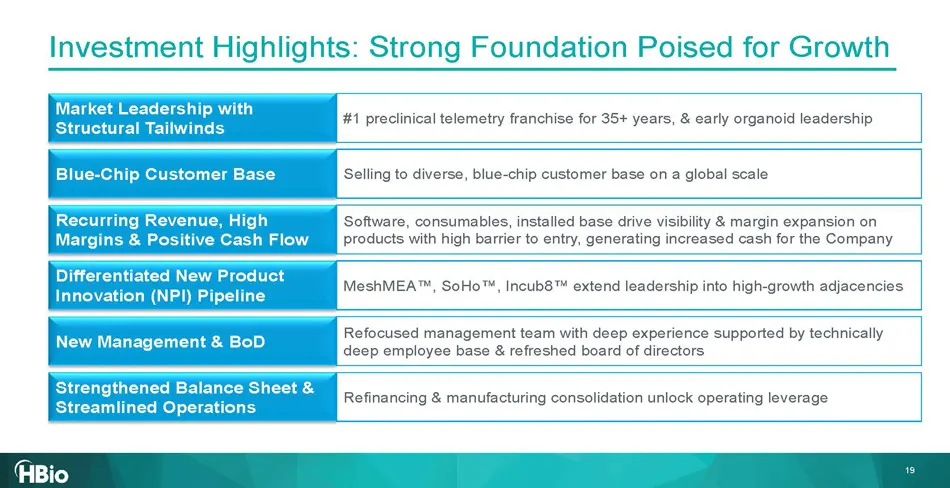
Investment Highlights: Strong Foundation Poised for Growth Market Leadership with Structural Tailwinds #1 preclinical telemetry franchise for 35+ years, & early organoid leadership Blue - Chip Customer Base Selling to diverse, blue - chip customer base on a global scale Recurring Revenue, High Margi

Slide 20: Appendix
20 Appendix 20
Slide 21: 3Q26 Revenue Breakdown
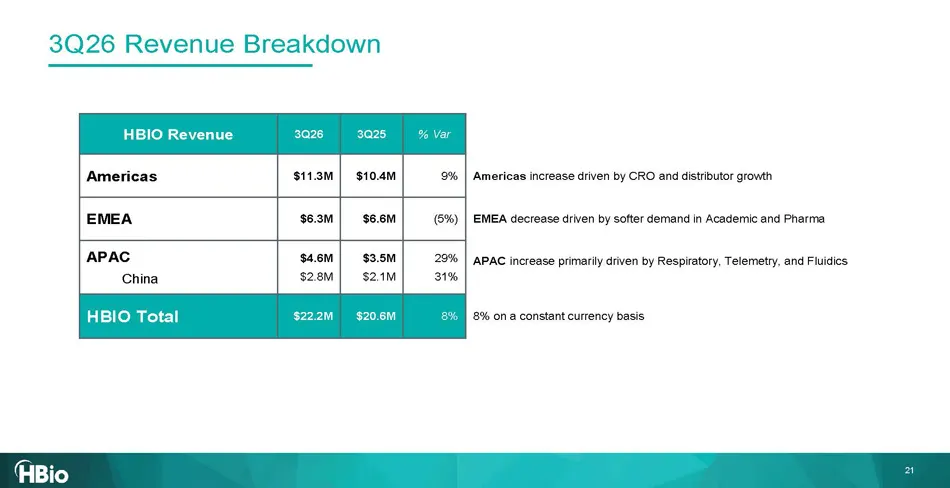
21 3Q26 Revenue Breakdown % Var 3Q25 3Q26 HBIO Revenue Americas increase driven by CRO and distributor growth 9% $10.4M $11.3M Americas EMEA decrease driven by softer demand in Academic and Pharma (5%) $6.6M $6.3M EMEA APAC increase primarily driven by Respiratory, Telemetry, and Fluidics 29% 31% $3
Slide 22: Leading Reputation, with Multiple Competitive Advantages
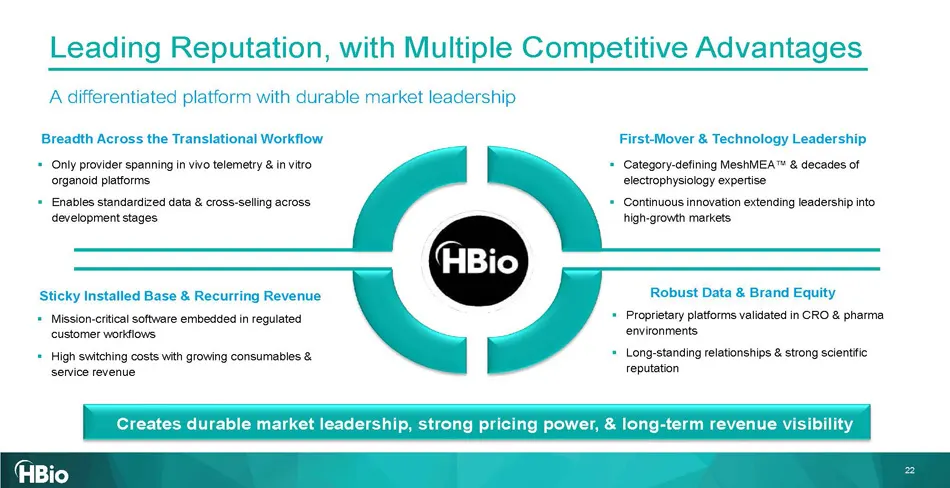
Leading Reputation , with Multiple Competitive Advantages A differentiated platform with durable market leadership 22 Breadth Across the Translational Workflow ▪ Only provider spanning in vivo telemetry & in vitro organoid platforms ▪ Enables standardized data & cross - selling across development st
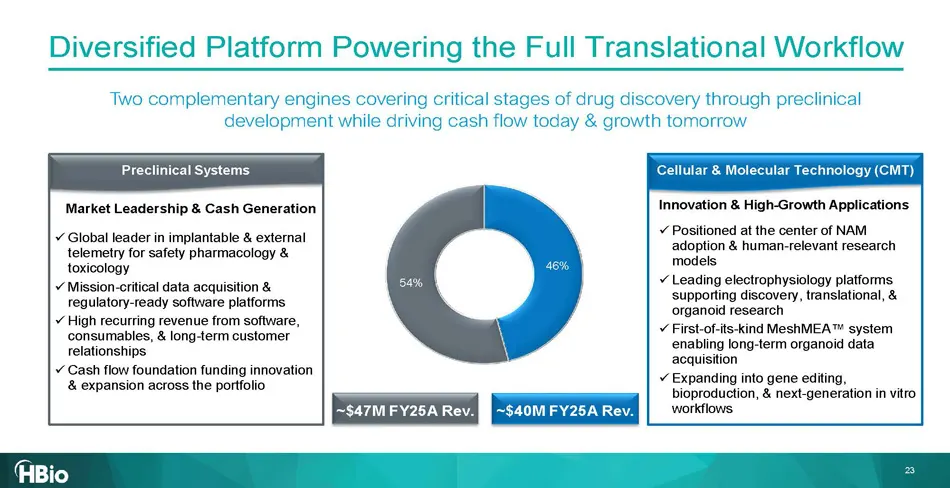
Slide 23: Diversified Platform Powering the Full Translational Workflow
x Global leader in implantable & external telemetry for safety pharmacology & toxicology x Mission - critical data acquisition & regulatory - ready software platforms x High recurring revenue from software, consumables, & long - term customer relationships x Cash flow foundation funding innovation &
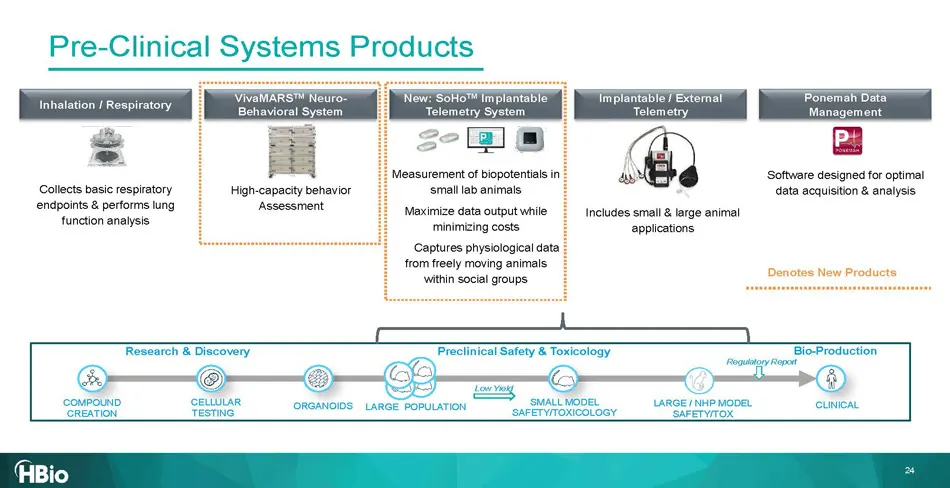
Slide 24: Preclinical Systems Products
Research & Discovery Preclinical Safety & Toxicology CELLULAR TESTING COMPOUND CREATION CLINICAL SMALL MODEL SAFETY/TOXICOLOGY LARGE / NHP MODEL SAFETY/TOX Bio - Production Regulatory Report Low Yield ORGANOIDS LARGE POPULATION Inhalation / Respiratory VivaMARS TM Neuro - Behavioral System New: SoHo
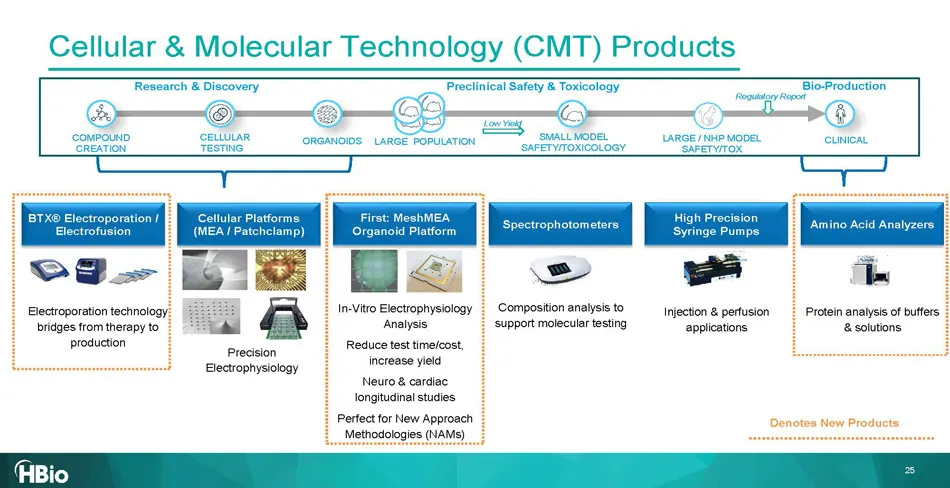
Slide 25: Cellular & Molecular Technology (CMT) Products
Research & Discovery Preclinical Safety & Toxicology CELLULAR TESTING COMPOUND CREATION CLINICAL SMALL MODEL SAFETY/TOXICOLOGY LARGE / NHP MODEL SAFETY/TOX Bio - Production Regulatory Report Low Yield ORGANOIDS LARGE POPULATION BTX® Electroporation / Electrofusion Electroporation technology bridges

Slide 26: Non-GAAP Reconciliation Tables
26 Non - GAAP Reconciliation Tables 26
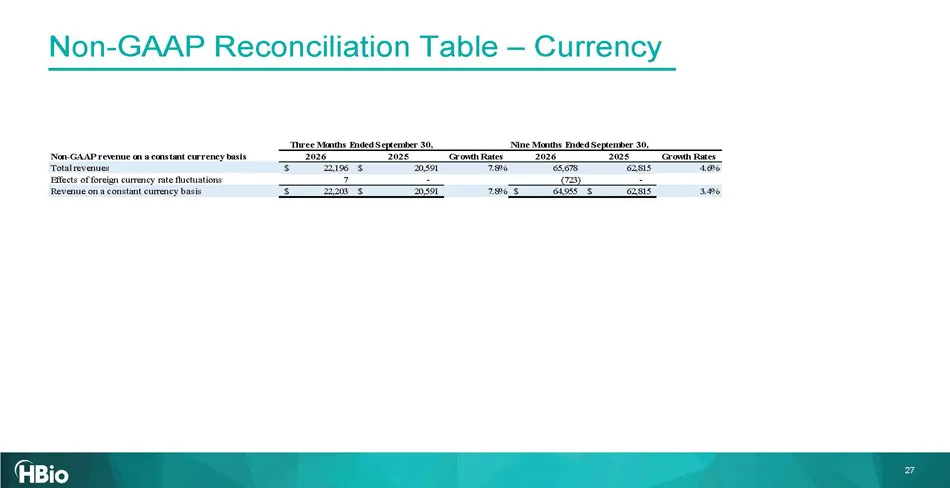
Slide 27: Non-GAAP Reconciliation Table – Currency
27 Non - GAAP Reconciliation Table – Currency Nine Months Ended September 30, Non-GAAP revenue on a constant currency basis 2026 2025 Growth Rates 2026 2025 Growth Rates Total revenues 22,196$ 20,591$ 7.8% 65,678 62,815 4.6% Effects of foreign currency rate fluctuations 7 - (723) - Revenue on a cons
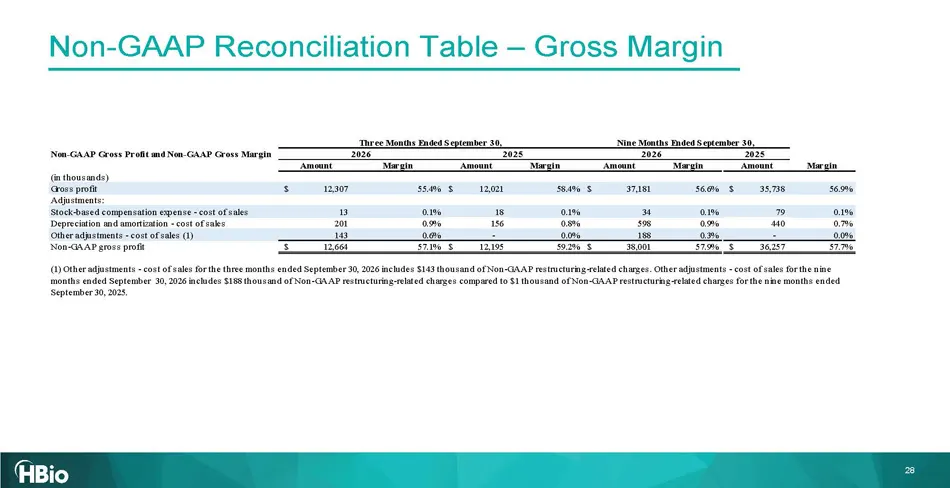
Slide 28: Non-GAAP Reconciliation Table – Gross Margin
28 Non - GAAP Reconciliation Table – Gross Margin Non-GAAP Gross Profit and Non-GAAP Gross Margin Amount Margin Amount Margin Amount Margin Amount Margin (in thousands) Gross profit 12,307$ 55.4% 12,021$ 58.4% 37,181$ 56.6% 35,738$ 56.9% Adjustments: Stock-based compensation expense - cost of sales
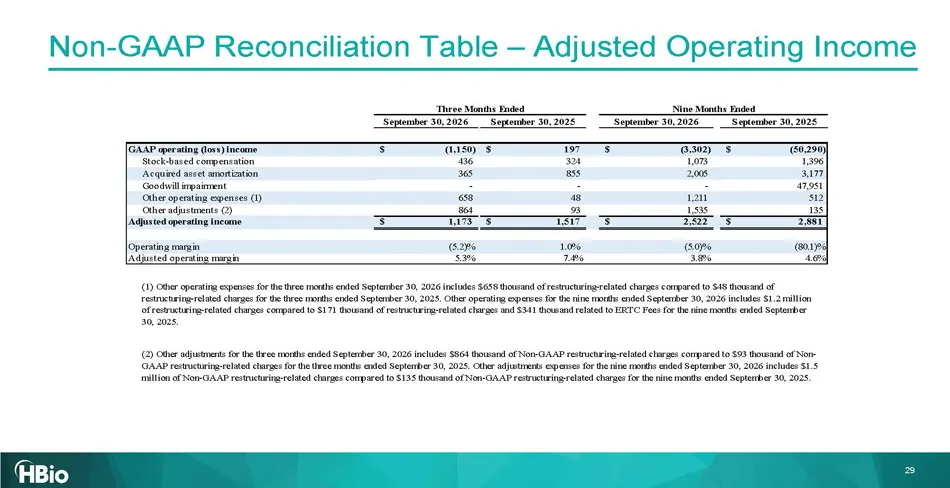
Slide 29: Non-GAAP Reconciliation Table – Adjusted Operating Income
29 Non - GAAP Reconciliation Table – Adjusted Operating Income September 30, 2026 September 30, 2025 September 30, 2026 September 30, 2025 (1,150)$ 197$ (3,302)$ (50,290)$ Stock-based compensation 436 324 1,073 1,396 Acquired asset amortization 365 855 2,005 3,177 Goodwill impairment - - - 47,951 Ot
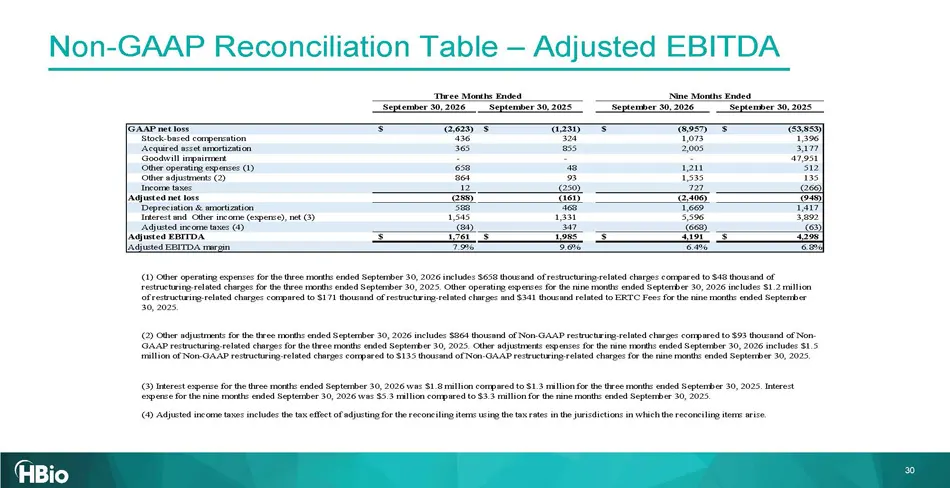
Slide 30: Non-GAAP Reconciliation Table – Adjusted EBITDA
30 Non - GAAP Reconciliation Table – Adjusted EBITDA September 30, 2026 September 30, 2025 September 30, 2026 September 30, 2025 (2,623)$ (1,231)$ (8,957)$ (53,853)$ Stock-based compensation 436 324 1,073 1,396 Acquired asset amortization 365 855 2,005 3,177 Goodwill impairment - - - 47,951 Other op
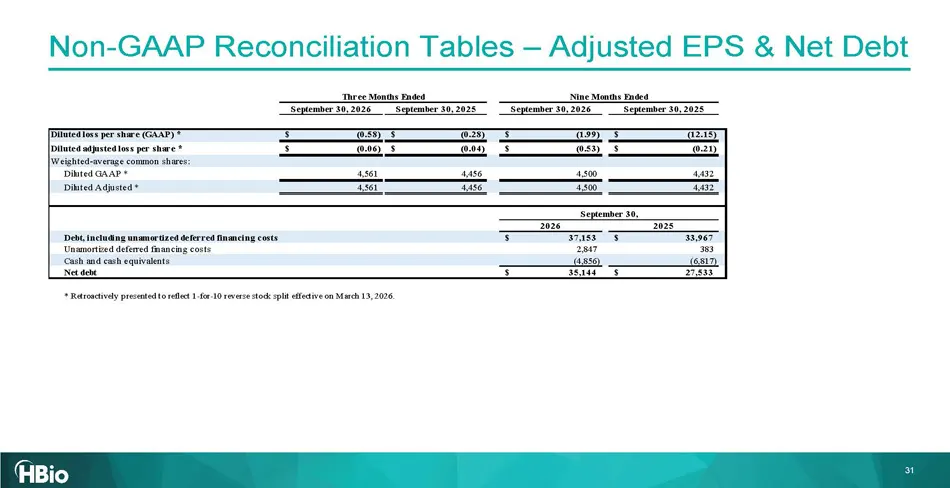
Slide 31: Non-GAAP Reconciliation Tables – Adjusted EPS & Net Debt
31 Non - GAAP Reconciliation Tables – Adjusted EPS & Net Debt September 30, 2026 September 30, 2025 September 30, 2026 September 30, 2025 Diluted loss per share (GAAP) * (0.58)$ (0.28)$ (1.99)$ (12.15)$ Diluted adjusted loss per share * (0.06)$ (0.04)$ (0.53)$ (0.21)$ Weighted-average common shares:

Slide 32: 32
32
Source: SEC EDGAR · 8-K filed Nov 10, 2026
More decks from Harvard Bioscience, Inc.
 Q3 2026 Earnings Presentation15 slides · Nov 10, 2026
 Q2 2026 Earnings Presentation15 slides · Aug 11, 2026
 Investor Presentation (August 2026)32 slides · August 2026
 Investor Presentation (May 2026)31 slides · May 12, 2026
 Q1 2026 Earnings Presentation13 slides · May 12, 2026
 Q4 2025 Earnings Presentation14 slides · Mar 12, 2026