Hexpol AB Class B · OMXSTO:HPOL_B
Hexpol AB Class B — Investor Day (May 2014)
142 slides from Hexpol AB Class B's investor day presentation, May 13, 2014
Slide 1: Welcome to HEXPOL Capital Market Day
WELCOME TO HEXPOL CAPITAL MARKET DAY (CMD) ÅMÅL, SWEDEN May 13, 2014 May 13, 2014 -1-
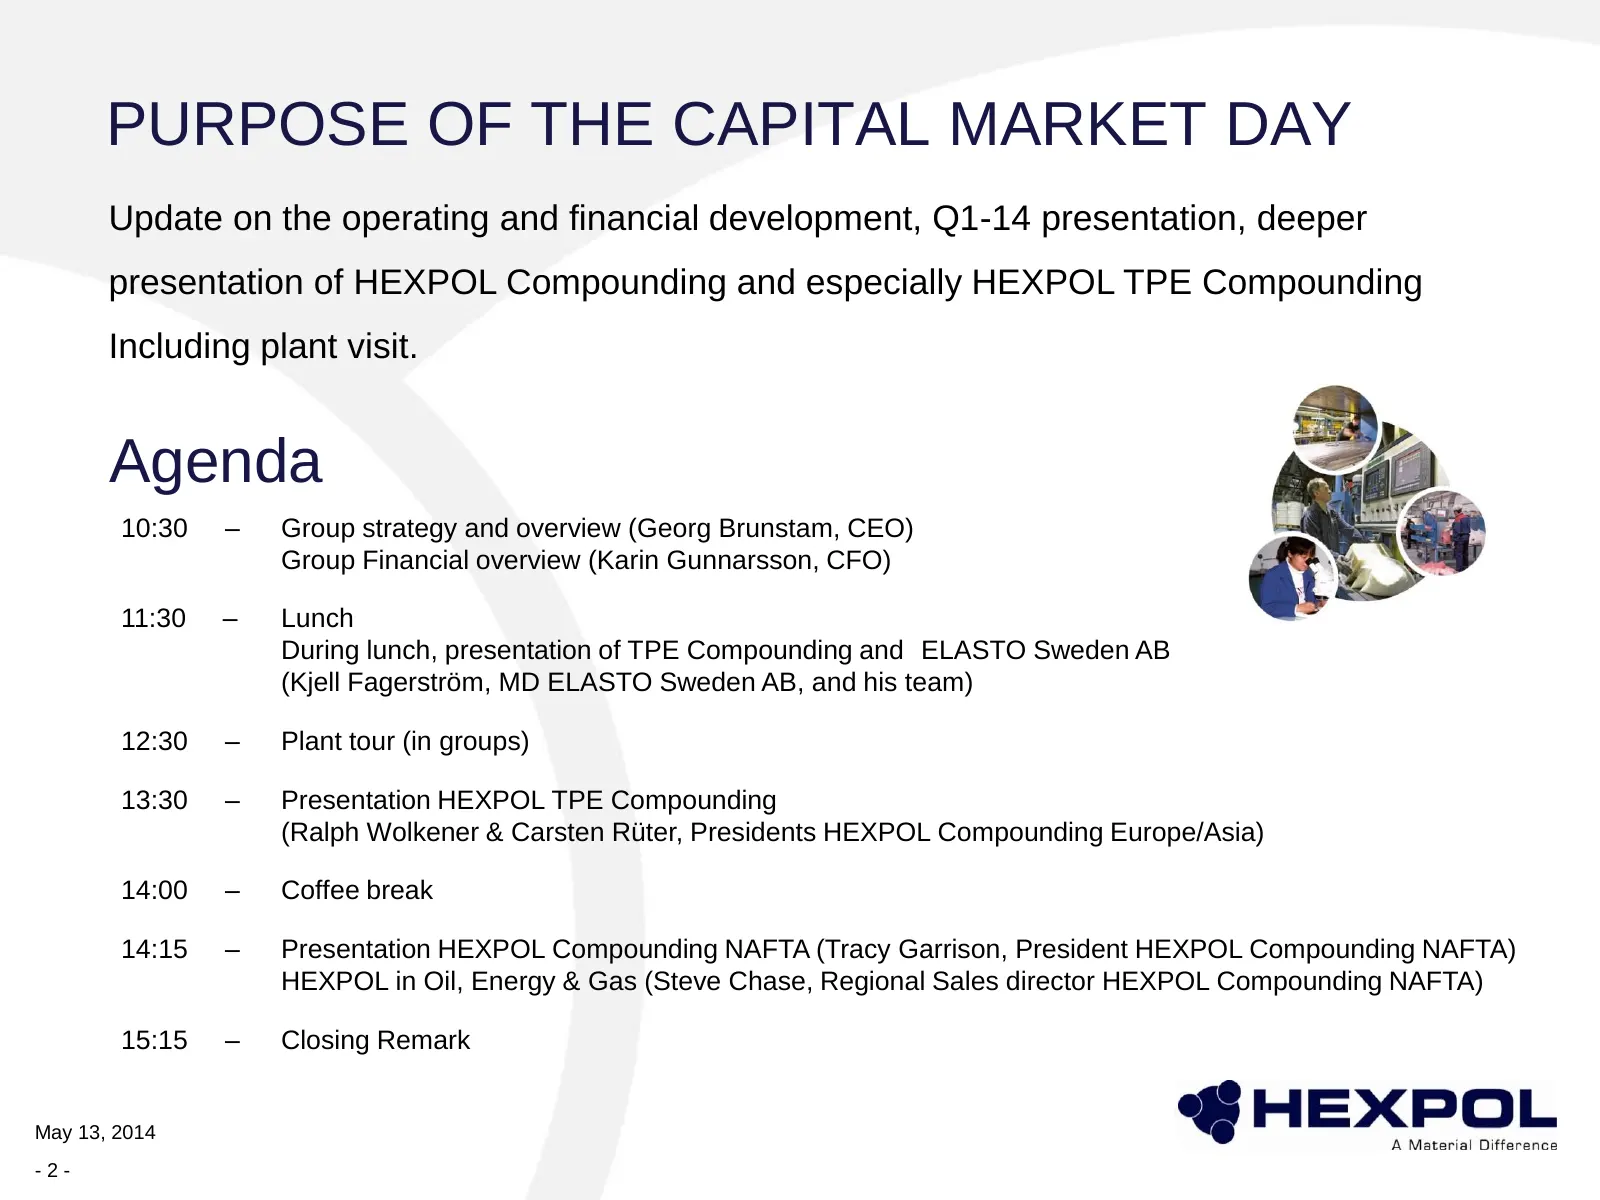
Slide 2: Purpose of the Capital Market Day
PURPOSE OF THE CAPITAL MARKET DAY Update on the operating and financial development, Q1-14 presentation, deeper presentation of HEXPOL Compounding and especially HEXPOL TPE Compounding Including plant visit. Agenda 10:30 – Group strategy and overview (Georg Brunstam, CEO) Group Financial overview (K
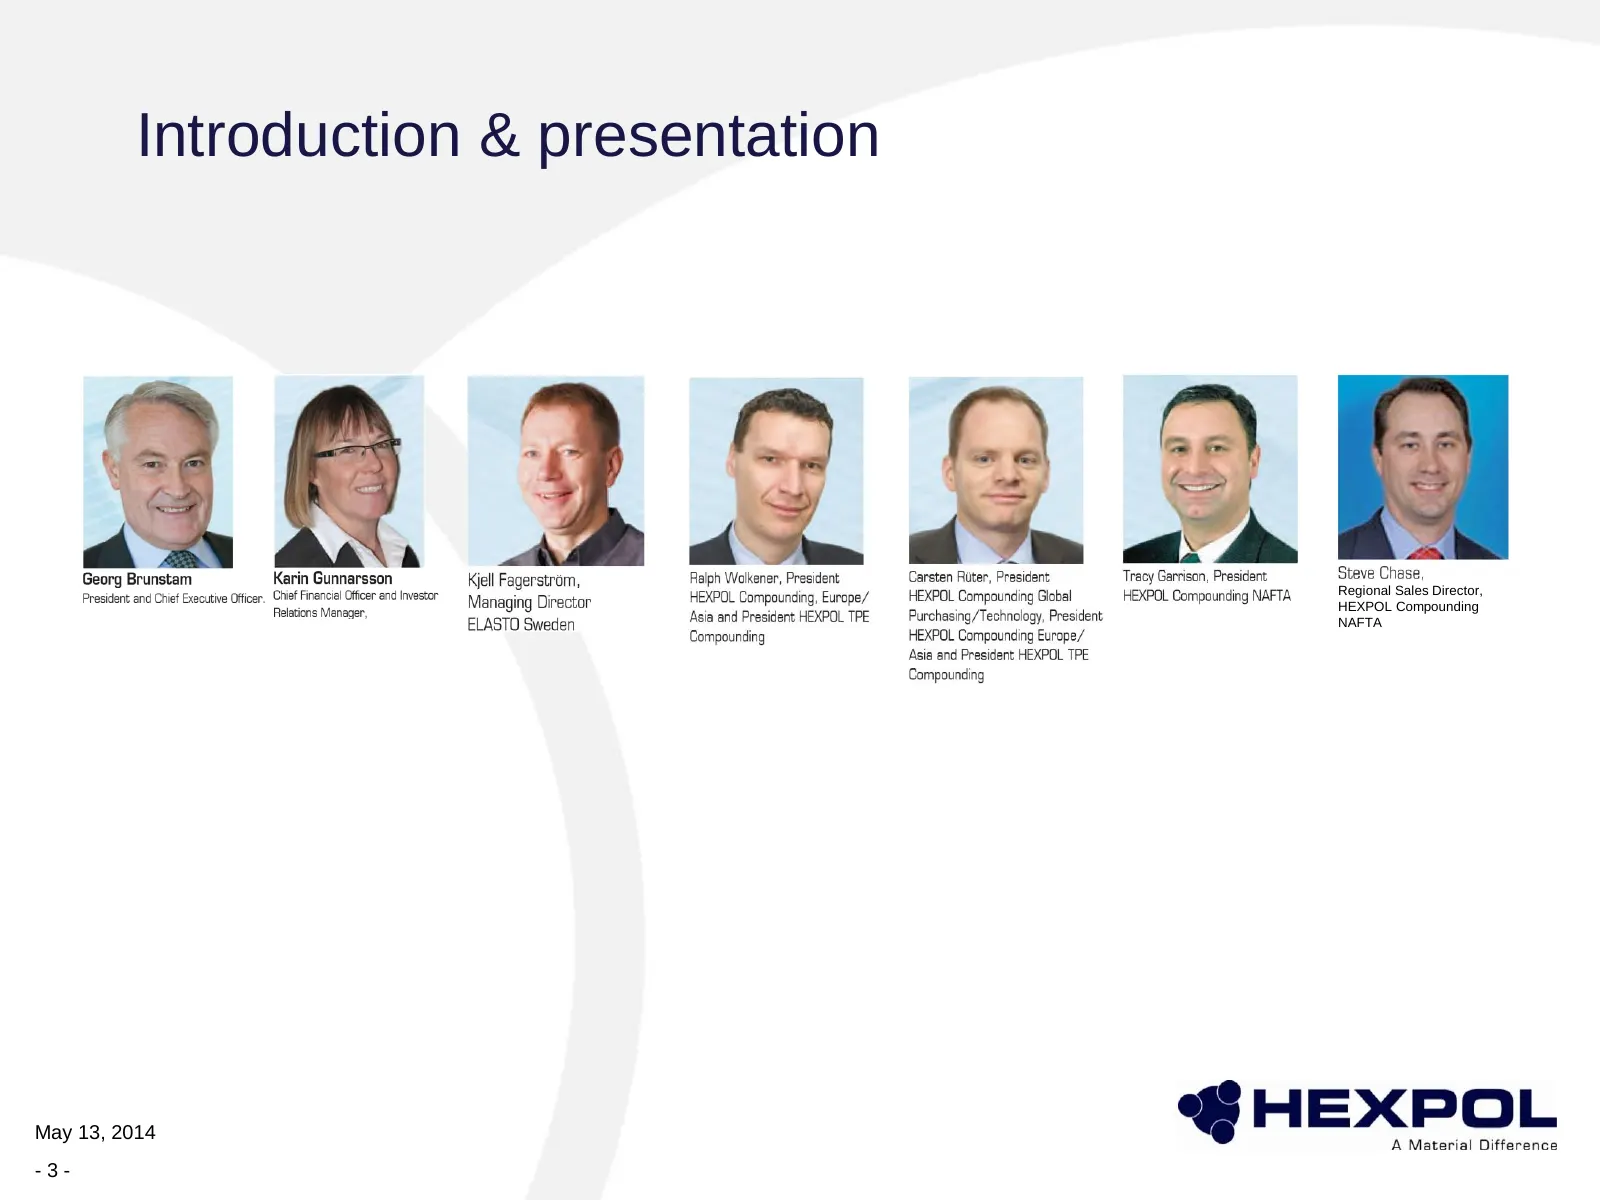
Slide 3: Introduction & presentation
Introduction & presentation Regional Sales Director, HEXPOL Compounding NAFTA May 13, 2014 -3-
Slide 4: Group strategy and overview
Group strategy and overview Including Q1-2014 update Georg Brunstam, CEO Karin Gunnarsson, CFO May 13, 2014 May 13, 2014 -4-
Slide 5: HEXPOL – Fast growing with strong margins
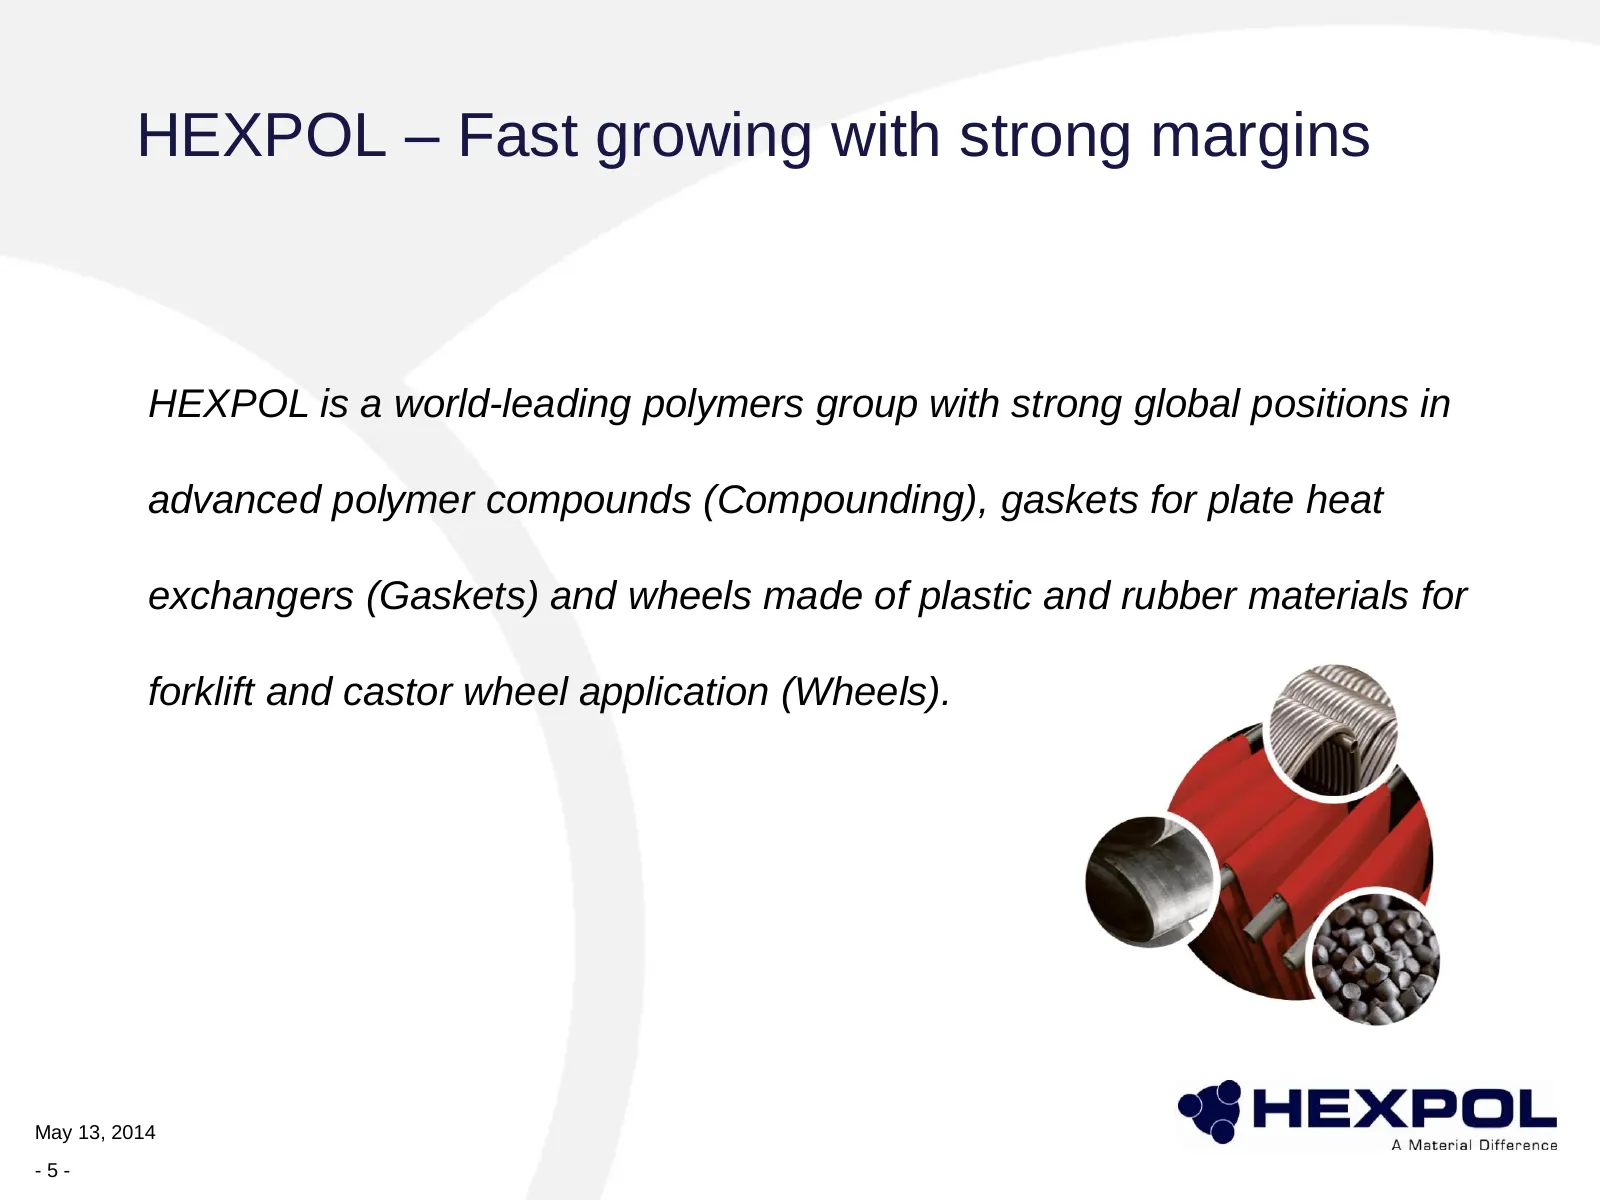
HEXPOL – Fast growing with strong margins HEXPOL is a world-leading polymers group with strong global positions in advanced polymer compounds (Compounding), gaskets for plate heat exchangers (Gaskets) and wheels made of plastic and rubber materials for forklift and castor wheel application (Wheels).
Slide 6: Our vision guides us
Our vision guides us HEXPOL’s vision is to be market leader, number one or two, in selected technological or geographical segments, to generate profit, growth and shareholder value. May 13, 2014 -6-
Slide 7: HEXPOL – A fast growing Group – Strong Growth
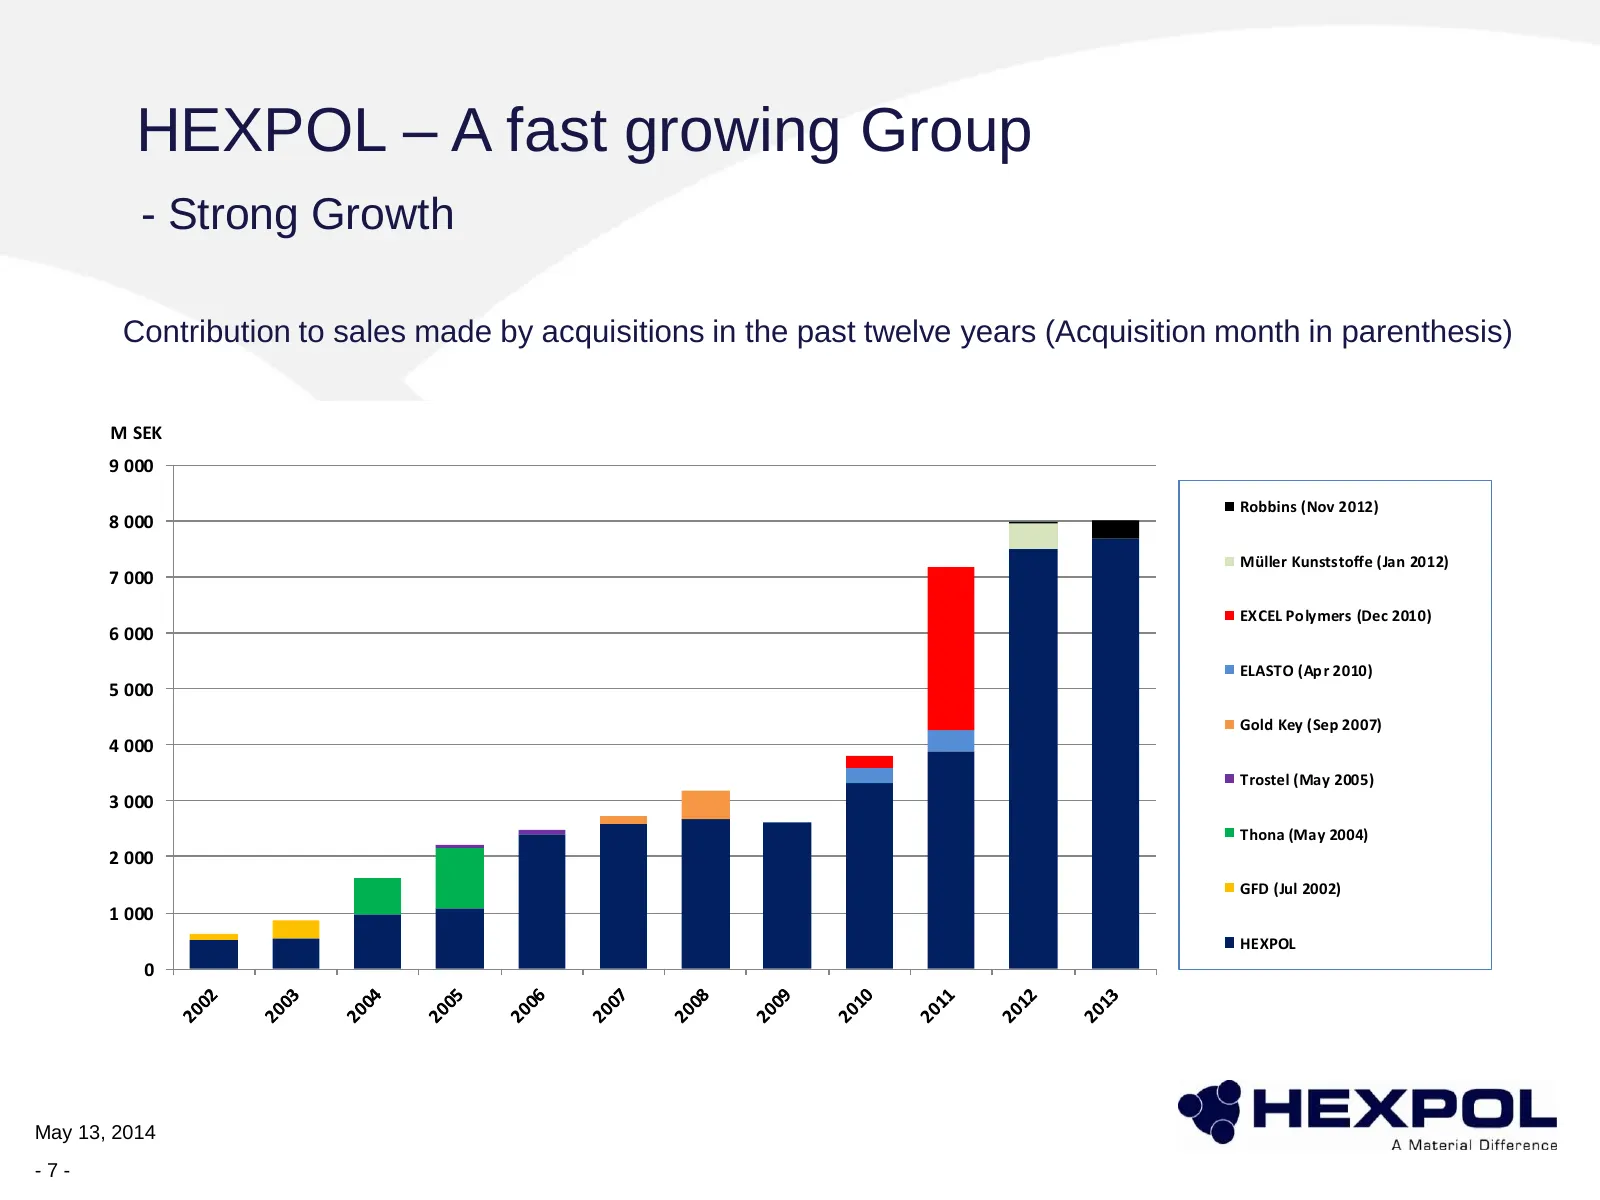
HEXPOL – A fast growing Group - Strong Growth Contribution to sales made by acquisitions in the past twelve years (Acquisition month in parenthesis) M SEK 9 000 Robbins (Nov 2012) 8 000 Müller Kunststoffe (Jan 2012) 7 000 EXCEL Polymers (Dec 2010) 6 000 ELASTO (Apr 2010) 5 000 Gold Key (Sep 2007) 4
Slide 8: Growth strategy
HEXPOL – A fast growing Group - Growth strategy • Product Development – New segments (for example: Shale gas, Flame retardant) – New products in existing segments (for example: weight saving) – Application oriented • Increased market share • Acquisitions mainly within Polymer Compounding – Existing
Slide 9: Investments for growth – added capacity
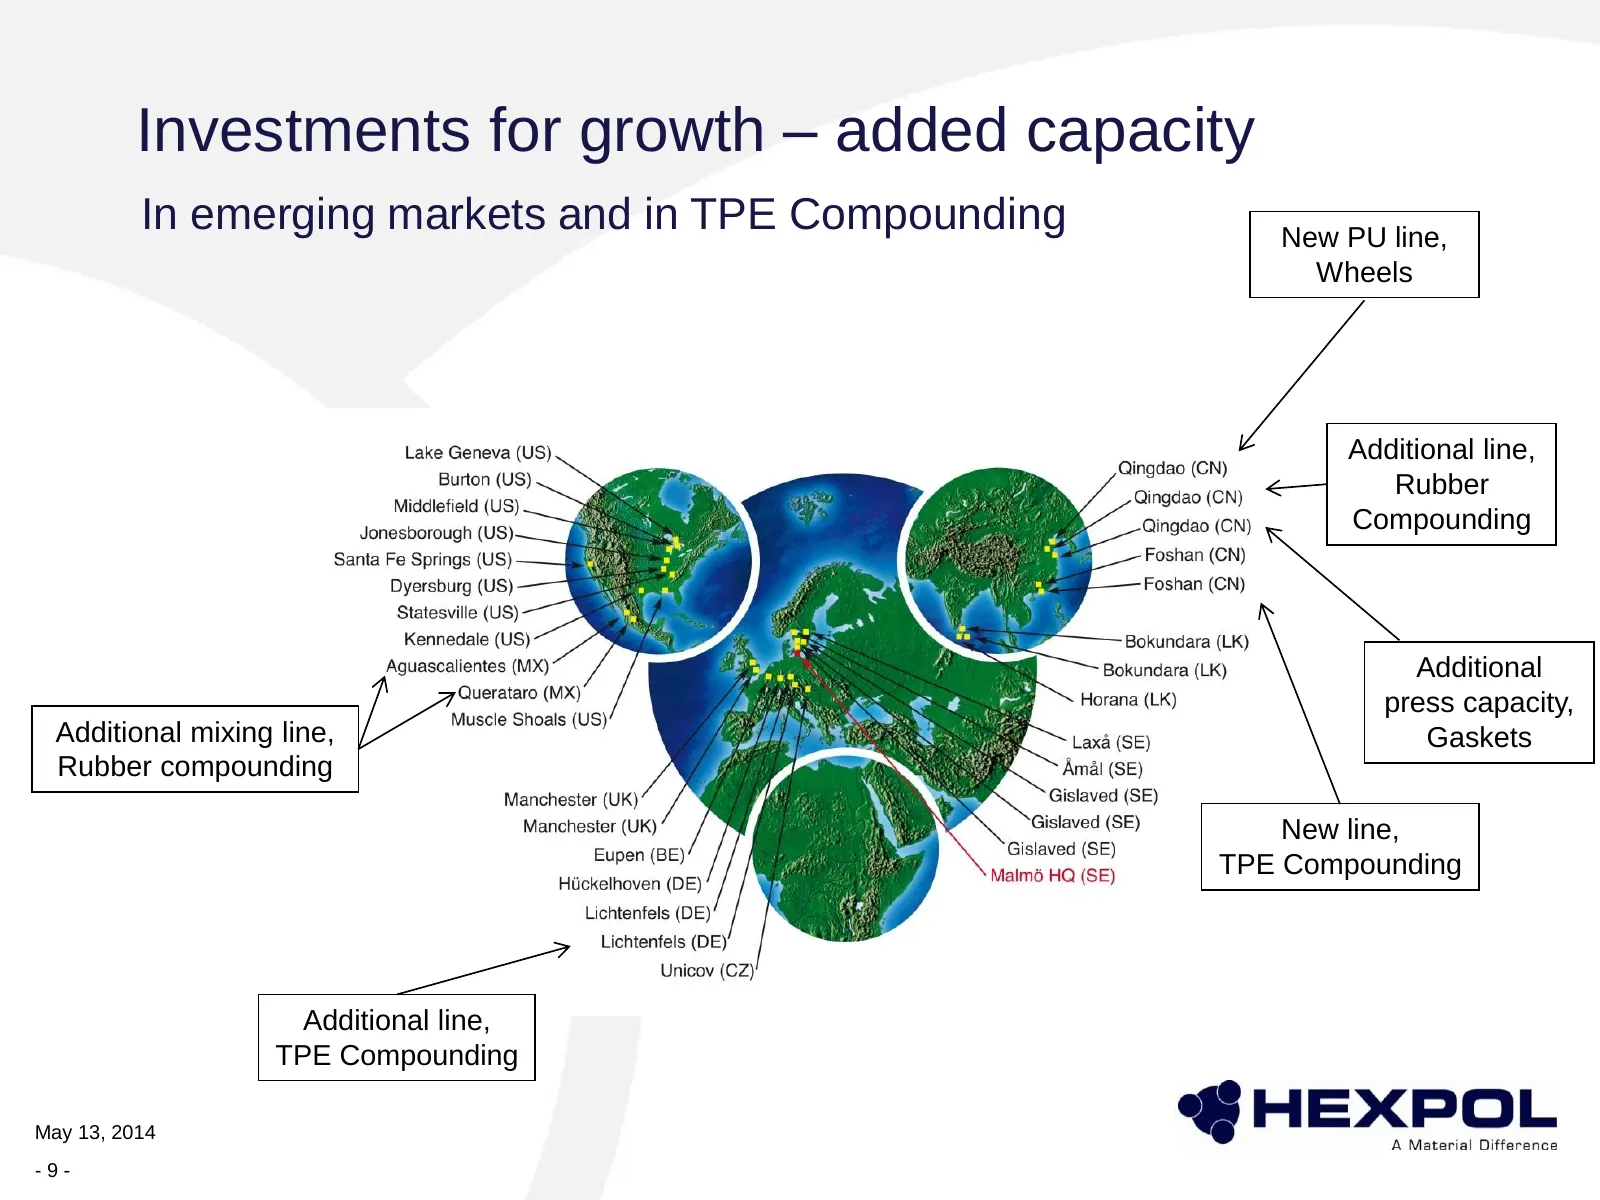
Investments for growth – added capacity In emerging markets and in TPE Compounding New PU line, Wheels Additional line, Rubber Compounding Additional press capacity, Additional mixing line, Gaskets Rubber compounding New line, TPE Compounding Additional line, TPE Compounding May 13, 2014 -9-
Slide 10: Growth in Mexico
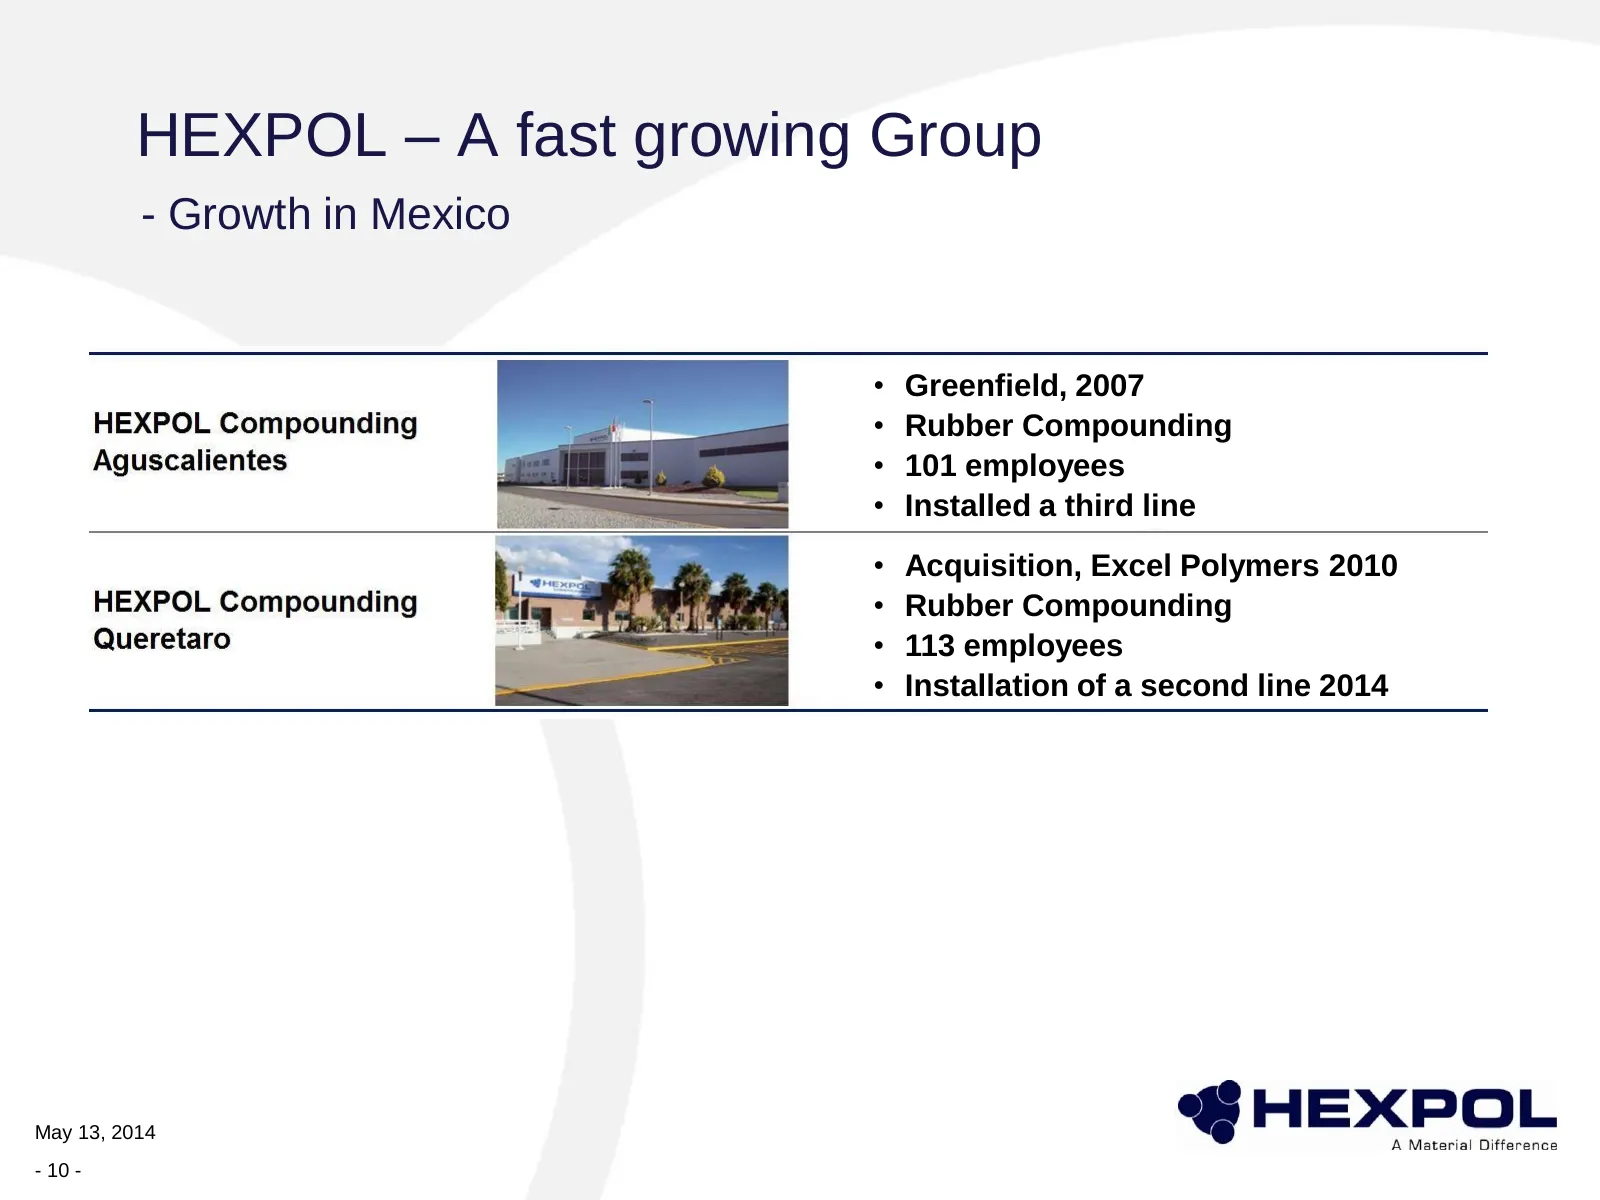
HEXPOL – A fast growing Group - Growth in Mexico • Greenfield, 2007 • Rubber Compounding • 101 employees • Installed a third line • Acquisition, Excel Polymers 2010 • Rubber Compounding • 113 employees • Installation of a second line 2014 May 13, 2014 - 10 -
Slide 11: Growth in Mexico
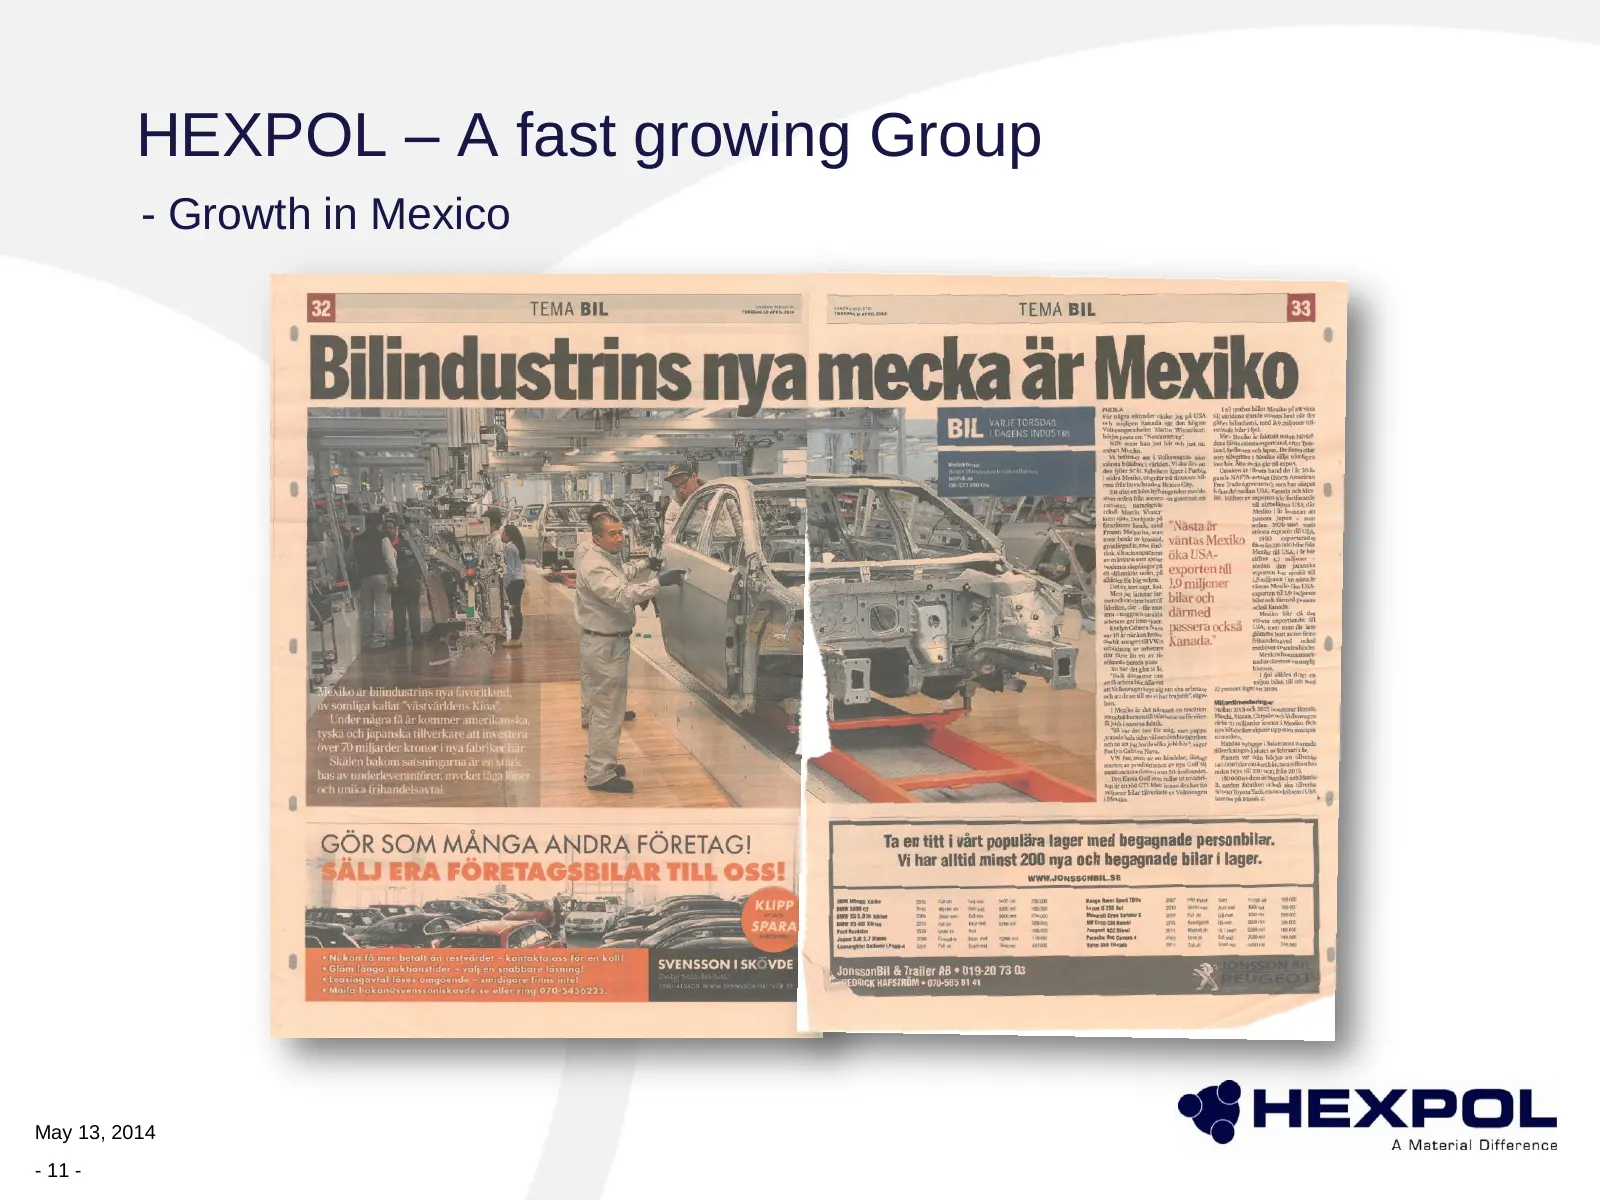
HEXPOL – A fast growing Group - Growth in Mexico May 13, 2014 - 11 -
Slide 12: Growth in Mexico
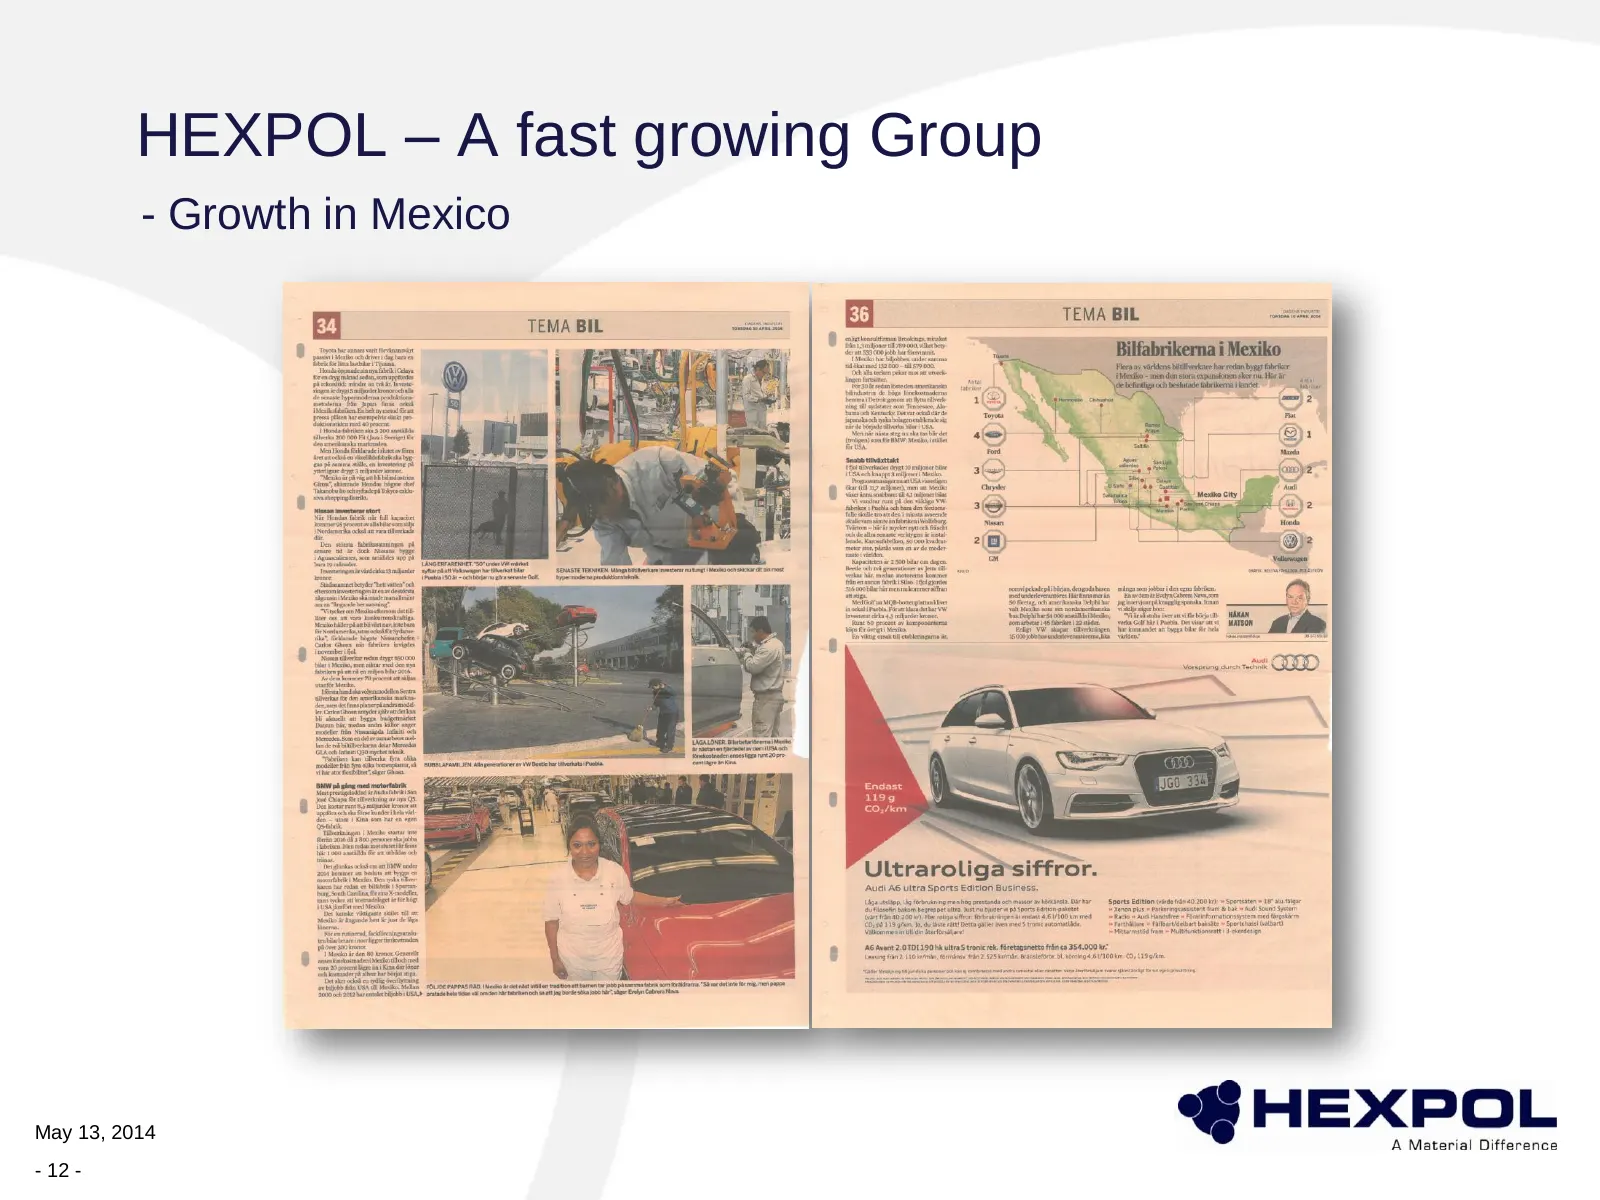
HEXPOL – A fast growing Group - Growth in Mexico May 13, 2014 - 12 -
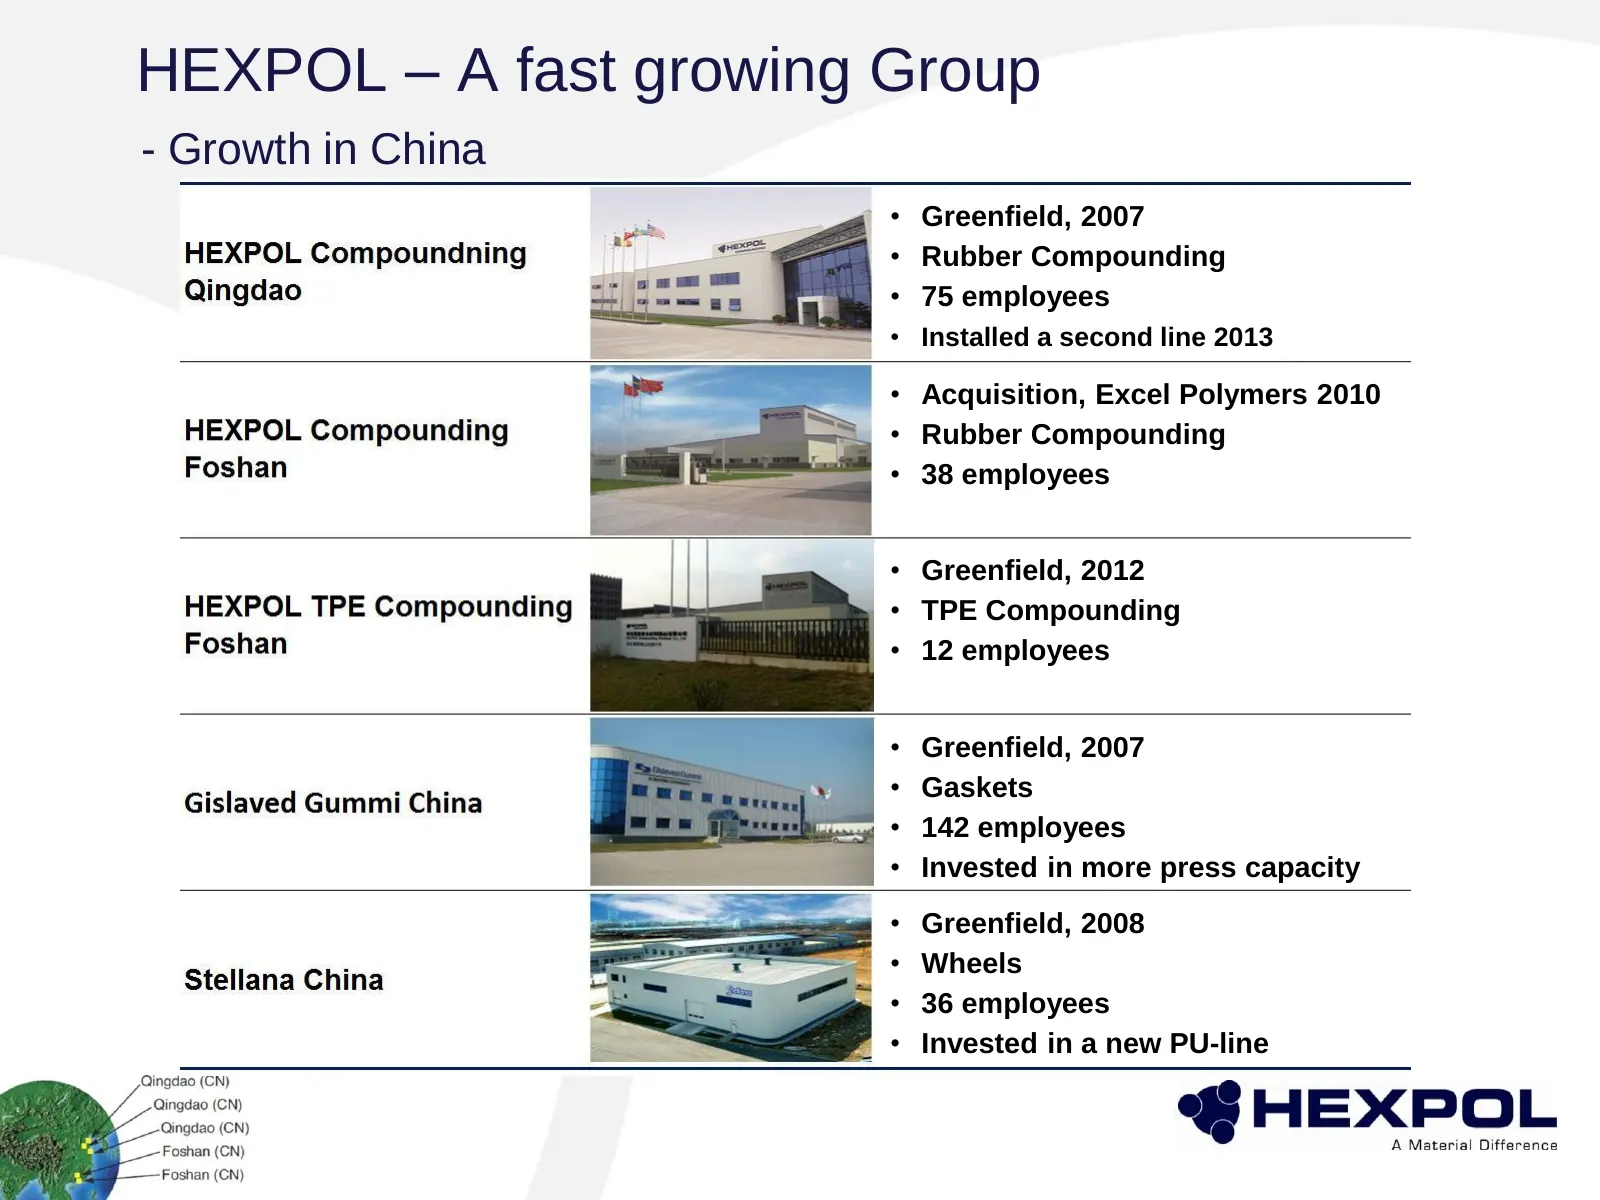
Slide 13: Growth in China
HEXPOL – A fast growing Group - Growth in China • Greenfield, 2007 • Rubber Compounding • 75 employees • Installed a second line 2013 • Acquisition, Excel Polymers 2010 • Rubber Compounding • 38 employees • Greenfield, 2012 • TPE Compounding • 12 employees • Greenfield, 2007 • Gaskets • 142 employee
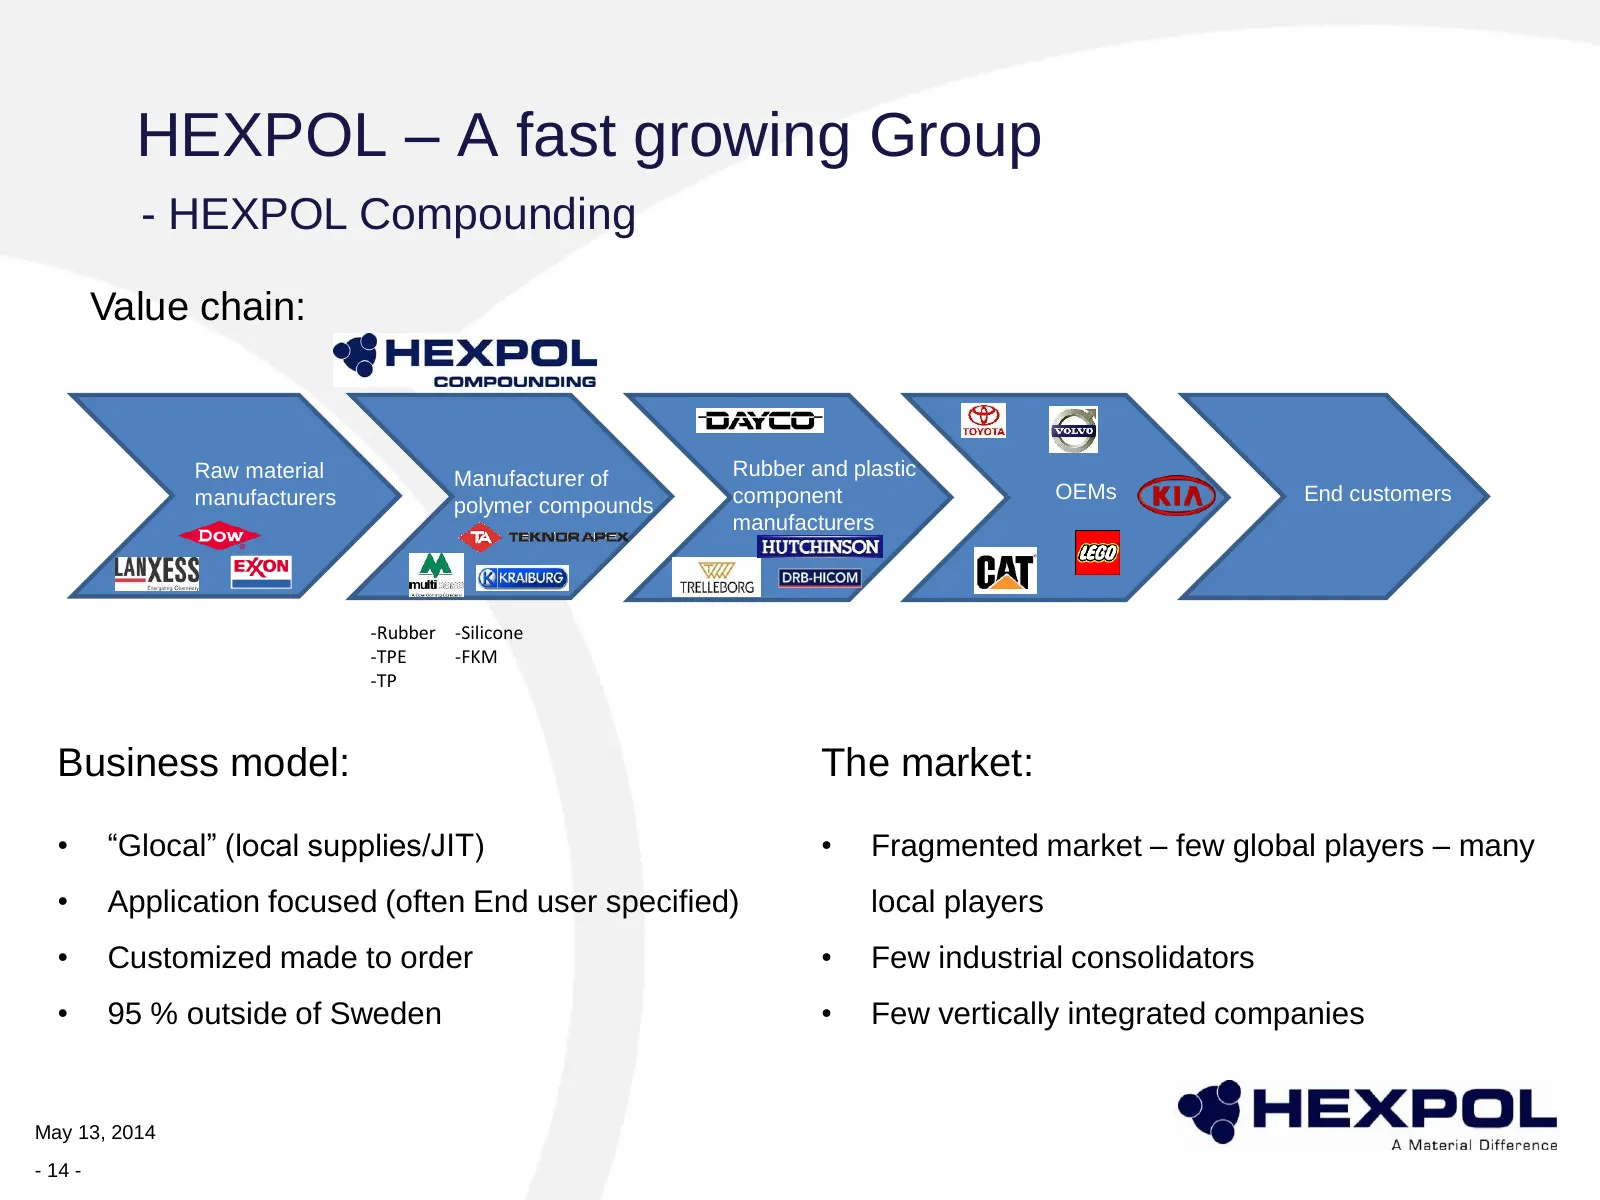
Slide 14: HEXPOL Compounding
HEXPOL – A fast growing Group - HEXPOL Compounding Value chain: Raw material Manufacturer of Rubber and plastic manufacturers component OEMs End customers polymer compounds manufacturers -Rubber -Silicone -TPE -FKM -TP Business model: The market: • “Glocal” (local supplies/JIT) • Fragmented market –
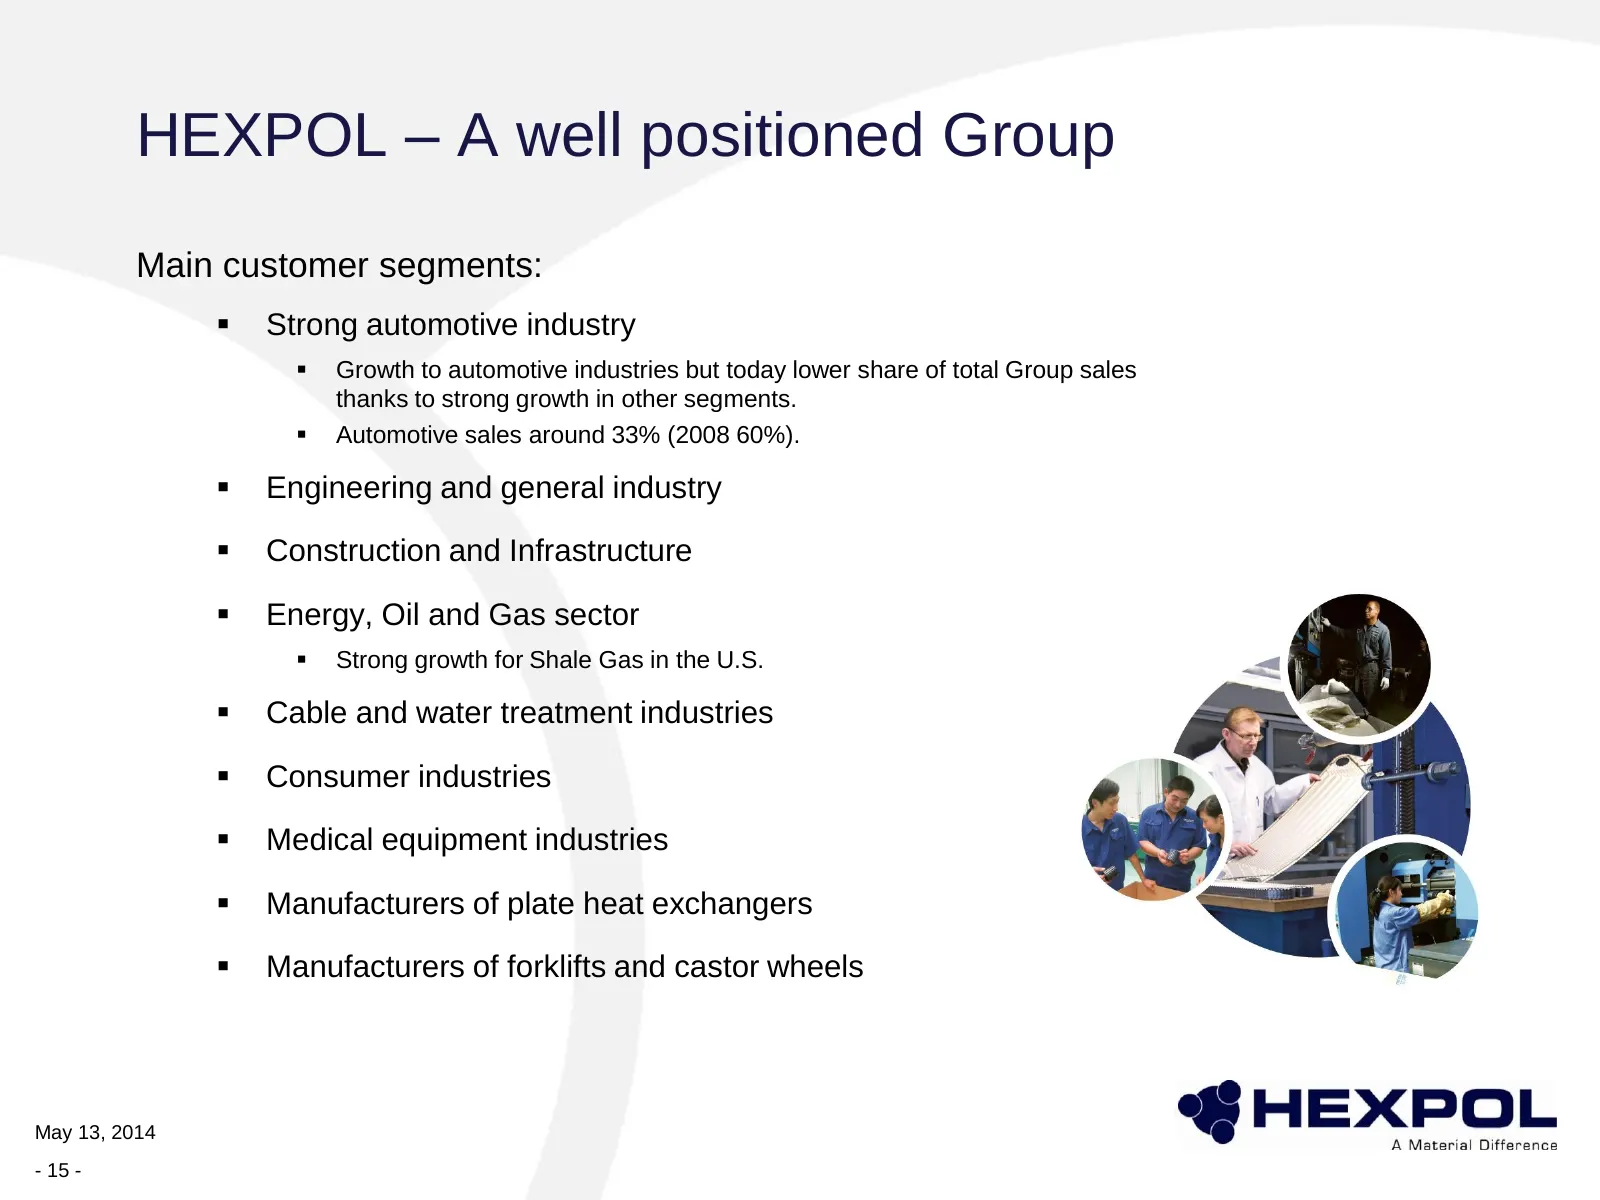
Slide 15: A well positioned Group – main customer segments
HEXPOL – A well positioned Group Main customer segments: Strong automotive industry Growth to automotive industries but today lower share of total Group sales thanks to strong growth in other segments. Automotive sales around 33% (2008 60%). Engineering and general industry Construction an
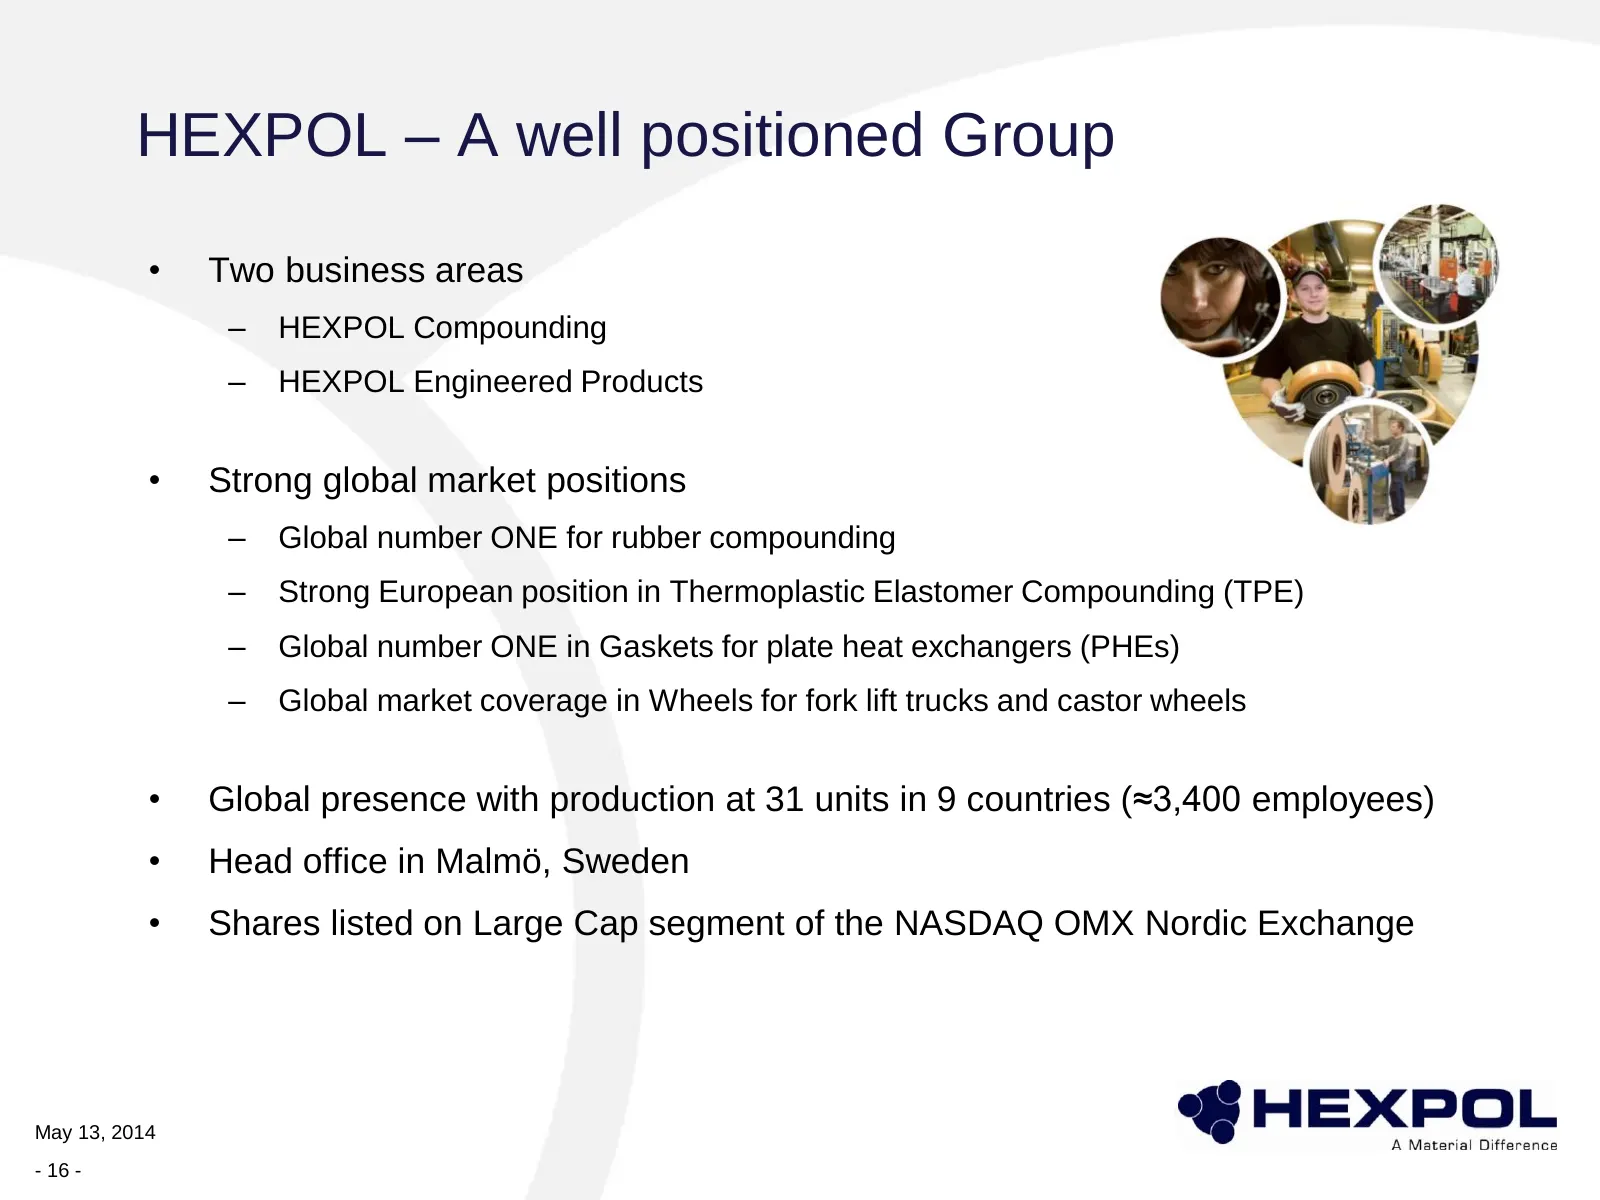
Slide 16: A well positioned Group
HEXPOL – A well positioned Group • Two business areas – HEXPOL Compounding – HEXPOL Engineered Products • Strong global market positions – Global number ONE for rubber compounding – Strong European position in Thermoplastic Elastomer Compounding (TPE) – Global number ONE in Gaskets for plate heat ex
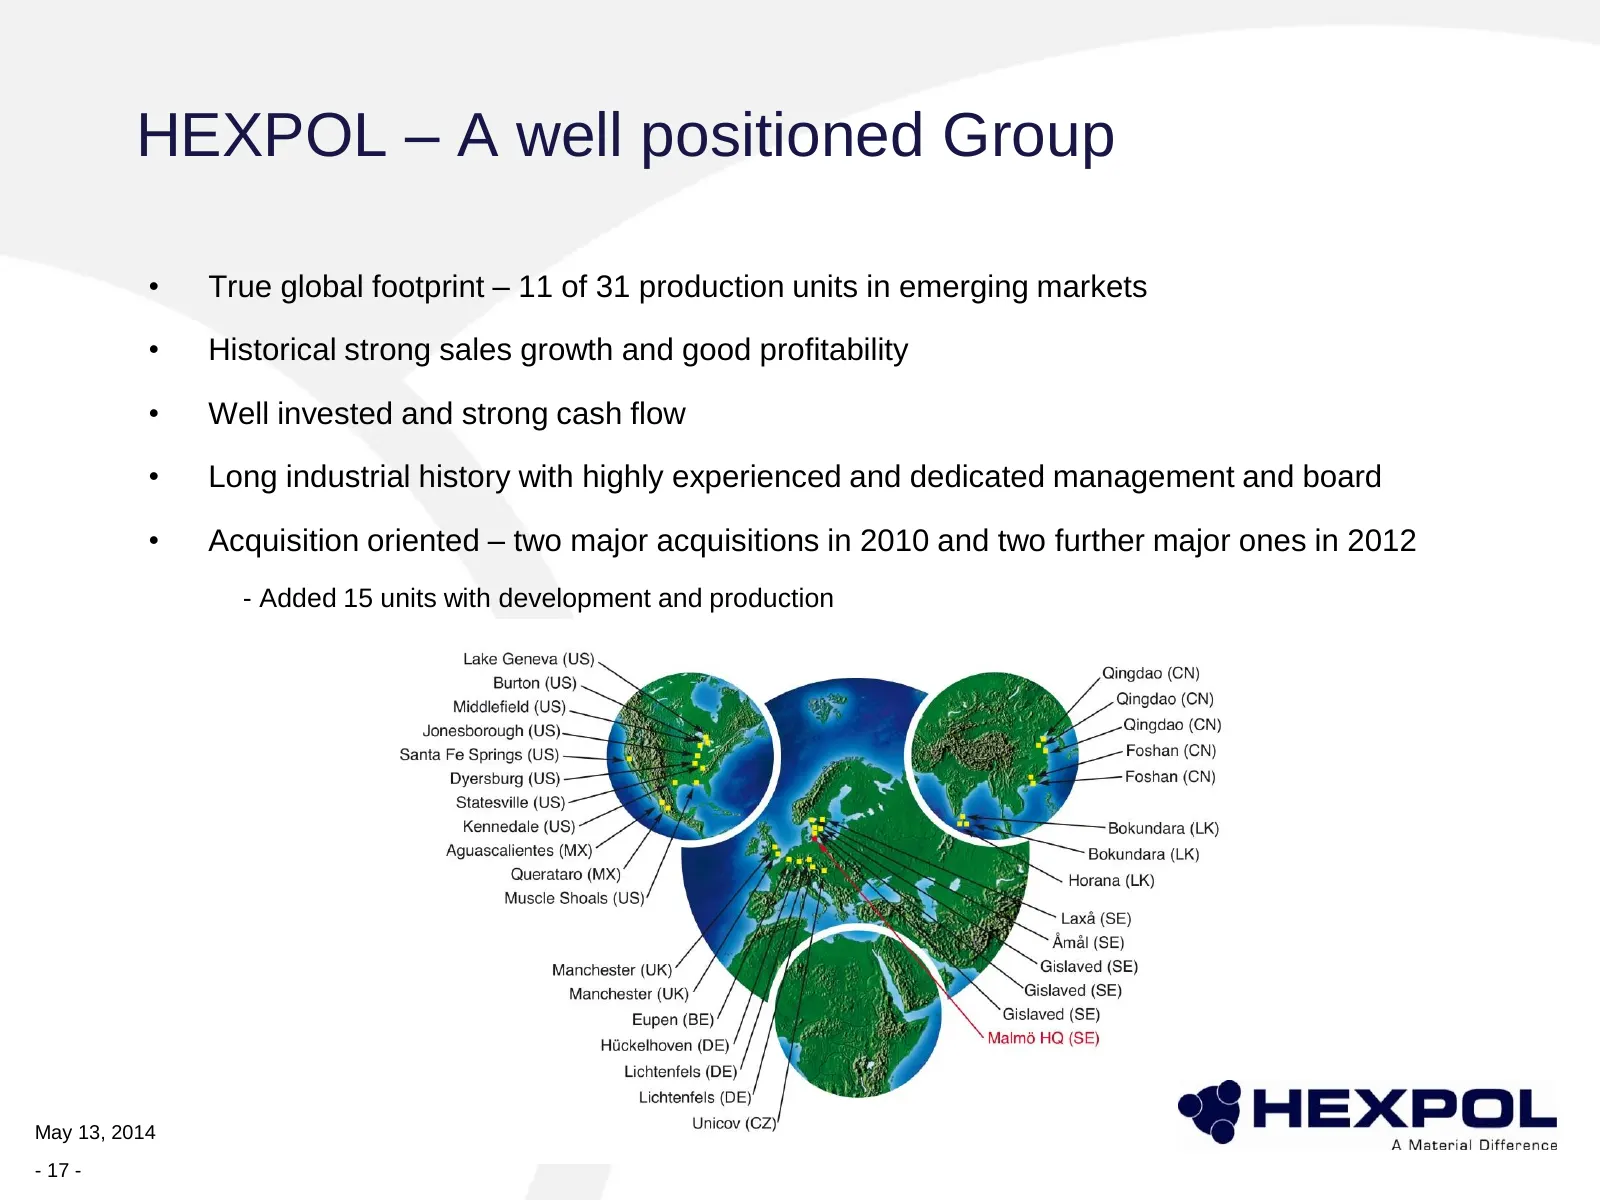
Slide 17: A well positioned Group
HEXPOL – A well positioned Group • True global footprint – 11 of 31 production units in emerging markets • Historical strong sales growth and good profitability • Well invested and strong cash flow • Long industrial history with highly experienced and dedicated management and board • Acquisition ori
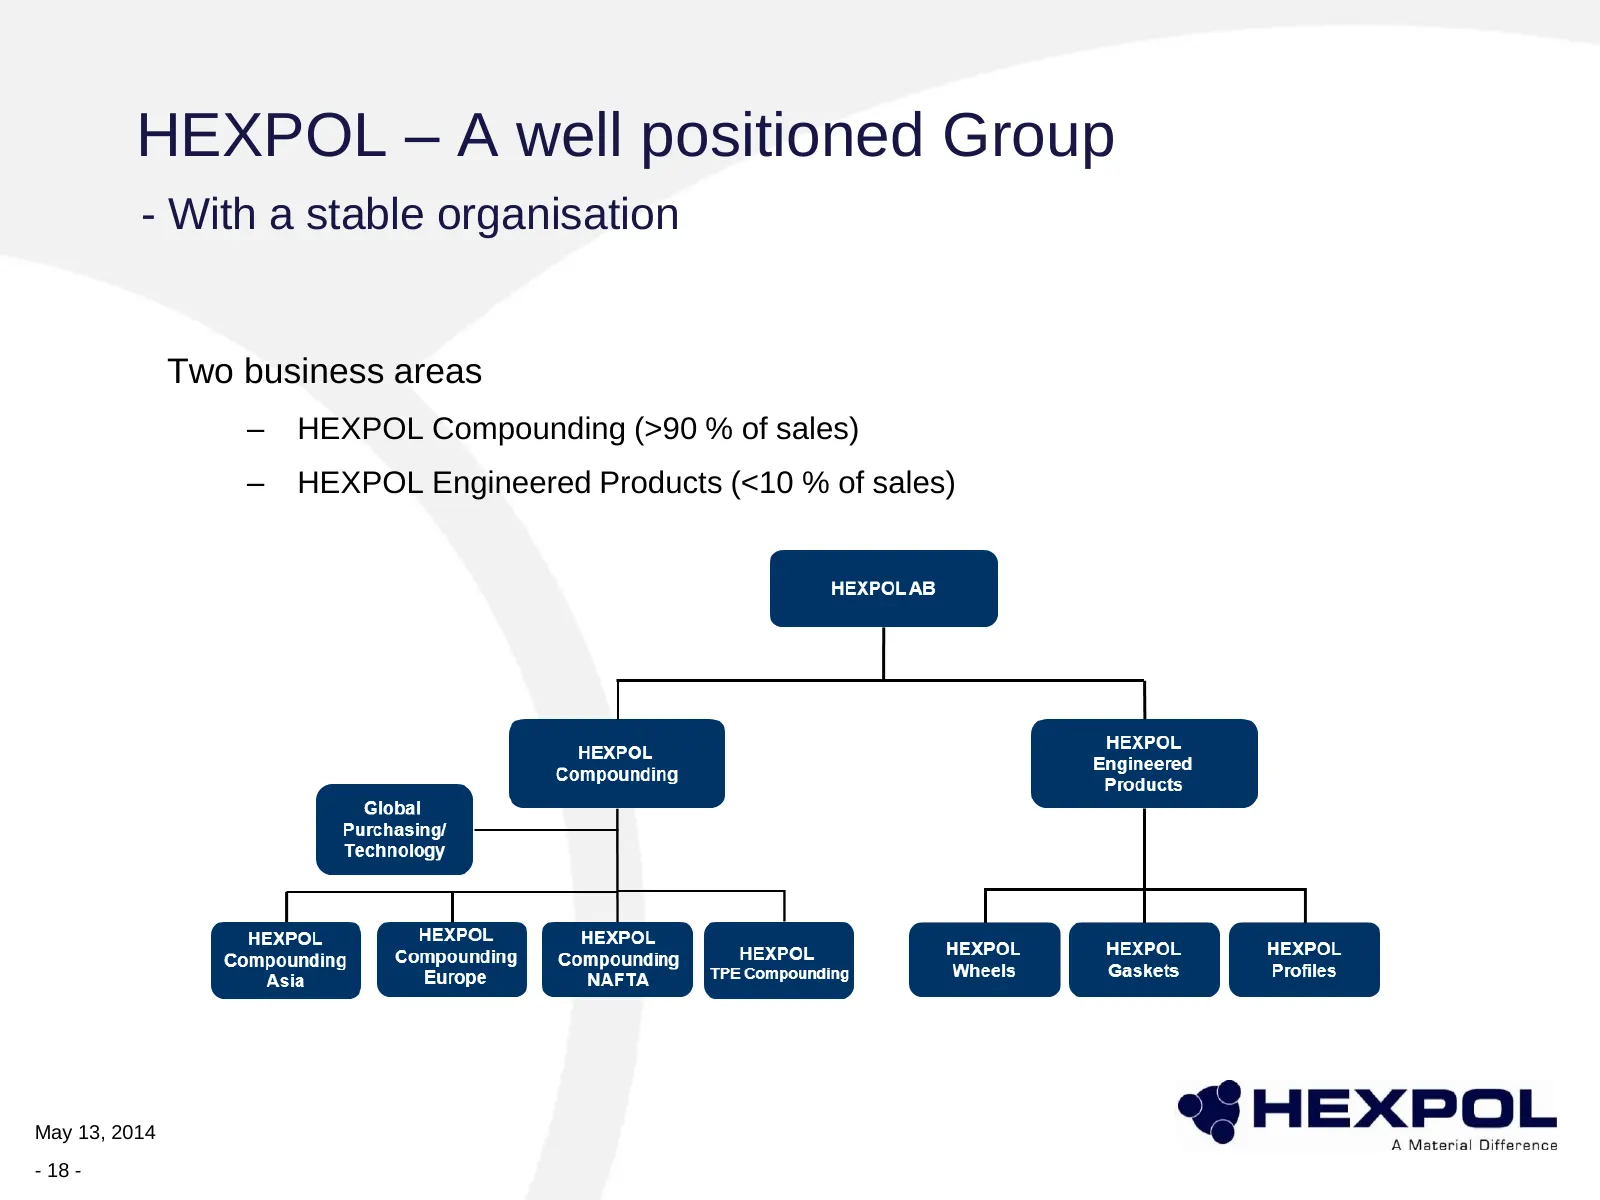
Slide 18: With a stable organisation
HEXPOL – A well positioned Group - With a stable organisation Two business areas – HEXPOL Compounding (>90 % of sales) – HEXPOL Engineered Products (<10 % of sales) May 13, 2014 - 18 -
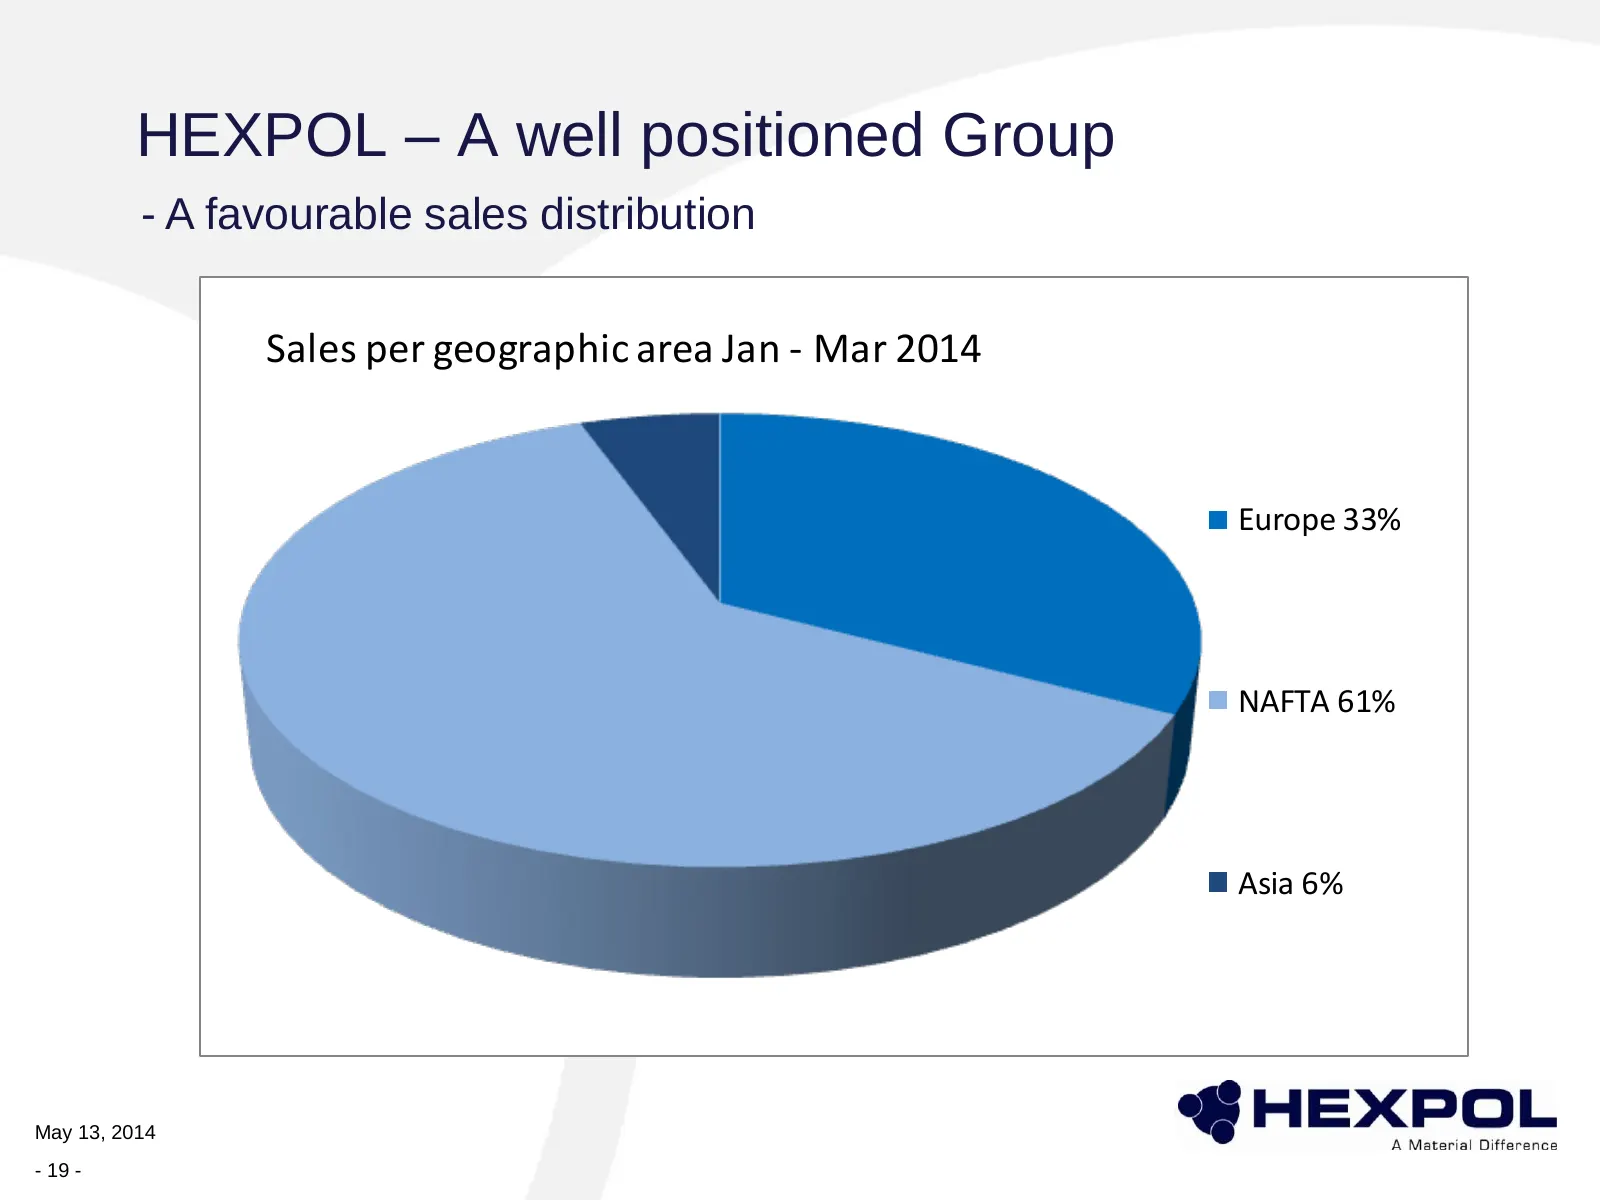
Slide 19: A favourable sales distribution
HEXPOL – A well positioned Group - A favourable sales distribution Sales per geographic area Jan - Mar 2014 Europe 33% NAFTA 61% Asia 6% May 13, 2014 - 19 -
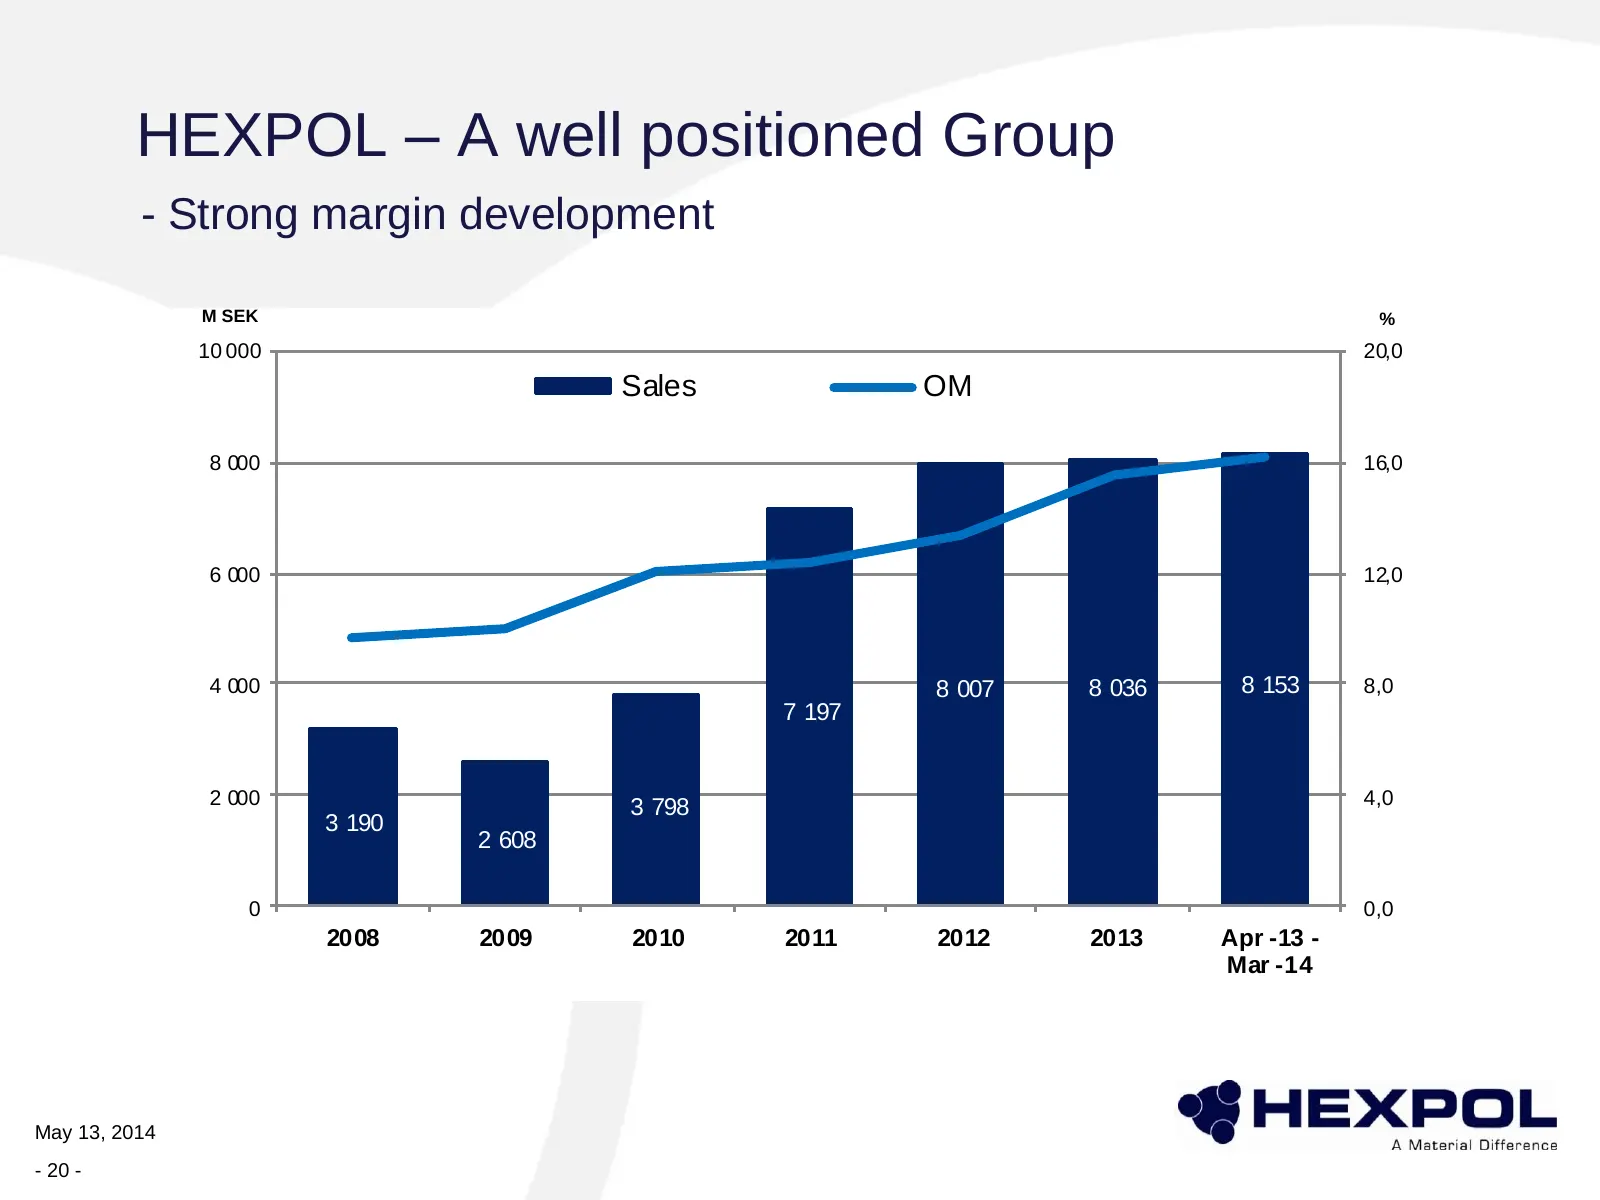
Slide 20: Strong margin development
HEXPOL – A well positioned Group - Strong margin development M SEK % 10 000 20,0 Sales OM 8 000 16,0 6 000 12,0 4 000 8 007 8 036 8 153 8,0 7 197 2 000 3 798 4,0 3 190 2 608 0 0,0 2008 2009 2010 2011 2012 2013 Apr -13 - Mar -14 May 13, 2014 - 20 -
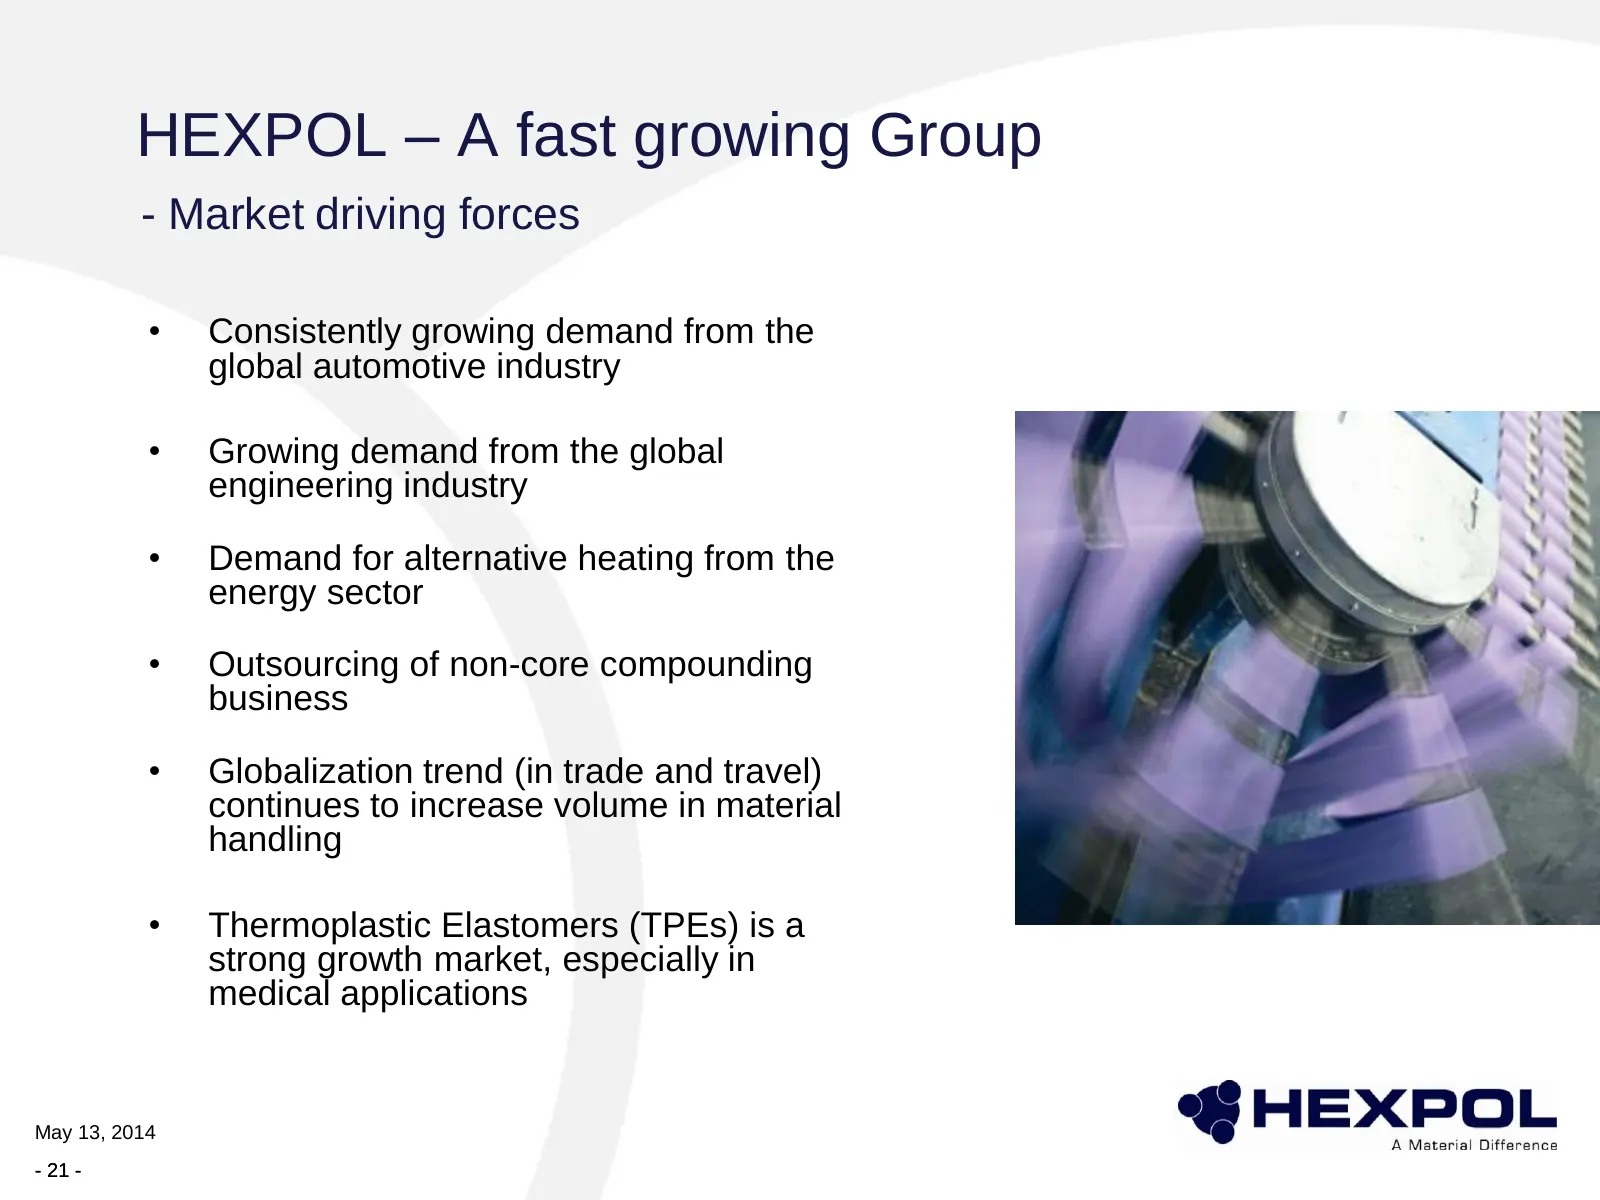
Slide 21: Market driving forces
HEXPOL – A fast growing Group - Market driving forces • Consistently growing demand from the global automotive industry • Growing demand from the global engineering industry • Demand for alternative heating from the energy sector • Outsourcing of non-core compounding business • Globalization trend (
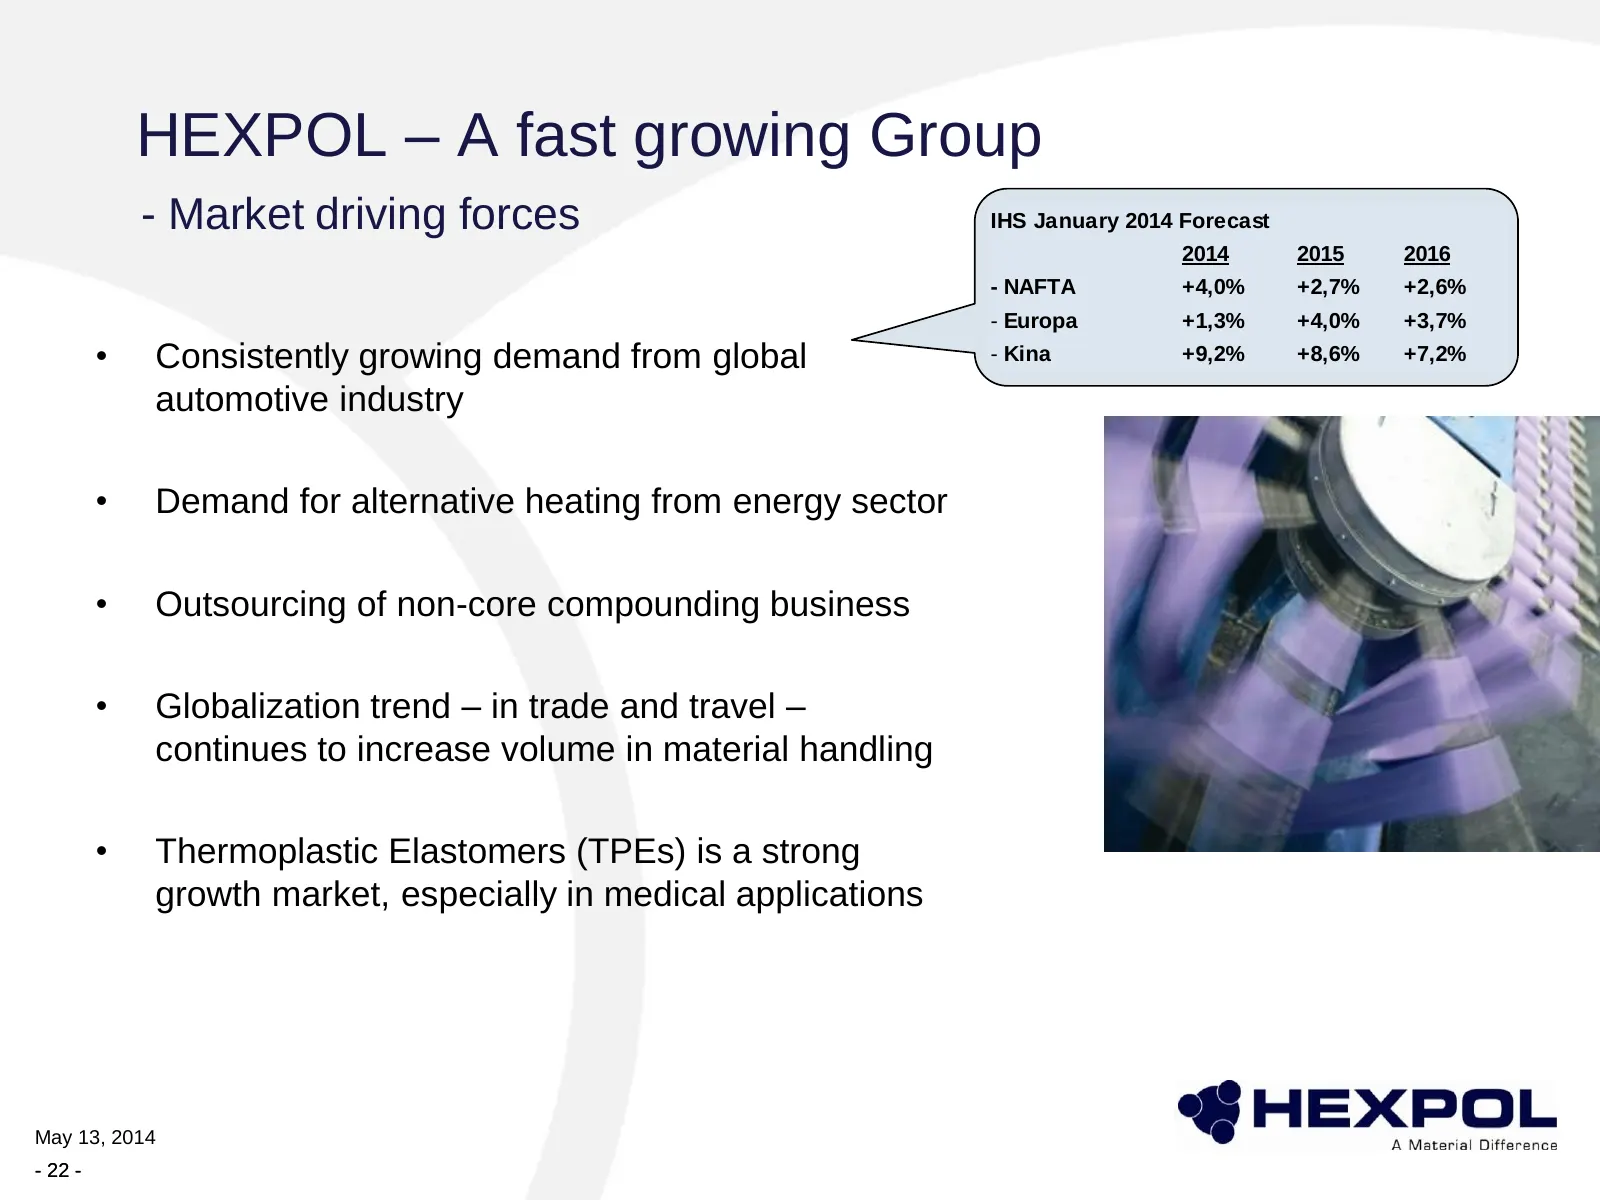
Slide 22: Market driving forces – IHS forecast
HEXPOL – A fast growing Group - Market driving forces IHS January 2014 Forecast 2014 2015 2016 - NAFTA +4,0% +2,7% +2,6% - Europa +1,3% +4,0% +3,7% • Consistently growing demand from global - Kina +9,2% +8,6% +7,2% automotive industry • Demand for alternative heating from energy sector • Outsourcing
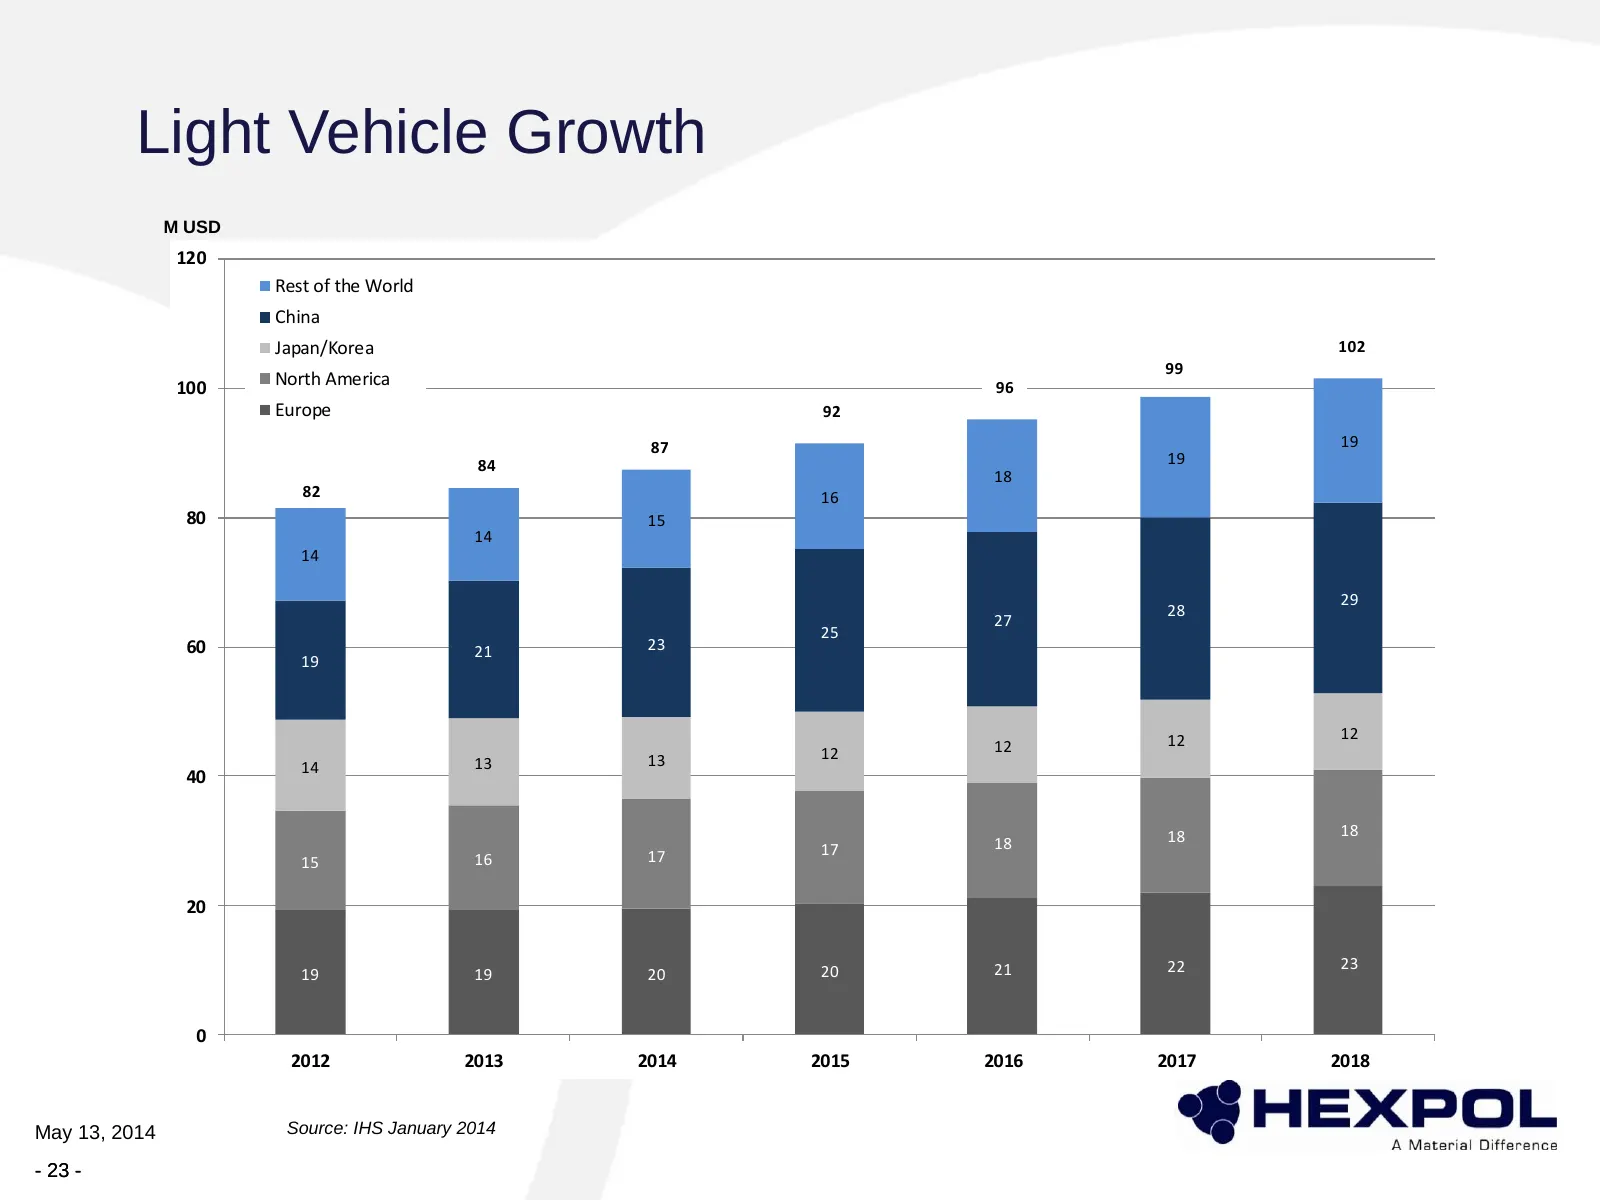
Slide 23: Light Vehicle Growth
Light Vehicle Growth M USD 120 Rest of the World China Japan/Korea 102 99 100 North America 96 Europe 92 87 19 84 19 18 82 16 80 15 14 14 29 28 27 25 60 21 23 19 12 12 12 12 14 13 13 40 18 18 17 18 15 16 17 20 20 21 22 23 19 19 20 0 2012 2013 2014 2015 2016 2017 2018 May 13, 2014 Source: IHS January
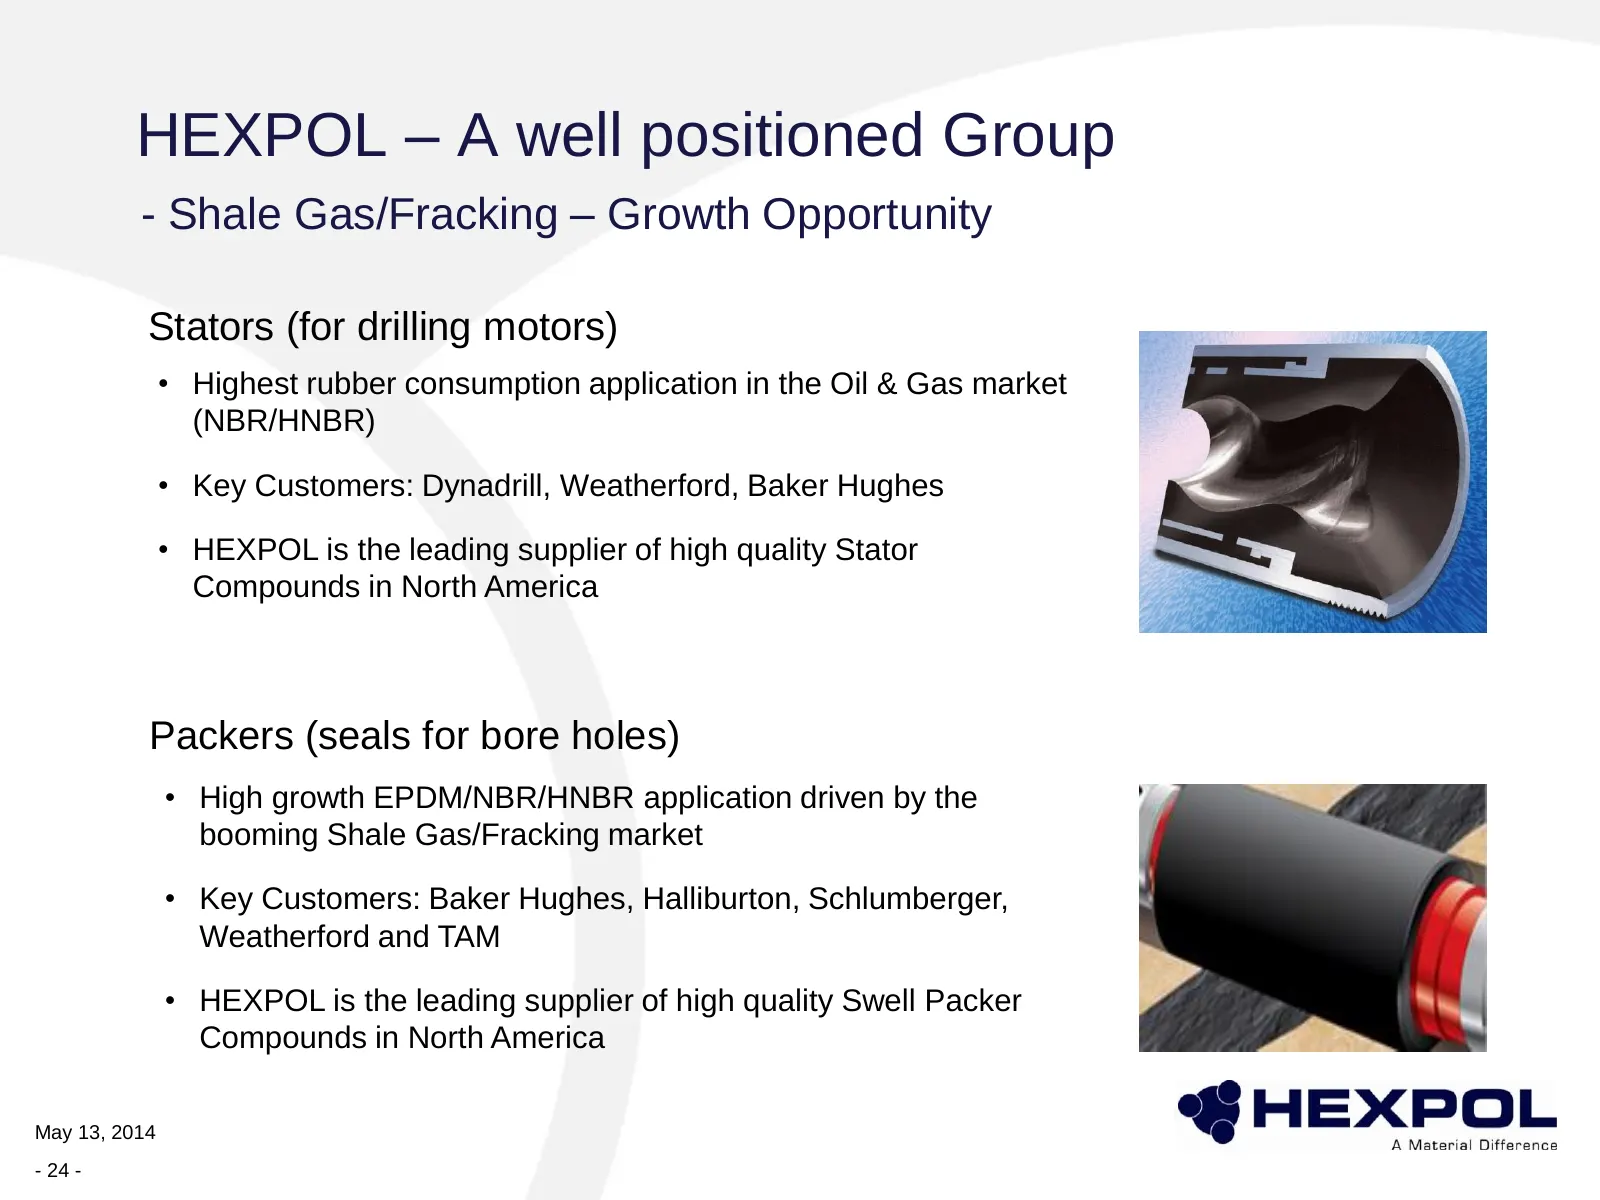
Slide 24: Shale Gas/Fracking – Growth Opportunity
HEXPOL – A well positioned Group - Shale Gas/Fracking – Growth Opportunity Stators (for drilling motors) • Highest rubber consumption application in the Oil & Gas market (NBR/HNBR) • Key Customers: Dynadrill, Weatherford, Baker Hughes • HEXPOL is the leading supplier of high quality Stator Compounds
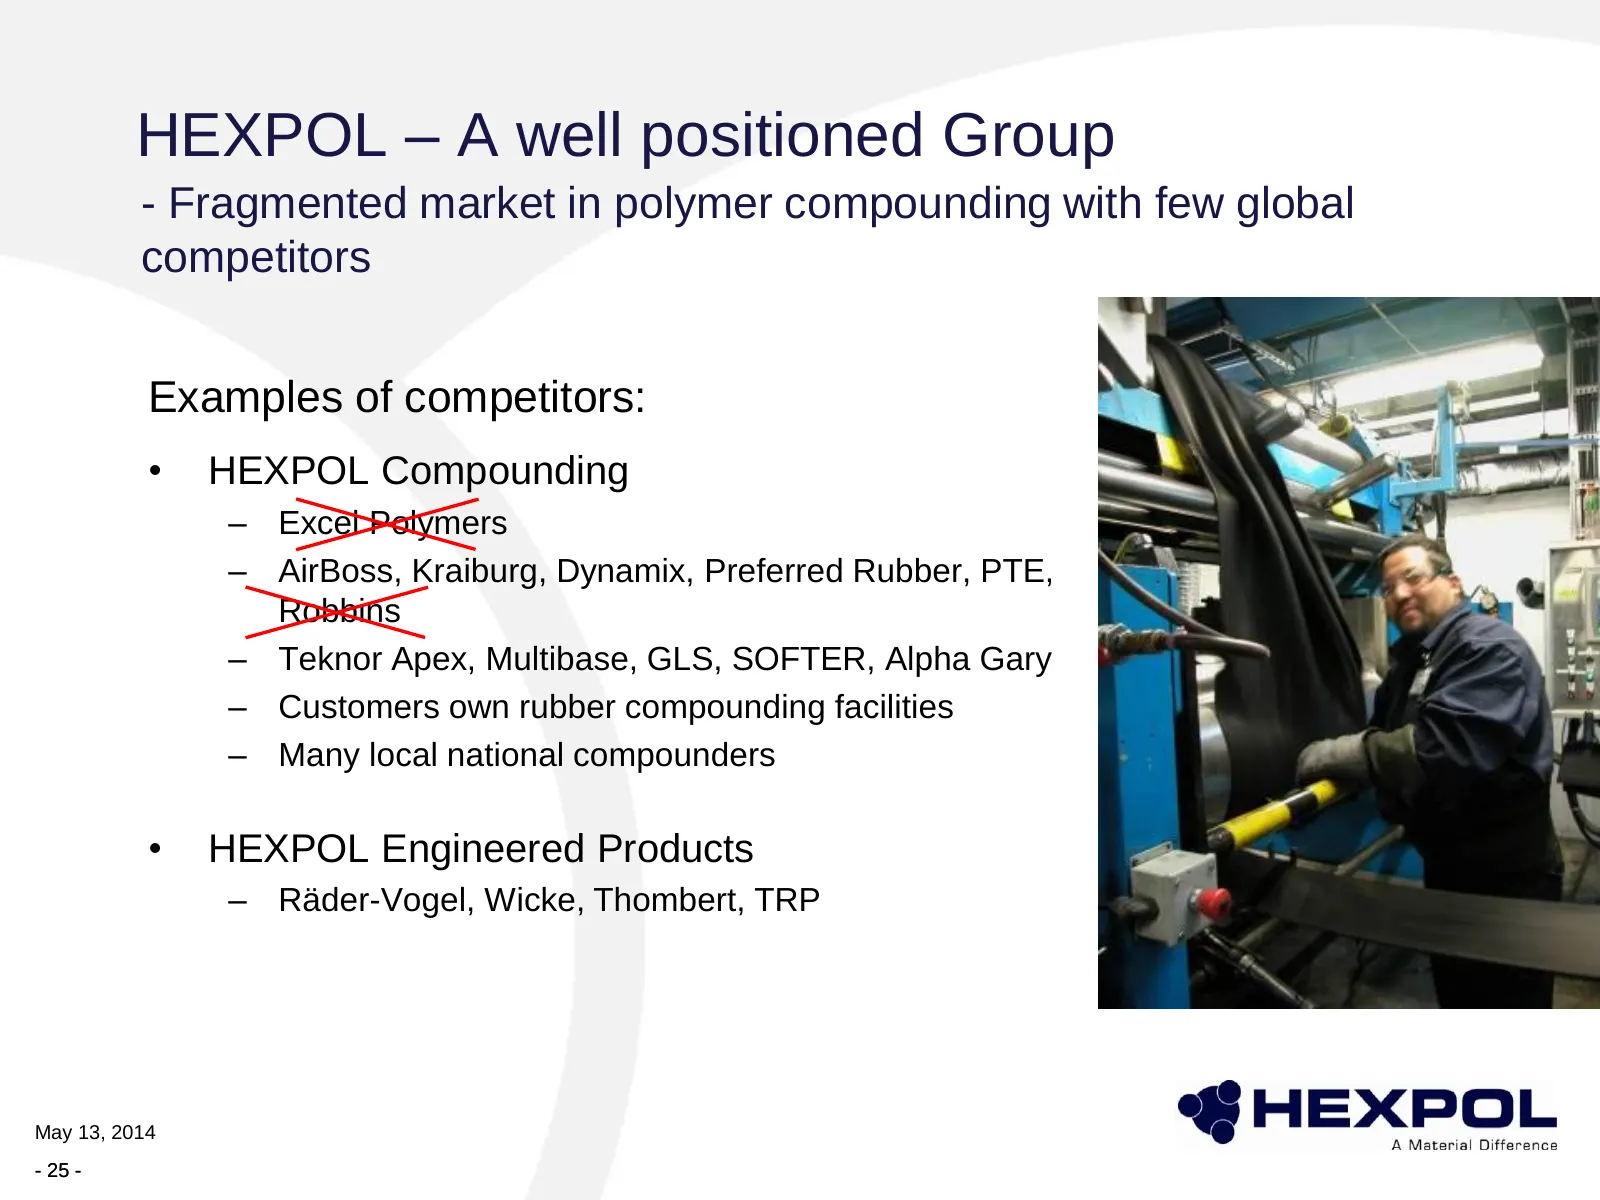
Slide 25: Fragmented market with few global competitors
HEXPOL – A well positioned Group - Fragmented market in polymer compounding with few global competitors Examples of competitors: • HEXPOL Compounding – Excel Polymers – AirBoss, Kraiburg, Dynamix, Preferred Rubber, PTE, Robbins – Teknor Apex, Multibase, GLS, SOFTER, Alpha Gary – Customers own rubber
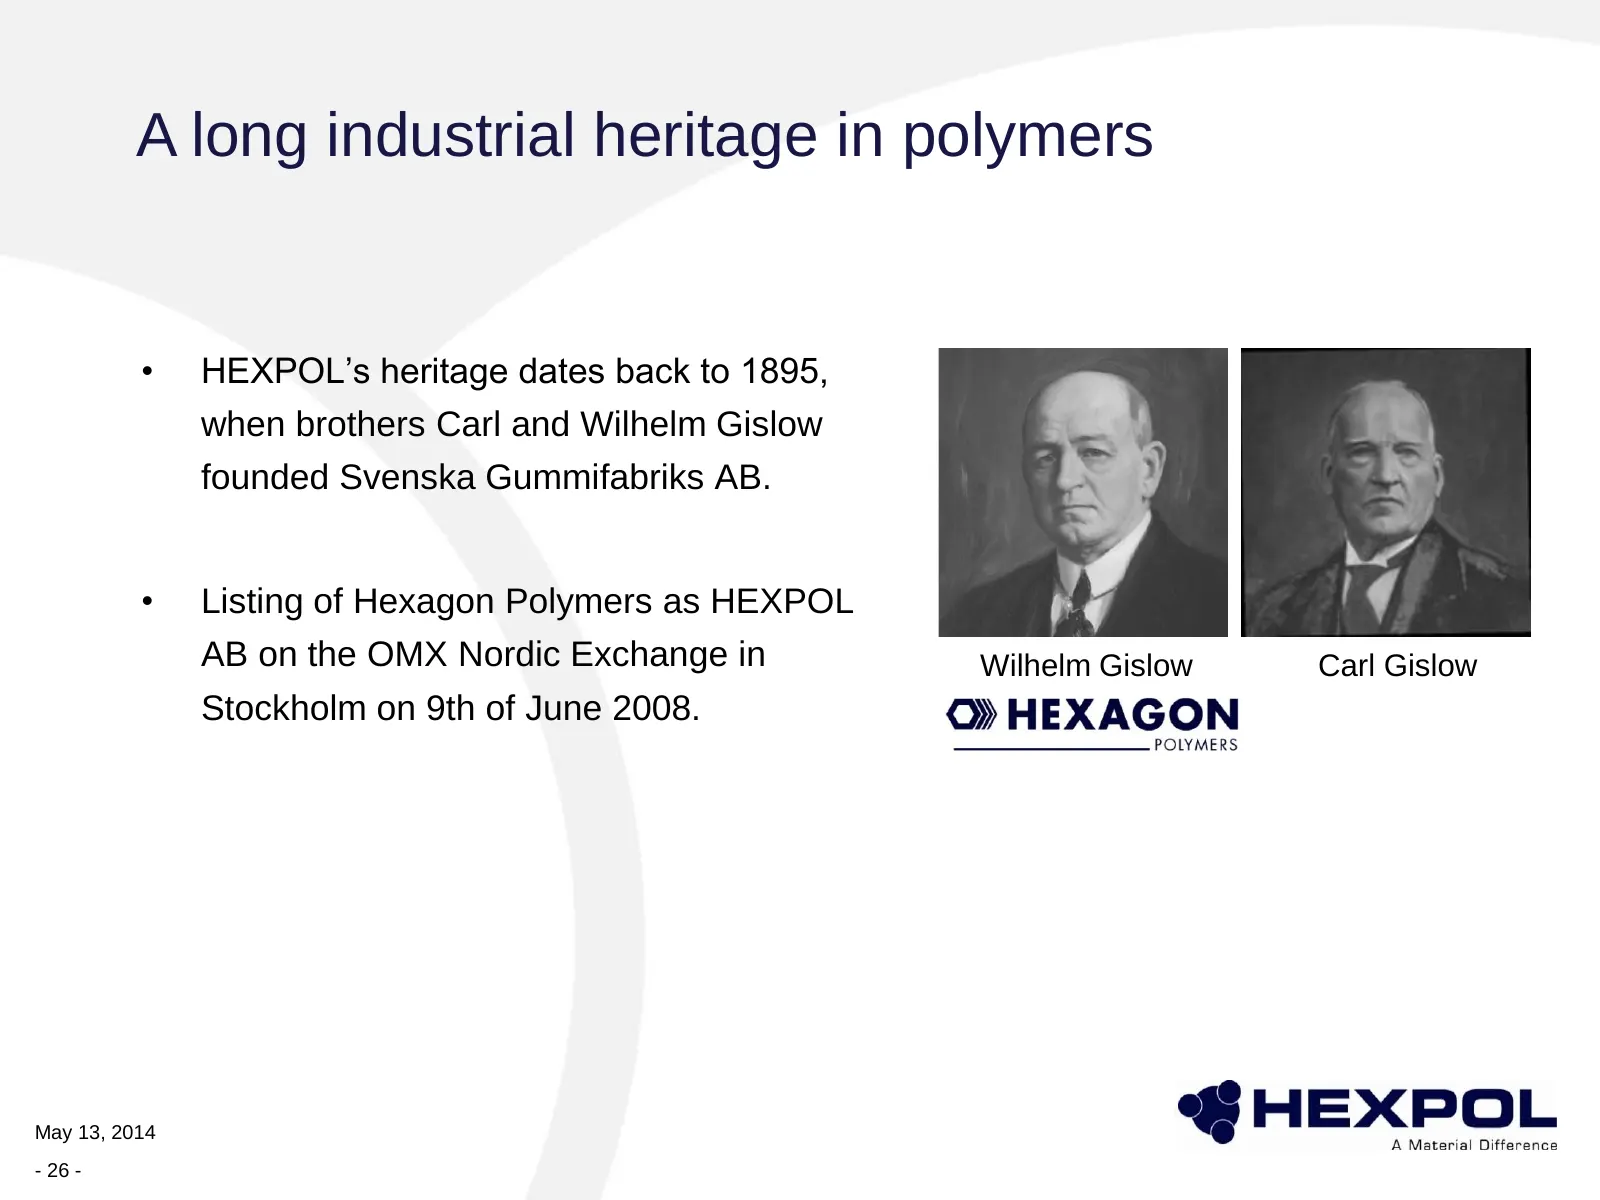
Slide 26: A long industrial heritage in polymers
A long industrial heritage in polymers • HEXPOL’s heritage dates back to 1895, when brothers Carl and Wilhelm Gislow founded Svenska Gummifabriks AB. • Listing of Hexagon Polymers as HEXPOL AB on the OMX Nordic Exchange in Wilhelm Gislow Carl Gislow Stockholm on 9th of June 2008. May 13, 2014 - 26 -
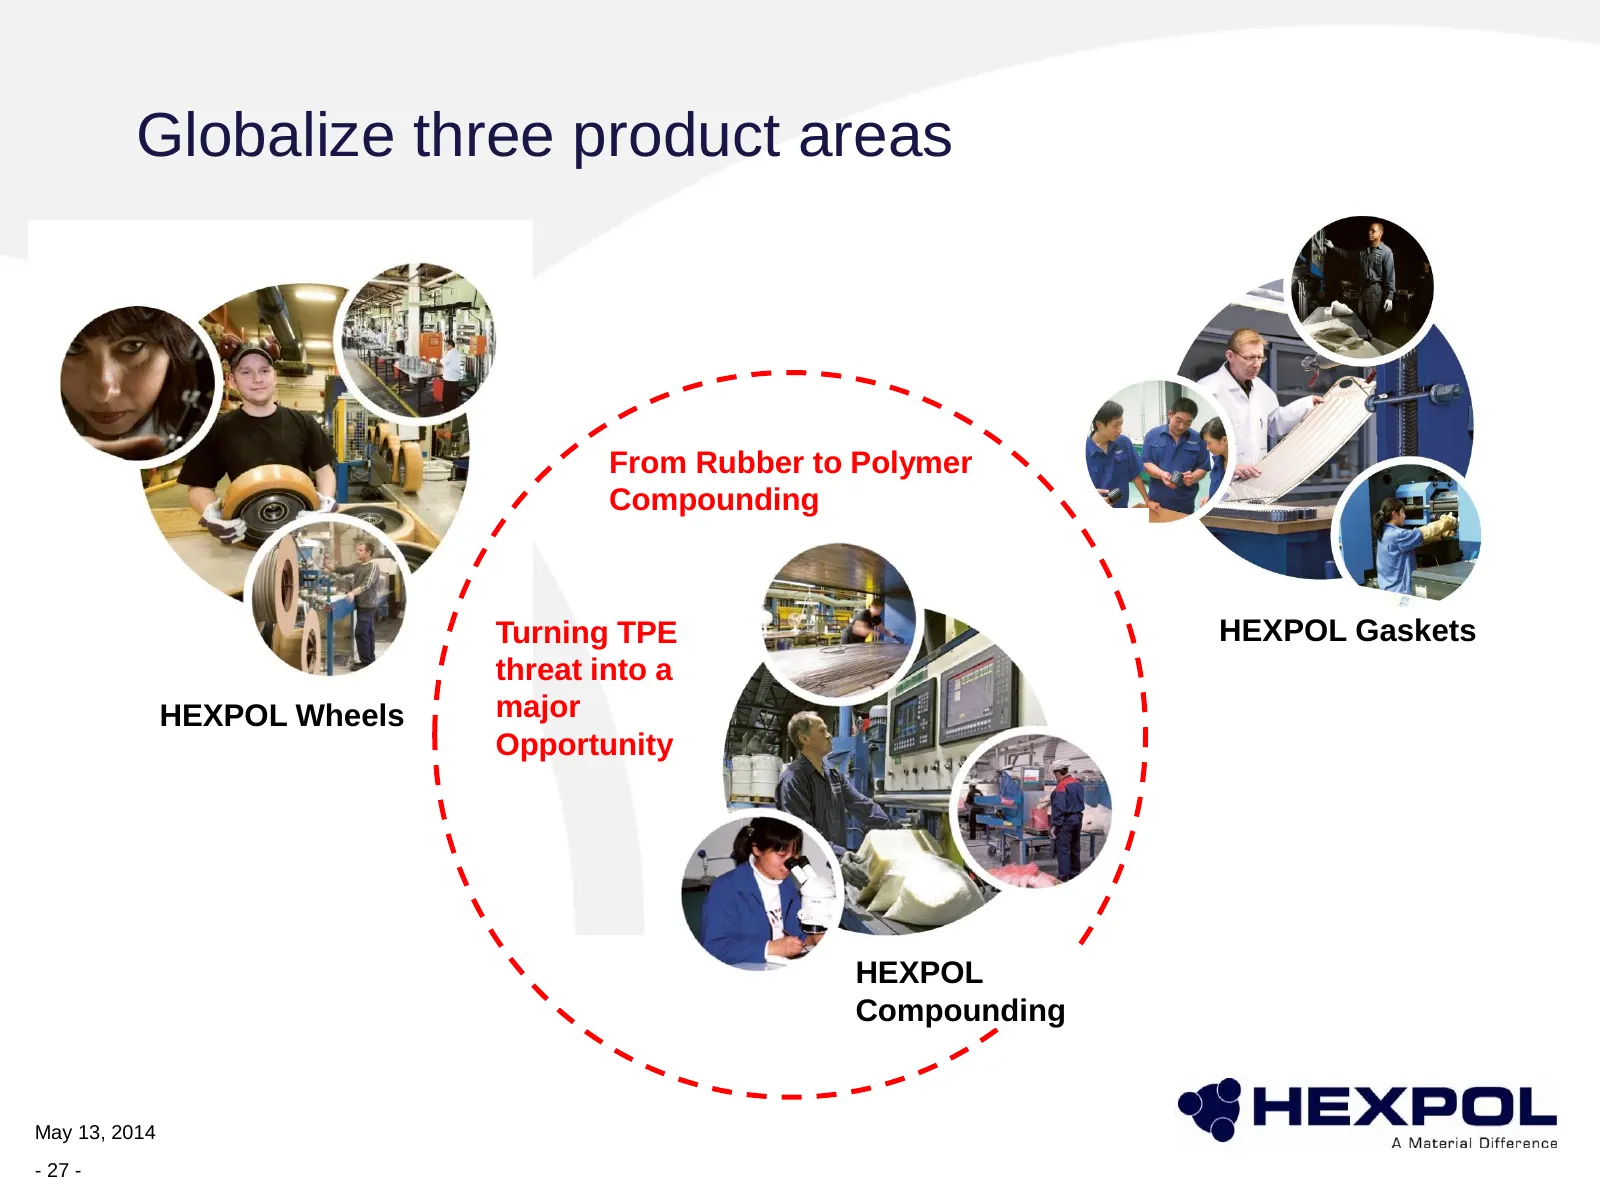
Slide 27: Globalize three product areas
Globalize three product areas From Rubber to Polymer Compounding Turning TPE HEXPOL Gaskets threat into a HEXPOL Wheels major Opportunity HEXPOL Compounding May 13, 2014 - 27 -
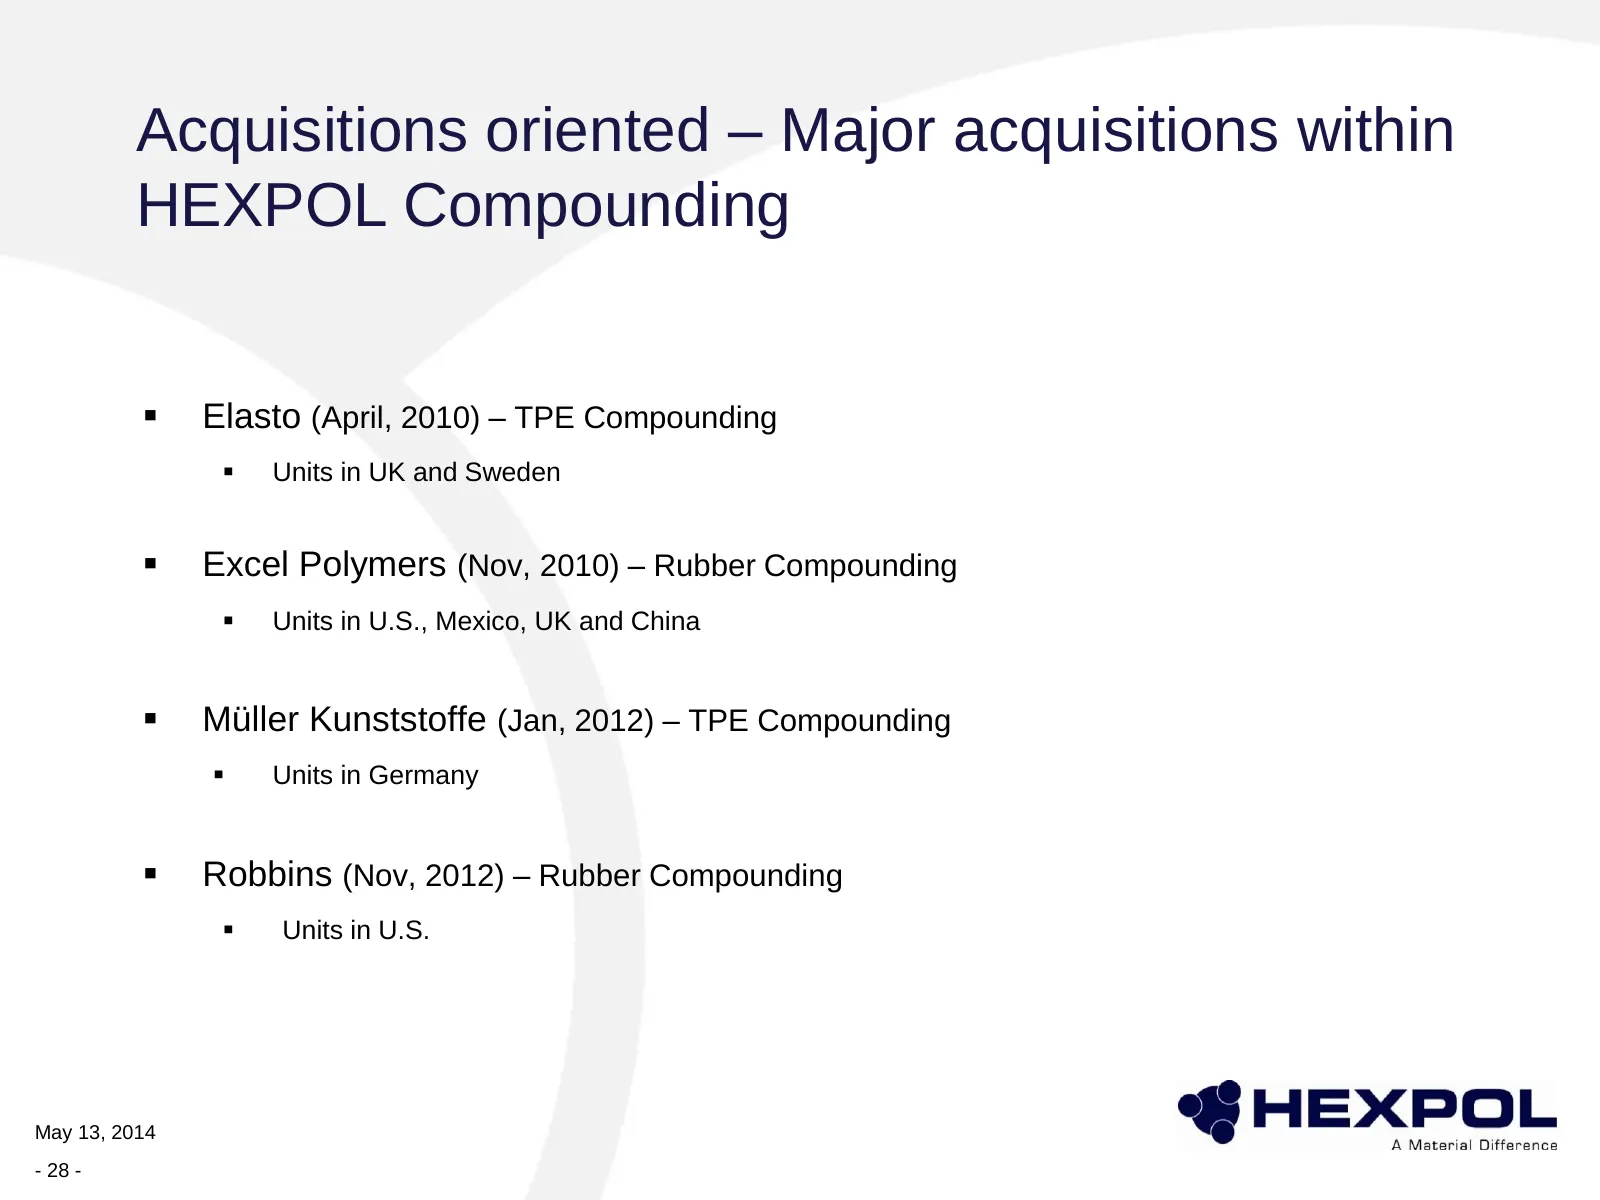
Slide 28: Acquisitions oriented – Major acquisitions
Acquisitions oriented – Major acquisitions within HEXPOL Compounding Elasto (April, 2010) – TPE Compounding Units in UK and Sweden Excel Polymers (Nov, 2010) – Rubber Compounding Units in U.S., Mexico, UK and China Müller Kunststoffe (Jan, 2012) – TPE Compounding Units in Germany Robbi
Slide 29: Continued expansion within Rubber Compounding
Acquisitions oriented – Continued expansion within HEXPOL Rubber Compounding Including acquisitions within: New end user customer segments New geografical regions May 13, 2014 - 29 -
Slide 30: Acquisition of Excel Polymers, Nov 2010
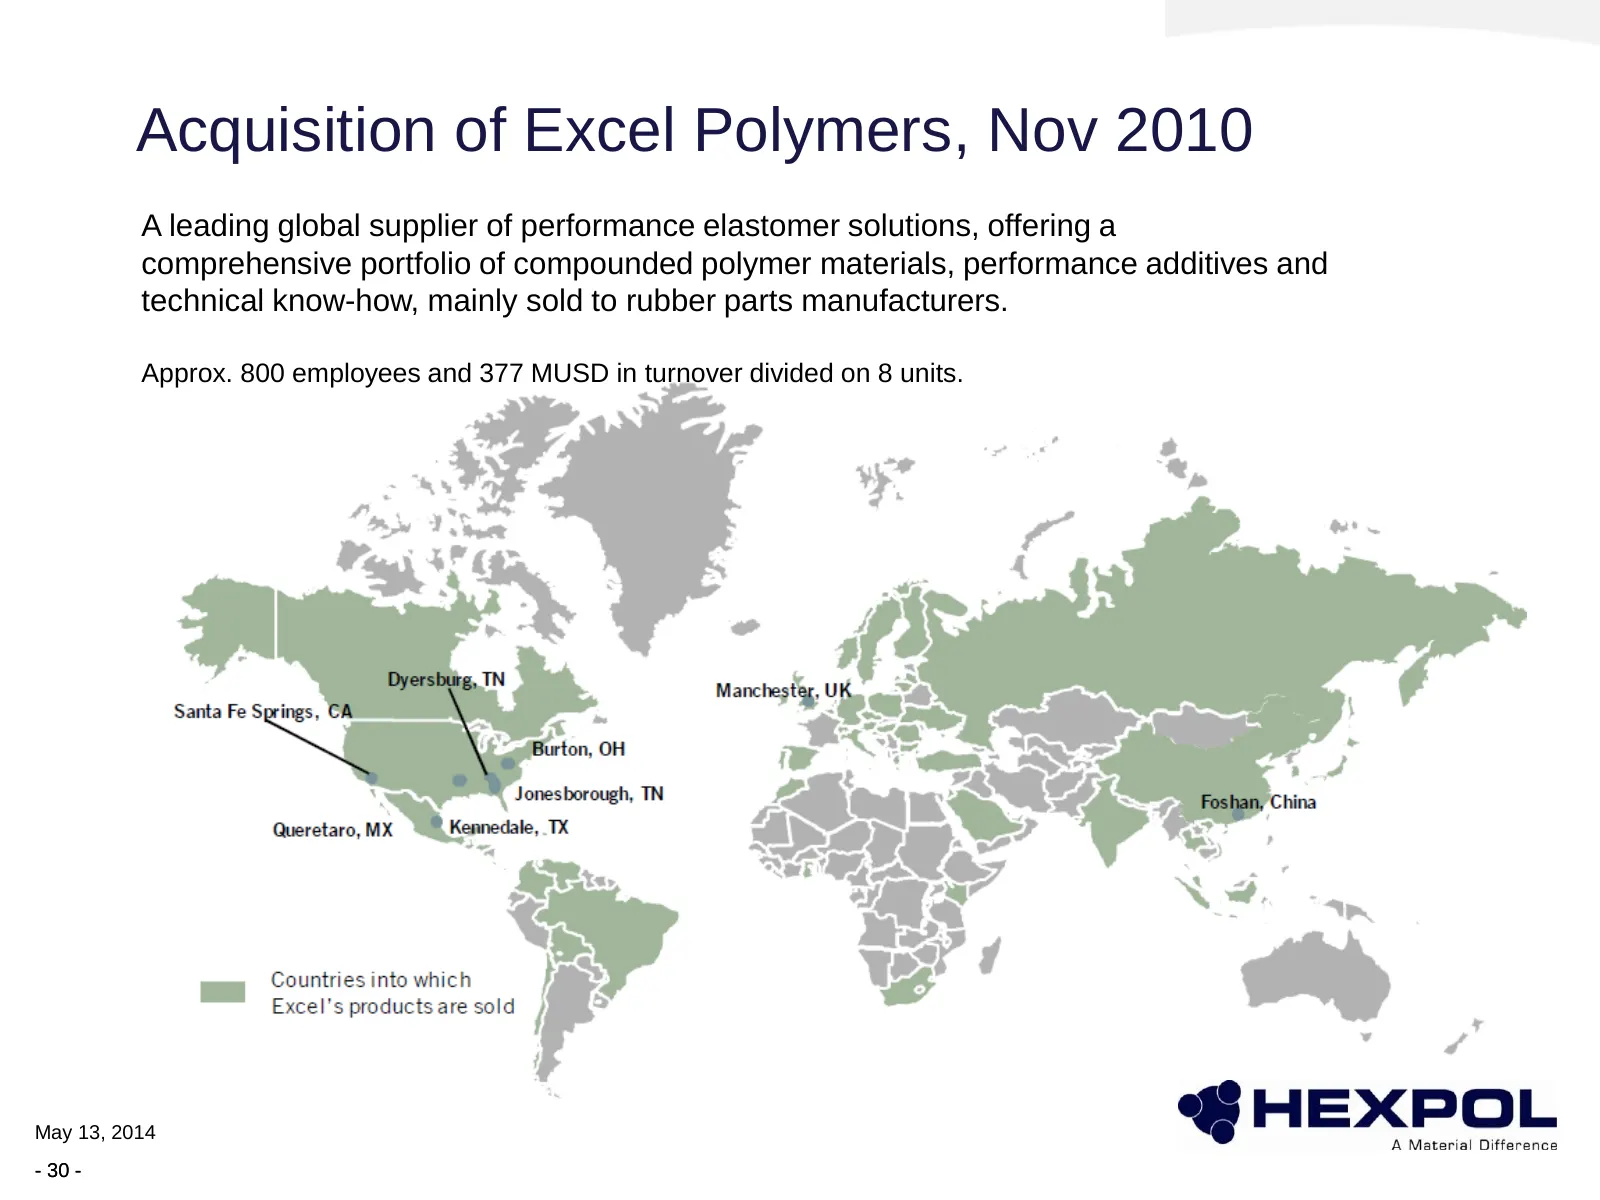
Acquisition of Excel Polymers, Nov 2010 A leading global supplier of performance elastomer solutions, offering a comprehensive portfolio of compounded polymer materials, performance additives and technical know-how, mainly sold to rubber parts manufacturers. Approx. 800 employees and 377 MUSD in tur
Slide 31: Excel Polymers – Complementary End Markets
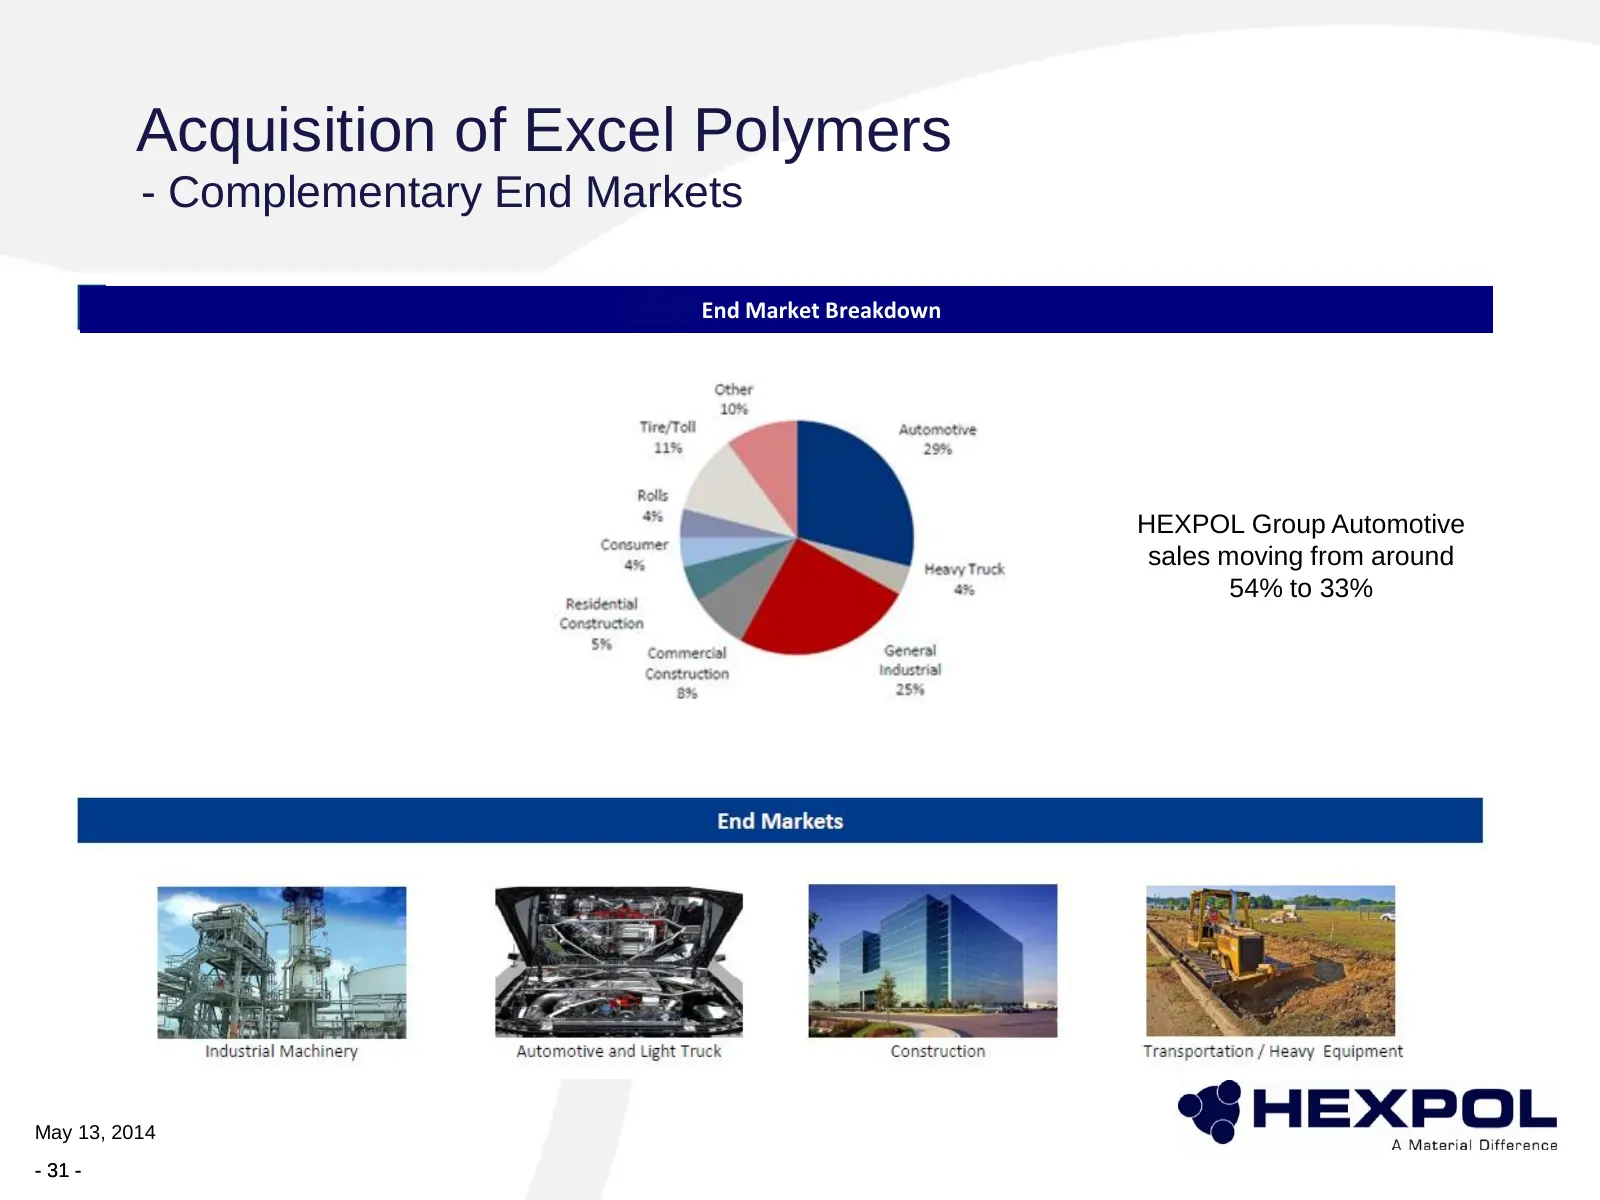
Acquisition of Excel Polymers - Complementary End Markets Excel Polymers 2009A End Market Breakdown HEXPOL Group Automotive sales moving from around 54% to 33% May 13, 2014 - 31 -
Slide 32: Acquisition of Robbins, Nov 2012
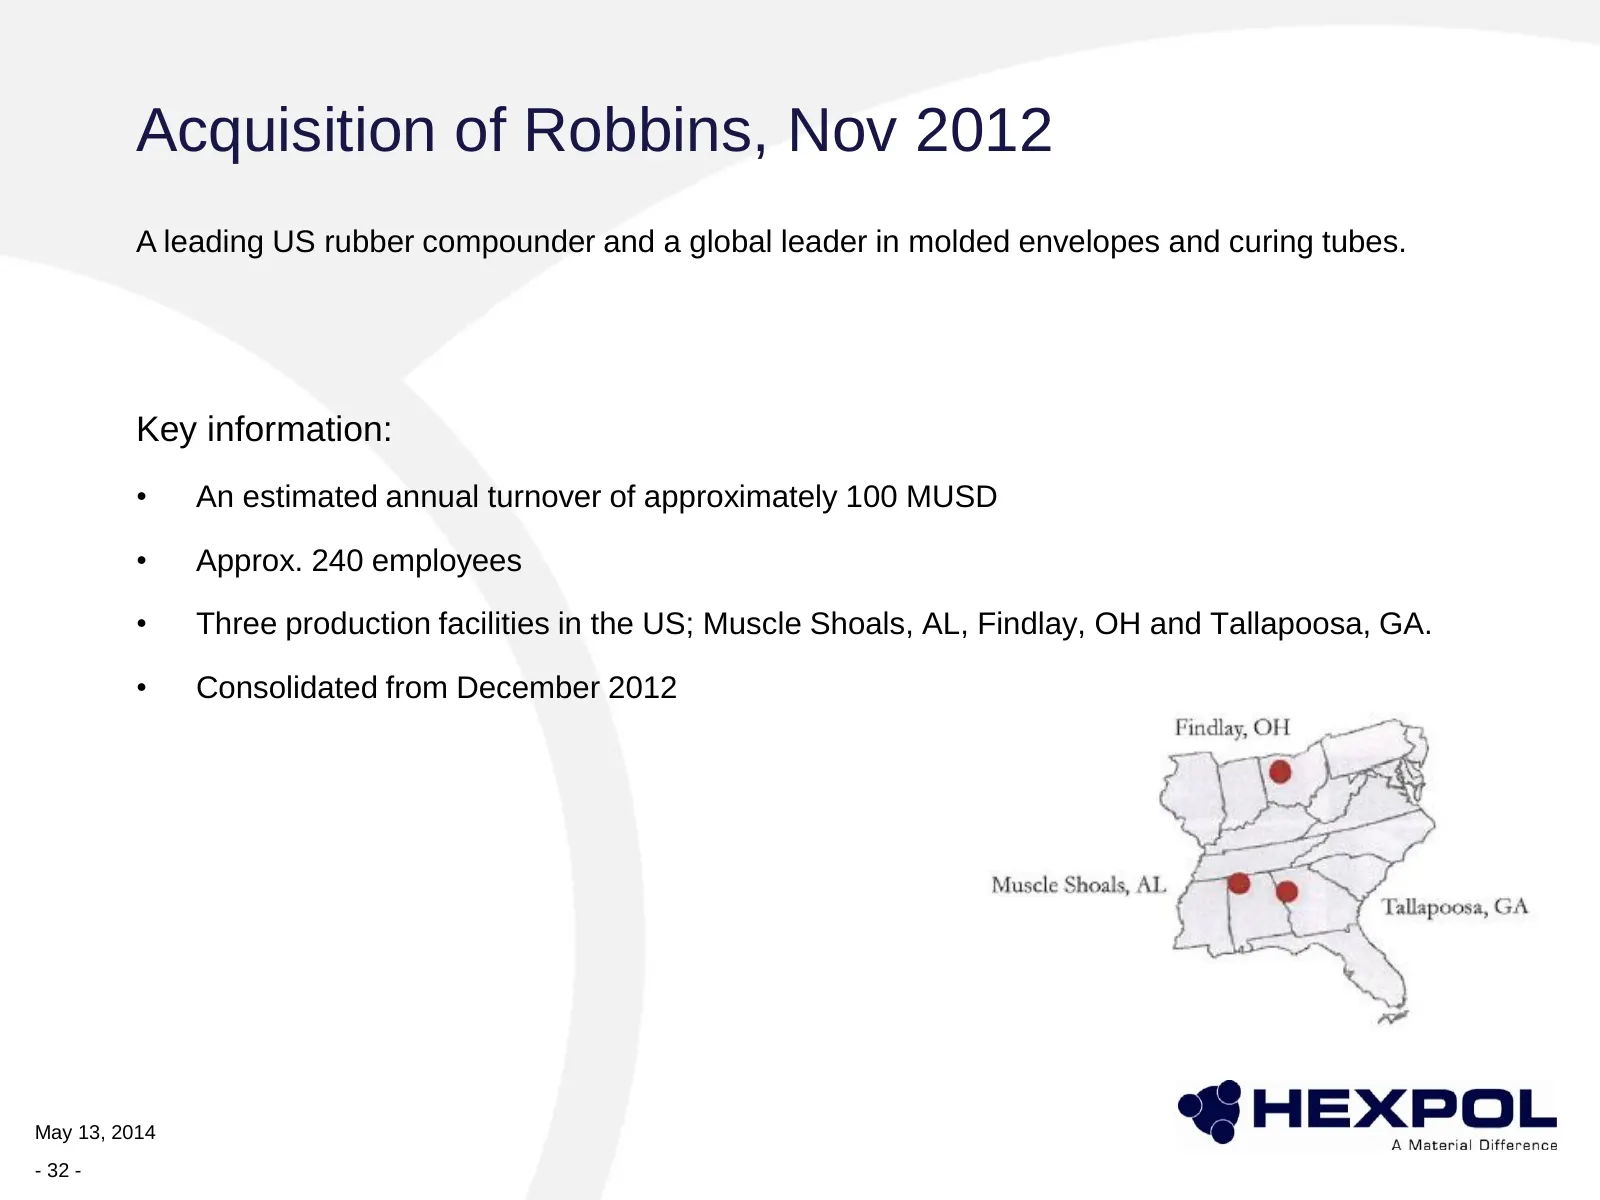
Acquisition of Robbins, Nov 2012 A leading US rubber compounder and a global leader in molded envelopes and curing tubes. Key information: • An estimated annual turnover of approximately 100 MUSD • Approx. 240 employees • Three production facilities in the US; Muscle Shoals, AL, Findlay, OH and Tall
Slide 33: Creating a Global TPE Compounding Business
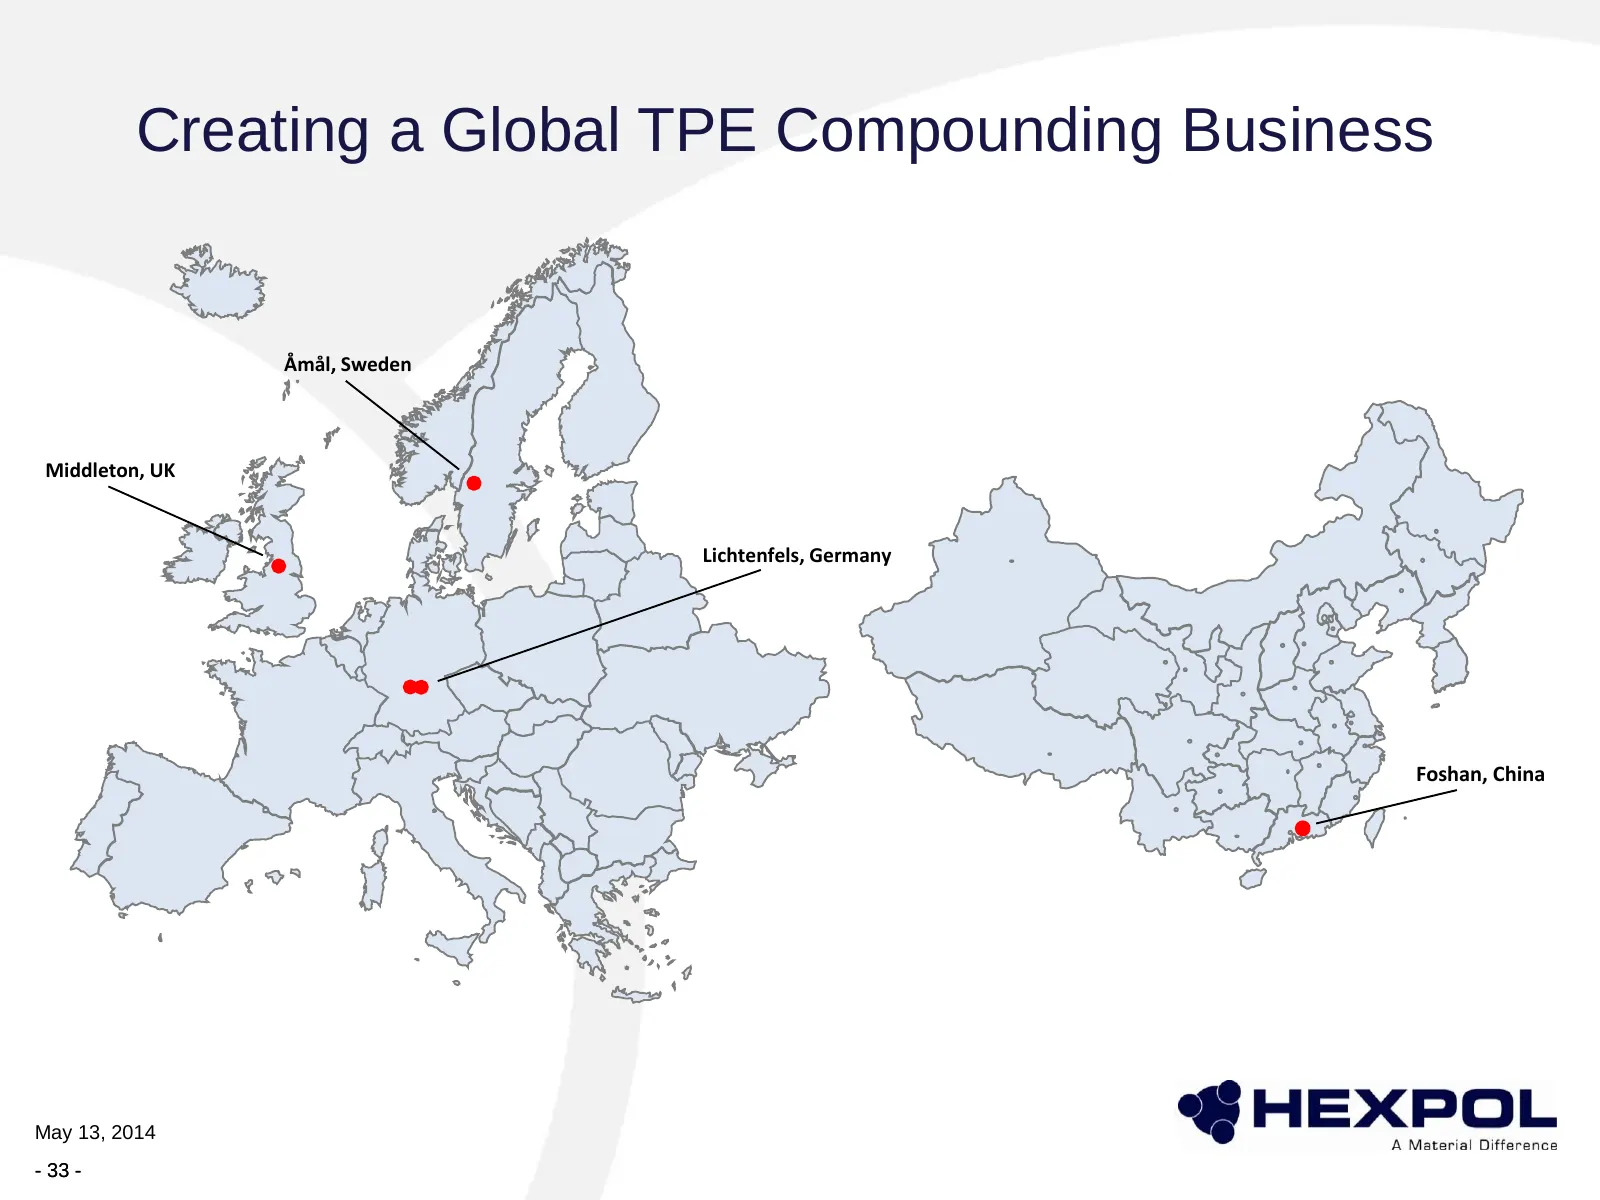
Creating a Global TPE Compounding Business Åmål, Sweden Middleton, UK Lichtenfels, Germany Foshan, China May 13, 2014 - 33 -
Slide 34: Acquisition of Elasto, Apr 2010
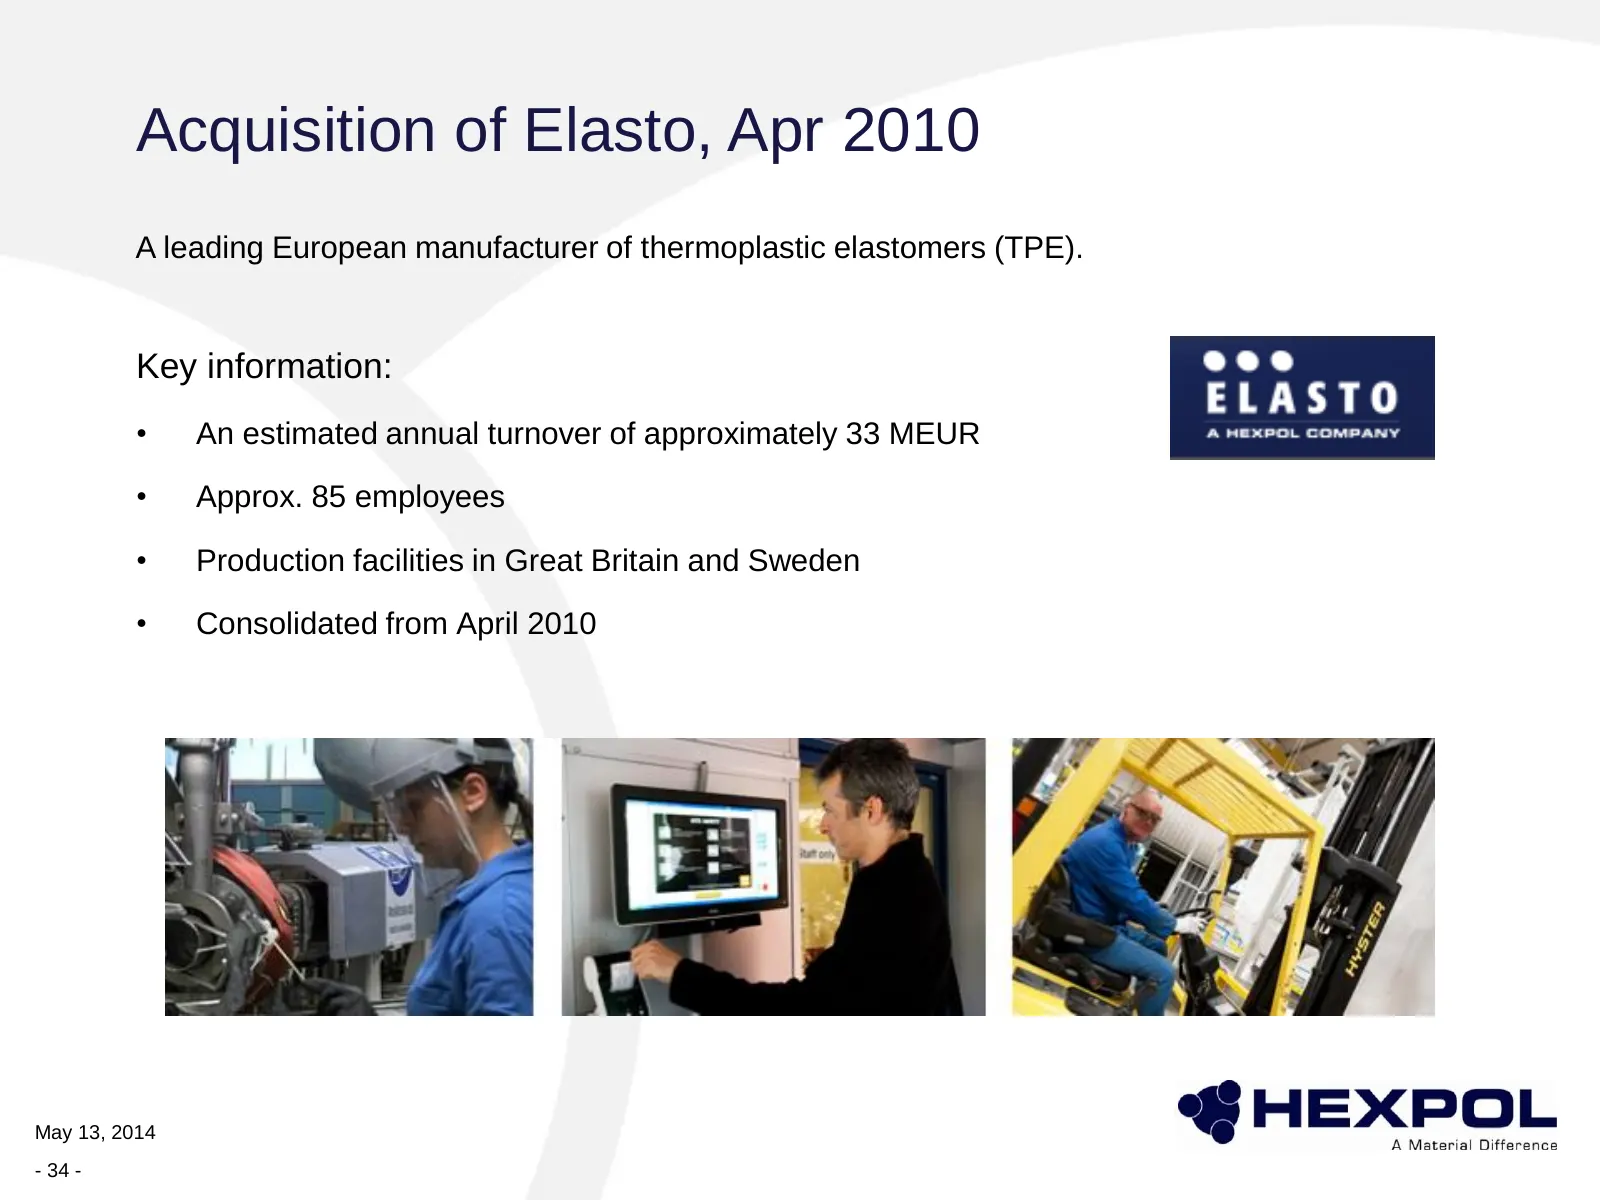
Acquisition of Elasto, Apr 2010 A leading European manufacturer of thermoplastic elastomers (TPE). Key information: • An estimated annual turnover of approximately 33 MEUR • Approx. 85 employees • Production facilities in Great Britain and Sweden • Consolidated from April 2010 May 13, 2014 - 34 -
Slide 35: Acquisition of Müller Kunststoffe, Jan 2012
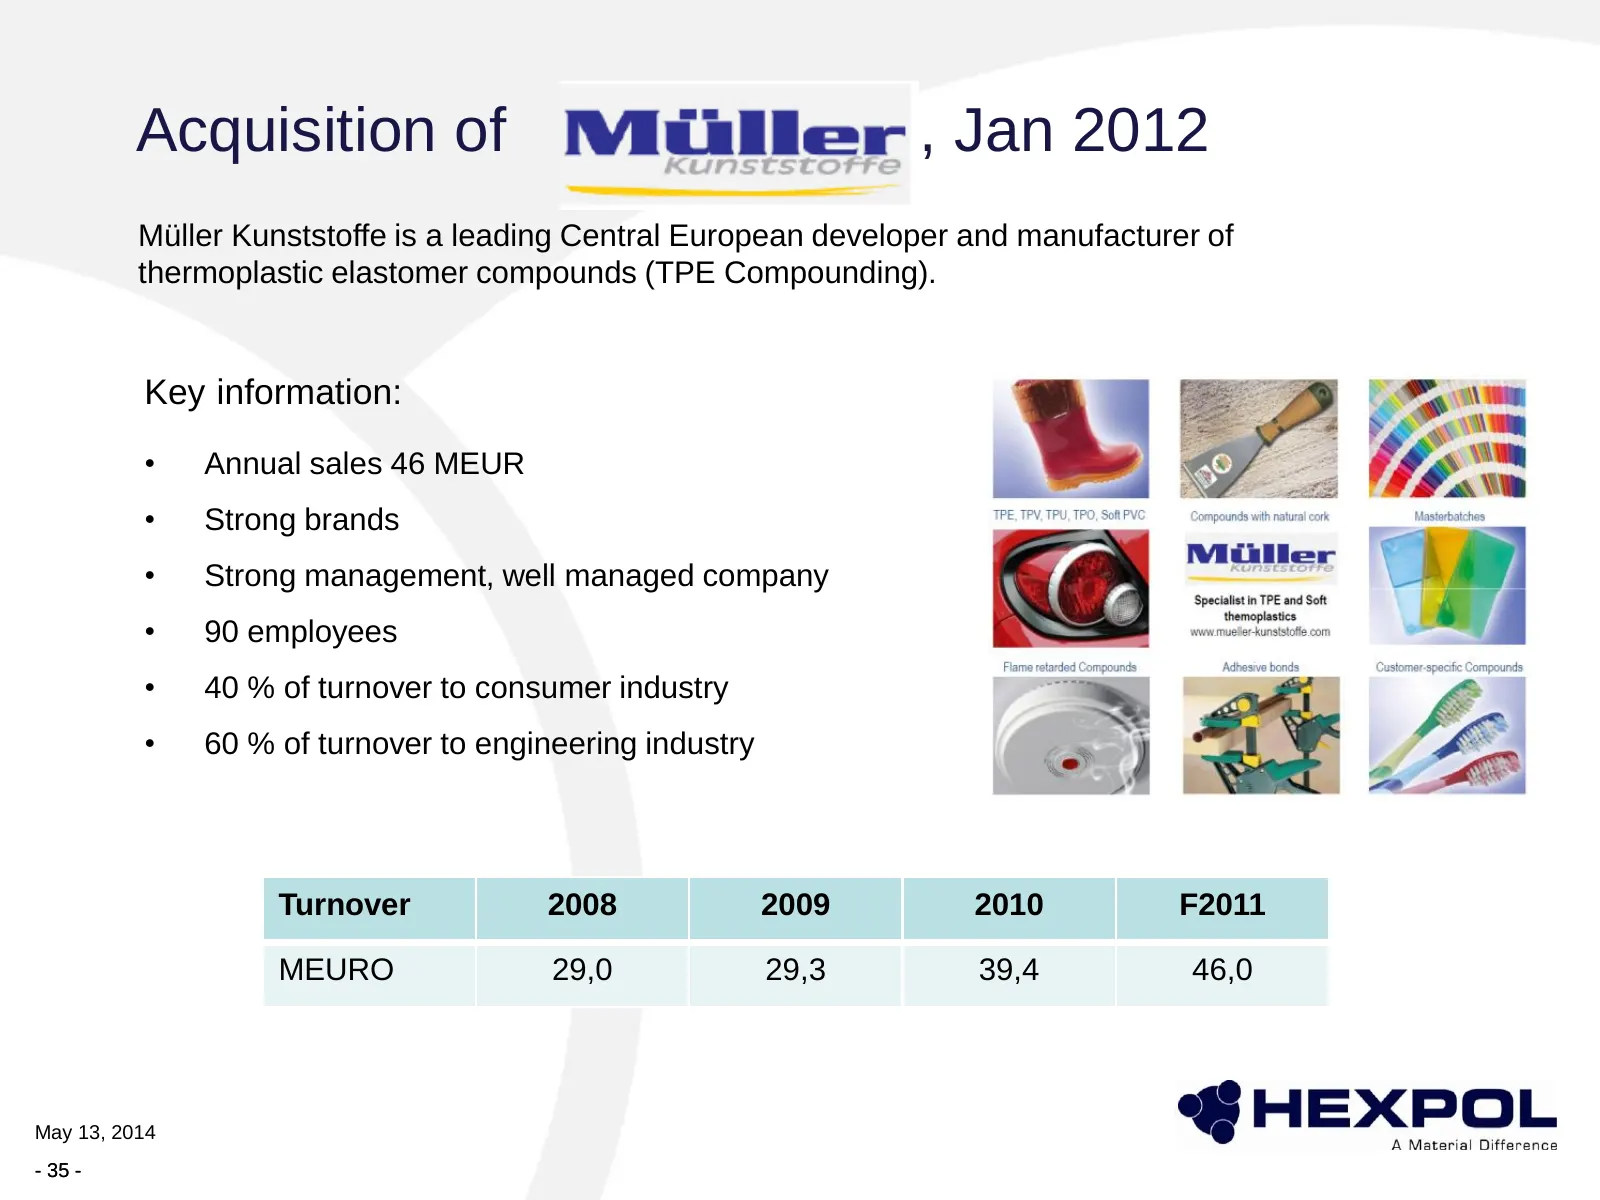
Acquisition of , Jan 2012 Müller Kunststoffe is a leading Central European developer and manufacturer of thermoplastic elastomer compounds (TPE Compounding). Key information: • Annual sales 46 MEUR • Strong brands • Strong management, well managed company • 90 employees • 40 % of turnover to consume
Slide 36: High level of competence
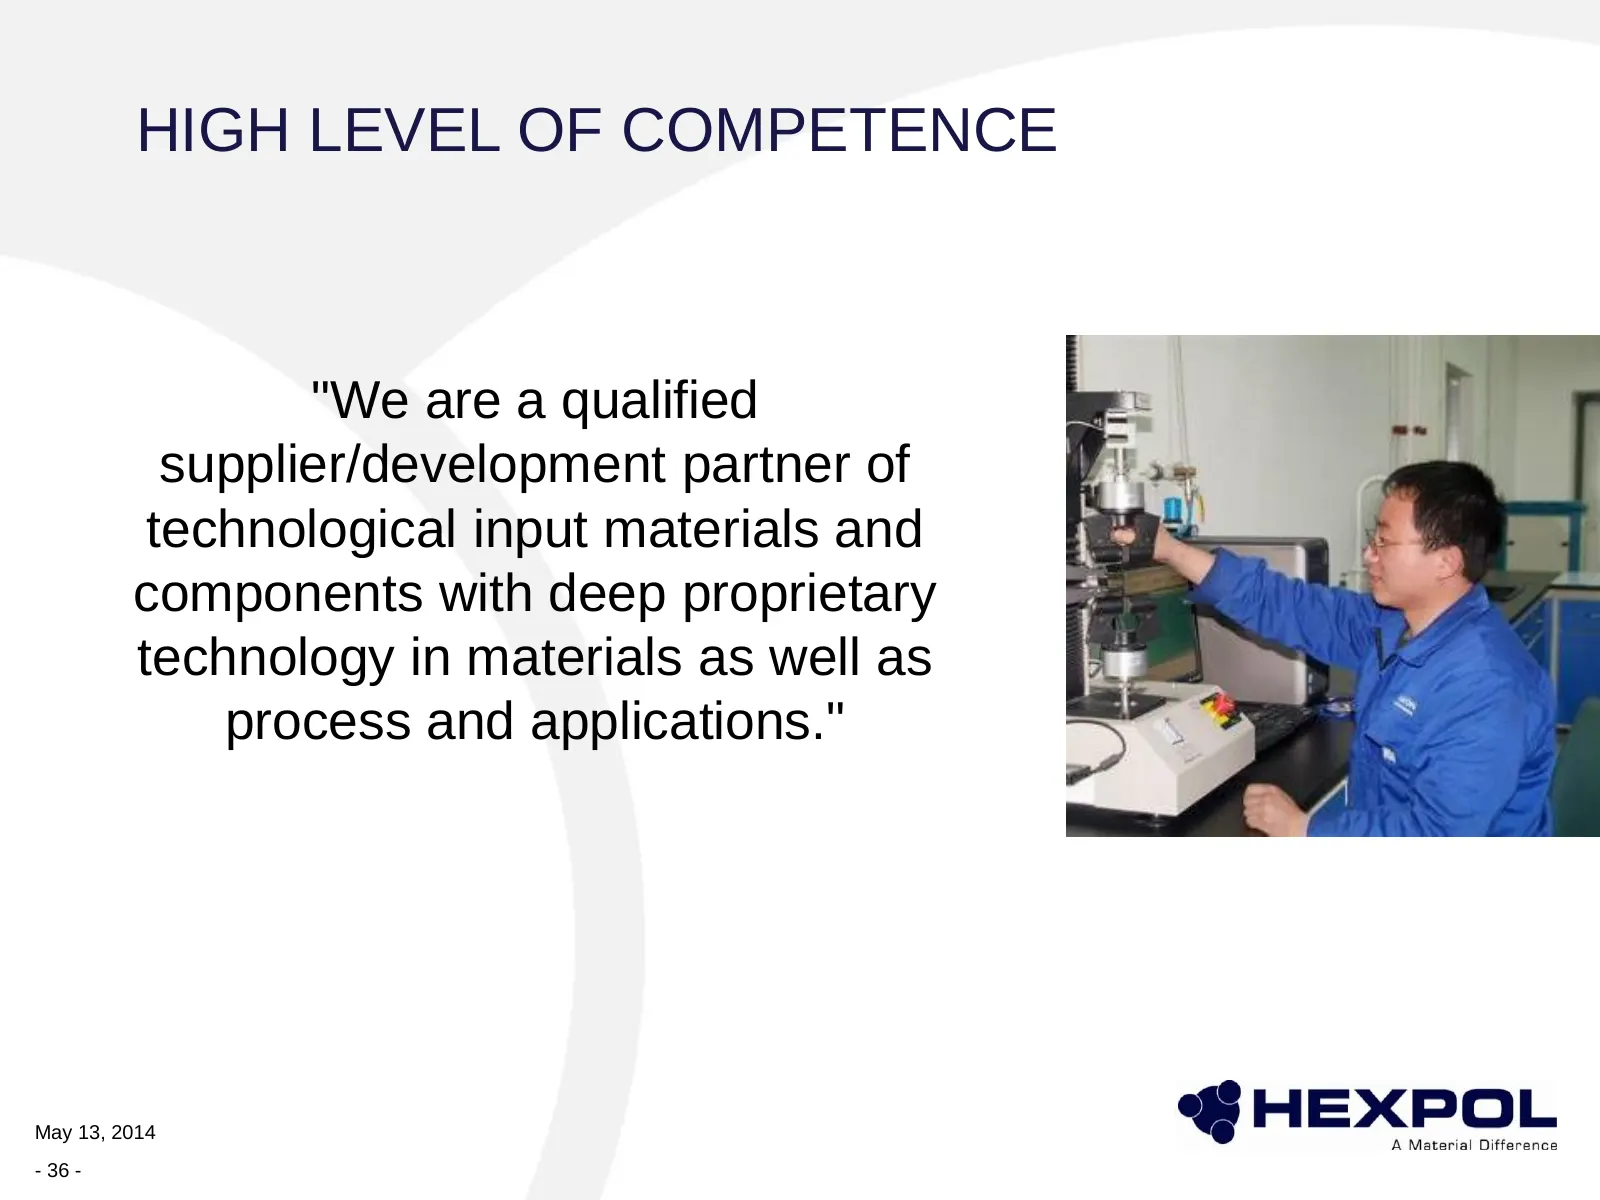
HIGH LEVEL OF COMPETENCE "We are a qualified supplier/development partner of technological input materials and components with deep proprietary technology in materials as well as process and applications." May 13, 2014 - 36 -
Slide 37: Sustainable development – a prerequisite
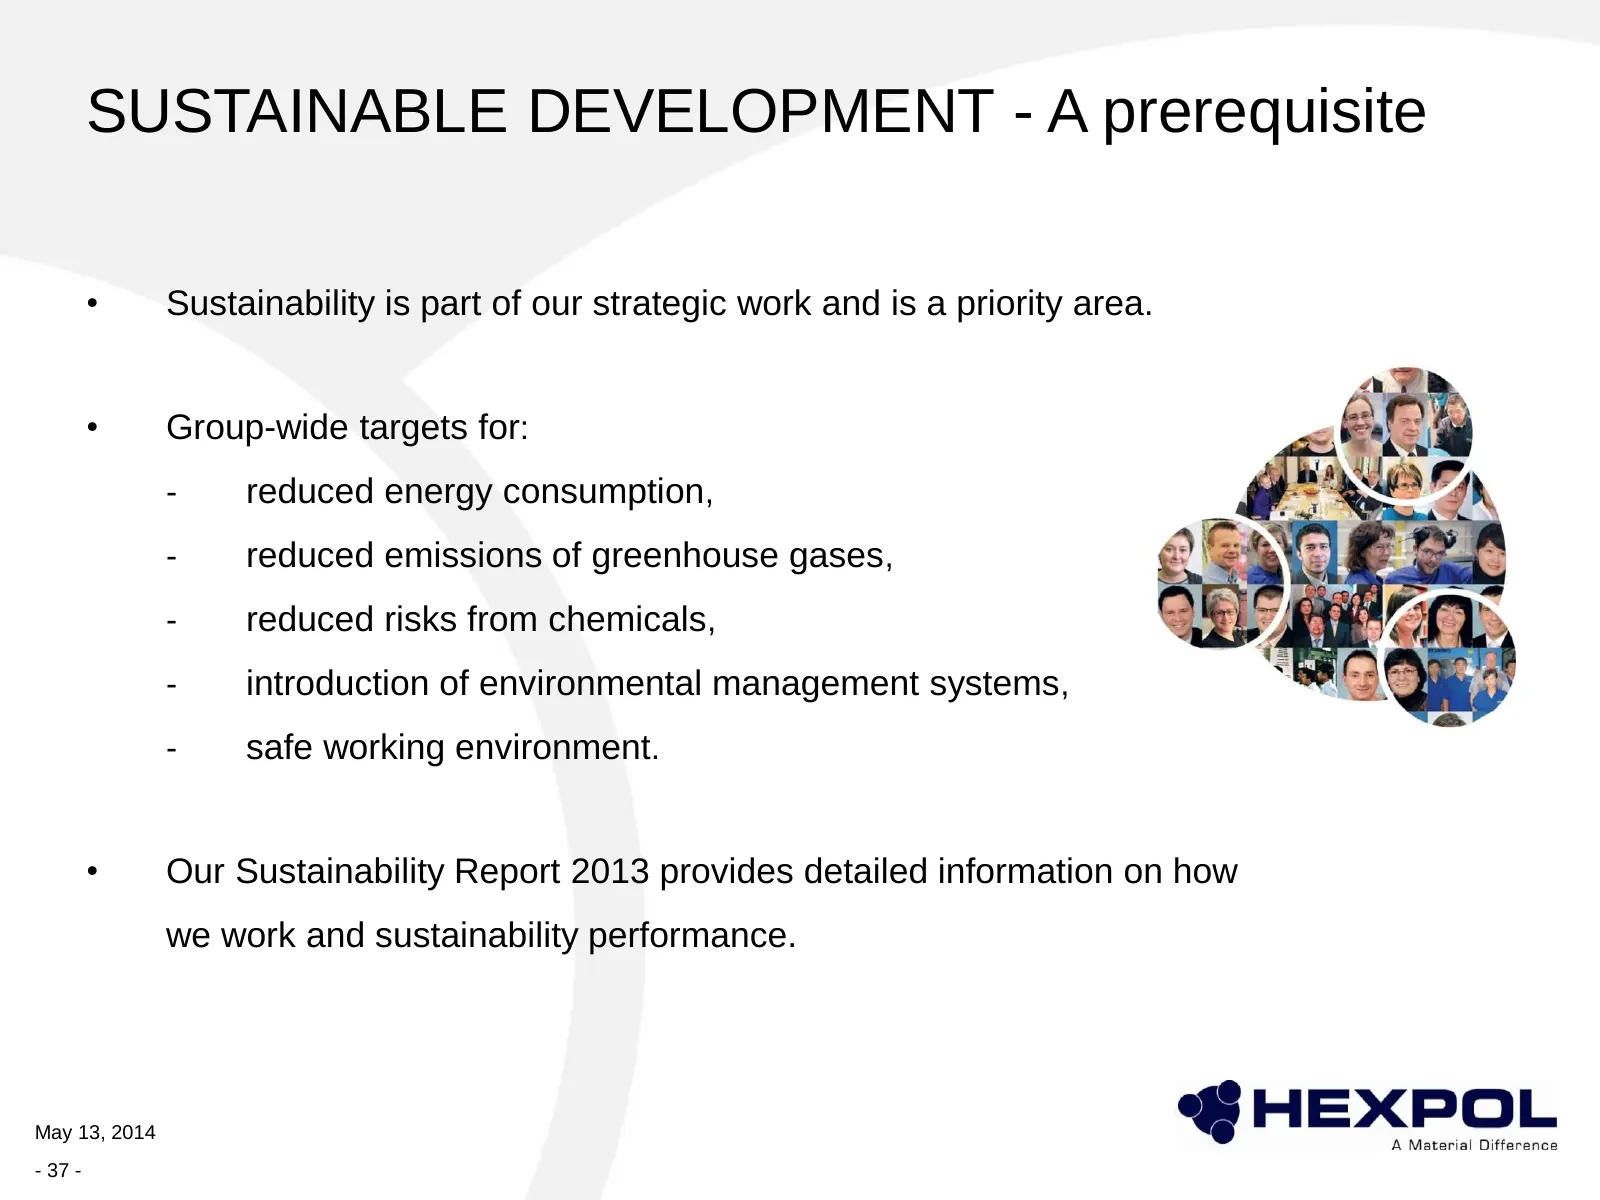
SUSTAINABLE DEVELOPMENT - A prerequisite • Sustainability is part of our strategic work and is a priority area. • Group-wide targets for: - reduced energy consumption, - reduced emissions of greenhouse gases, - reduced risks from chemicals, - introduction of environmental management systems, - safe
Slide 38: Sustainability report
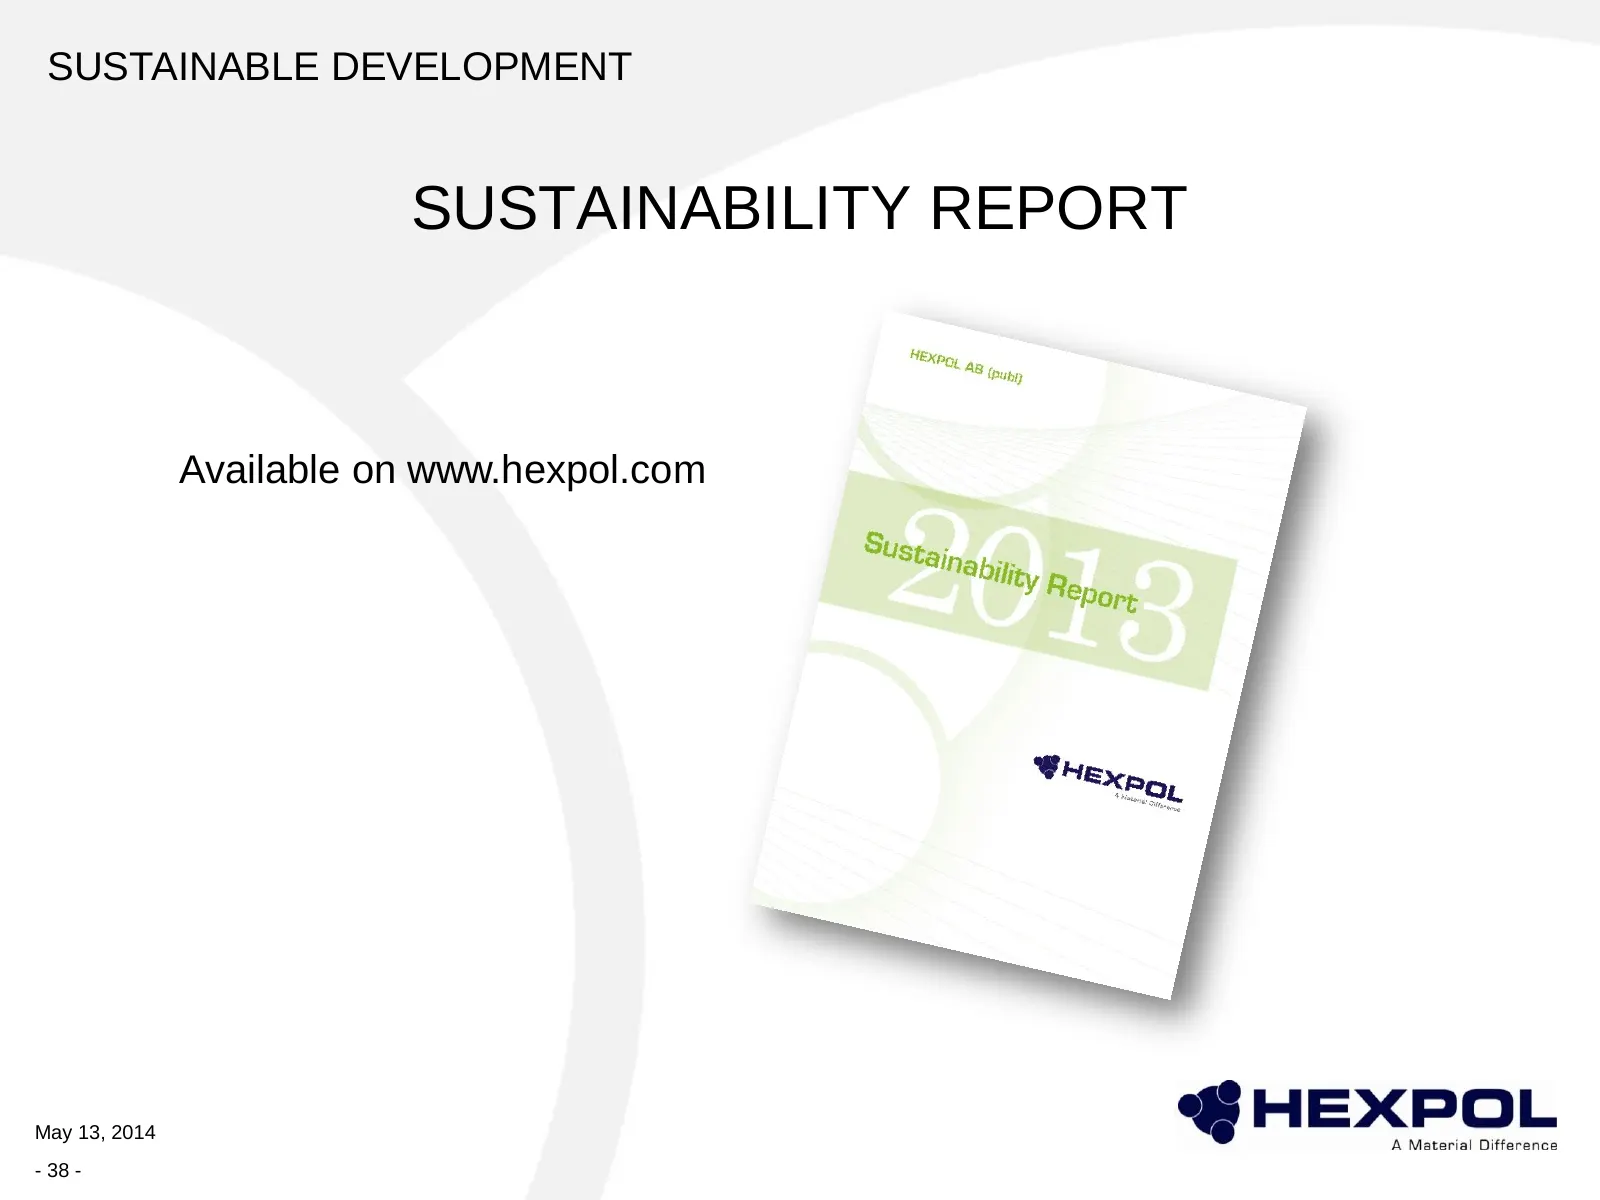
SUSTAINABLE DEVELOPMENT SUSTAINABILITY REPORT Available on www.hexpol.com May 13, 2014 - 38 -
Slide 39: Materializing our values
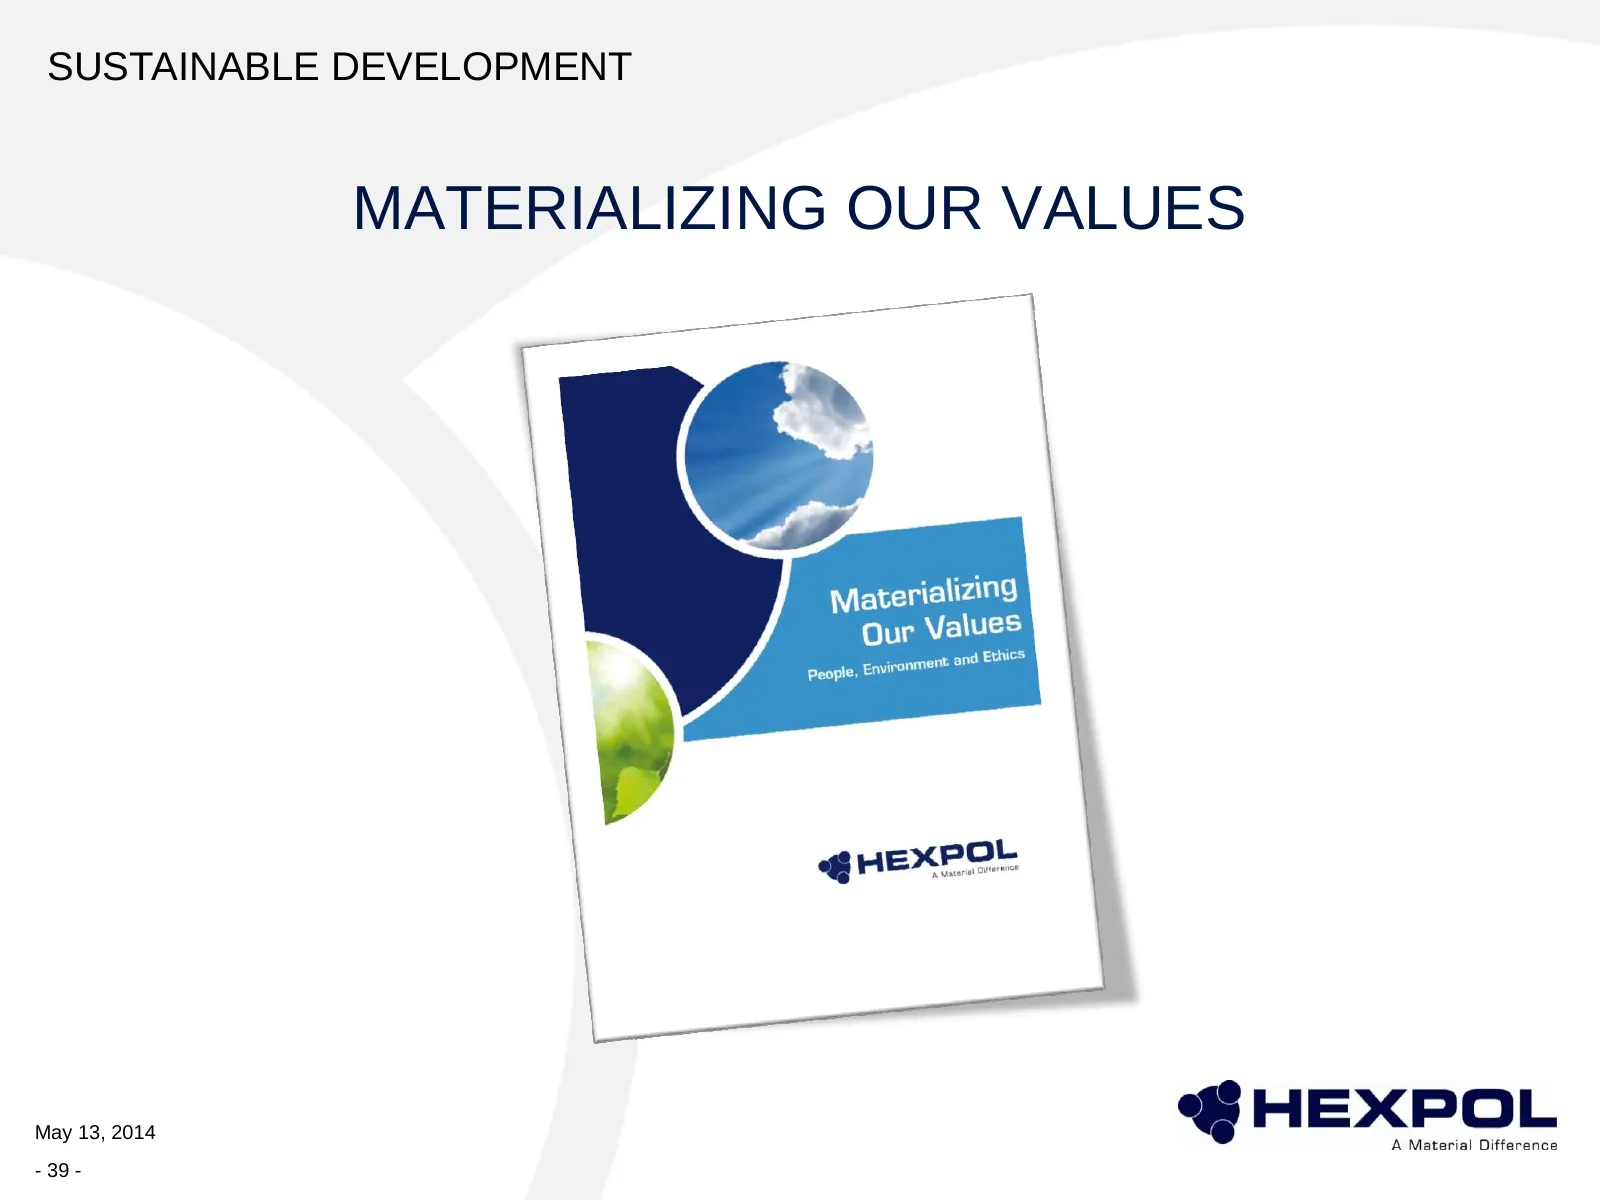
SUSTAINABLE DEVELOPMENT MATERIALIZING OUR VALUES May 13, 2014 - 39 -
Slide 40: Sustainability work goes forward
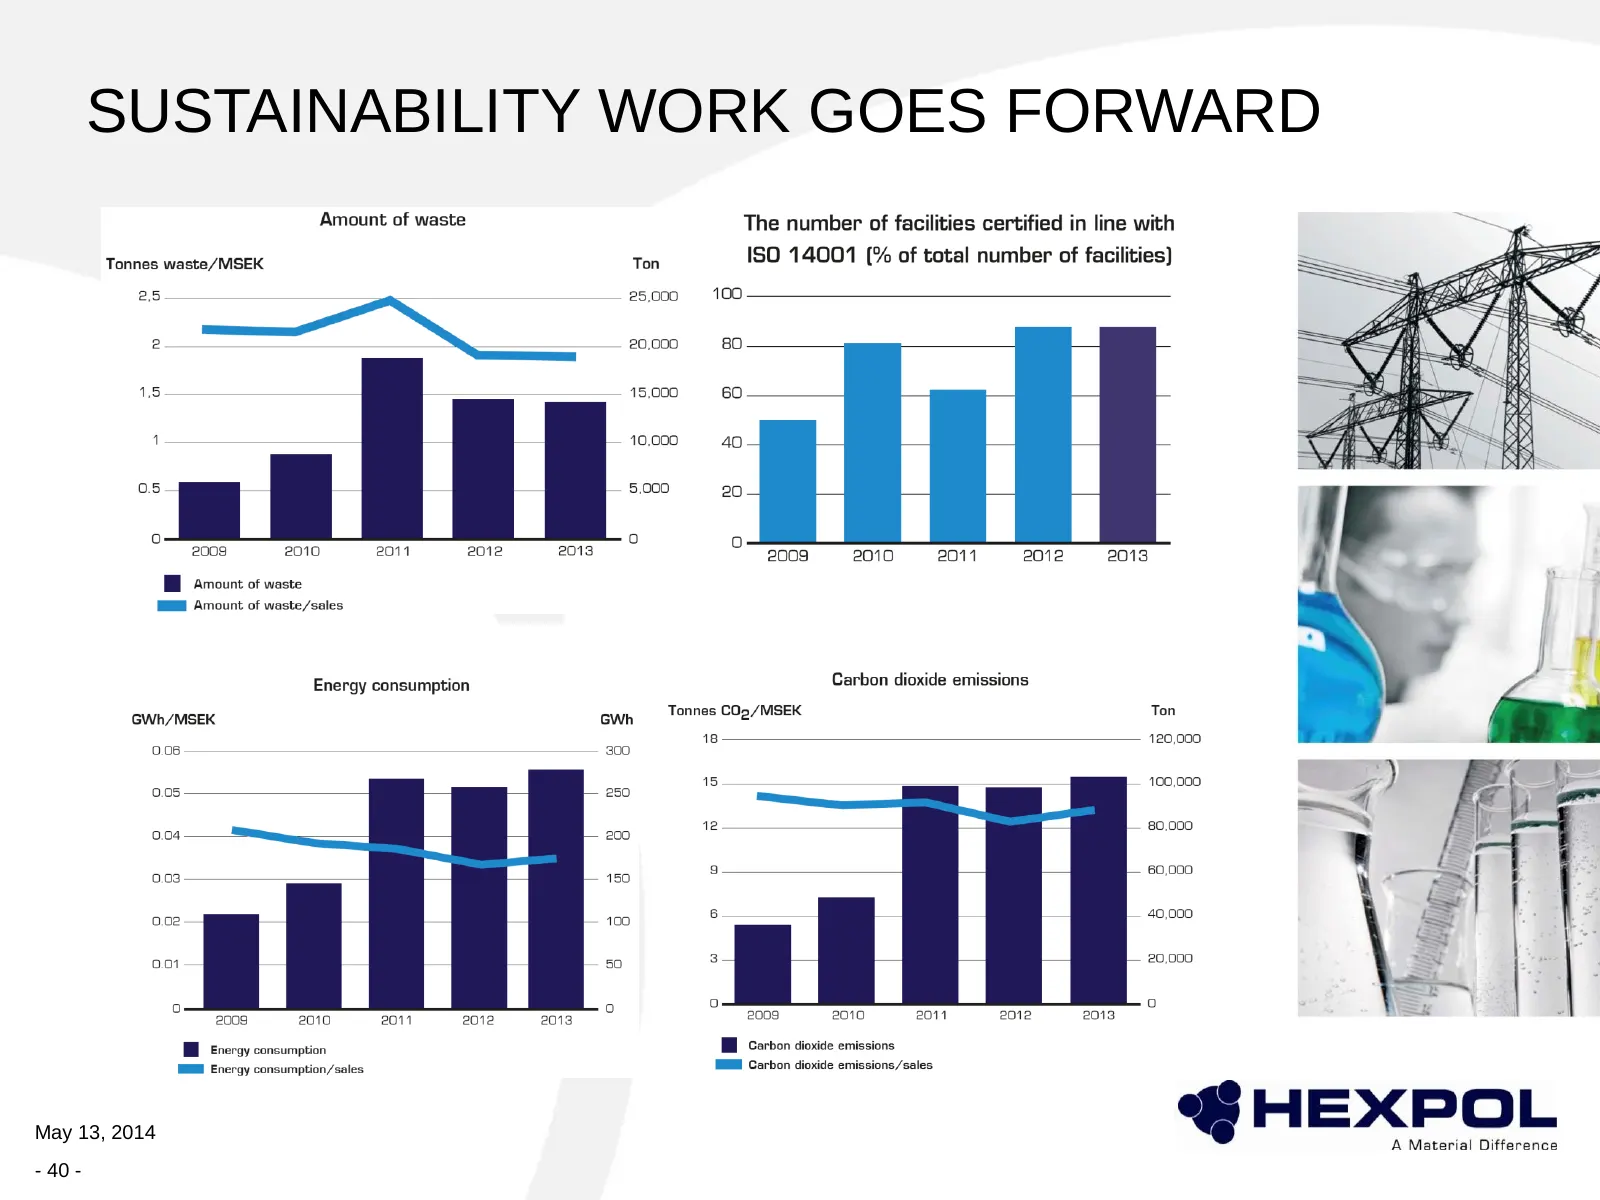
SUSTAINABILITY WORK GOES FORWARD May 13, 2014 - 40 -
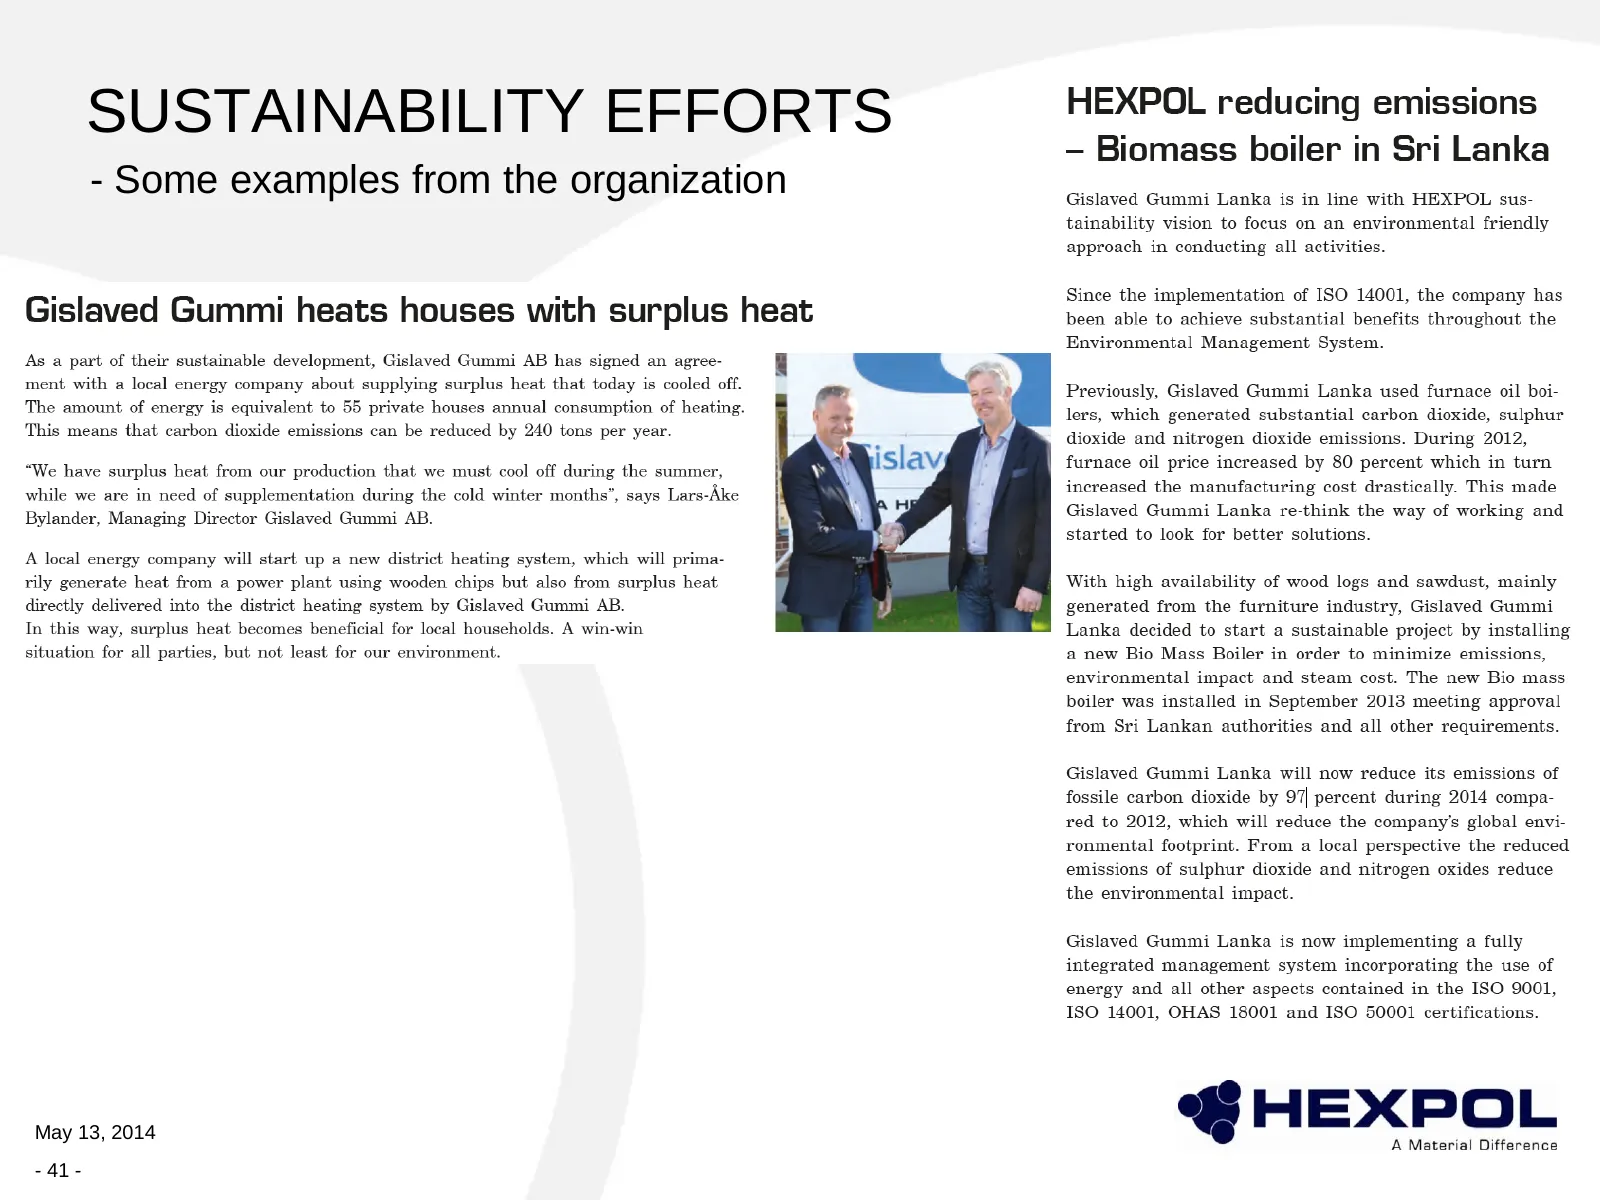
Slide 41: Sustainability efforts
SUSTAINABILITY EFFORTS - Some examples from the organization May 13, 2014 - 41 -
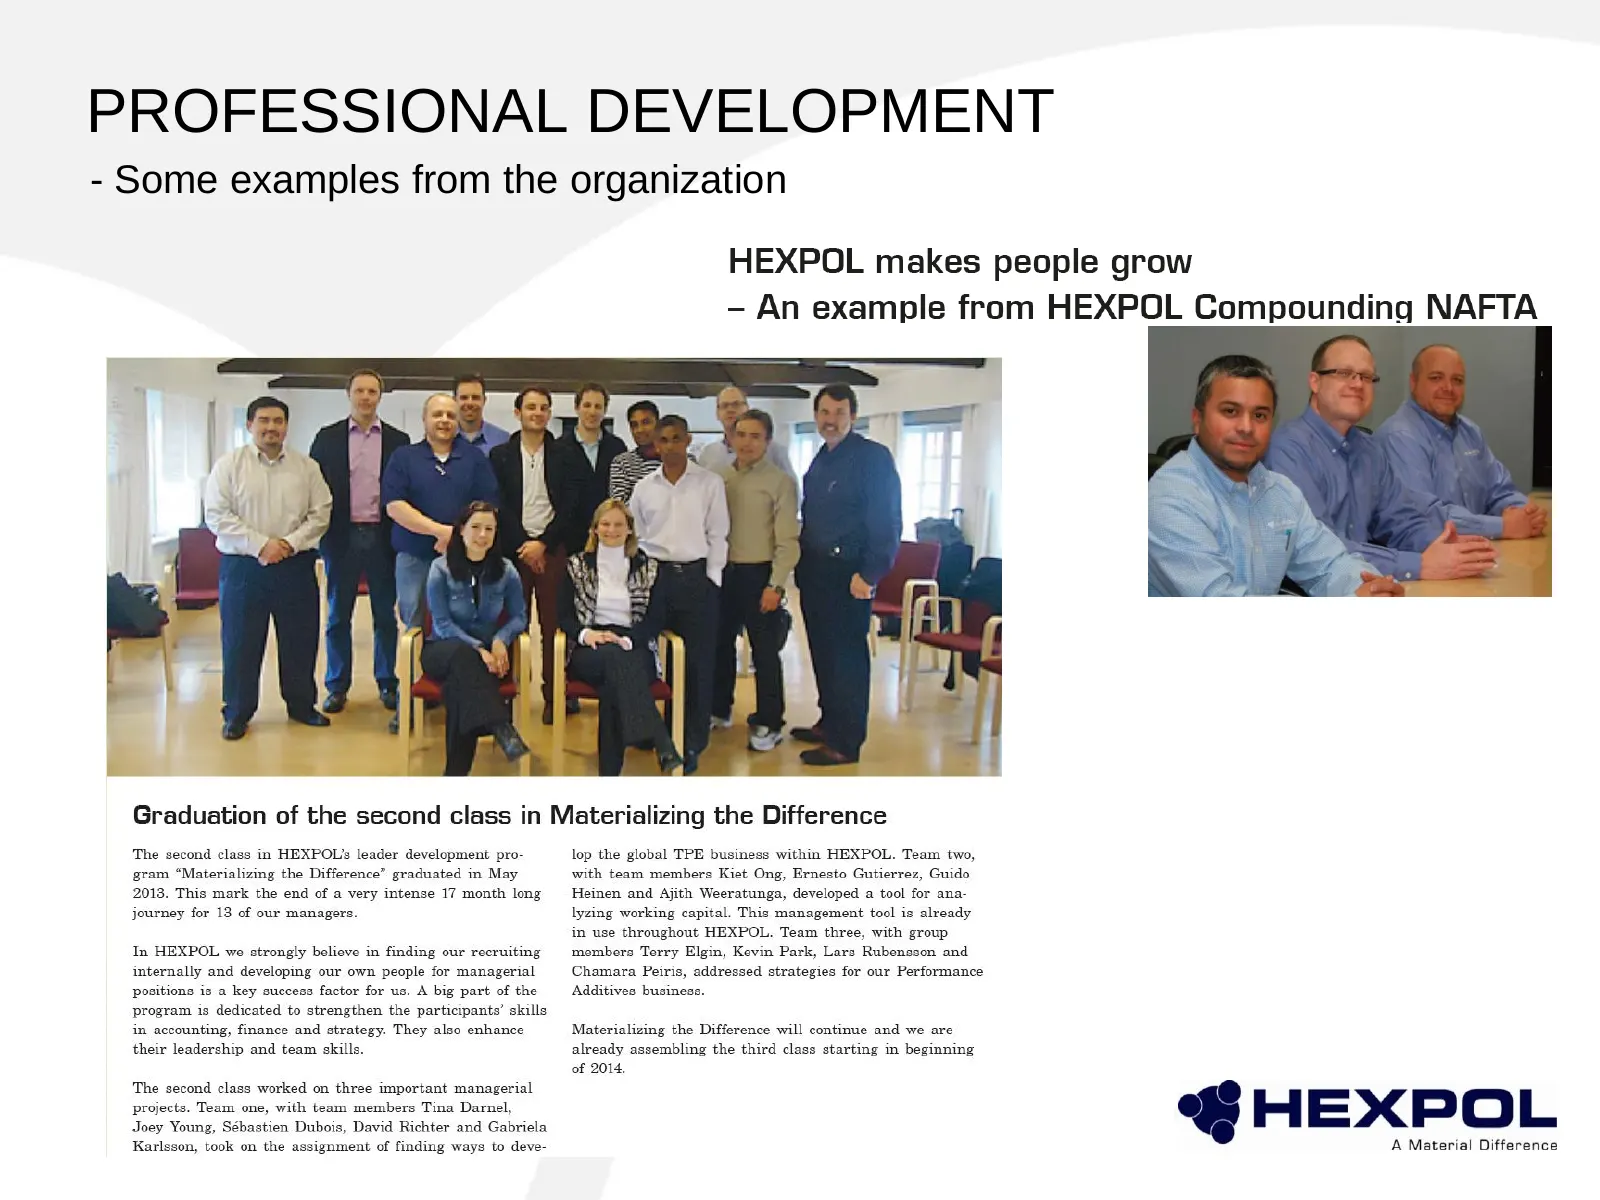
Slide 42: Professional development
PROFESSIONAL DEVELOPMENT - Some examples from the organization 42
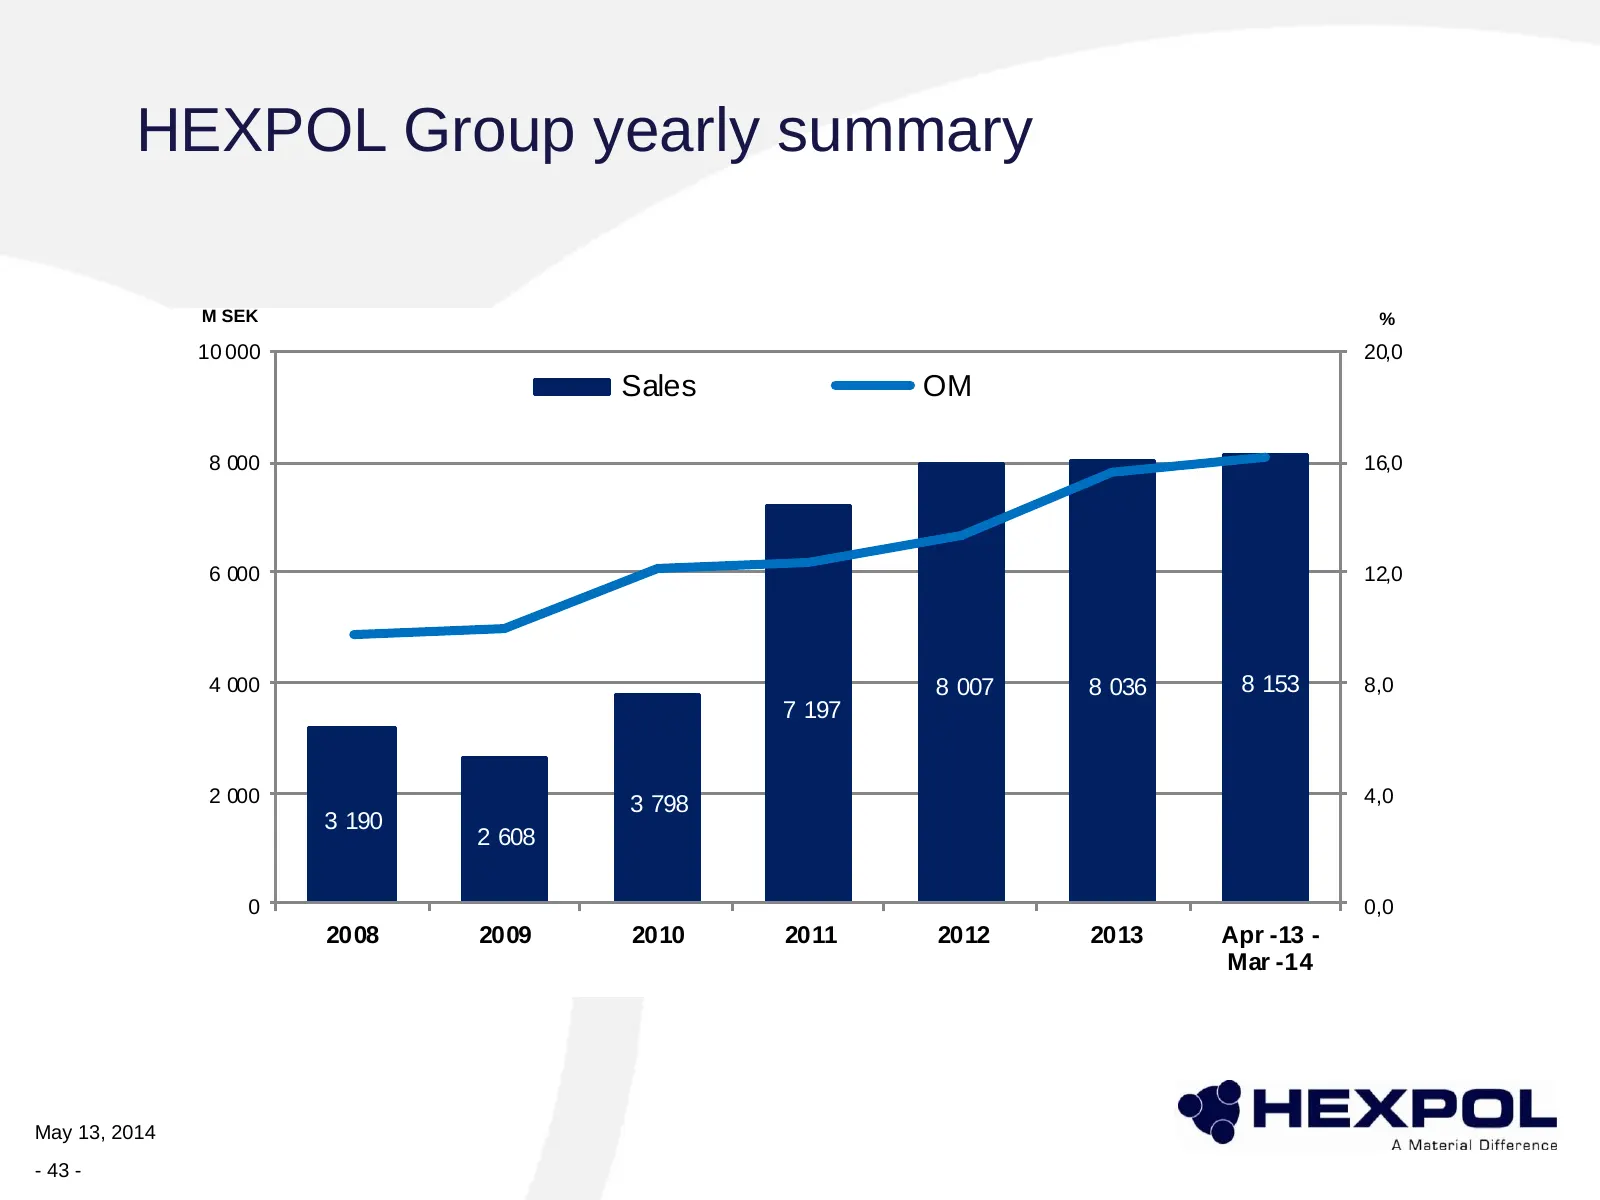
Slide 43: HEXPOL Group yearly summary – sales and margin
HEXPOL Group yearly summary M SEK % 10 000 20,0 Sales OM 8 000 16,0 6 000 12,0 4 000 8 007 8 036 8 153 8,0 7 197 2 000 3 798 4,0 3 190 2 608 0 0,0 2008 2009 2010 2011 2012 2013 Apr -13 - Mar -14 May 13, 2014 - 43 -
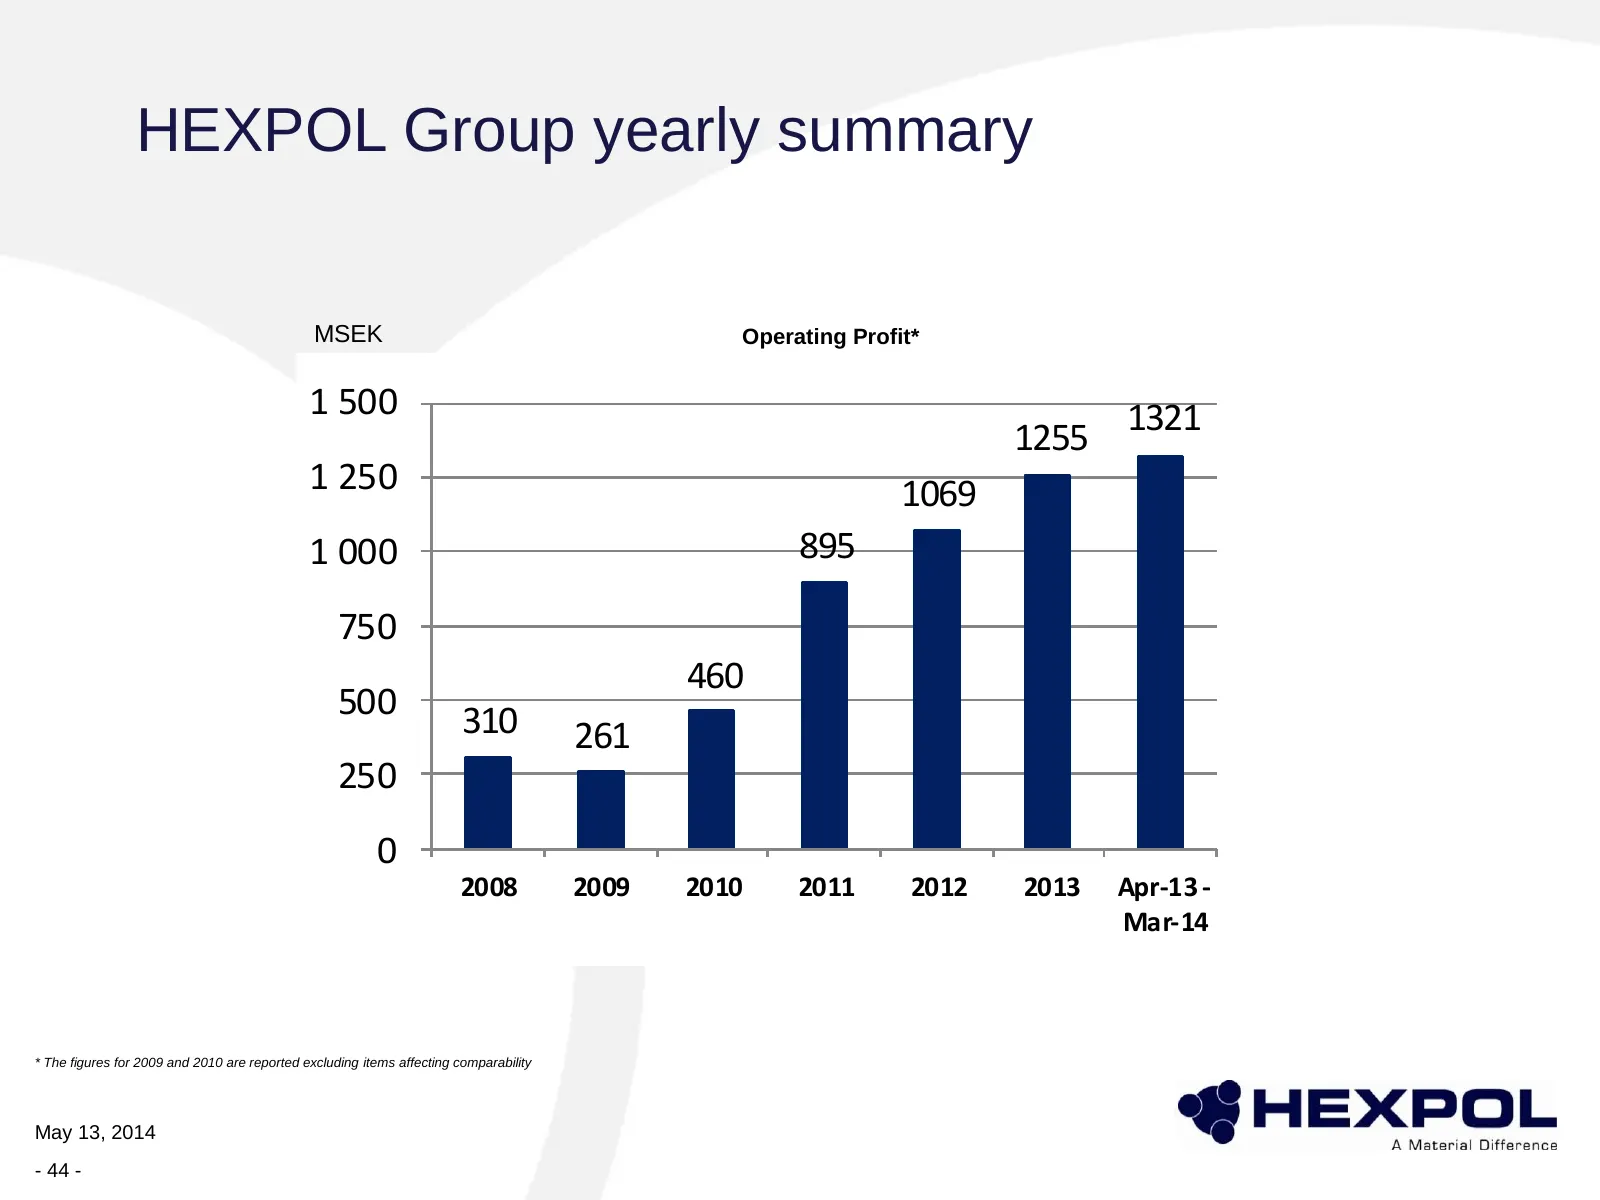
Slide 44: HEXPOL Group yearly summary – operating profit
HEXPOL Group yearly summary MSEK Operating Profit* 1 500 1255 1321 1 250 1069 1 000 895 750 460 500 310 261 250 0 2008 2009 2010 2011 2012 2013 Apr-13 - Mar-14 * The figures for 2009 and 2010 are reported excluding items affecting comparability May 13, 2014 - 44 -
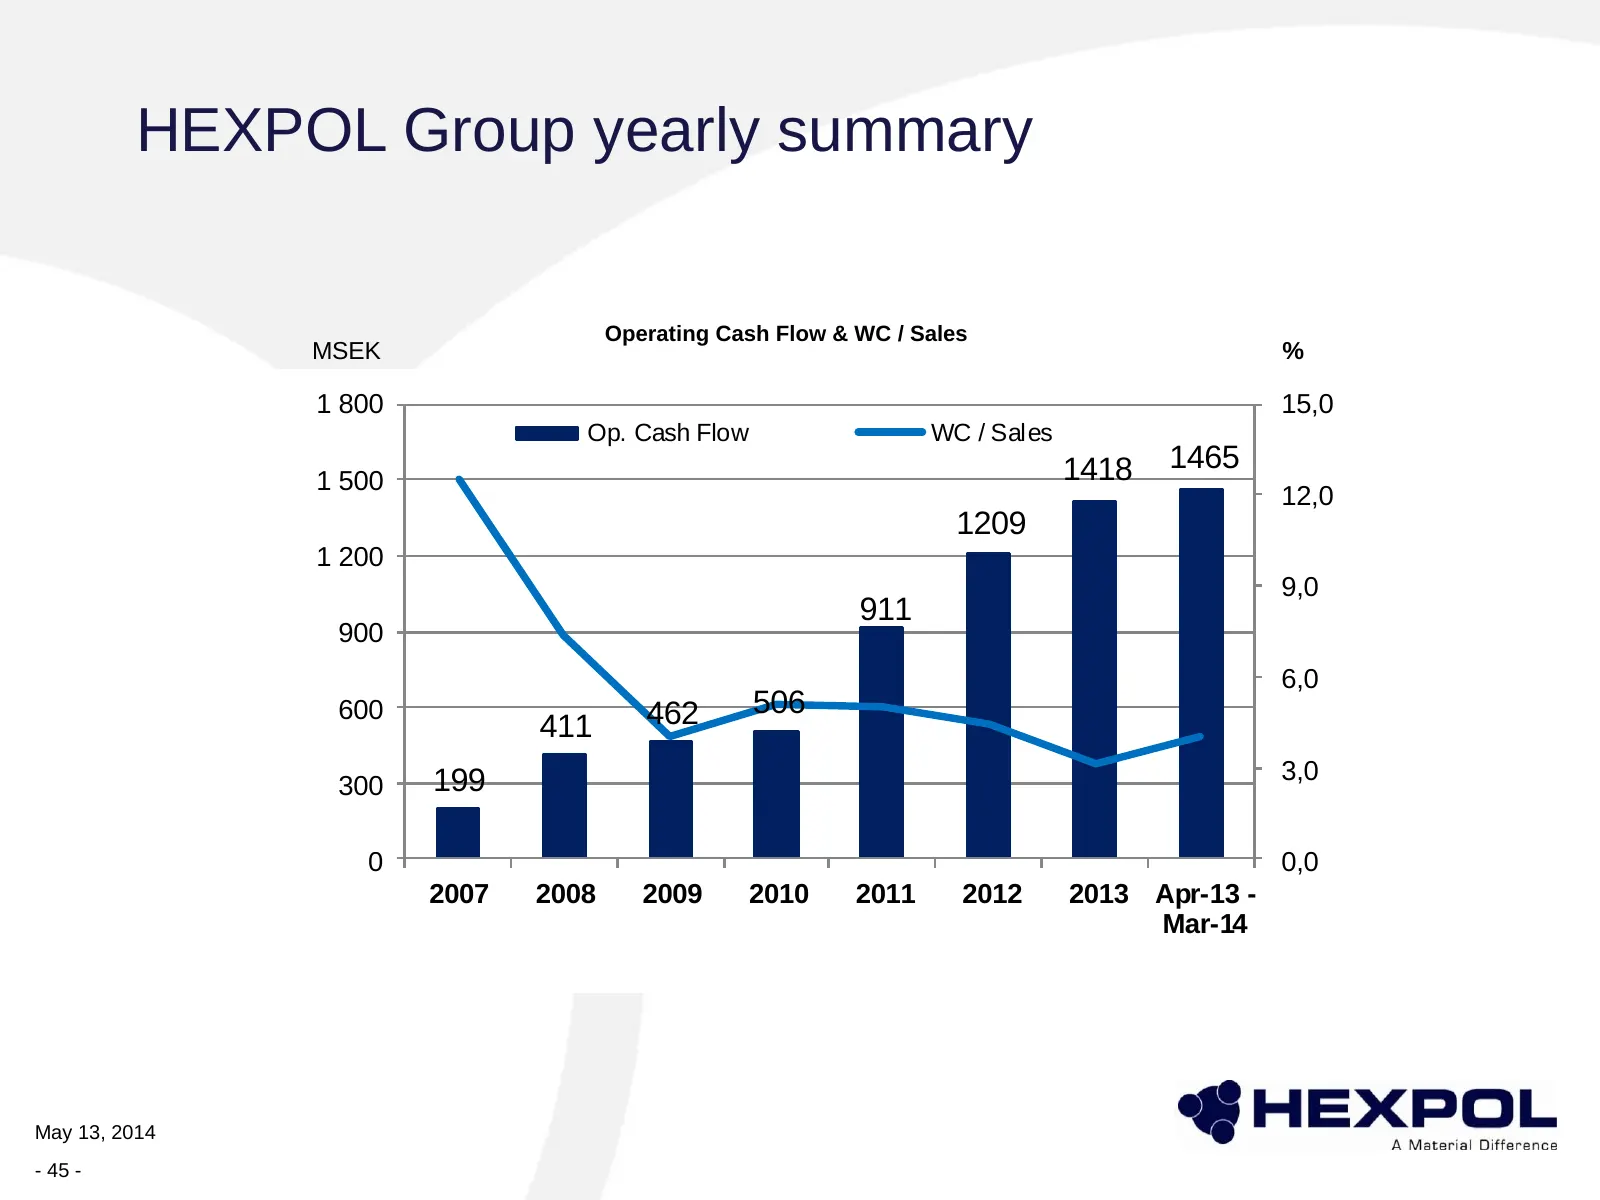
Slide 45: Operating cash flow & WC / sales
HEXPOL Group yearly summary Operating Cash Flow & WC / Sales MSEK % 1 800 15,0 Op. Cash Flow WC / Sales 1418 1465 1 500 12,0 1209 1 200 9,0 911 900 6,0 600 462 506 411 199 3,0 300 0 0,0 2007 2008 2009 2010 2011 2012 2013 Apr-13 - Mar-14 May 13, 2014 - 45 -
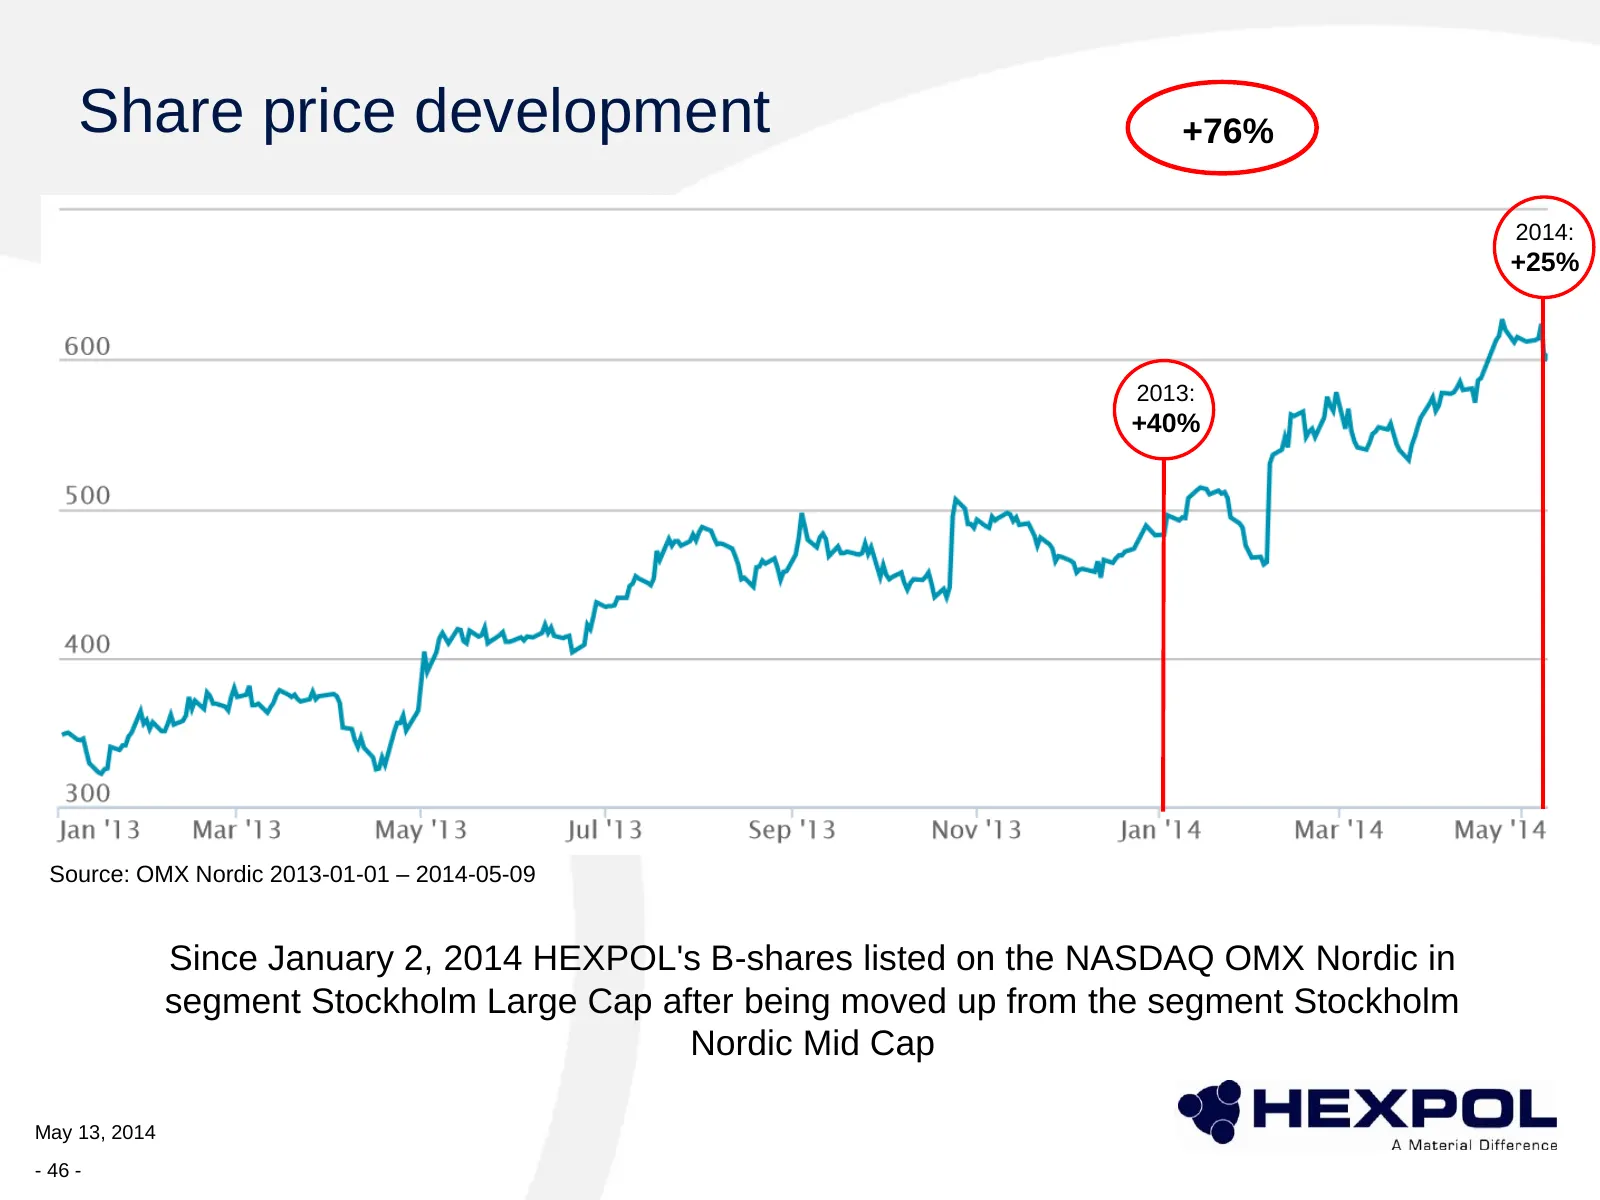
Slide 46: Share price development
Share price development +76% 2014: +25% 2013: +40% Source: OMX Nordic 2013-01-01 – 2014-05-09 Since January 2, 2014 HEXPOL's B-shares listed on the NASDAQ OMX Nordic in segment Stockholm Large Cap after being moved up from the segment Stockholm Nordic Mid Cap May 13, 2014 - 46 -
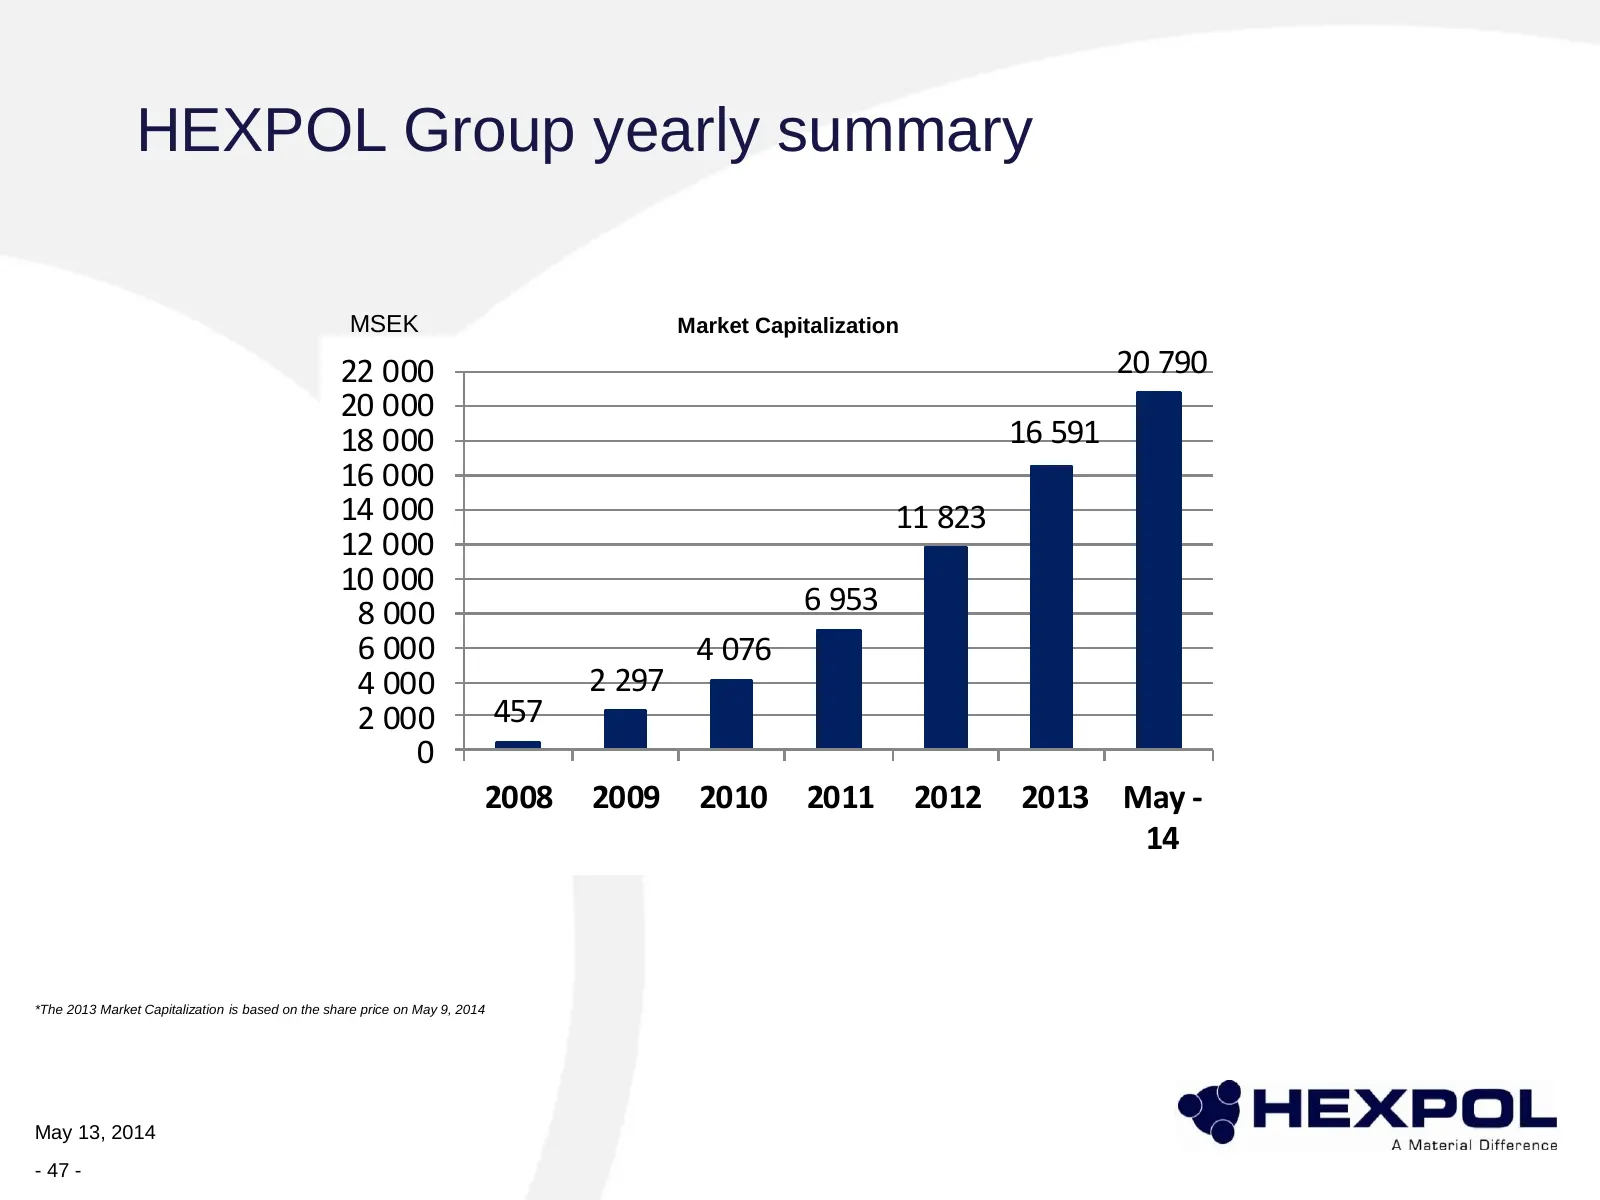
Slide 47: Market capitalization
HEXPOL Group yearly summary MSEK Market Capitalization 22 000 20 790 20 000 18 000 16 591 16 000 14 000 11 823 12 000 10 000 8 000 6 953 6 000 4 076 4 000 2 297 2 000 457 0 2008 2009 2010 2011 2012 2013 May - 14 *The 2013 Market Capitalization is based on the share price on May 9, 2014 May 13, 2014
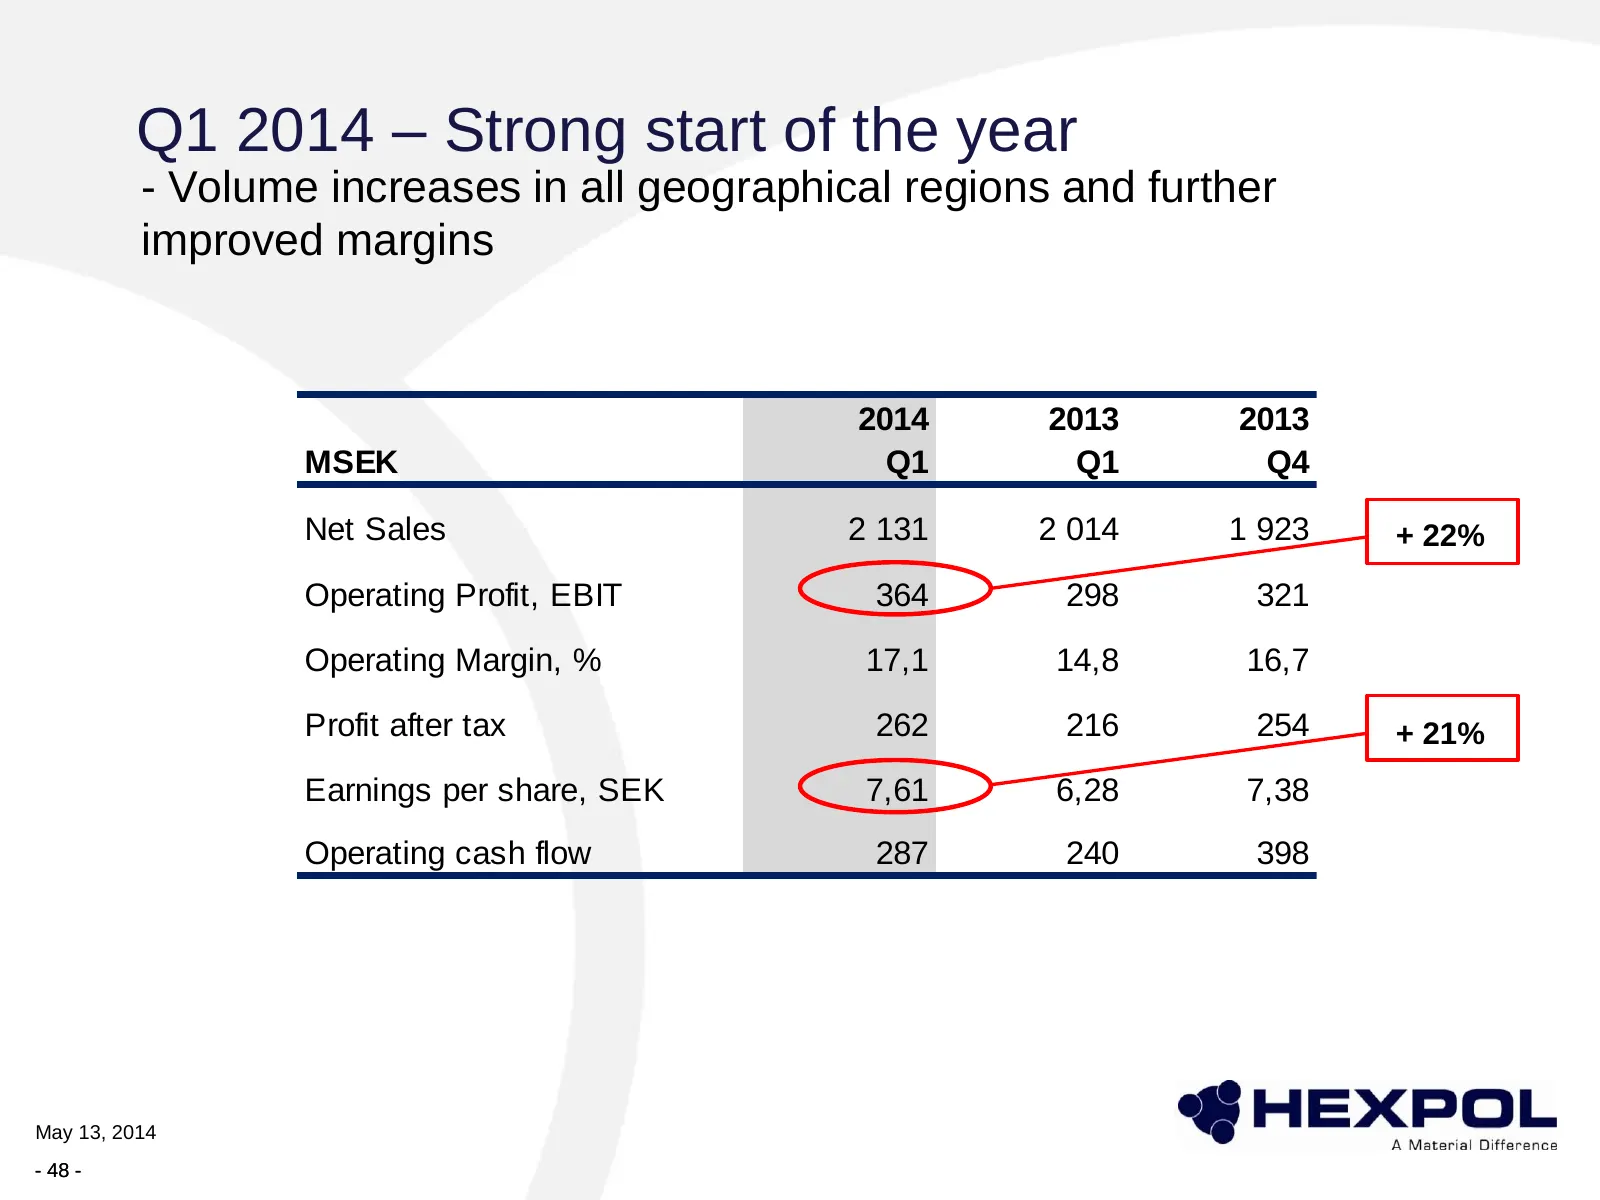
Slide 48: Q1 2014 – Strong start of the year
Q1 2014 – Strong start of the year - Volume increases in all geographical regions and further improved margins 2014 2013 2013 MSEK Q1 Q1 Q4 Net Sales 2 131 2 014 1 923 + 22% Operating Profit, EBIT 364 298 321 Operating Margin, % 17,1 14,8 16,7 Profit after tax 262 216 254 + 21% Earnings per share, S
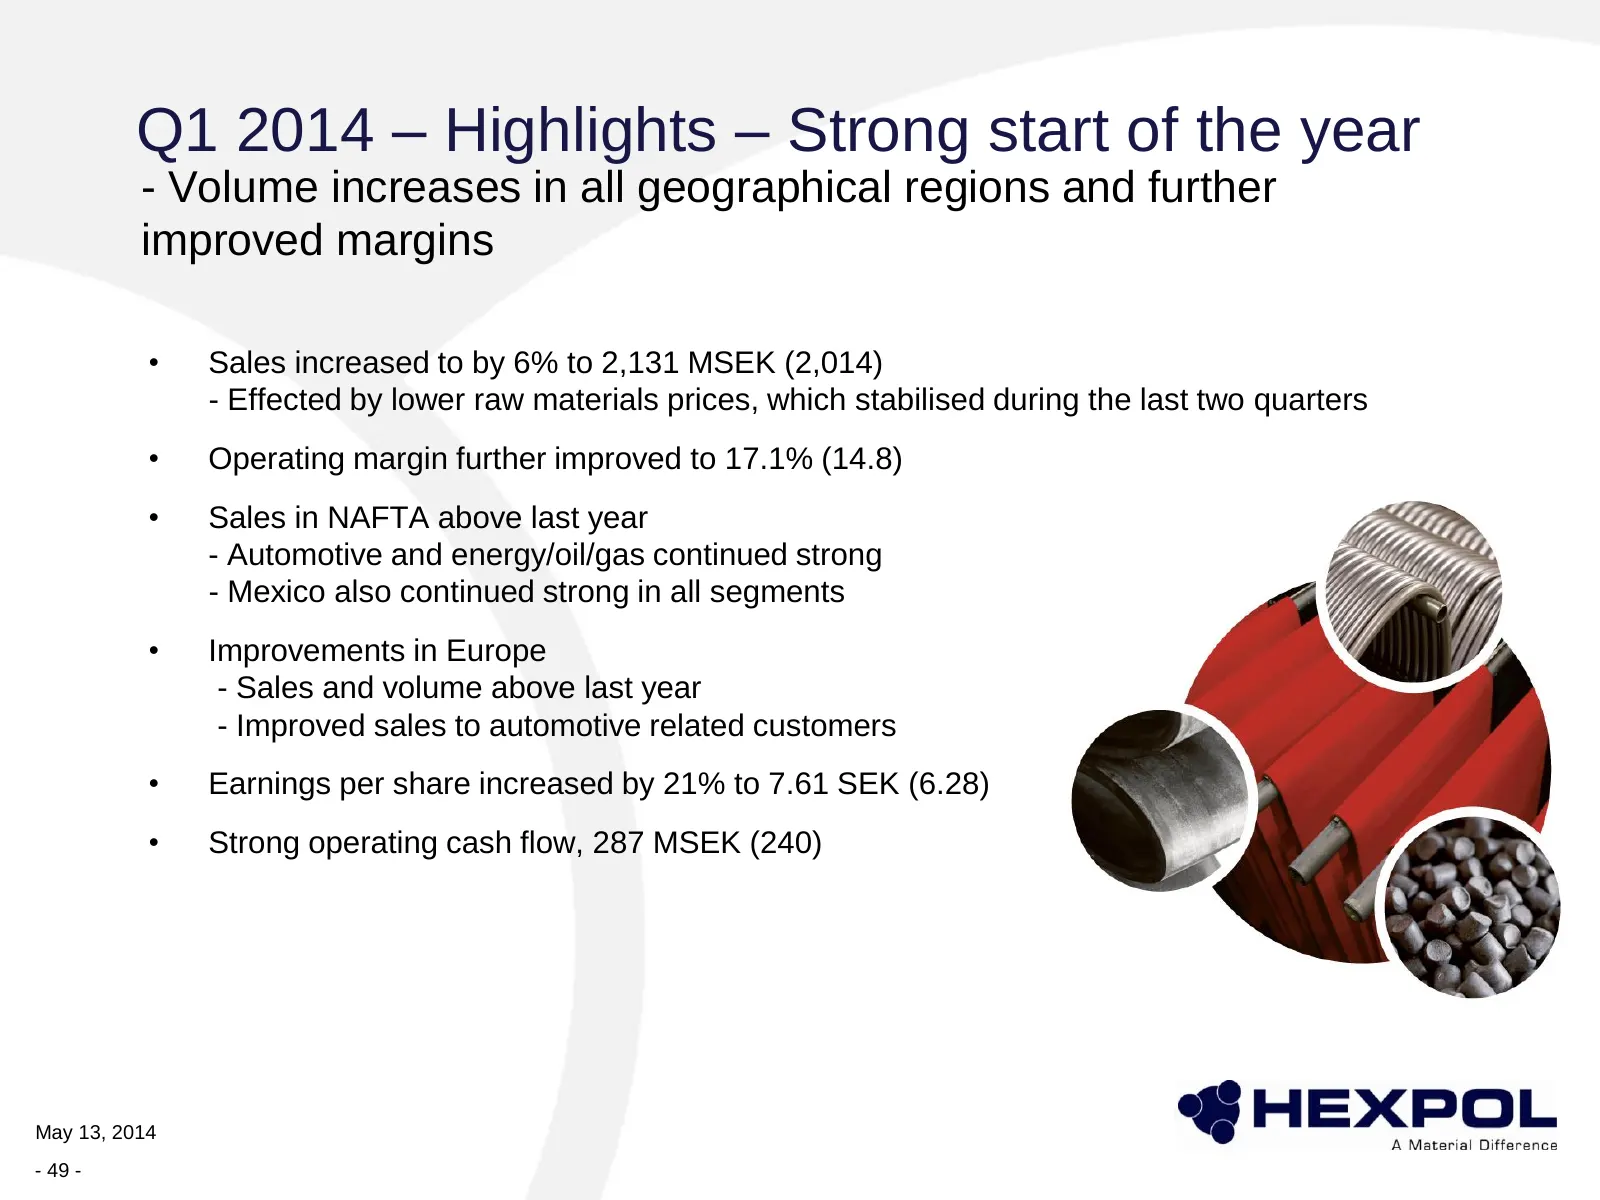
Slide 49: Q1 2014 – Highlights
Q1 2014 – Highlights – Strong start of the year - Volume increases in all geographical regions and further improved margins • Sales increased to by 6% to 2,131 MSEK (2,014) - Effected by lower raw materials prices, which stabilised during the last two quarters • Operating margin further improved to
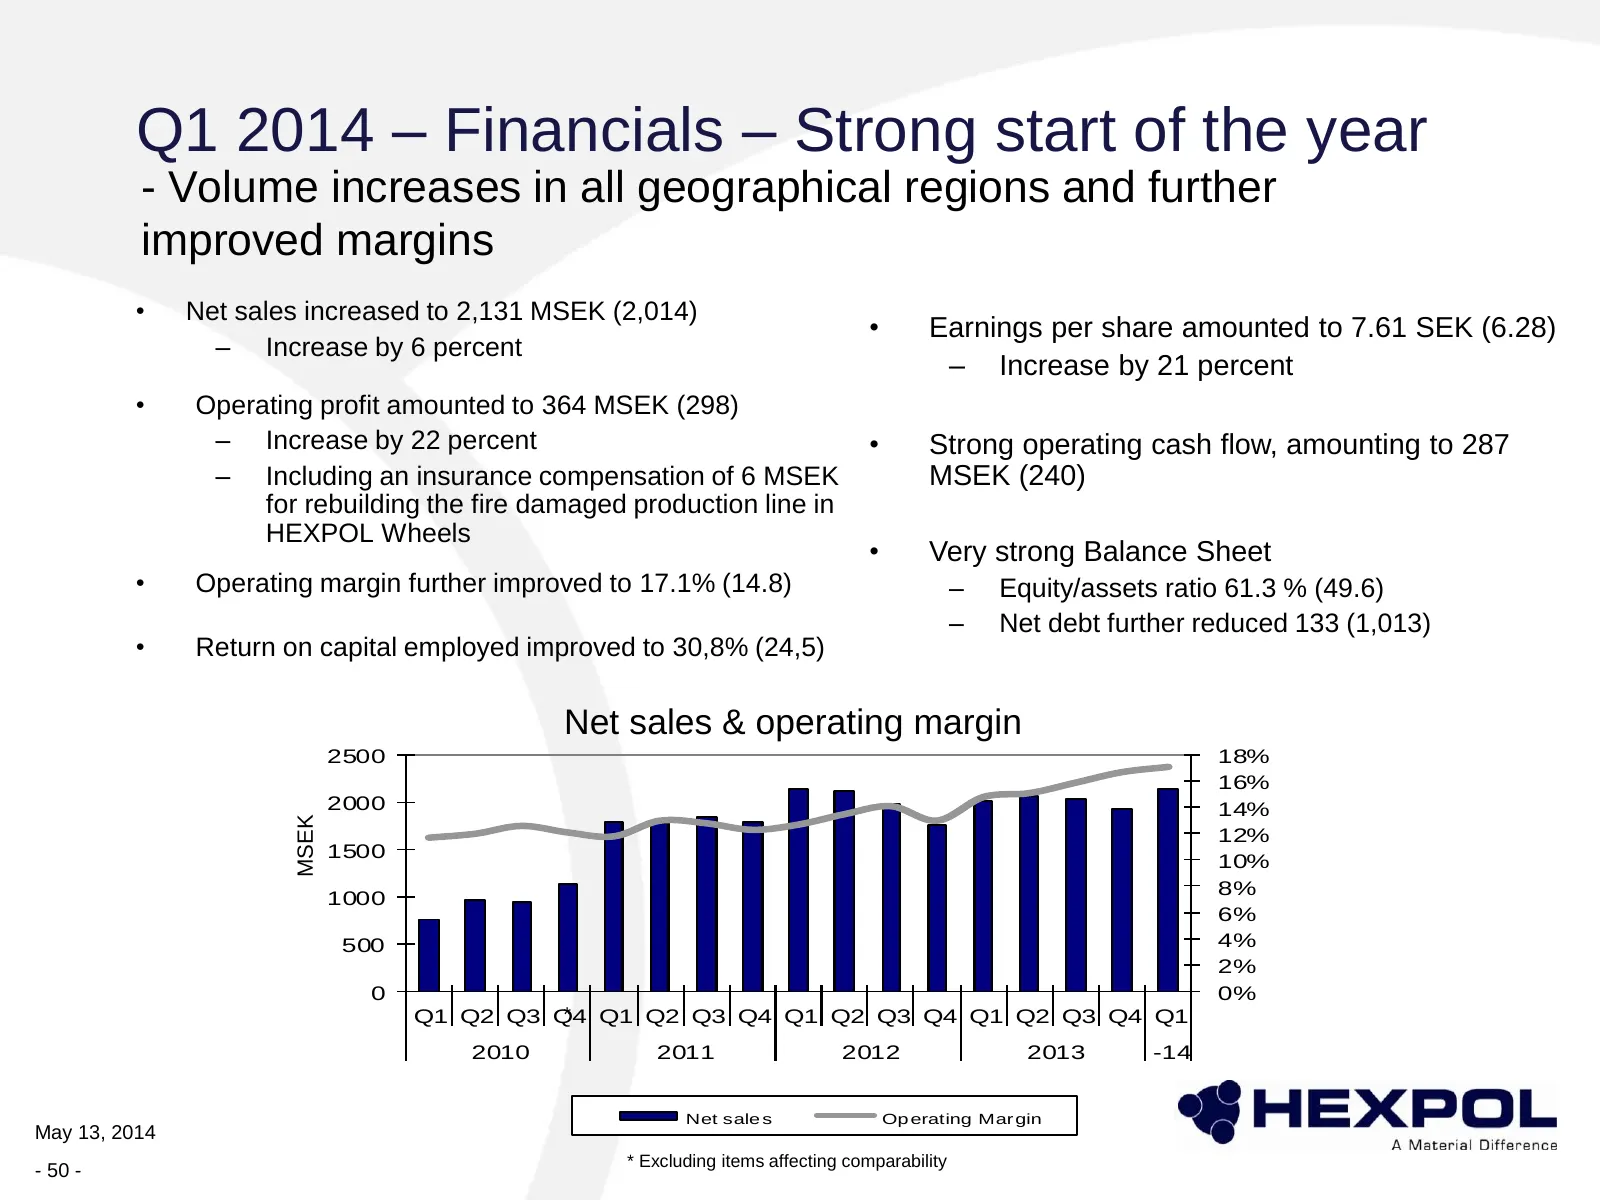
Slide 50: Q1 2014 – Financials
Q1 2014 – Financials – Strong start of the year - Volume increases in all geographical regions and further improved margins • Net sales increased to 2,131 MSEK (2,014) • Earnings per share amounted to 7.61 SEK (6.28) – Increase by 6 percent – Increase by 21 percent • Operating profit amounted to 364
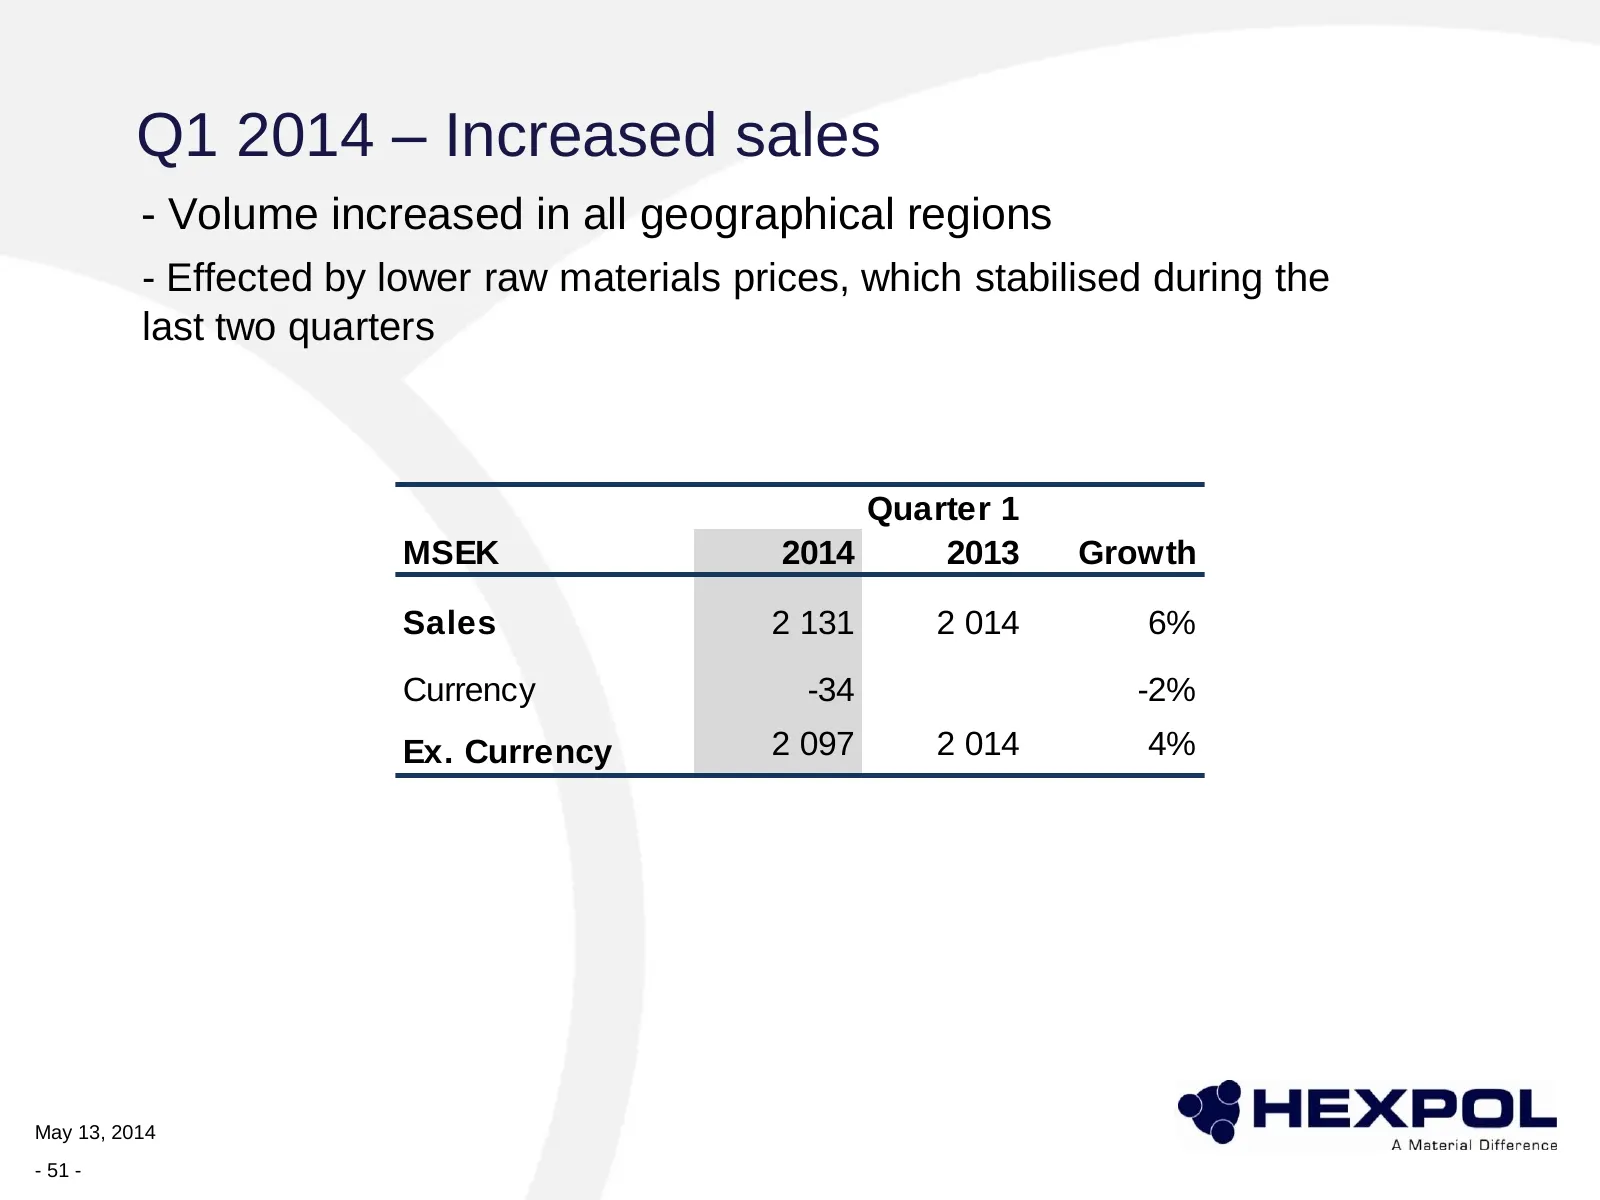
Slide 51: Q1 2014 – Increased sales
Q1 2014 – Increased sales - Volume increased in all geographical regions - Effected by lower raw materials prices, which stabilised during the last two quarters Quarter 1 MSEK 2014 2013 Growth Sales 2 131 2 014 6% Currency -34 -2% Ex. Currency 2 097 2 014 4% May 13, 2014 - 51 -
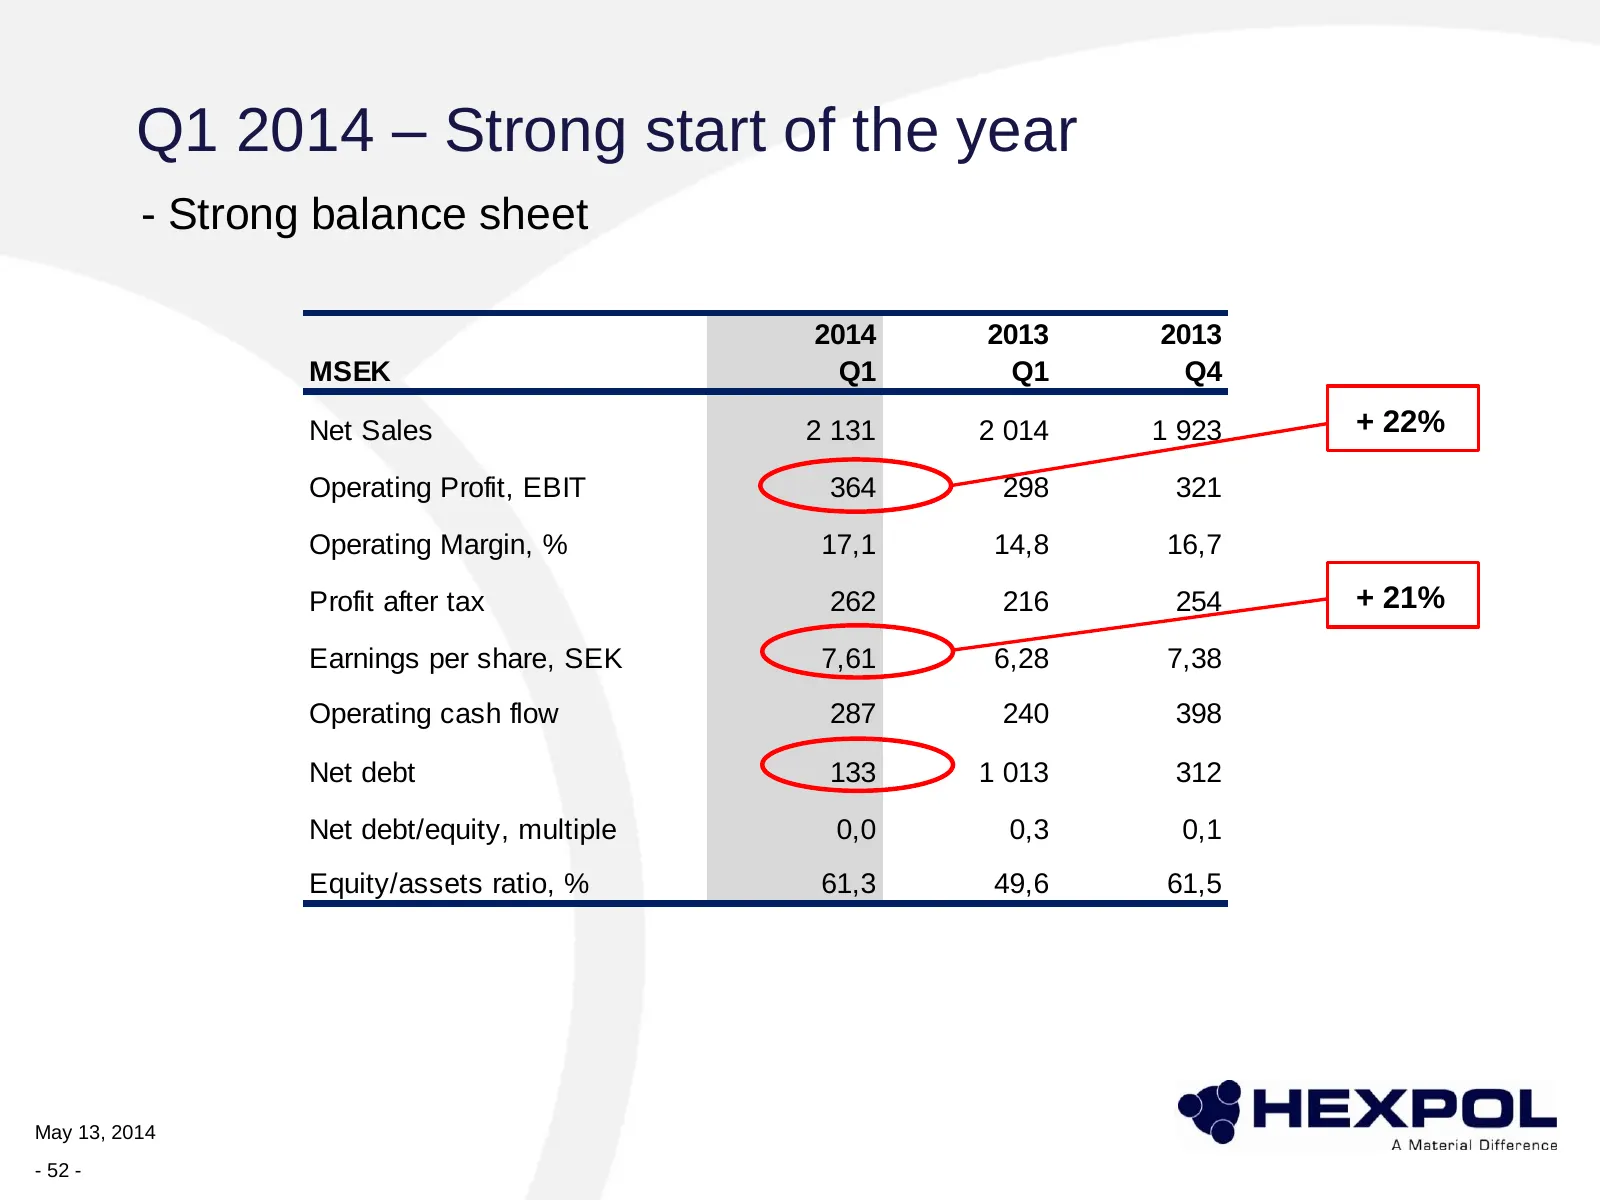
Slide 52: Q1 2014 – Strong balance sheet
Q1 2014 – Strong start of the year - Strong balance sheet 2014 2013 2013 MSEK Q1 Q1 Q4 Net Sales 2 131 2 014 1 923 + 22% Operating Profit, EBIT 364 298 321 Operating Margin, % 17,1 14,8 16,7 Profit after tax 262 216 254 + 21% Earnings per share, SEK 7,61 6,28 7,38 Operating cash flow 287 240 398 Net
Slide 53: Q1 2014 – Business areas
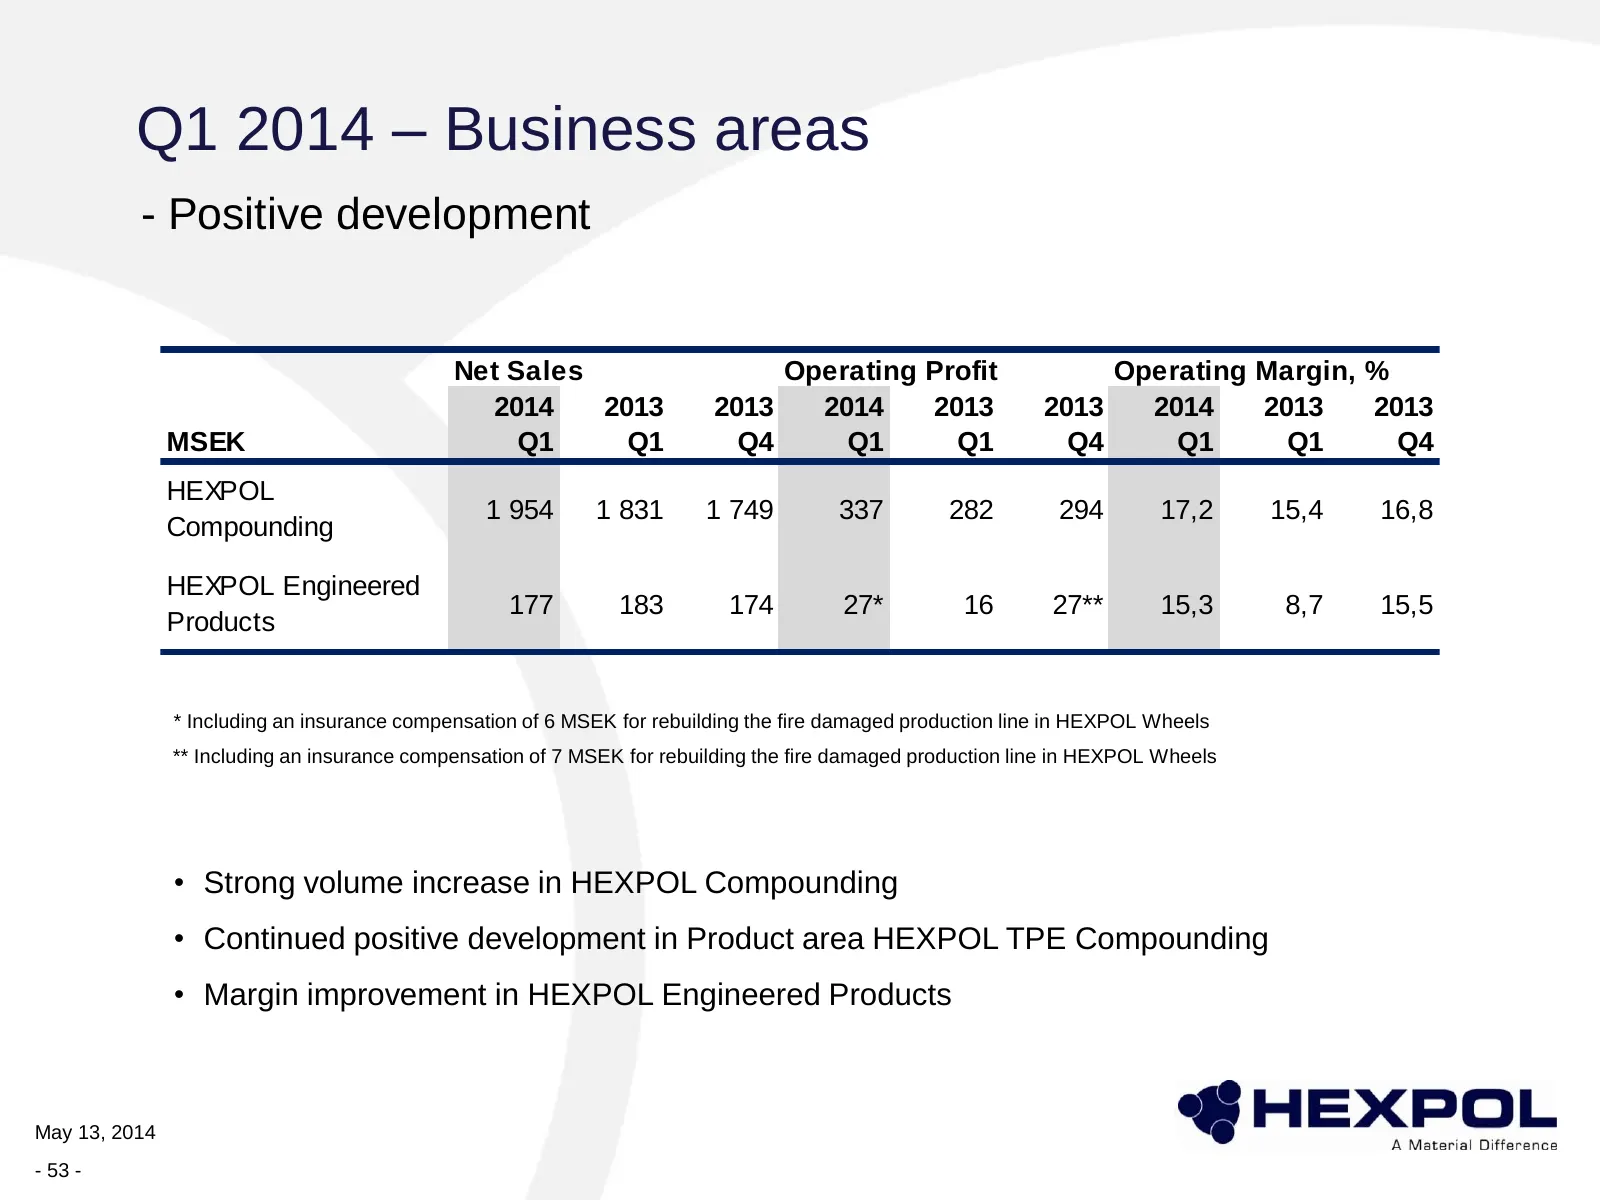
Q1 2014 – Business areas - Positive development Net Sales Operating Profit Operating Margin, % 2014 2013 2013 2014 2013 2013 2014 2013 2013 MSEK Q1 Q1 Q4 Q1 Q1 Q4 Q1 Q1 Q4 HEXPOL 1 954 1 831 1 749 337 282 294 17,2 15,4 16,8 Compounding HEXPOL Engineered 177 183 174 27* 16 27** 15,3 8,7 15,5 Products
Slide 54: Q1 2014 – HEXPOL Compounding
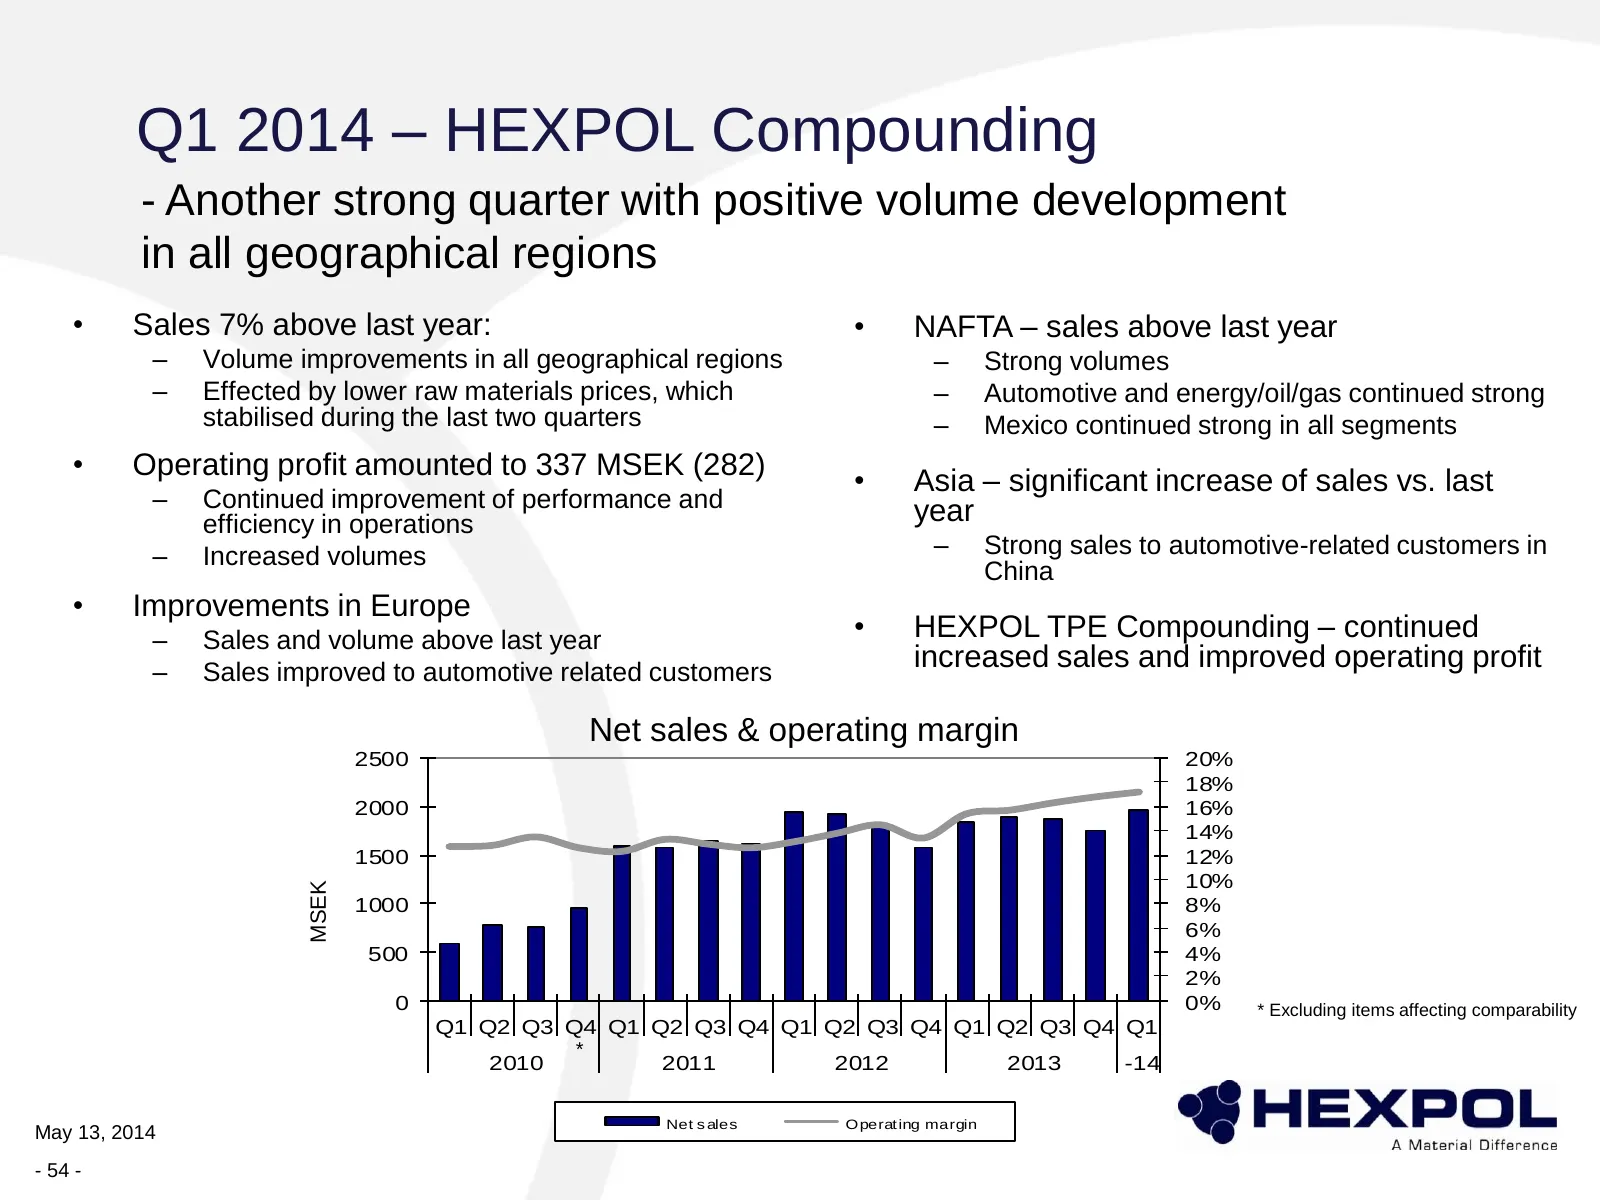
Q1 2014 – HEXPOL Compounding - Another strong quarter with positive volume development in all geographical regions • Sales 7% above last year: • NAFTA – sales above last year – Volume improvements in all geographical regions – Strong volumes – Effected by lower raw materials prices, which – Automoti
Slide 55: Q1 2014 – HEXPOL Engineered Products
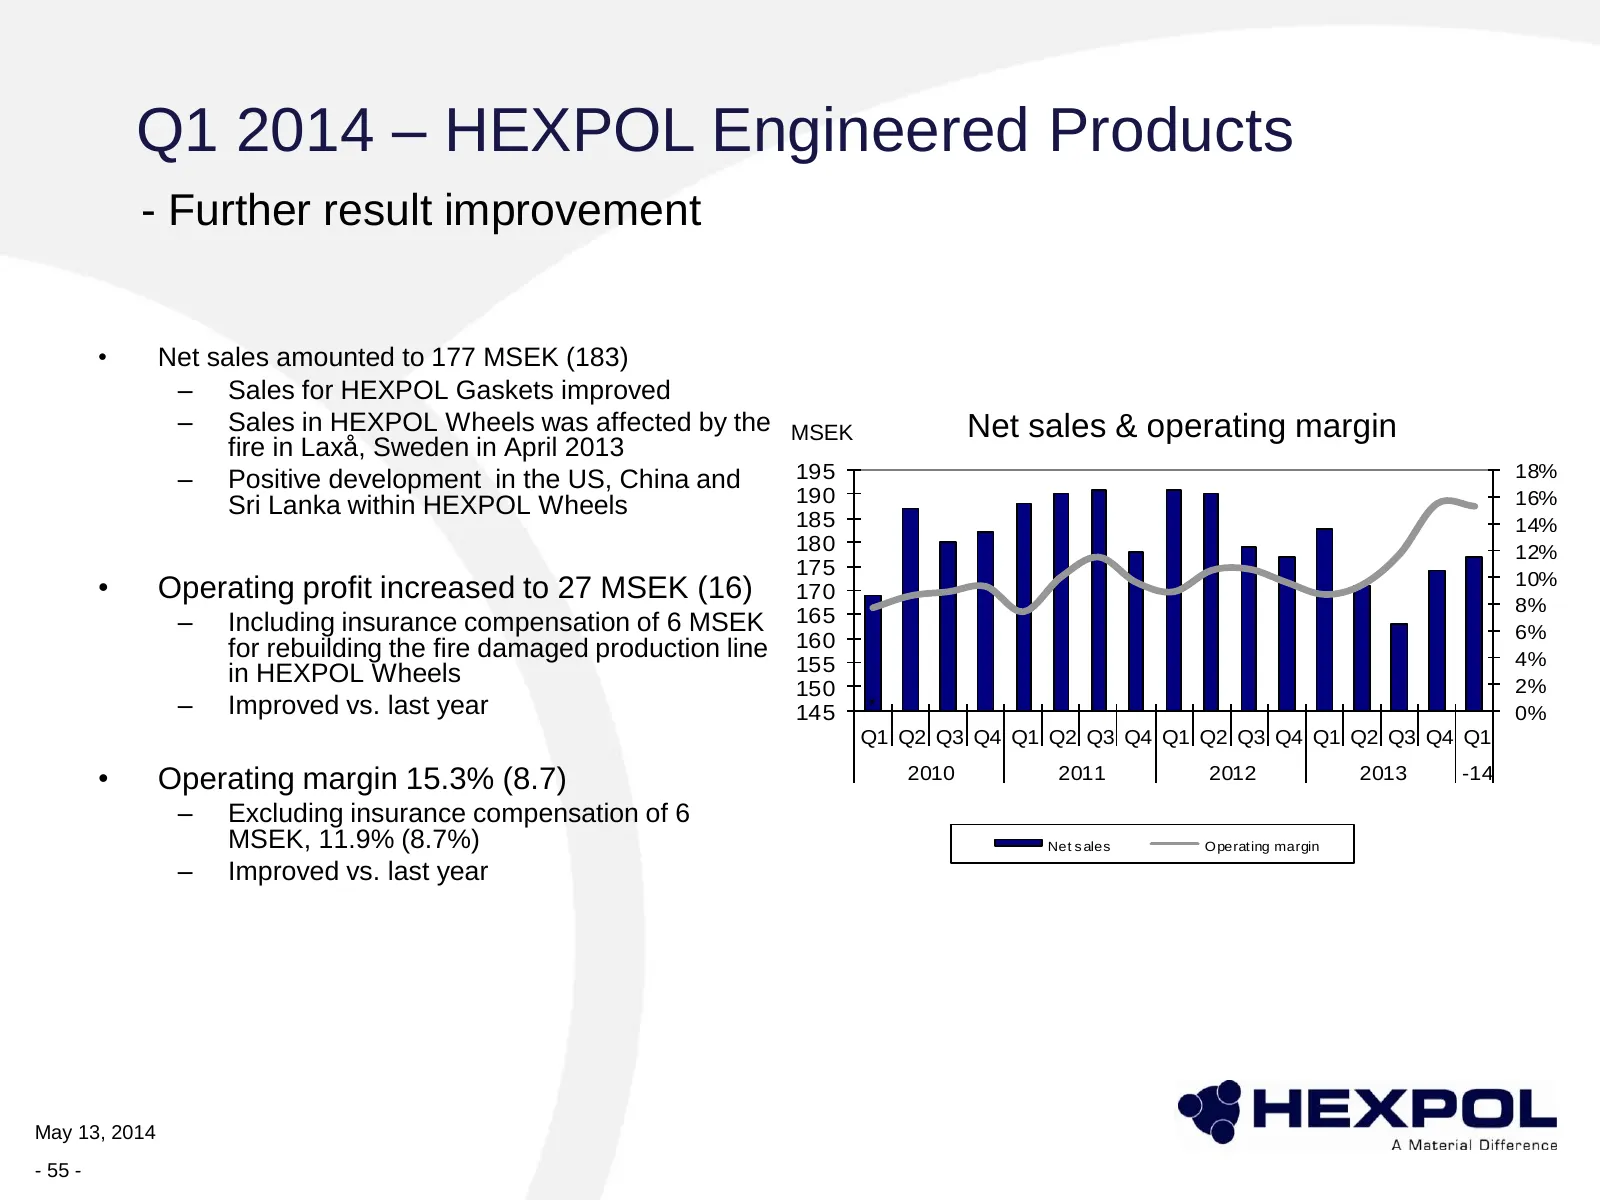
Q1 2014 – HEXPOL Engineered Products - Further result improvement • Net sales amounted to 177 MSEK (183) – Sales for HEXPOL Gaskets improved – Sales in HEXPOL Wheels was affected by the MSEK Net sales & operating margin fire in Laxå, Sweden in April 2013 – Positive development in the US, China and 1
Slide 56: Q1 2014 – Strong start of the year
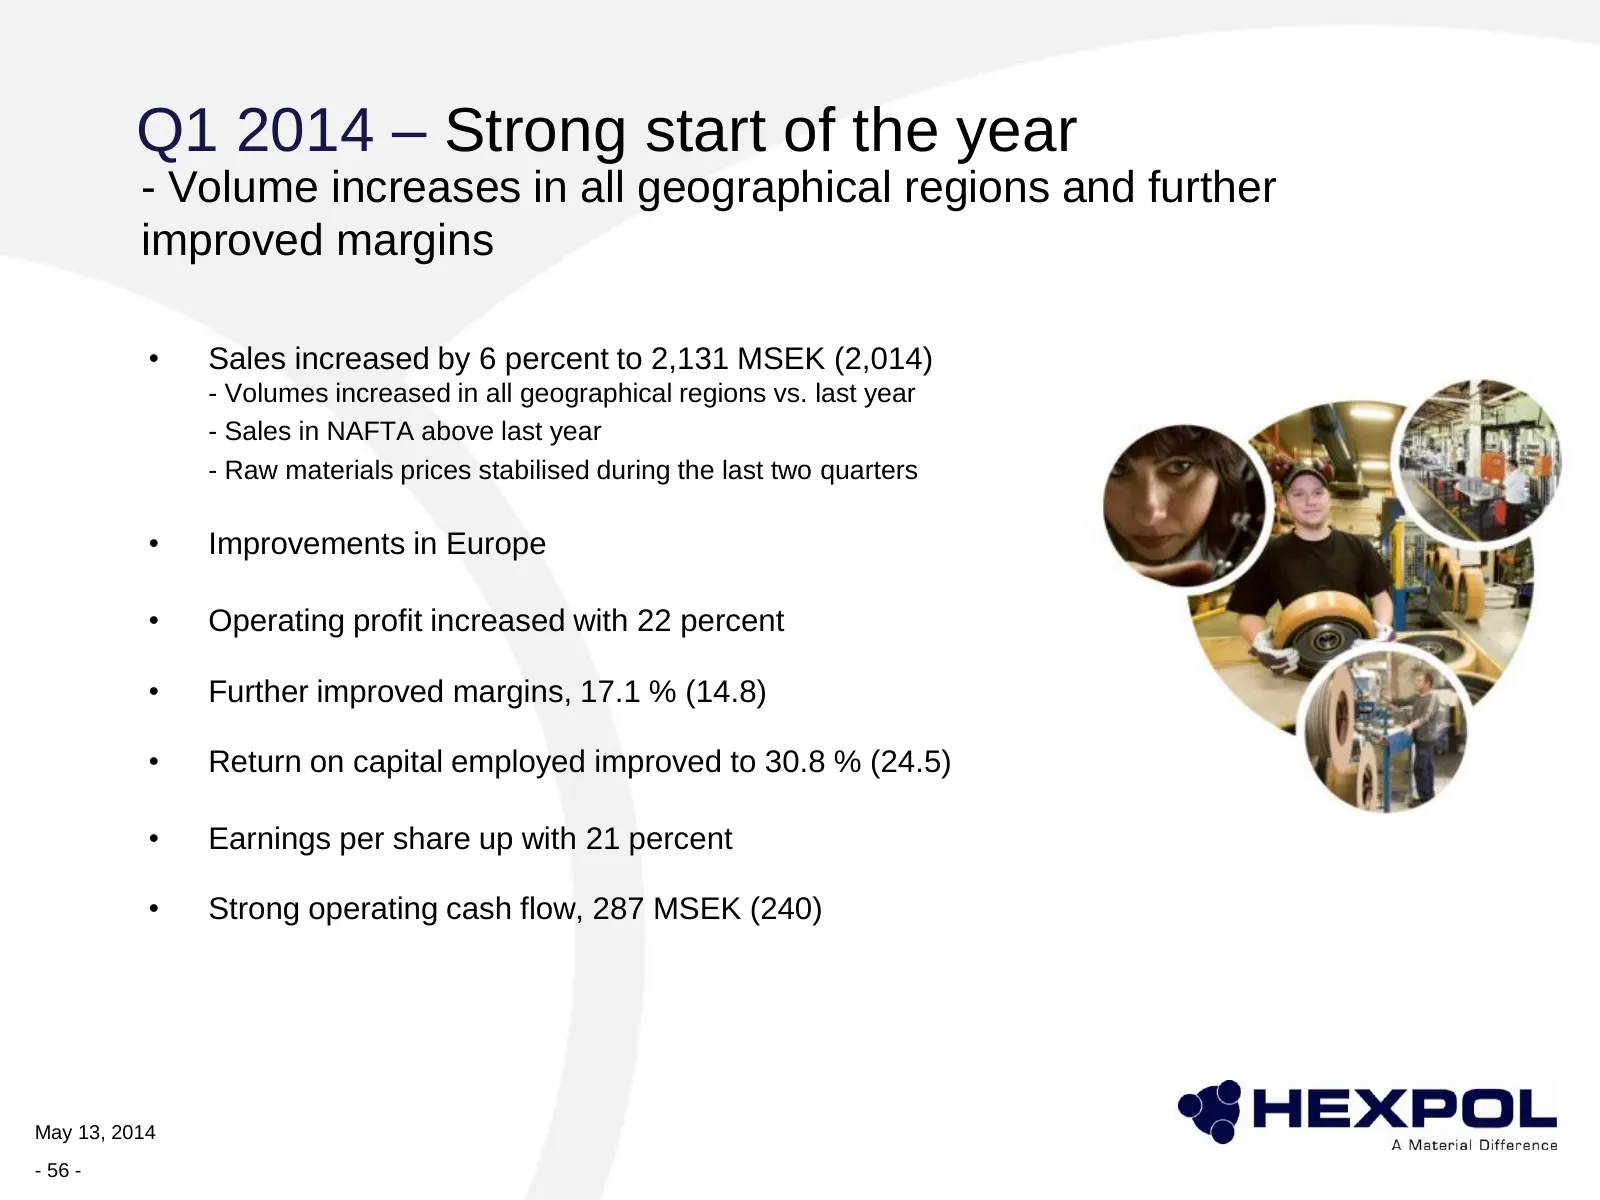
Q1 2014 – Strong start of the year - Volume increases in all geographical regions and further improved margins • Sales increased by 6 percent to 2,131 MSEK (2,014) - Volumes increased in all geographical regions vs. last year - Sales in NAFTA above last year - Raw materials prices stabilised during
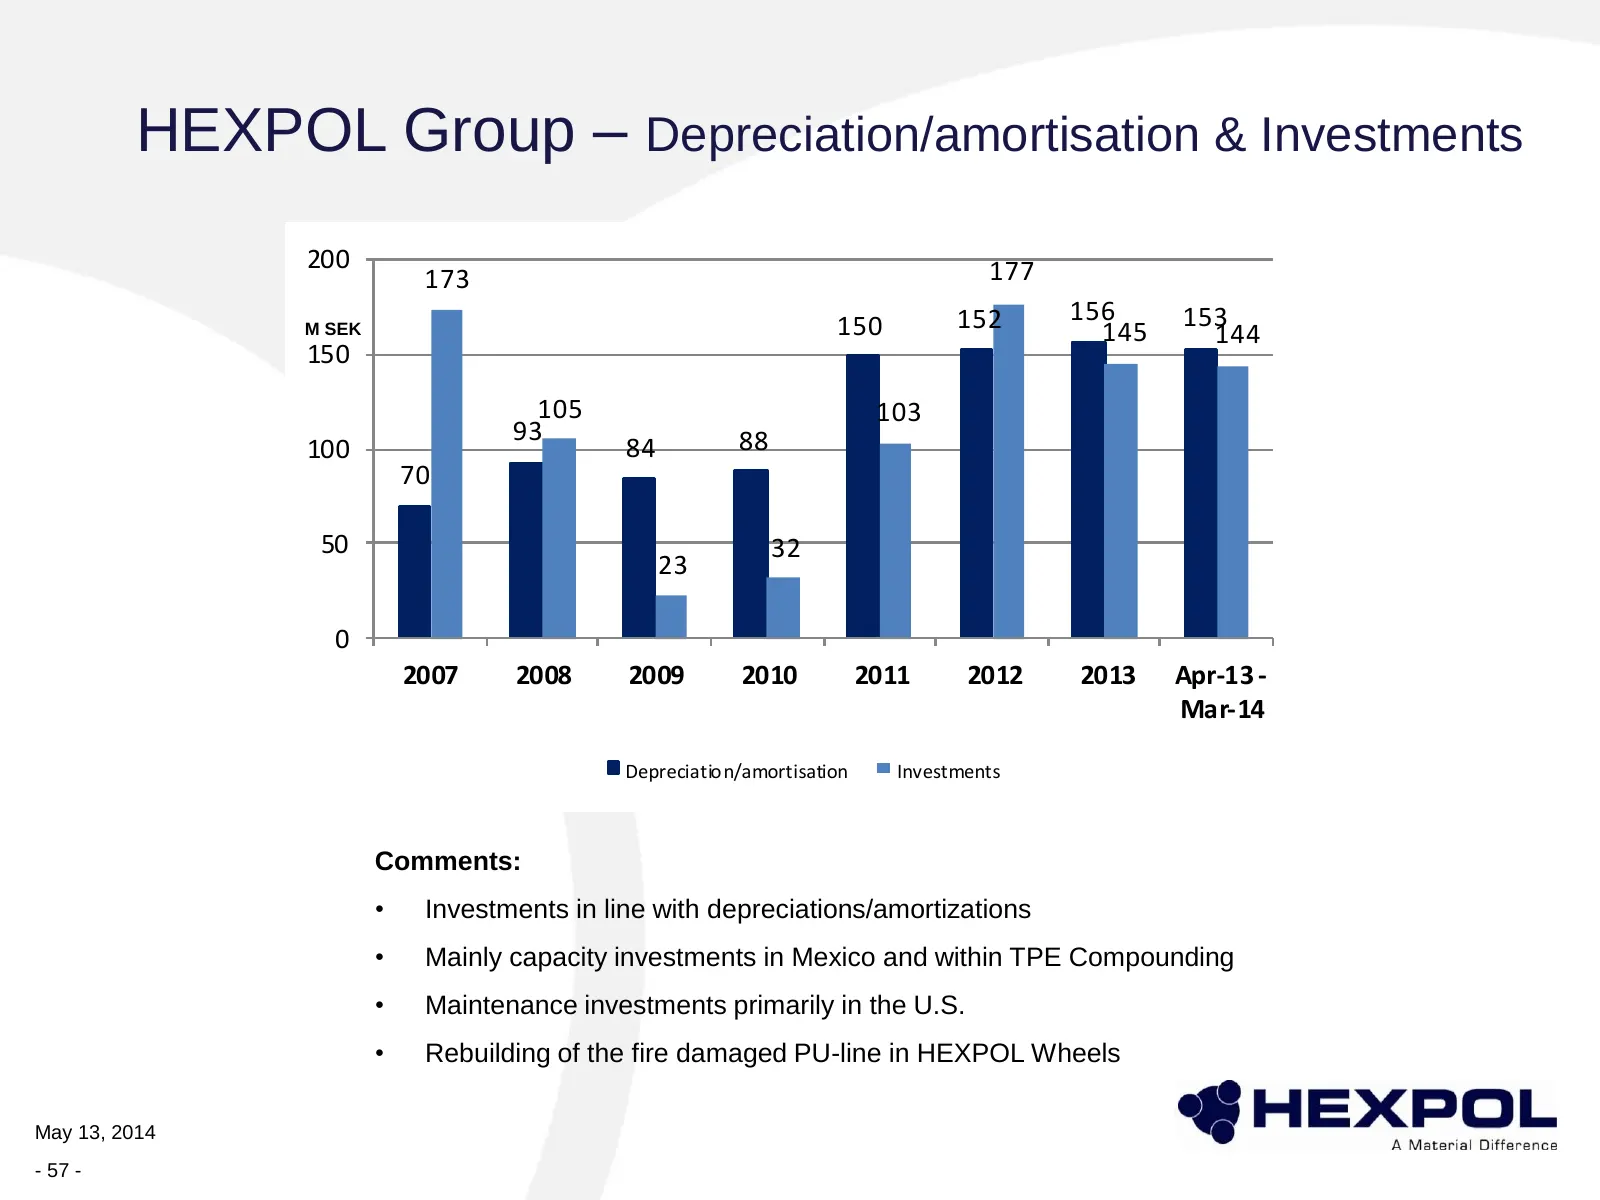
Slide 57: Depreciation/amortisation & Investments
HEXPOL Group – Depreciation/amortisation & Investments 200 177 173 152 156 153 M SEK 150 145 144 150 105 103 93 88 100 84 70 50 32 23 0 2007 2008 2009 2010 2011 2012 2013 Apr-13 - Mar-14 Depreciation/amortisation Investments Comments: • Investments in line with depreciations/amortizations • Mainly c
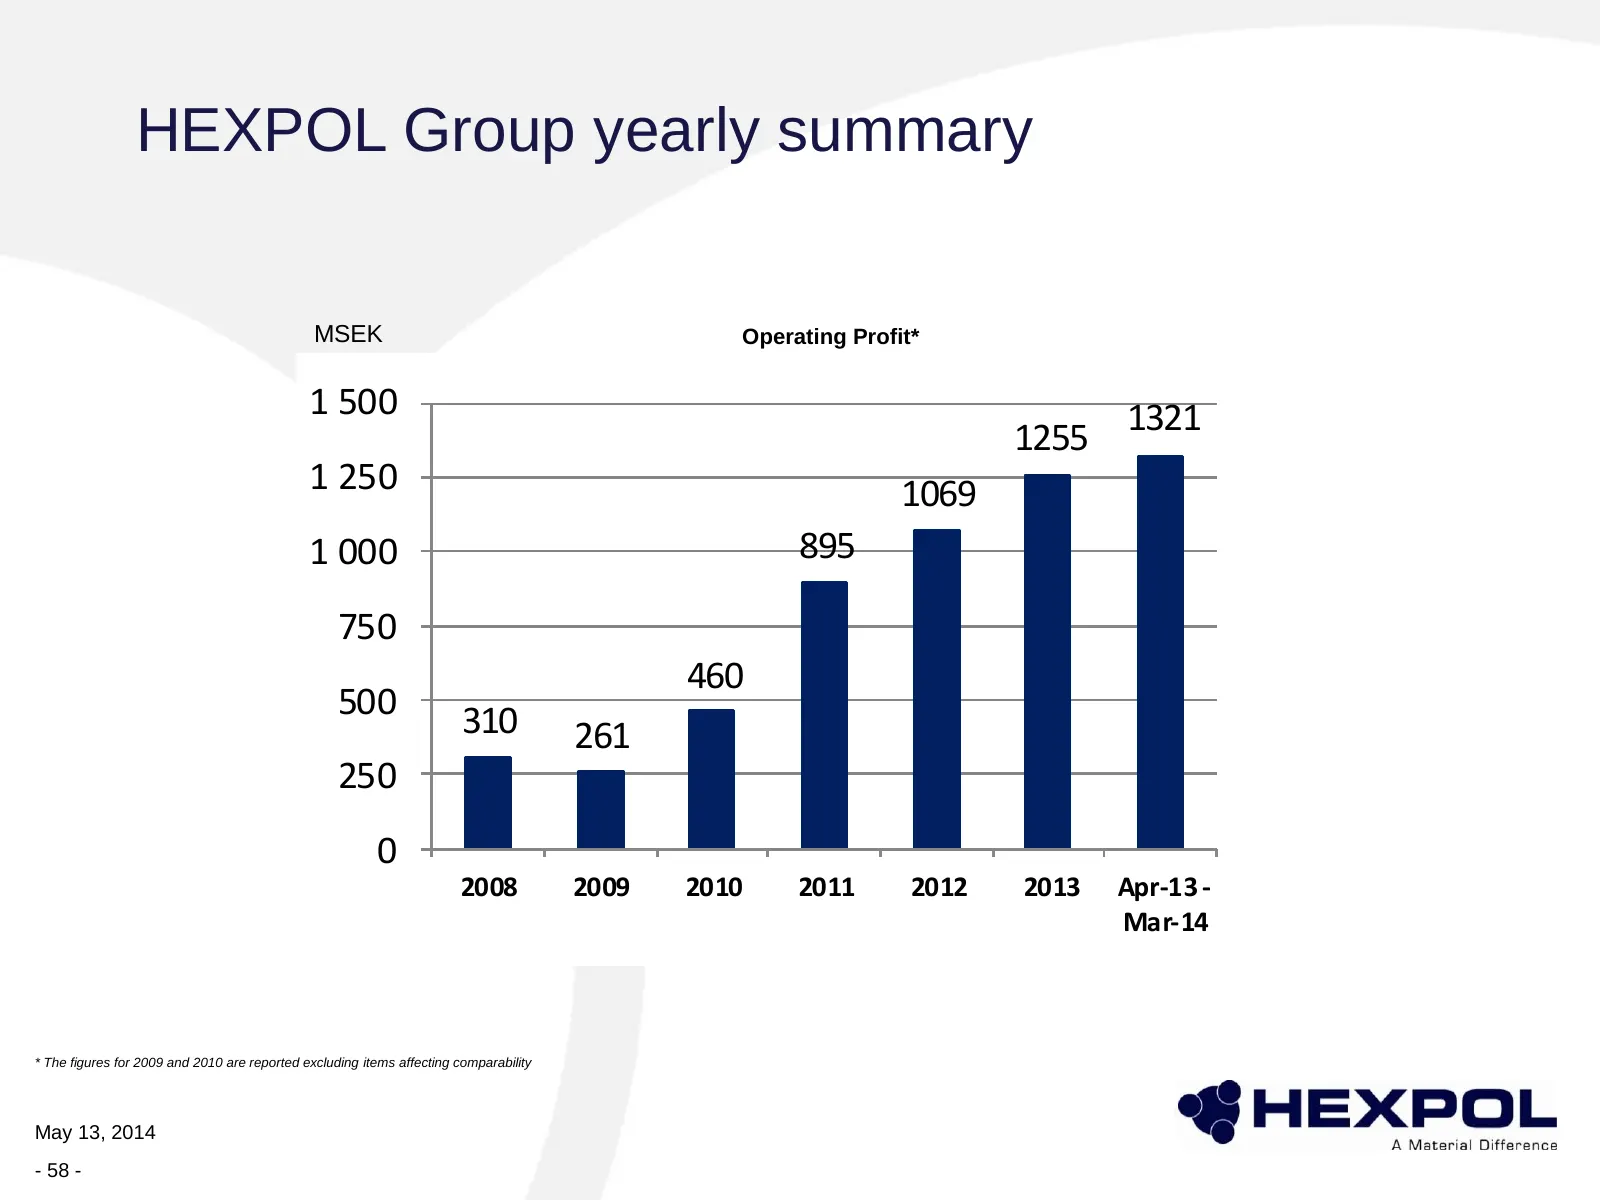
Slide 58: HEXPOL Group yearly summary – operating profit
HEXPOL Group yearly summary MSEK Operating Profit* 1 500 1255 1321 1 250 1069 1 000 895 750 460 500 310 261 250 0 2008 2009 2010 2011 2012 2013 Apr-13 - Mar-14 * The figures for 2009 and 2010 are reported excluding items affecting comparability May 13, 2014 - 58 -
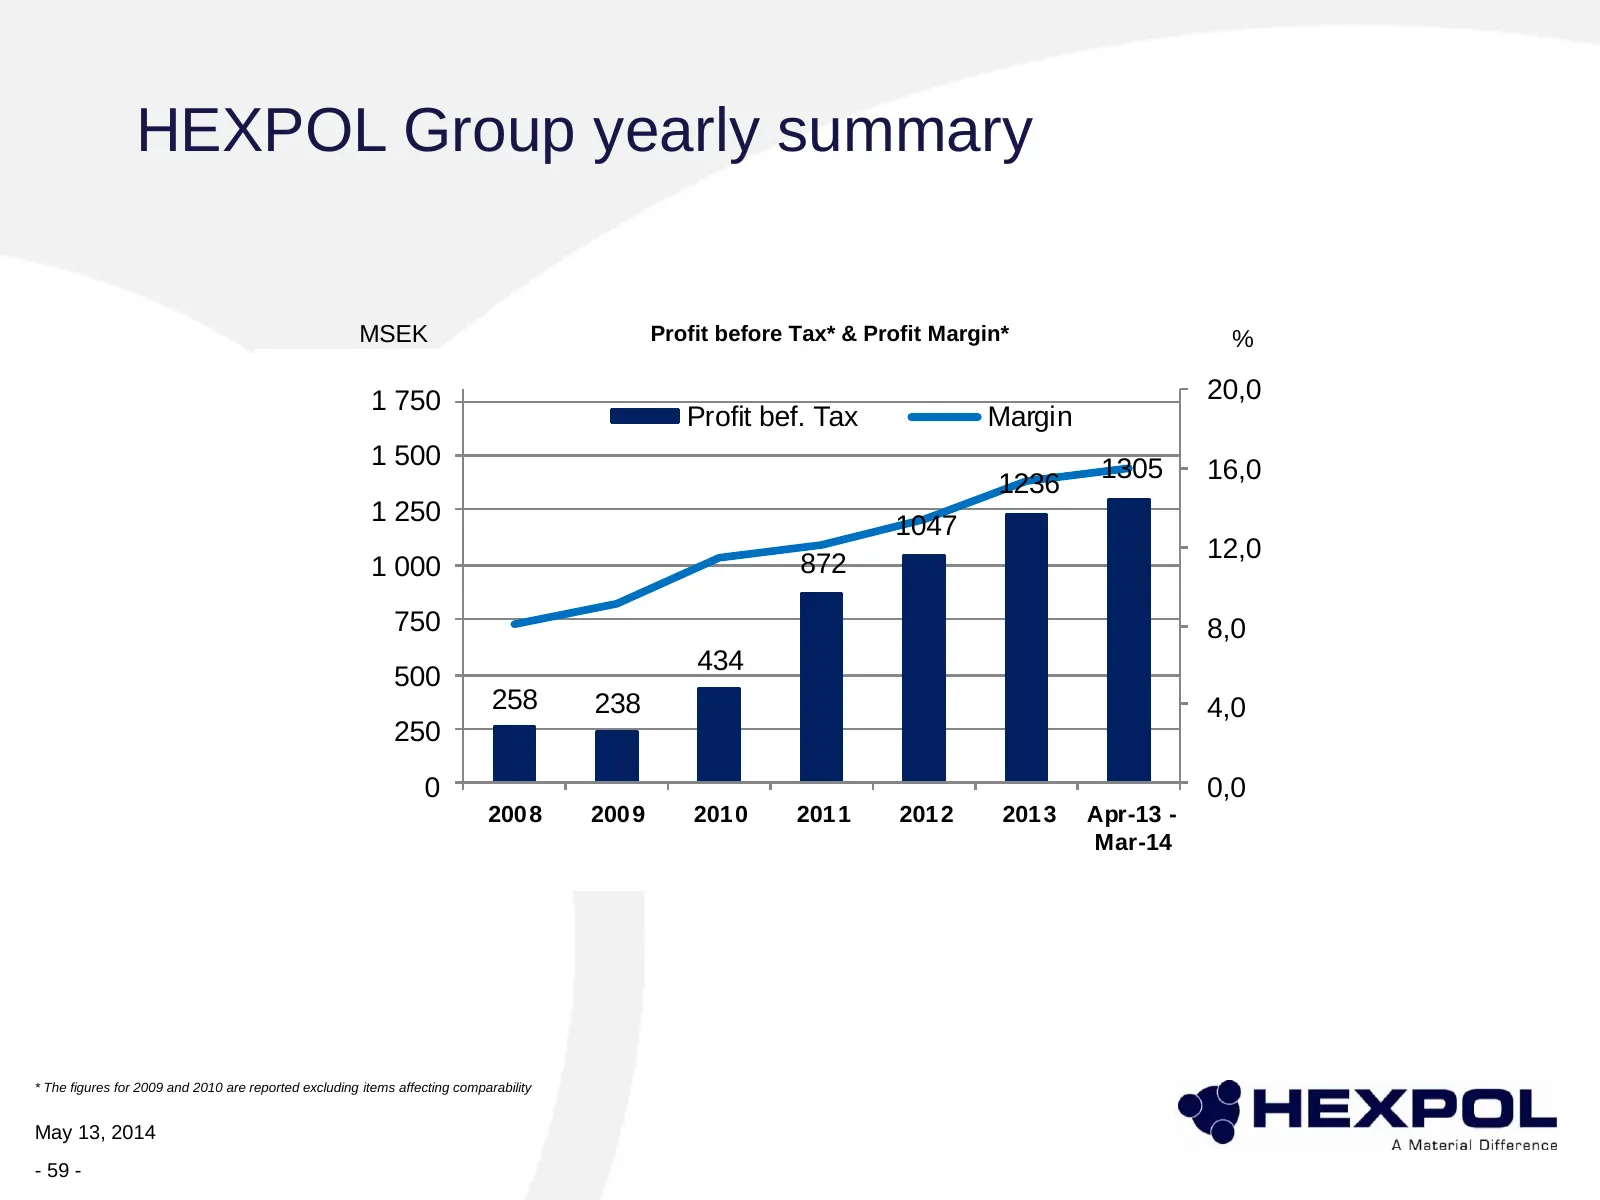
Slide 59: Profit before tax & profit margin
HEXPOL Group yearly summary MSEK Profit before Tax* & Profit Margin* % 1 750 20,0 Profit bef. Tax Margin 1 500 1305 16,0 1236 1 250 1047 12,0 1 000 872 750 8,0 434 500 258 238 4,0 250 0 0,0 200 8 200 9 201 0 201 1 201 2 201 3 Apr-13 - Mar-14 * The figures for 2009 and 2010 are reported excluding ite
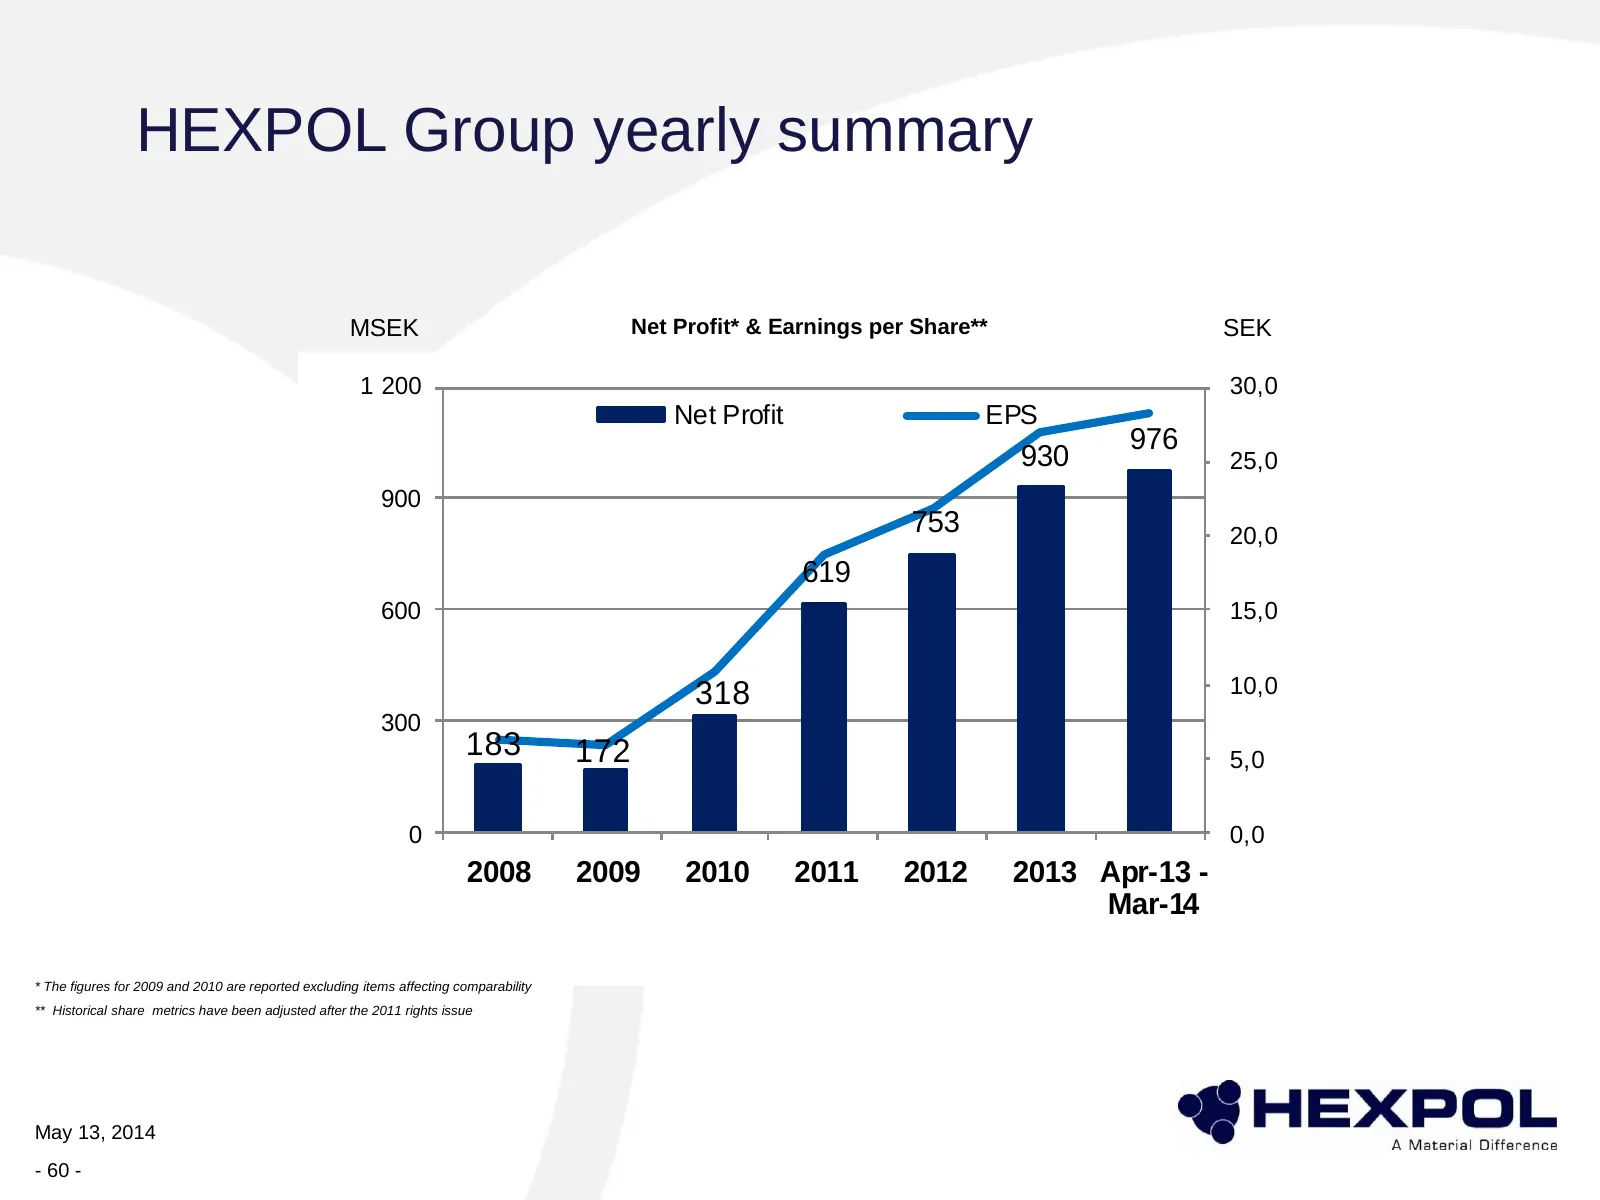
Slide 60: Net profit & earnings per share
HEXPOL Group yearly summary MSEK Net Profit* & Earnings per Share** SEK 1 200 30,0 Net Profit EPS 976 930 25,0 900 753 20,0 619 600 15,0 318 10,0 300 183 172 5,0 0 0,0 2008 2009 2010 2011 2012 2013 Apr-13 - Mar-14 * The figures for 2009 and 2010 are reported excluding items affecting comparability *
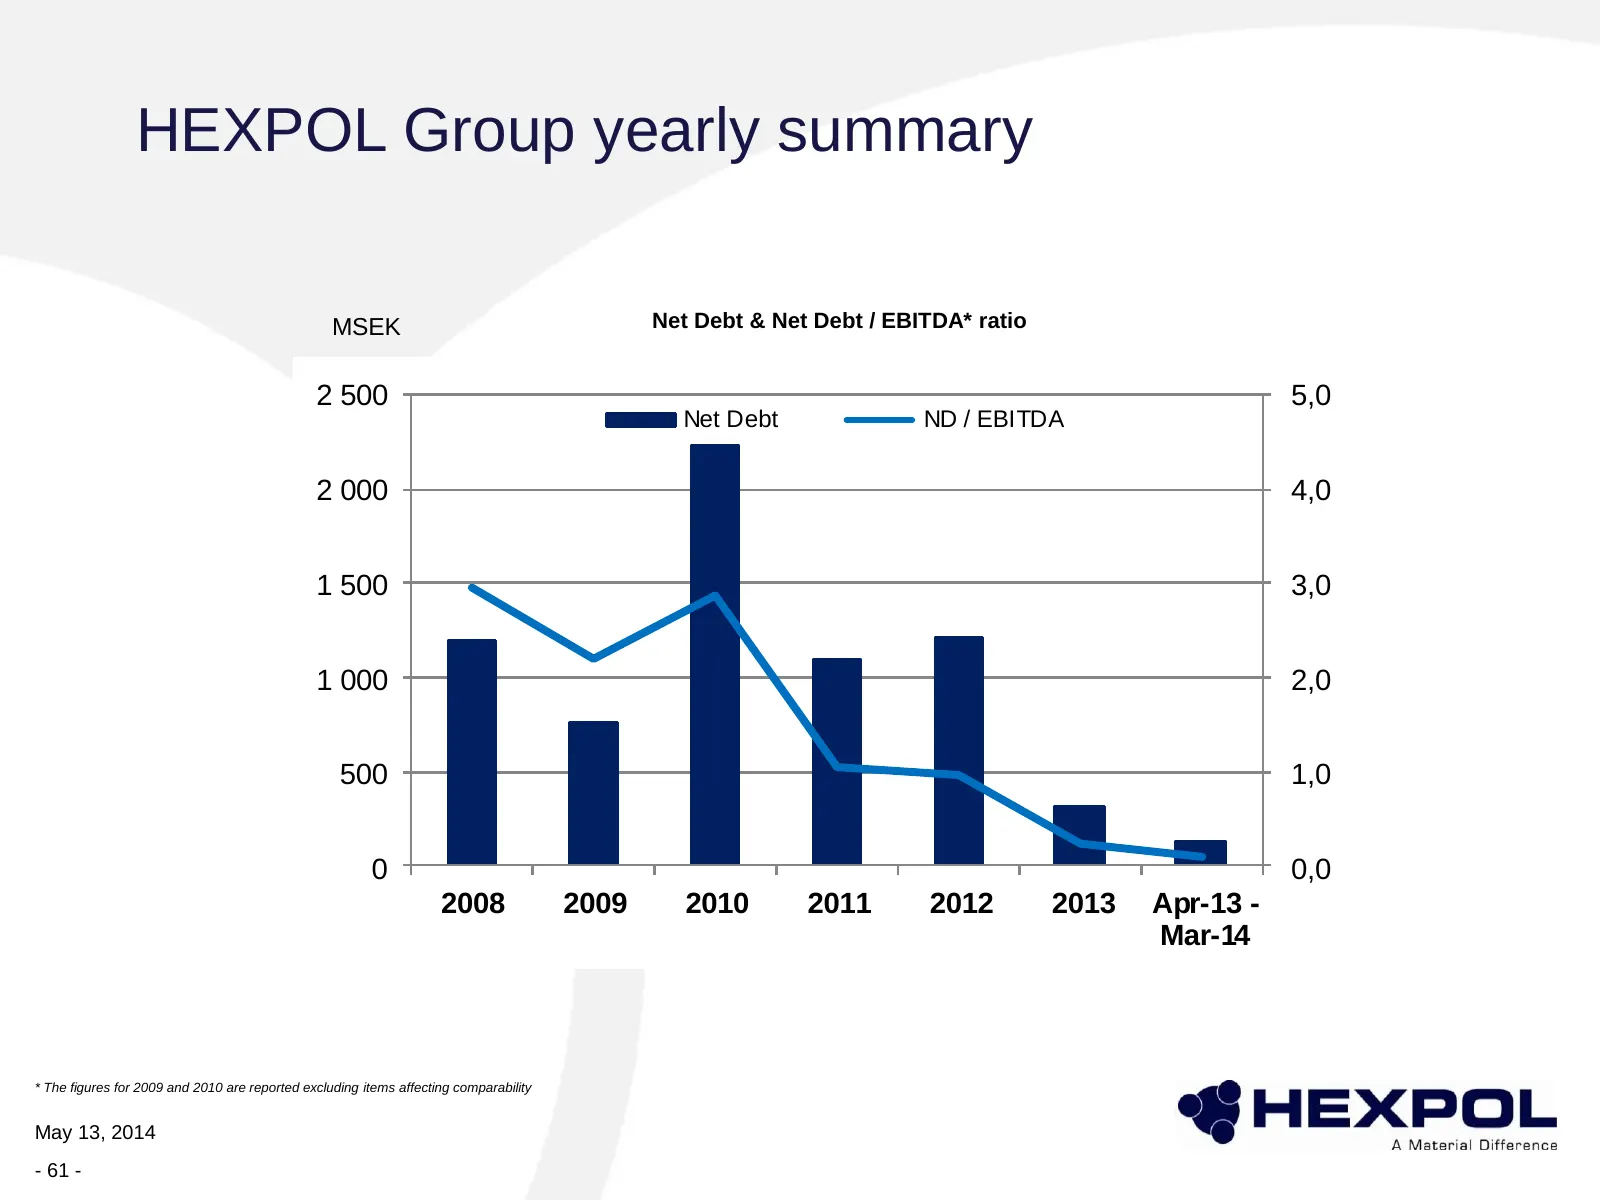
Slide 61: Net debt & Net debt / EBITDA
HEXPOL Group yearly summary MSEK Net Debt & Net Debt / EBITDA* ratio 2 500 5,0 Net Debt ND / EBITDA 2 000 4,0 1 500 3,0 1 000 2,0 500 1,0 0 0,0 2008 2009 2010 2011 2012 2013 Apr-13 - Mar-14 * The figures for 2009 and 2010 are reported excluding items affecting comparability May 13, 2014 - 61 -
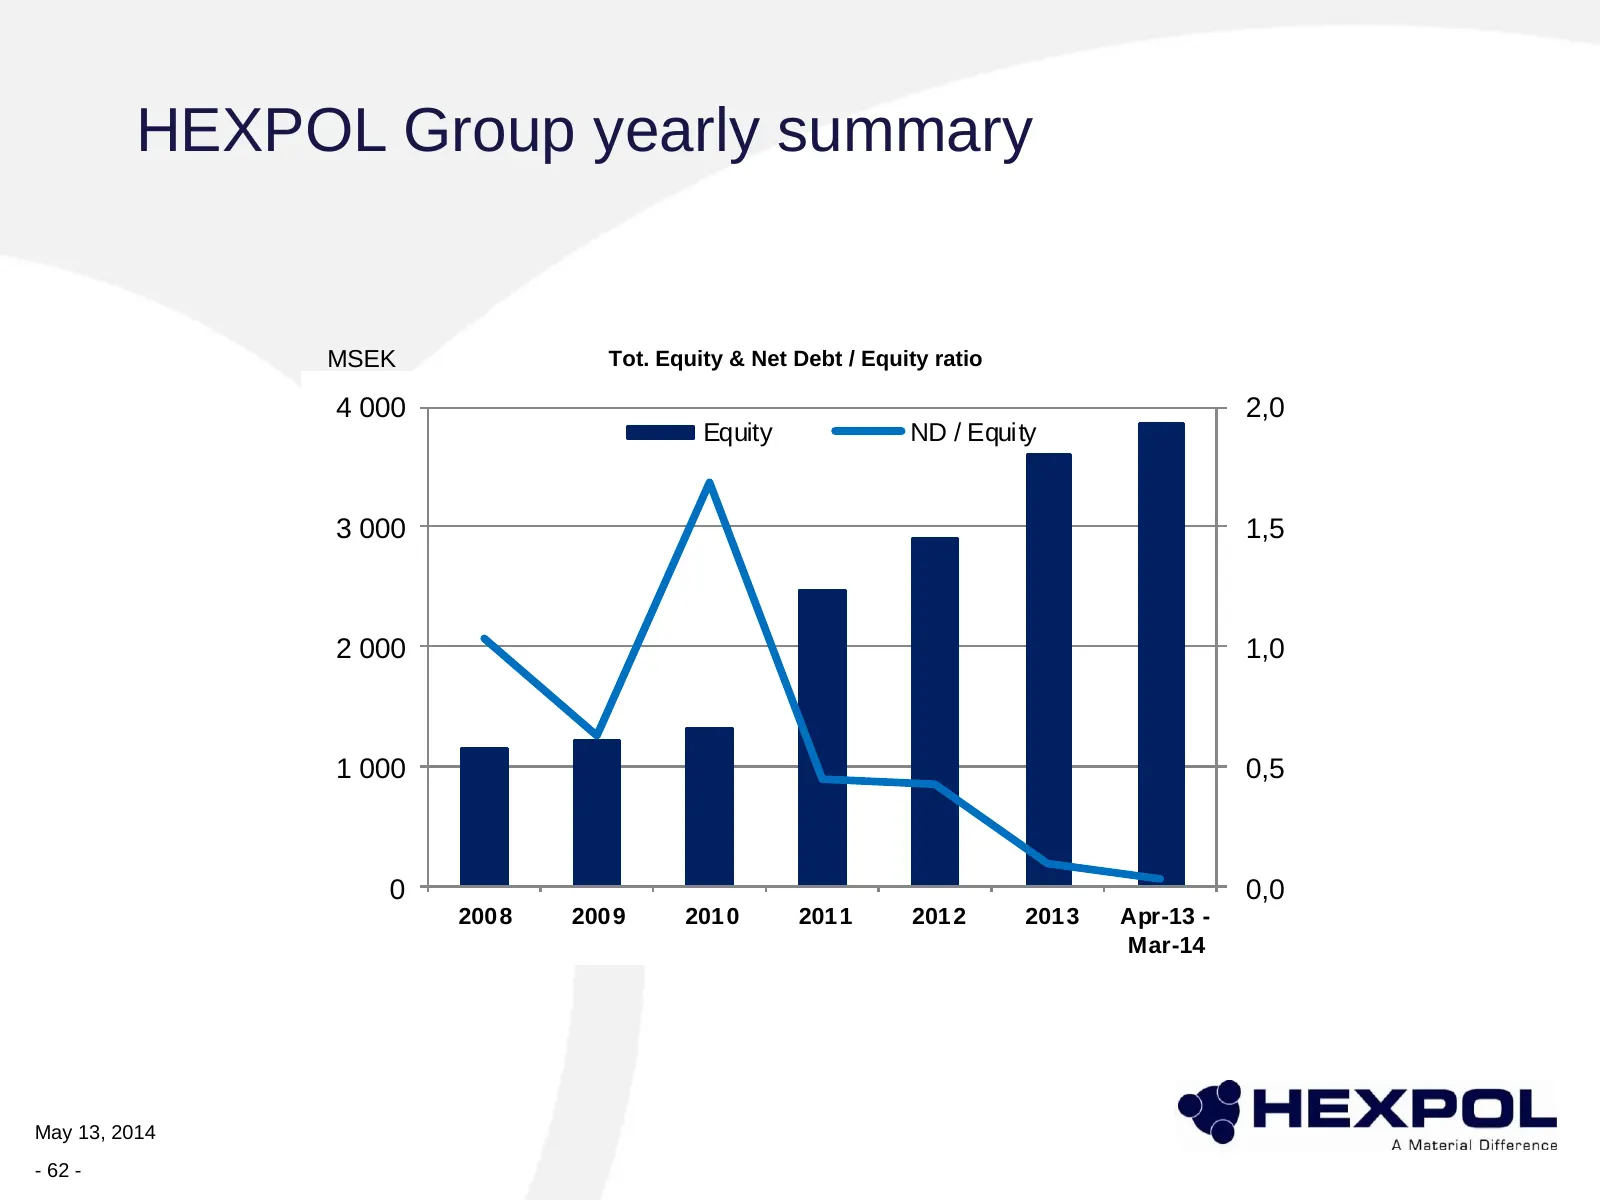
Slide 62: Total equity & Net debt / equity
HEXPOL Group yearly summary MSEK Tot. Equity & Net Debt / Equity ratio 4 000 2,0 Equity ND / Equity 3 000 1,5 2 000 1,0 1 000 0,5 0 0,0 200 8 200 9 201 0 201 1 201 2 201 3 Apr-13 - Mar-14 May 13, 2014 - 62 -
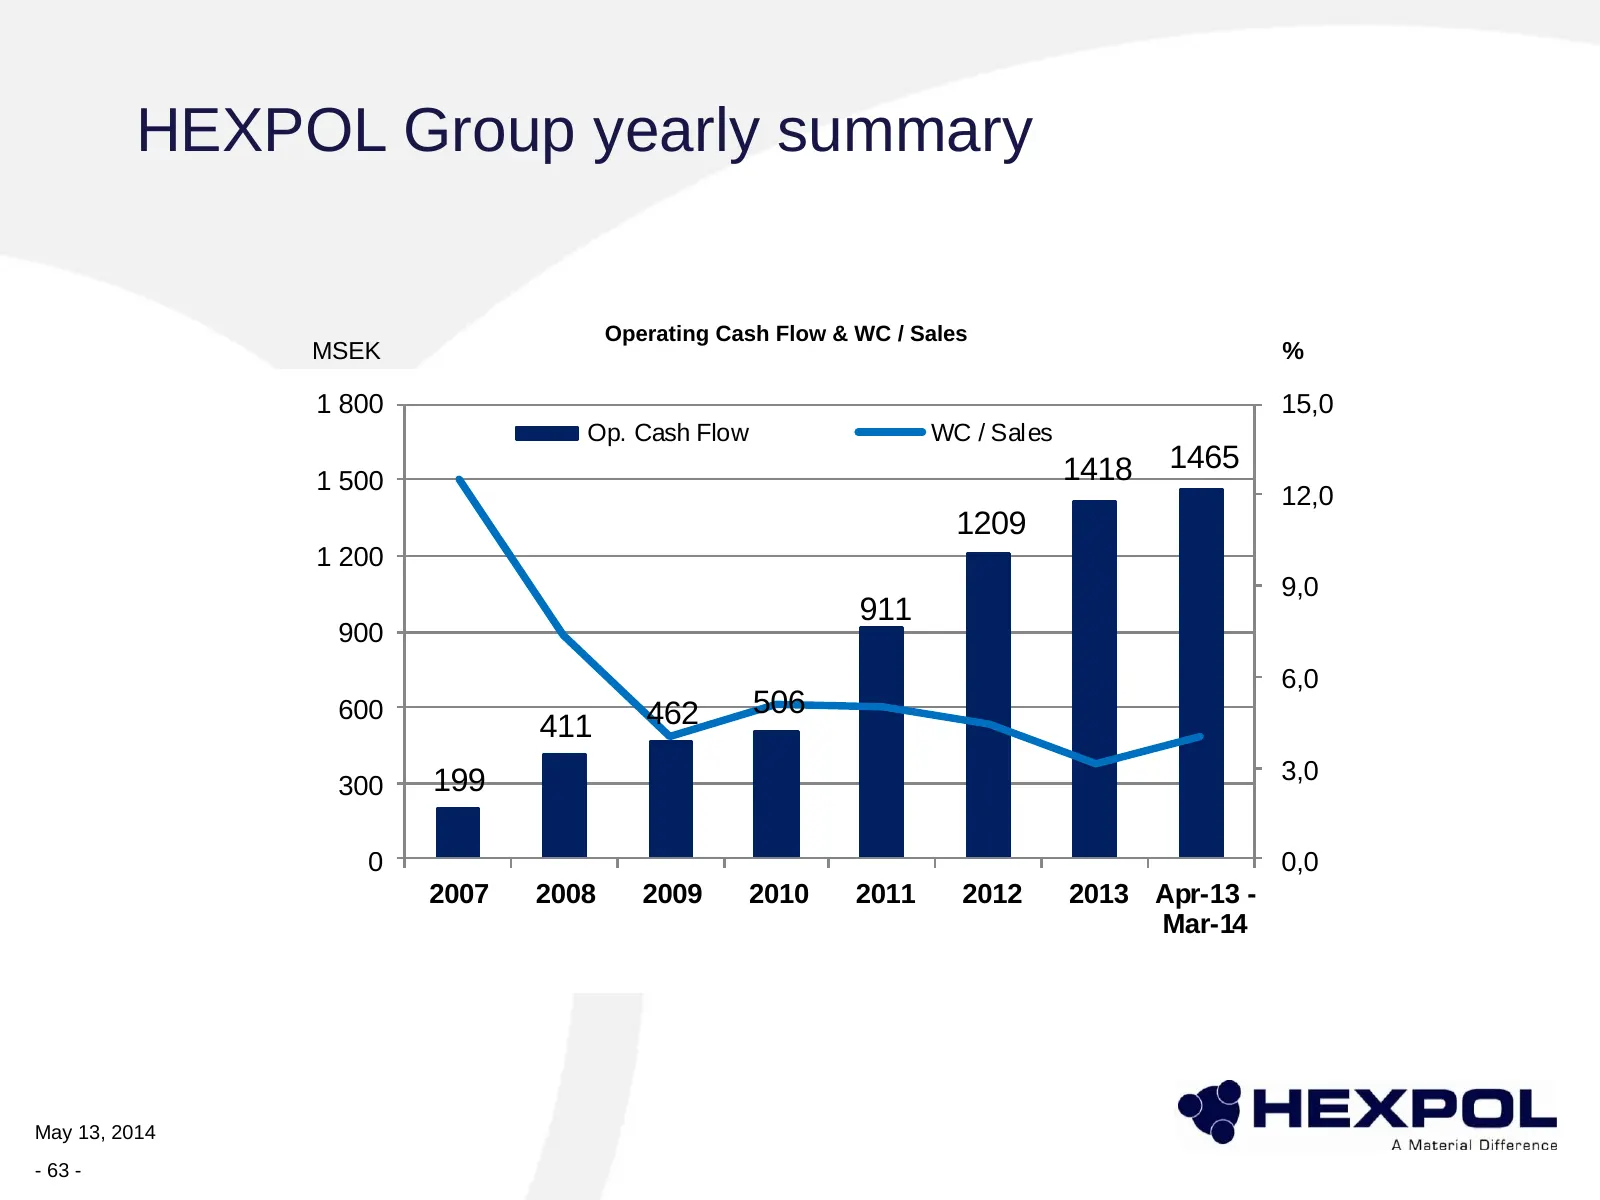
Slide 63: Operating cash flow & WC / sales
HEXPOL Group yearly summary Operating Cash Flow & WC / Sales MSEK % 1 800 15,0 Op. Cash Flow WC / Sales 1418 1465 1 500 12,0 1209 1 200 9,0 911 900 6,0 600 462 506 411 199 3,0 300 0 0,0 2007 2008 2009 2010 2011 2012 2013 Apr-13 - Mar-14 May 13, 2014 - 63 -
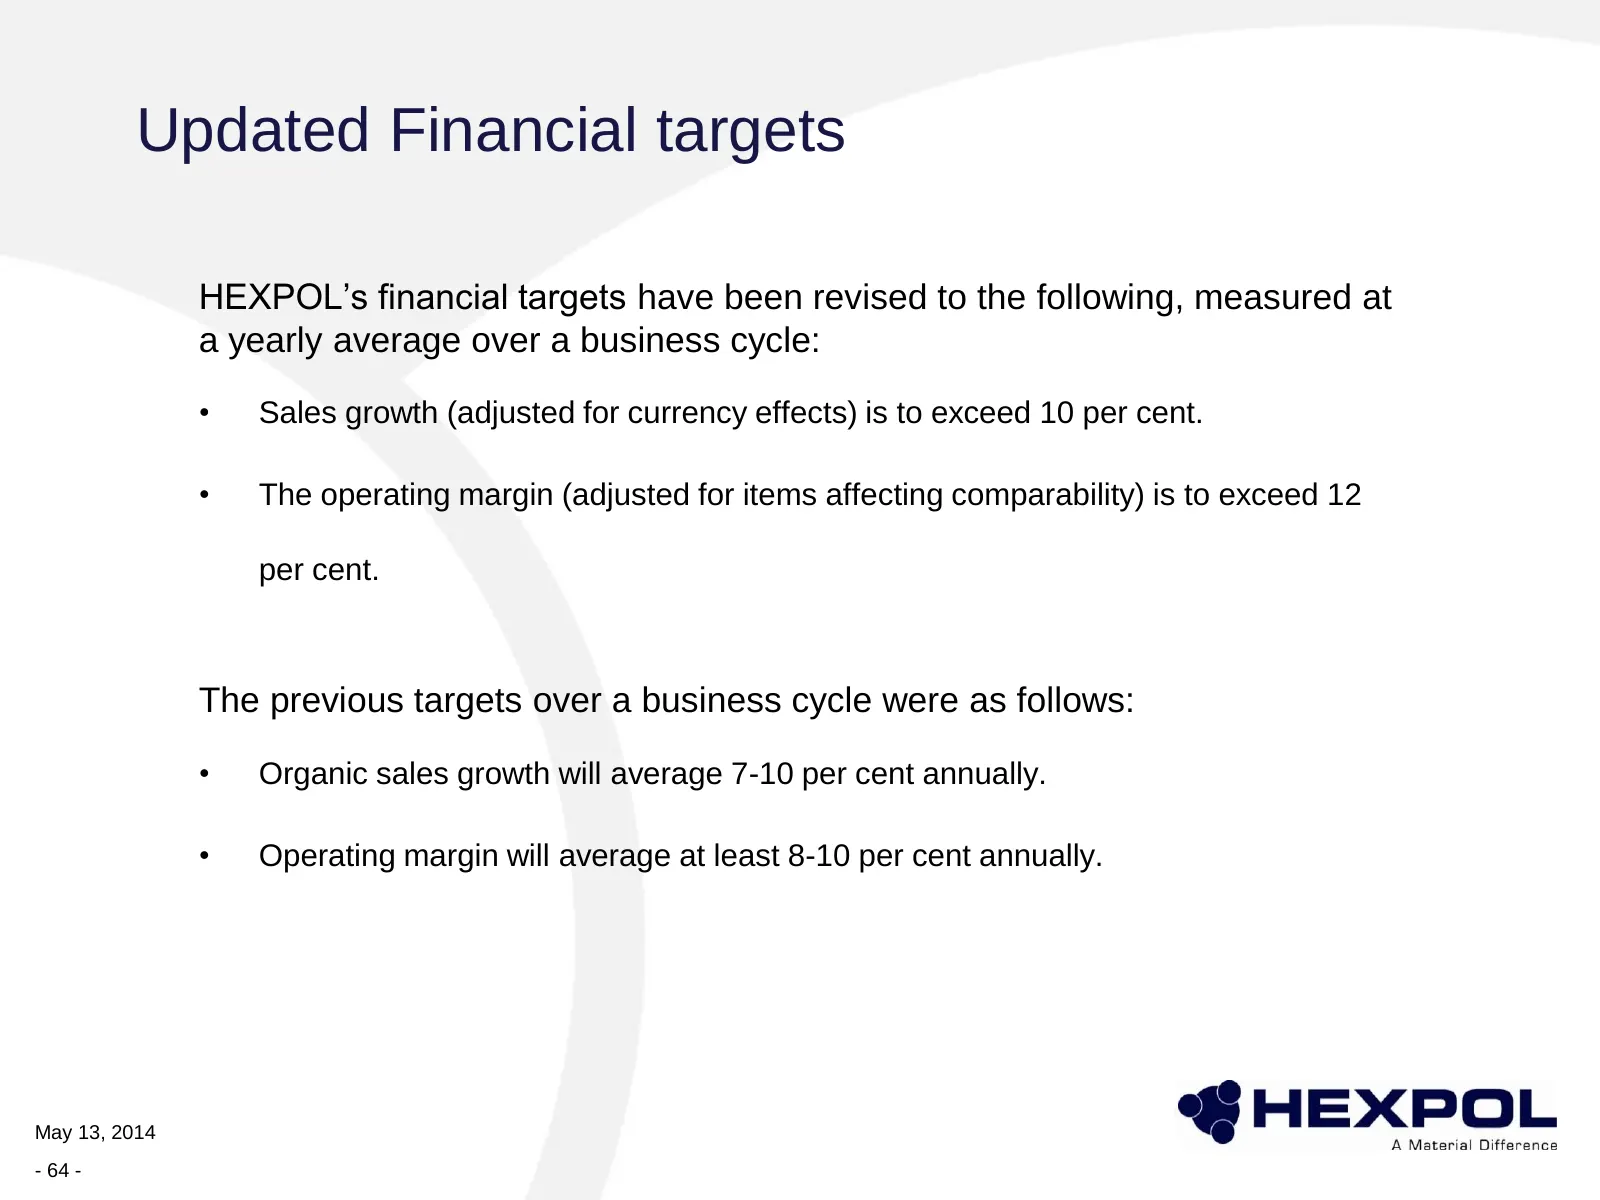
Slide 64: Updated Financial targets
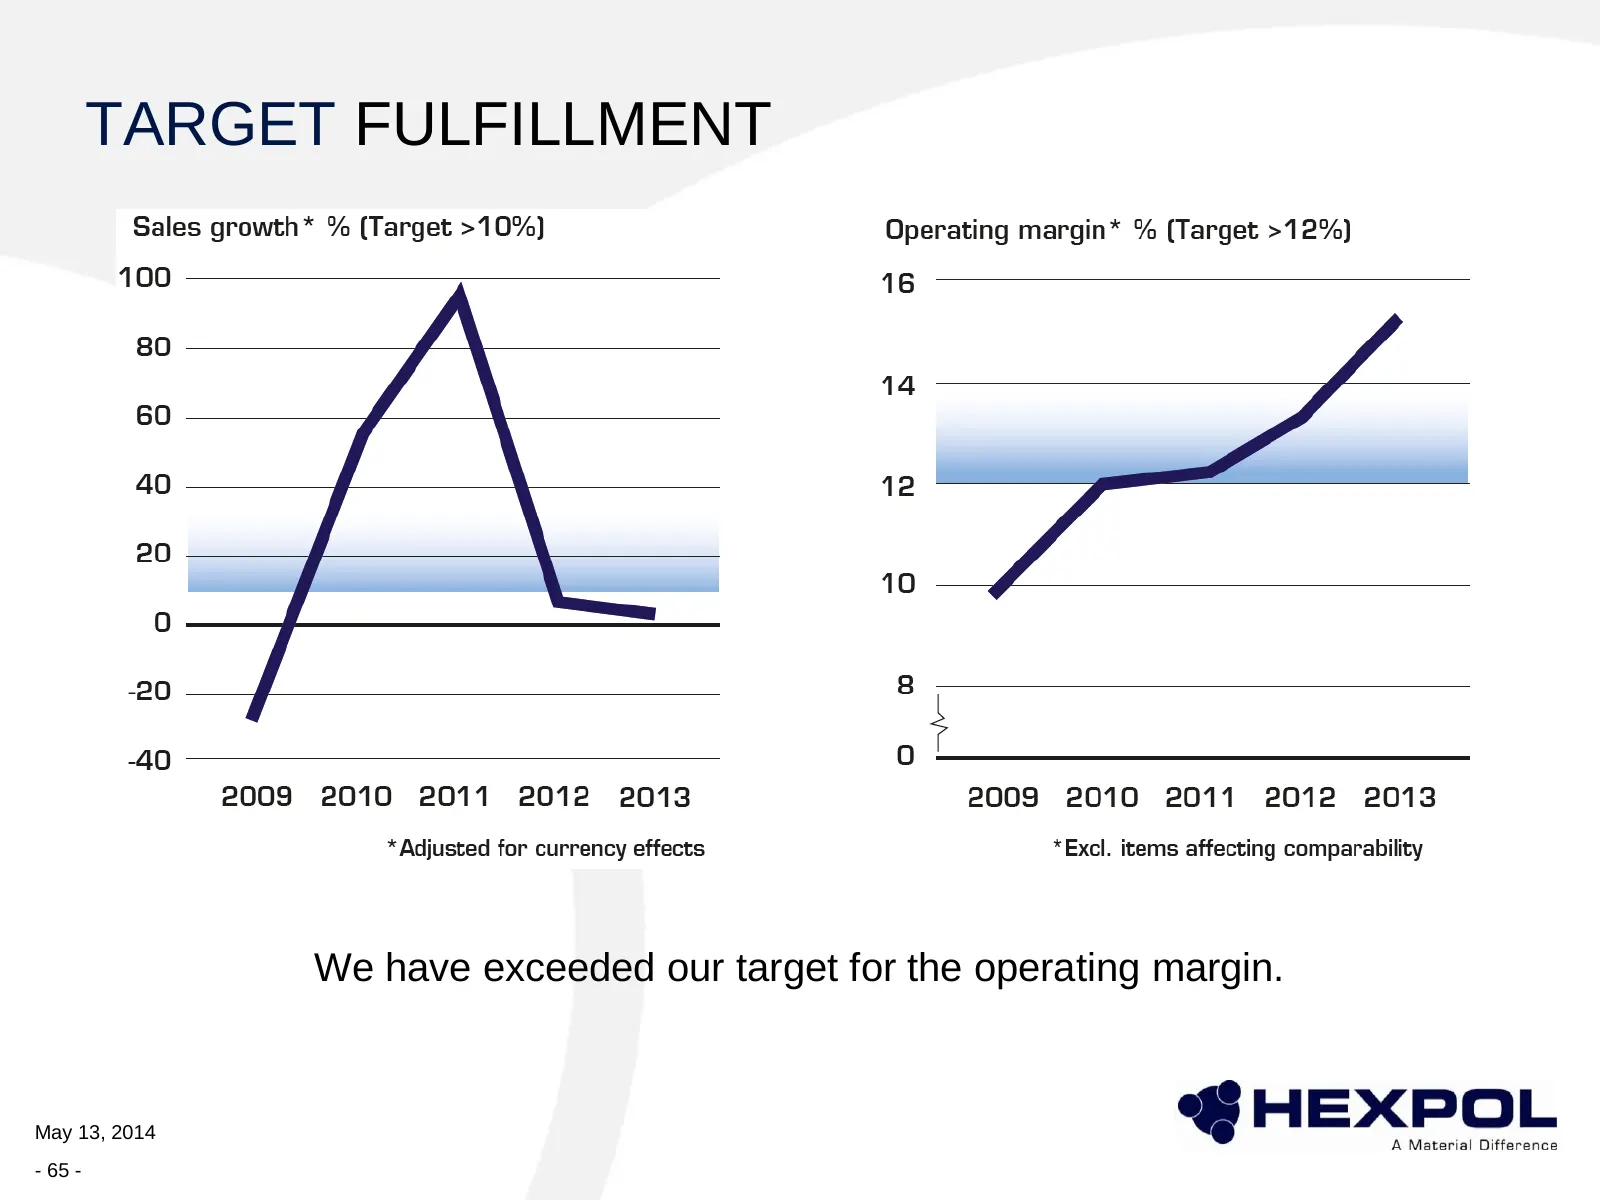
Updated Financial targets HEXPOL’s financial targets have been revised to the following, measured at a yearly average over a business cycle: • Sales growth (adjusted for currency effects) is to exceed 10 per cent. • The operating margin (adjusted for items affecting comparability) is to exceed 12 pe
Slide 65: Target fulfillment
TARGET FULFILLMENT We have exceeded our target for the operating margin. May 13, 2014 - 65 -
Slide 66: Dividend policy
DIVIDEND POLICY HEXPOL's earnings and equity ratio determines the size of the dividend. HEXPOL's dividend policy is that 25-50 percent of profit after tax to be used for distribution to HEXPOL's shareholders with the premise that the Group's financial position is satisfactory. AGM DECISION 9.00 SEK
Slide 67: Jan - Dec 2013
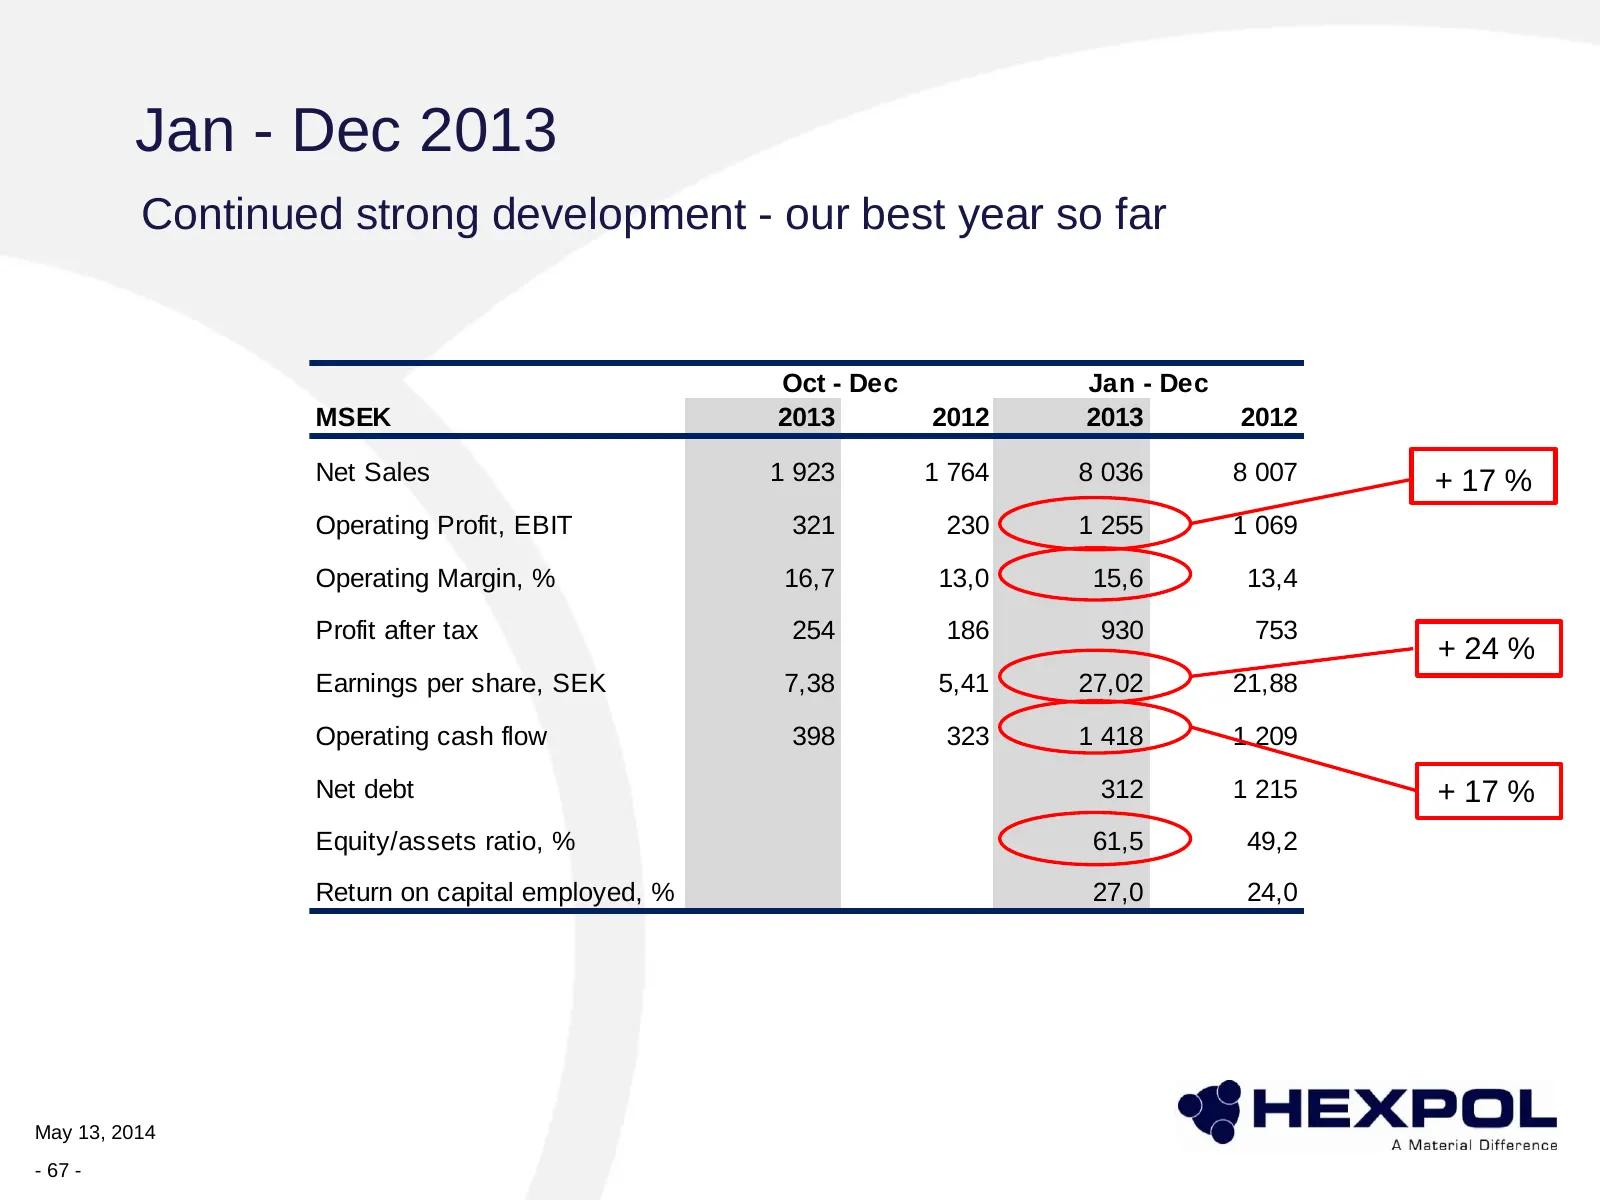
Jan - Dec 2013 Continued strong development - our best year so far Oct - Dec Jan - Dec MSEK 2013 2012 2013 2012 Net Sales 1 923 1 764 8 036 8 007 + 17 % Operating Profit, EBIT 321 230 1 255 1 069 Operating Margin, % 16,7 13,0 15,6 13,4 Profit after tax 254 186 930 753 + 24 % Earnings per share, SEK
Slide 68: Full-year 2013
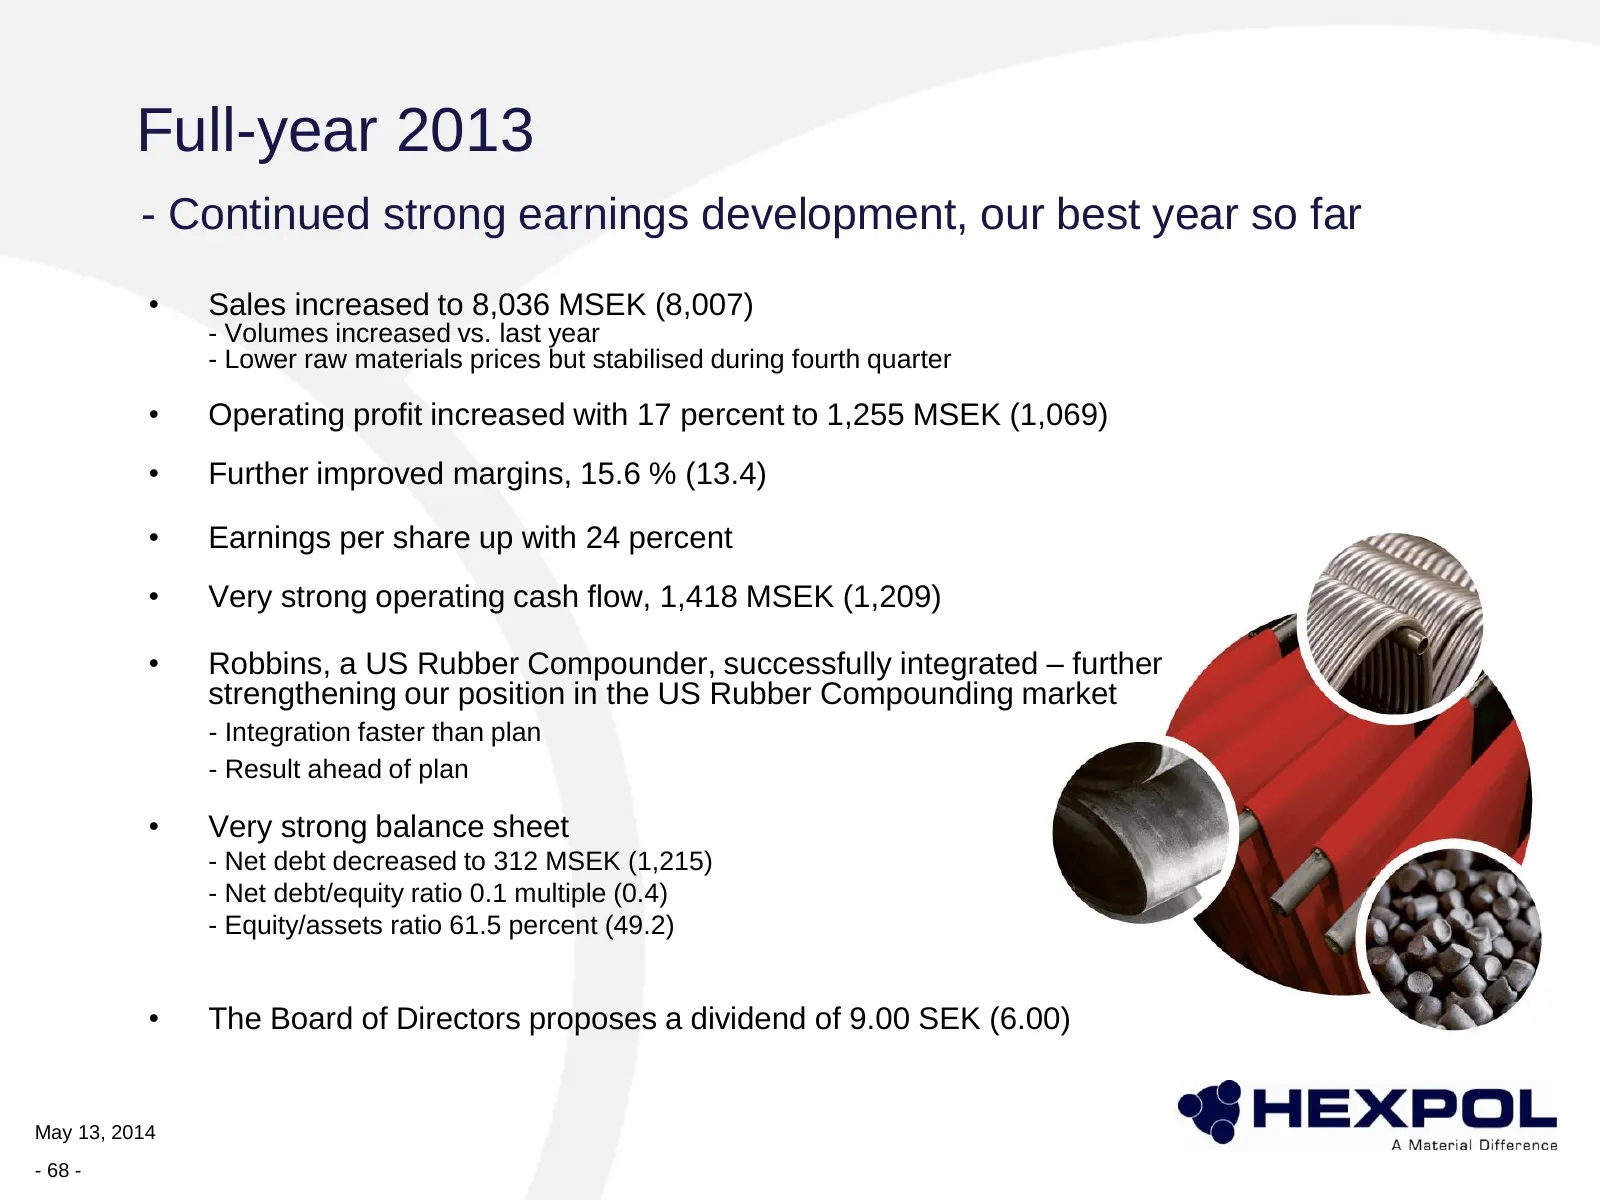
Full-year 2013 - Continued strong earnings development, our best year so far • Sales increased to 8,036 MSEK (8,007) - Volumes increased vs. last year - Lower raw materials prices but stabilised during fourth quarter • Operating profit increased with 17 percent to 1,255 MSEK (1,069) • Further improv
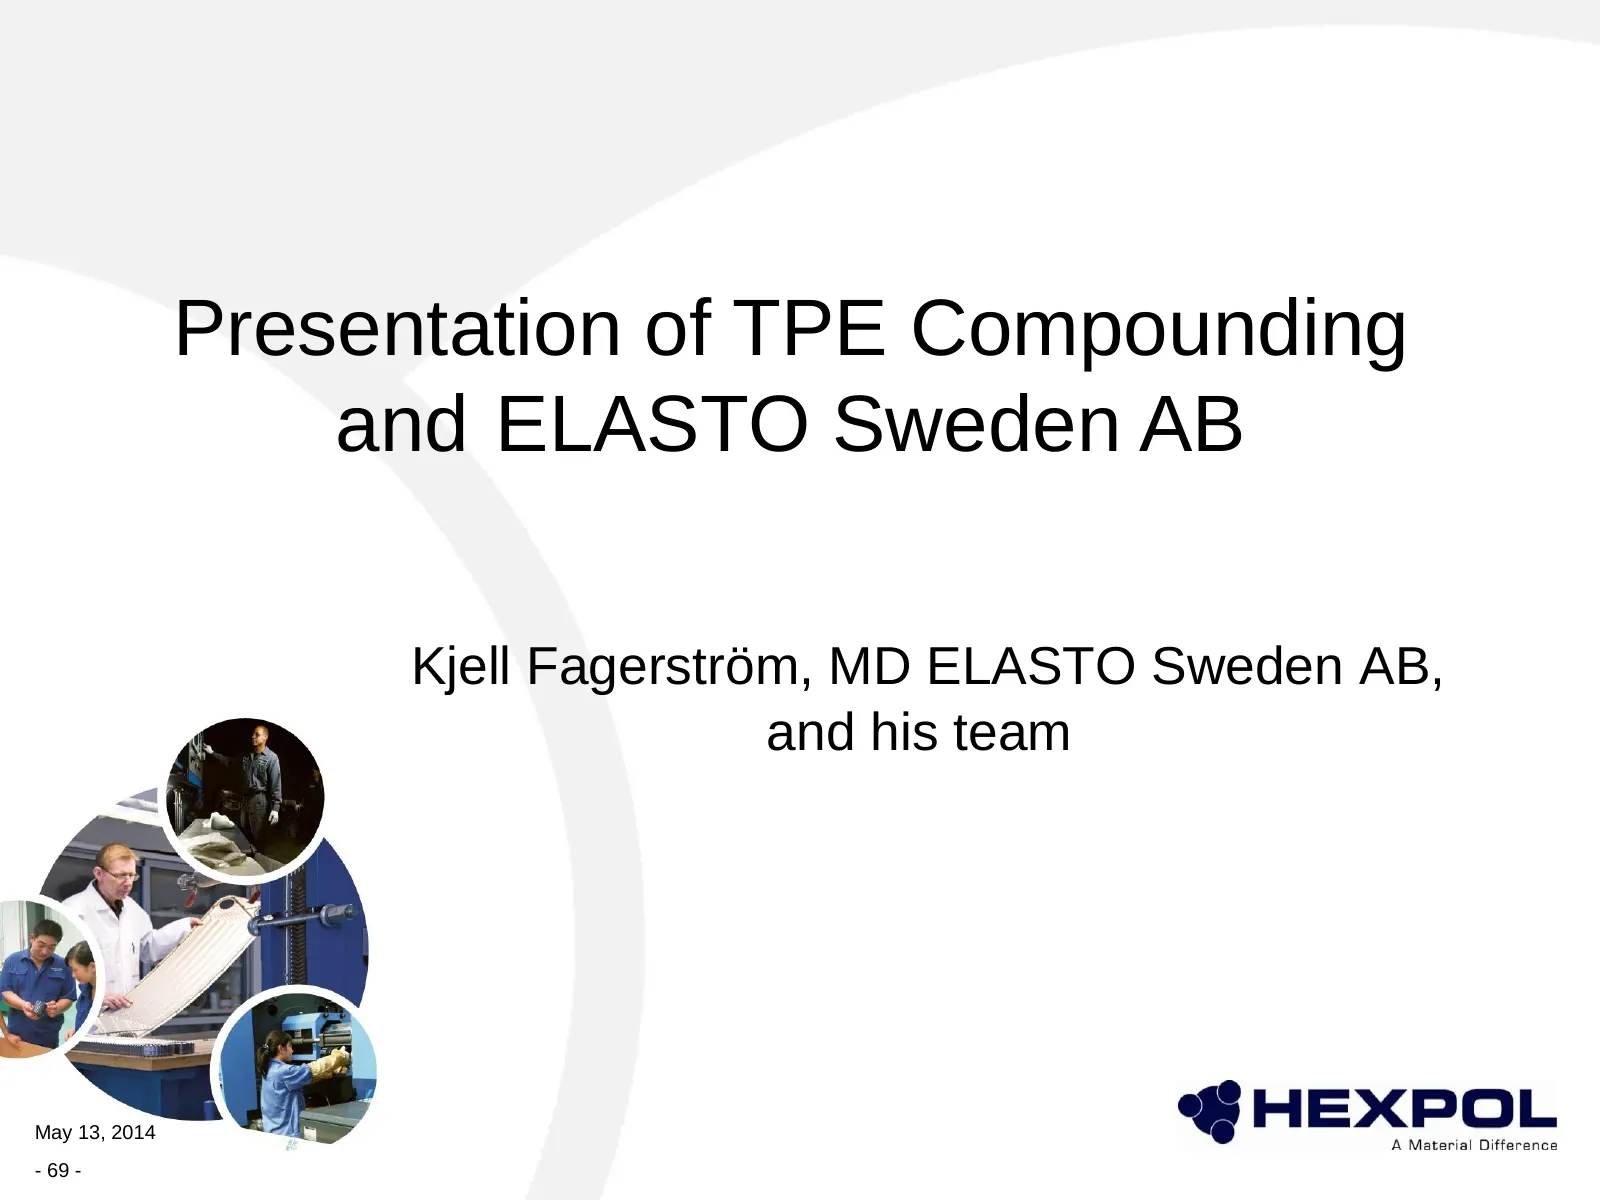
Slide 69: Presentation of TPE Compounding and ELASTO Sweden AB
Presentation of TPE Compounding and ELASTO Sweden AB Kjell Fagerström, MD ELASTO Sweden AB, and his team May 13, 2014 - 69 -
Slide 70: ELASTO Sweden AB
ELASTO Sweden AB May 13, 2014 - 70 -
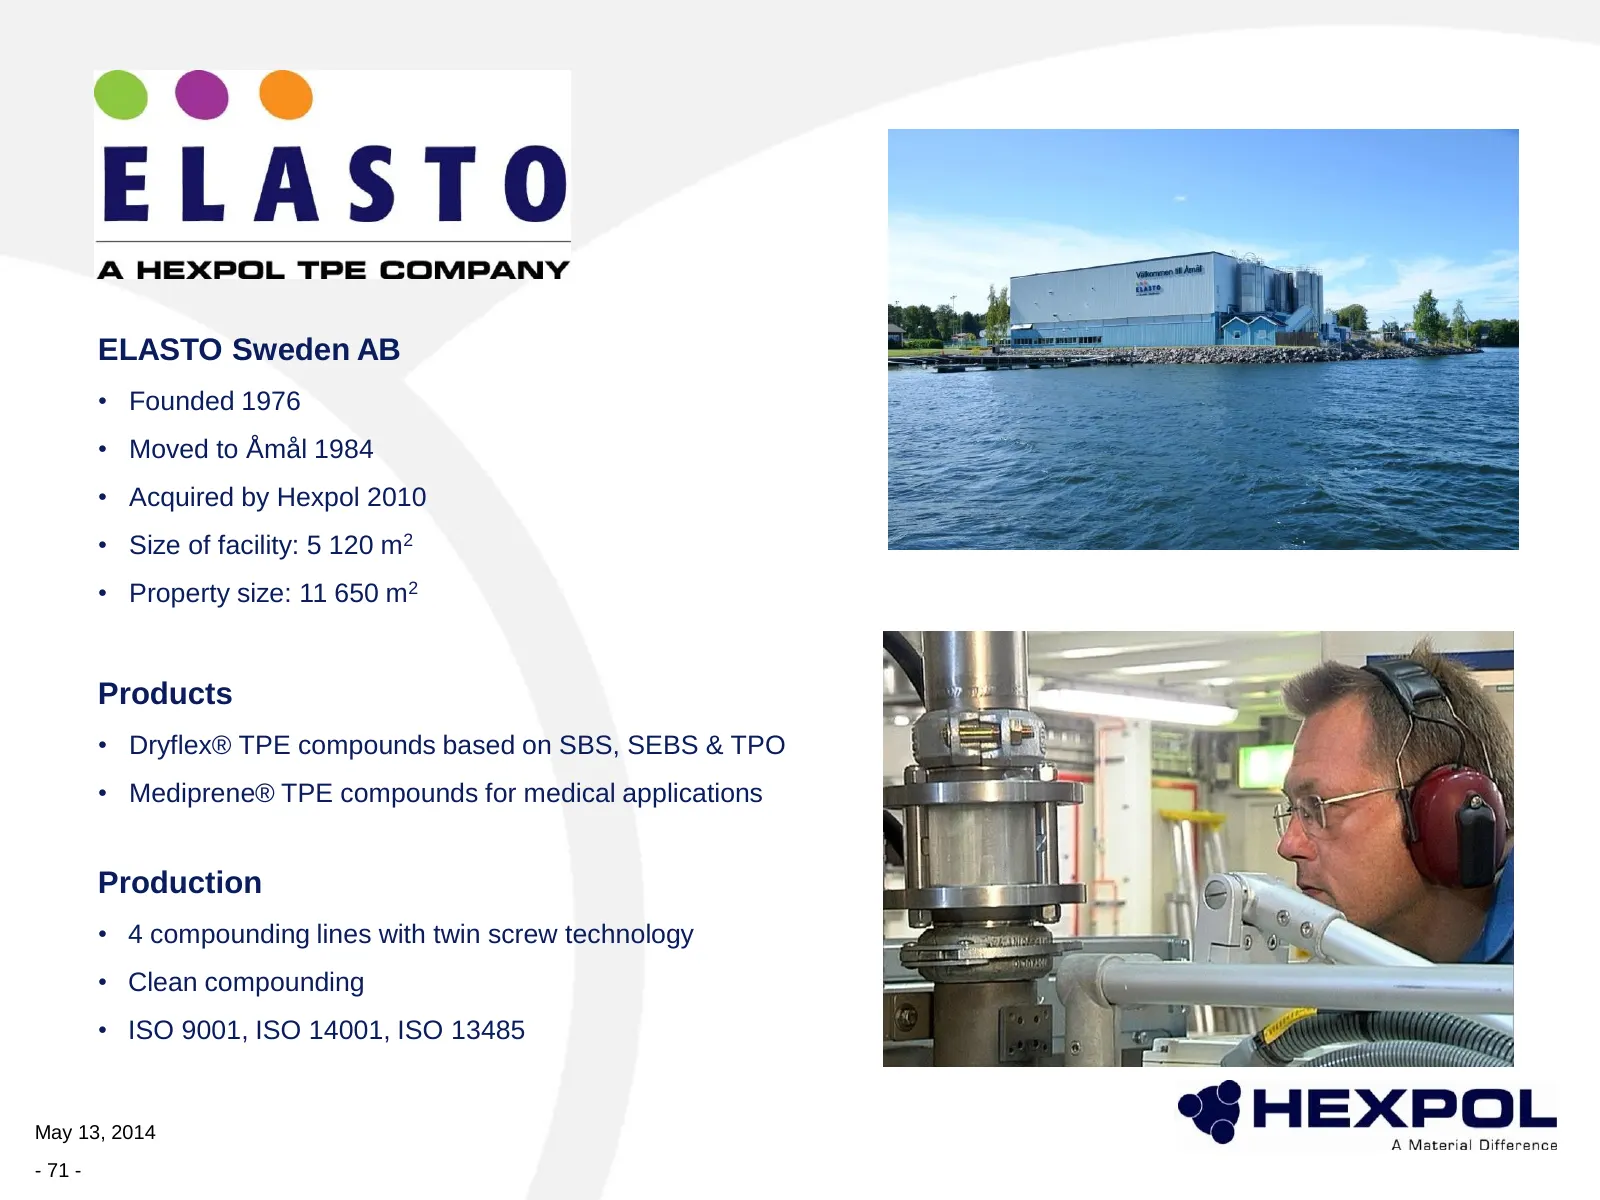
Slide 71: ELASTO Sweden AB
ELASTO Sweden AB • Founded 1976 • Moved to Åmål 1984 • Acquired by Hexpol 2010 • Size of facility: 5 120 m2 • Property size: 11 650 m2 Products • Dryflex® TPE compounds based on SBS, SEBS & TPO • Mediprene® TPE compounds for medical applications Production • 4 compounding lines with twin screw techn
Slide 72: What is TPE?
What is TPE?
Slide 73: Polymer Family Tree
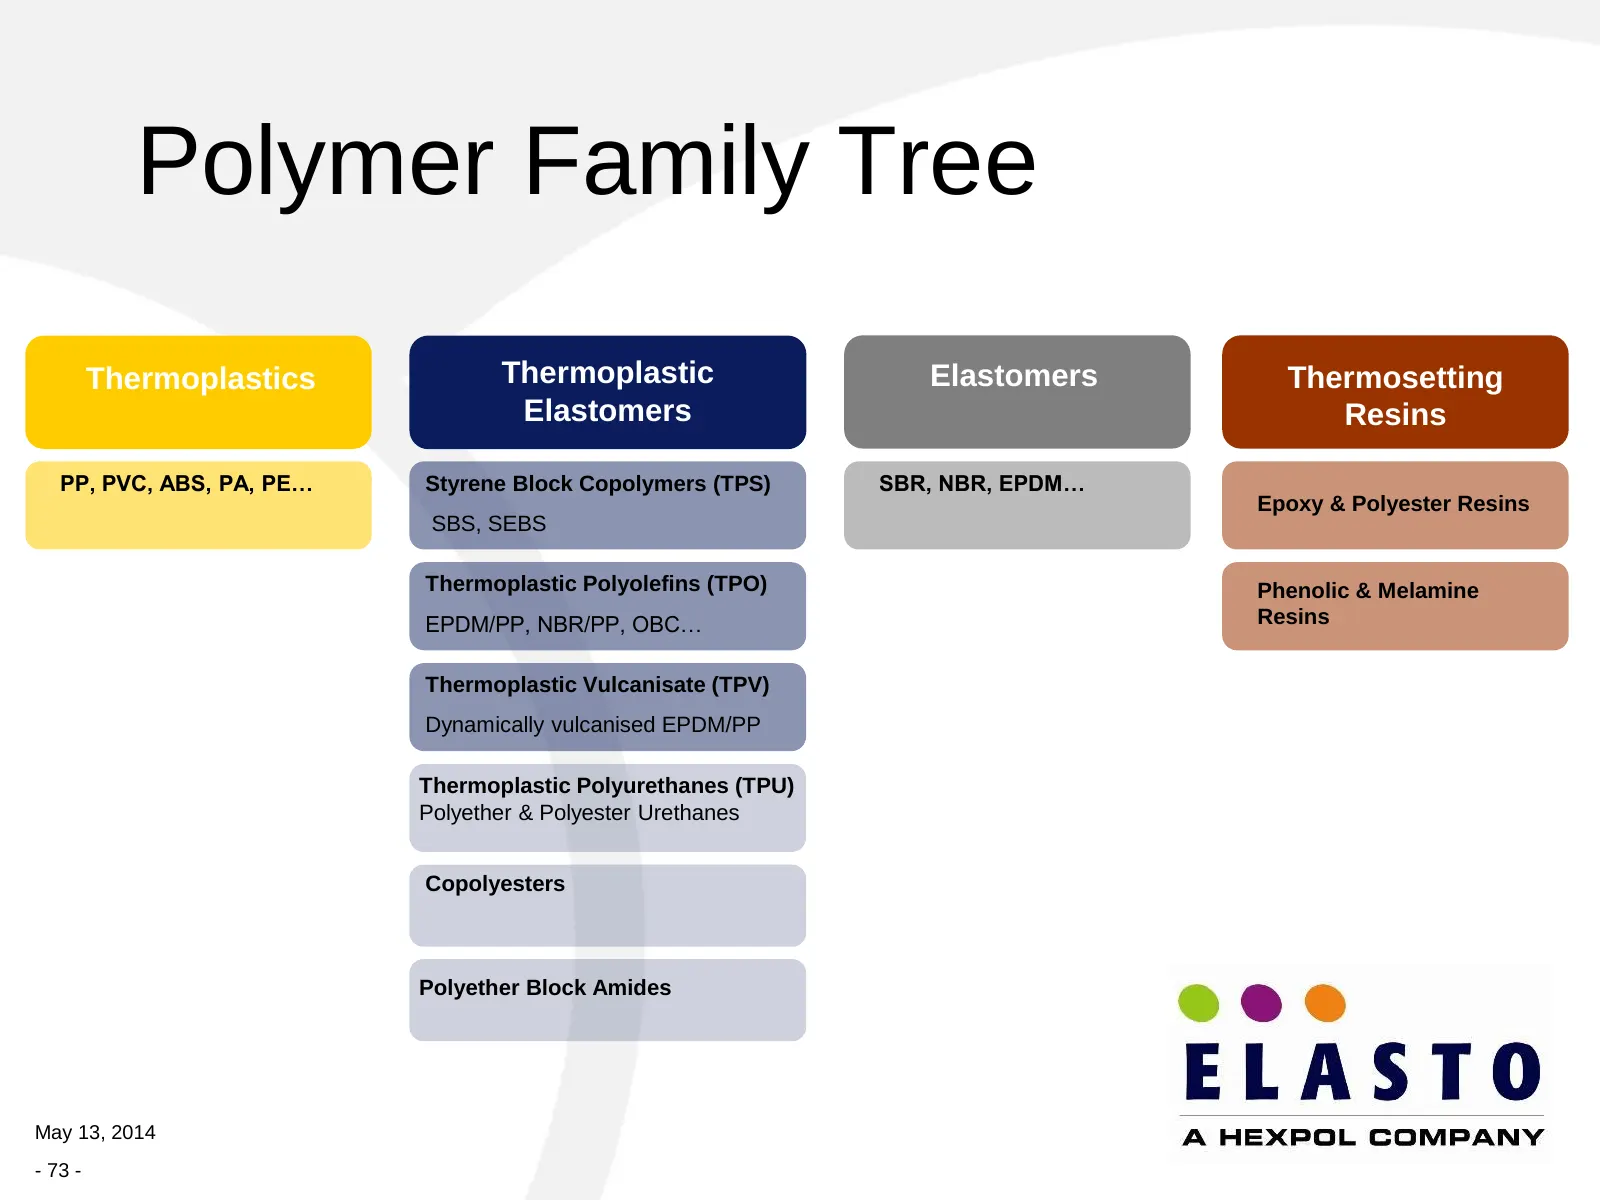
Polymer Family Tree Thermoplastics Thermoplastic Elastomers Thermosetting Elastomers Resins PP, PVC, ABS, PA, PE… Styrene Block Copolymers (TPS) SBR, NBR, EPDM… Epoxy & Polyester Resins SBS, SEBS Thermoplastic Polyolefins (TPO) Phenolic & Melamine EPDM/PP, NBR/PP, OBC… Resins Thermoplastic Vulcanisa
Slide 74: What is TPE?
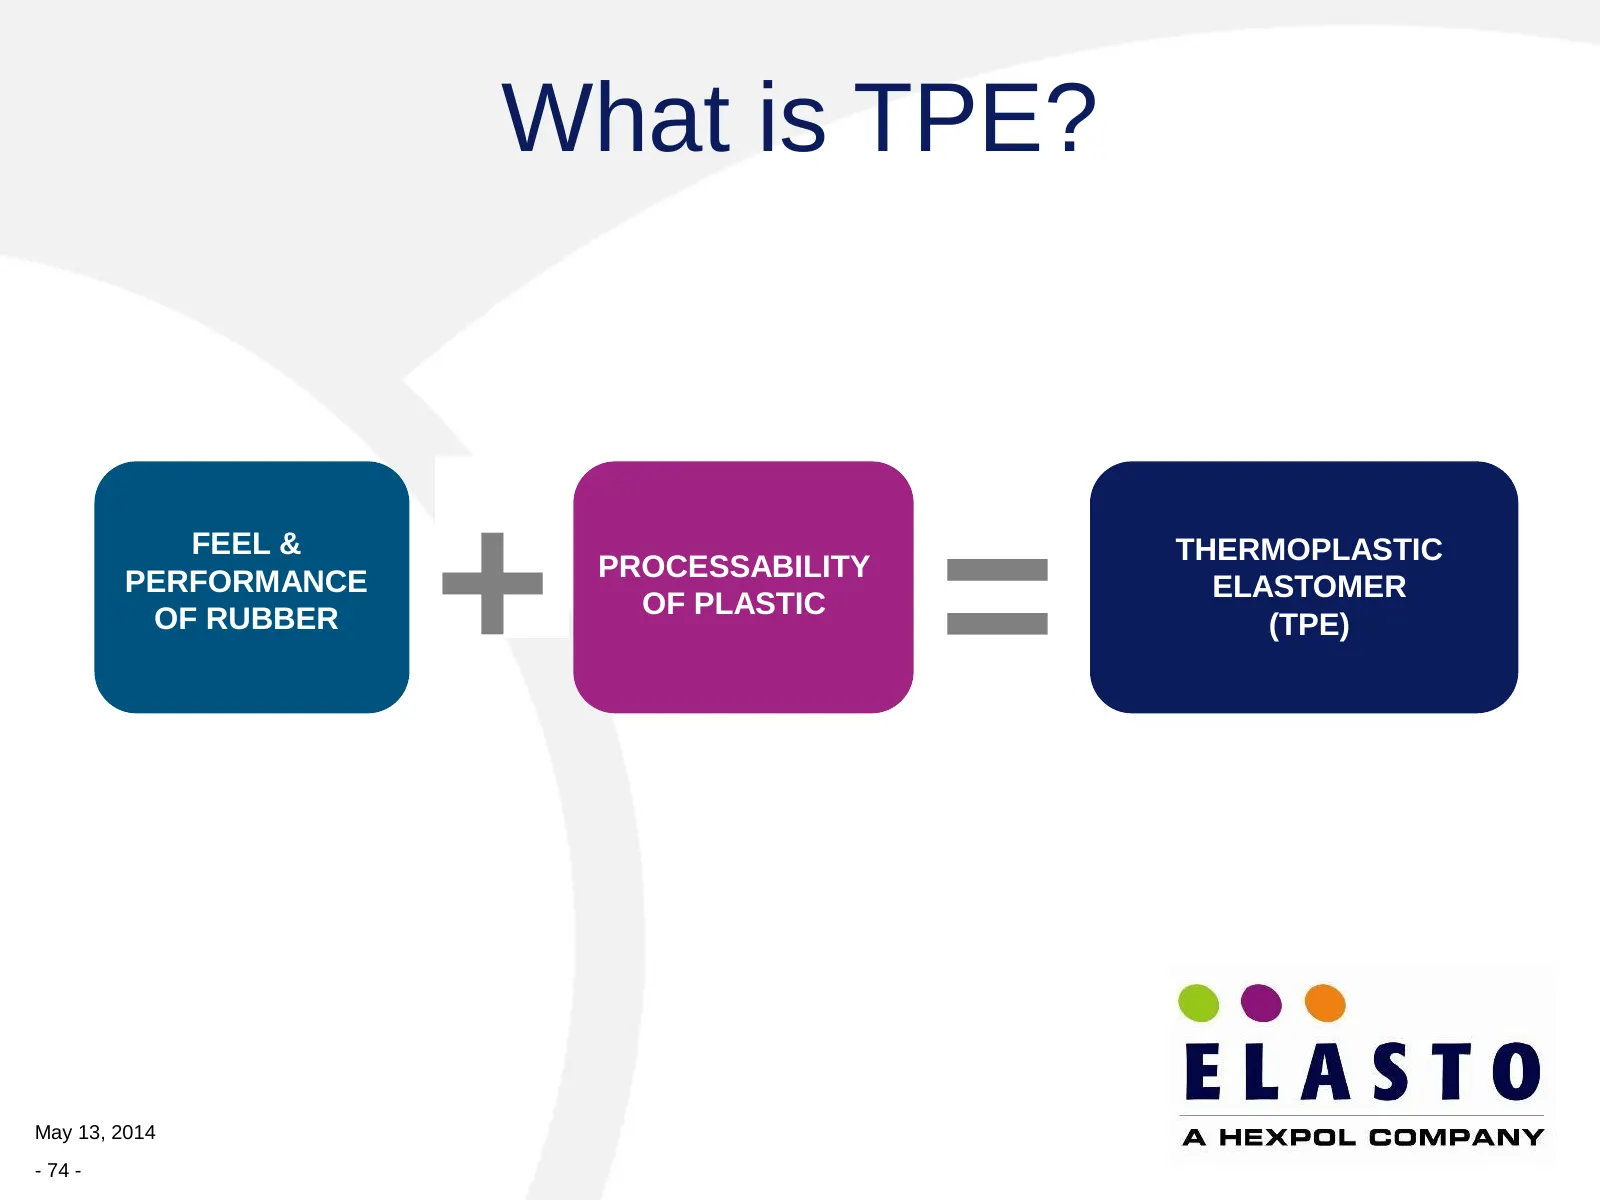
What is TPE? FEEL & PERFORMANCE OF RUBBER + PROCESSABILITY OF PLASTIC = THERMOPLASTIC ELASTOMER (TPE) May 13, 2014 - 74 -
Slide 75: What is a TPE Compound?
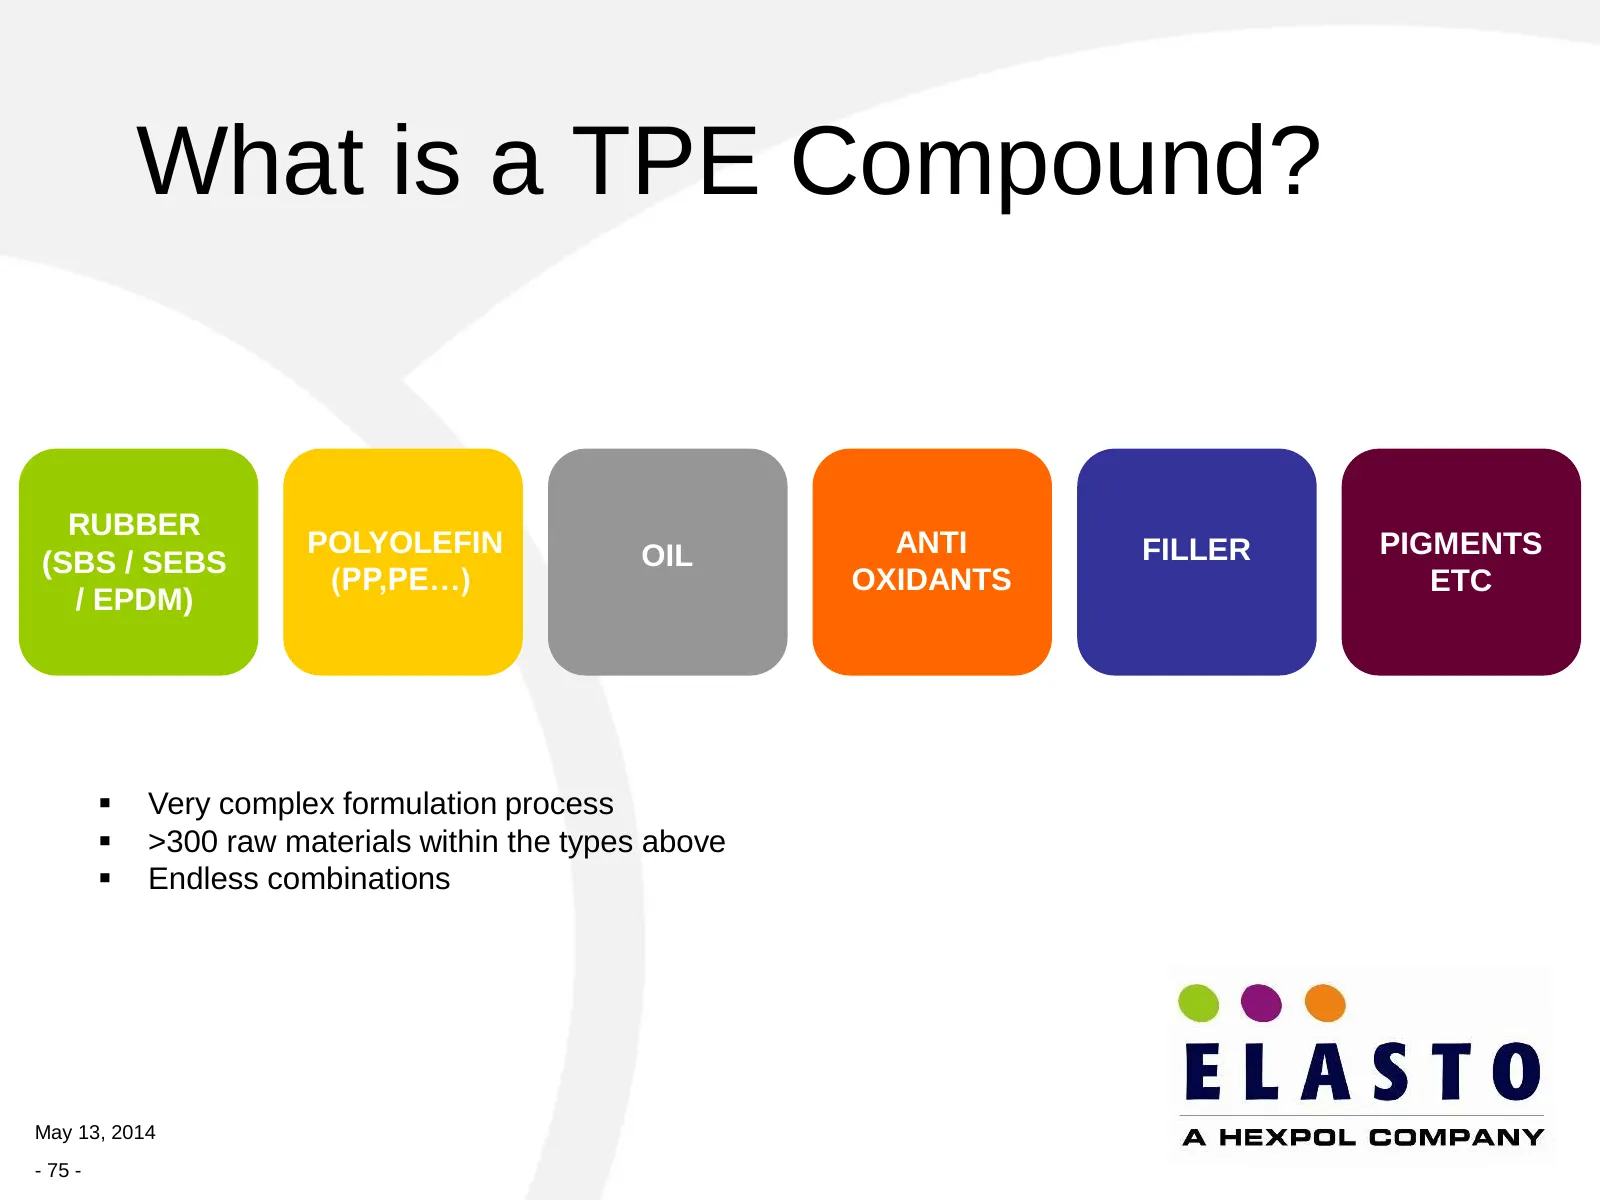
What is a TPE Compound? RUBBER POLYOLEFIN OIL ANTI FILLER PIGMENTS (SBS / SEBS (PP,PE…) OXIDANTS ETC / EPDM) Very complex formulation process >300 raw materials within the types above Endless combinations May 13, 2014 - 75 -
Slide 76: TPE Compounding
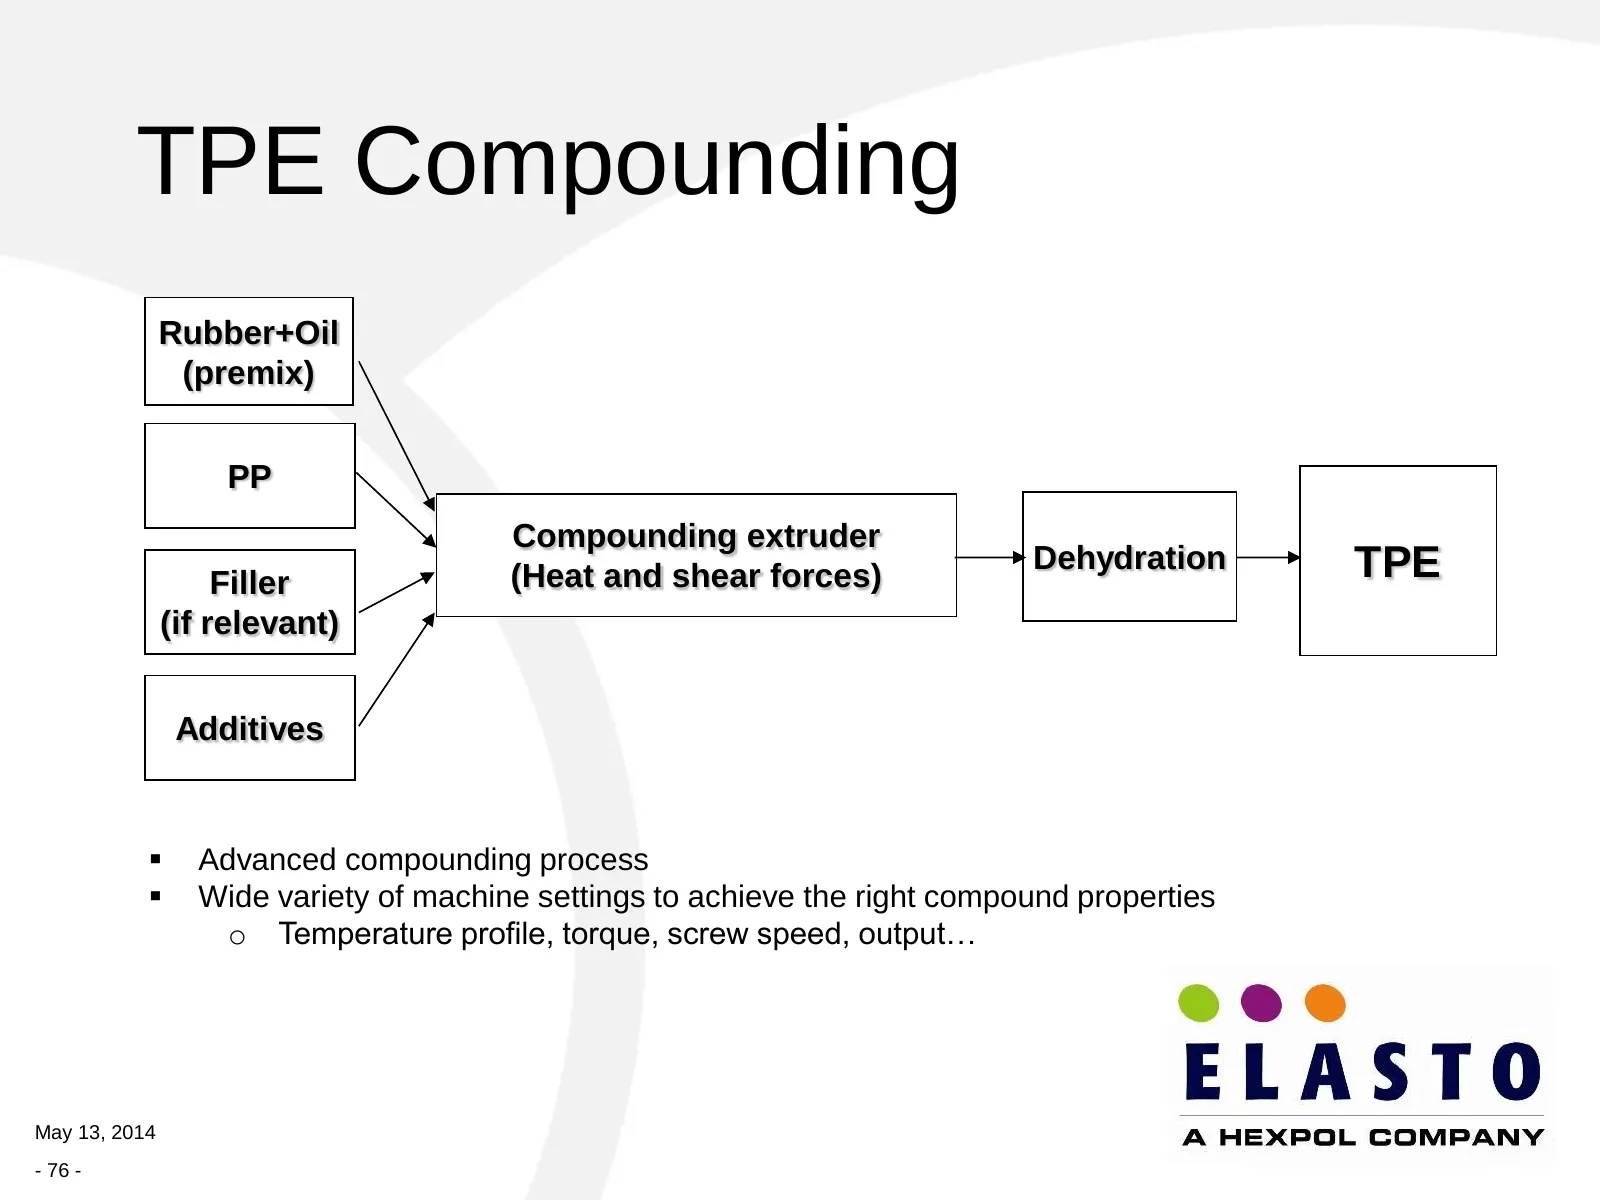
TPE Compounding Rubber+Oil (premix) PP Compounding extruder Dehydration TPE Filler (Heat and shear forces) (if relevant) Additives Advanced compounding process Wide variety of machine settings to achieve the right compound properties o Temperature profile, torque, screw speed, output… May 13, 20
Slide 77: TPE Processing Benefits
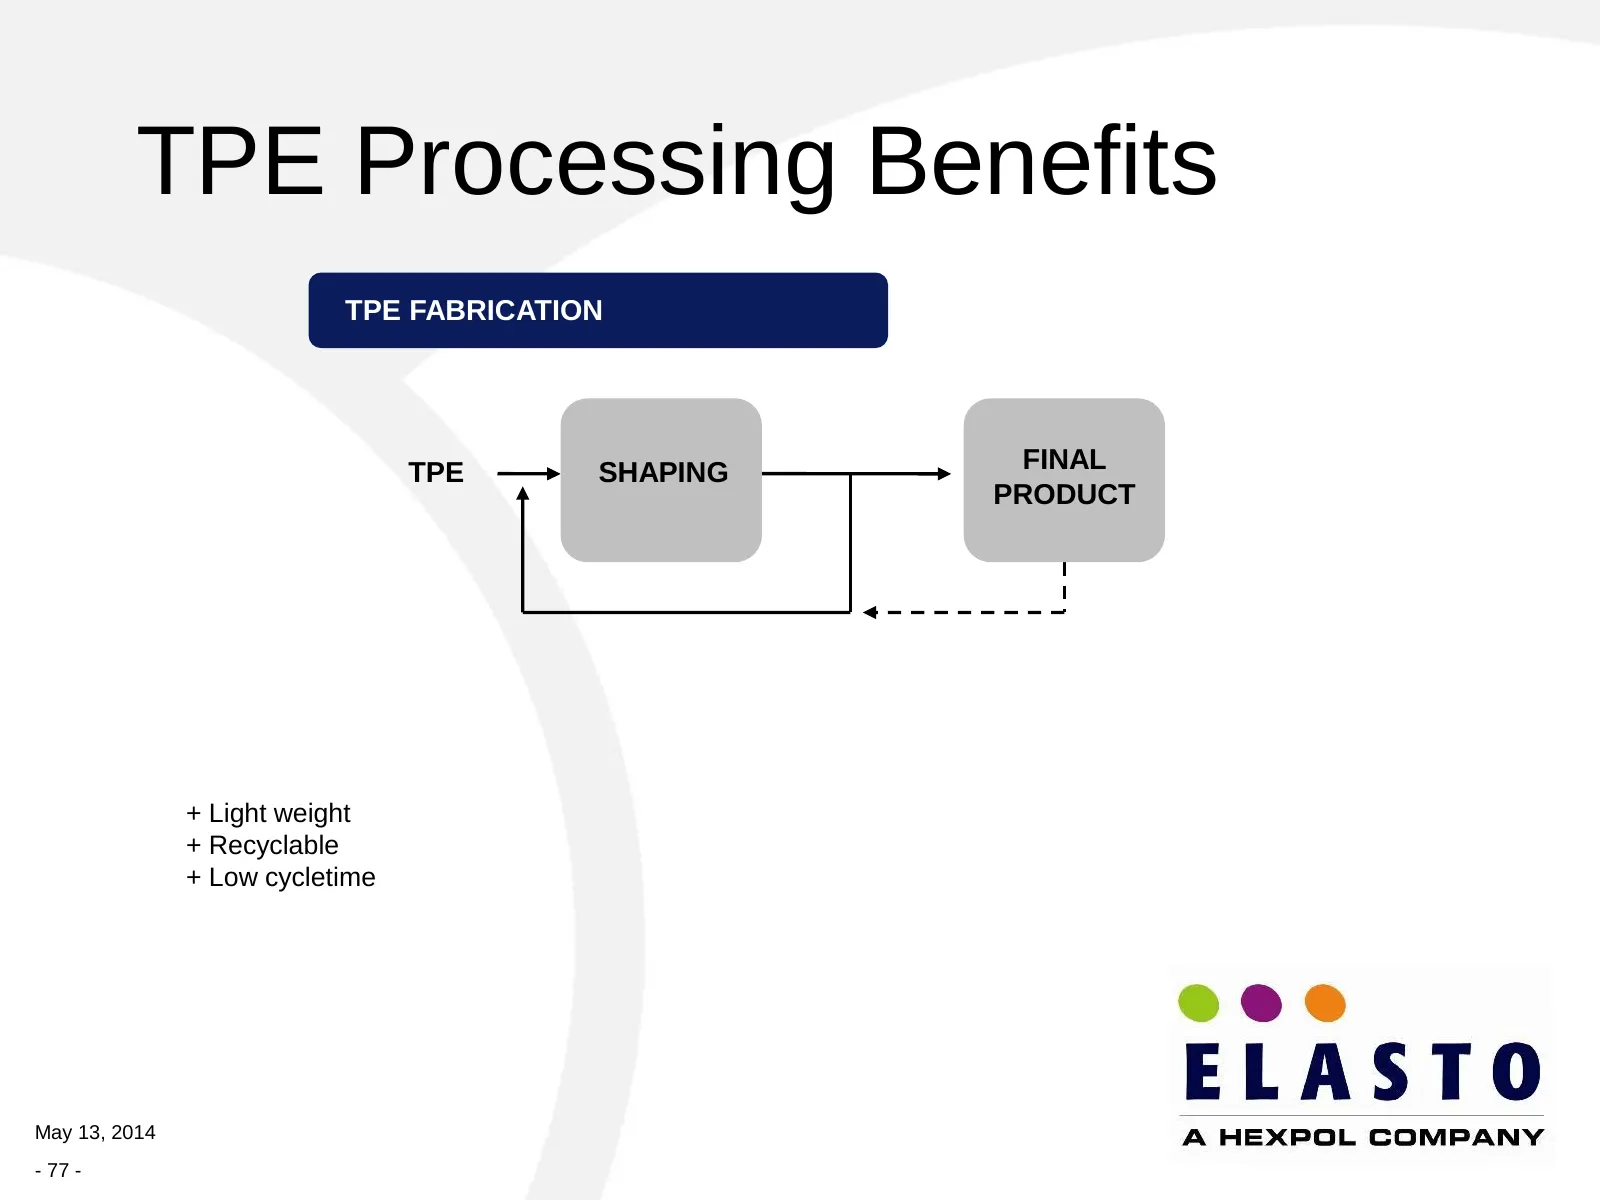
TPE Processing Benefits TPE FABRICATION TPE SHAPING FINAL PRODUCT + Light weight + Recyclable + Low cycletime May 13, 2014 - 77 -
Slide 78: TPE grade properties
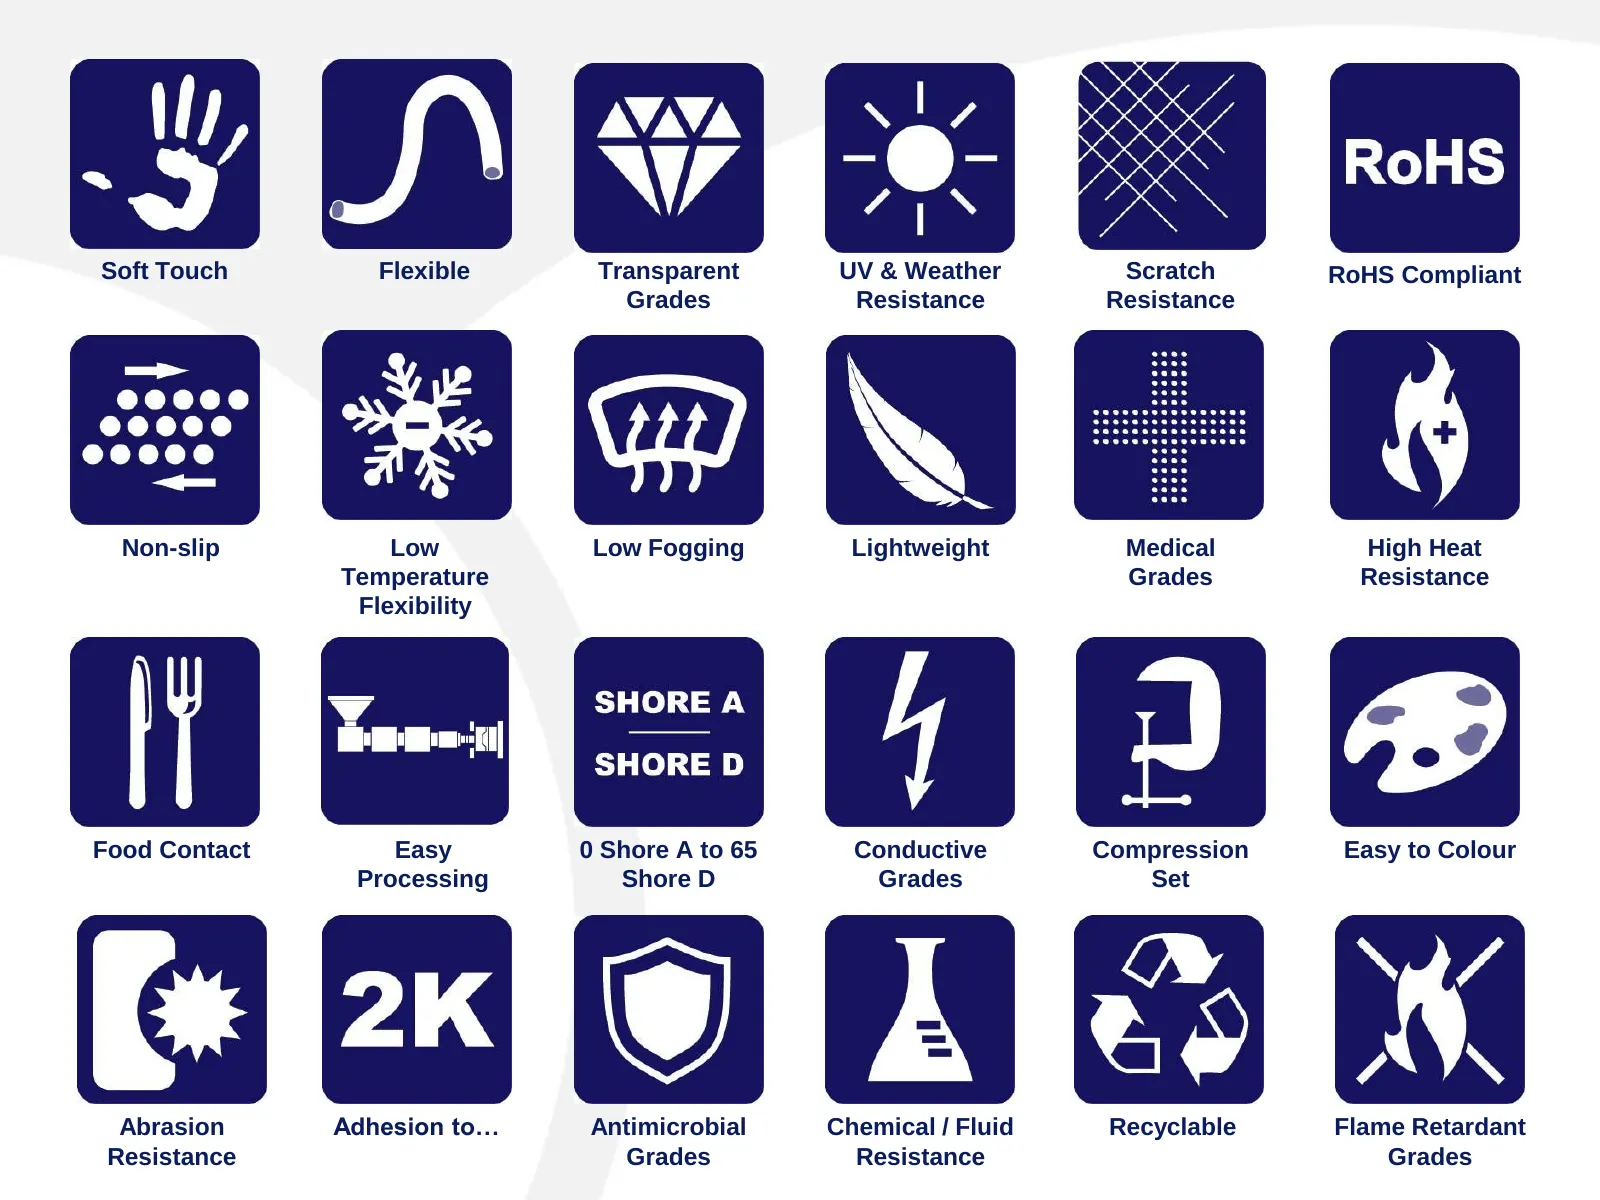
Soft Touch Flexible Transparent UV & Weather Scratch RoHS Compliant Grades Resistance Resistance Non-slip Low Low Fogging Lightweight Medical High Heat Temperature Grades Resistance Flexibility Food Contact Easy 0 Shore A to 65 Conductive Compression Easy to Colour Processing Shore D Grades Set Abra
Slide 79: ELASTO Sweden
ELASTO Sweden
Slide 80: Quality brands
Quality brands May 13, 2014 - 80 -
Slide 81: Long and extensive experience
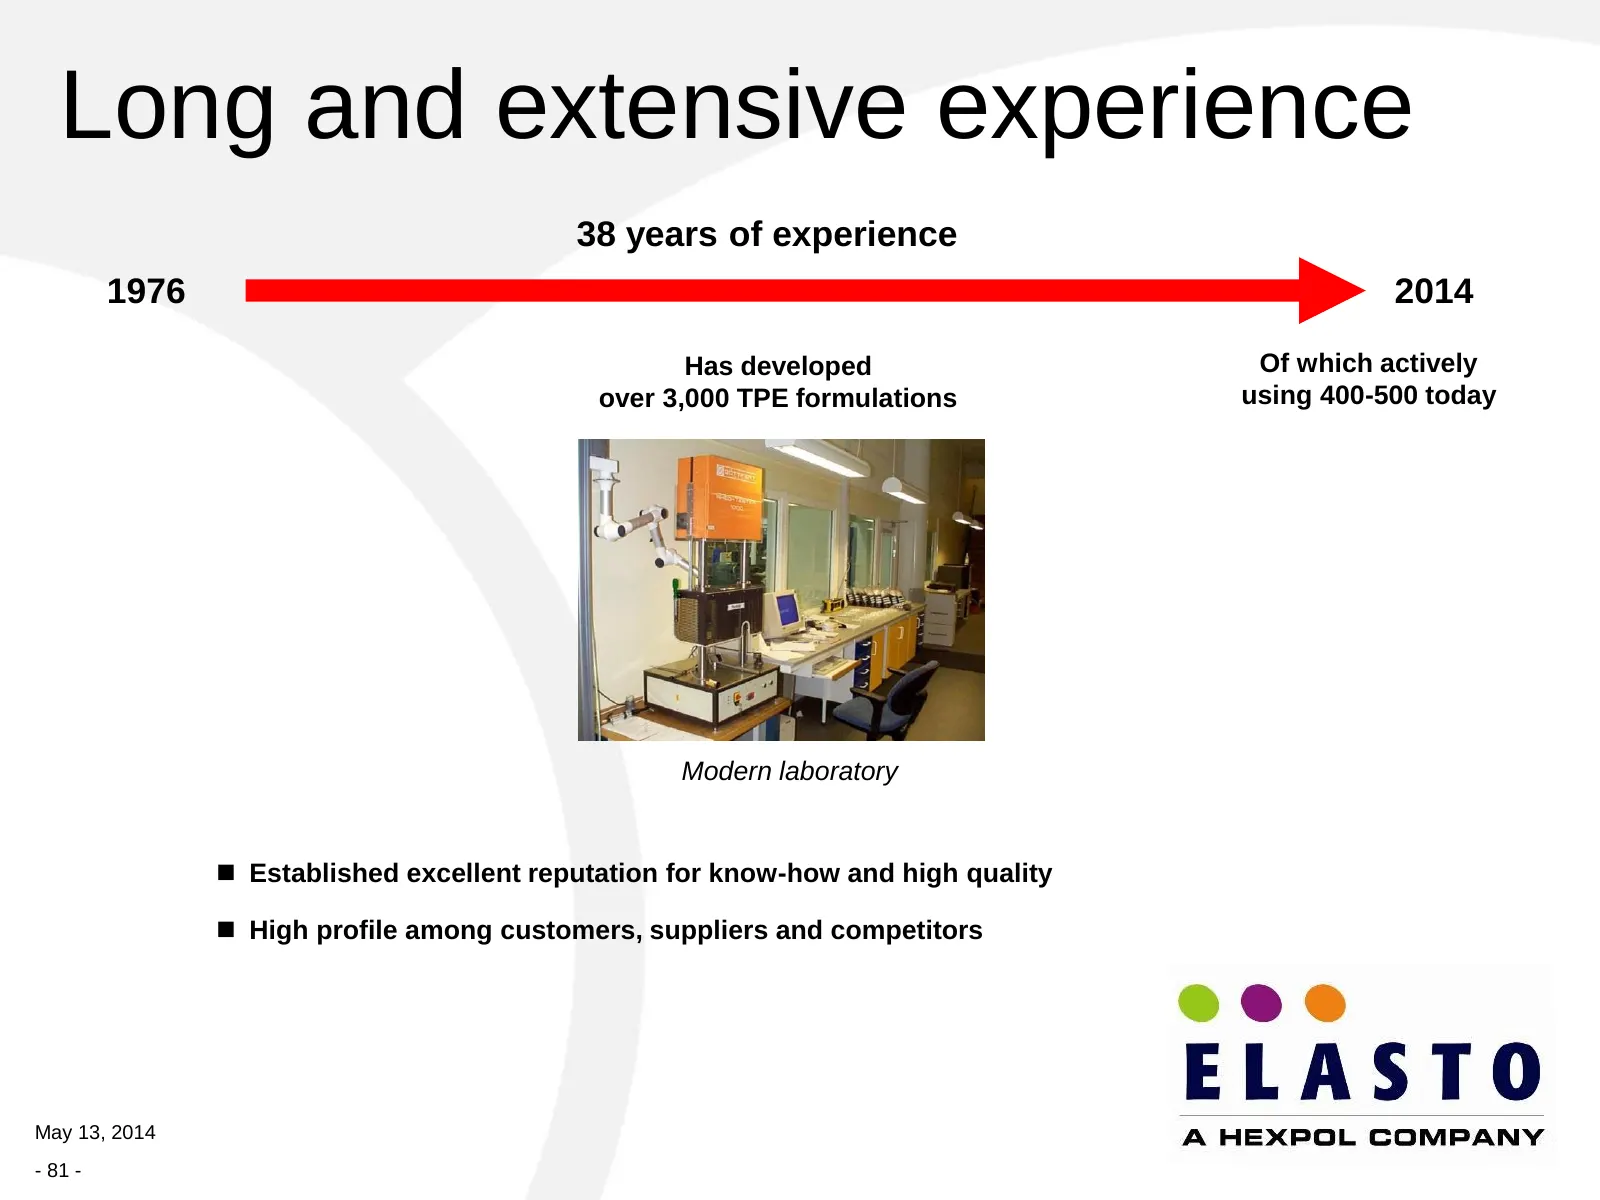
Long and extensive experience 38 years of experience 1976 2014 Has developed Of which actively over 3,000 TPE formulations using 400-500 today Modern laboratory Established excellent reputation for know-how and high quality High profile among customers, suppliers and competitors May 13, 2014 - 8
Slide 82: Key attractions of ELASTO Sweden
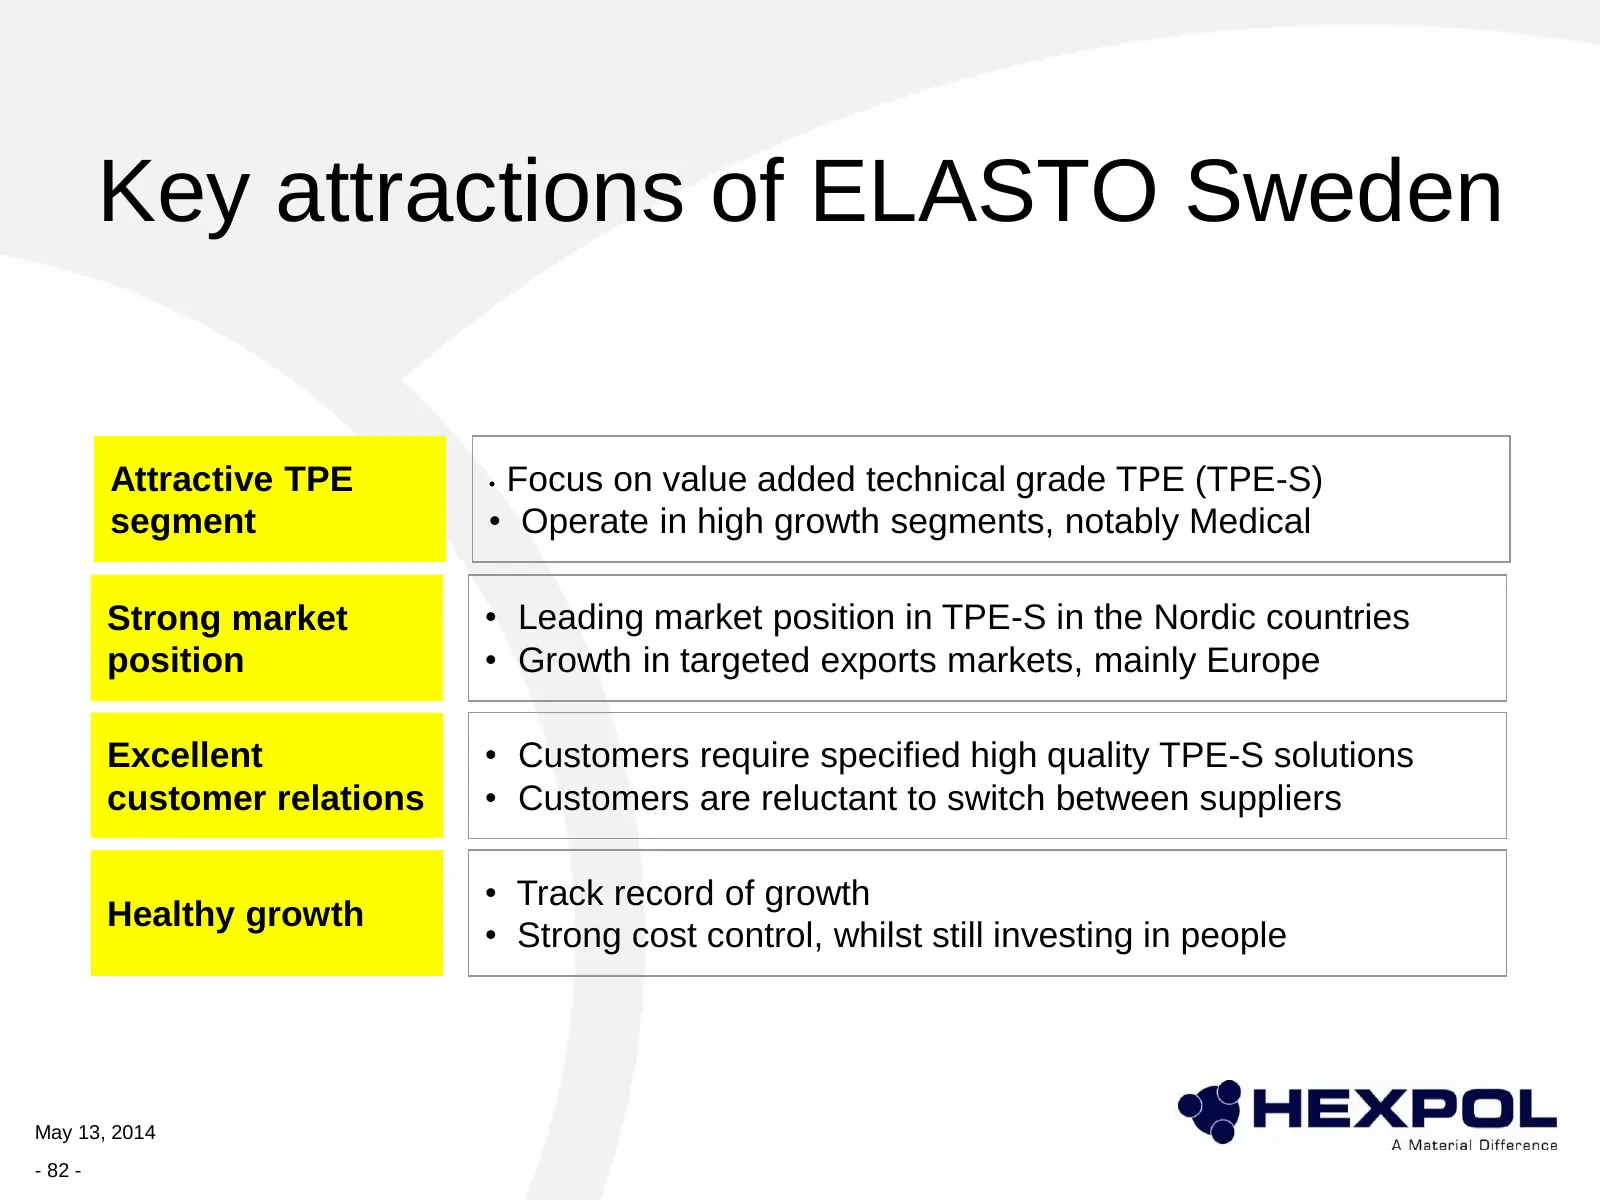
Key attractions of ELASTO Sweden Attractive TPE •Focus on value added technical grade TPE (TPE-S) segment • Operate in high growth segments, notably Medical Strong market • Leading market position in TPE-S in the Nordic countries position • Growth in targeted exports markets, mainly Europe Excellent
Slide 83: State of the art production
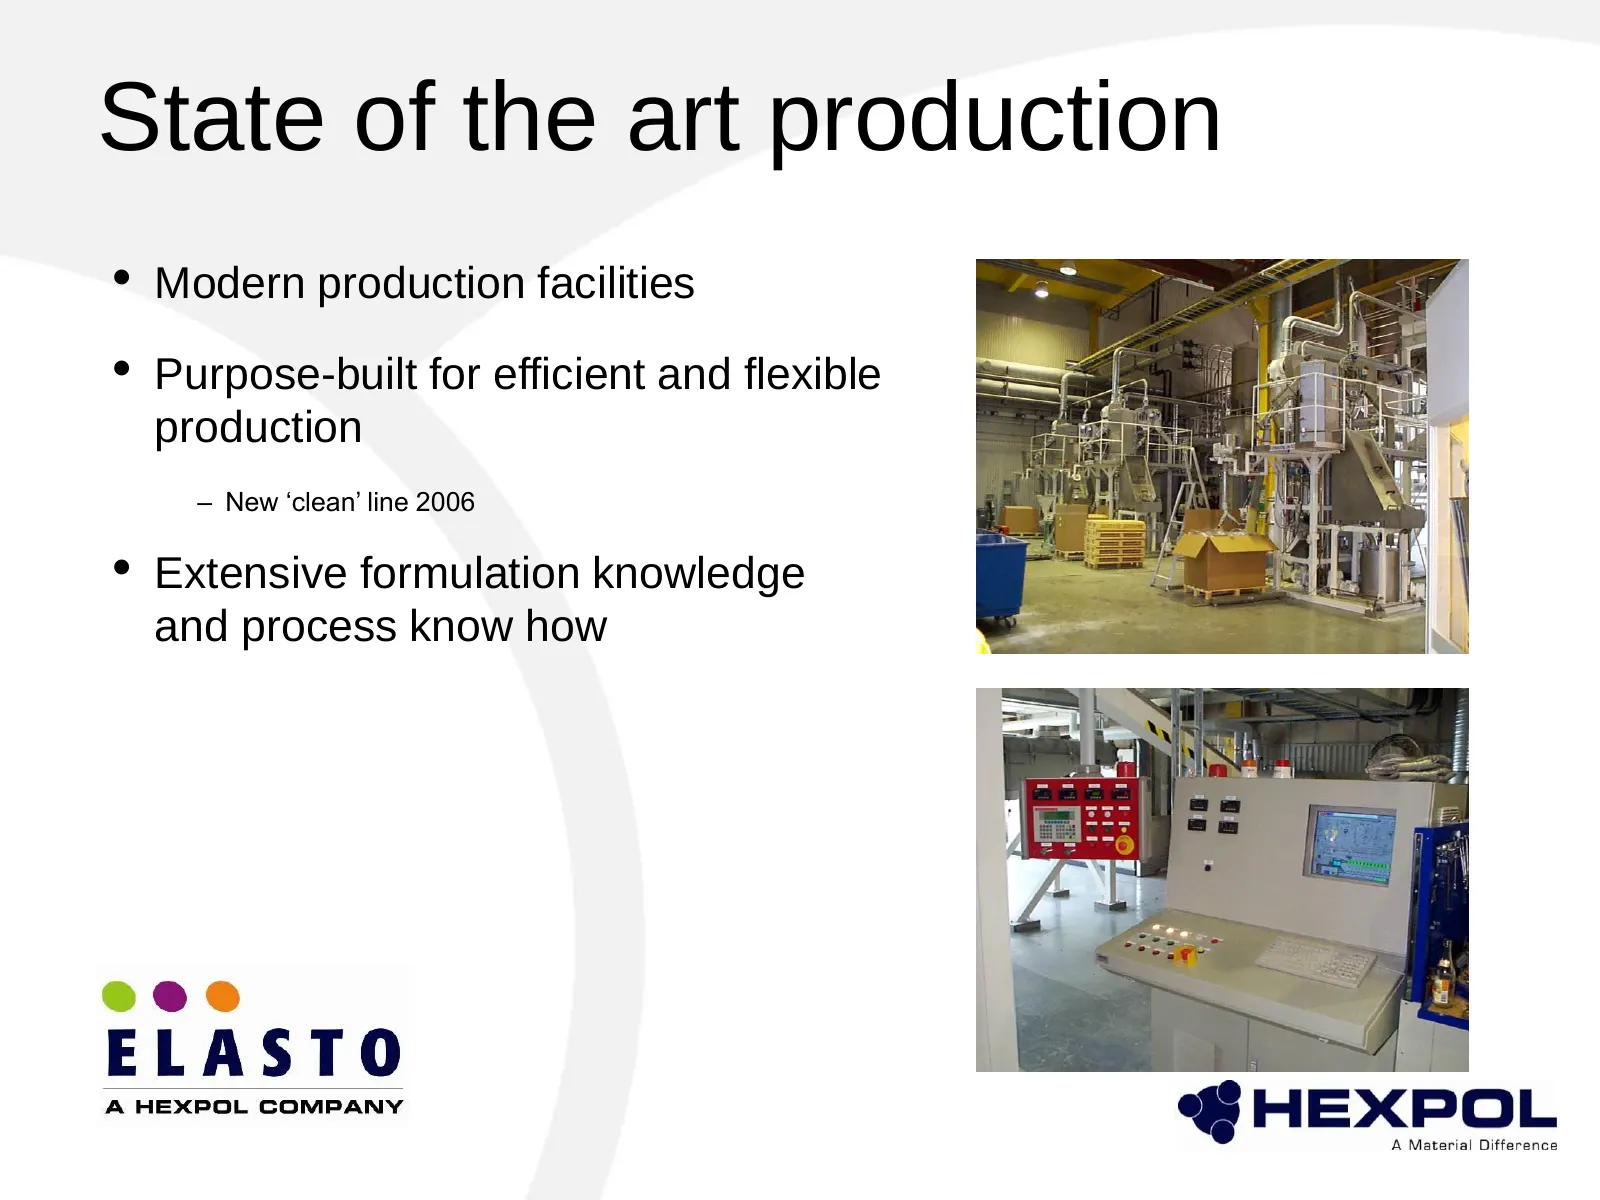
State of the art production • Modern production facilities • Purpose-built for efficient and flexible production – New ‘clean’ line 2006 • Extensive formulation knowledge and process know how
Slide 84: Success factors
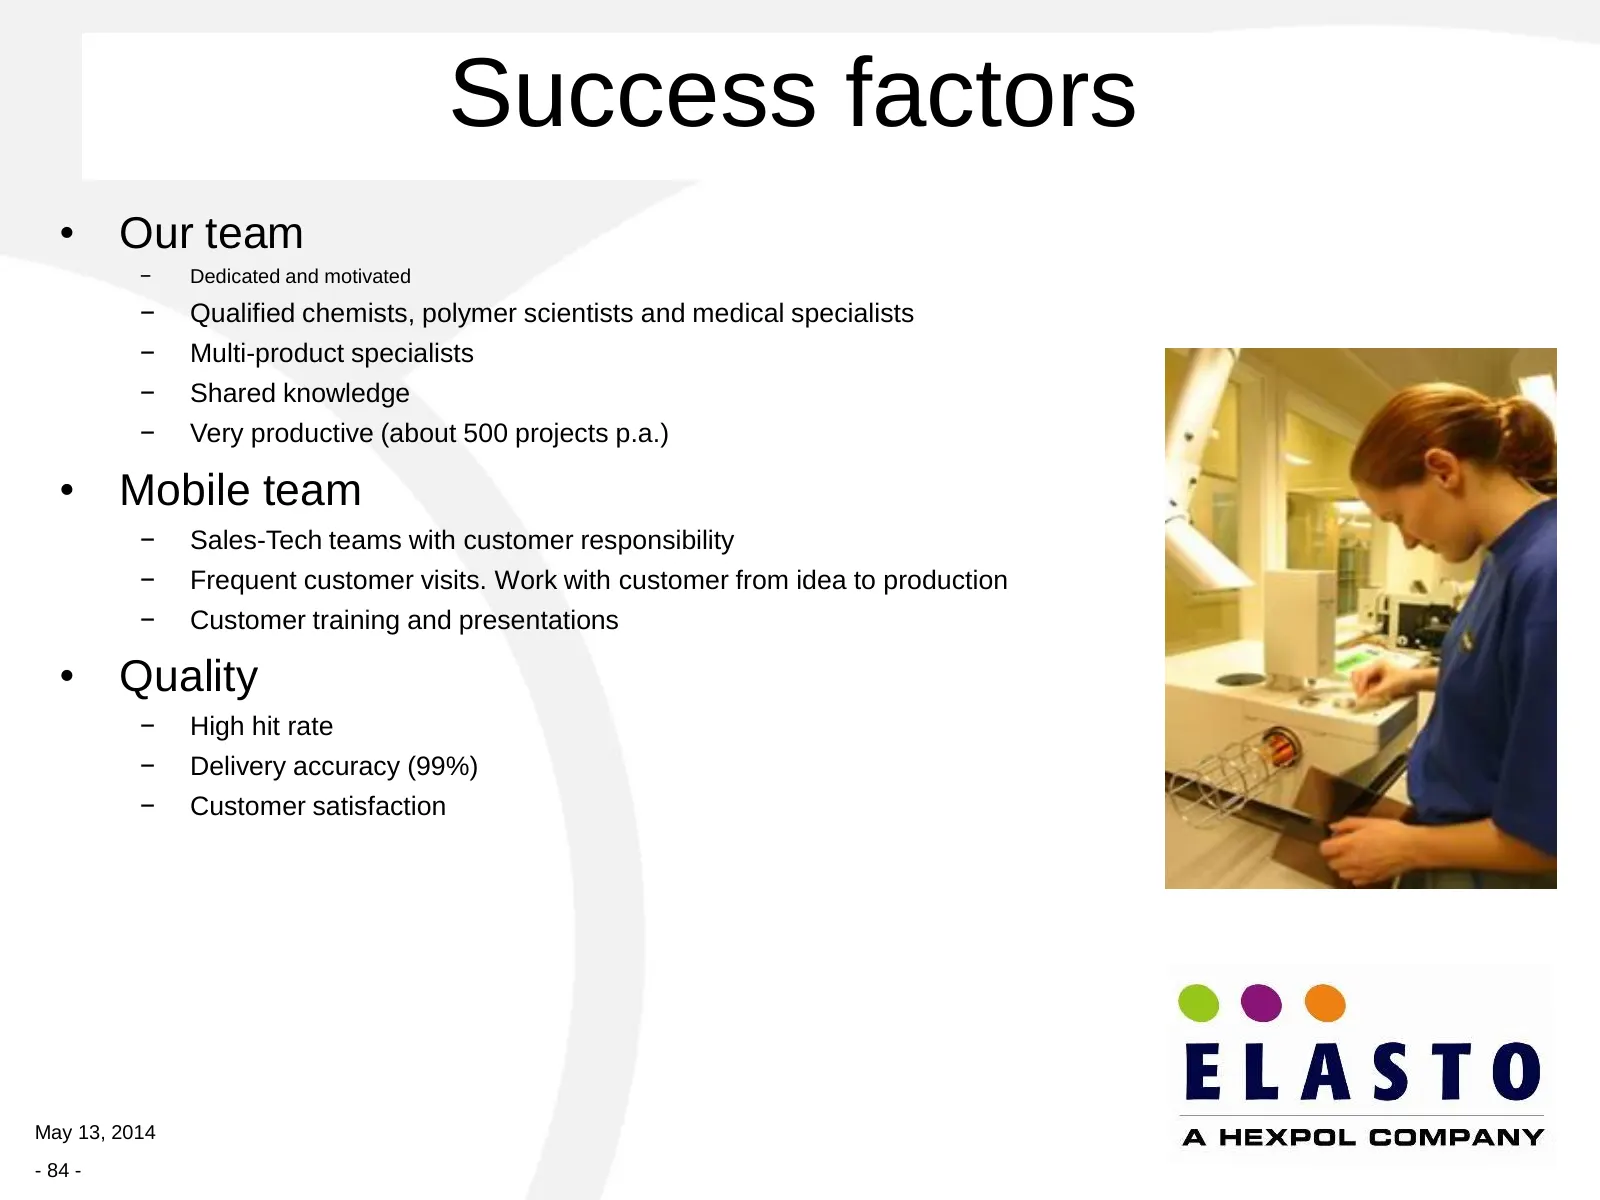
Success factors • Our team − Dedicated and motivated − Qualified chemists, polymer scientists and medical specialists − Multi-product specialists − Shared knowledge − Very productive (about 500 projects p.a.) • Mobile team − Sales-Tech teams with customer responsibility − Frequent customer visits. W
Slide 85: Presentation of HEXPOL TPE Compounding
Presentation of HEXPOL TPE Compounding Ralph Wolkener & Carsten Rüter Presidents HEXPOL Compounding Europe/Asia May 13, 2014 - 85 -
Slide 86: HEXPOL TPE Capital Markets Day 2014
HEXPOL TPE Capital Markets Day 2014
Slide 87: Agenda
Agenda: 1. Organization/facilities 2. Target markets 3. Commercial organisation 4. Highlights 2013/2014 5. Technical organisation 6. Product developments May 13, 2014 - 87 -
Slide 88: Organisation/facilities
Organisation/facilities
Slide 89: Organizational Chart
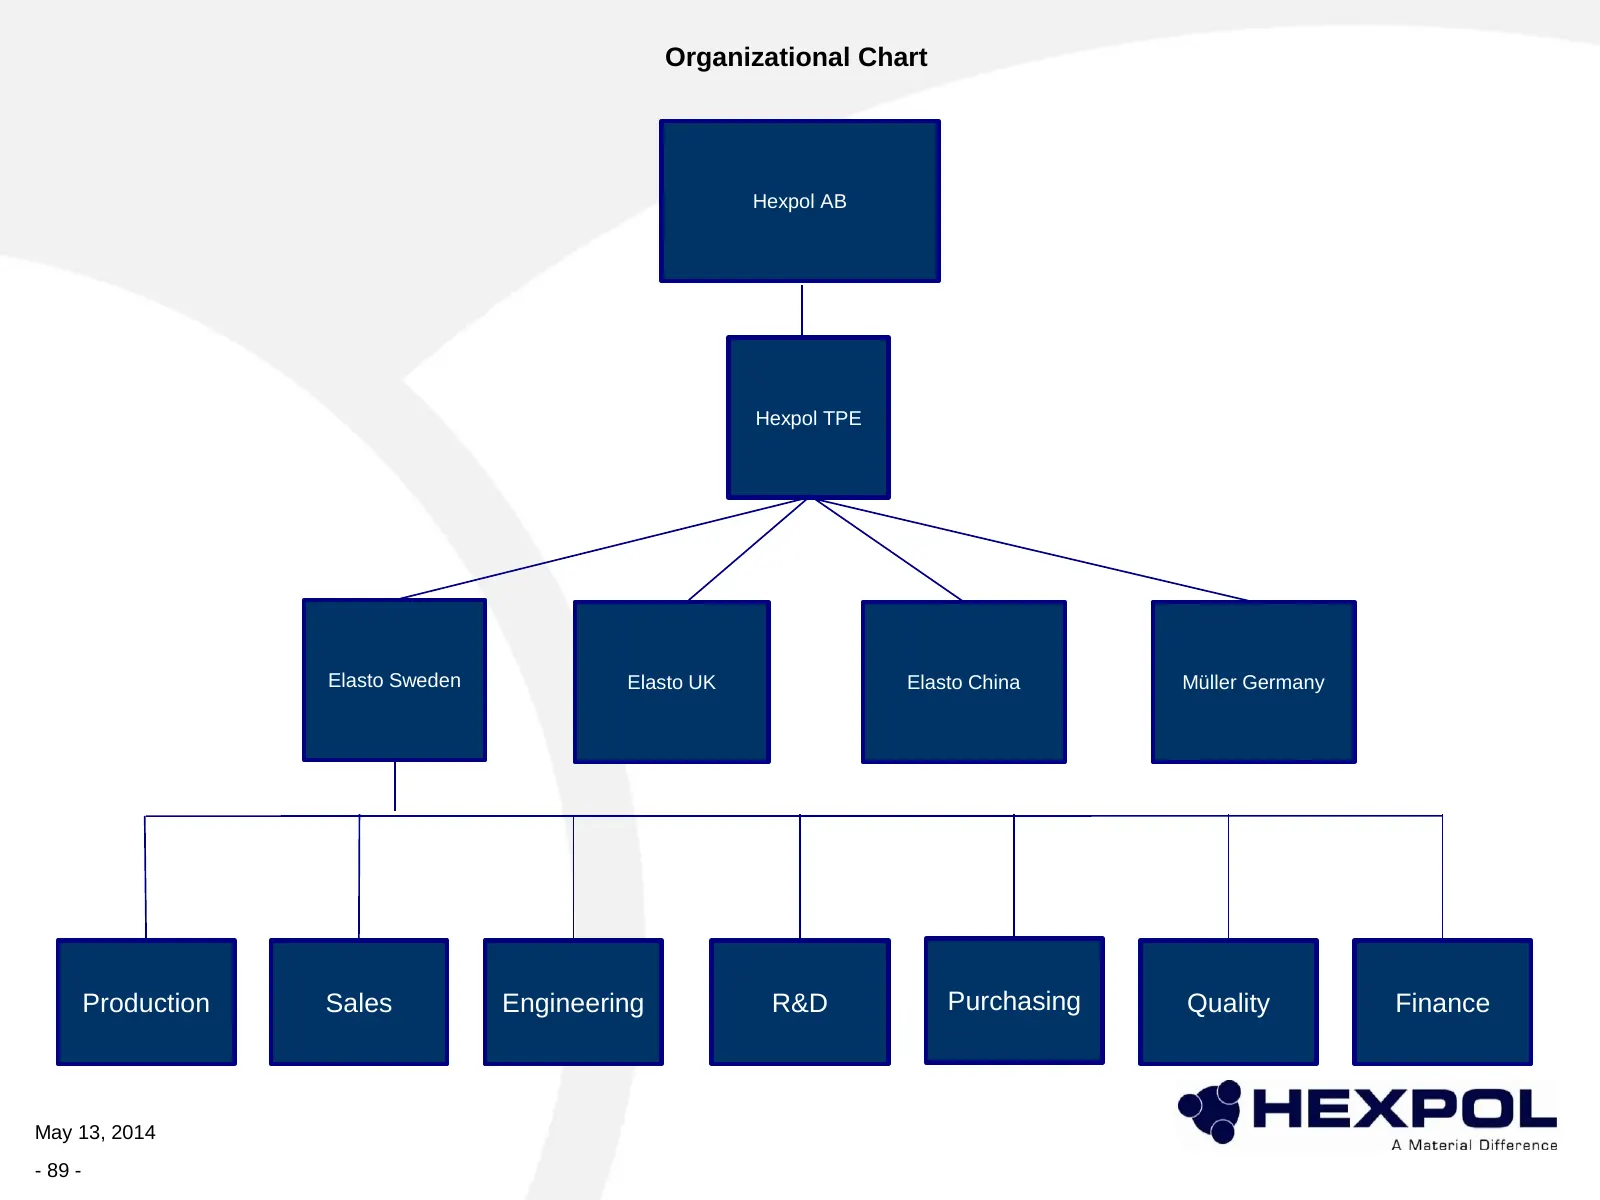
Organizational Chart Hexpol AB Hexpol TPE Elasto Sweden Elasto UK Elasto China Müller Germany Production Sales Engineering R&D Purchasing Quality Finance May 13, 2014 - 89 -
Slide 90: European production sites and capacity
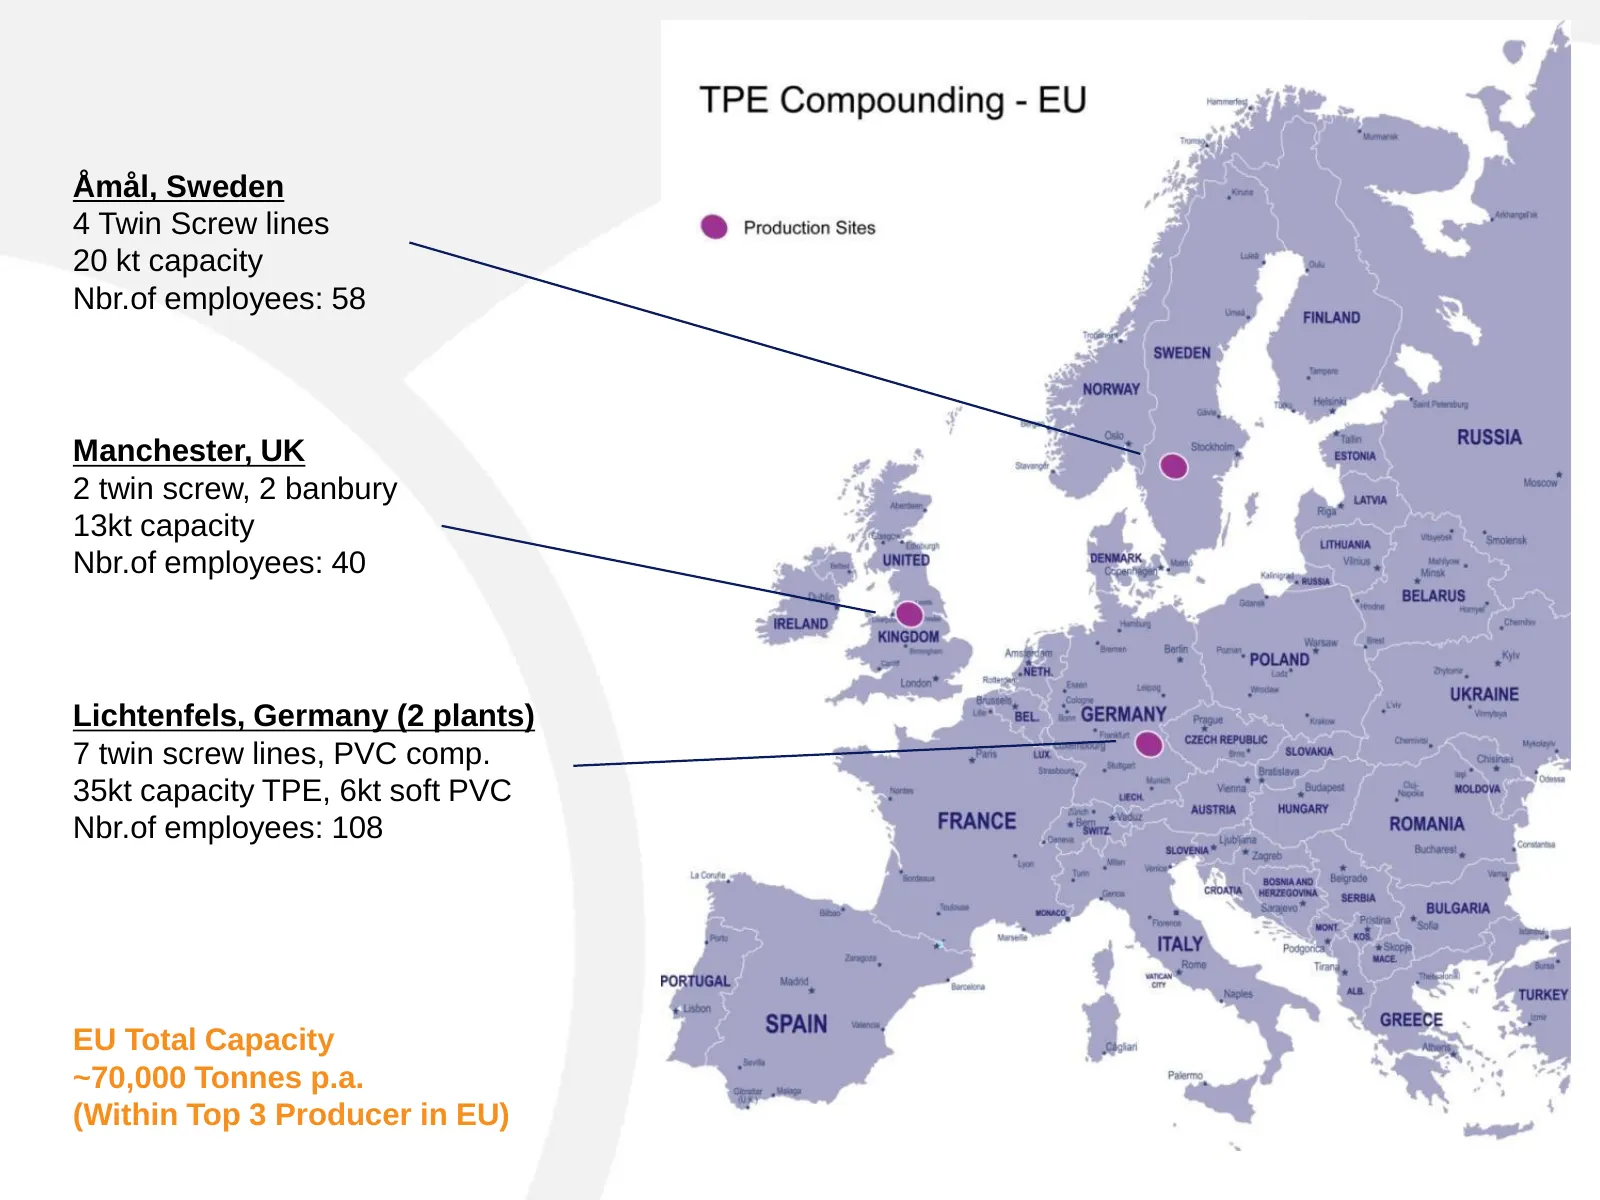
Åmål, Sweden 4 Twin Screw lines 20 kt capacity Nbr.of employees: 58 Manchester, UK 2 twin screw, 2 banbury 13kt capacity Nbr.of employees: 40 Lichtenfels, Germany (2 plants) 7 twin screw lines, PVC comp. 35kt capacity TPE, 6kt soft PVC Nbr.of employees: 108 EU Total Capacity ~70,000 Tonnes p.a. (Wit
Slide 91: Foshan, China
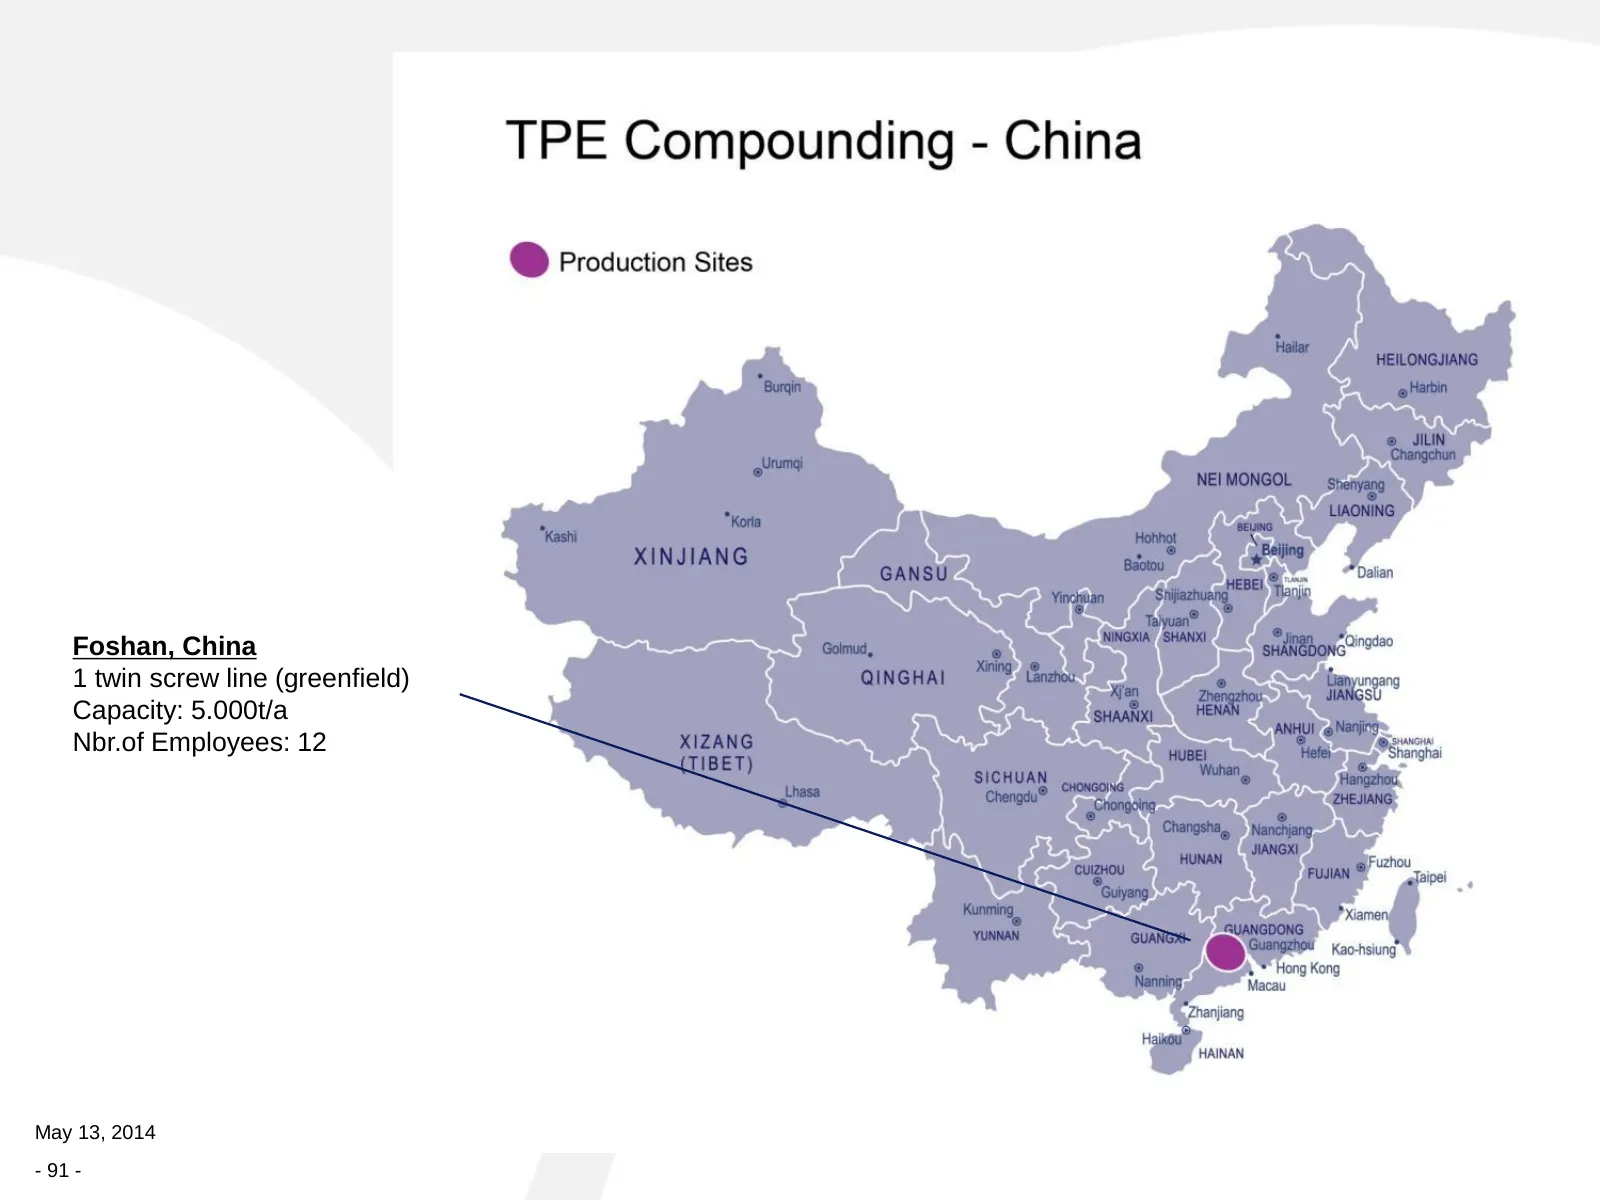
Foshan, China 1 twin screw line (greenfield) Capacity: 5.000t/a Nbr.of Employees: 12 May 13, 2014 - 91 -

Slide 92: Target Markets
Target Markets
Slide 93: General Market
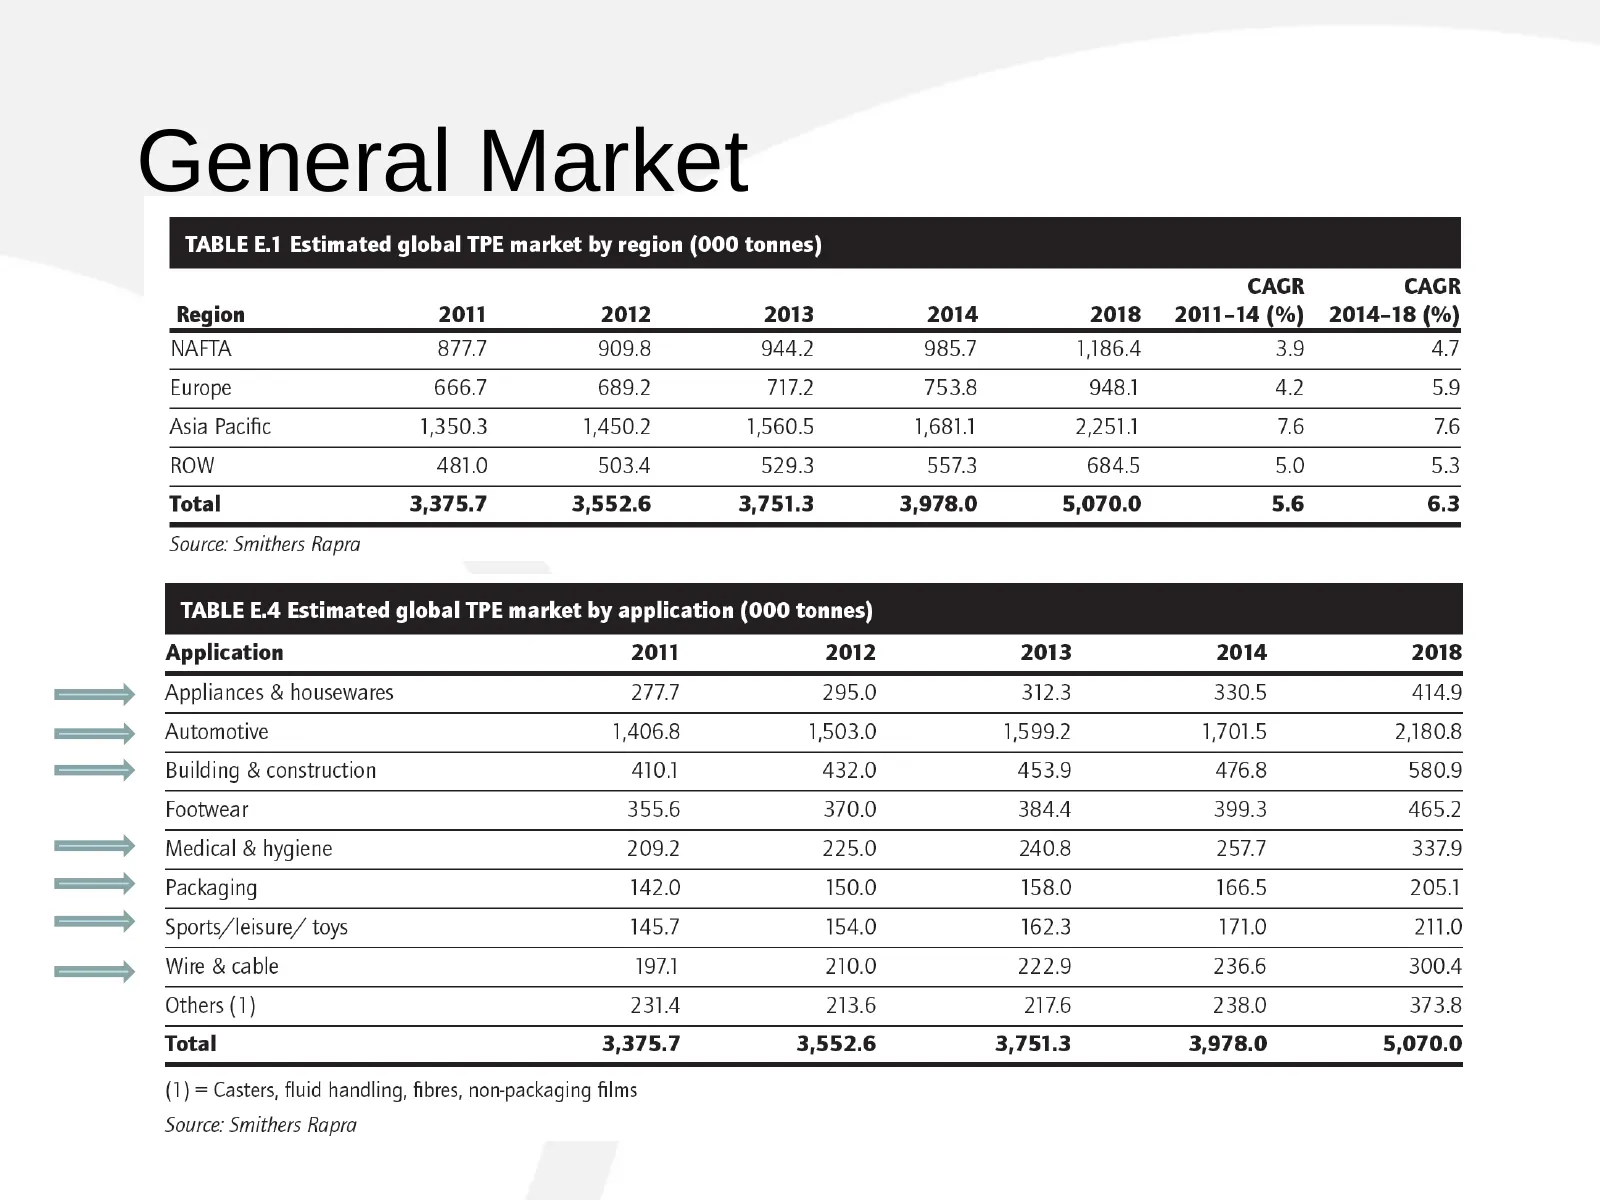
PUN UU General Market CAGR CAGR Region 2011 2012 2013 2014 2018 2011-14(%) 2014-18 (%) NAFTA 8777 909.8 944.2 985.7 1,186.4 3.9 47 Europe 666.7 689.2 717.2 753.8 948.1 42 5.9 Asia Pacific 1,350.3 1,450.2 1,560.5 1,681.1 2,2511 76 76 ROW 481.0 503.4 529.3 557.3 684.5 5.0 5.3 Total 3,375.7 3,552.6 3,7
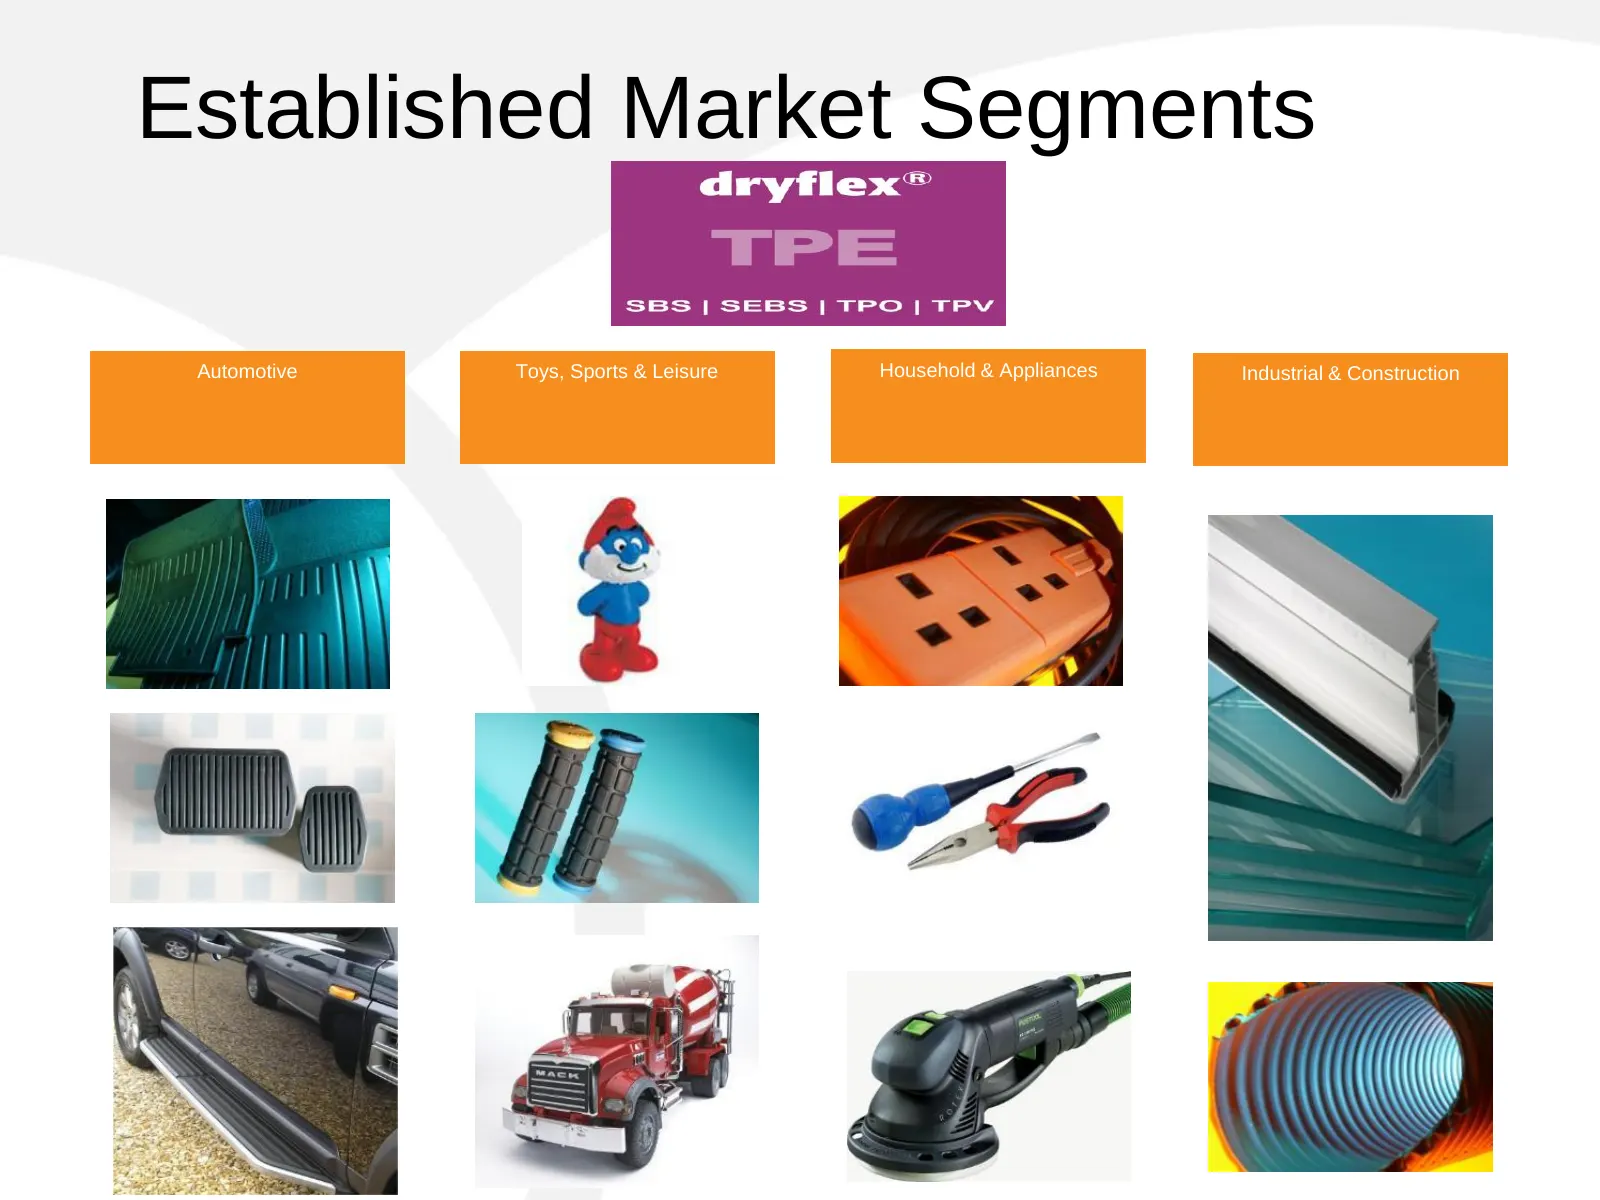
Slide 94: Established Market Segments
Established Market Segments Automotive Toys, Sports & Leisure Household & Appliances Industrial & Construction
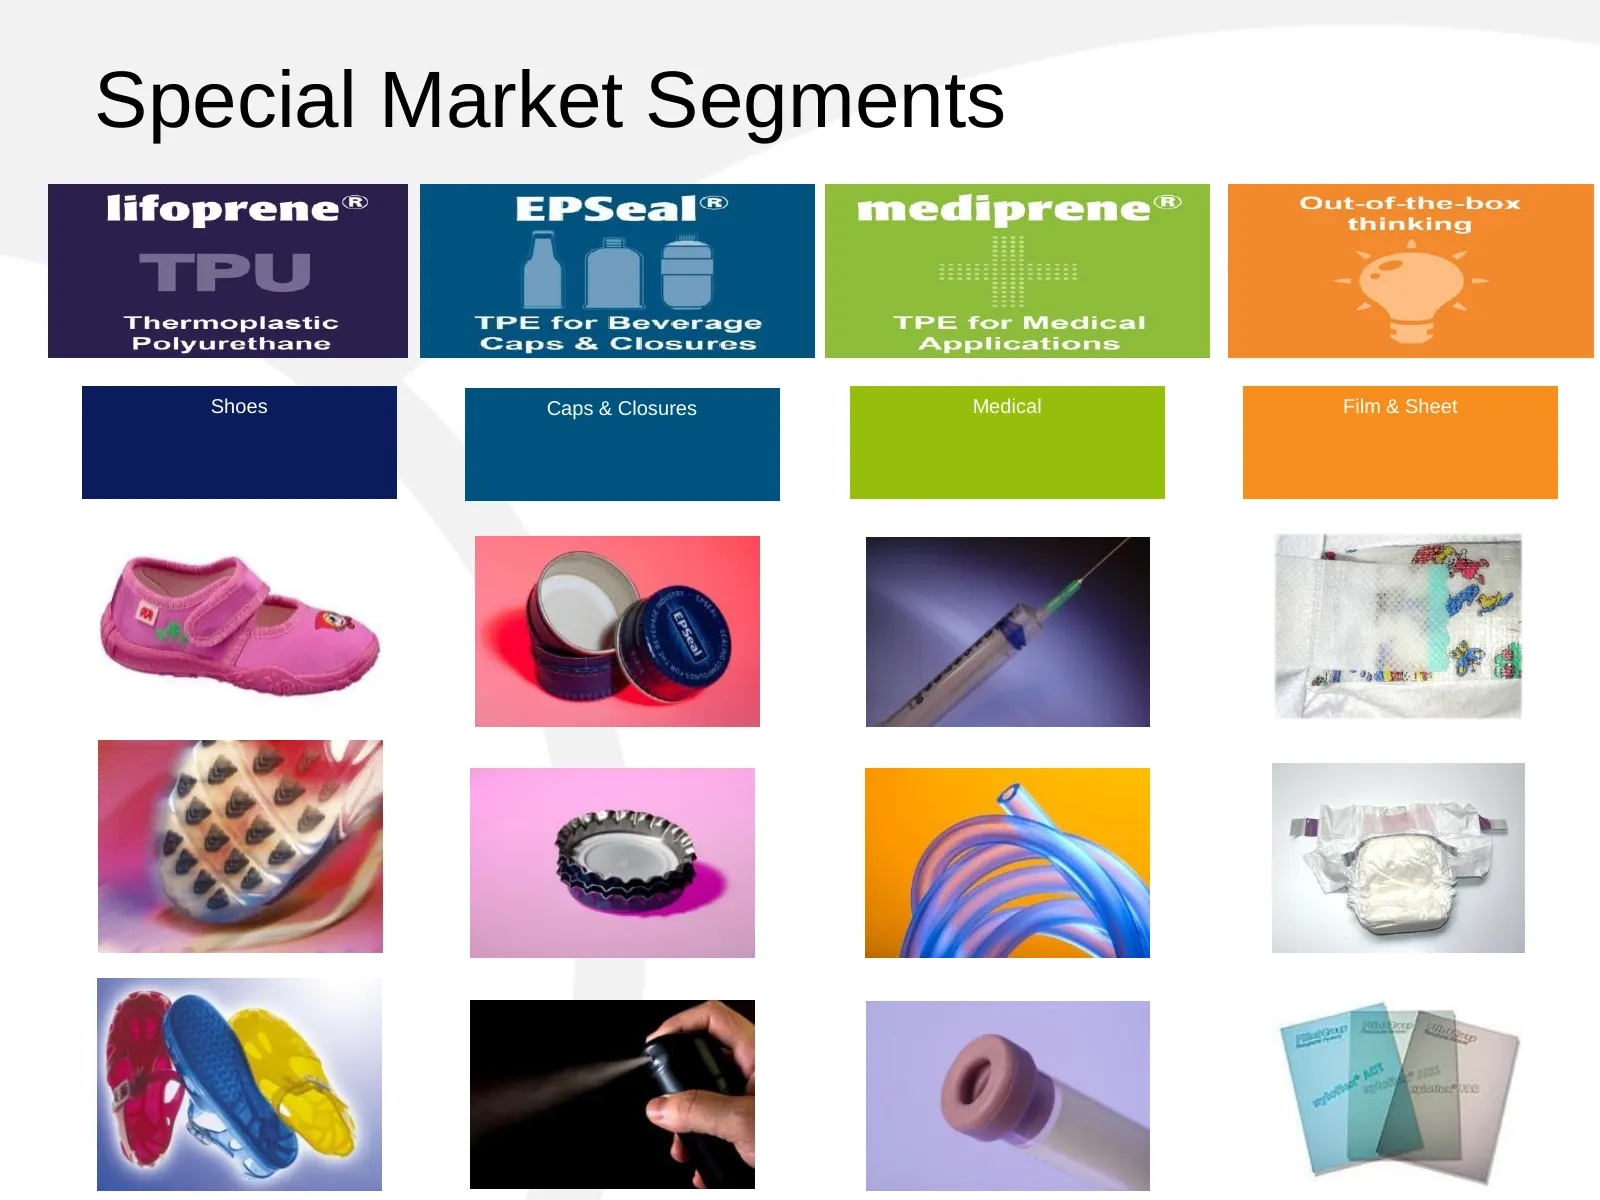
Slide 95: Special Market Segments
Special Market Segments Shoes Caps & Closures Medical Film & Sheet
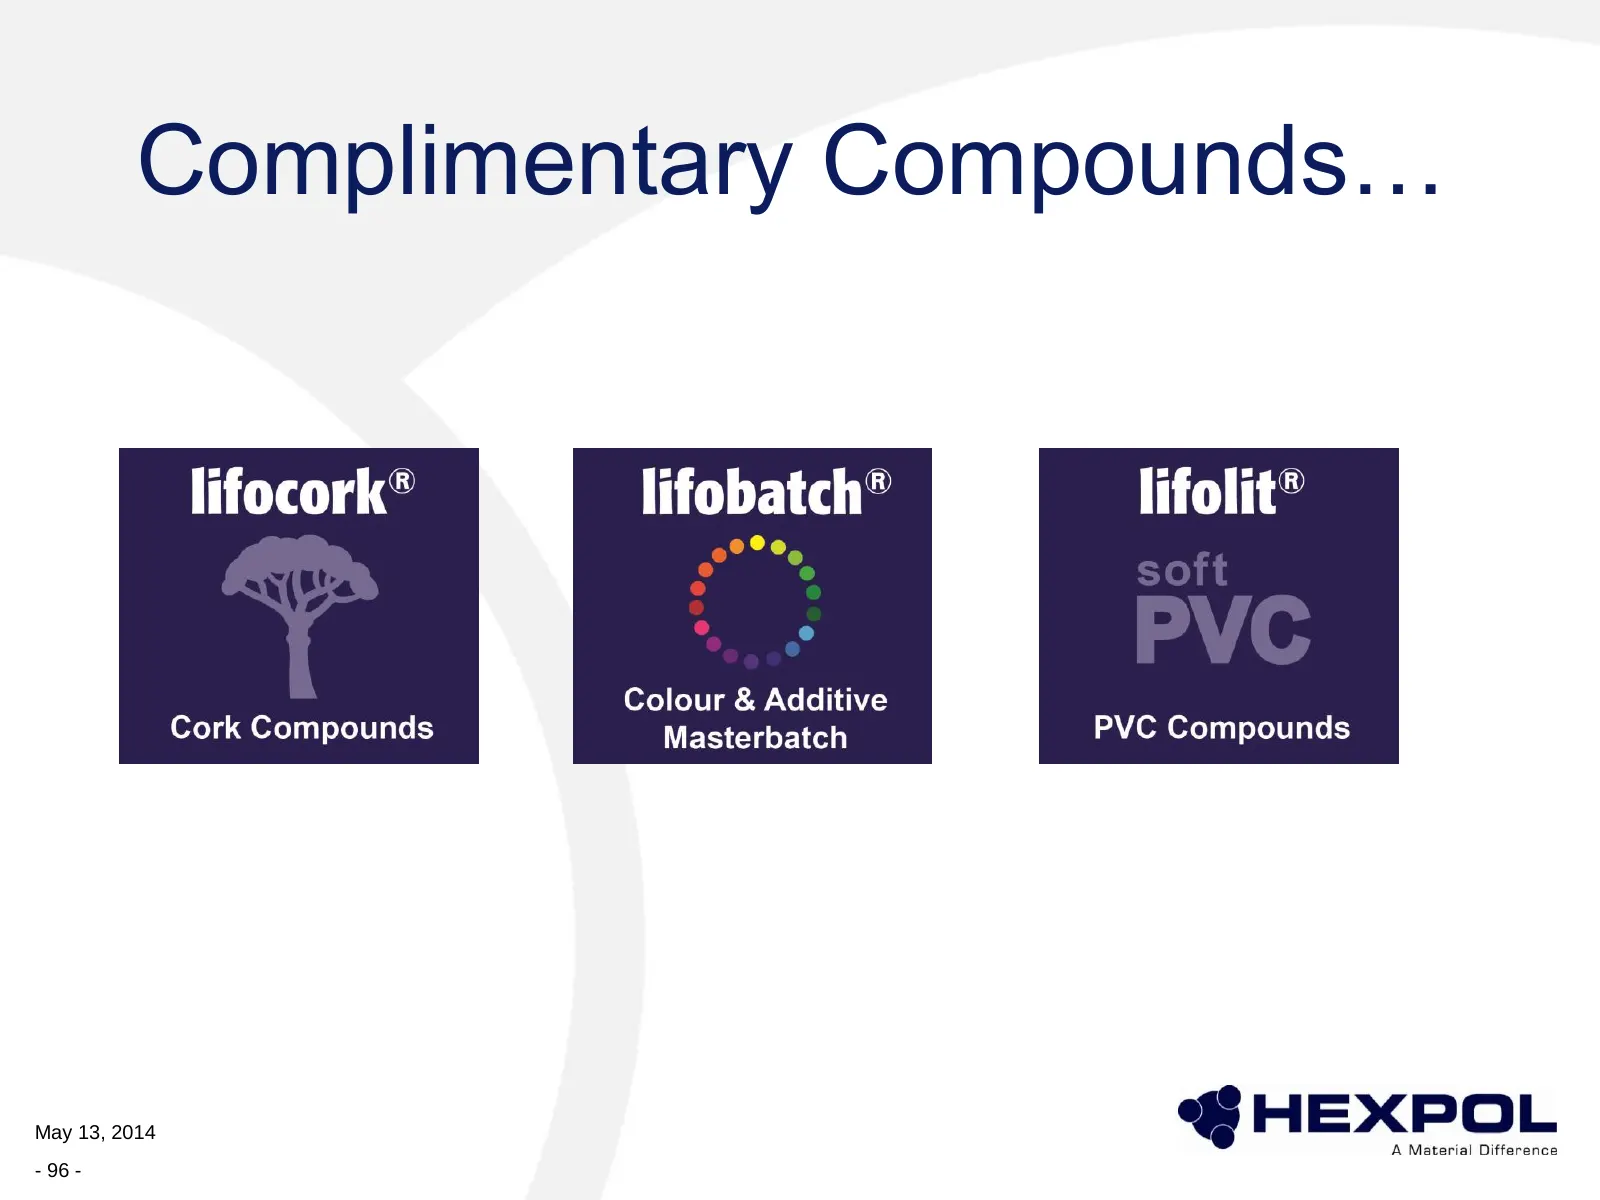
Slide 96: Complimentary Compounds…
Complimentary Compounds… May 13, 2014 - 96 -
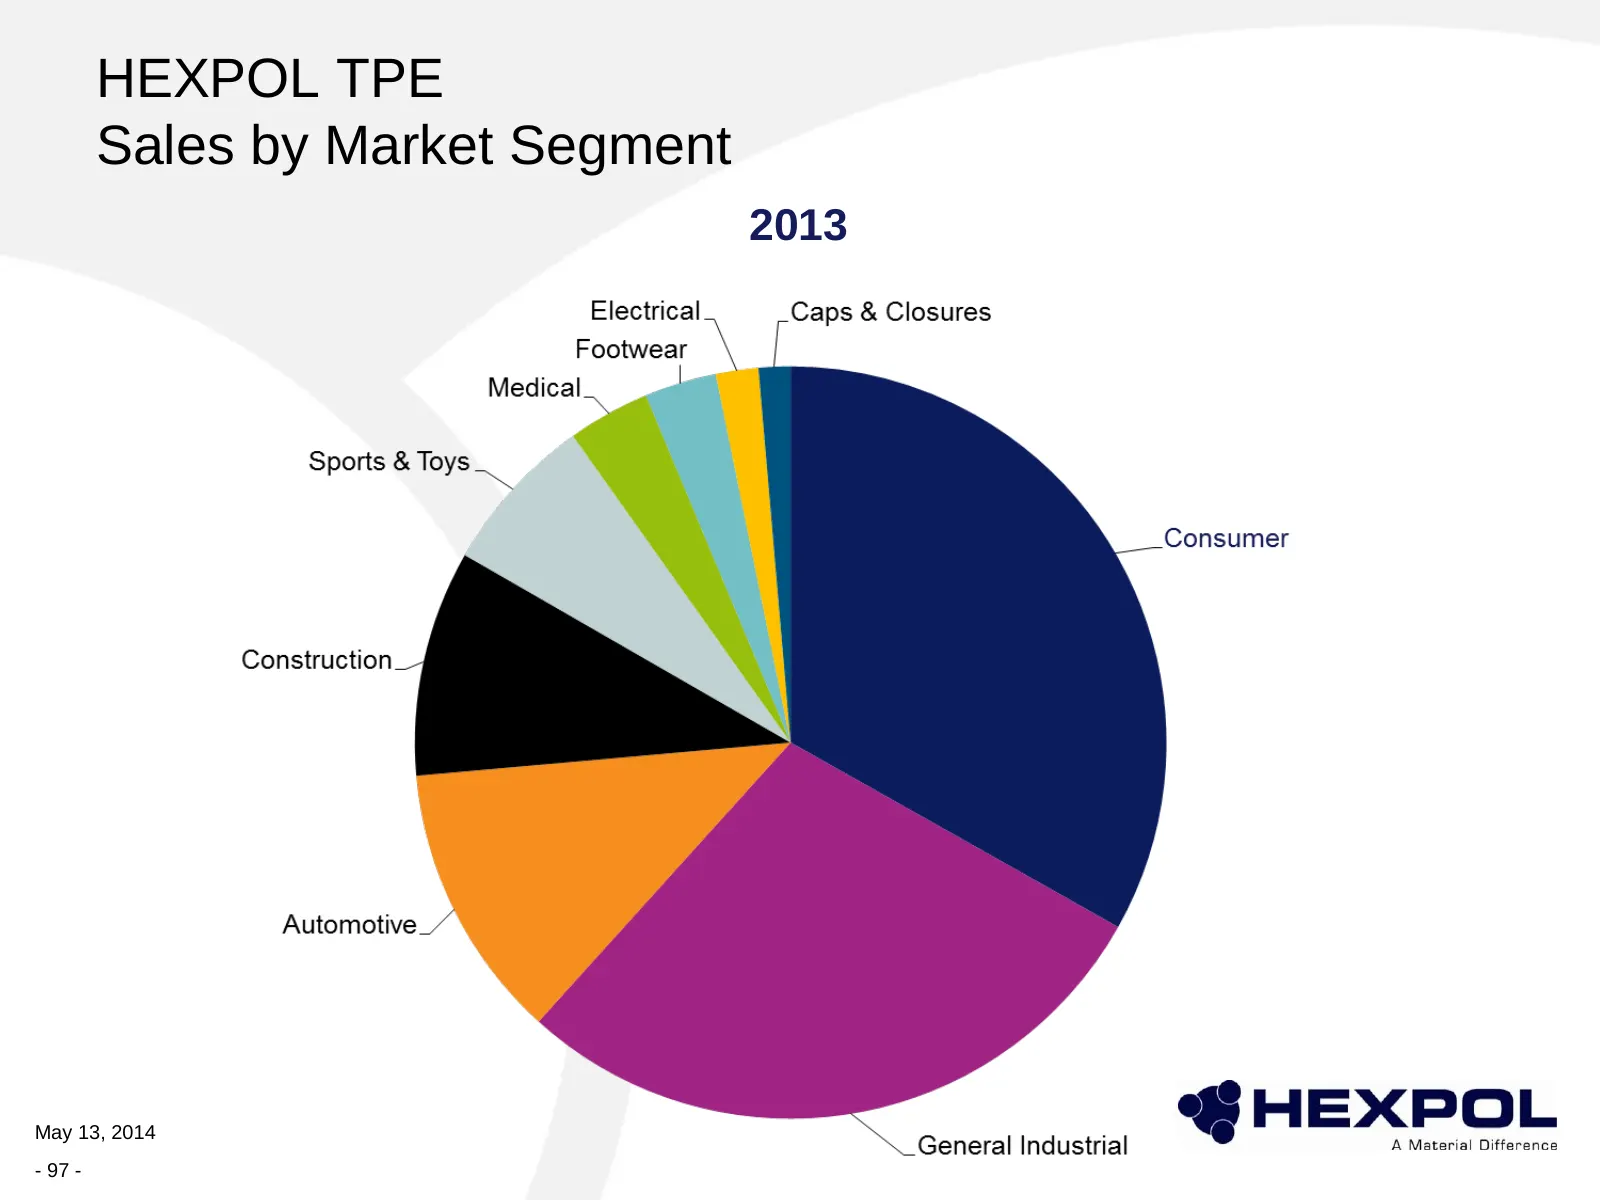
Slide 97: HEXPOL TPE Sales by Market Segment
HEXPOL TPE Sales by Market Segment 2013 May 13, 2014 - 97 -
Slide 98: Commercial Organisation
Commercial Organisation
Slide 99: Multi-channel structure
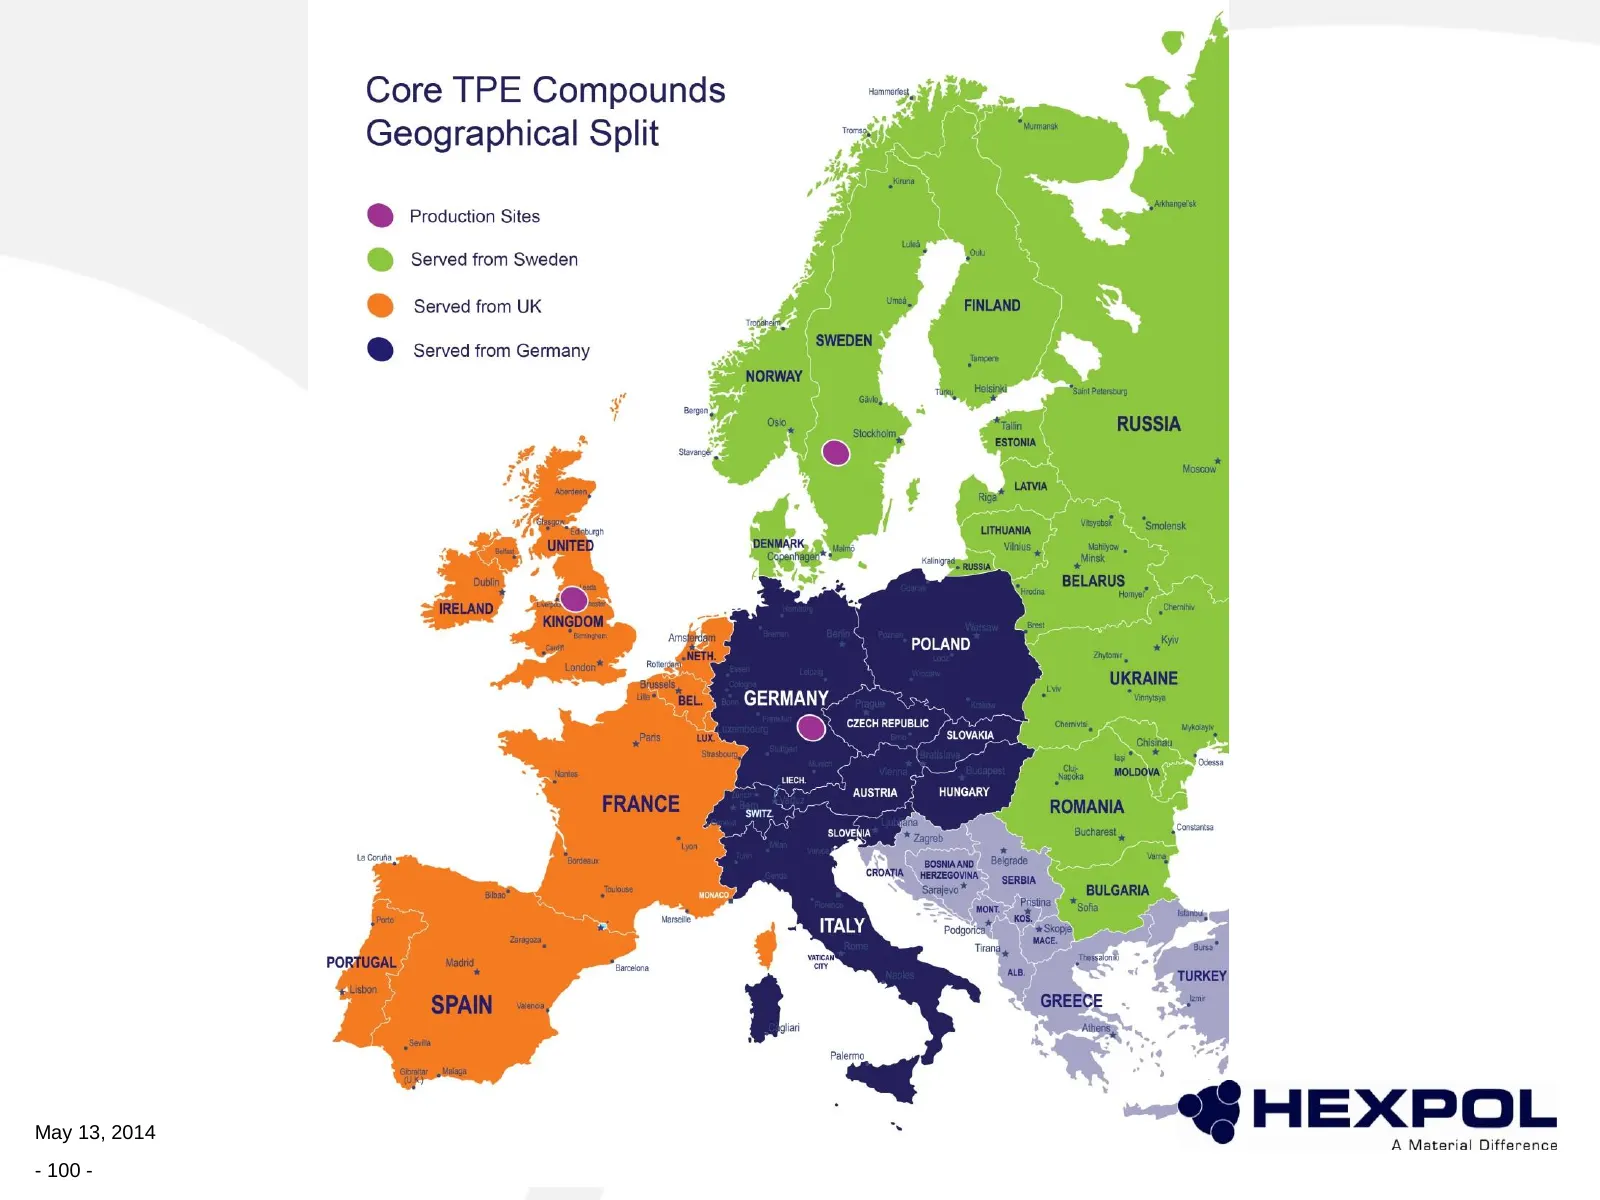
Multi-channel structure • Geographical responsibilities for ‘core’ TPE compounds • Product specialities – Sweden = Medical – UK = Waterswell, TPV – Germany = Flame Retardant, PVC, Masterbatch, Cork Compounds, ‘out-the-box thinking’ • Key Account Management • Market Segment Teams – Medical – Caps & C
Slide 100: Core TPE Compounds – Geographical Split
Core TPE Compounds Geographical Split t Production Sites @ Served from Sweden e Served from UK t ) Served from Germany 5, GERMANY, HUNGAR) May 13, 2014 ; ~ mm HEXPOL A Material Difference - 100 -

Slide 101: Highlights 2013/2014
Highlights 2013/2014
Slide 102: Highlights 2013 / 2014
Highlights 2013 / 2014 Expansion at Müller Kunststoffe -Line 6 in operation since beginning 2013 and running already at full capacity since May/June -Line 7 in operation since Q2 2014 -Expansion of offices (technical lab + customer service) Development of new TPV range in UK -First TPV orders after
Slide 103: Highlights 2013 / 2014
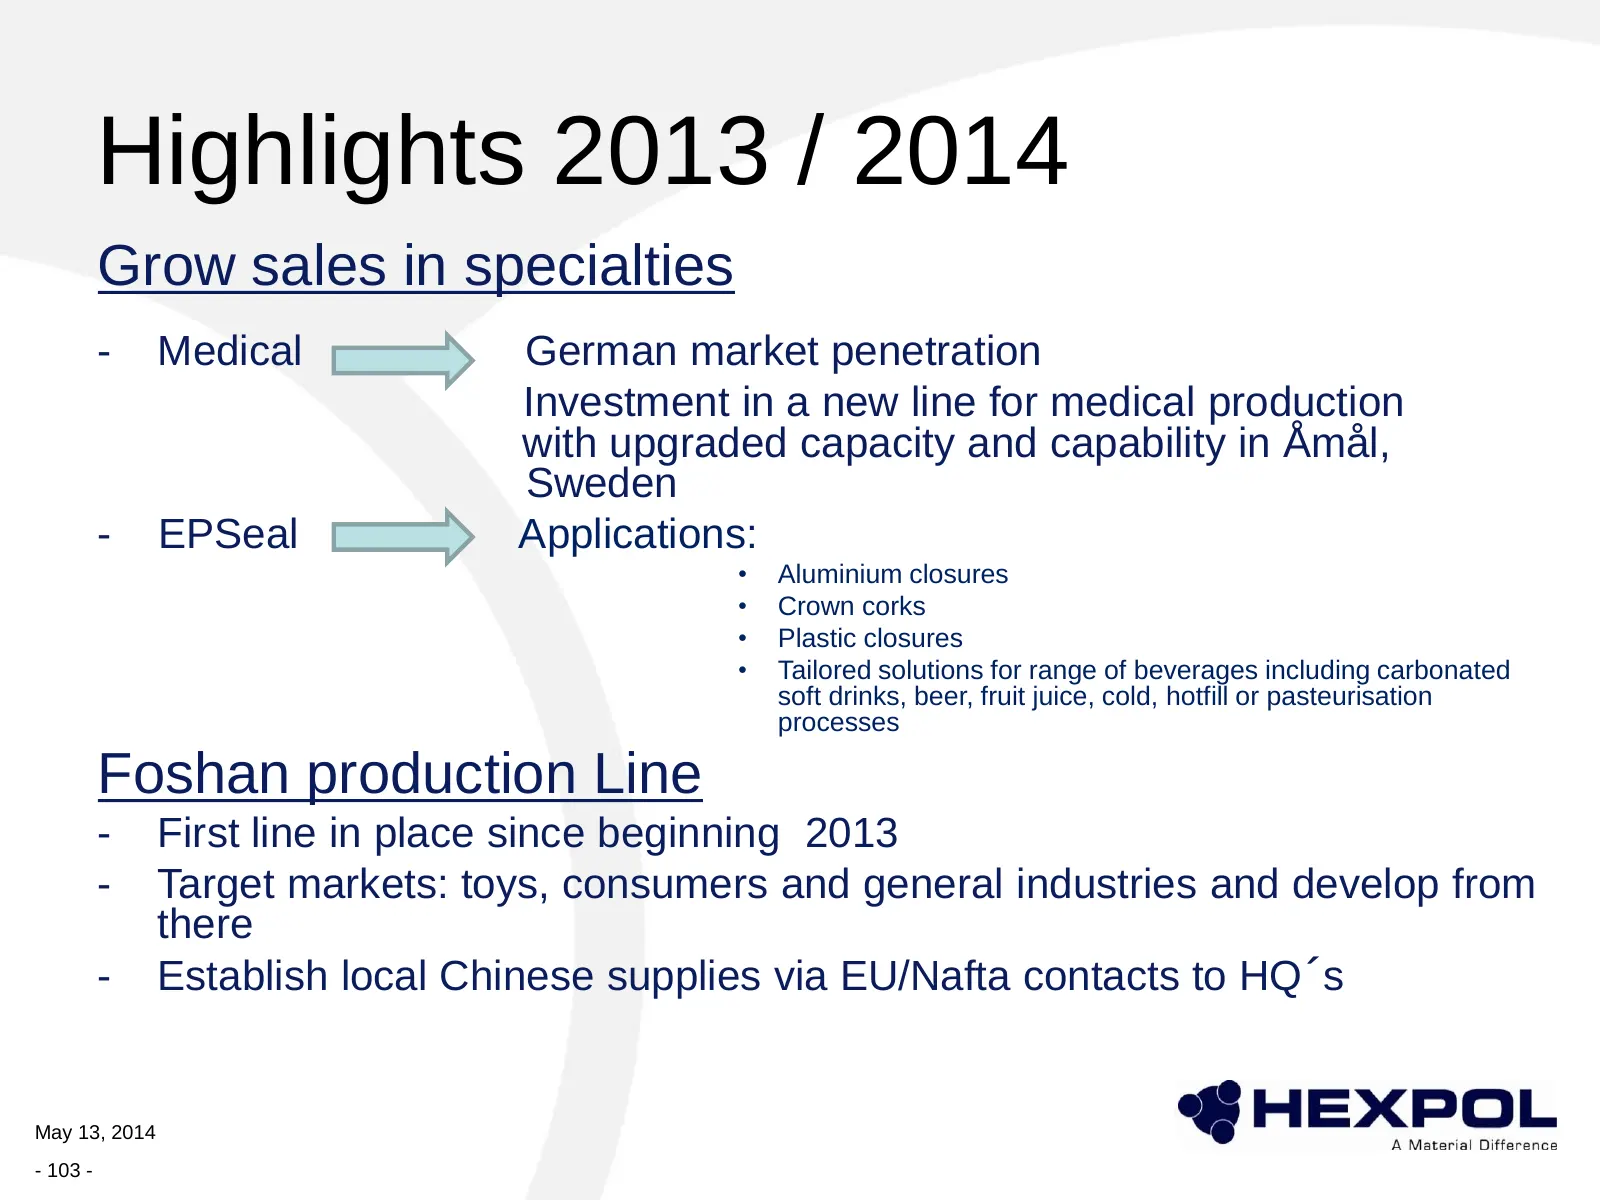
Highlights 2013 / 2014 Grow sales in specialties - Medical German market penetration Investment in a new line for medical production with upgraded capacity and capability in Åmål, Sweden - EPSeal Applications: • Aluminium closures • Crown corks • Plastic closures • Tailored solutions for range of be
Slide 104: Technical Organisation
Technical Organisation
Slide 105: Think global, act local
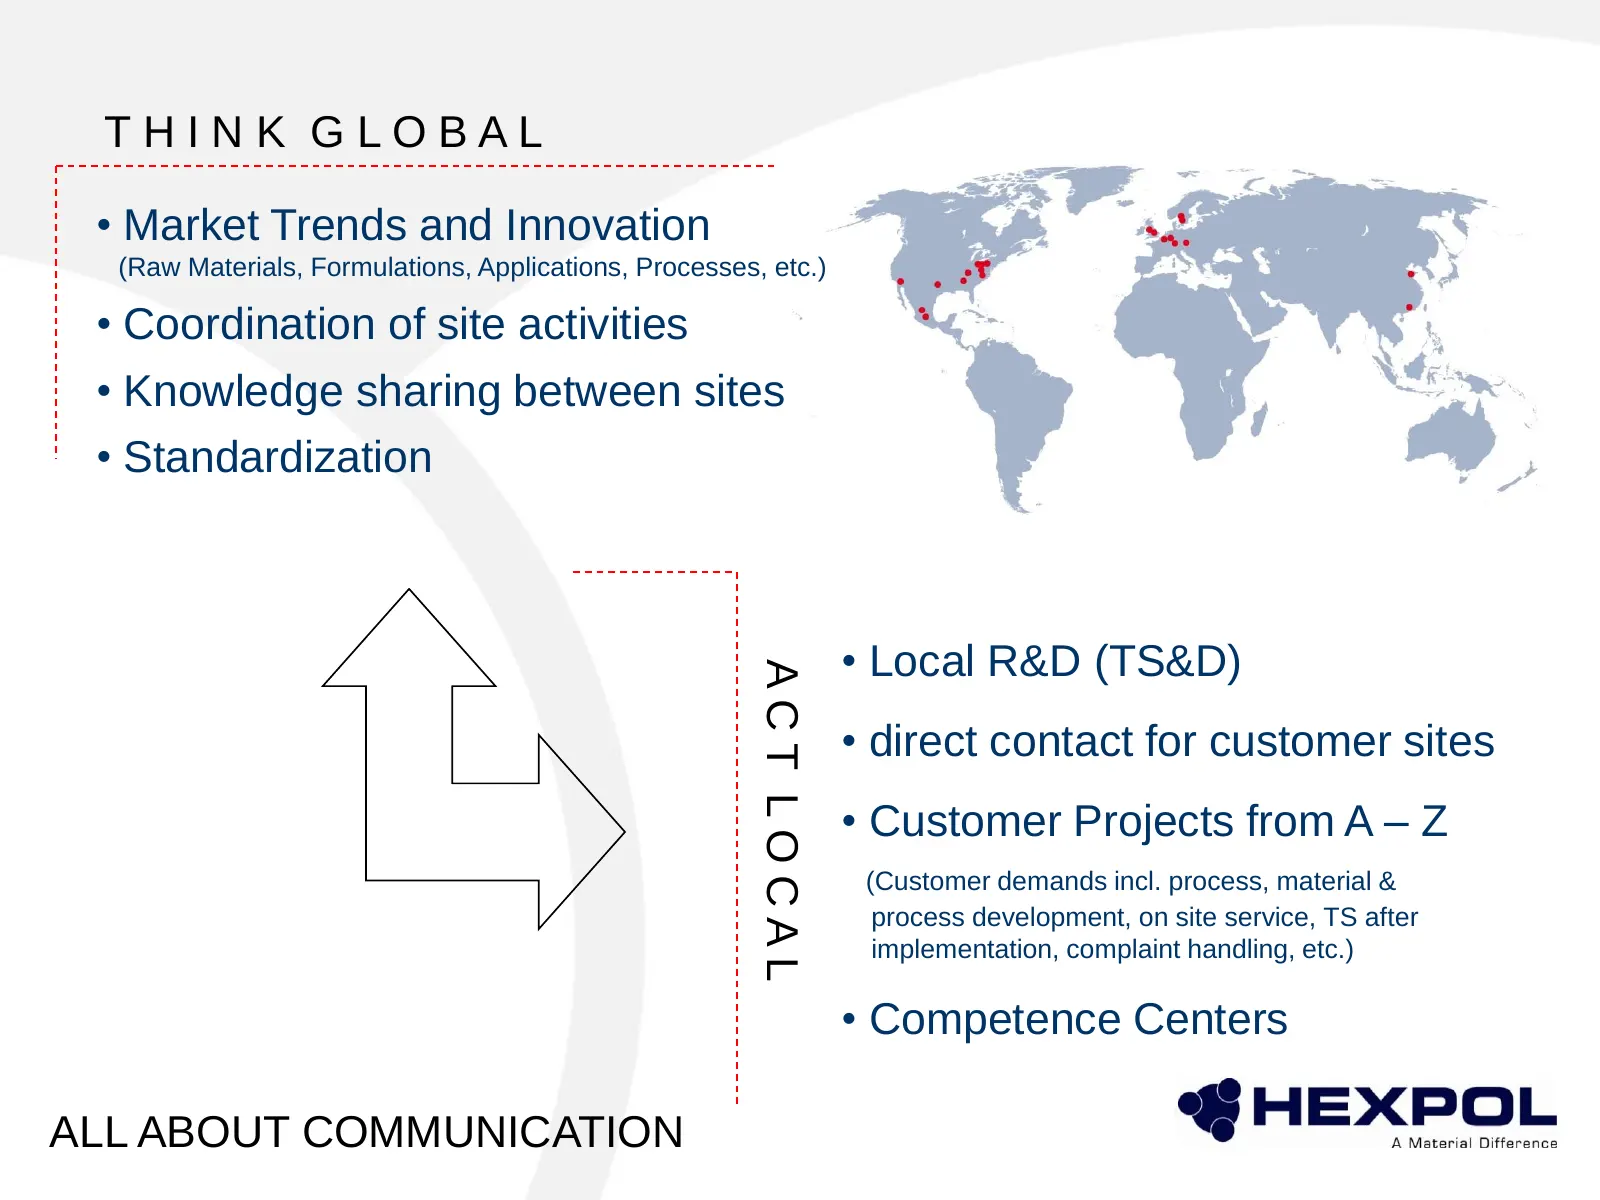
THINK GLOBAL • Market Trends and Innovation (Raw Materials, Formulations, Applications, Processes, etc.) • Coordination of site activities • Knowledge sharing between sites • Standardization • Local R&D (TS&D) ACT LOCAL • direct contact for customer sites • Customer Projects from A – Z (Customer dem
Slide 106: Follow the market trends
Follow the market trends • Automotive interior parts made of TPE (mats, buttons, etc.) • Move from PVC to TPE in medical and toy applications (new materials and new process, also on customer site) • 3D Printing for private usage and industrial prototyping • Continues focus on legislation changes (Fo
Slide 107: Development Team
Development Team • 10% of all Hexpol TPE Group work in R&D (TS&D) • AMA 9, LIF 6, MAN 5, China 2 • Different Centre of Expertise Medical – Amal Soft PVC, Cork, special TPE – Lichtenfels TPV, Waterswell – Manchester • R&D Coordination in place and lead by Klas Dannas May 13, 2014 - 107 -
Slide 108: Development process
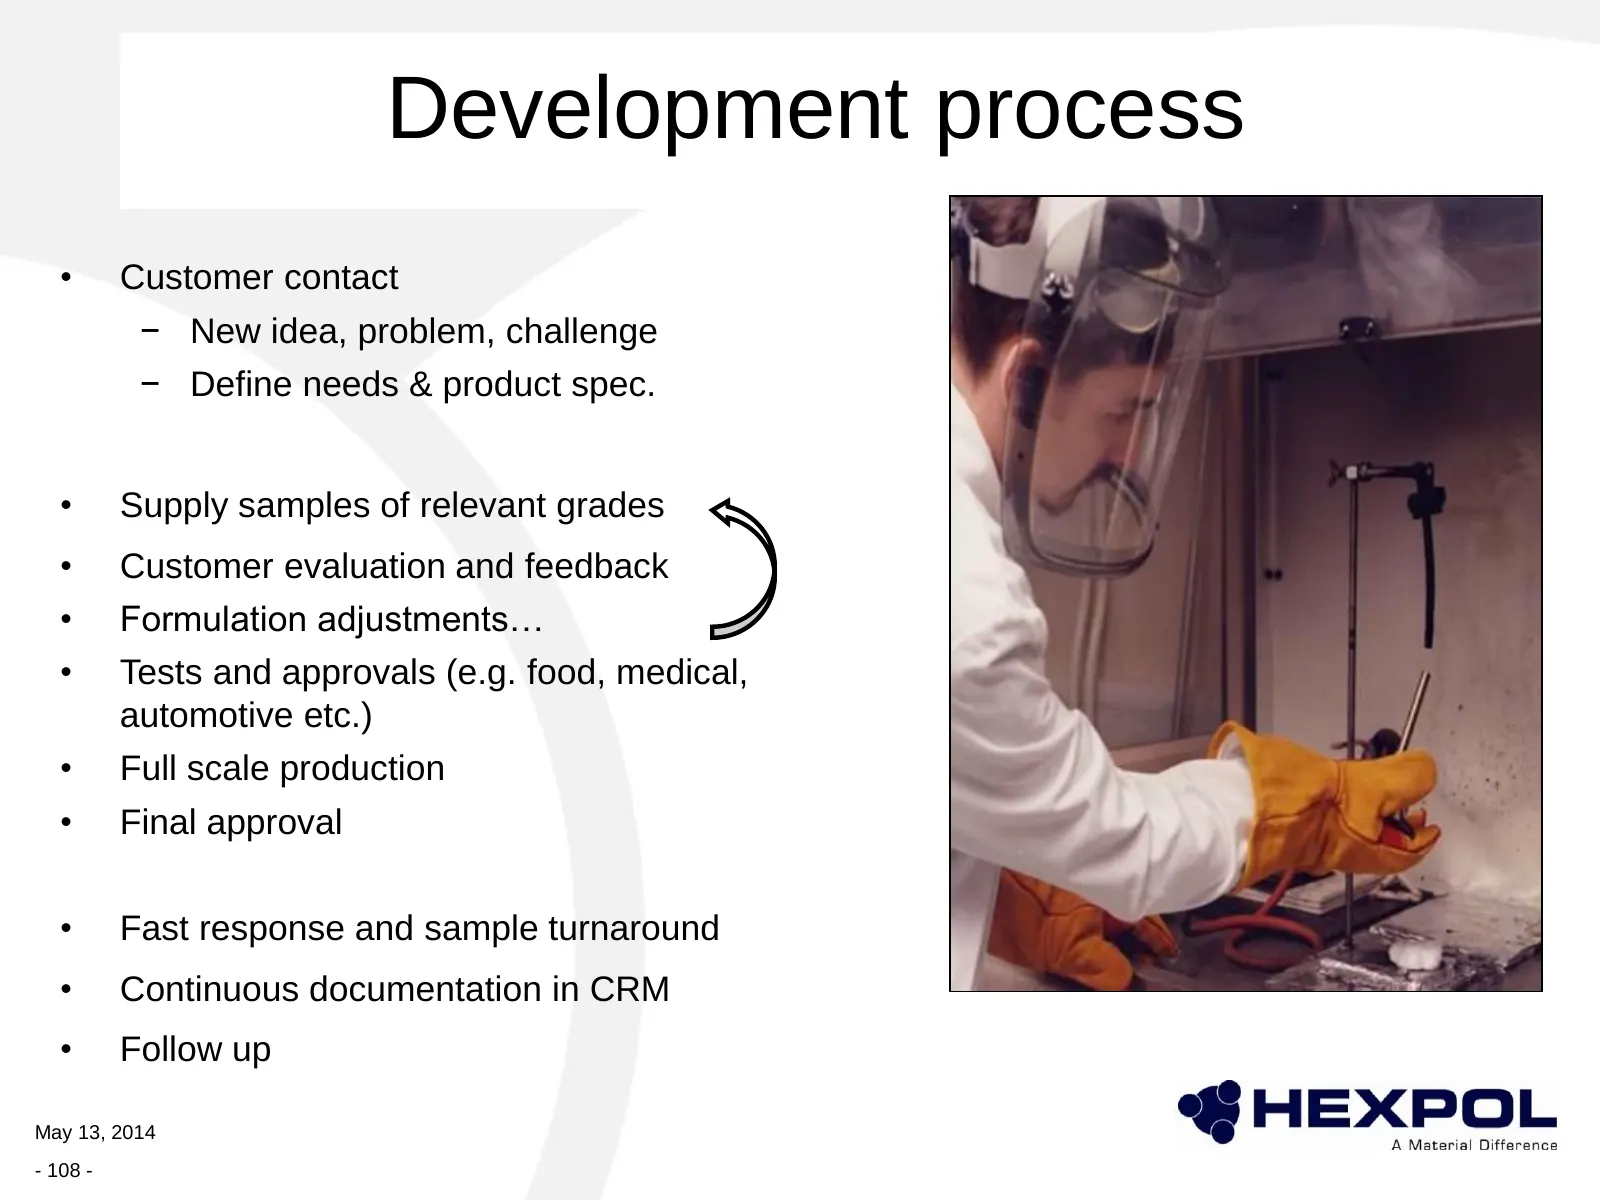
Development process • Customer contact − New idea, problem, challenge − Define needs & product spec. • Supply samples of relevant grades • Customer evaluation and feedback • Formulation adjustments… • Tests and approvals (e.g. food, medical, automotive etc.) • Full scale production • Final approval

Slide 109: Recent Product Developments
Recent Product Developments
Slide 110: Recent Developments - Automotive Mats
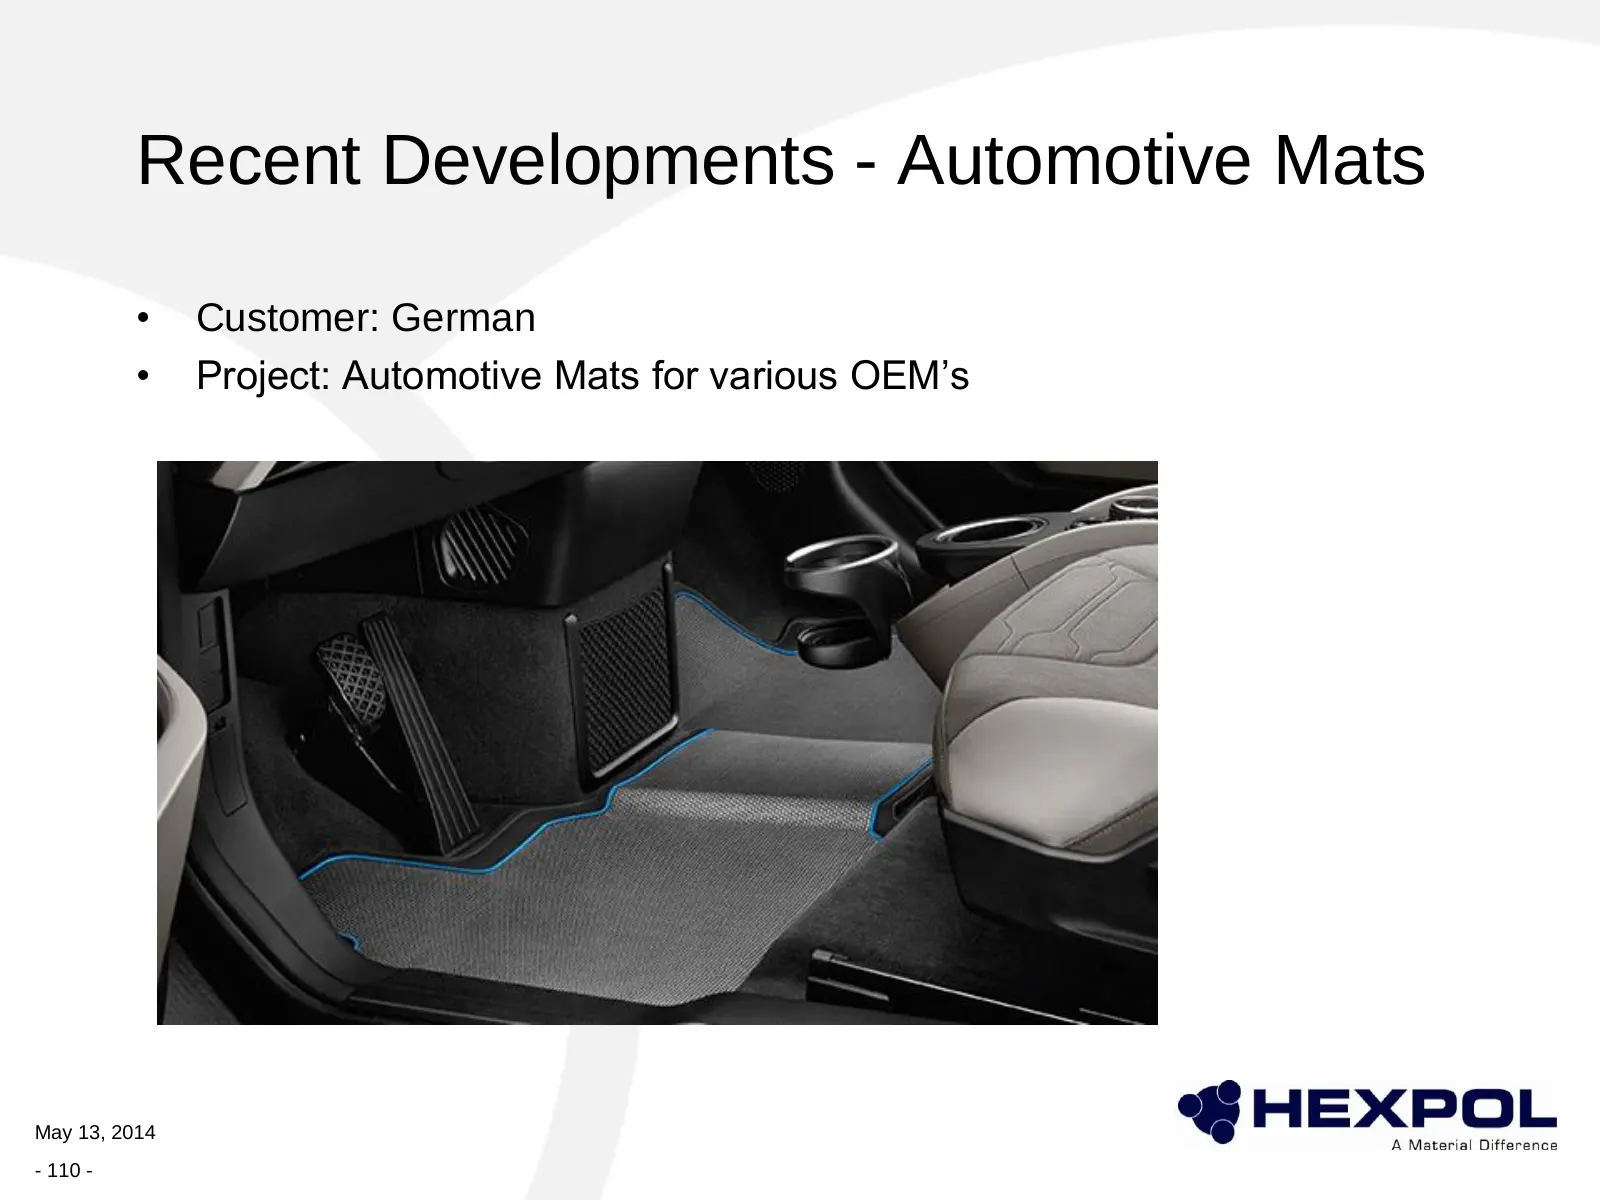
Recent Developments - Automotive Mats • Customer: German • Project: Automotive Mats for various OEM’s May 13, 2014 - 110 -
Slide 111: Recent Developments – Antistatic Shoes
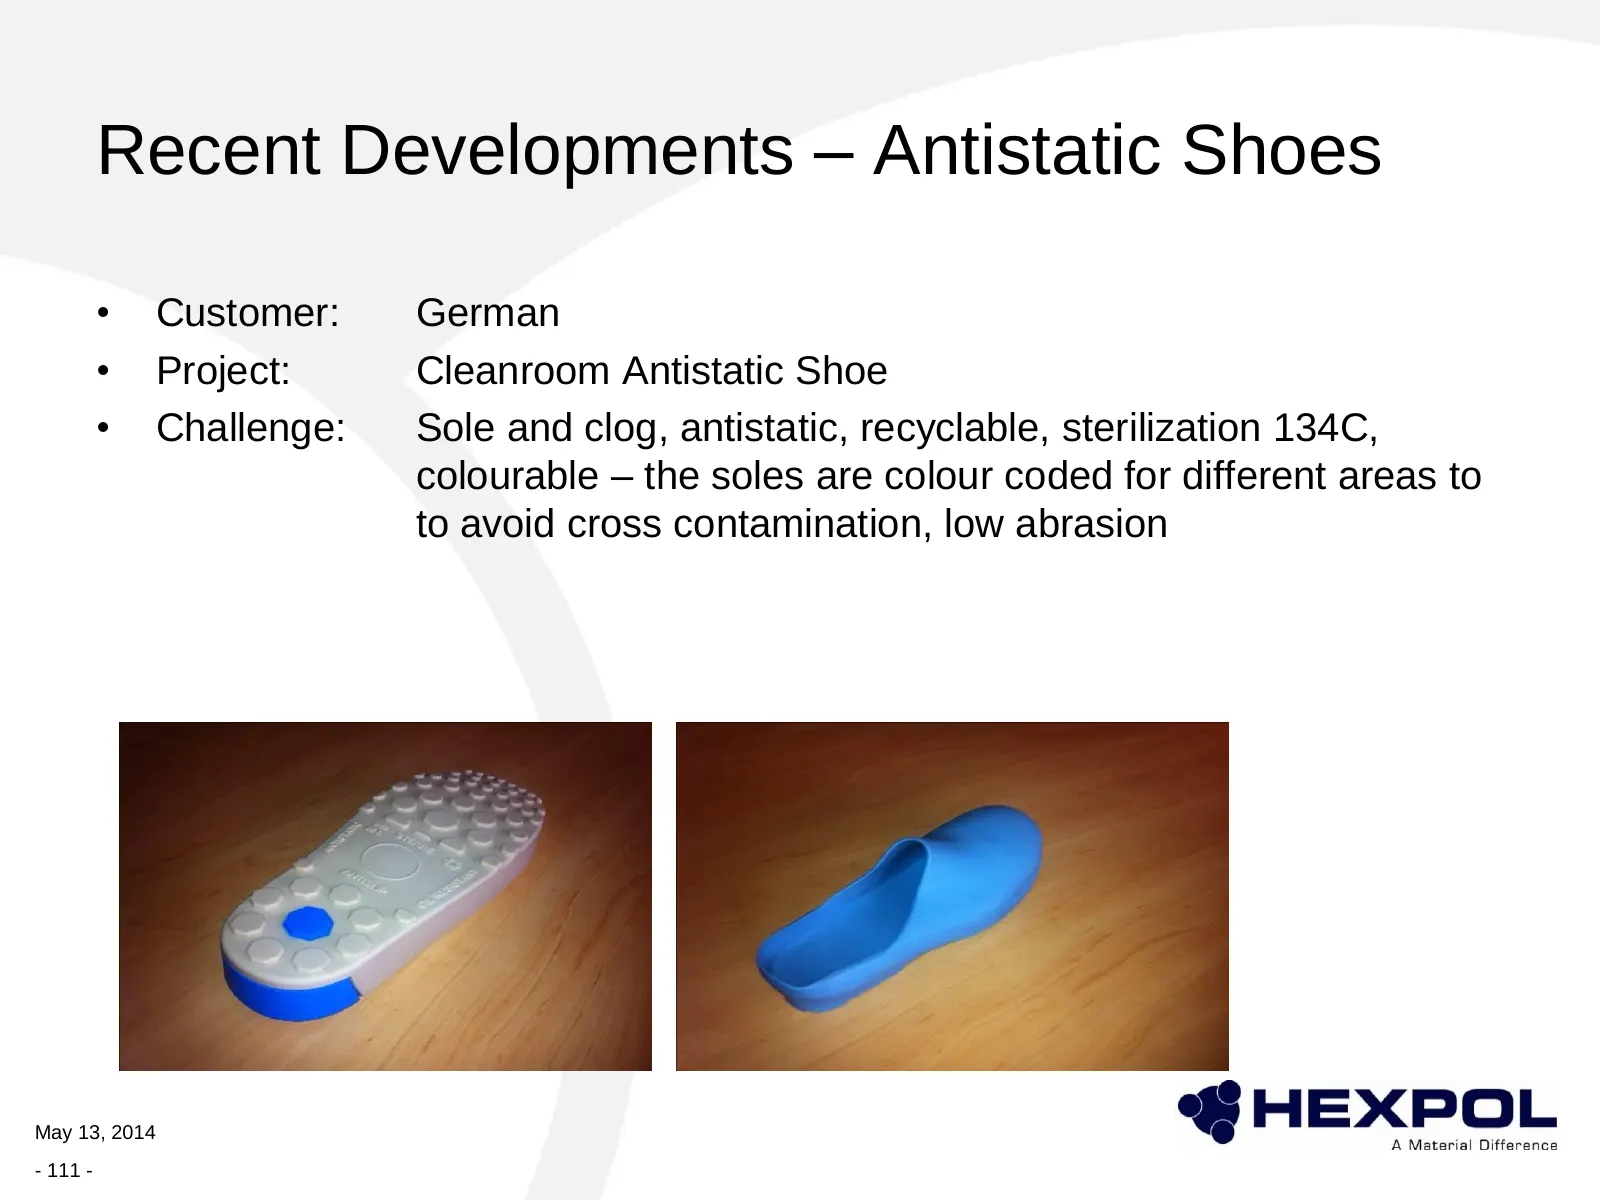
Recent Developments – Antistatic Shoes • Customer: German • Project: Cleanroom Antistatic Shoe • Challenge: Sole and clog, antistatic, recyclable, sterilization 134C, colourable – the soles are colour coded for different areas to to avoid cross contamination, low abrasion May 13, 2014 - 111 -
Slide 112: Recent Developments – Dinosaur China
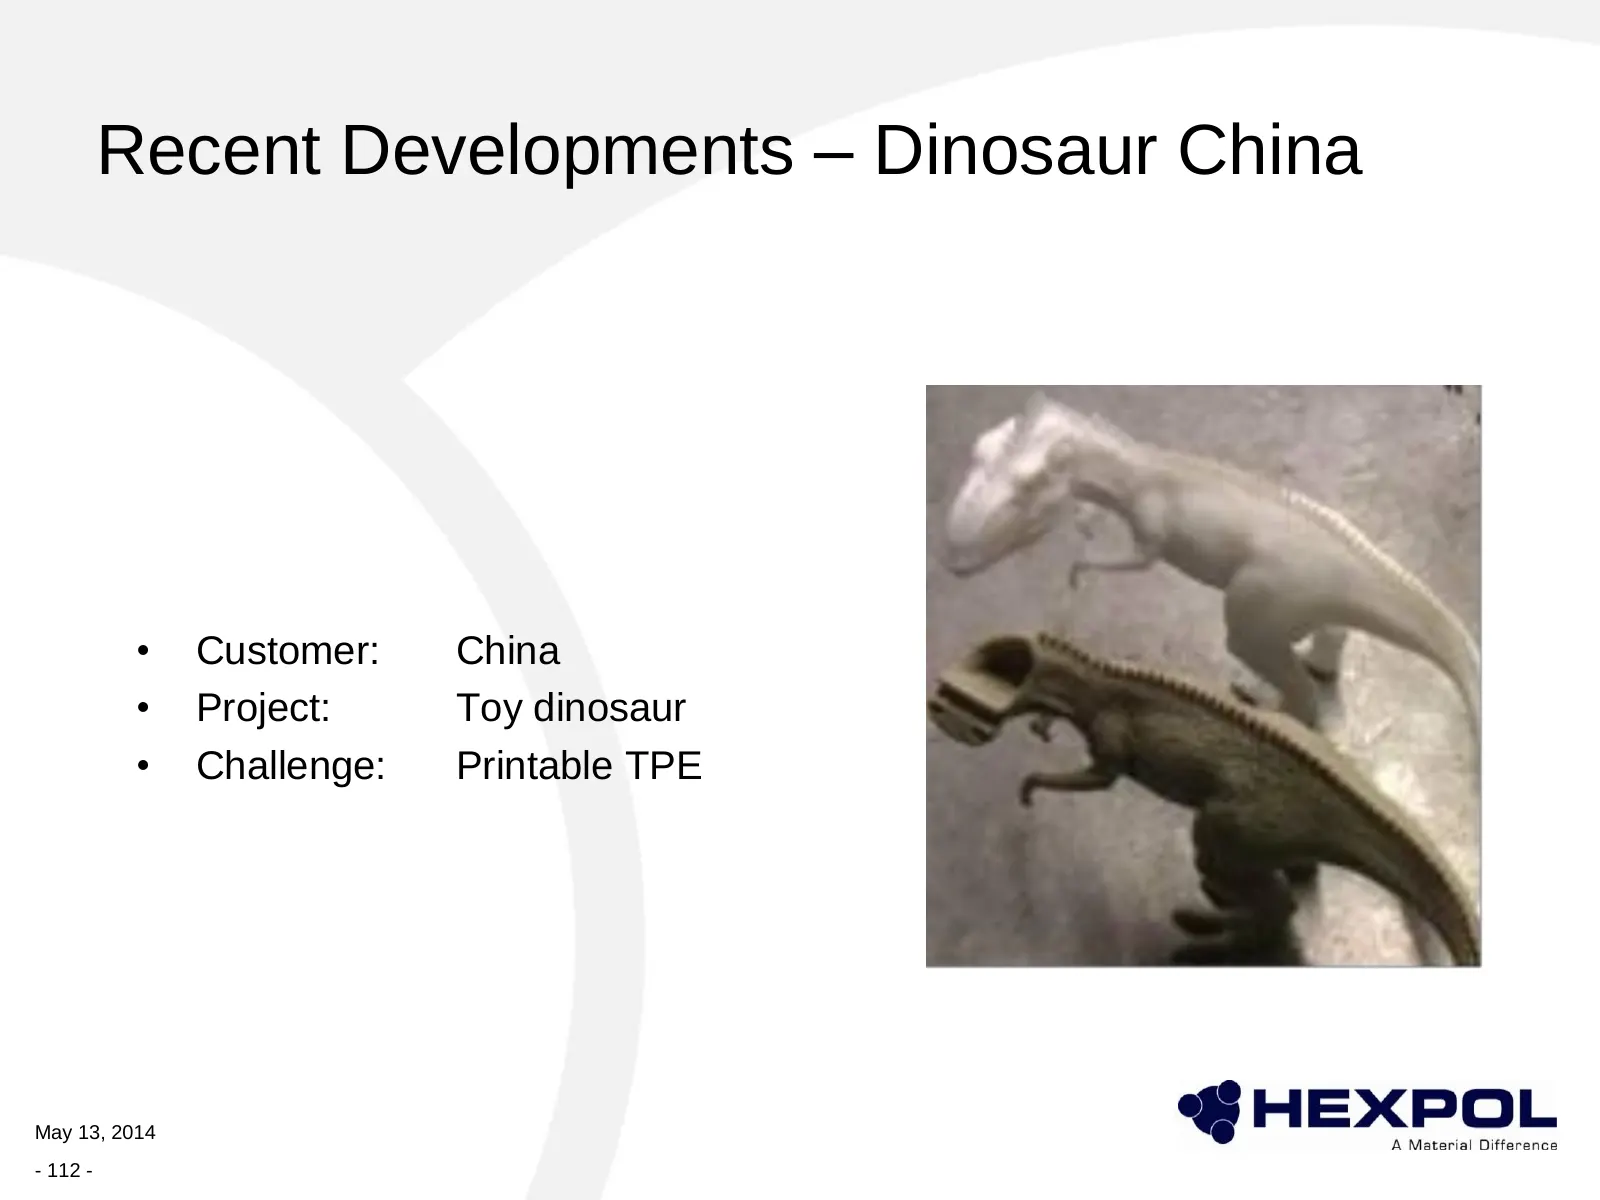
Recent Developments – Dinosaur China • Customer: China • Project: Toy dinosaur • Challenge: Printable TPE May 13, 2014 - 112 -
Slide 113: Medical
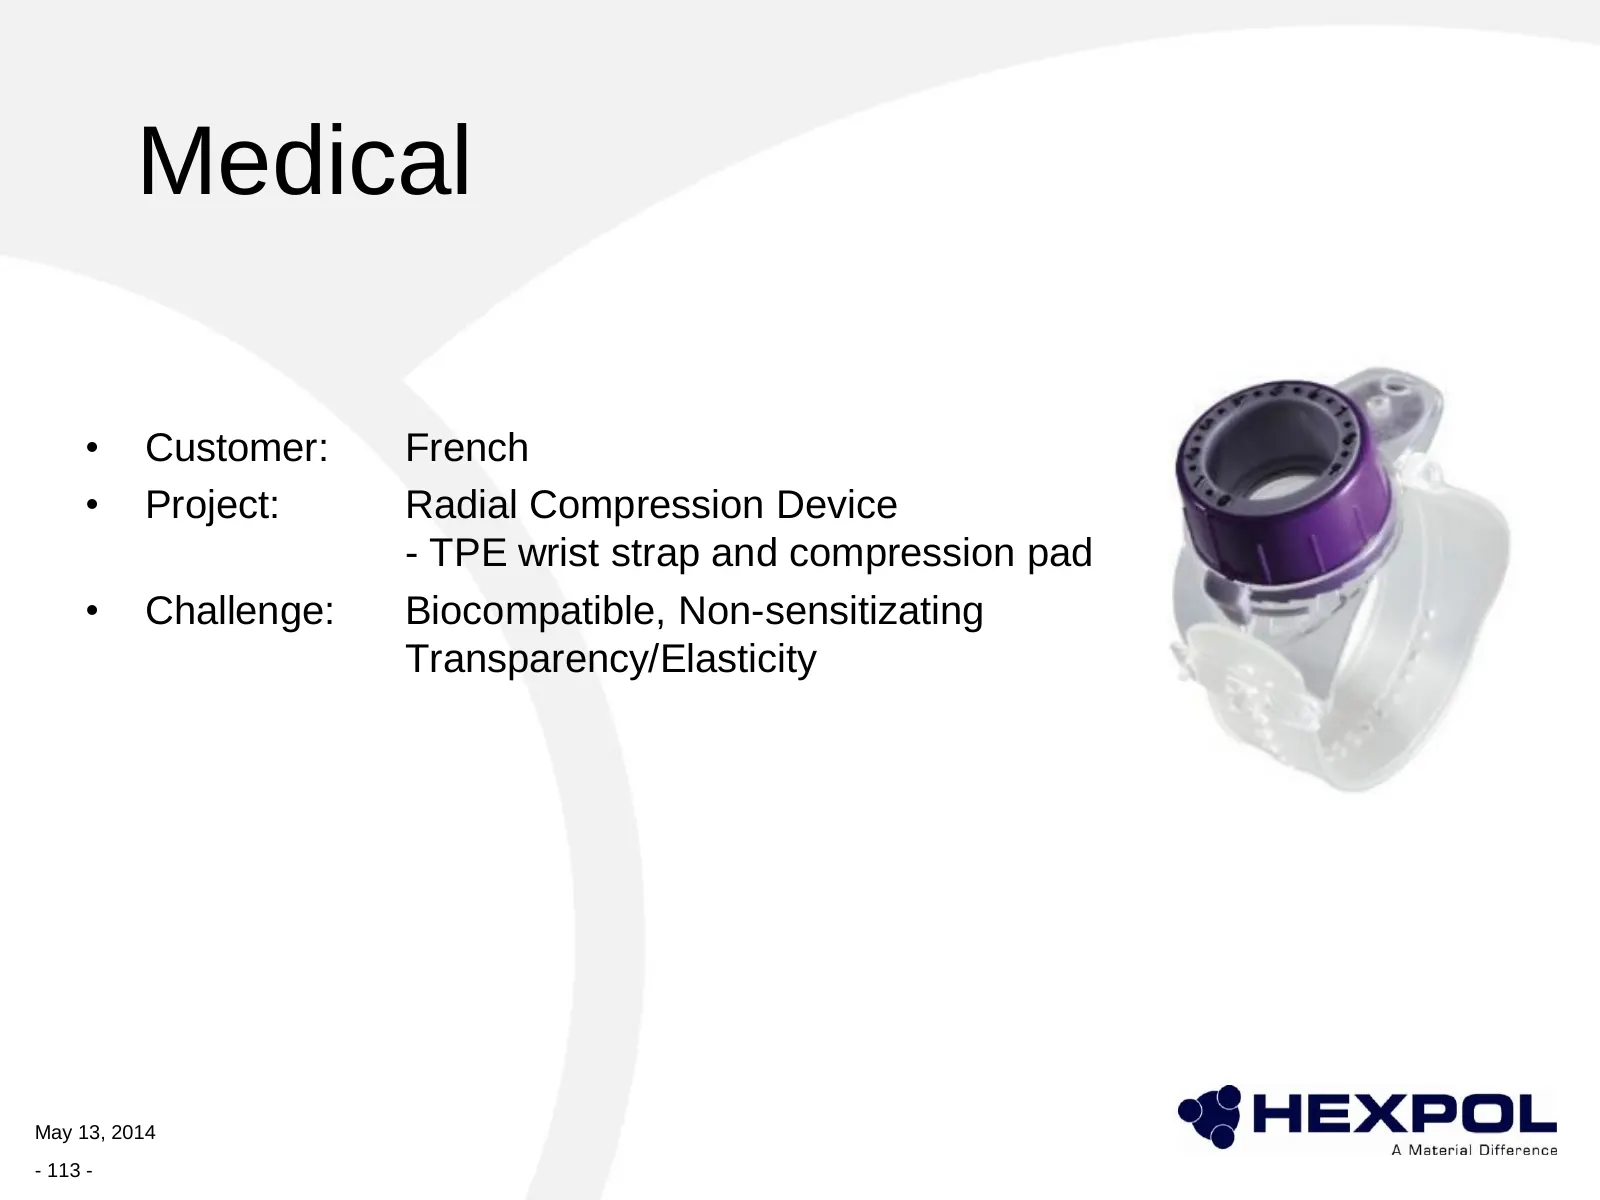
Medical • Customer: French • Project: Radial Compression Device - TPE wrist strap and compression pad • Challenge: Biocompatible, Non-sensitizating Transparency/Elasticity May 13, 2014 - 113 -
Slide 114: Thank you!
HEXPOL TPE Thank you!
Slide 115: Presentation of HEXPOL Compounding NAFTA
Presentation of HEXPOL Compounding NAFTA Tracy Garrison, President HEXPOL Compounding NAFTA Steve Chase, Regional Sales Director HEXPOL Compounding NAFTA May 13, 2014 - 115 -
Slide 116: Agenda
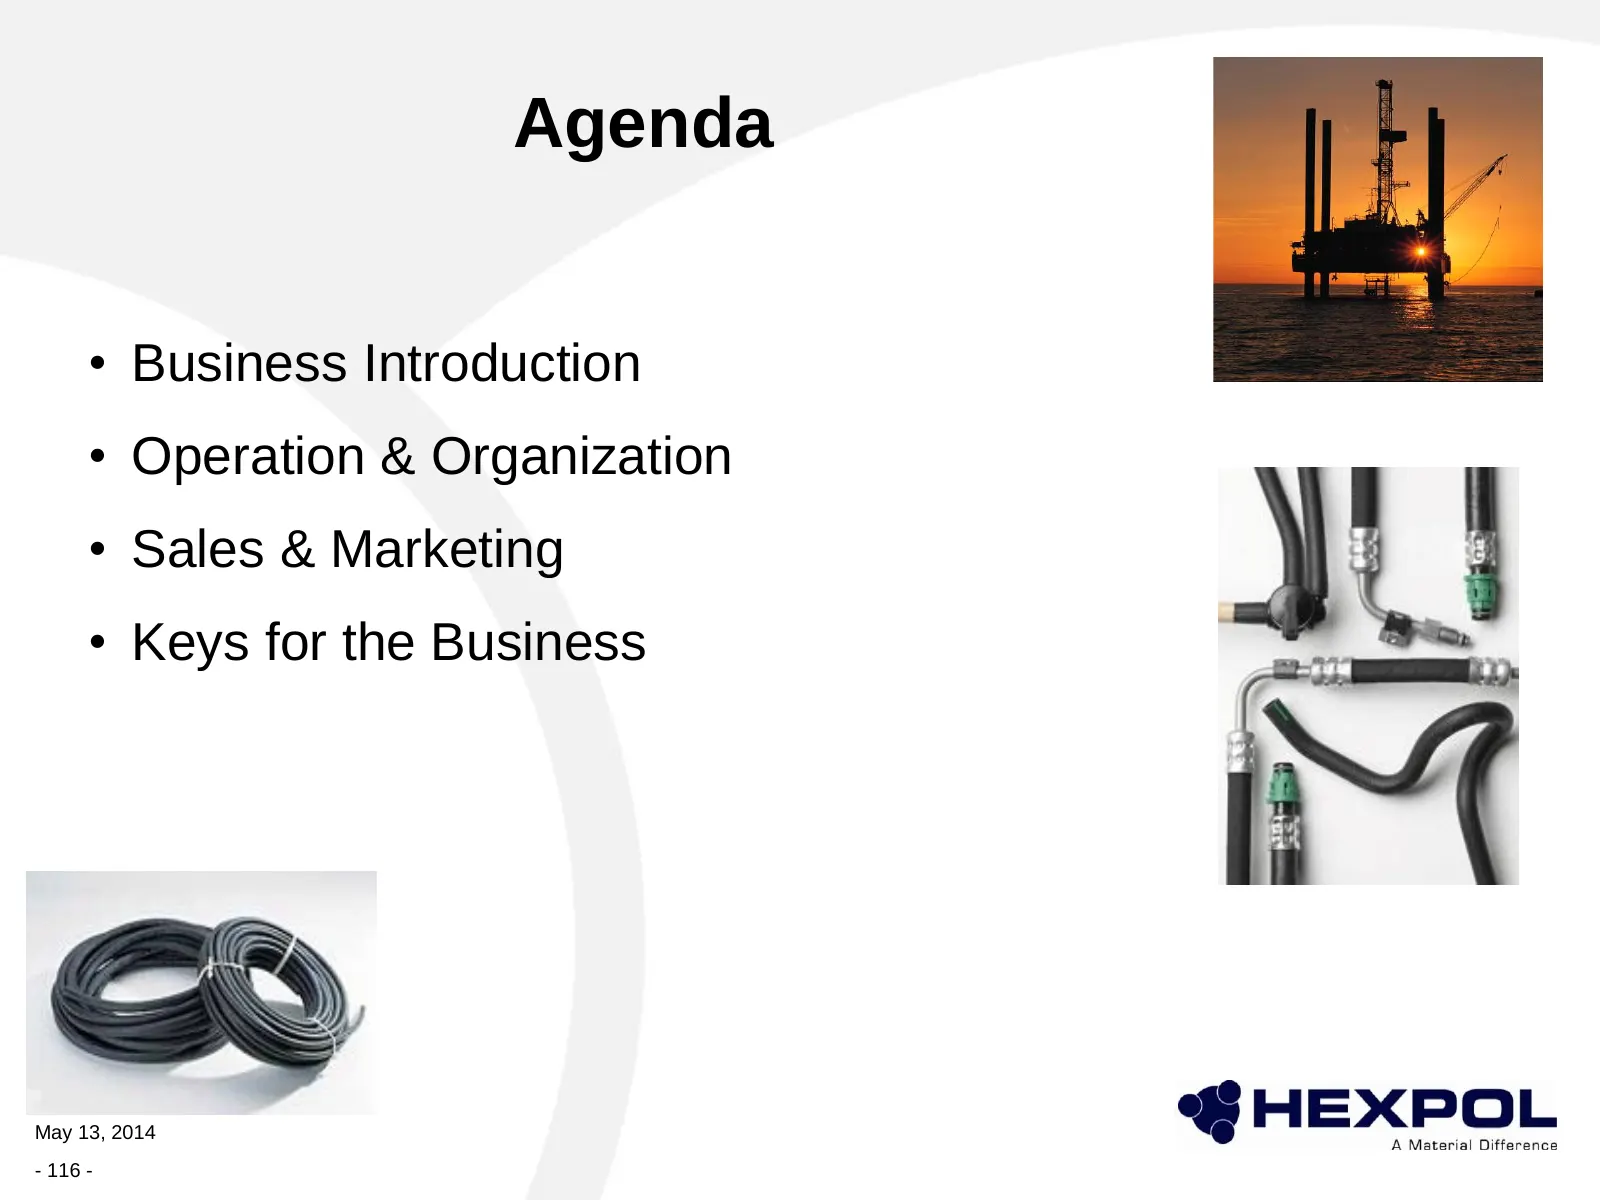
Agenda • Business Introduction • Operation & Organization • Sales & Marketing • Keys for the Business May 13, 2014 - 116 -
Slide 117: NAFTA Compounding
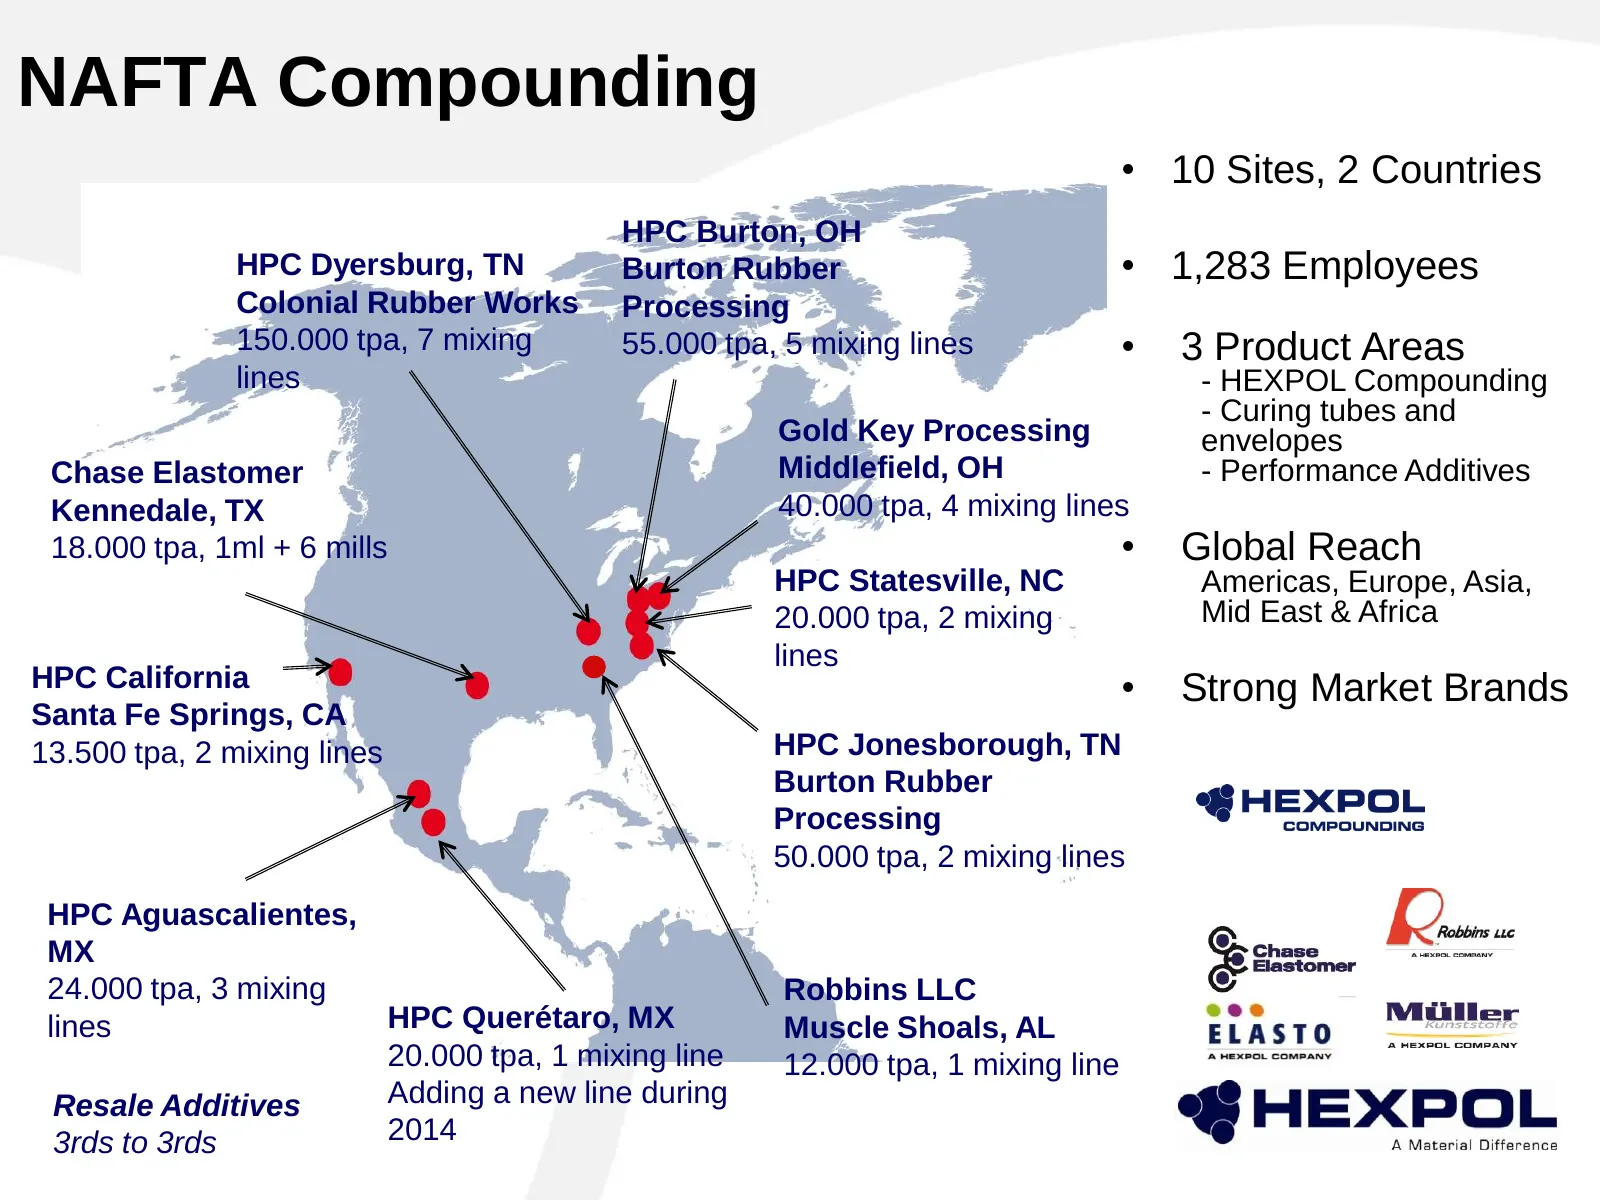
NAFTA Compounding • 10 Sites, 2 Countries HPC Burton, OH HPC Dyersburg, TN Burton Rubber • 1,283 Employees Colonial Rubber Works Processing 150.000 tpa, 7 mixing 55.000 tpa, 5 mixing lines • 3 Product Areas lines - HEXPOL Compounding - Curing tubes and Gold Key Processing envelopes Chase Elastomer M
Slide 118: HEXPOL Compounding NAFTA Organization
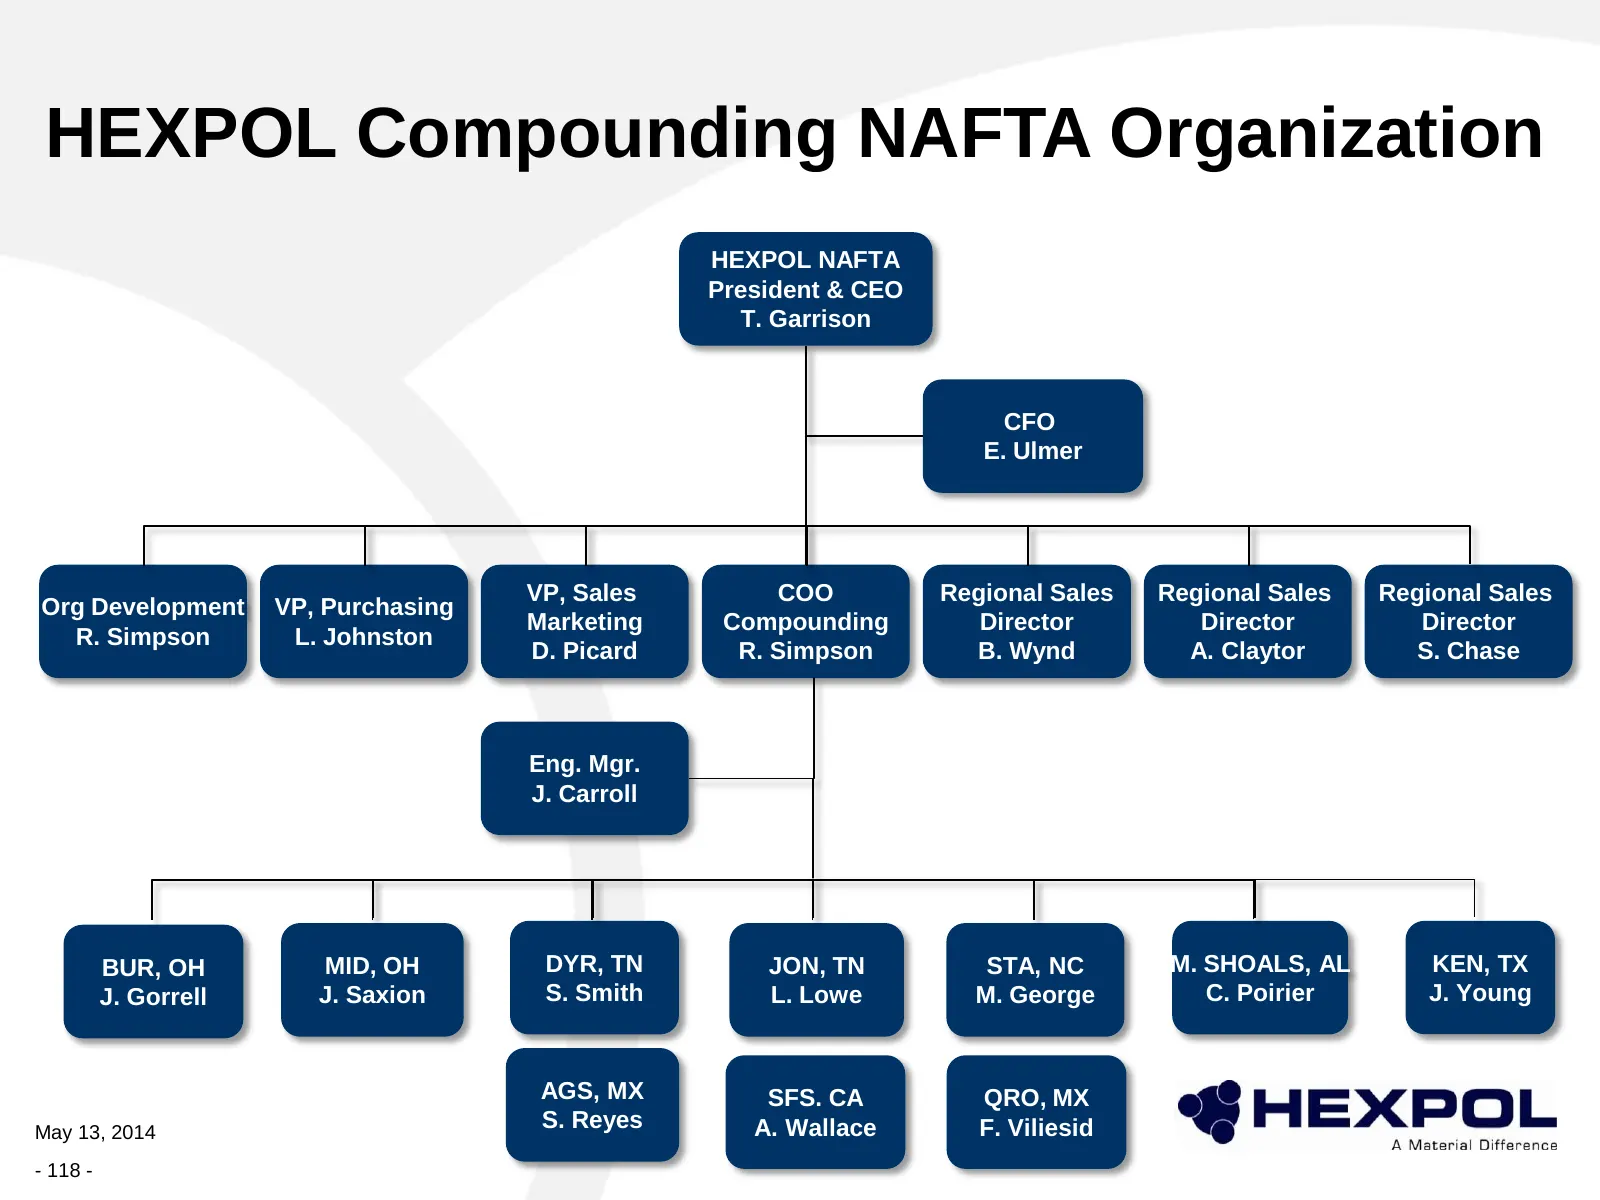
HEXPOL Compounding NAFTA Organization HEXPOL NAFTA President & CEO T. Garrison CFO E. Ulmer VP, Sales COO Regional Sales Regional Sales Regional Sales Org Development VP, Purchasing Marketing Compounding Director Director Director R. Simpson L. Johnston D. Picard R. Simpson B. Wynd A. Claytor S. Cha
Slide 119: Organizational Development
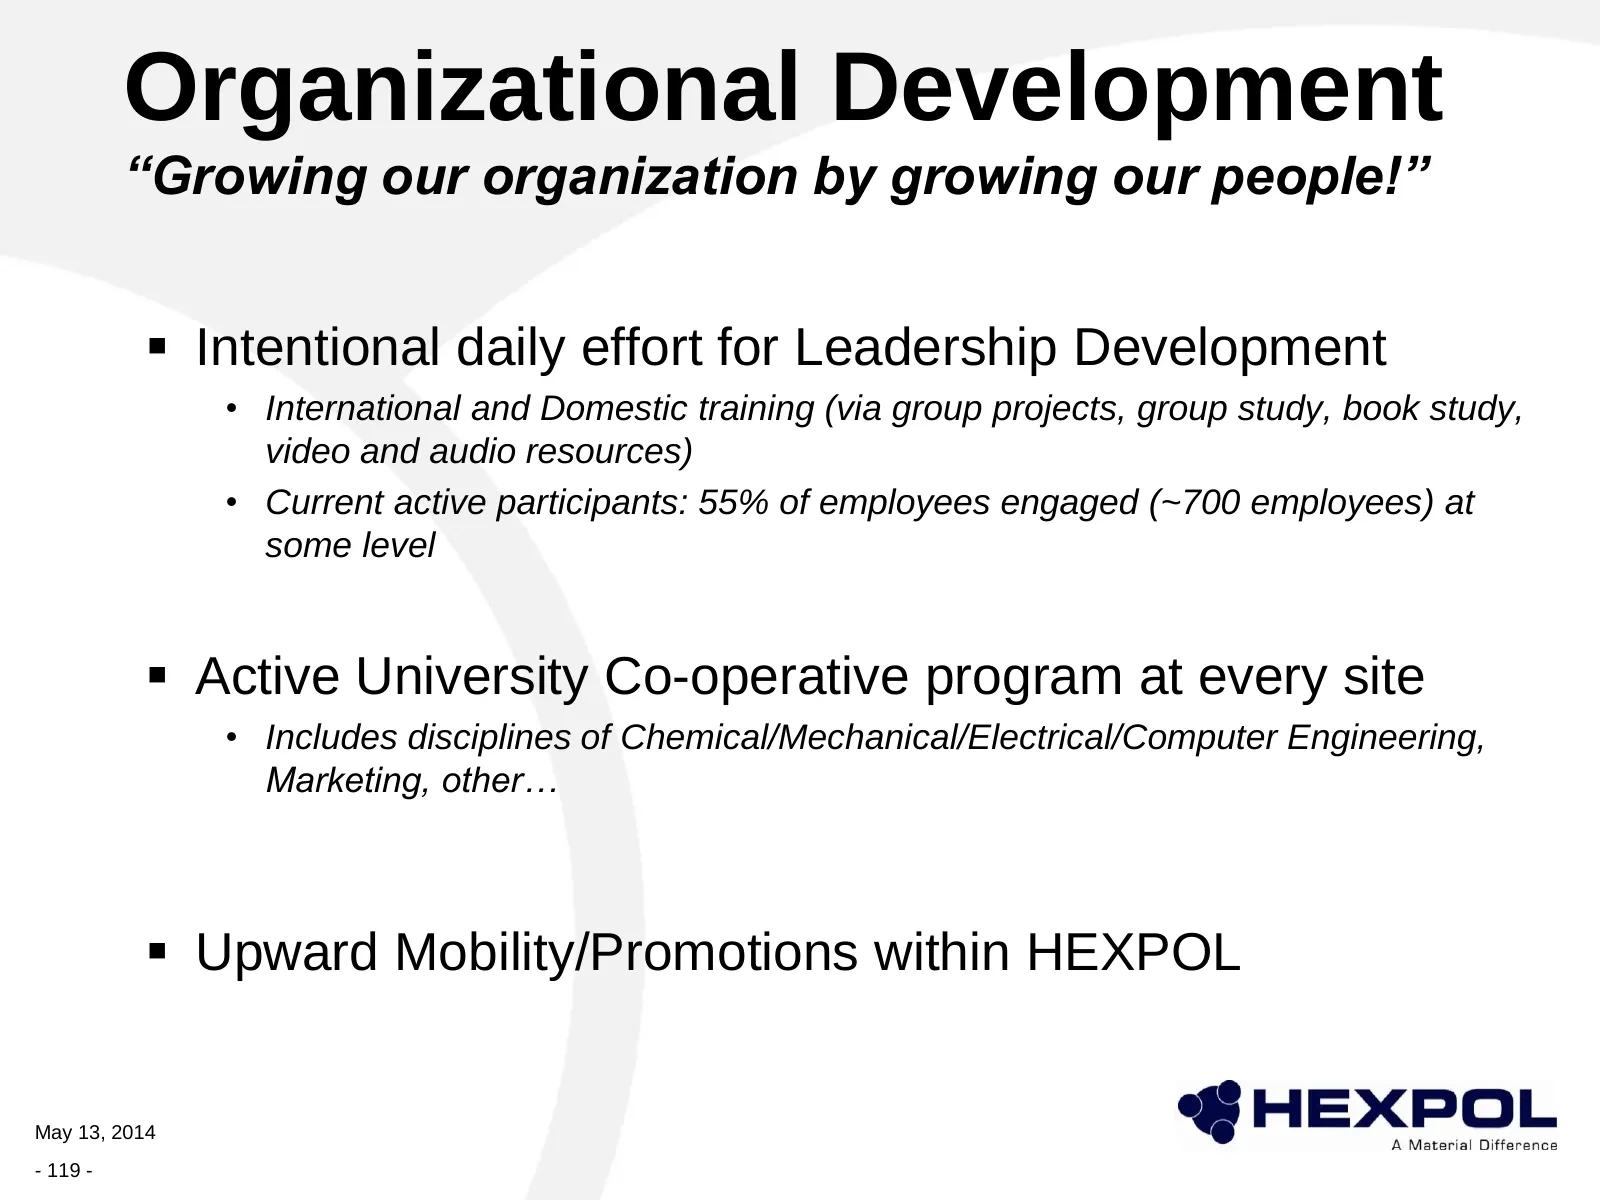
Organizational Development “Growing our organization by growing our people!” Intentional daily effort for Leadership Development • International and Domestic training (via group projects, group study, book study, video and audio resources) • Current active participants: 55% of employees engaged (~
Slide 120: Focused development capabilities
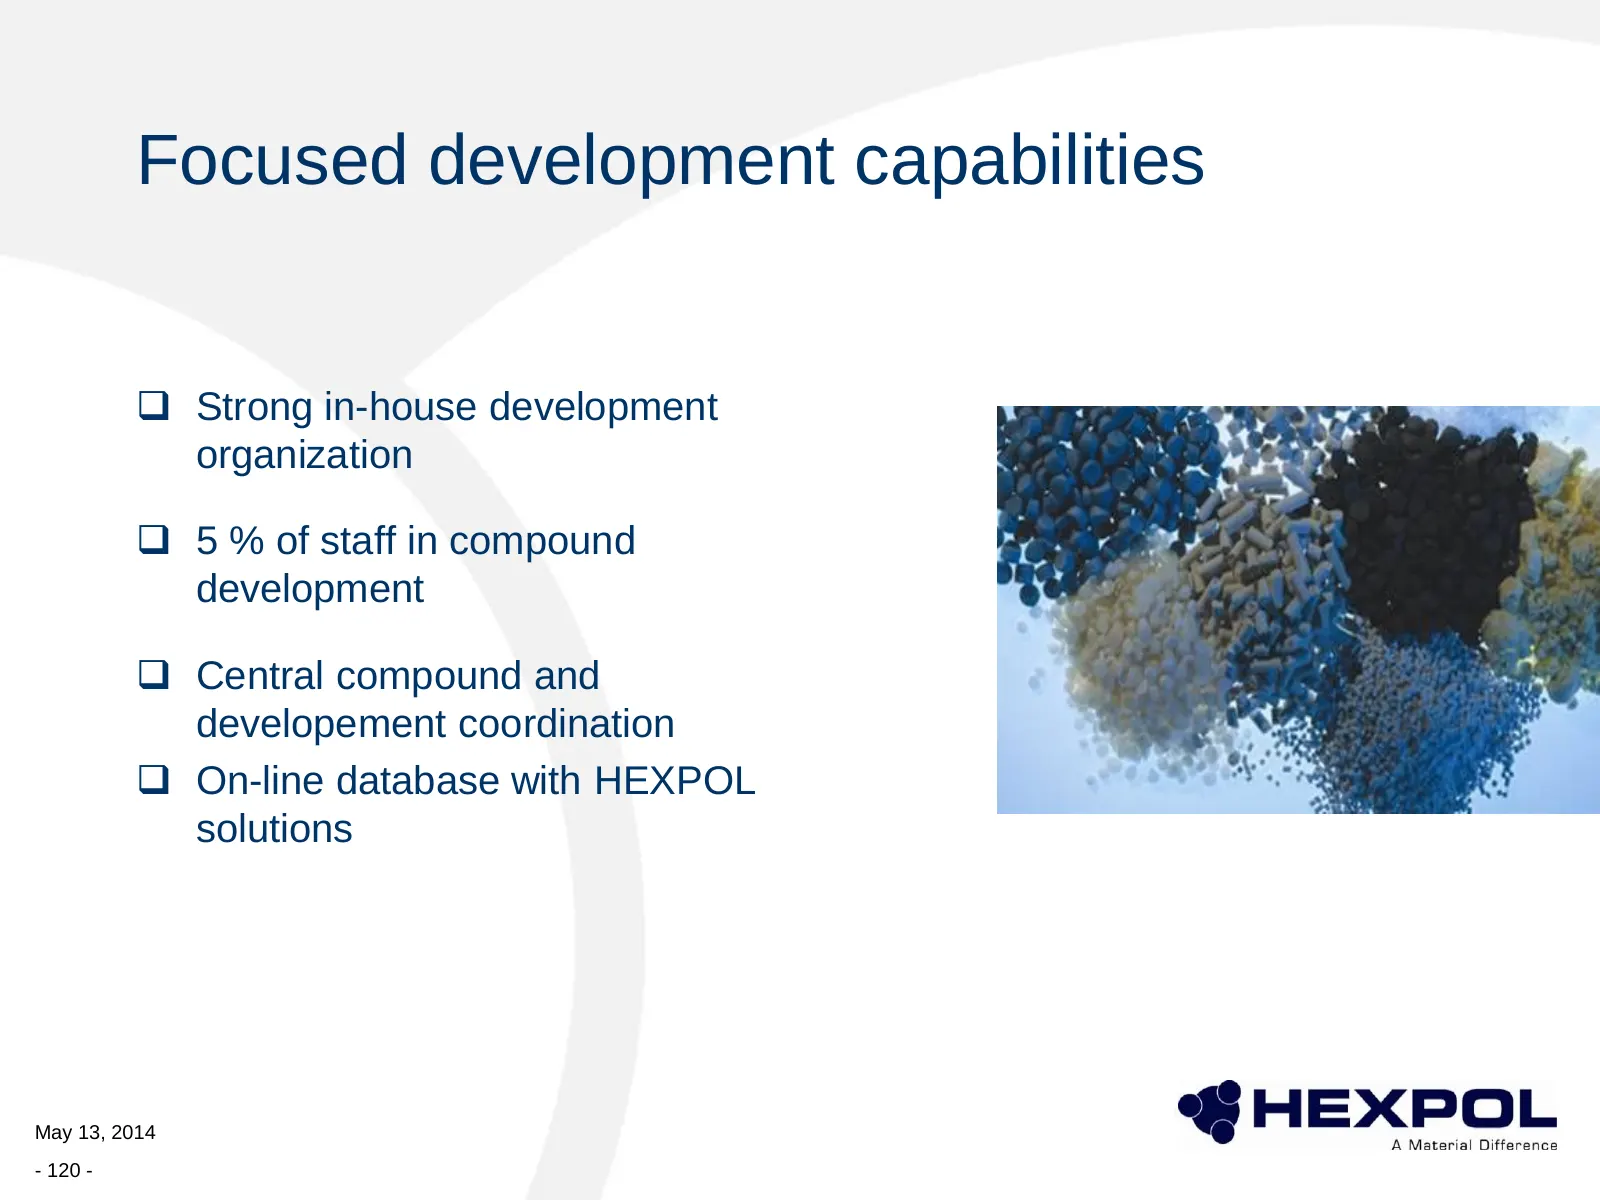
Focused development capabilities Strong in-house development organization 5 % of staff in compound development Central compound and developement coordination On-line database with HEXPOL solutions May 13, 2014 - 120 -
Slide 121: Products
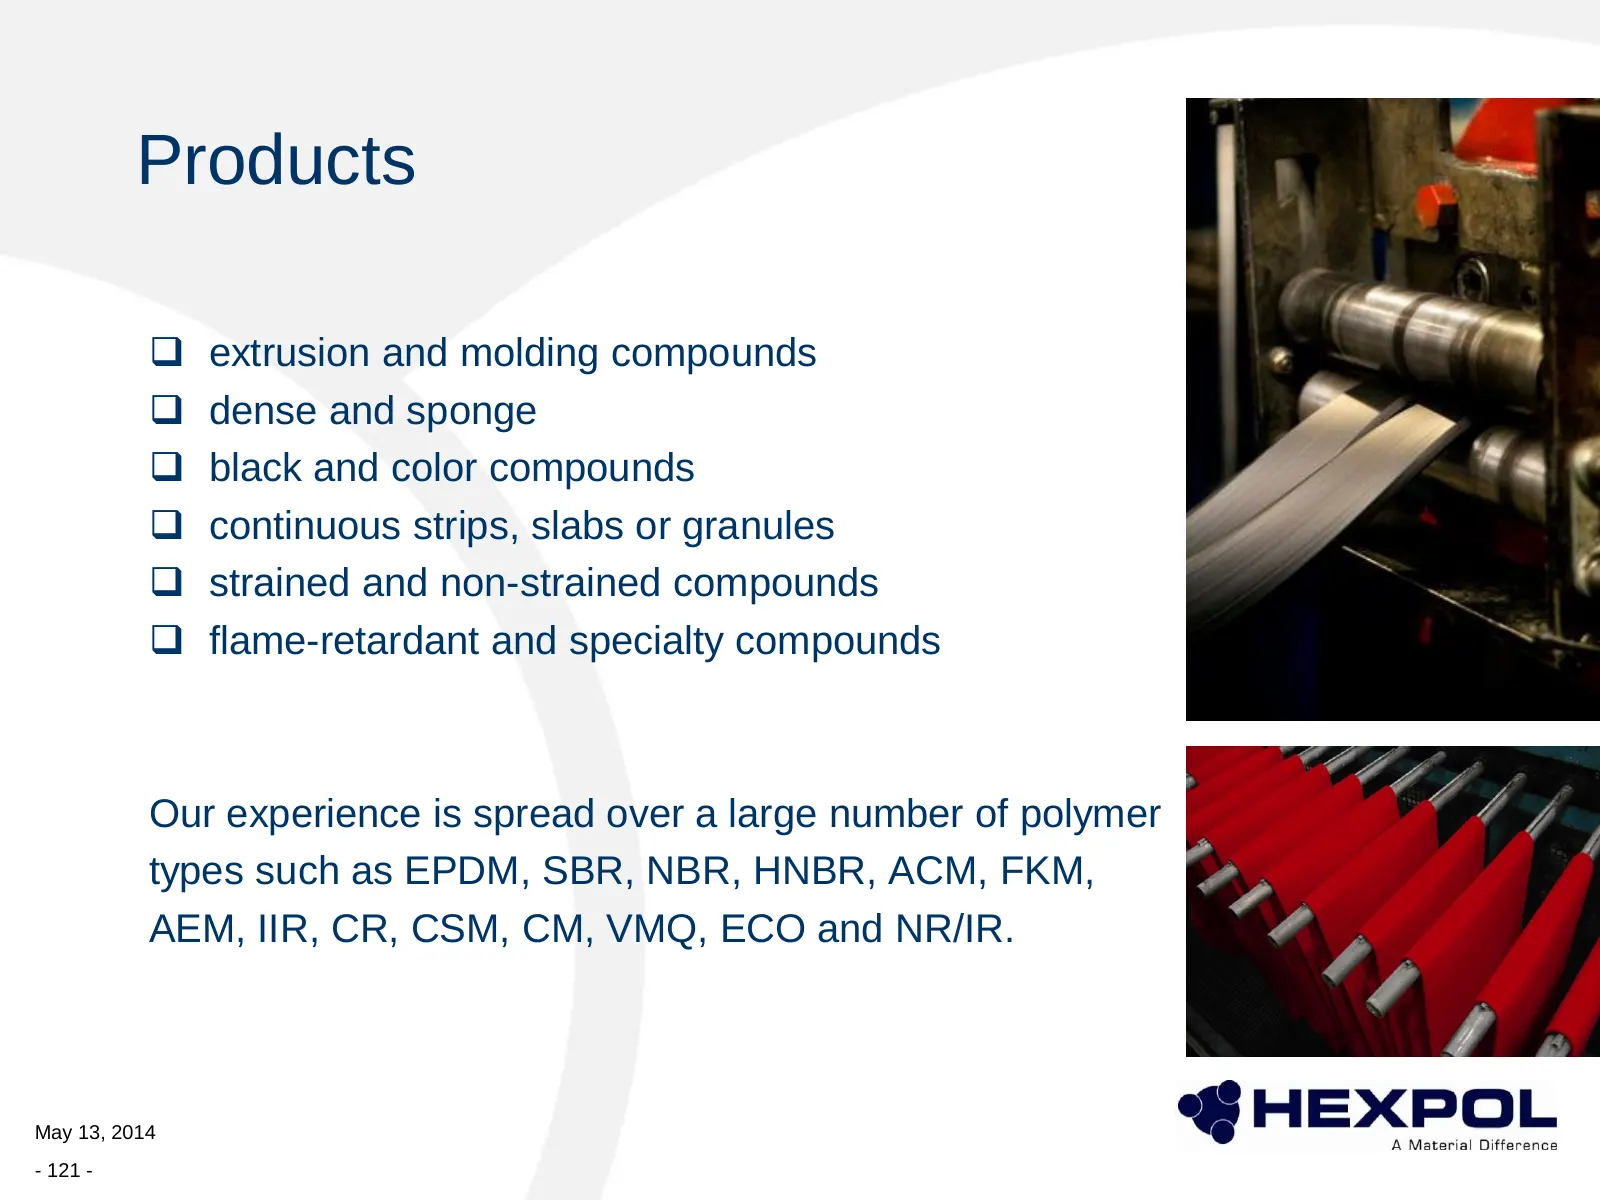
Products extrusion and molding compounds dense and sponge black and color compounds continuous strips, slabs or granules strained and non-strained compounds flame-retardant and specialty compounds Our experience is spread over a large number of polymer types such as EPDM, SBR, NBR, HNBR,
Slide 122: Our market segments
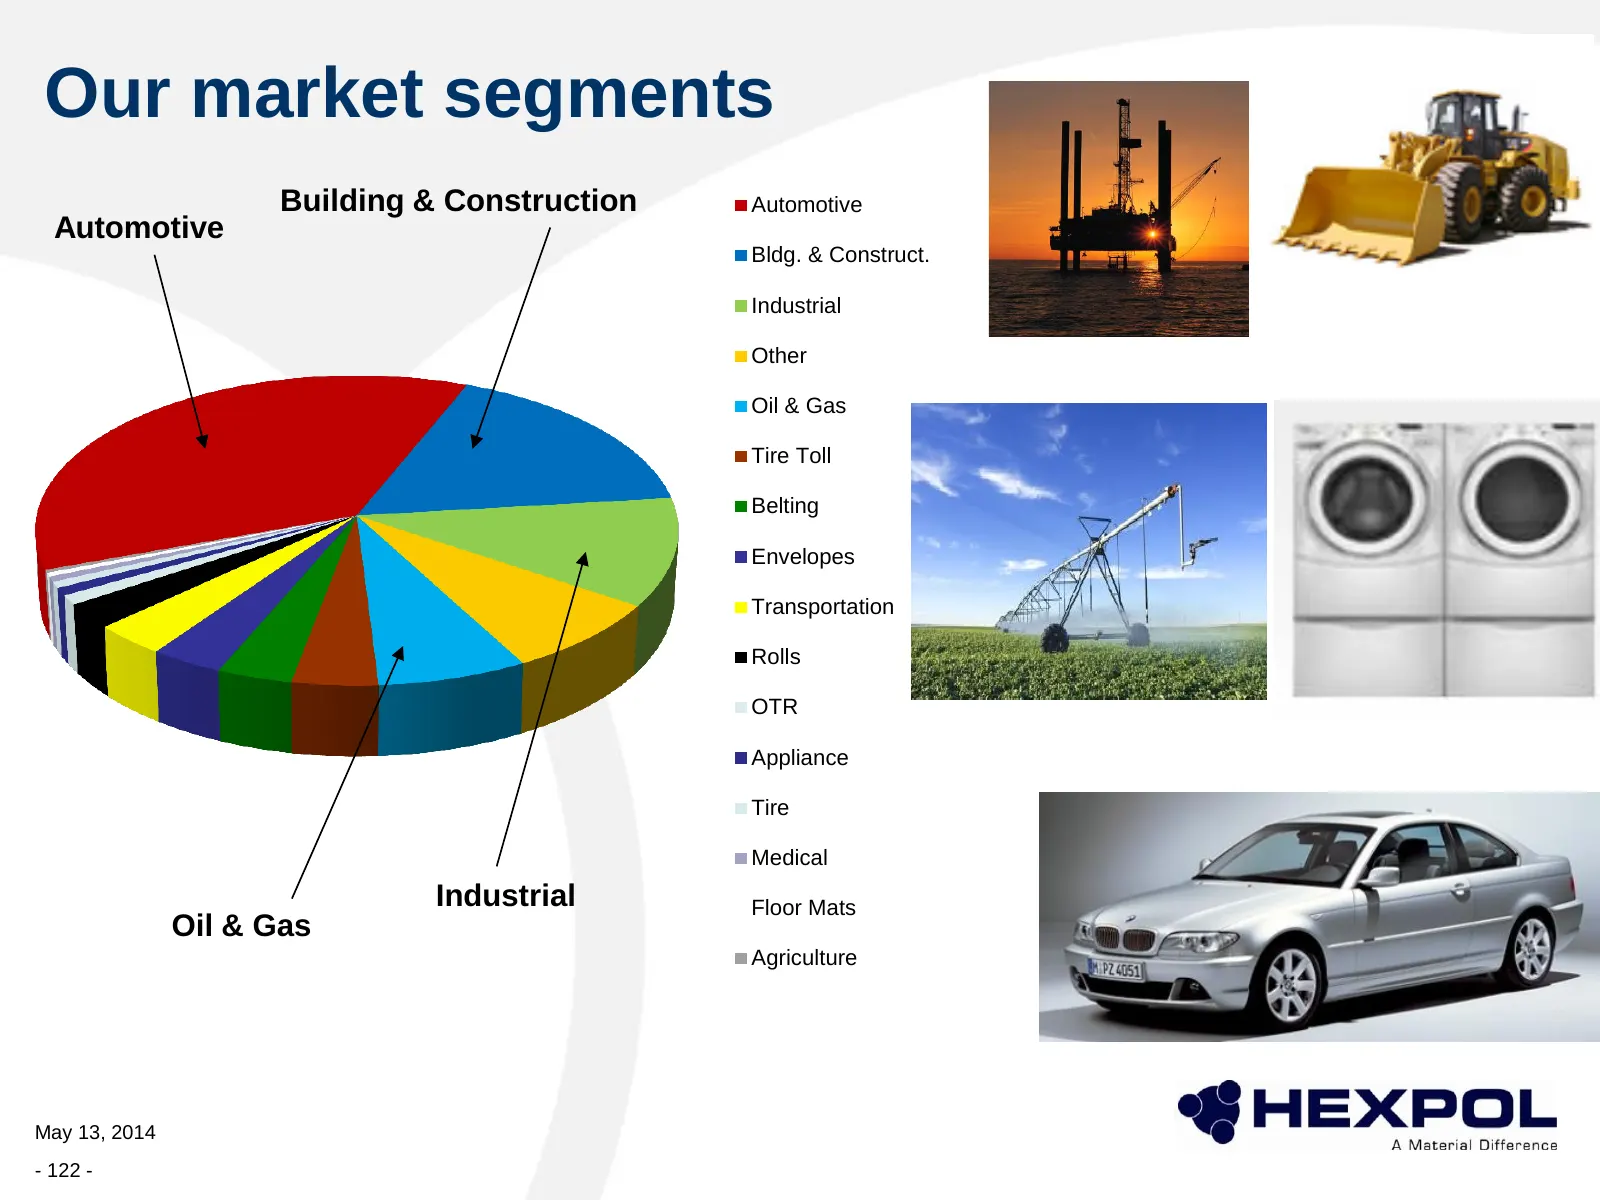
Our market segments Building & Construction Automotive Automotive Bldg. & Construct. Industrial Other Oil & Gas Tire Toll Belting Envelopes Transportation Rolls OTR Appliance Tire Medical Industrial Floor Mats Oil & Gas Agriculture May 13, 2014 - 122 -
Slide 123: Automotive Segmentation (Americas)
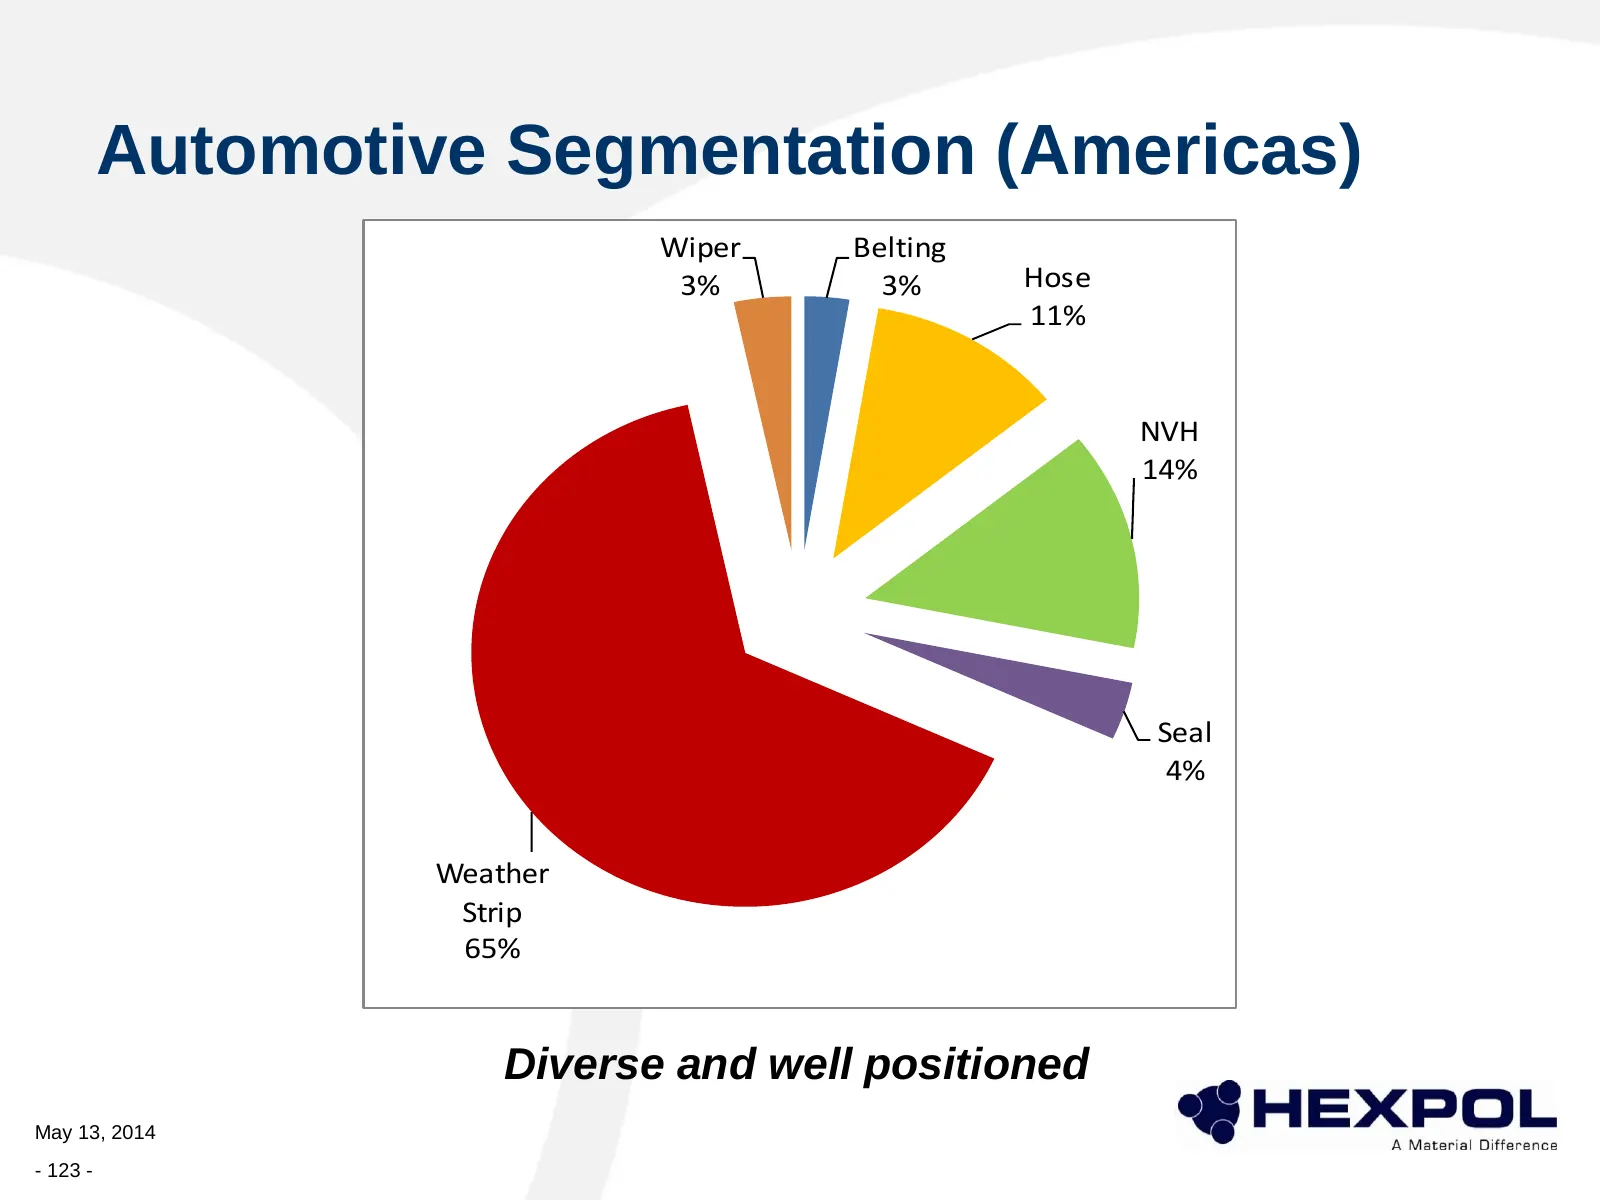
Automotive Segmentation (Americas) Wiper Belting 3% 3% Hose 11% NVH 14% Seal 4% Weather Strip 65% Diverse and well positioned May 13, 2014 - 123 -
Slide 124: We have an international and balanced customer base
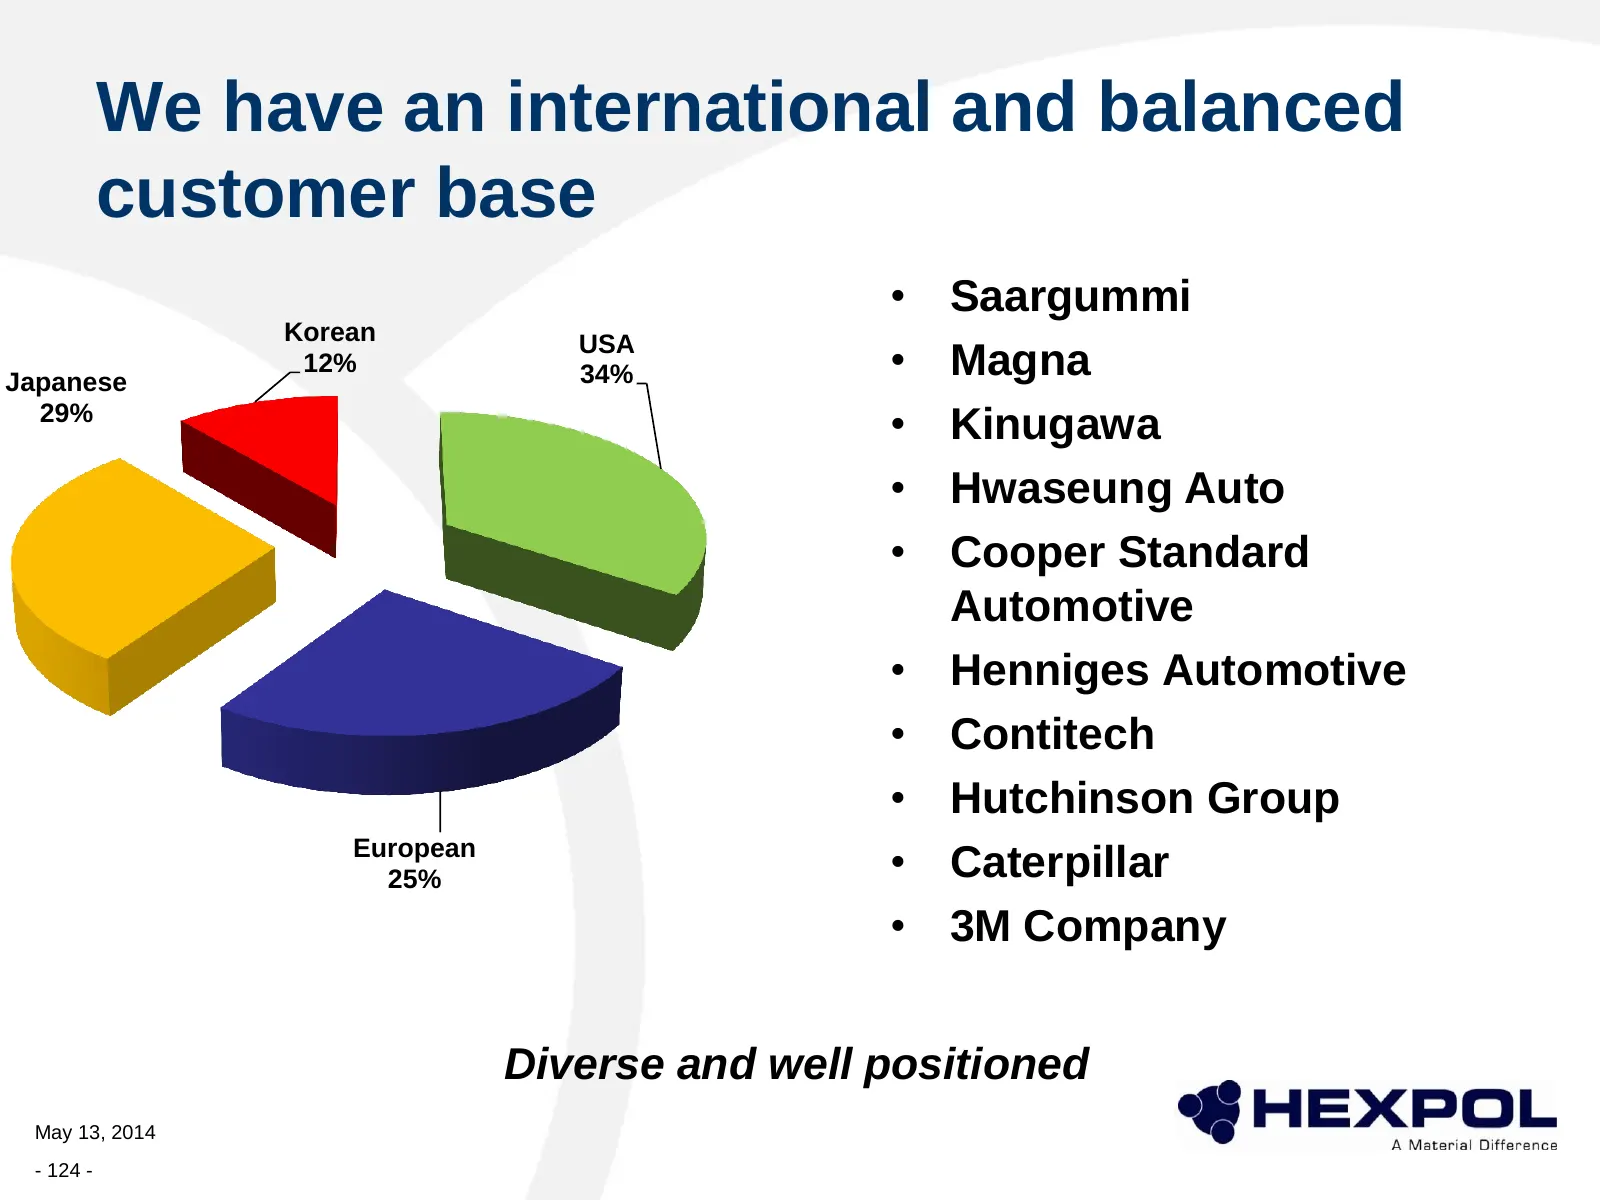
We have an international and balanced customer base • Saargummi Korean USA Japanese 12% 34% • Magna 29% • Kinugawa • Hwaseung Auto • Cooper Standard Automotive • Henniges Automotive • Contitech • Hutchinson Group European 25% • Caterpillar • 3M Company Diverse and well positioned May 13, 2014 - 124
Slide 125: Mexico Automotive Sector
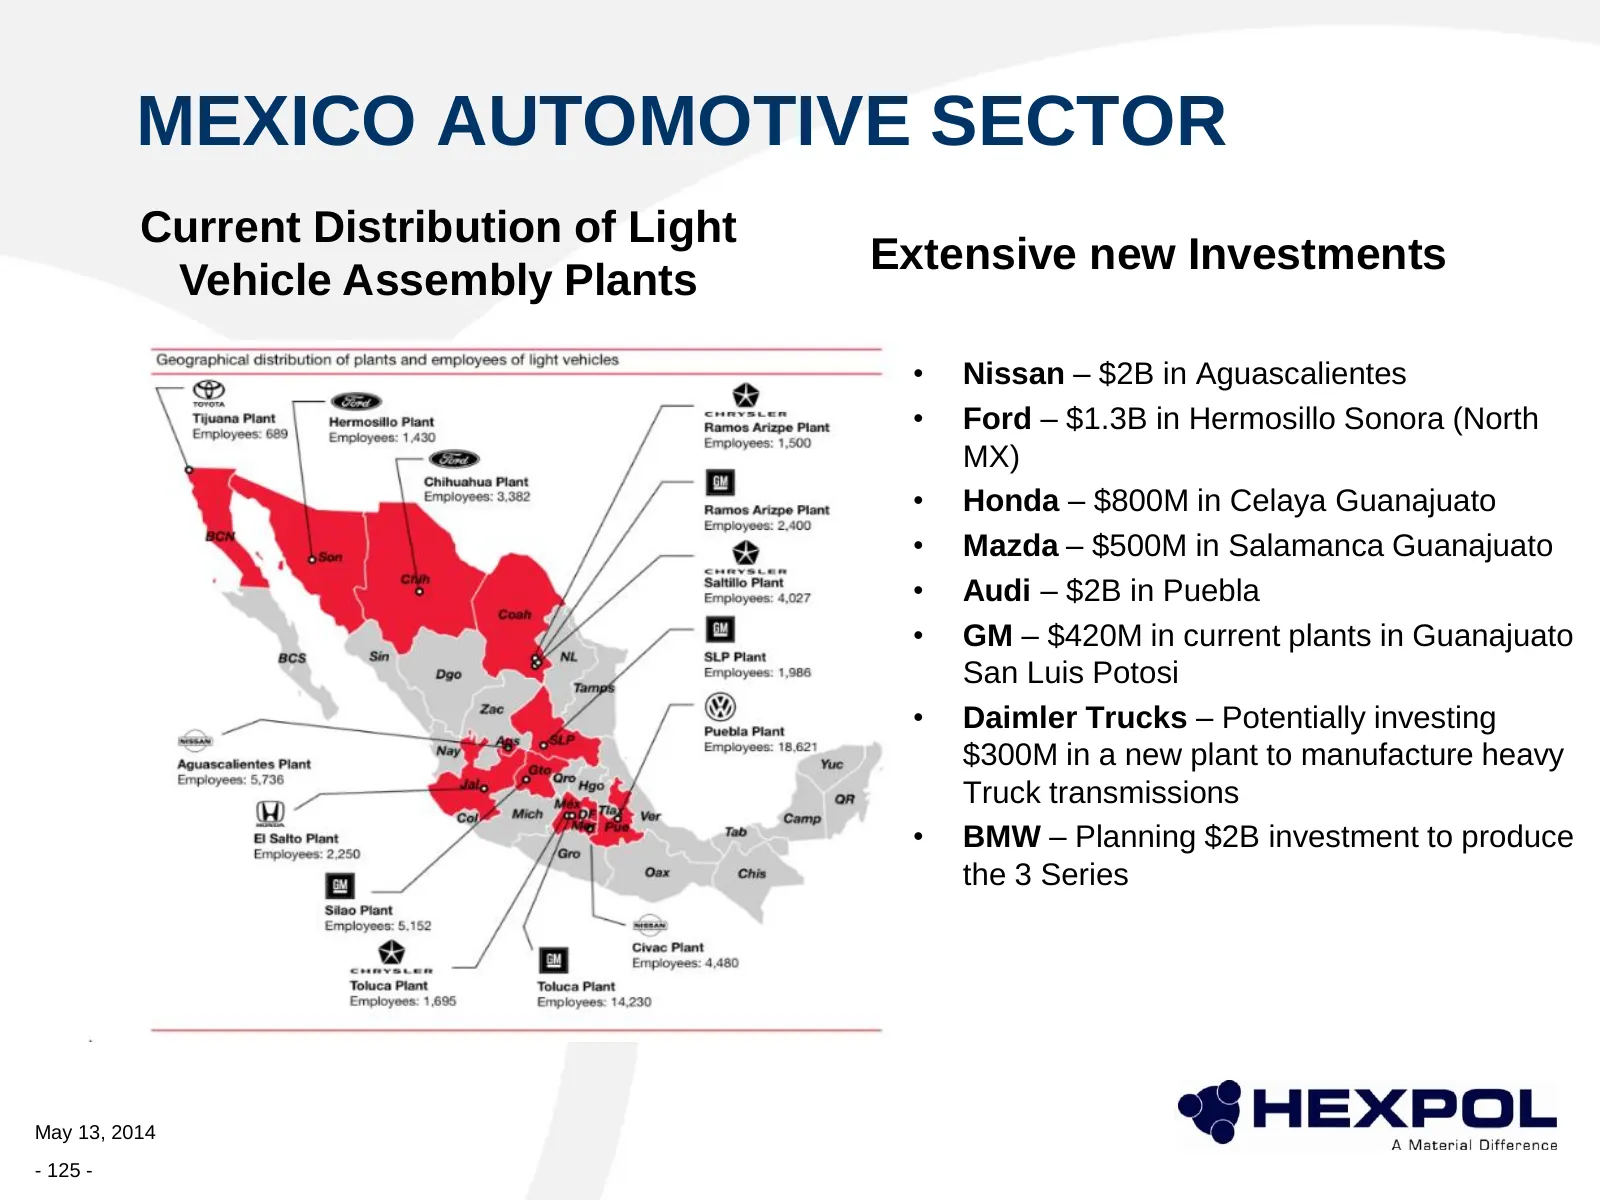
MEXICO AUTOMOTIVE SECTOR Current Distribution of Light Extensive new Investments Vehicle Assembly Plants • Nissan – $2B in Aguascalientes • Ford – $1.3B in Hermosillo Sonora (North MX) • Honda – $800M in Celaya Guanajuato • Mazda – $500M in Salamanca Guanajuato • Audi – $2B in Puebla • GM – $420M in
Slide 126: Priorities
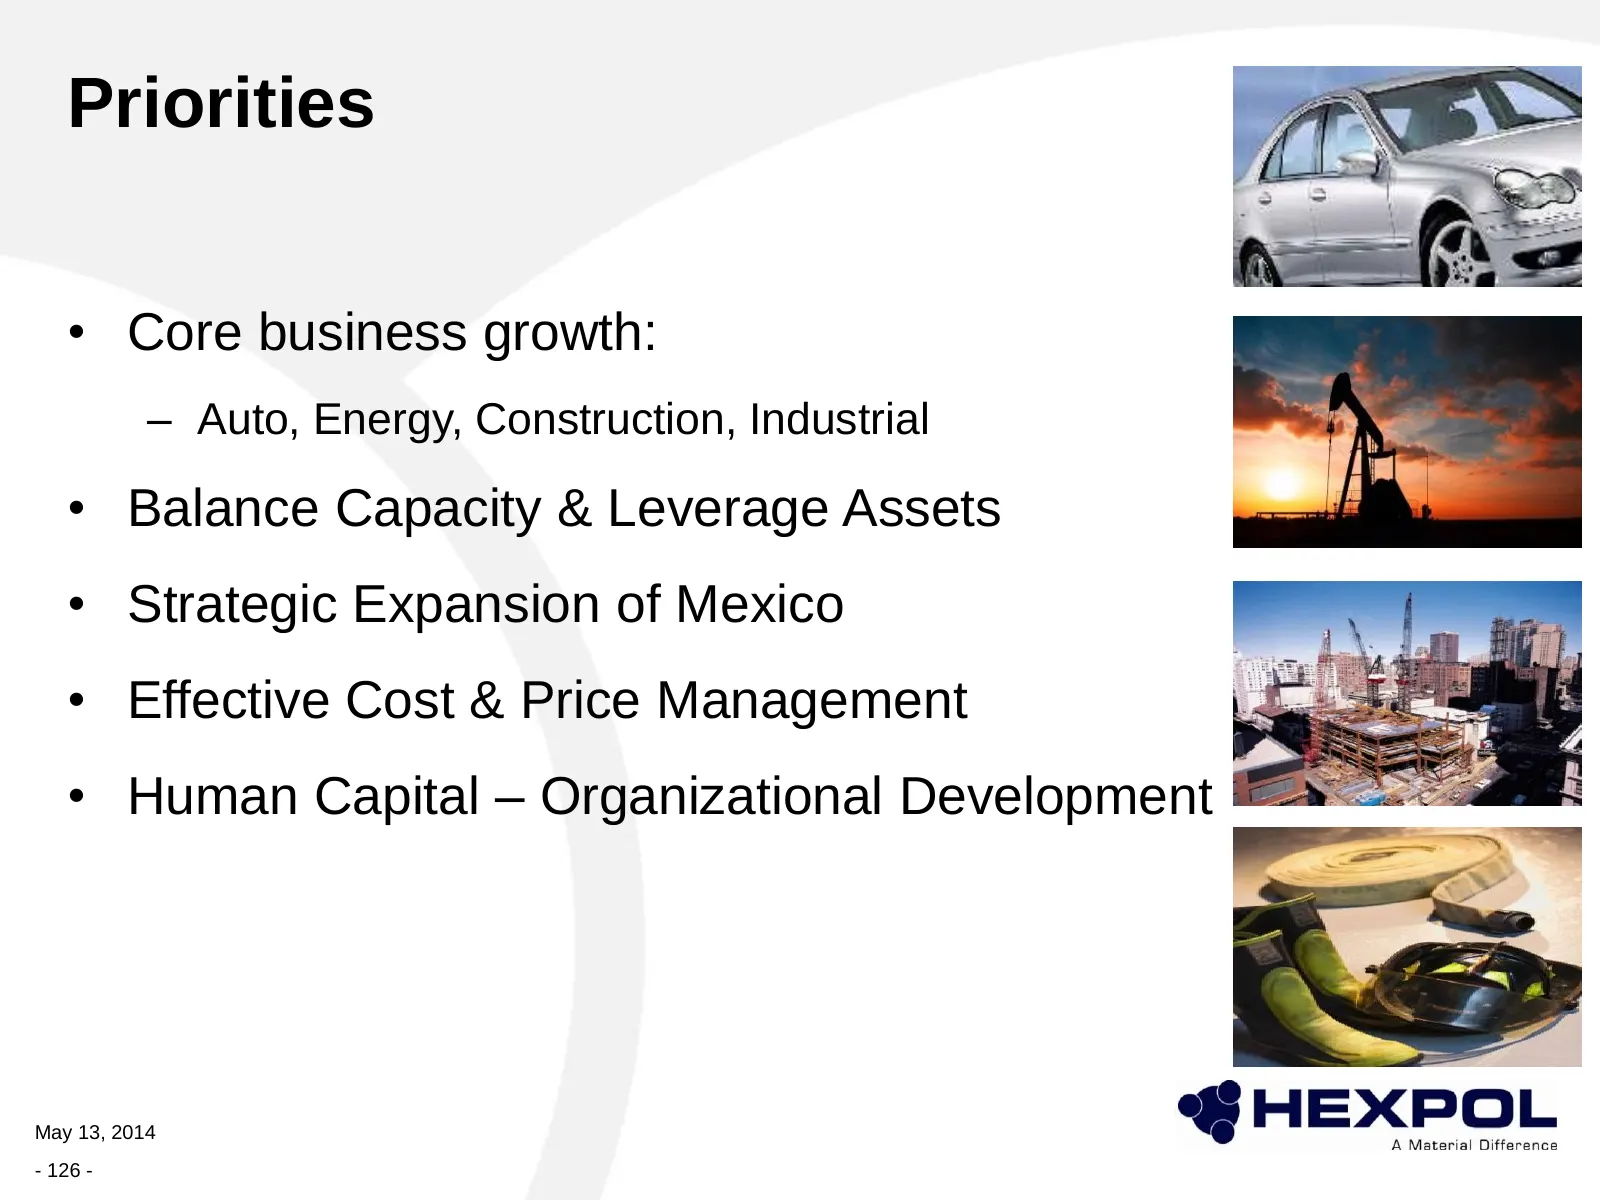
Priorities • Core business growth: – Auto, Energy, Construction, Industrial • Balance Capacity & Leverage Assets • Strategic Expansion of Mexico • Effective Cost & Price Management • Human Capital – Organizational Development May 13, 2014 - 126 -
Slide 127: Sector update: a spotlight on energy & growth
SECTOR UPDATE A SPOTLIGHT ON ENERGY & GROWTH Intentionality In Everything we Do May 13, 2014 - 127 -
Slide 128: Specialized Product Expansion
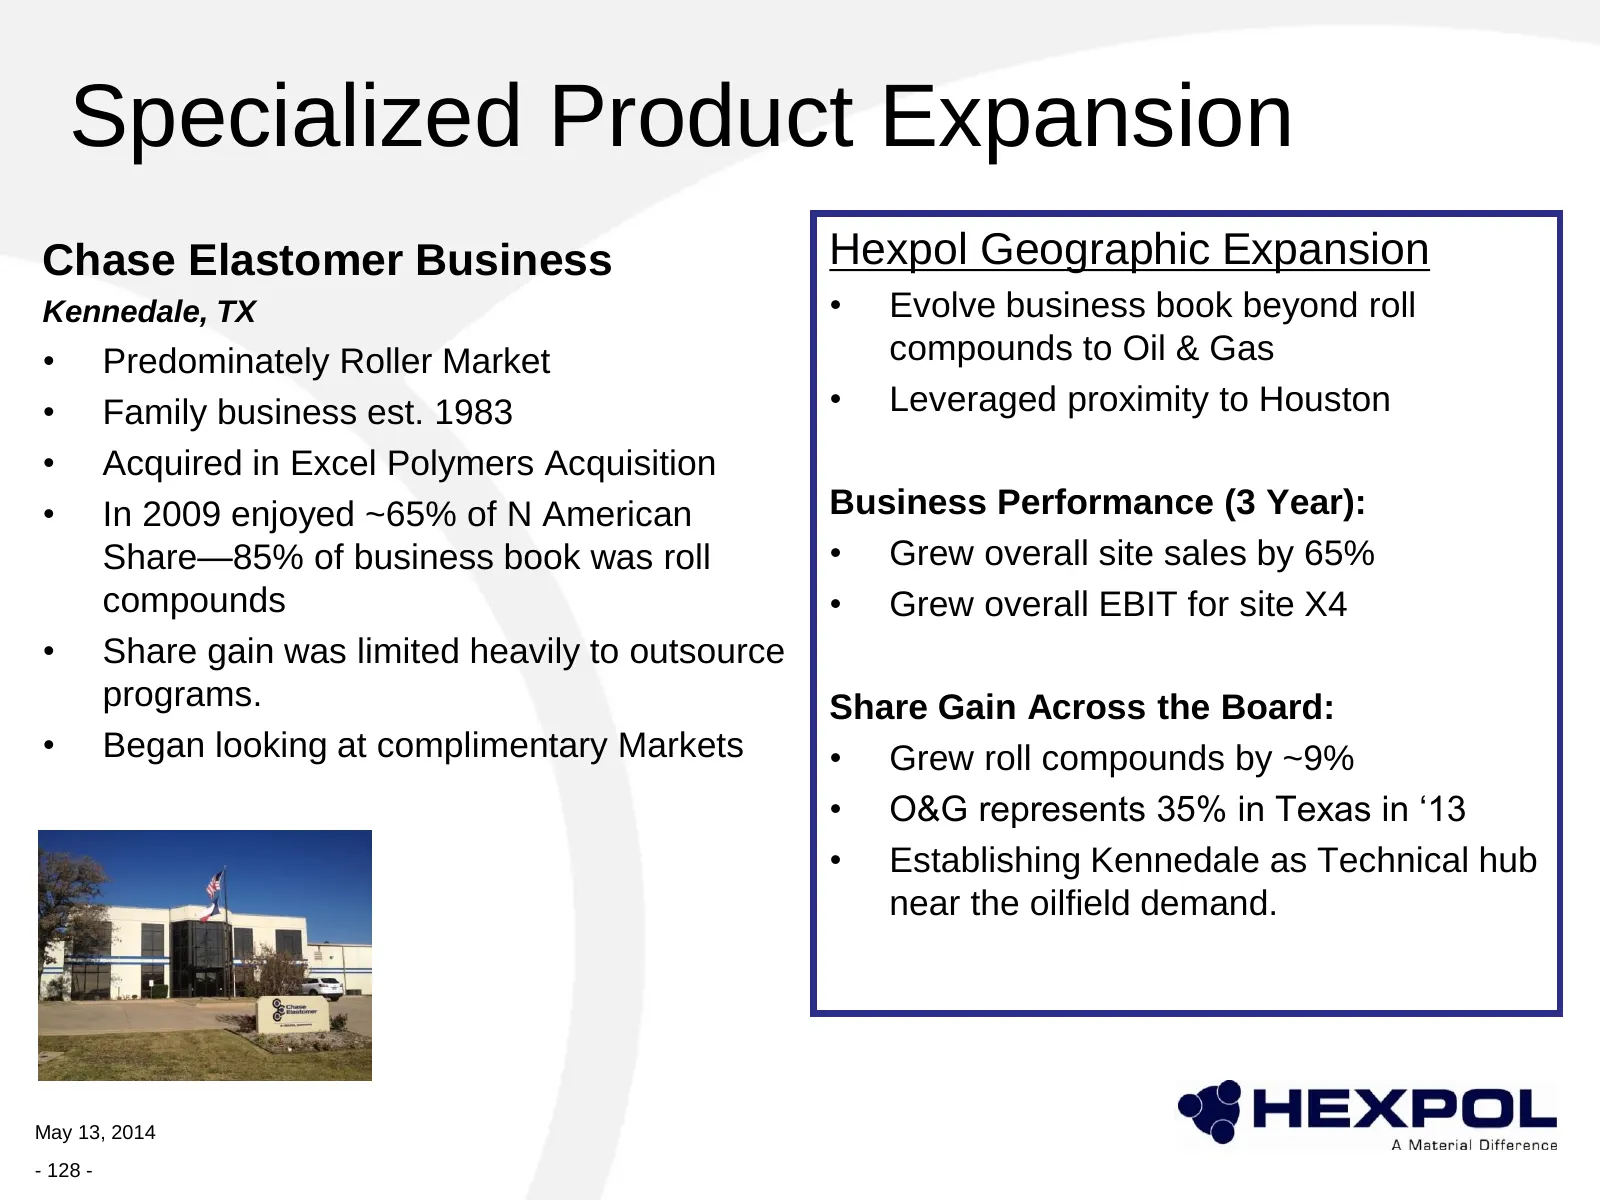
Specialized Product Expansion Chase Elastomer Business Hexpol Geographic Expansion Kennedale, TX • Evolve business book beyond roll • Predominately Roller Market compounds to Oil & Gas • Family business est. 1983 • Leveraged proximity to Houston • Acquired in Excel Polymers Acquisition • In 2009 enj
Slide 129: Who buys rubber for Oil & Gas?
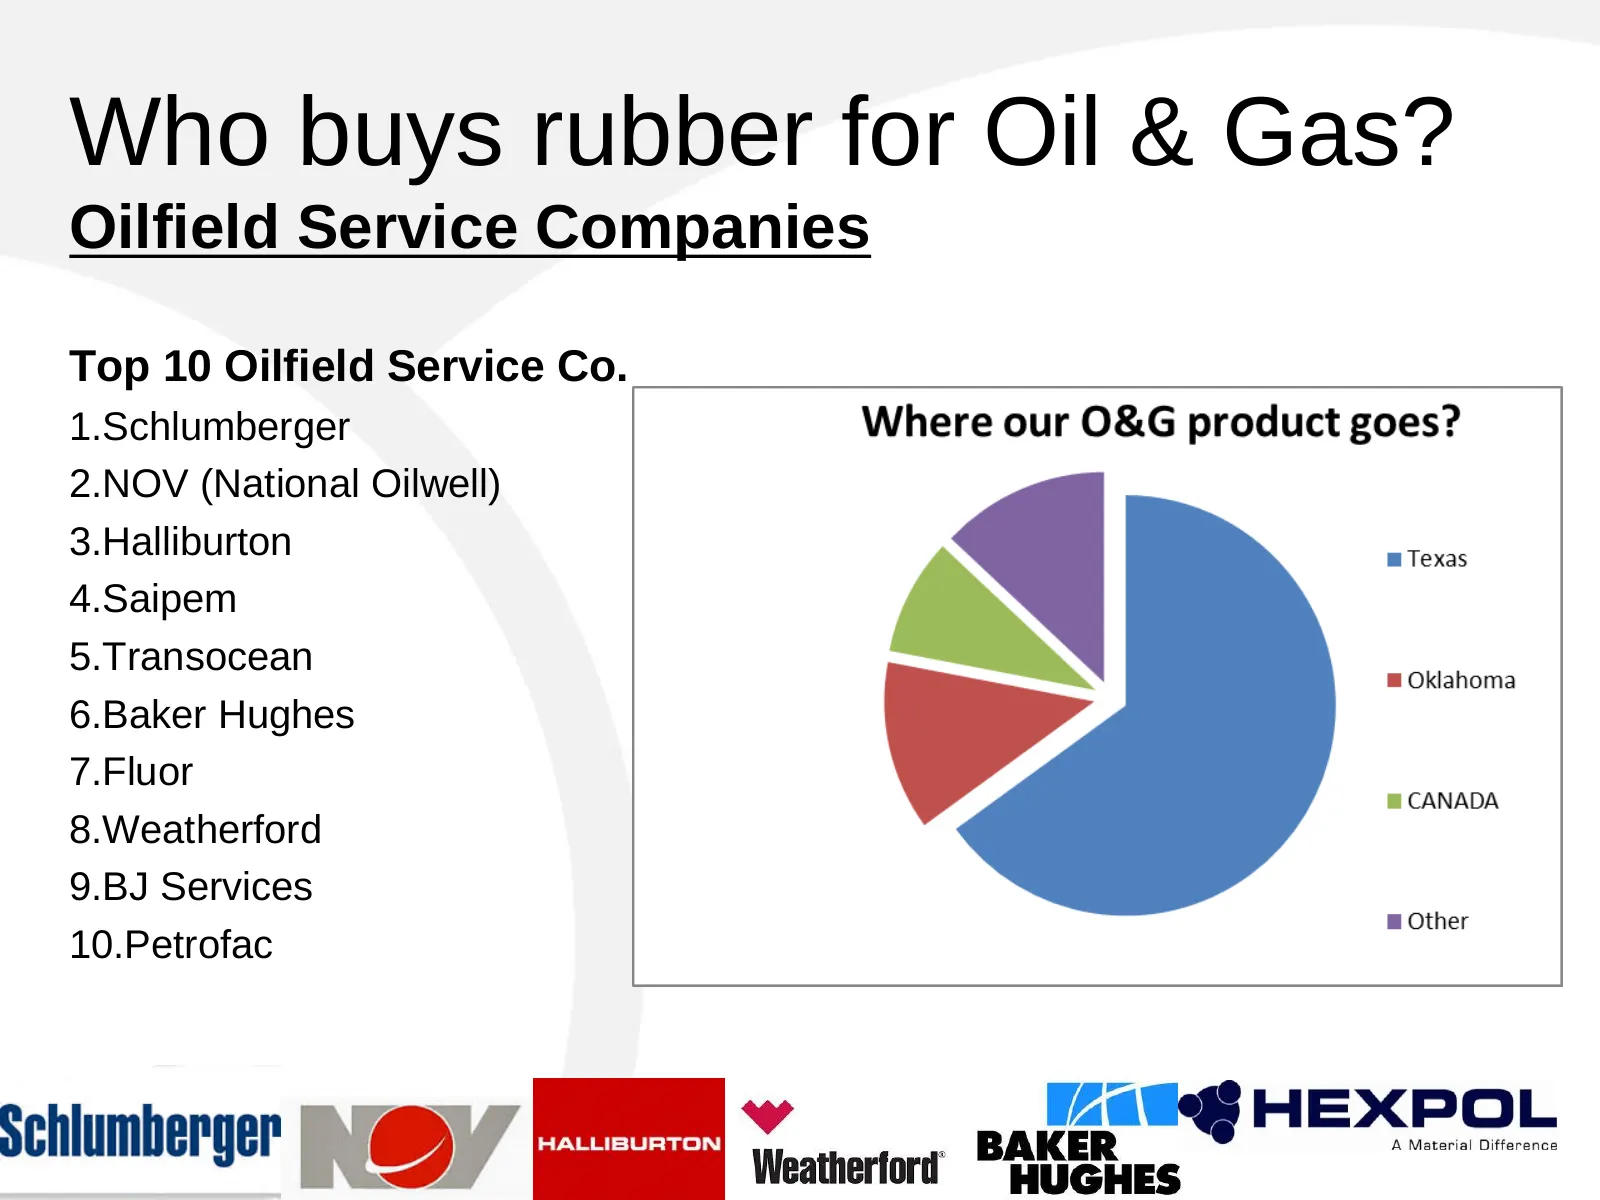
Who buys rubber for Oil & Gas? Oilfield Service Companies Top 10 Oilfield Service Co. 1.Schlumberger 2.NOV (National Oilwell) 3.Halliburton 4.Saipem 5.Transocean 6.Baker Hughes 7.Fluor 8.Weatherford 9.BJ Services 10.Petrofac May 13, 2014 - 129 -
Slide 130: Why Oil & Gas?
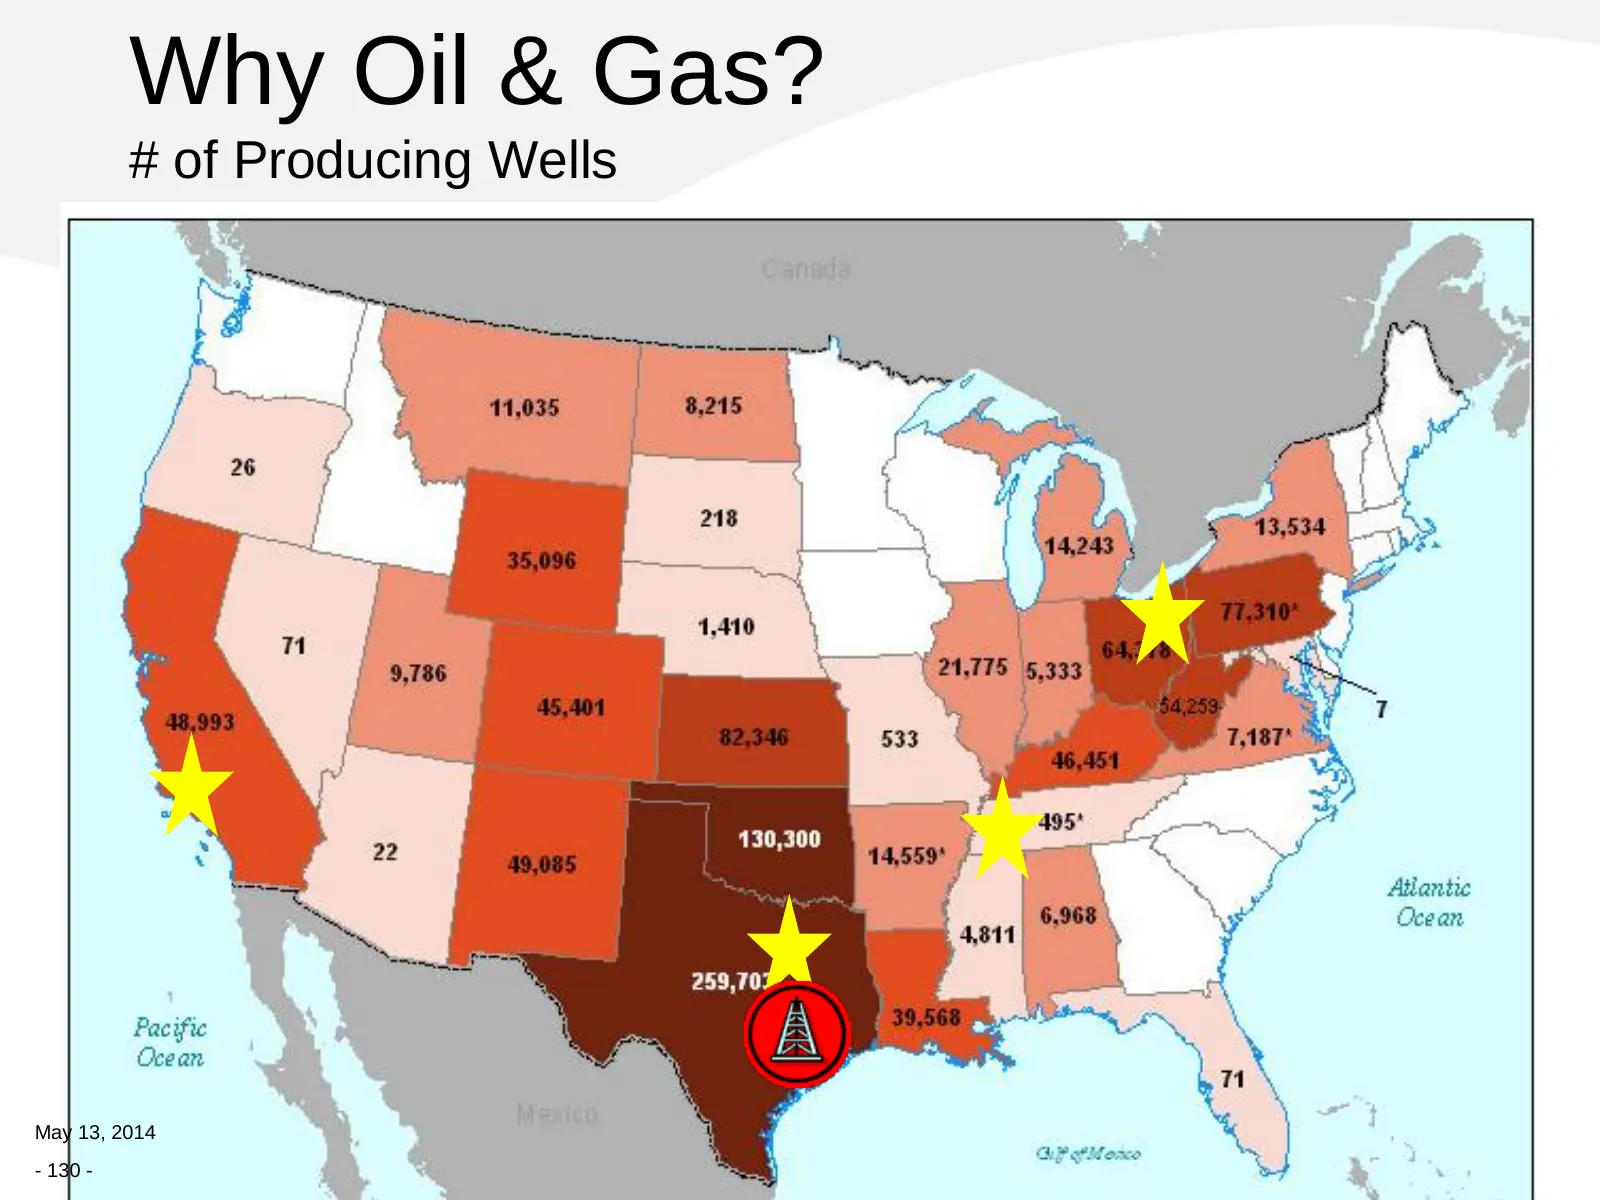
Why Oil & Gas? # of Producing Wells May 13, 2014 - 130 -
Slide 131: NAFTA O&G Market - Rig Count
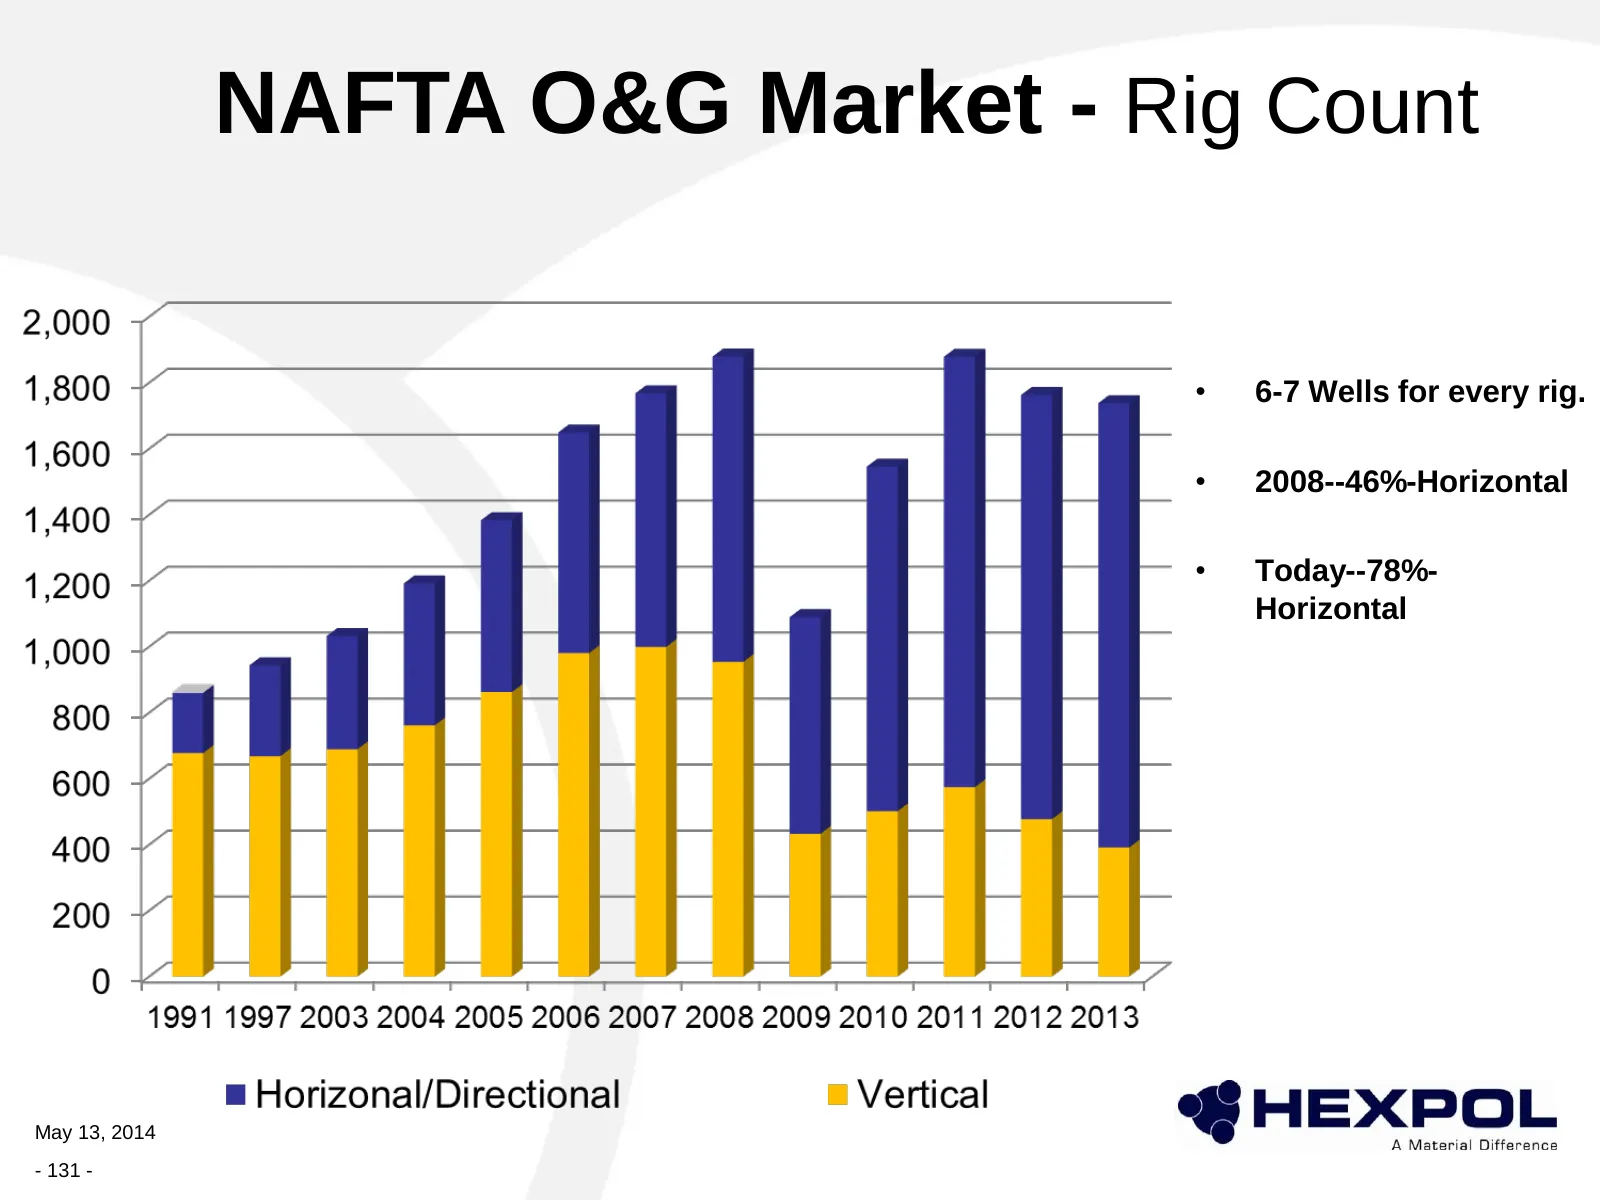
NAFTA O&G Market - Rig Count • 6-7 Wells for every rig. • 2008--46%-Horizontal • Today--78%- Horizontal May 13, 2014 - 131 -
Slide 132: Why Oil & Gas?
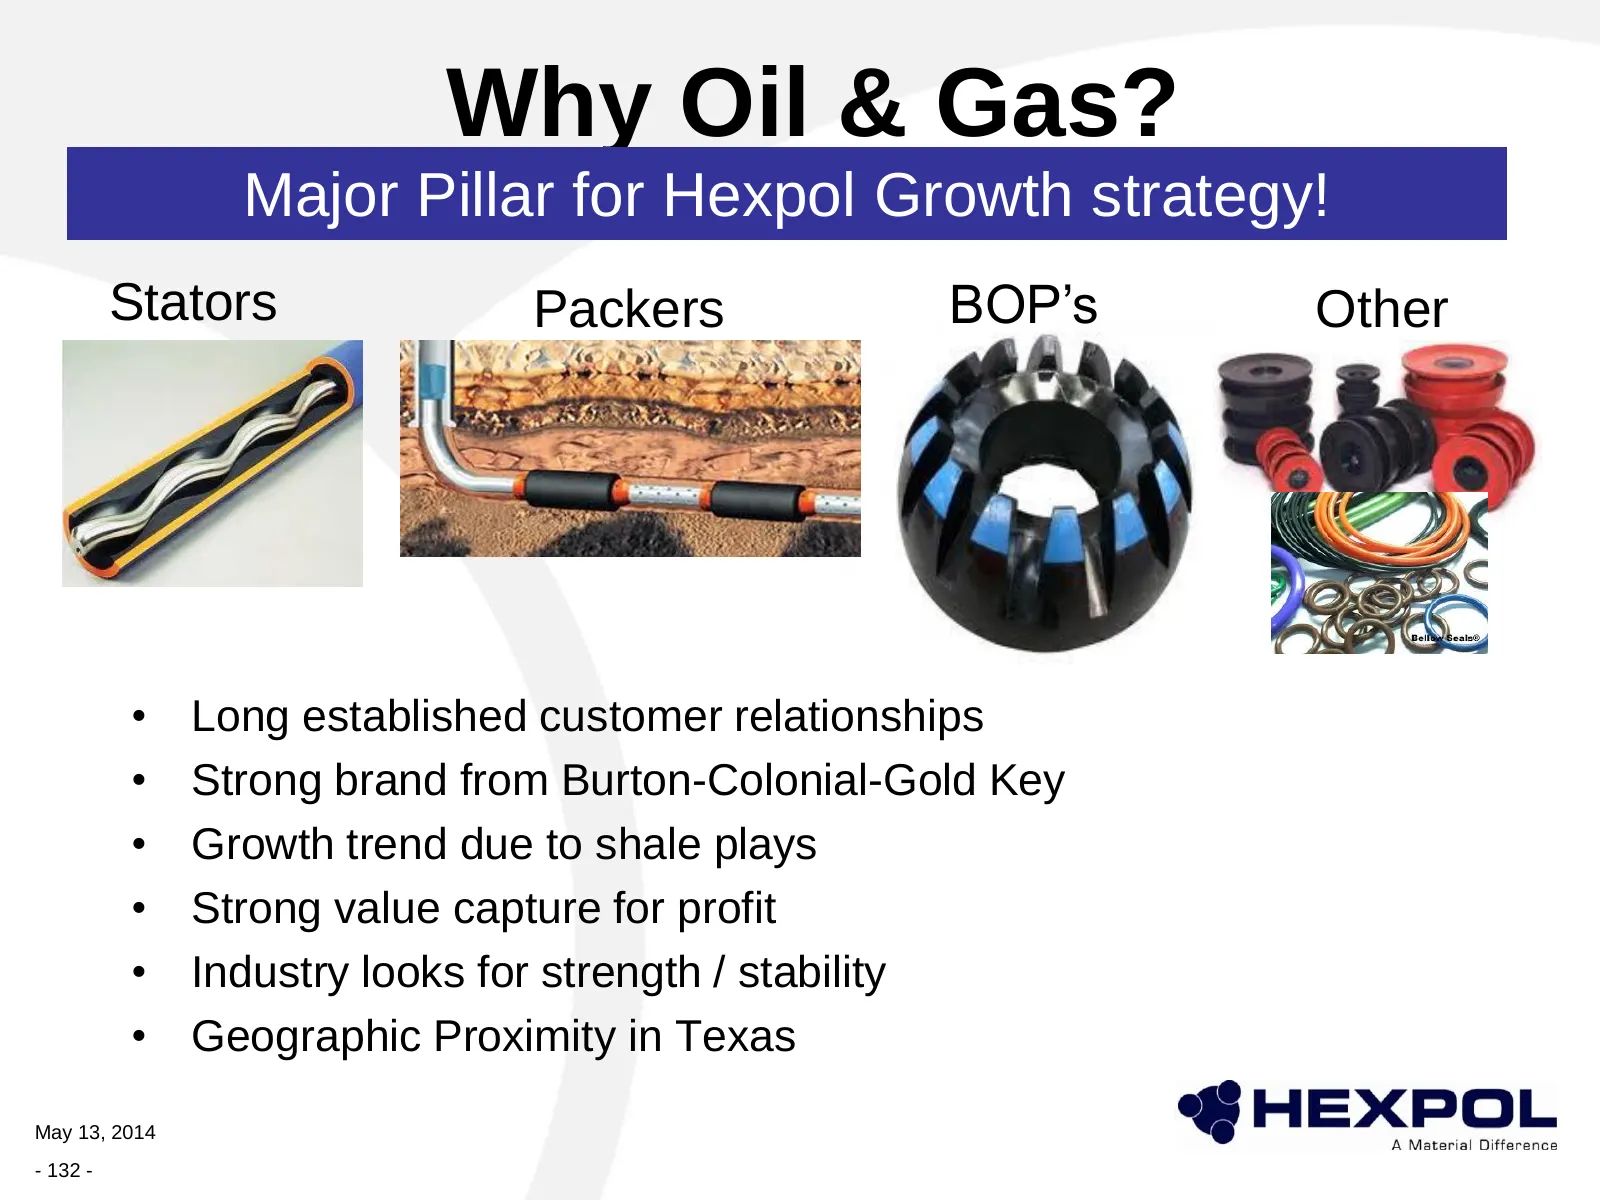
Why Oil & Gas? Major Pillar for Hexpol Growth strategy! Stators Packers BOP’s Other • Long established customer relationships • Strong brand from Burton-Colonial-Gold Key • Growth trend due to shale plays • Strong value capture for profit • Industry looks for strength / stability • Geographic Proxim
Slide 133: Shale gas plays
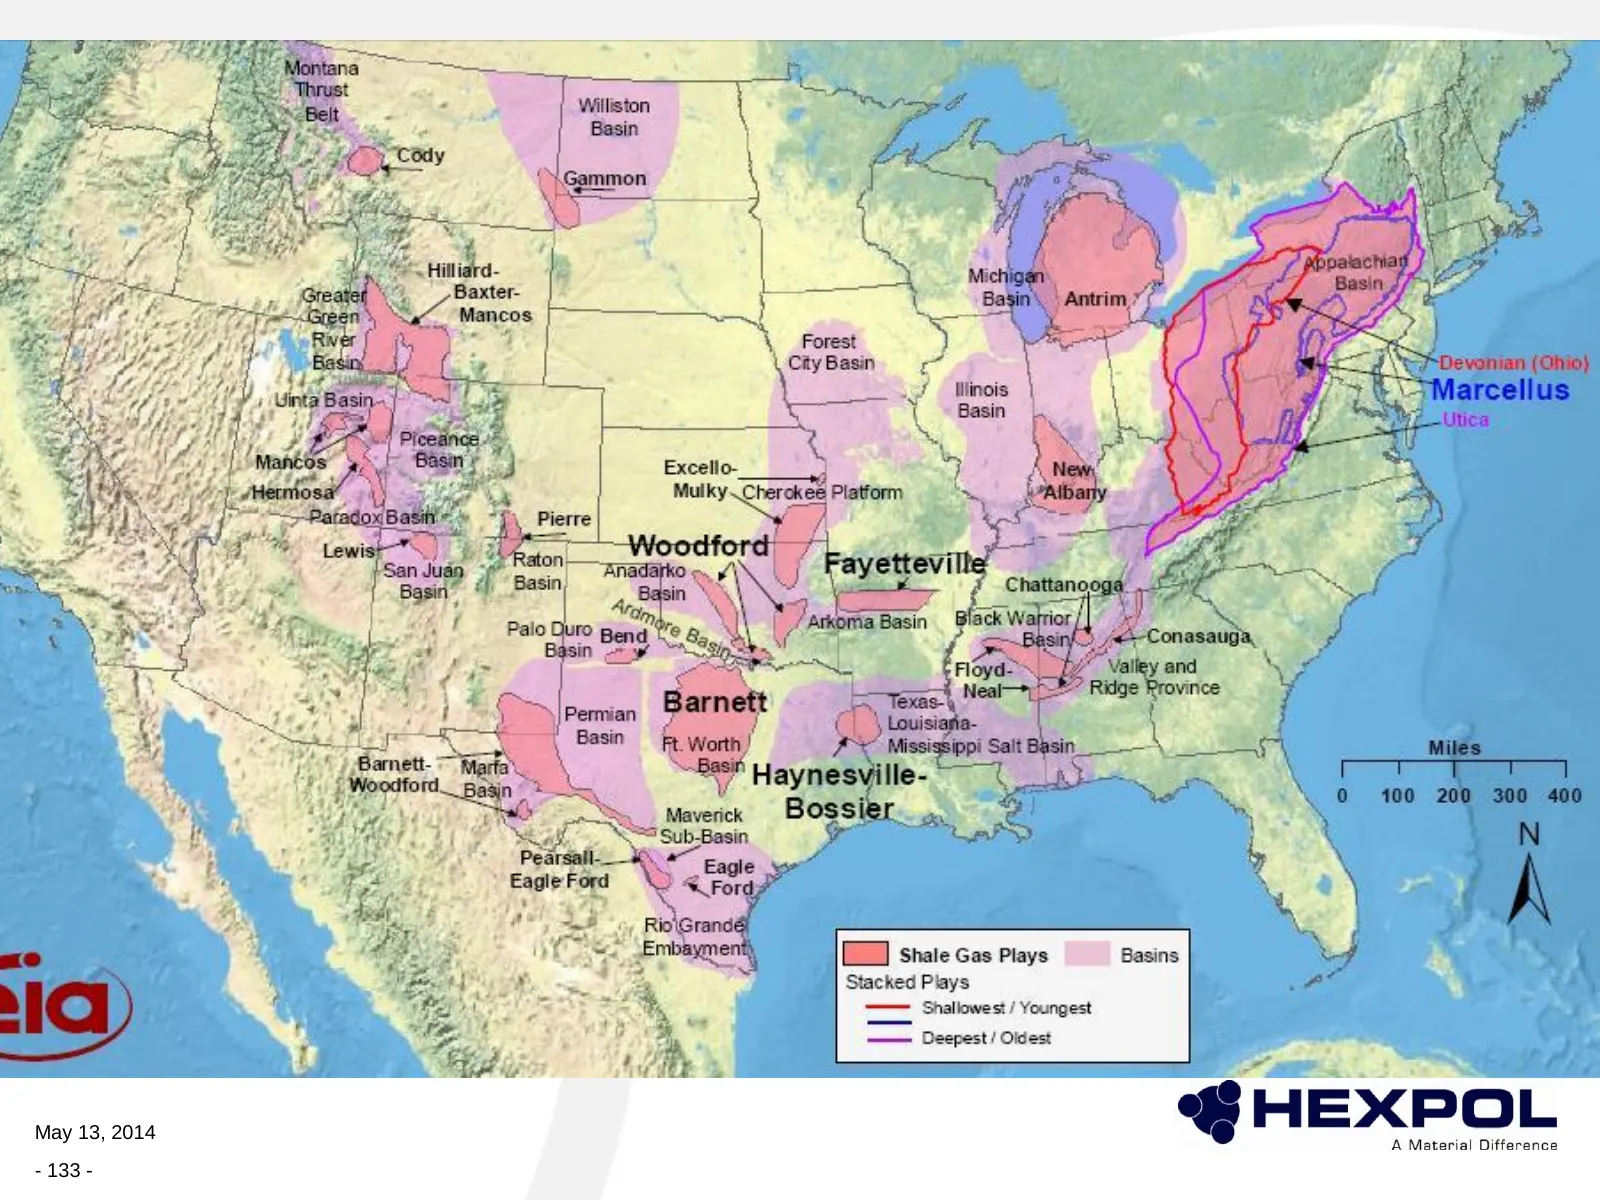
Marcellus [ shate Gas Plays Stacked Plays ey; —— Shallowest / Youngest —— Deepest / Oldest mes @ HEXPOL A Material Difference May 13, 2014 - 133 -
Slide 134: Ongoing Globalization
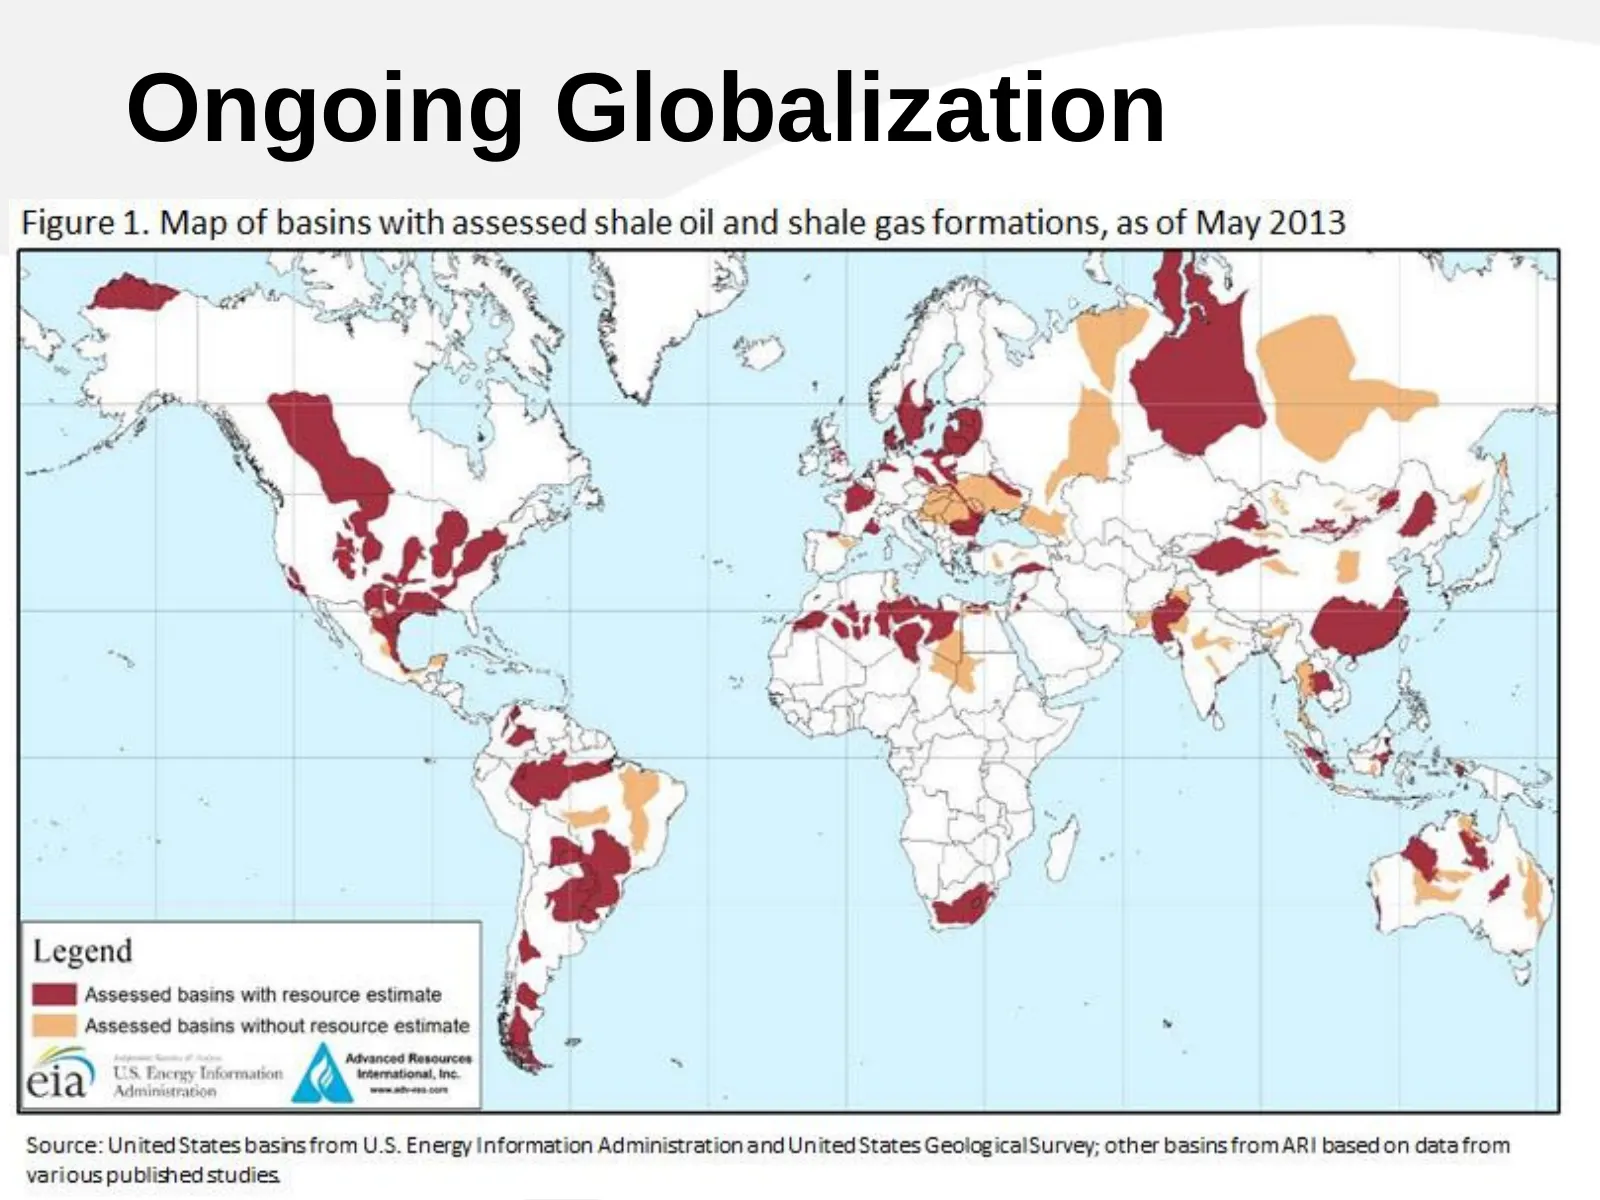
Ongoing Globalization May 13, 2014 - 134 -
Slide 135: Trends for O&G Compounds
Trends for O&G Compounds • Reliability of supply and Security of Technology • Expanding geographies • Operational temperatures elevating – High Pressures – Deeper Wells (inland and offshore) – Demand for heat resistant technology • Speed to performance – Sealing or Securing the hole to begin product
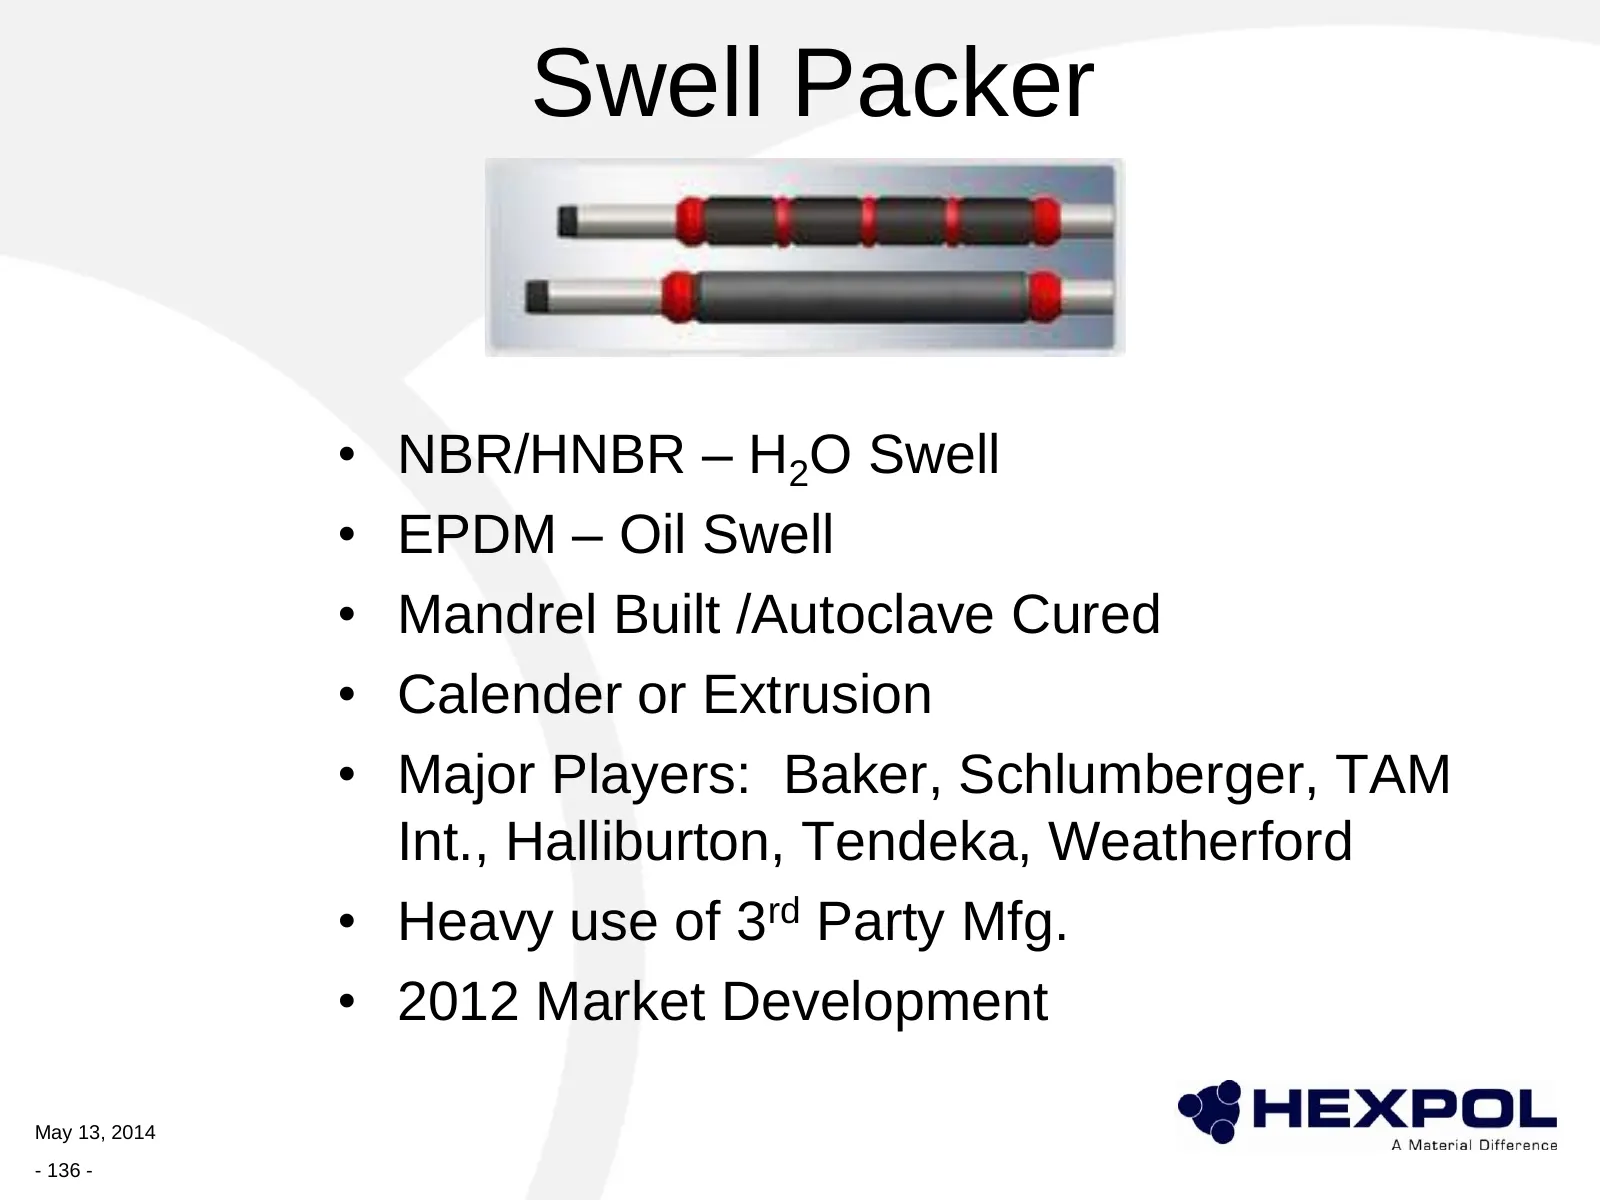
Slide 136: Swell Packer
Swell Packer • NBR/HNBR – H2O Swell • EPDM – Oil Swell • Mandrel Built /Autoclave Cured • Calender or Extrusion • Major Players: Baker, Schlumberger, TAM Int., Halliburton, Tendeka, Weatherford • Heavy use of 3rd Party Mfg. • 2012 Market Development May 13, 2014 - 136 -
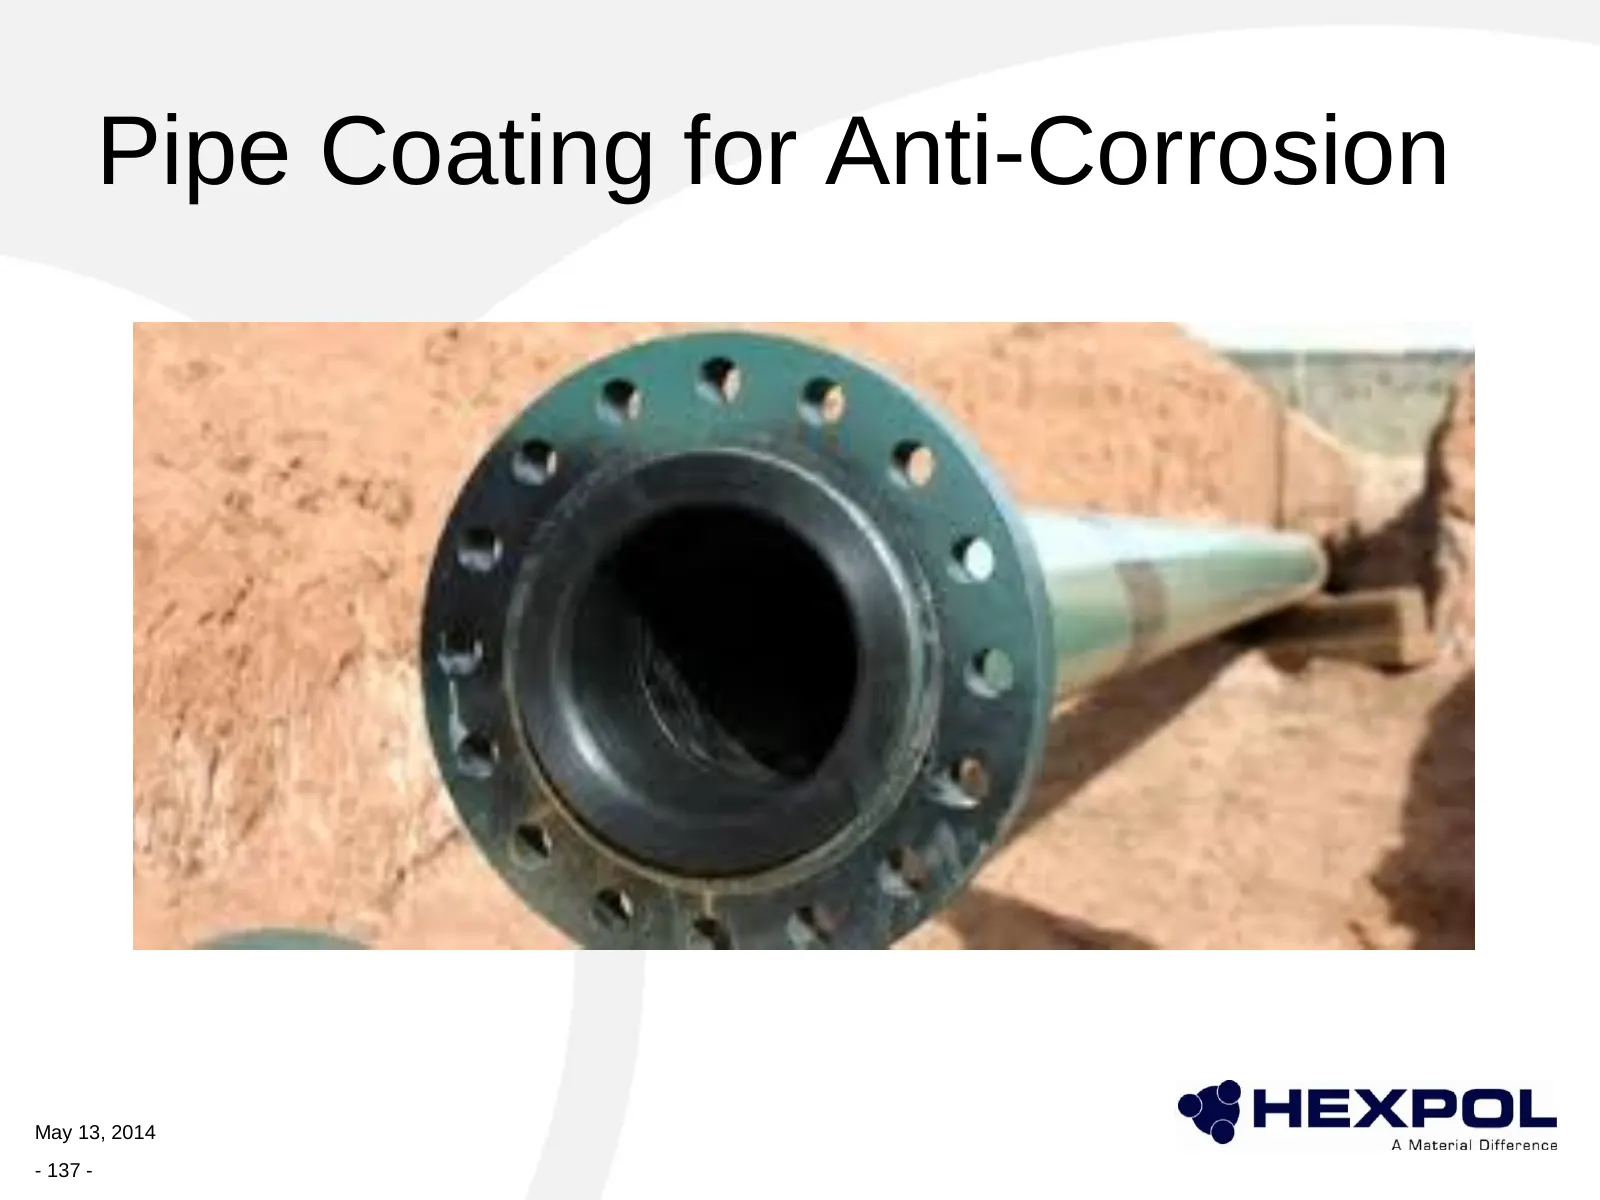
Slide 137: Pipe Coating for Anti-Corrosion
Pipe Coating for Anti-Corrosion May 13, 2014 - 137 -
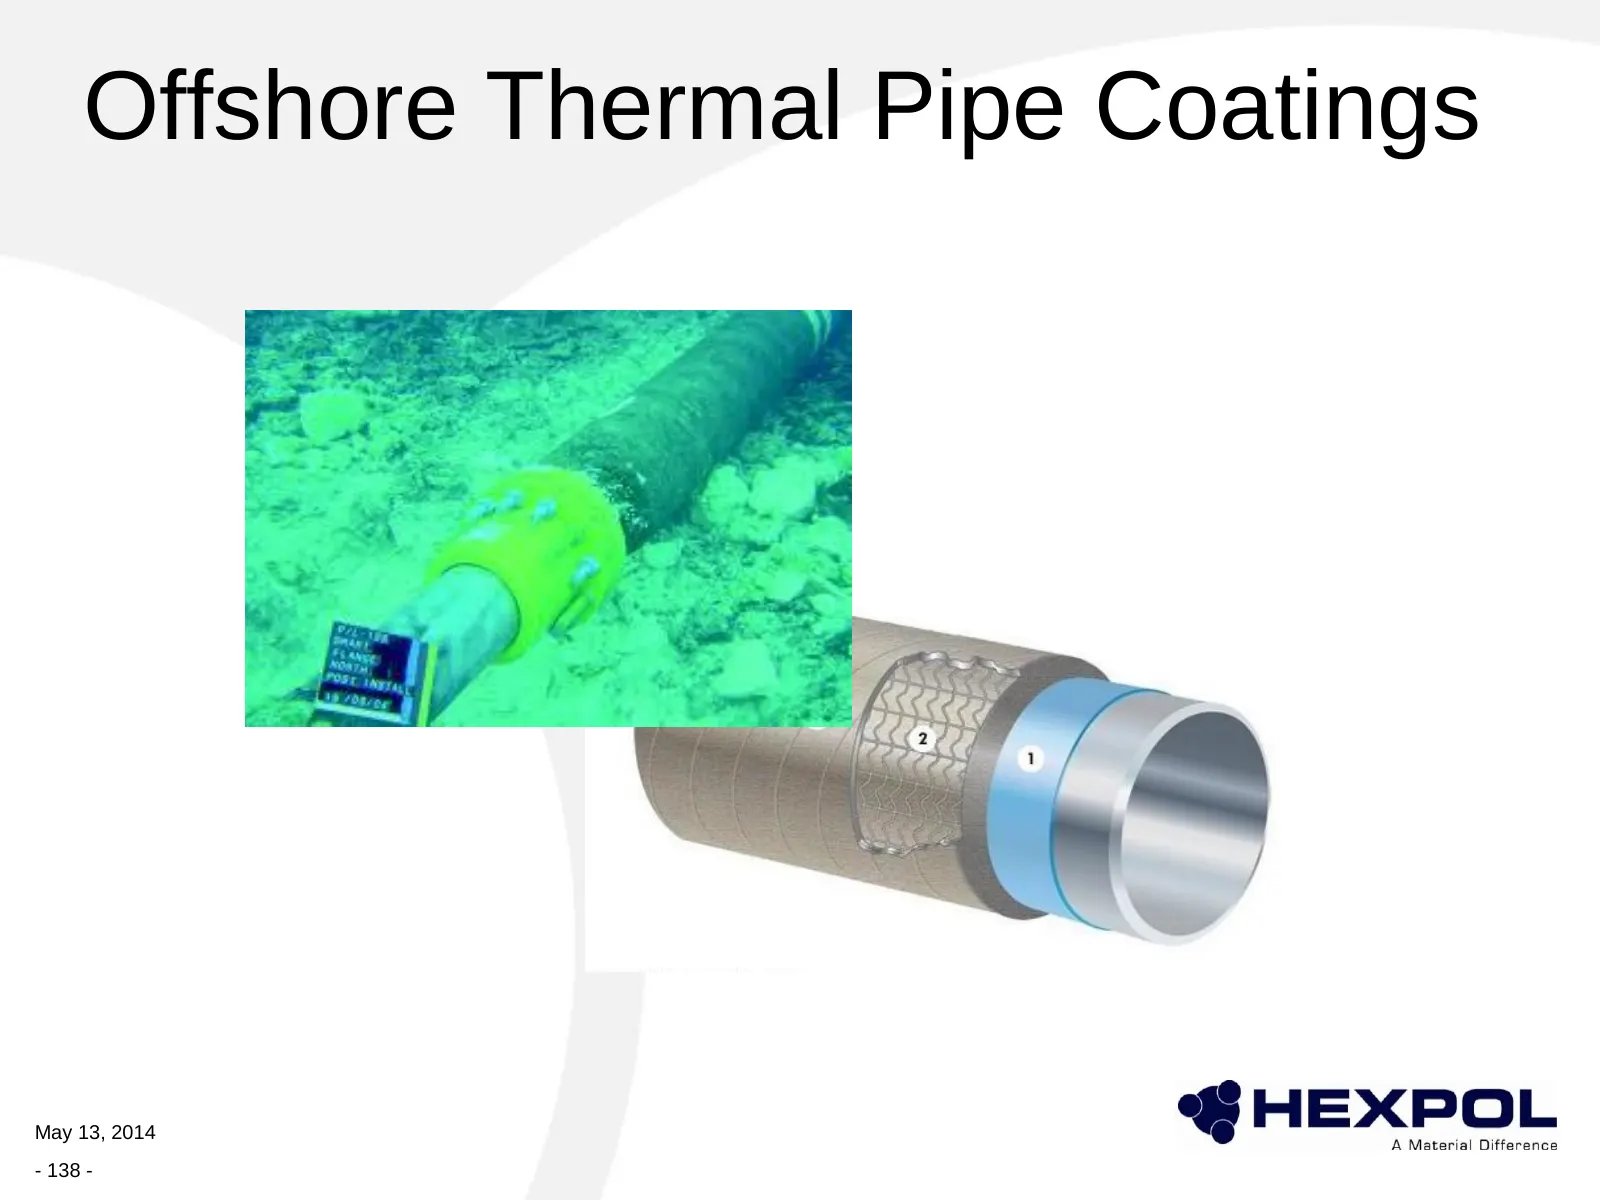
Slide 138: Offshore Thermal Pipe Coatings
Offshore Thermal Pipe Coatings May 13, 2014 - 138 -
Slide 139: HEXPOL O&G Growth Strategy
HEXPOL O&G Growth Strategy • Economic indicators are strong into 2040 • Major well service companies expanding part production into 2020 to Asia and Middle East • HEXPOL operational footprint aligned for growth May 13, 2014 - 139 -
Slide 140: Thank you for your attention
Thank you for your attention May 13, 2014 - 140 -
Slide 141: Closing Remark
Closing Remark Georg Brunstam, CEO May 13, 2014 - 141 -
Slide 142: Summary – Strong market positions and profitable growth oriented
SUMMARY– STRONG MARKET POSITIONS AND PROFITABLE GROWTH ORIENTED • We are global with strong market positions – approx. 95 per cent of our sales outside of Sweden. • We have deep and broad polymer application know-how – ”The vision and the busniess model is strong”. • We have a strong company culture
Source: Internet Archive copy of investors.hexpol.com
More decks from Hexpol AB Class B
 Q3 2026 Earnings Presentation21 slides · Oct 23, 2026
 Q2 2026 Earnings Presentation20 slides · Jul 20, 2026
 Q1 2026 Earnings Presentation24 slides · May 4, 2026
 Q4 2025 Earnings Presentation20 slides · Jan 29, 2026
 Q3 2025 Earnings Presentation18 slides · Oct 24, 2025
 Q2 2025 Earnings Presentation21 slides · Jul 18, 2025