Duke Realty — Citigroup Global REIT CEO Conference 2017
44 slides from Duke Realty's conference presentation, Mar 6, 2017
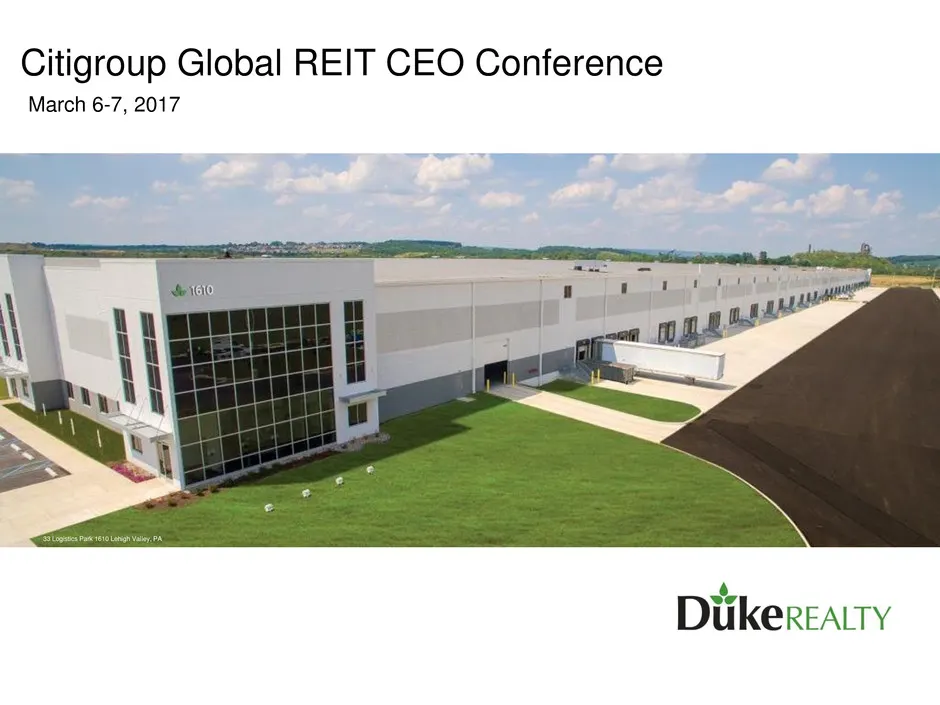
Slide 1: Citigroup Global REIT CEO Conference
Citigroup Global REIT CEO Conference March 6-7, 2017 4, DiikereAtty
Slide 2: Forward-Looking Statement
Forward-Looking Statement This slide presentation contains statements that constitute “forward-looking statements” within the meaning of the Securities Act of 1933 and the Securities Exchange Act of 1934 as amended by the Private Securities Litigation Reform Act of 1995. These forward-looking statem
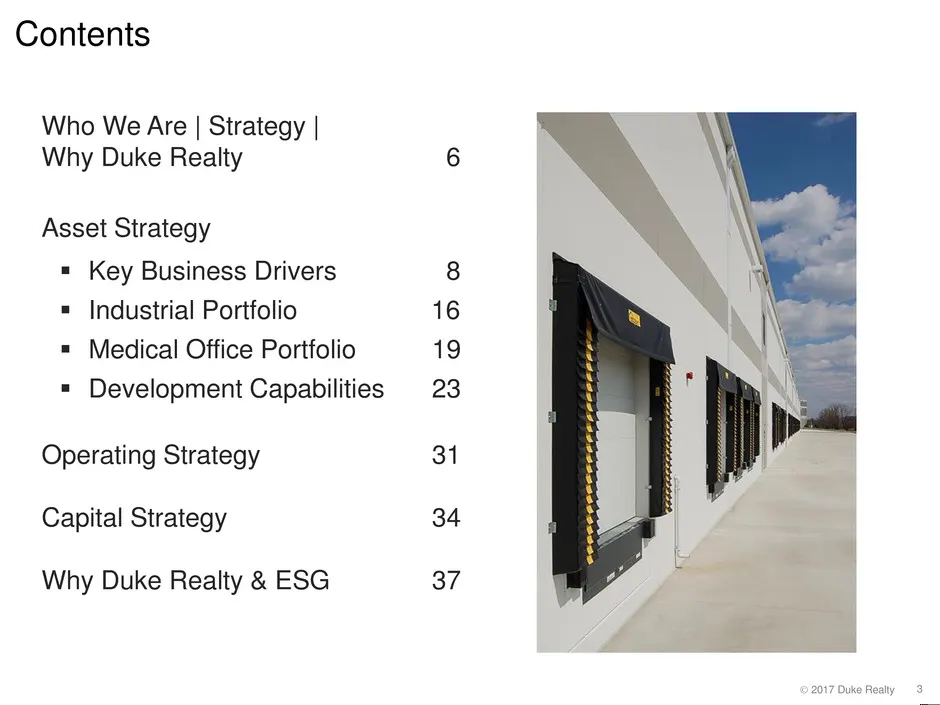
Slide 3: Contents
Contents Who We Are | Strategy | Why Duke Realty Asset Strategy = Key Business Drivers = Industrial Portfolio = Medical Office Portfolio = Development Capabilities Operating Strategy Capital Strategy Why Duke Realty & ESG
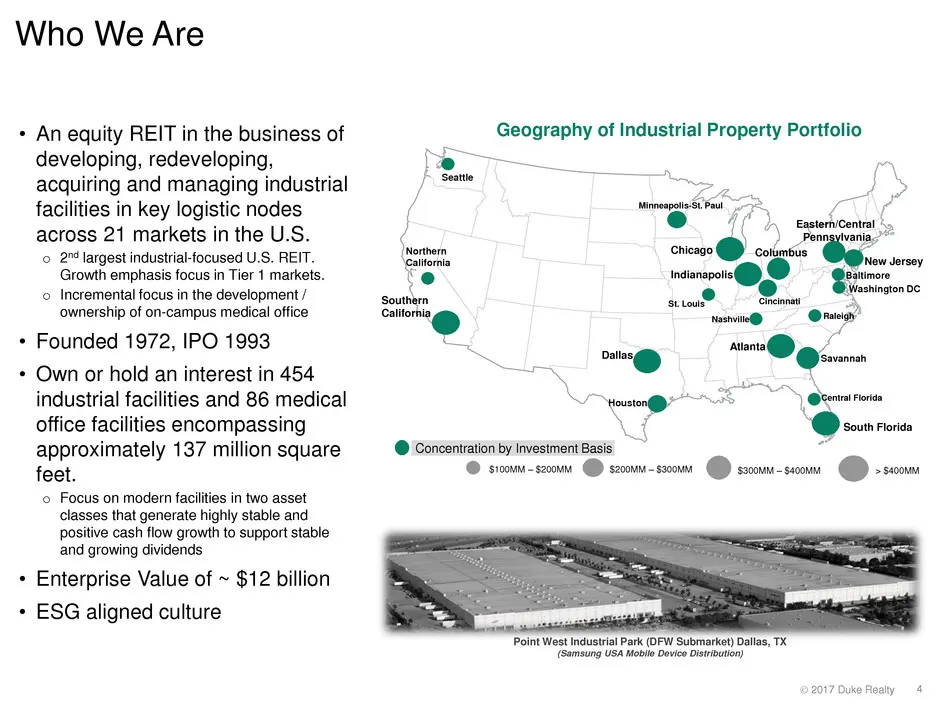
Slide 4: Who We Are
Who We Are + An equity REIT in the business of developing, redeveloping, acquiring and managing industrial facilities in key logistic nodes across 21 markets in the U.S. © 2" largest industrial- focused U.S. REIT. ‘ship of on-campus medical office + Founded 1972, IPO 1993 + Own or hold an interest i
Slide 5: Strategy for Increasing Shareholder Value
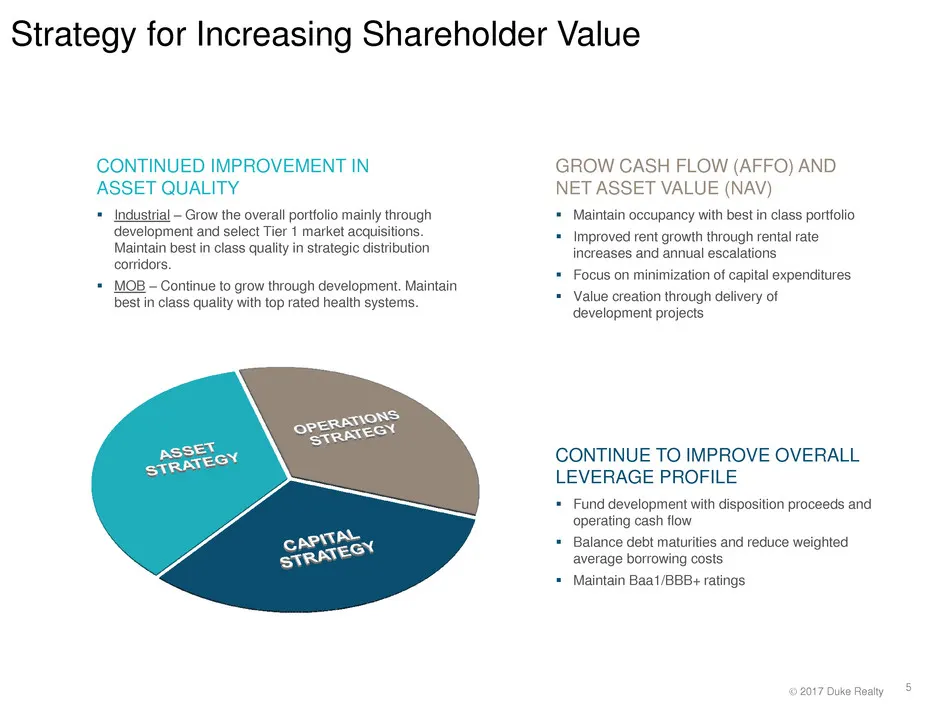
Strategy for Increasing Shareholder Value CONTINUED IMPROVEMENT IN GROW CASH FLOW (AFFO) AND. ASSET QUALITY NET ASSET VALUE (NAV) Industrial the overall p nly throug + Maintain occupancy with best in class portfolio. P a tier 1 i = Improved rent growth through rental rate n increases and annual esca
Slide 6: Why Duke Realty?
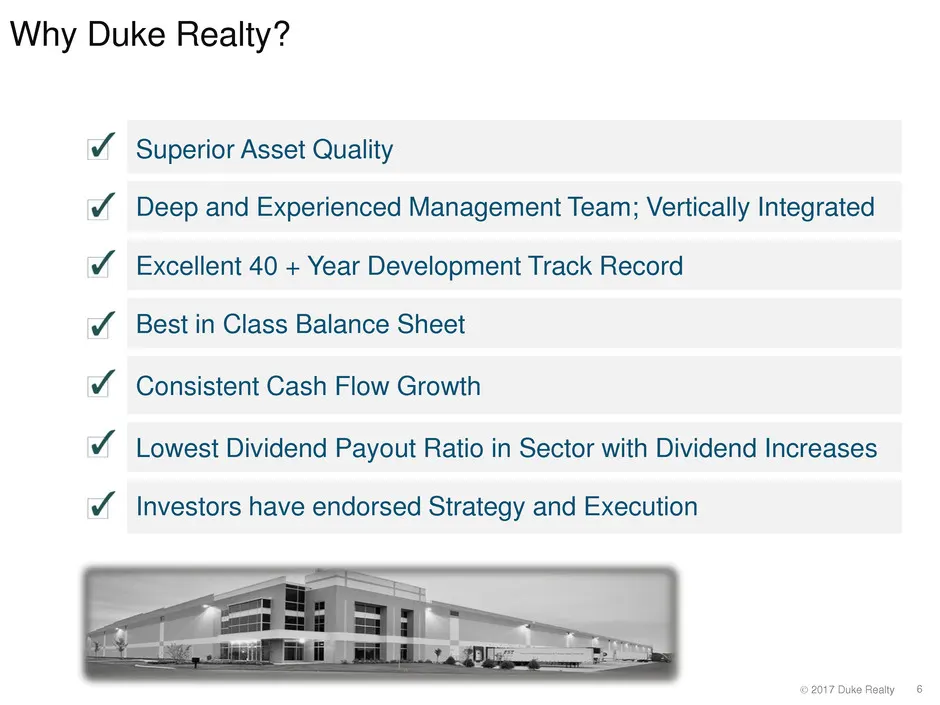
Why Duke Realty? Superior Asset Quality Deep and Experienced Management Team; Vertically Integrated Excellent 40 + Year Development Track Record Consistent Cash Flow Growth Lowest Dividend Payout Ratio in Sector with Dividend Increases v v v v¥ Best in Class Balance Sheet v v v Investors have endors
Slide 7: Total Shareholder Return Outperformance
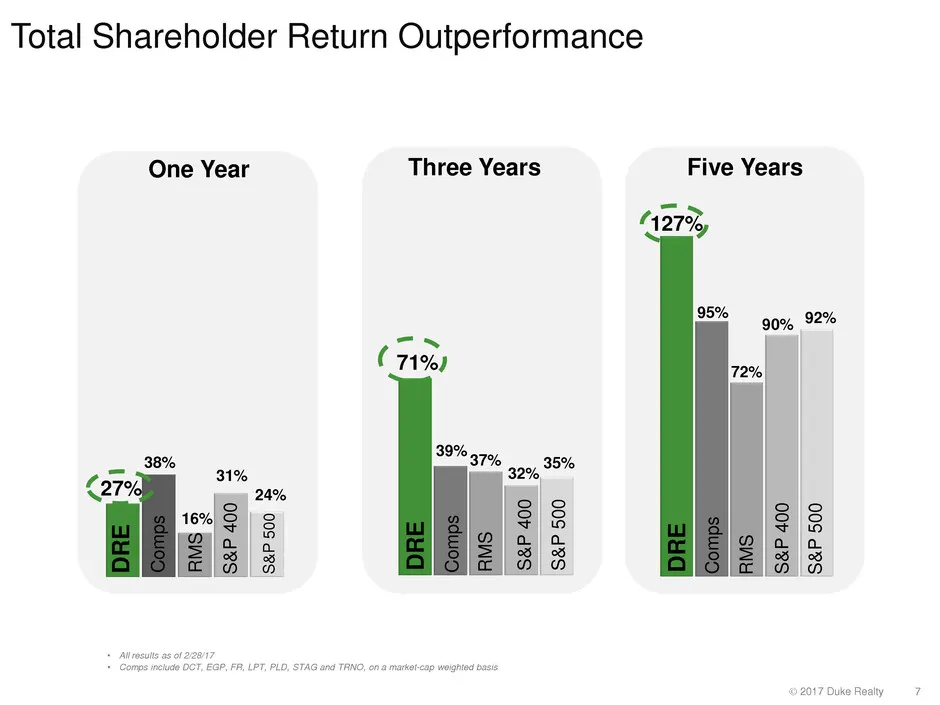
Total Shareholder Return Outperformance One Year Three Years Five Years 27% 38% 31% = 24% 16%) S PE ( no &P 500 S&P 500
Slide 8: Key Industrial Business Drivers & State of the Market
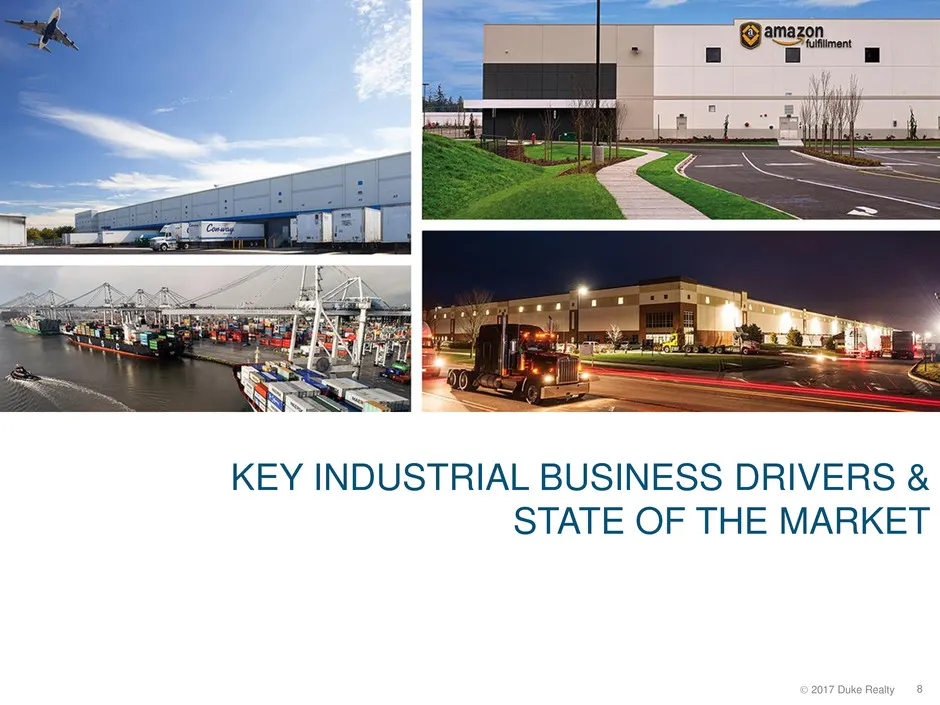
KEY INDUSTRIAL BUSINESS DRIVERS & STATE OF THE MARKET
Slide 9: DEMAND: Macroeconomic Indicators / Drivers
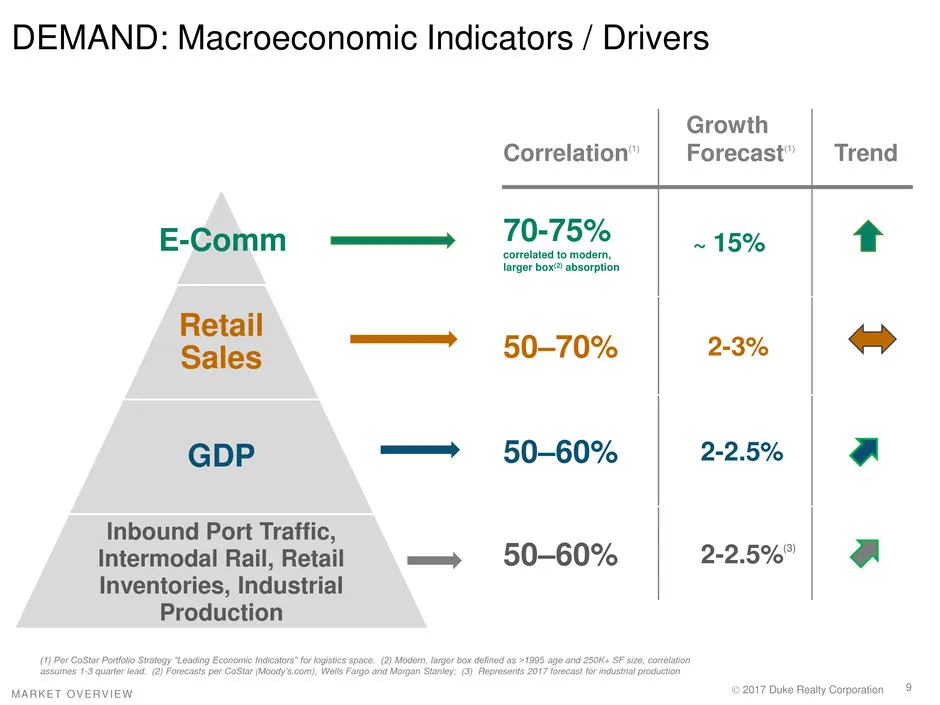
DEMAND: Macroeconomic Indicators / Drivers E-Comn => Retail , Sales GDP — Inbound Port Traffic, Intermodal Rail, Retail — Inventories, Industrial Production Growth Correlation” Forecast Trend TOTS | + 18% t 50-70% 23% | &> 50-60% | 22.5% | wm 50-60% 2-2.5%" | BA 2017 Duke Really Co
Slide 10: DEMAND: E-Commerce capturing larger portion of retail sales
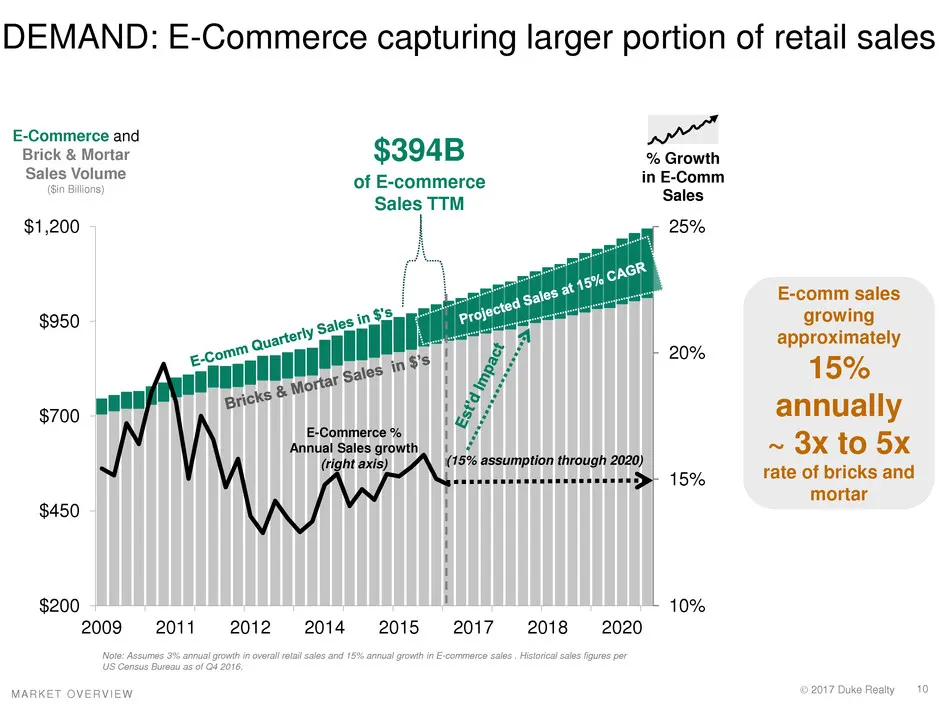
DEMAND: E-Commerce capturing larger portion of retail sales E-Commerce and we Brick & Mortar $394B Caran a of E-commerce in E-Comm Sales TTM ales $1,200 my 25% E-comm sales rowing approximately 15% annually ~ 3x to 5x (15% tion through 2020) AEA Er fed 15% rate of bricks and ortar 20% i H H H H H y
Slide 11: DEMAND: New industrial SF needed to keep up with growth
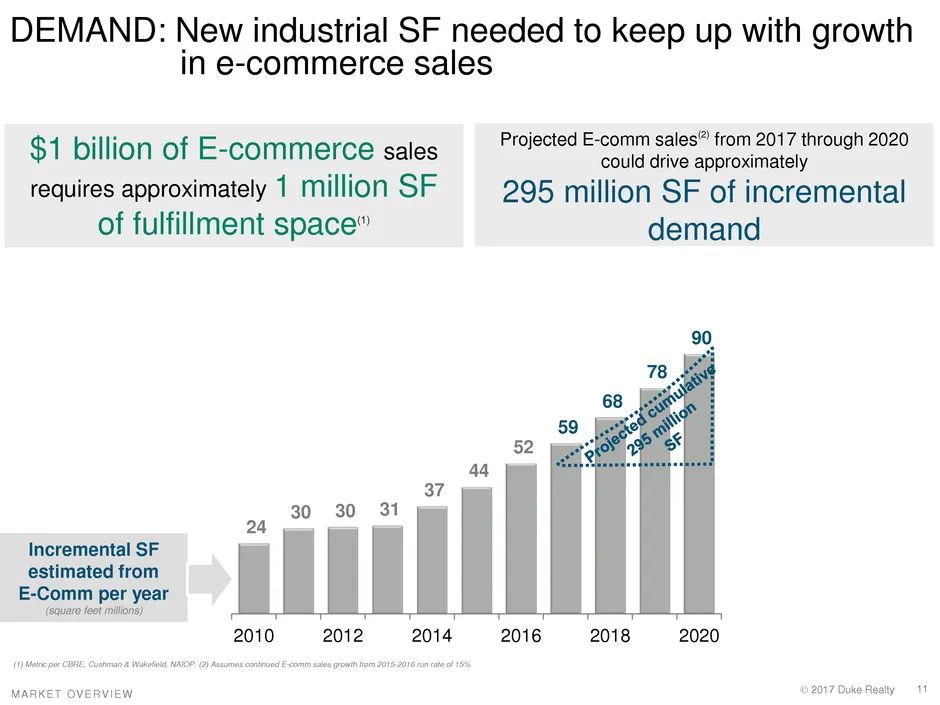
DEMAND: New industrial SF needed to keep up with growth in e-commerce sales SiibillionlofEcommercersalesil| uibserua sch ent sui loll oes 295 million SF of incremental requires approximately 1 million SF demand of fulfillment space” Incremental SF estimated from E-Comm per year (square feet millions
Slide 12: DEMAND: E-Commerce warehousing different from traditional distribution
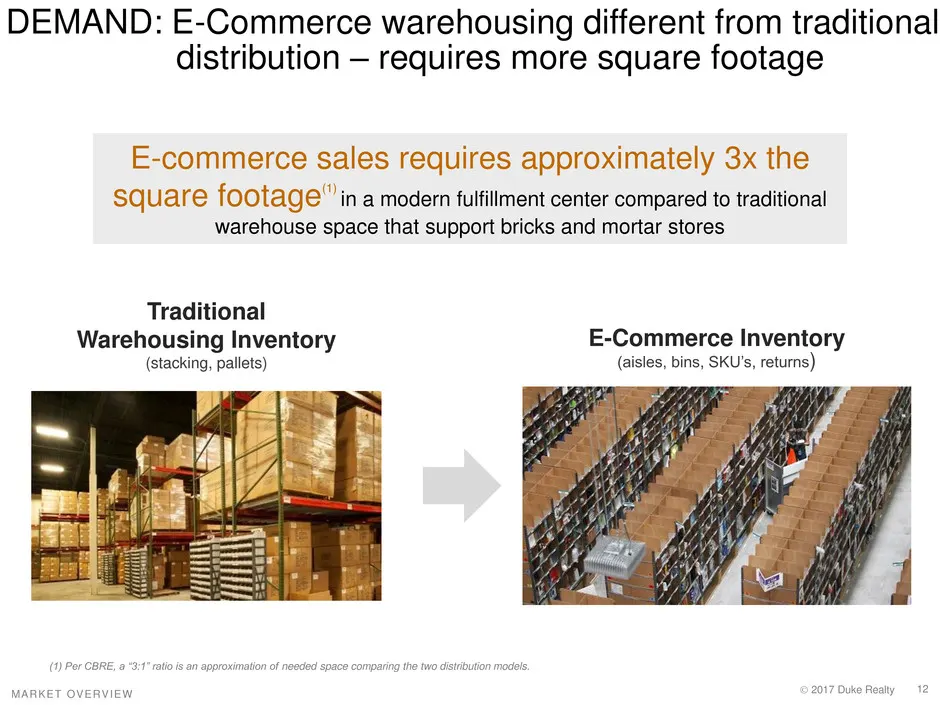
DEMAND: E-Commerce warehousing different from traditional distribution — requires more square footage E-commerce sales requires approximately 3x the square footage” in a modern fulfillment center compared to traditional warehouse space that support bricks and mortar stores Traditional Warehousing In
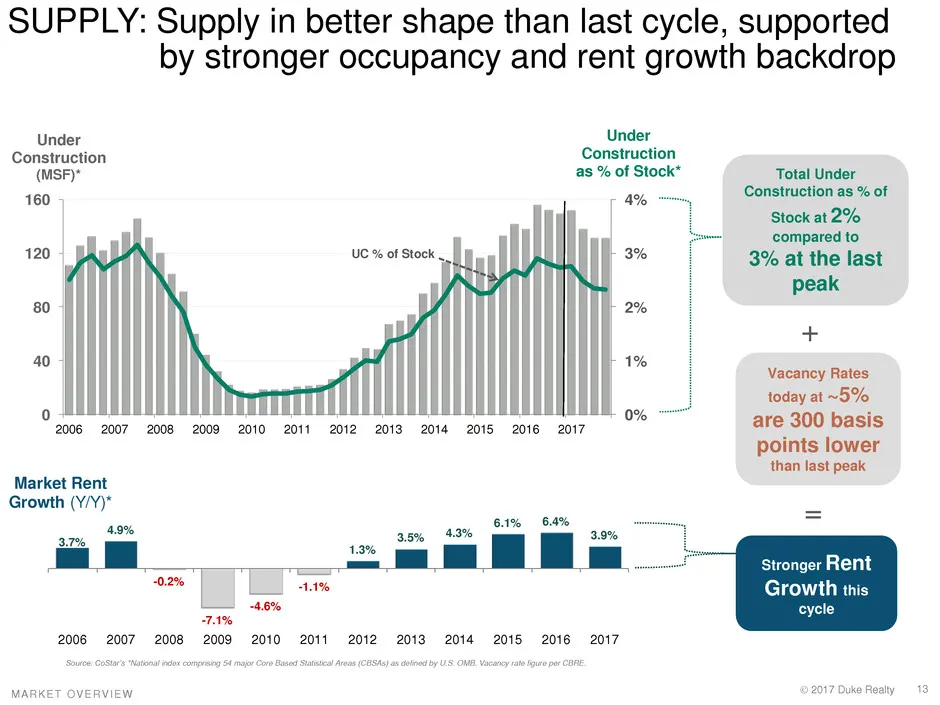
Slide 13: SUPPLY: Supply in better shape than last cycle
SUPPLY: Supply in better shape than last cycle, supported by stronger occupancy and rent growth backdrop Under : Construction Construction (MSE)* as % of Stock* 160 5 5 A% ny Construction as % of Stock at 2% | VEE Heck p 3% 3% at the last L peak 80 |; 2% af 40 ; 1% Vacancy Rates today at ~5% C) U ™
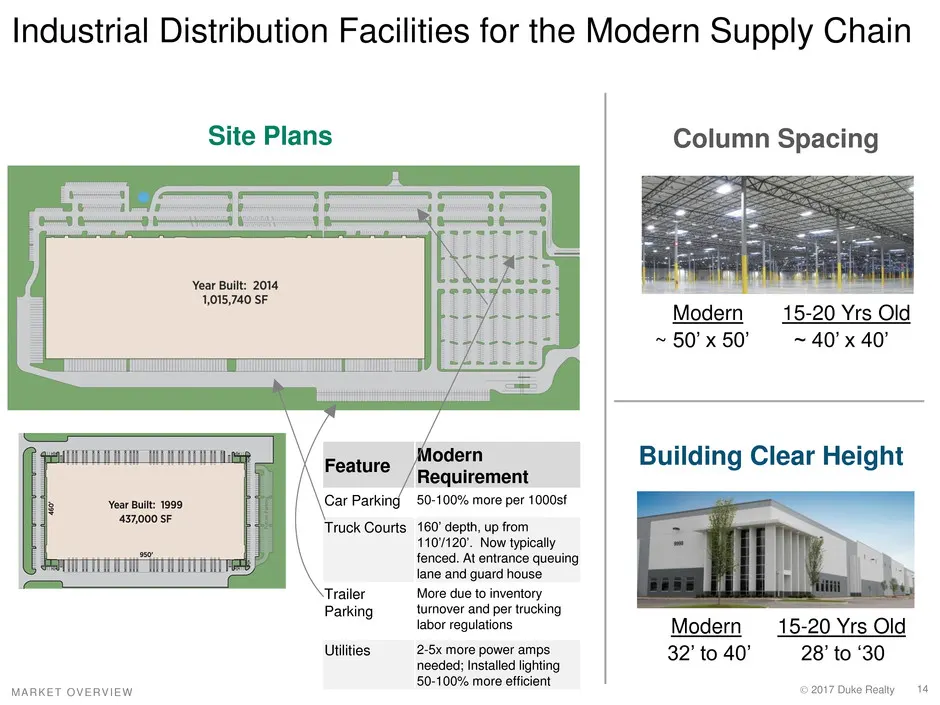
Slide 14: Industrial Distribution Facilities for the Modern Supply Chain
Industrial Distribution Facilities for the Modern Supply Chain Site Plans Year Built: 2014 1,015,740 SF ireme: Car Parking 50-10% more per 1000sf Truck Courts 160° depth, up fro 1107120", Now typically Face eerrene aa lane and oad Trailer More due Parking turmover and per wucking labor regulations U
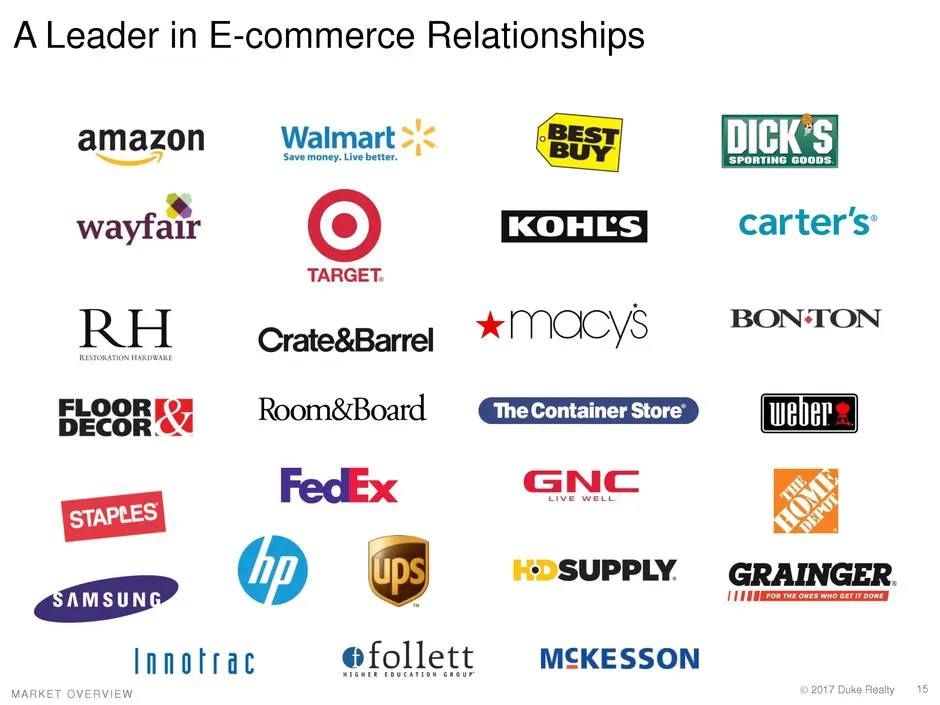
Slide 15: A Leader in E-commerce Relationships
A Leader in E-commerce Relationships amazon = Walmart>x a ENG wayfatr © |KOHLS| carter’s’ TARGET. Crate8Barrel XIOOCYS = BON'TON Room&Board weber 7 @ Ops /:DSUPPLY GRAINGER. Innotrac ef
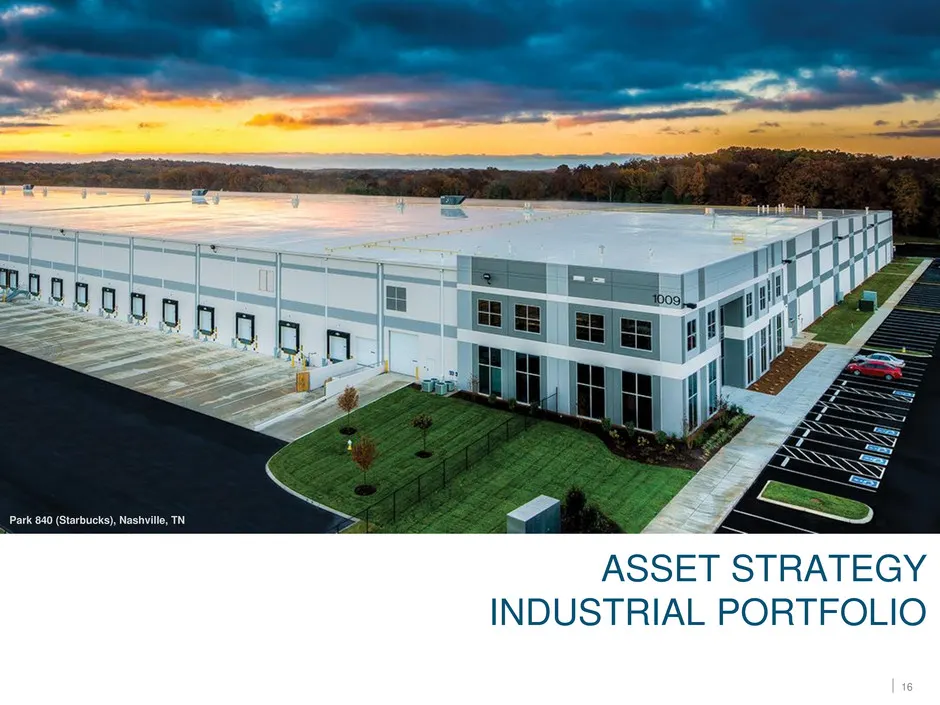
Slide 16: Asset Strategy: Industrial Portfolio
Park 840 (Starbucks), Nashville, TN ASSET STRATEGY INDUSTRIAL PORTFOLIO
Slide 17: Industrial Strategy
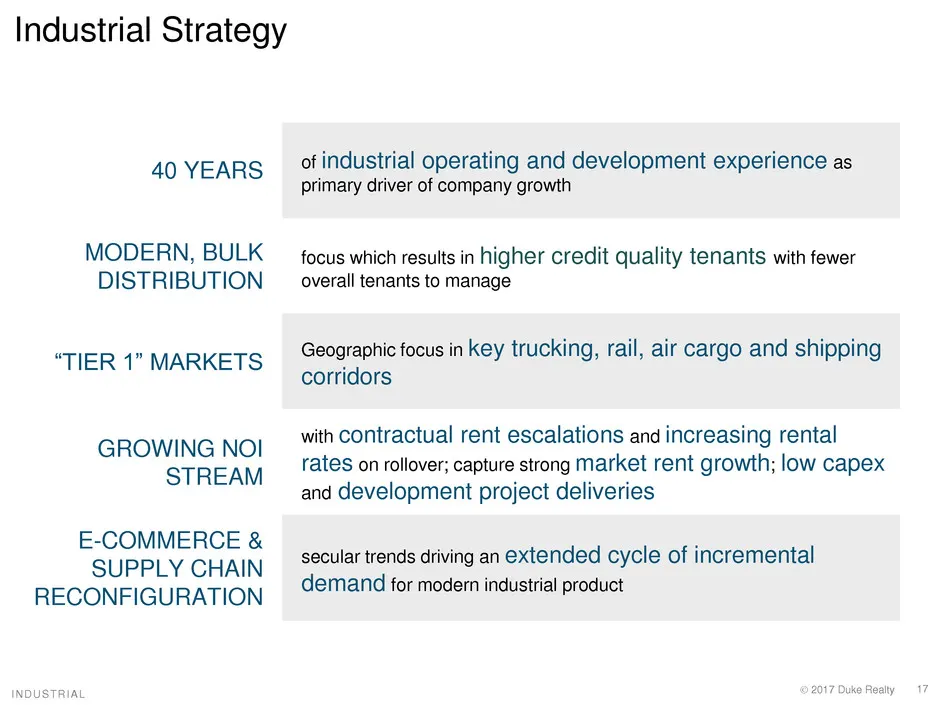
Industrial Strategy 40 YEARS _ “industrial operating and development experience as primary driver of company growth MODERN, BULK {focus which results in higher credit quality tenants with fewer DISTRIBUTION __ overall tenants to manage “TIER 1” MARKETS Geographic focus in key trucking, rail, air car
Slide 18: Industrial Best in Class Portfolio
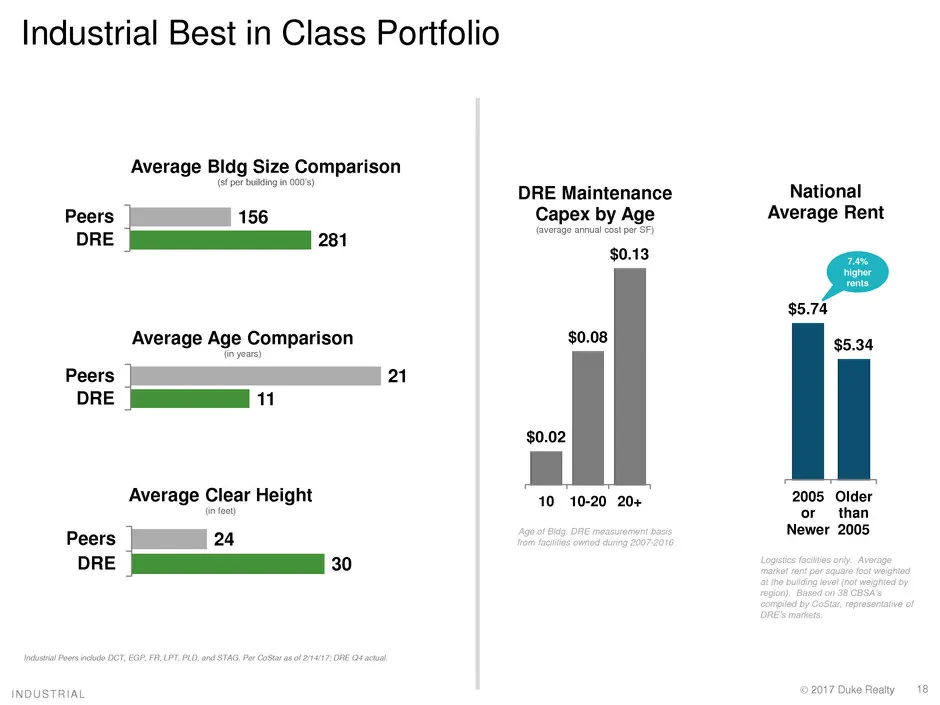
Industrial Best in Class Portfolio Average Bidg ¢ ize Comparison ng 00) Peers 156 DRE 281 Average Age Comparison te year) Peers 21 DRE "1 Average Clear Height (ates Peers 24 DRE 30 NDUSTRIAL DRE Maintenance Capex by Age 3) (avorage annual cos pr $0.13 $0.02 10 10-20 20+ National Average Rent 2005 Ol
Slide 19: Asset Strategy: Medical Office Portfolio
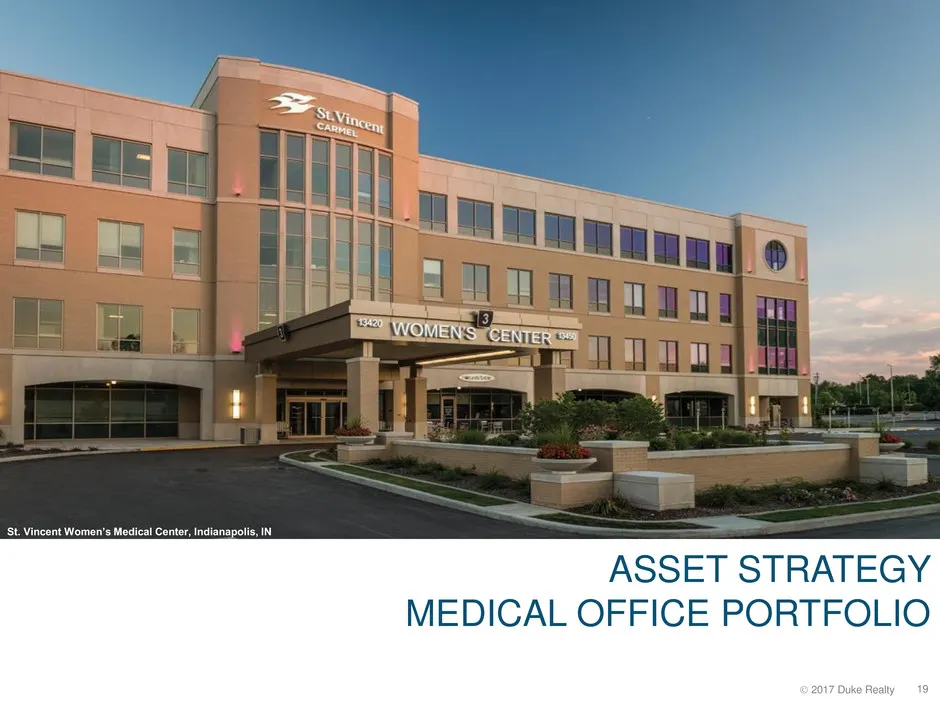
y I See ; a SEU WOWEN Sr CENTERS —— = ASSET STRATEGY MEDICAL OFFICE PORTFOLIO
Slide 20: Medical Office Platform Enhances Risk-adjusted Returns
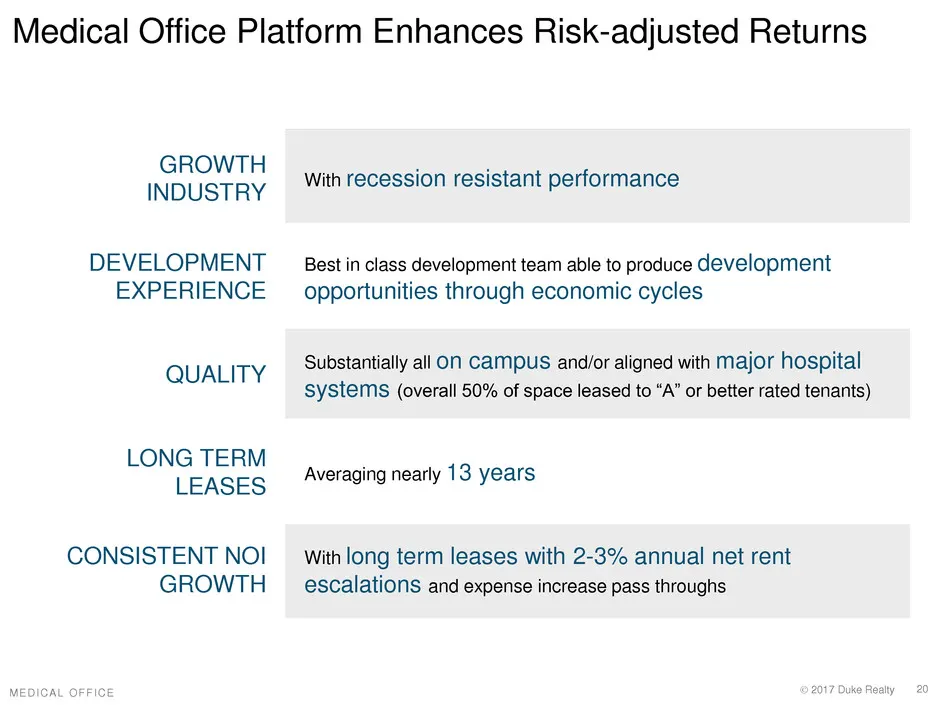
Medical Office Platform Enhances Risk-adjusted Returns GROWTH INDUSTRY DEVELOPMENT EXPERIENCE QUALITY LONG TERM LEASES CONSISTENT NOI GROWT! With recession resistant performance Best in class development team able to produce development opportunities through economic cycles Substantially all ON CAMP
Slide 21: Medical Office - Market Drivers
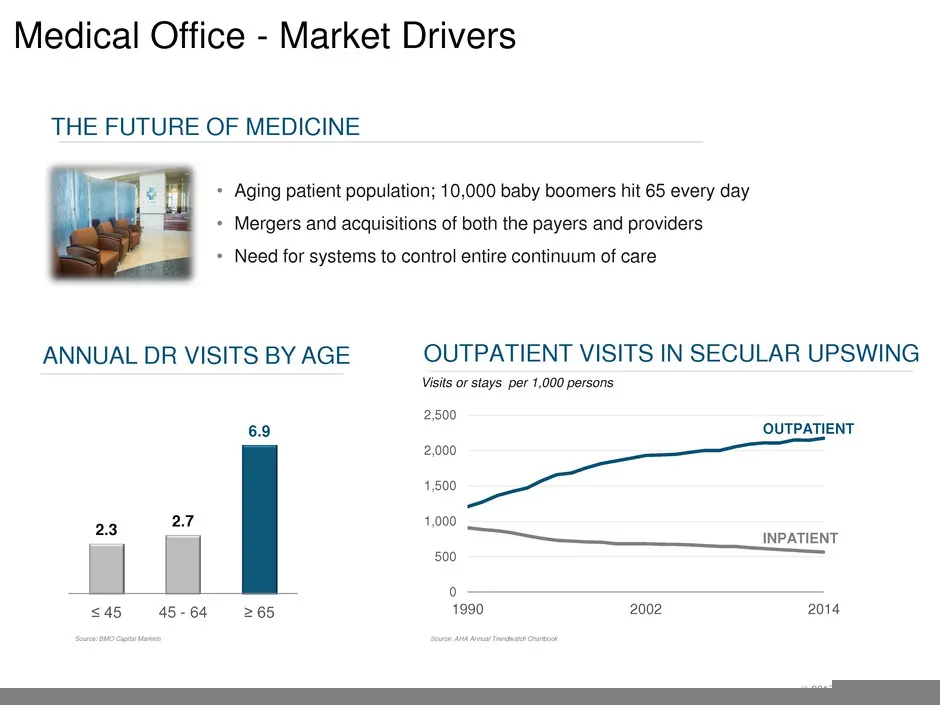
Medical Office - Market Drivers THE FUTURE OF MEDICINE + Aging patient population; 10,000 baby boomers hit 65 every day + Mergers and acquisitions of both the payers and providers - Need for systems to control entire continuum of care ANNUAL DR VISITS BY AGE OUTPATIENT VISITS IN SECULAR UPSWING Visi
Slide 22: Substantially on-campus | Top health systems | Long term leases
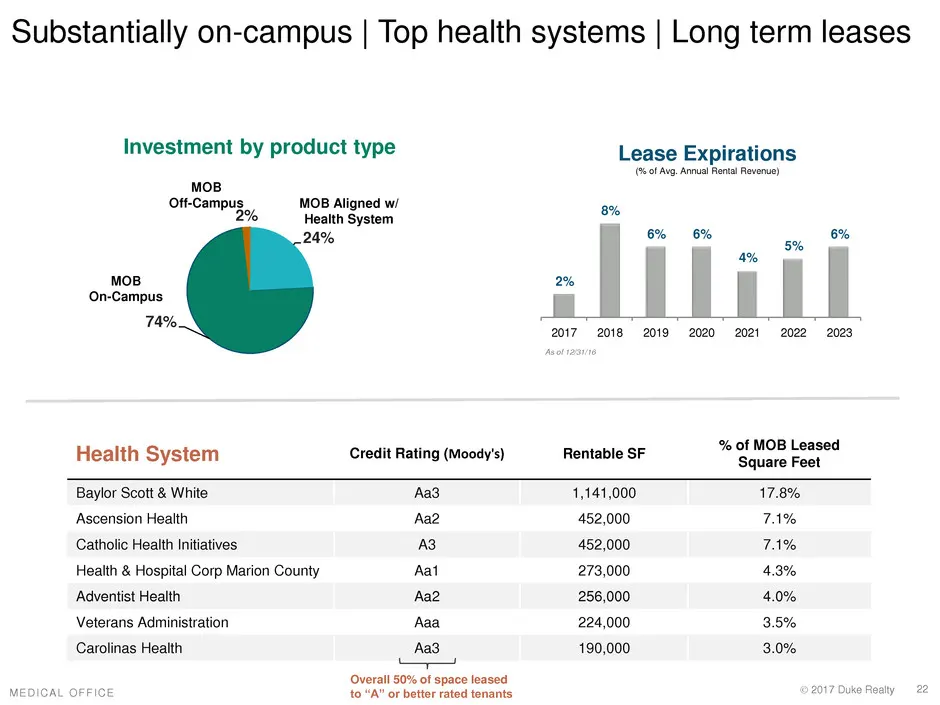
Substantially on-campus | Top health systems | Long term leases Investment by product type Lease Expirations (ot Avg, Arua ents Reverse) MOB Off-Campus MOB Aligned w/ 2% Health System MOB On-Campus 74%, 2017 2018 2019 2020 2021 2022 2028 P % of MOB Leased Health System Credit Rating (Moody's) Rentab
Slide 23: Asset Strategy: Development Capabilities
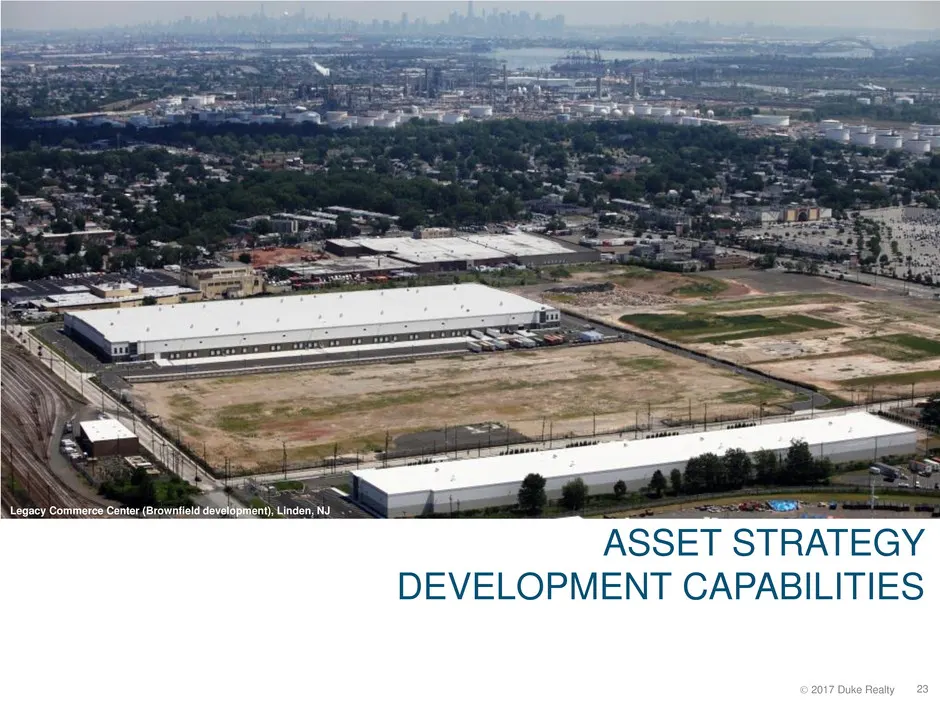
ASSET STRATEGY DEVELOPMENT CAPABILITIES
Slide 24: Development Strategic Advantages
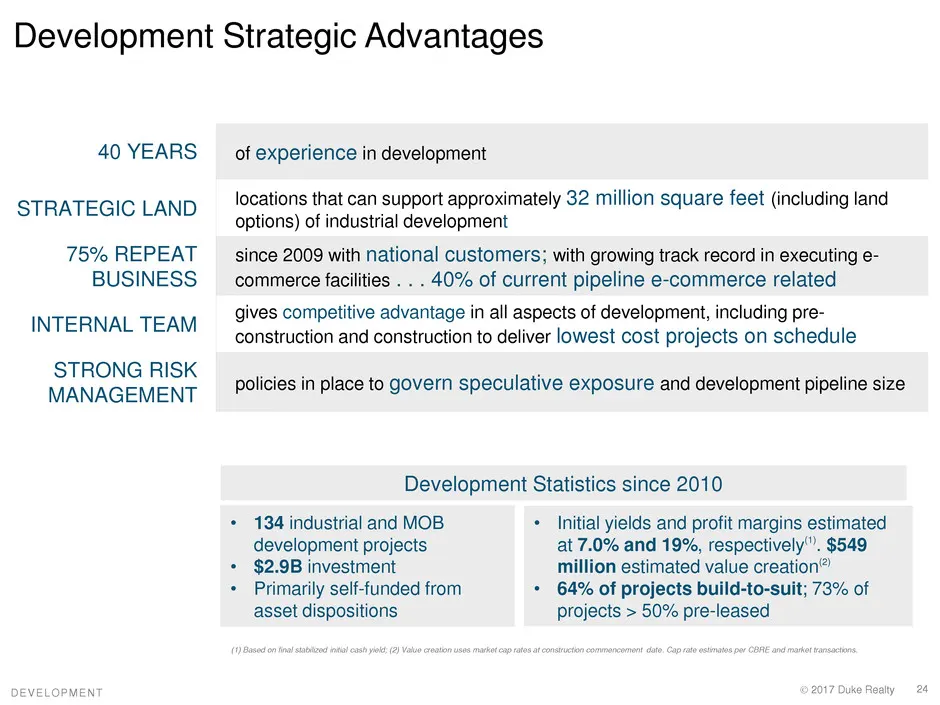
Development Strategic Advantages 40 YEARS STRATEGIC LAND 75% REPEAT BUSINESS INTERNAL TEAM STRONG RISK MANAGEMENT of experience in development locations that can support approximately 32 million square feet (including land options) of industrial development since 2009 with national customers; with g
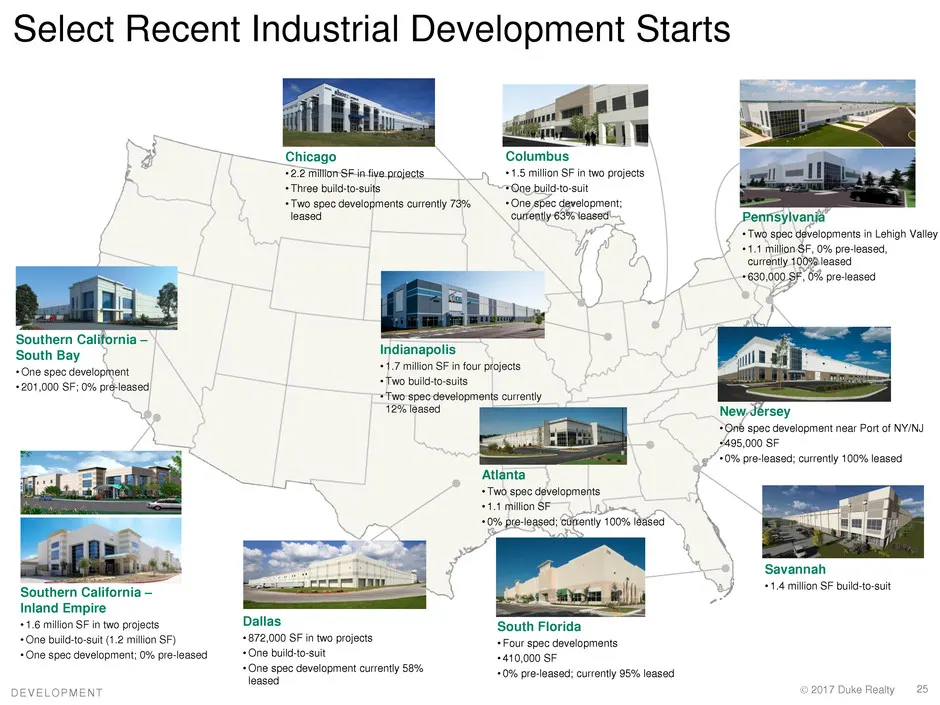
Slide 25: Select Recent Industrial Development Starts
Select Recent Industrial Development Starts - —_— 77 Chicago Columbus SEES LD TX Ser00e build tosuit pe development curenty 79%. +Ono sc devtoom a ‘curfently 63% ‘eae pean pron i Leh Vl ange o% I Indi napoli +1.7 milion SF in four pljocts mu “Chosen doops 1.7 milion SF in our eect 201,000 SF; 0% ple
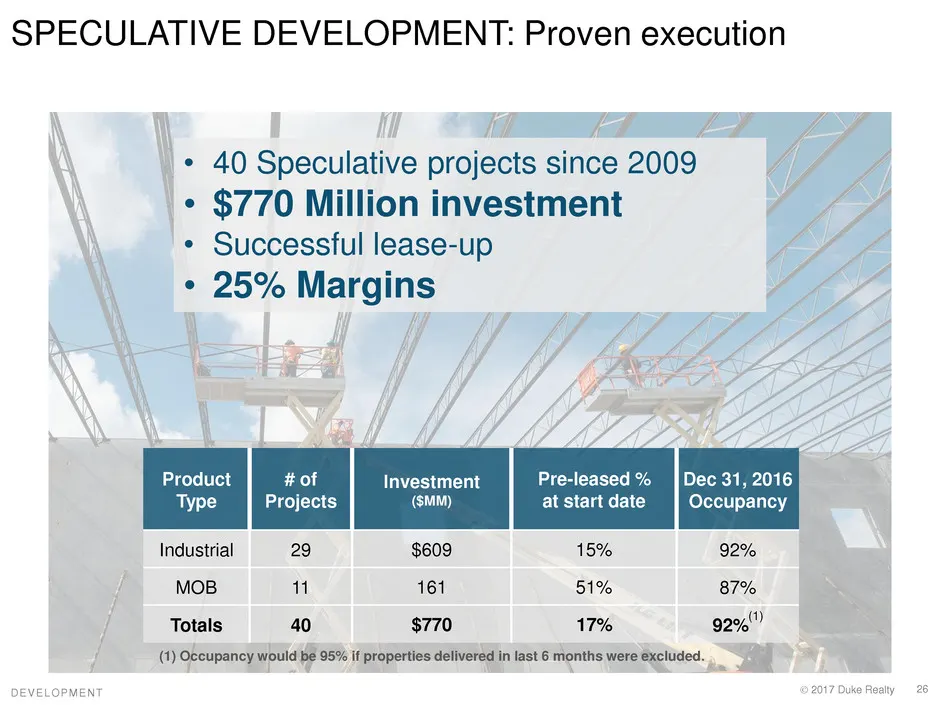
Slide 26: Speculative Development: Proven execution
SPECULATIVE DEVELOPMENT: Proven execution \ I i i = A we X\ ‘* 40 Speculative proeel since 2009 Z | ‘\ _* $770 Million investment * Successful lease-up ¢ 25% Margins | yi yy f ff Ip Z ea) f y y, oa | / Wi AP tr 5 Z Product #of investment Pre-leased % | Dec 31, 2016 Type Projects at start date Occupa
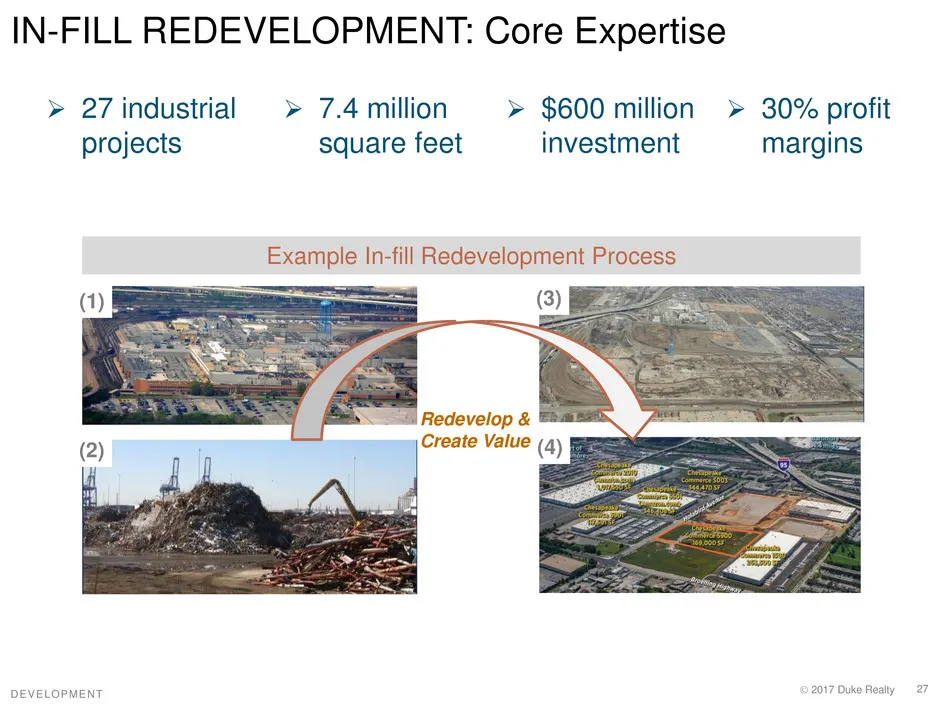
Slide 27: In-Fill Redevelopment: Core Expertise
IN-FILL REDEVELOPMENT: Core Expertise > 27 industrial > 7.4 million > $600 million > 30% profit projects square feet investment margins DEVELOPMENT
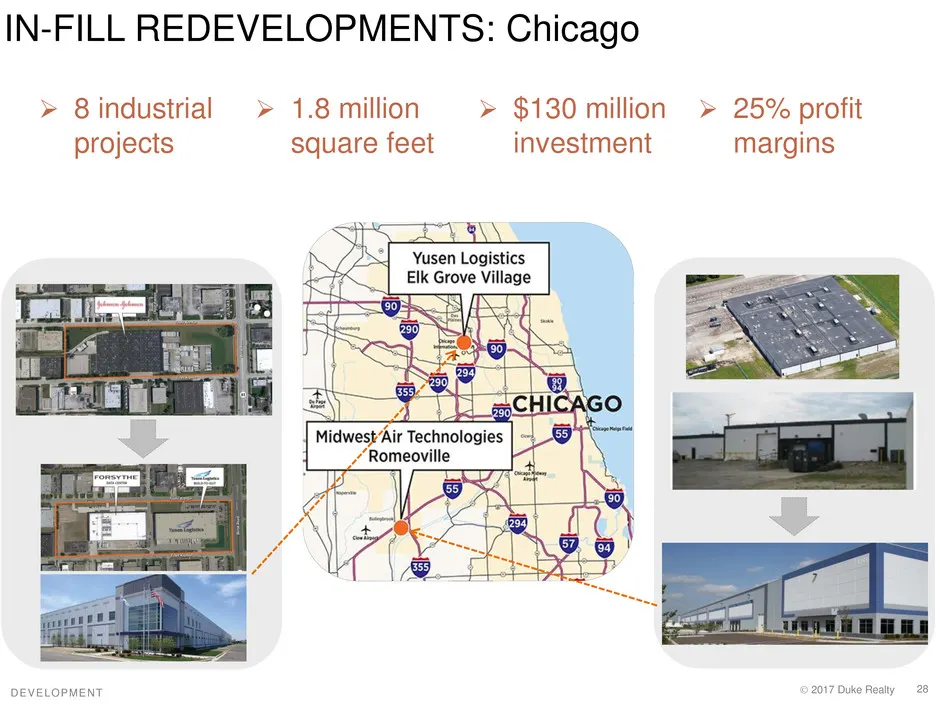
Slide 28: In-Fill Redevelopments: Chicago
IN-FILL REDEVELOPMENTS: Chicago > 8industrial > 1.8 million > $130 million > 25% profit projects square feet investment margins 4 Yusen Logistics Elk Grove Village DEVELOPMENT
Slide 29: In-Fill Redevelopments: Southern California
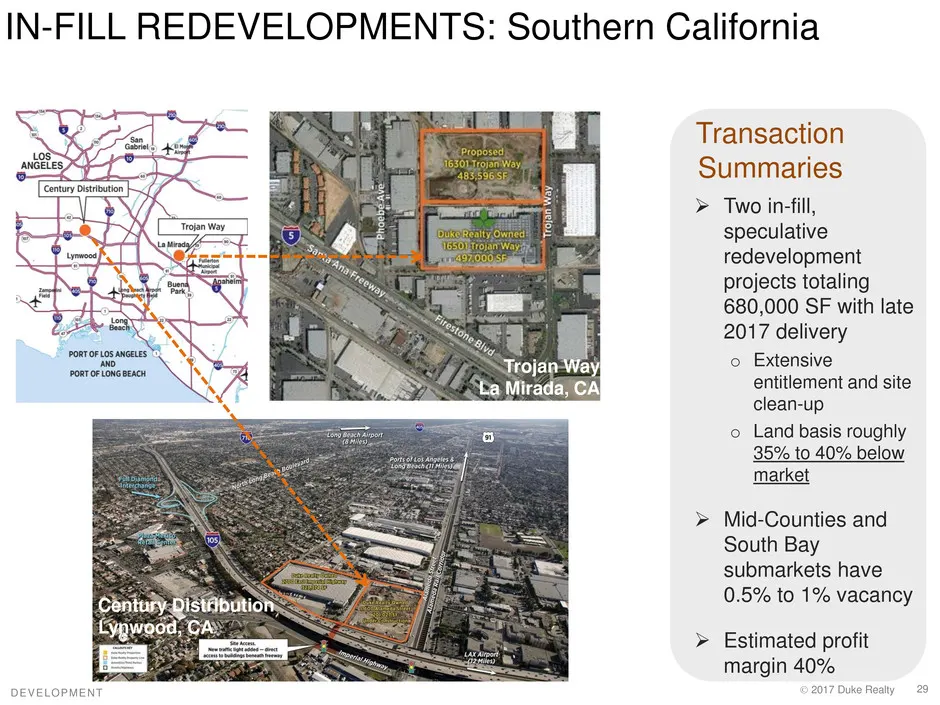
IN-FILL REDEVELOPMENTS: Southern California Transaction Summaries > Two in-fill, speculative redevelopment projects totaling 4 680,000 SF with late A 2017 delivery Trojan ‘Wa' o Extensive La Mirada, CA entitlement and site clean-up o Land basis roughly 35% to 40% below market roo » Mid-Counties and
Slide 30: Strong Relative Development Pipeline
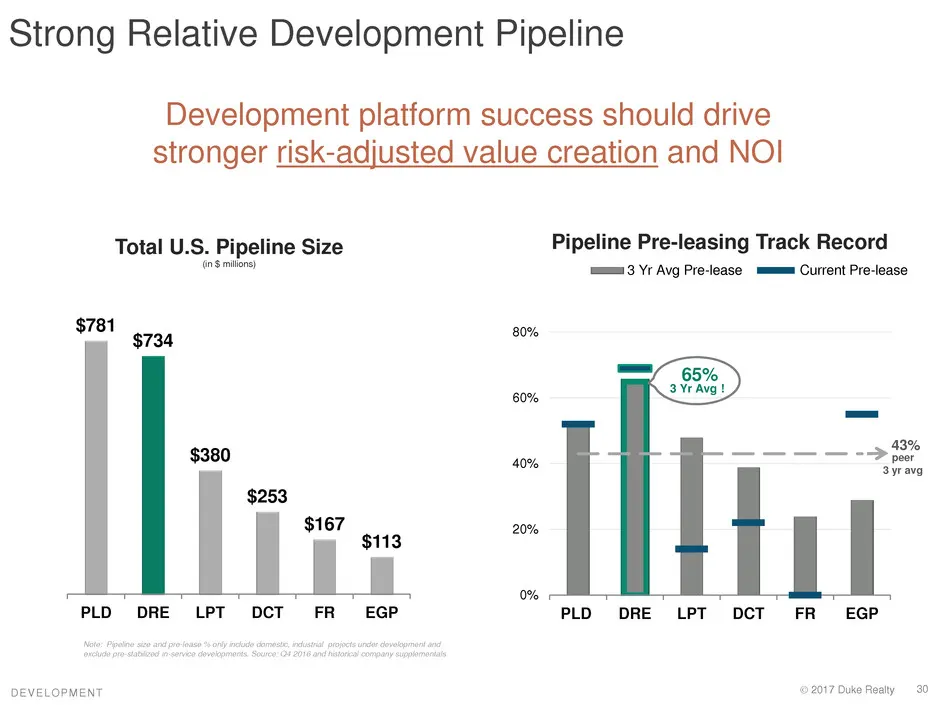
Strong Relative Development Pipeline Development platform success should drive stronger risk-adjusted value creation and NOI Total U.S. Pipeline Size Pipeline Pre-leasing Track Record Gomis) mmm 3 Yr Avg Pre-lease mmm Current Pre-lease x $734 PLD DRE LPT DCT FR_ EGP PLD DRE LPT DCT FR EGP DEVELOPMEN
Slide 31: Operating Strategy
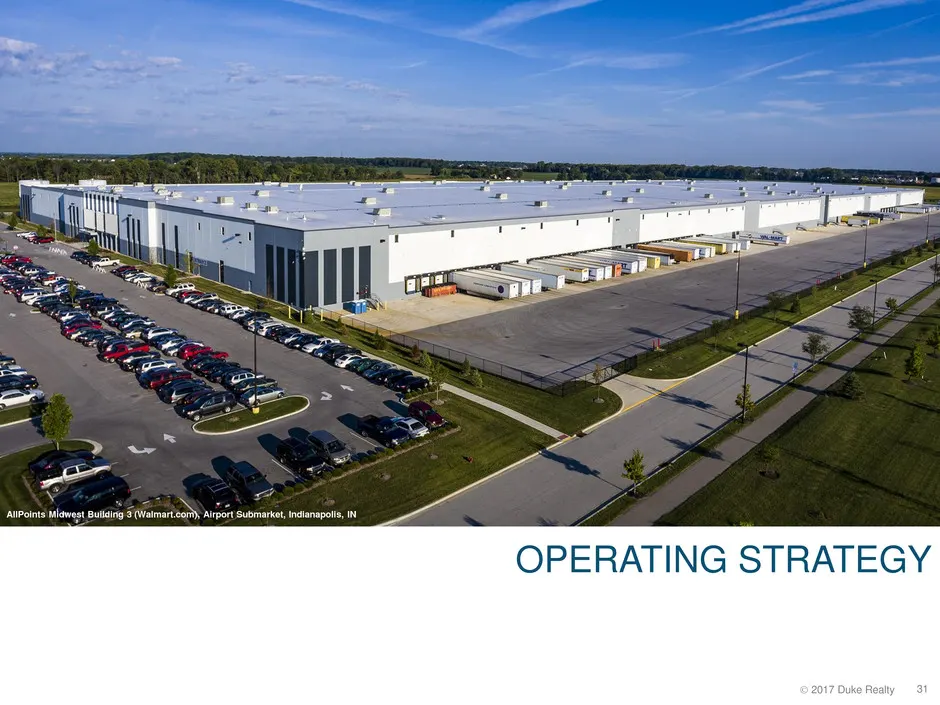
OPERATING STRATEGY
Slide 32: NOI Growth to drive NAV Growth
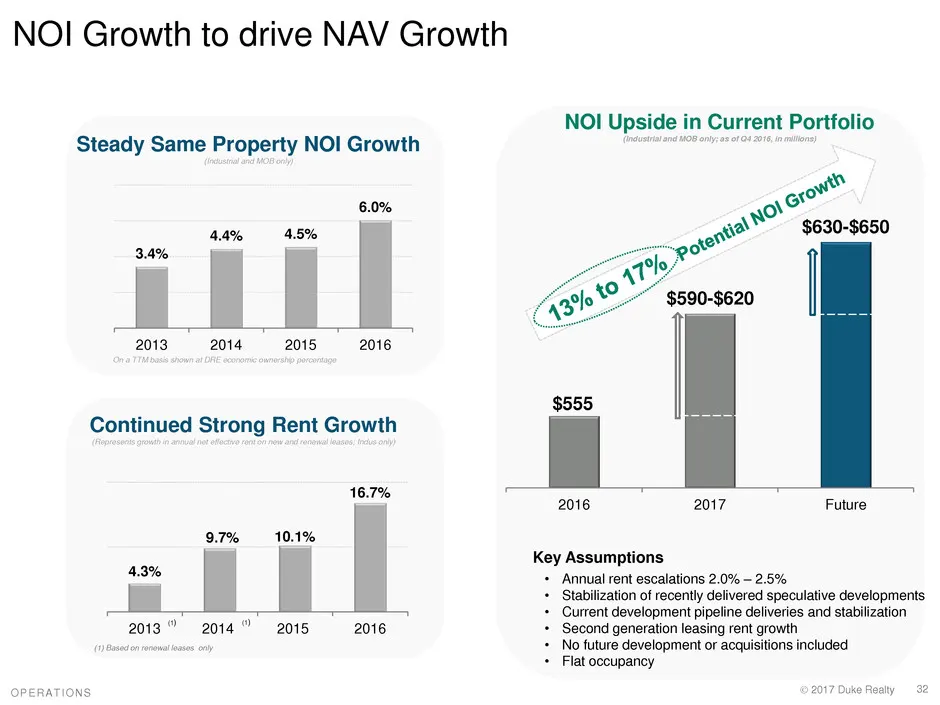
NOI Growth to drive NAV Growth Steady Same Property NOI Growth 6.0% 4.4% 4.5% 2013 2014 2015 2016 Continued Strong Rent Growth 16.7% 2013” 2014” 2015 2016 NOI Upside in Current Portfolio oo oo" 9630-8650 2 “gd av’ jo 8° $590-$620 2016 2017 Future Key Assumptions + Annual rent escalations 2.0% — 2.5%
Slide 33: Consistent Cash Flow Growth
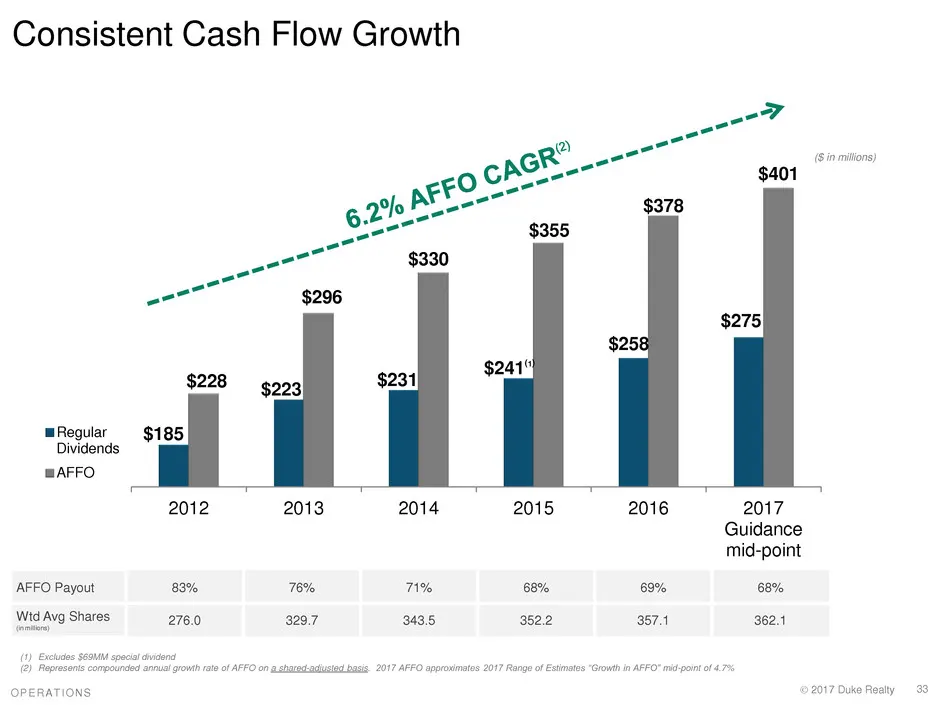
Consistent Cash Flow Growth cpo® ae a mRegular Dividends mAFFO 2012 2013 2014 2015 2016 2017 Guidance mid-point AFFO Payout 83% 76% 71% 68% 69% 68% Wid Avg Shares 276.0 329.7 343.5 352.2 387.1 362.1
Slide 34: Capital Strategy
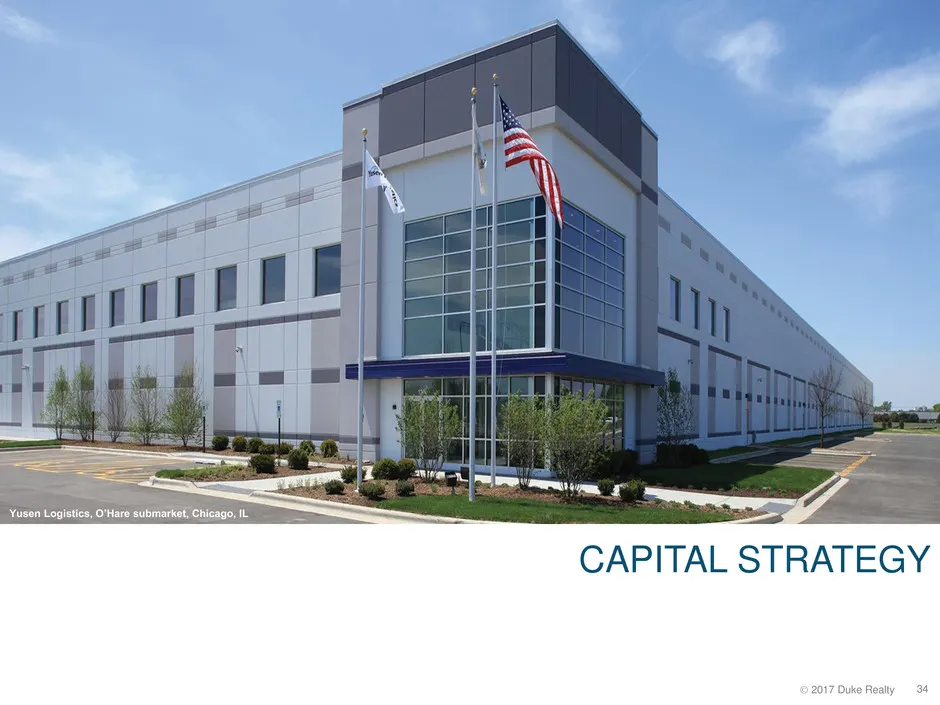
ie, | ane - CAPITAL STRATEGY
Slide 35: Best in Class Balance Sheet
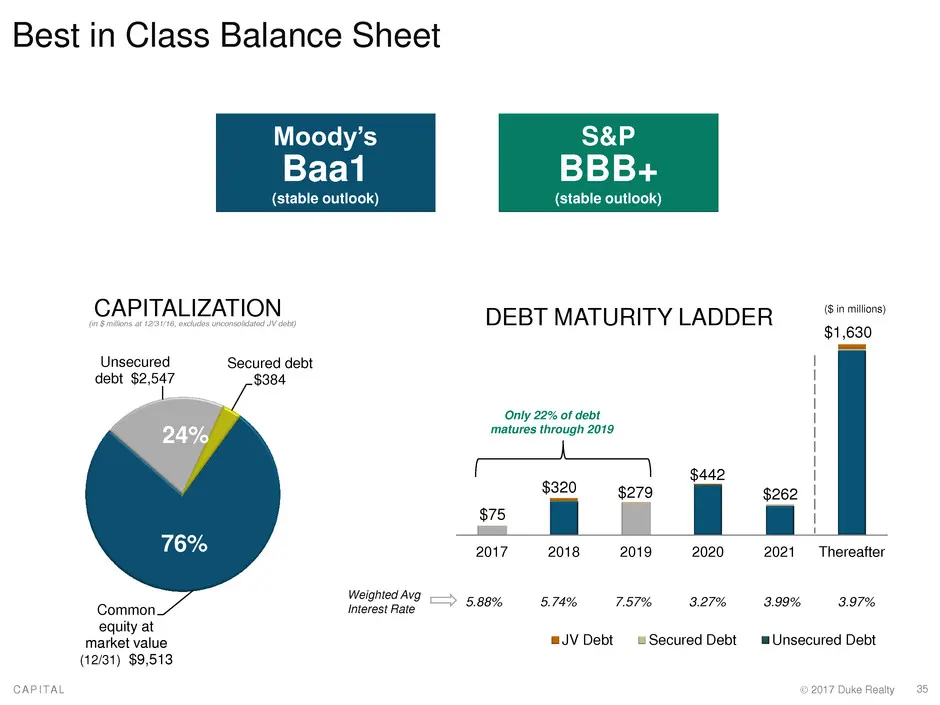
Best in Class Balance Sheet Moody’s S&P (stable outlook) (stable outlook) CAPITALIZATION DEBT MATURITY LADDER (Sin mitions) —_— $1,630 Unsecured Secured debt debt oid $384 Only 22% of debt ‘matures through 2019 $320 $279 2017-2018 2019 2020 2021 Thereafter Weighted avg Common. Interest Rate. > 588%
Slide 36: Conservative Capital Structure with Refinancing Upside
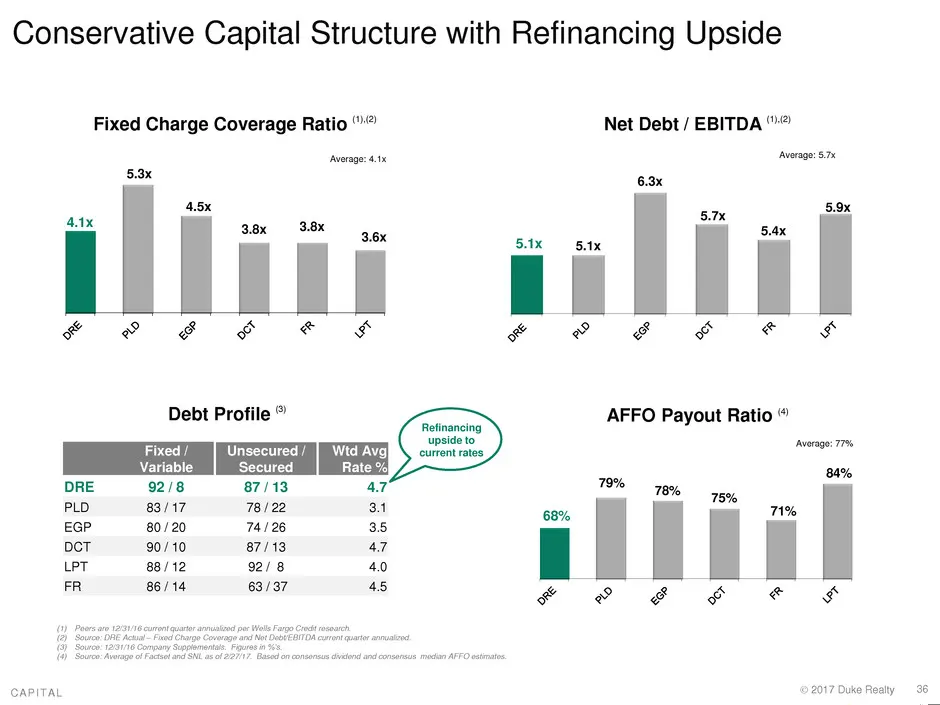
Conservative Capital Structure with Refinancing Upside Fixed Charge Coverage Ratio ".” Net Debt / EBITDA” verage: 4.8 ‘verge: 8.74 6.3x 5.7K 5.9x Ta & & € F € F & & €§ $F$ Ff F AFFO Payout Ratio “ CAPITAL 2017 Duke Realty
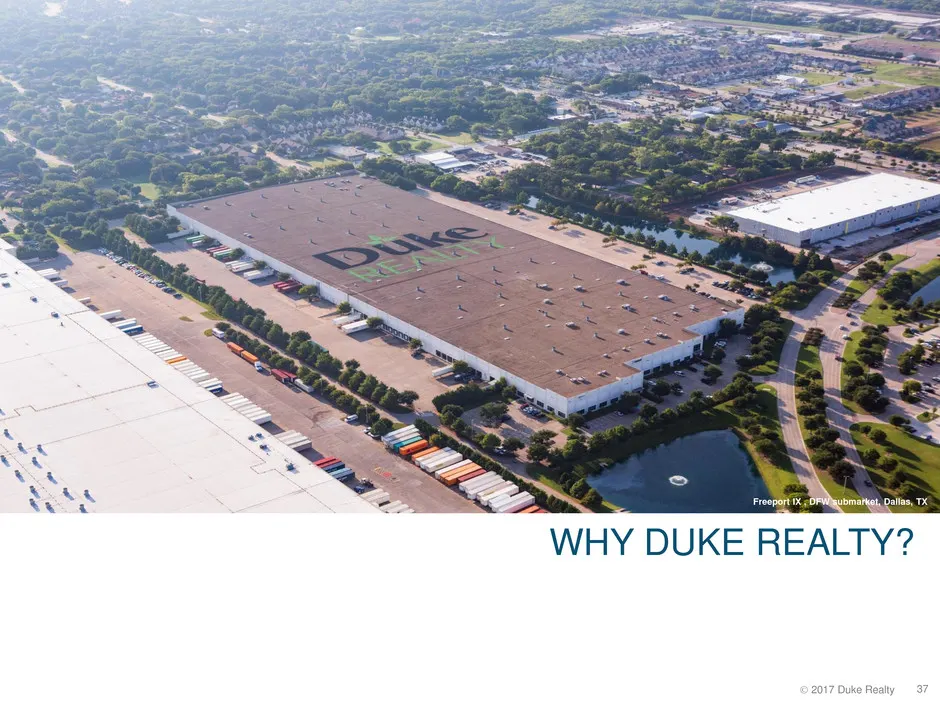
Slide 37: ac. is a <x uw a Lu x — a > i =
ac. is a <x uw a Lu x — a > i =
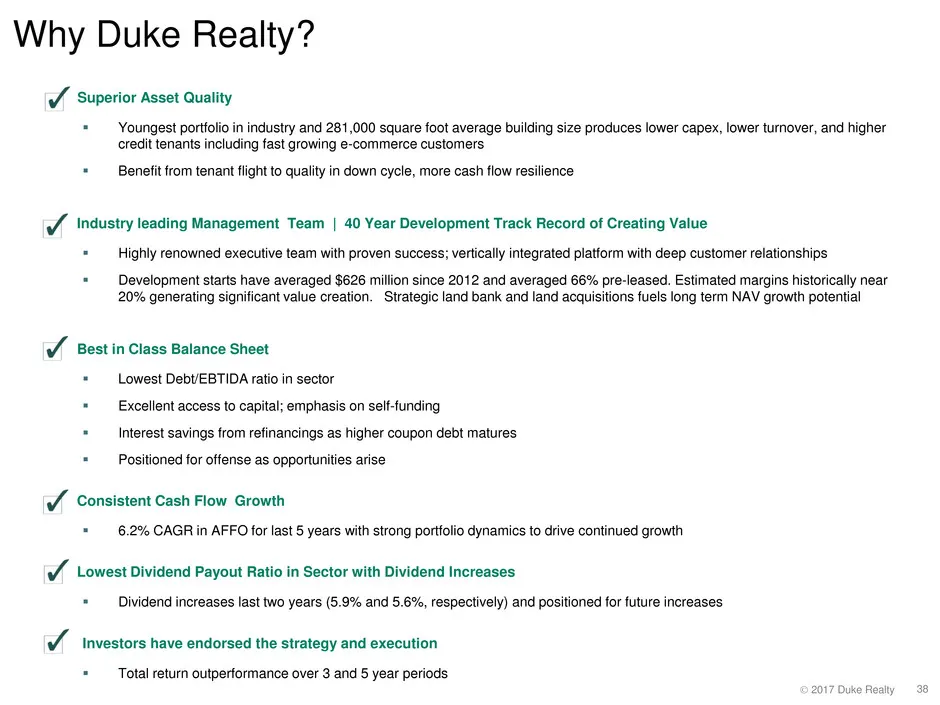
Slide 38: Why Duke Realty?
Why Duke Realty? ov Superior Asset Quality . i it and 281 ing si capex, lower turnover, and higher 9 * Benefit from tenant flight to quality in down v Industry leading Management Team | 40 Year Development Track Record of Creating Value ighly relationship: term Vv Best in Class Balance Sheet + Lowes
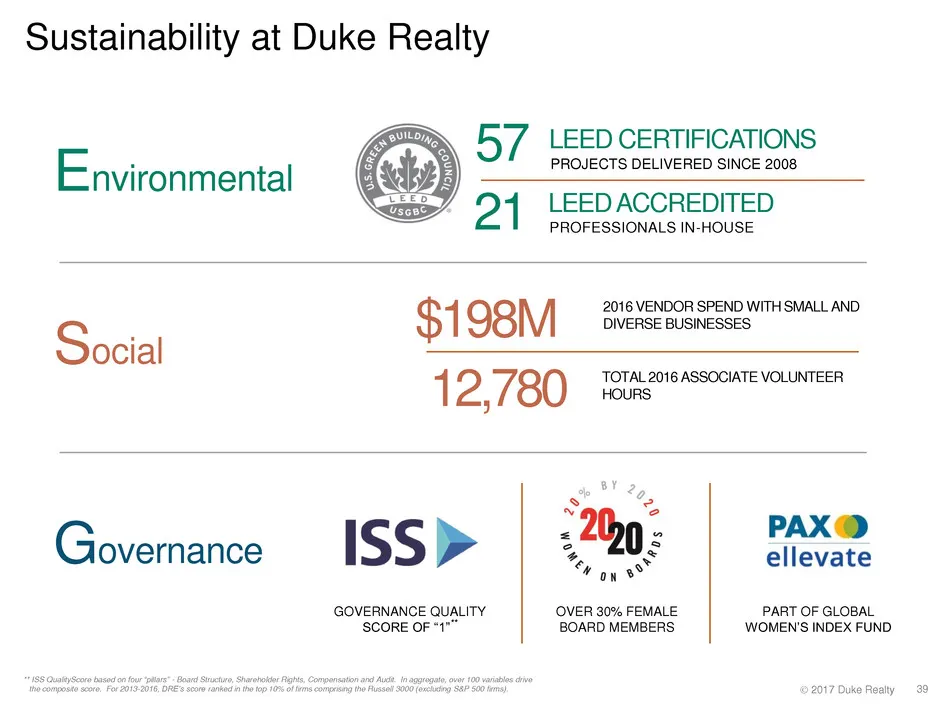
Slide 39: Sustainability at Duke Realty
Sustainability at Duke Realty LEED CERTIFICATIONS PROJECTS DELIVERED SINCE 2008 LEED ACCREDITED PROFESSIONALS IN-HOUSE Environmental 2016 VENDOR SPEND WITH SMALL AND DIVERSE BUSINESSES Ss ocial TOTAL 2016 ASSOCIATE VOLUNTEER 5 HOURS Governance ISS> +20: Hee te, S 4 on v® GOVERNANCE QUALITY OVER 30%
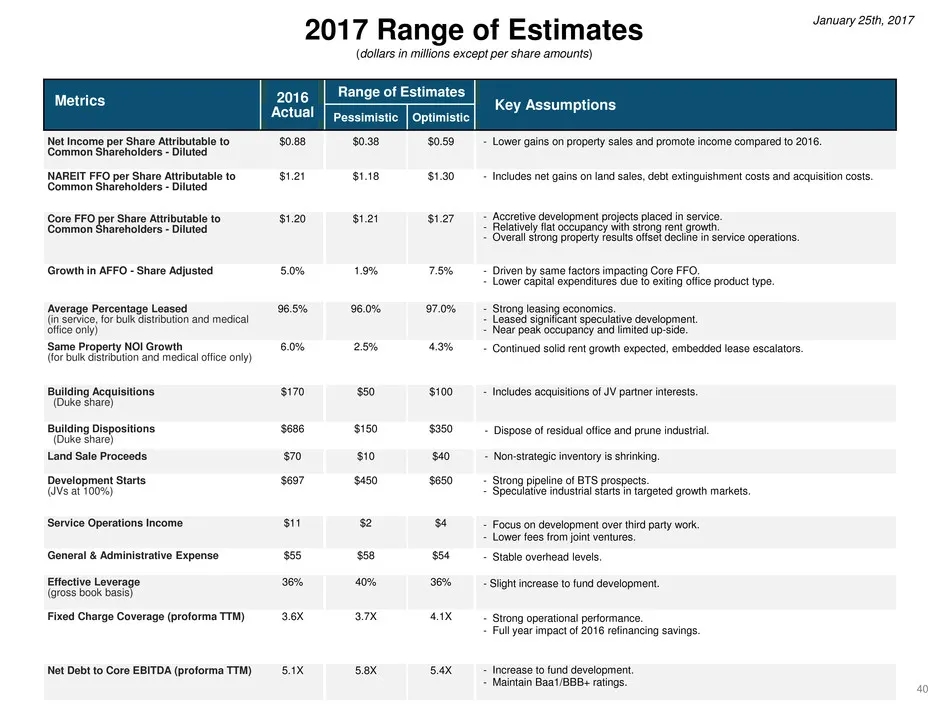
Slide 40: 2017 Range of Estimates
2017 Range of Estimates downey 207 (dollars in milions except per share amounts) Range of Estimates Key Assumptions Pessimistic | Optimistic et Inomy por Share Atul to $88 $038 $059 Common Shareholders NAREIT FEO per Share Aibutableto 1.21, $1181.00 Common Srareholders- Diluted re FFO per Share At 1
Slide 41: CoStar Disclaimer
CoStar Disclaimer THESE COSTAR PORTFOLIO STRATEGY MATERIALS CONTAIN FINANCIAL AND OTHER, INFORMATION FROM A VARIETY OF PUBLIC AND PROPRIETARY SOURCES. COSTAR GROUP, INC. AND ITS AFFILIATES (COLLECTIVELY, “COSTAR”) HAVE ASSUMED AND RELIED UPON, WITHOUT INDEPENDENT VERIFICATION, THE ACCURACY AND COMPL
Slide 42: Definitions
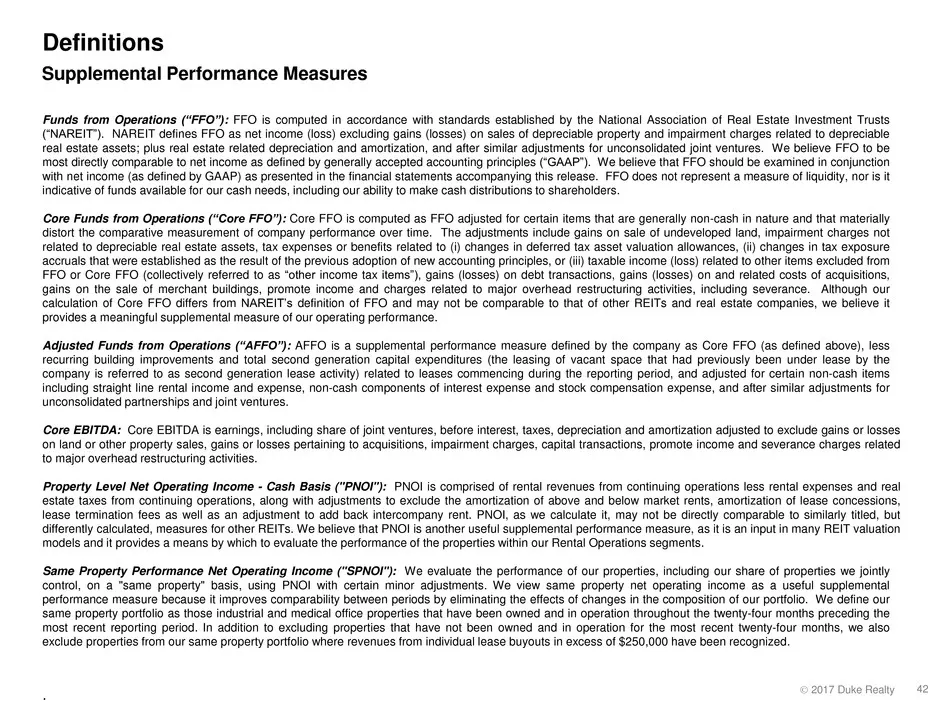
Definitions Supplemental Performance Measures “unds from Operations (“FFO"): FFO is computed in accordance with standards established by the National Association of Real Estate Investment Trusts reciable Chanter NAST detnes 70 0 and amortization, and i joint ventures. We believe FFO to be P") liquid
Slide 43: FFO, Core FFO and AFFO Reconciliation
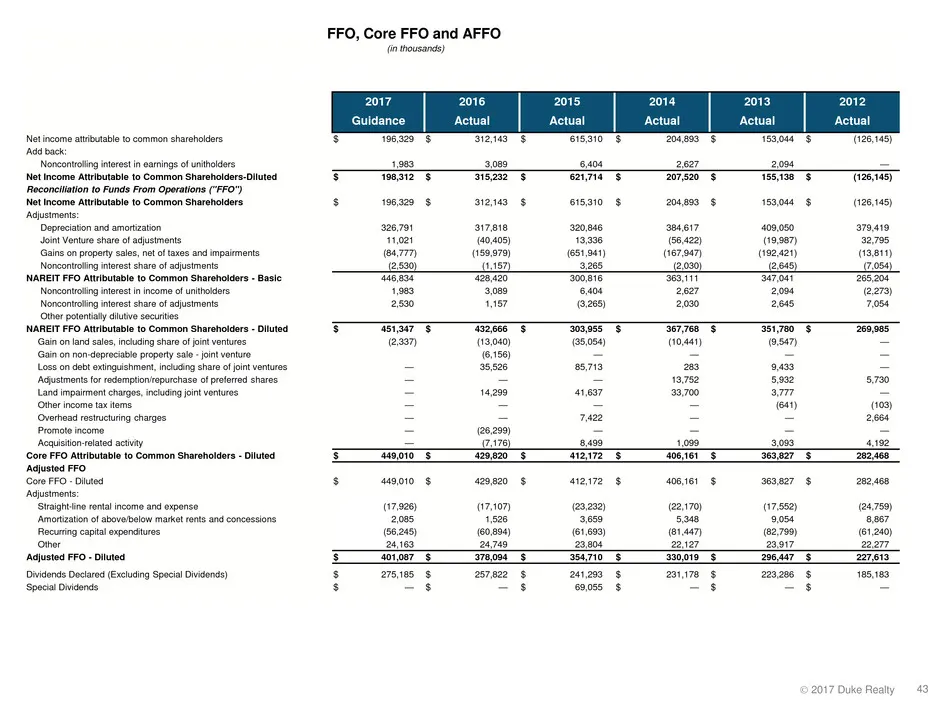
Ntincome atibuble to common shareholders Ad back: Noncontoling intrest in earings of unthedors Het come Ate Conon Shales ite npr CPO) te common Sarcoters Acquisiion lated actvy FFO, Core FFO and AFFO (i ousands) 2017 4 3 408 2627 2084 = ¥ Tesi & i522 ware © wor 520 755,198 & Tae) s 195529 § 312,148
Slide 44: Same Property NOI Reconciliation
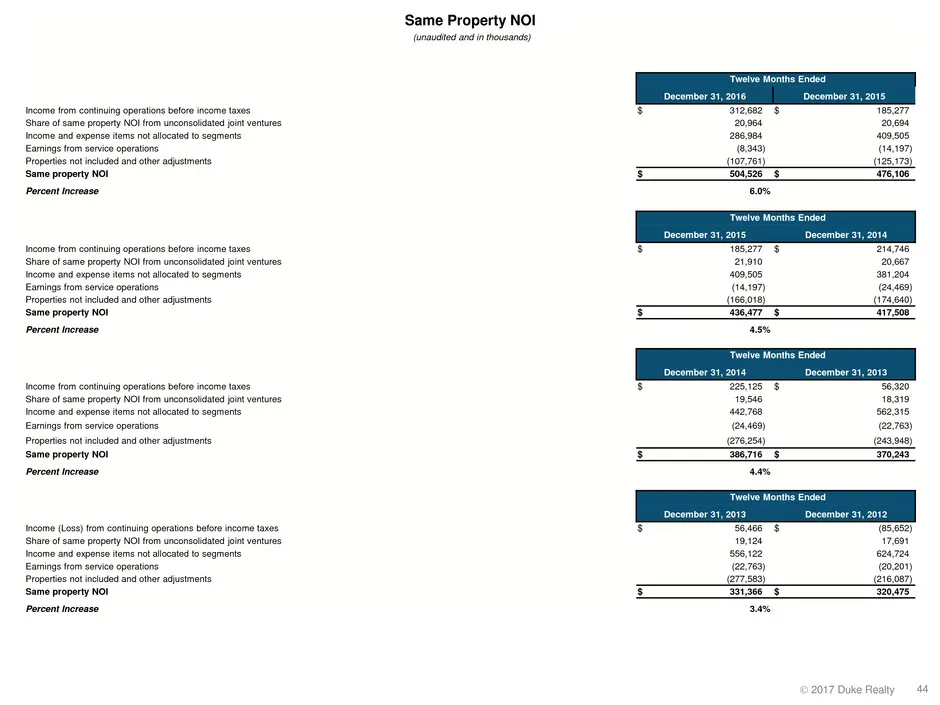
came fam canting opens blo Sha fsa NOltom uconsodsted iat ventures 1nd expense tems no allocated o sqm Eamings tom ore eprtens Preporos not included and other adusiments ‘Same property NOI se rom continuing operations oon 9 teane ppt Nt ton rt ia ventures ‘xponco tems nt allocates 6 foe rom service
Source: SEC EDGAR · 8-K filed Mar 6, 2017
More decks from Duke Realty Corporation
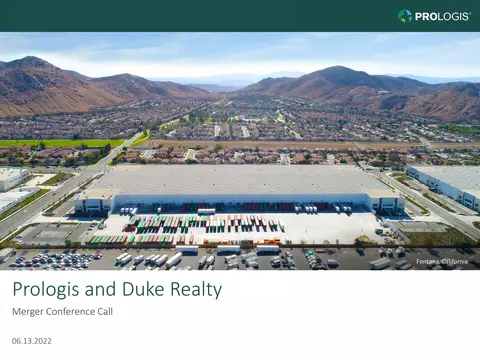 Merger or Acquisition (June 2022)14 slides · Jun 13, 2022
 Investor Presentation (June 2021)58 slides · Jun 7, 2021
 Investor Presentation (May 2021)44 slides · May 10, 2021
 Investor Presentation (February 2021)58 slides · Feb 22, 2021
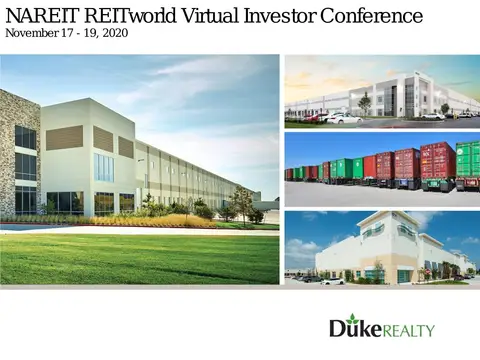 NAREIT REITworld Virtual Investor Conference 202056 slides · Nov 16, 2020
 B of A Securities 2020 Global Real Estate Conference56 slides · Sep 15, 2020