Rexel SA · EURONEXT:RXL
Rexel SA — Investor Day (2013)
125 slides from Rexel SA's investor day presentation, 2013
Slide 1: Rexel 2013 Investor Day: Staying the Course
REXEL 2013 INVESTOR DAY “STAYING THE COURSE”
Slide 2: Strategic Update
STRATEGIC UPDATE Rudy PROVOOST, Chairman of the Management Board and CEO
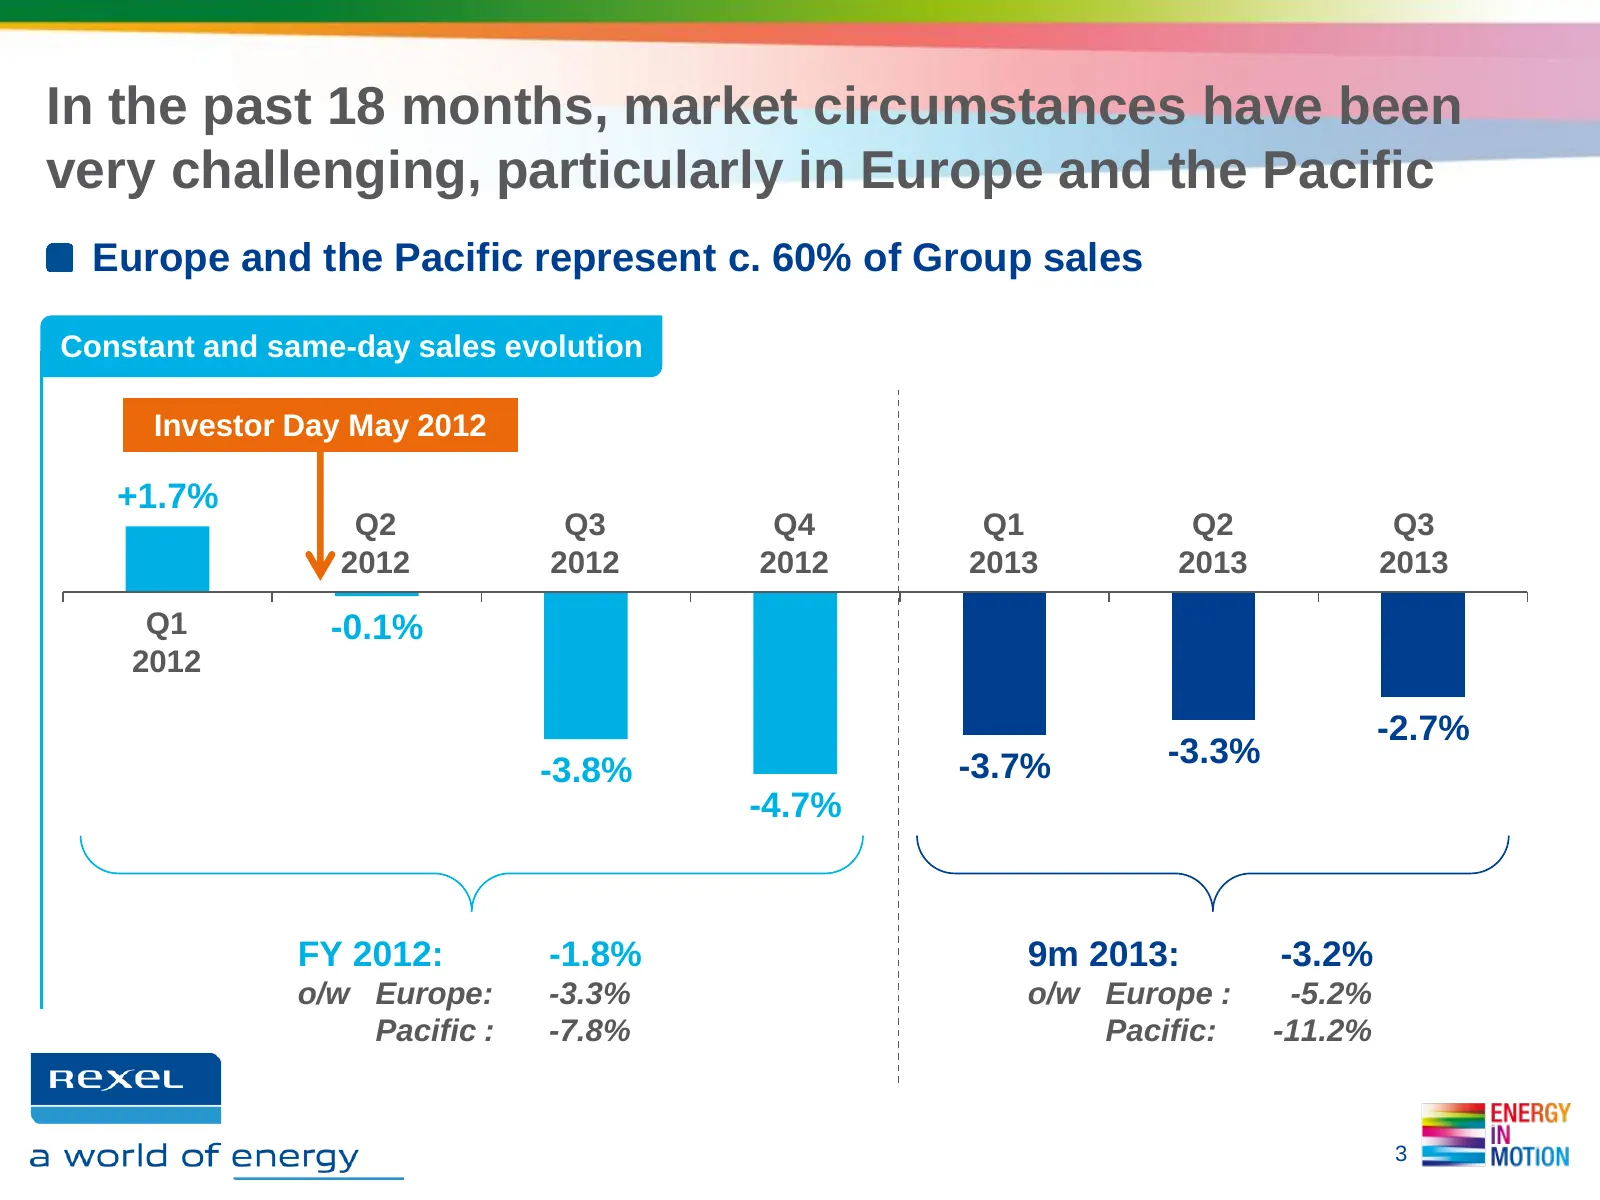
Slide 3: Market circumstances very challenging in Europe and the Pacific
In the past 18 months, market circumstances have been very challenging, particularly in Europe and the Pacific Europe and the Pacific represent c. 60% of Group sales Constant and same-day sales evolution Investor Day May 2012 +1.7% Q2 Q3 Q4 Q1 Q2 Q3 2012 2012 2012 2013 2013 2013 Q1 -0.1% 2012 -2.7%
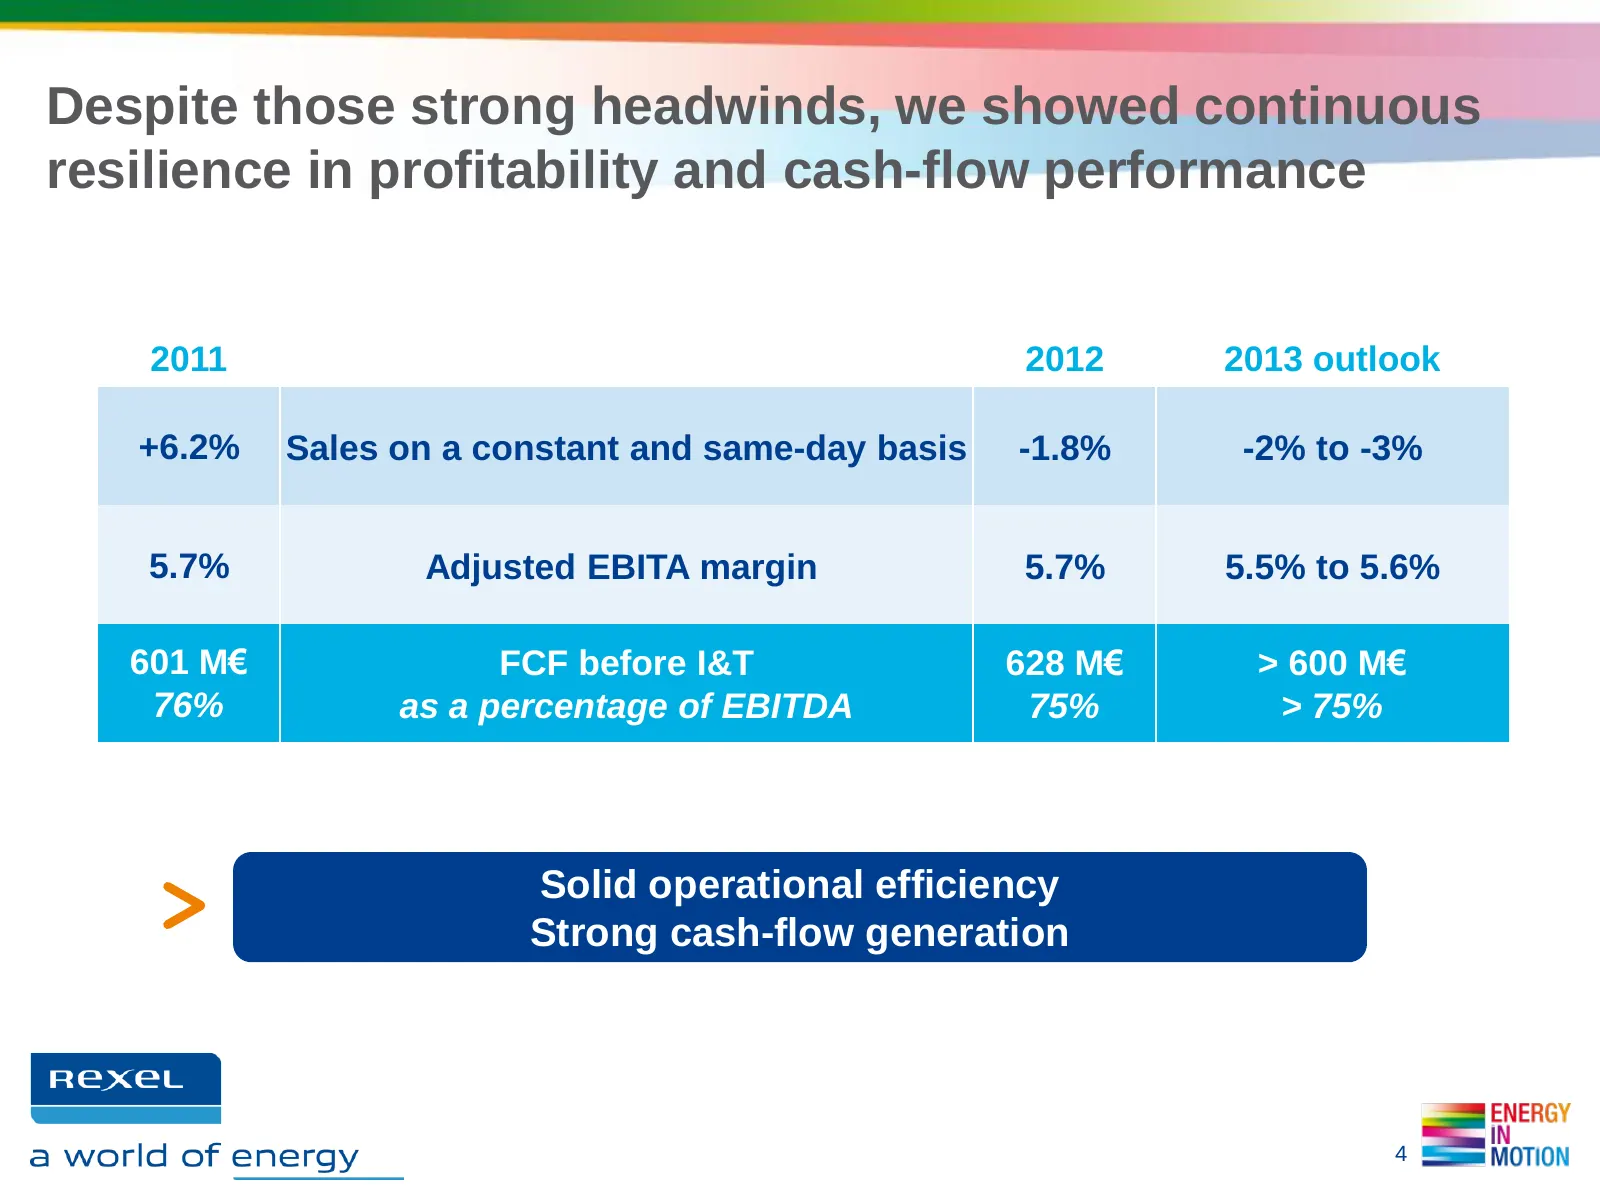
Slide 4: Resilience in profitability and cash-flow performance
Despite those strong headwinds, we showed continuous resilience in profitability and cash-flow performance 2011 2012 2013 outlook +6.2% Sales on a constant and same-day basis -1.8% -2% to -3% 5.7% Adjusted EBITA margin 5.7% 5.5% to 5.6% 601 M€ FCF before I&T 628 M€ > 600 M€ 76% as a percentage of EB
Slide 5: High-growth initiatives generated solid organic growth
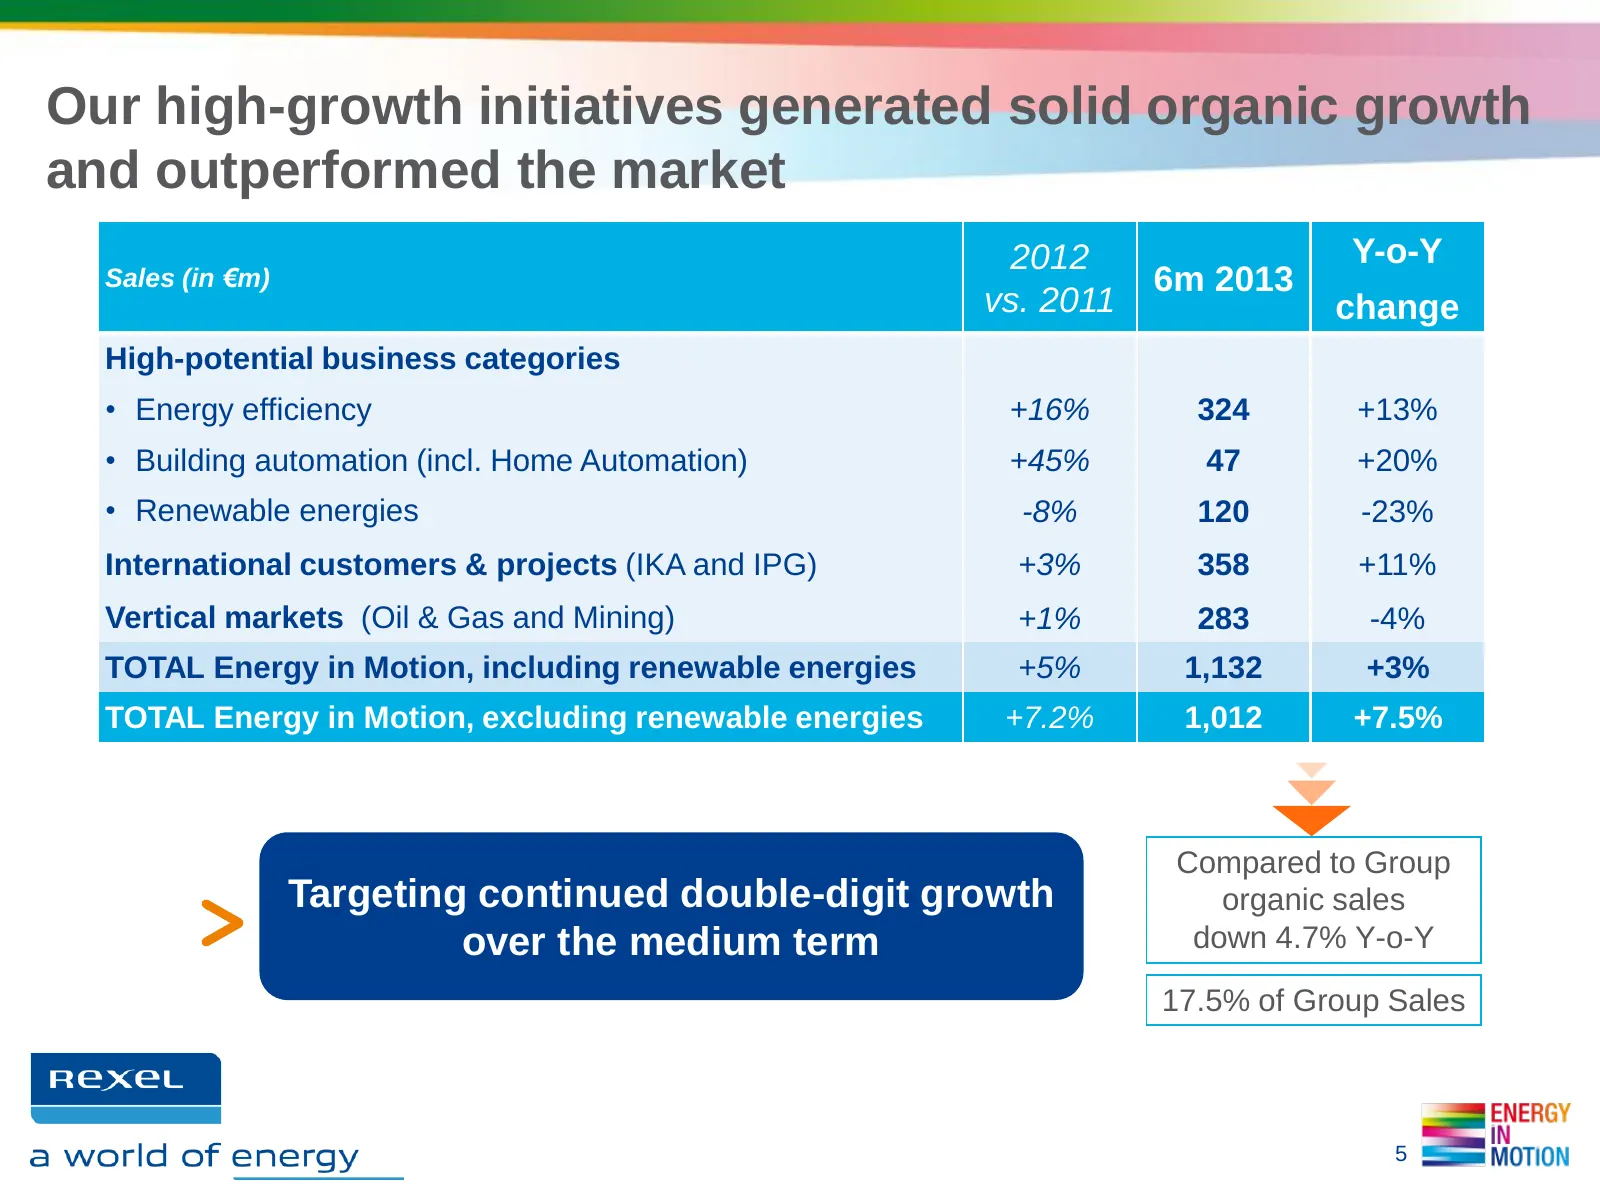
Our high-growth initiatives generated solid organic growth and outperformed the market 2012 Y-o-Y Sales (in €m) 6m 2013 vs. 2011 change High-potential business categories • Energy efficiency +16% 324 +13% • Building automation (incl. Home Automation) +45% 47 +20% • Renewable energies -8% 120 -23% In
Slide 6: Since January 2012, we have stepped up our M&A
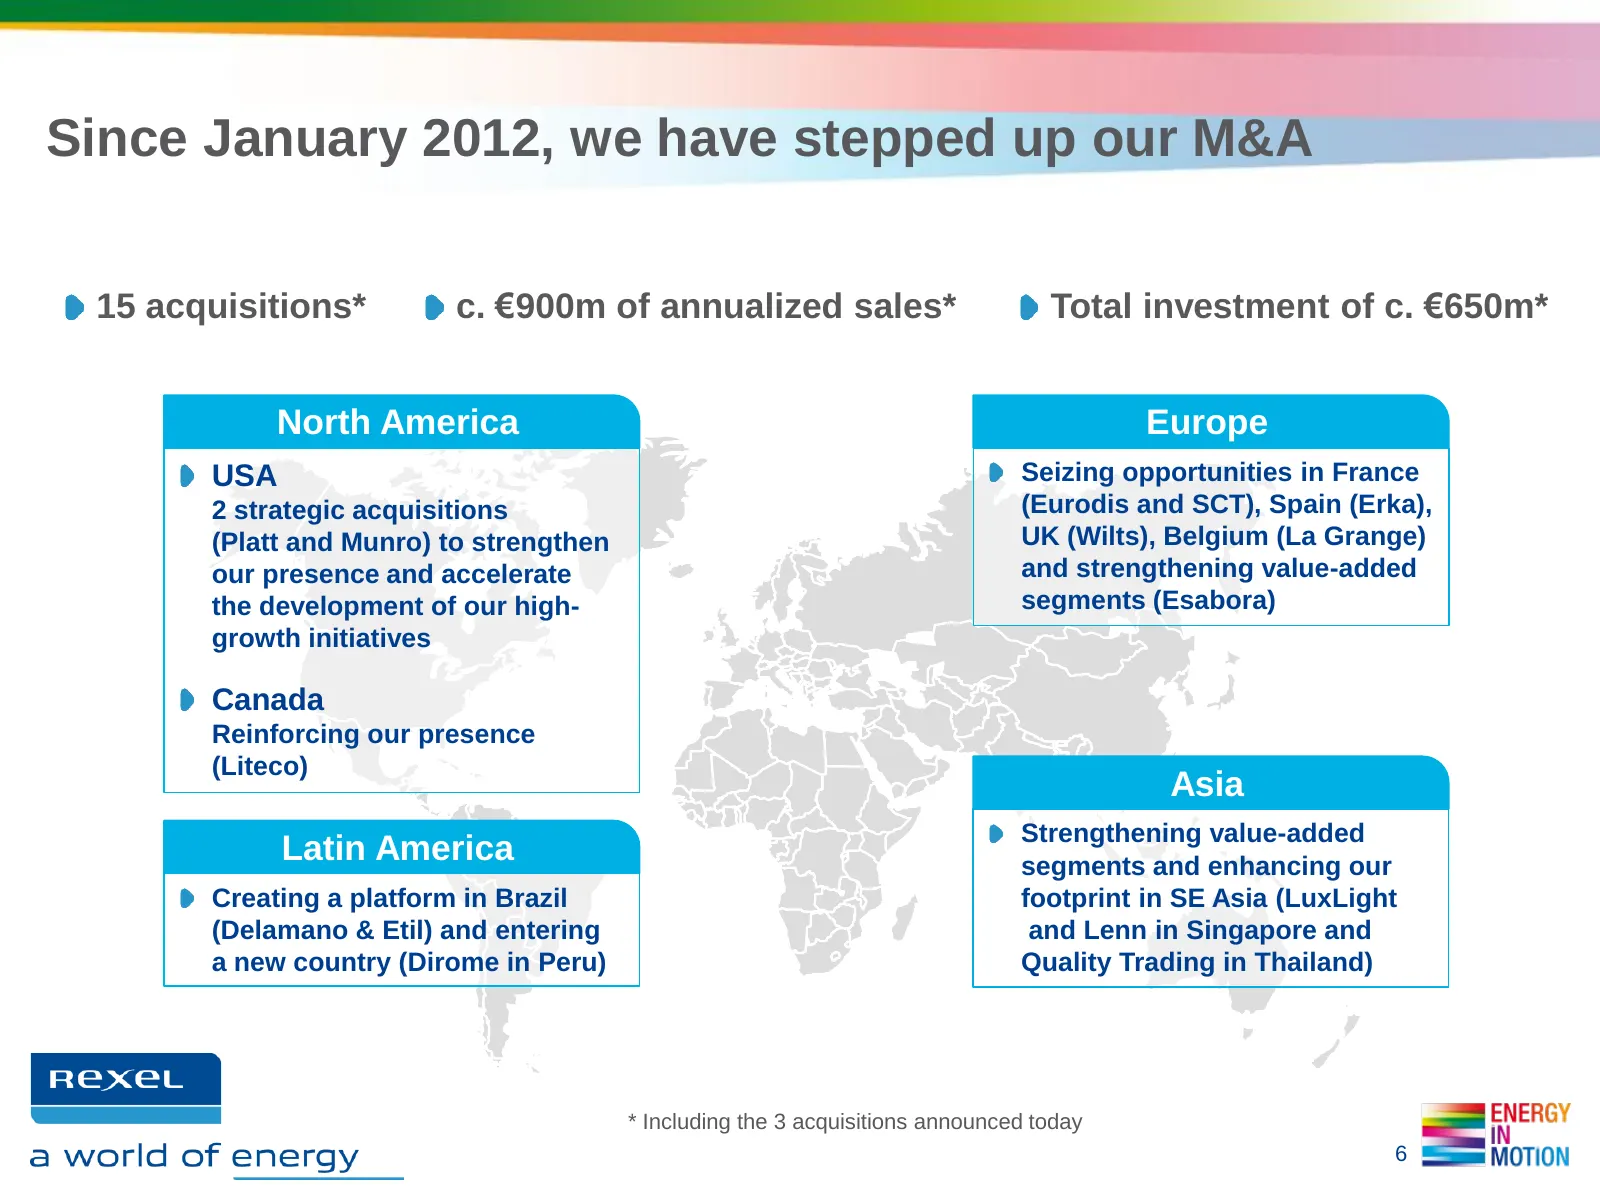
Since January 2012, we have stepped up our M&A 15 acquisitions* c. €900m of annualized sales* Total investment of c. €650m* North America Europe USA Seizing opportunities in France 2 strategic acquisitions (Eurodis and SCT), Spain (Erka), (Platt and Munro) to strengthen UK (Wilts), Belgium (La Grang
Slide 7: Rexel occupies a strategic position in the value chain
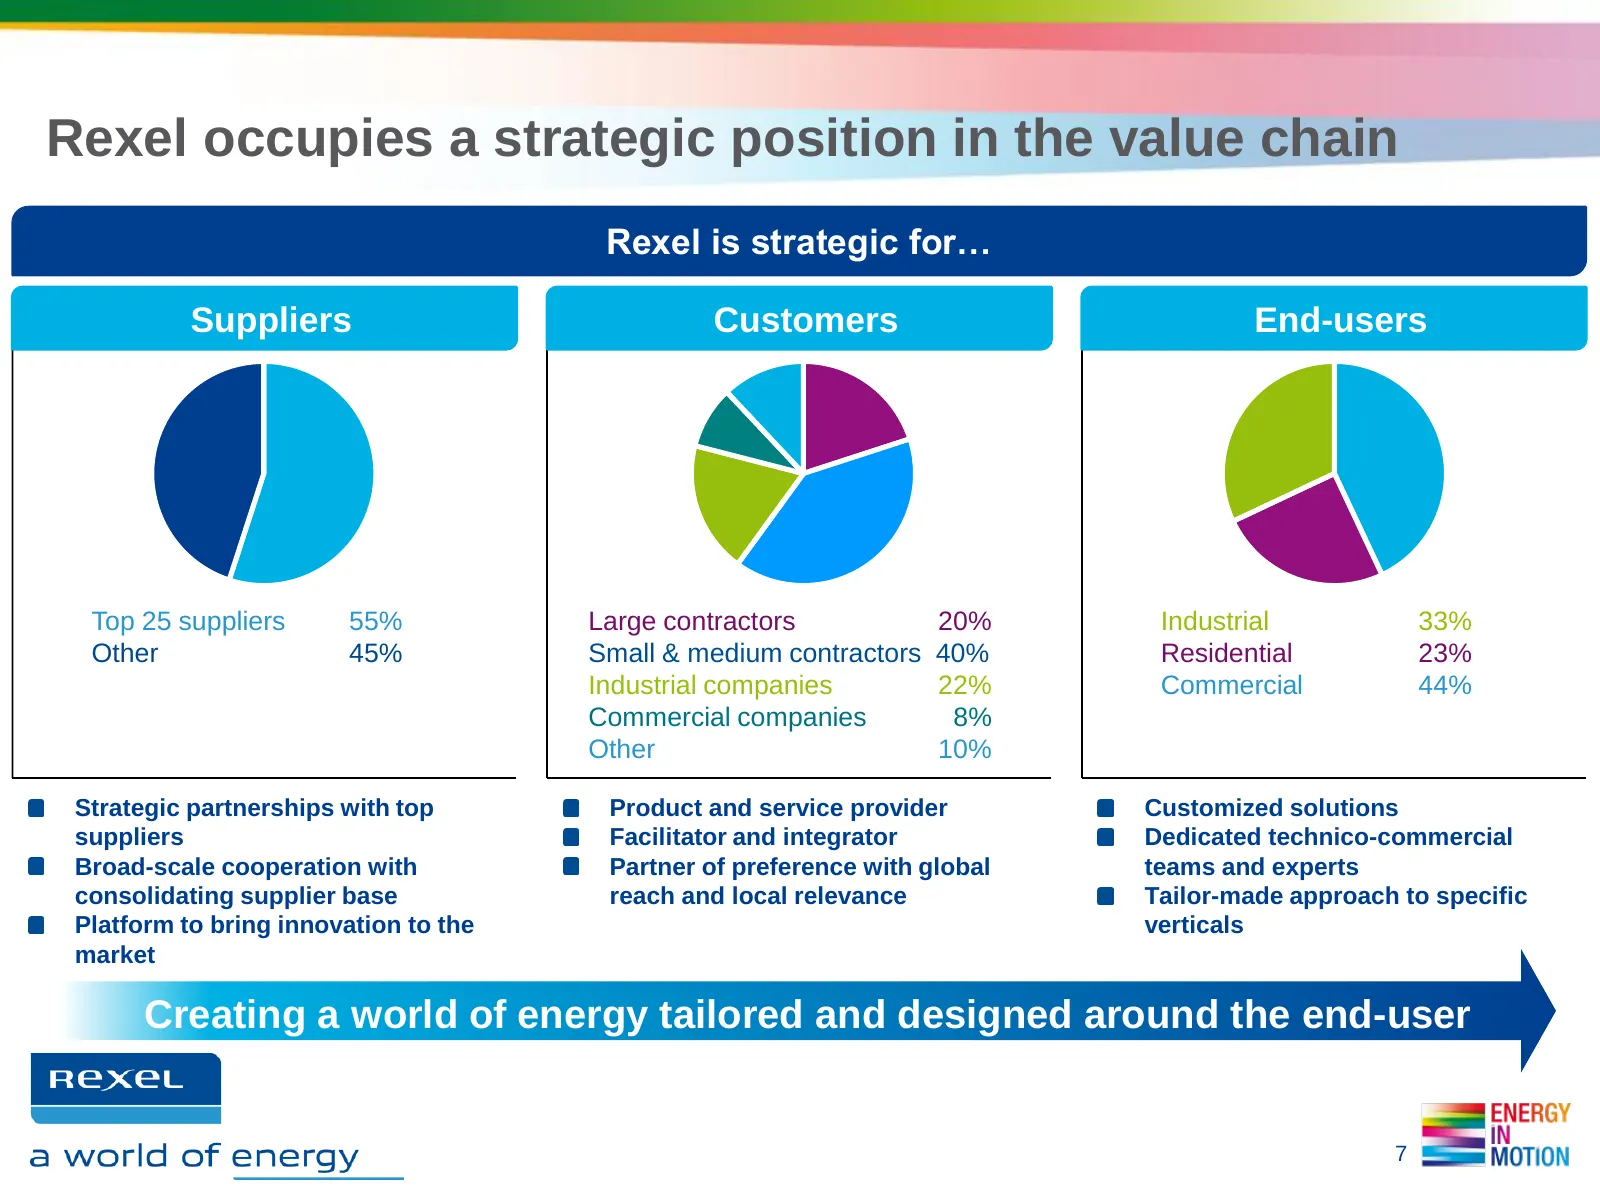
Rexel occupies a strategic position in the value chain Rexel is strategic for… Suppliers Customers End-users Top 25 suppliers 55% Large contractors 20% Industrial 33% Other 45% Small & medium contractors 40% Residential 23% Industrial companies 22% Commercial 44% Commercial companies 8% Other 10% St
Slide 8: Leading positions in most markets
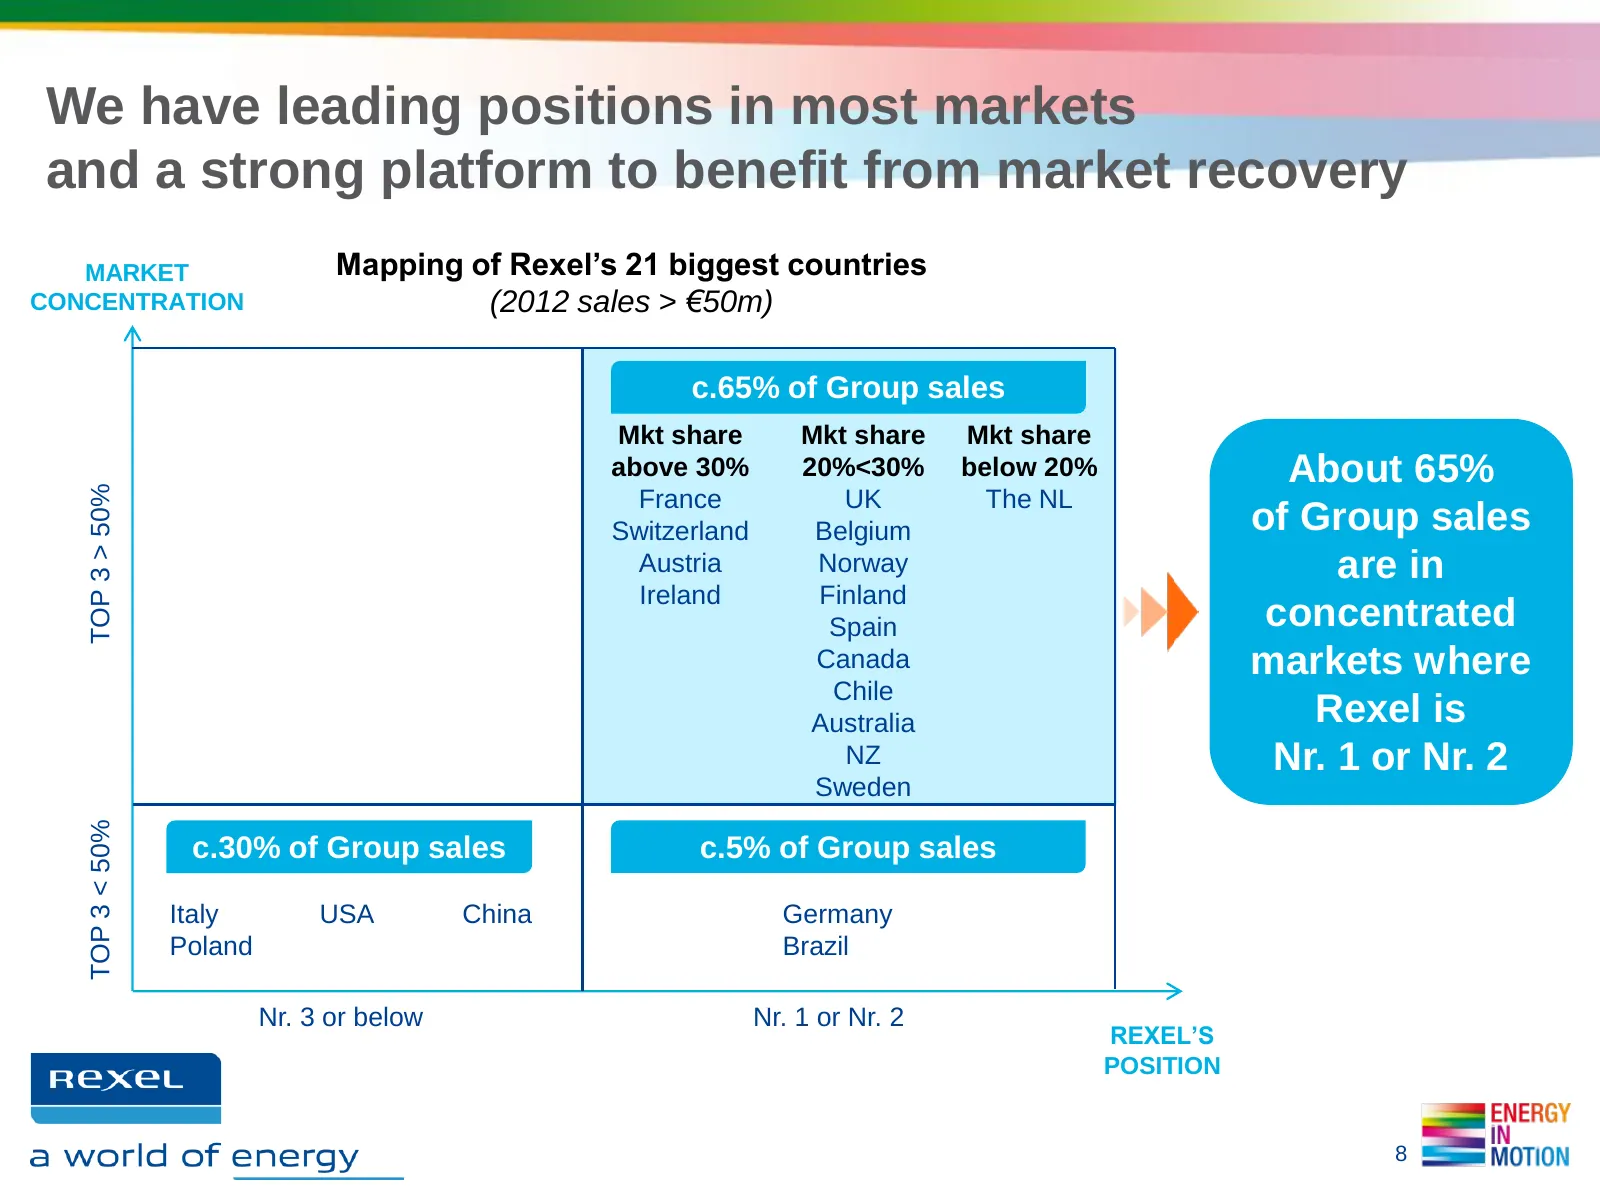
We have leading positions in most markets and a strong platform to benefit from market recovery MARKET Mapping of Rexel’s 21 biggest countries CONCENTRATION (2012 sales > €50m) c.65% of Group sales Mkt share Mkt share Mkt share above 30% 20%<30% below 20% About 65% TOP 3 > 50% France UK The NL Switz
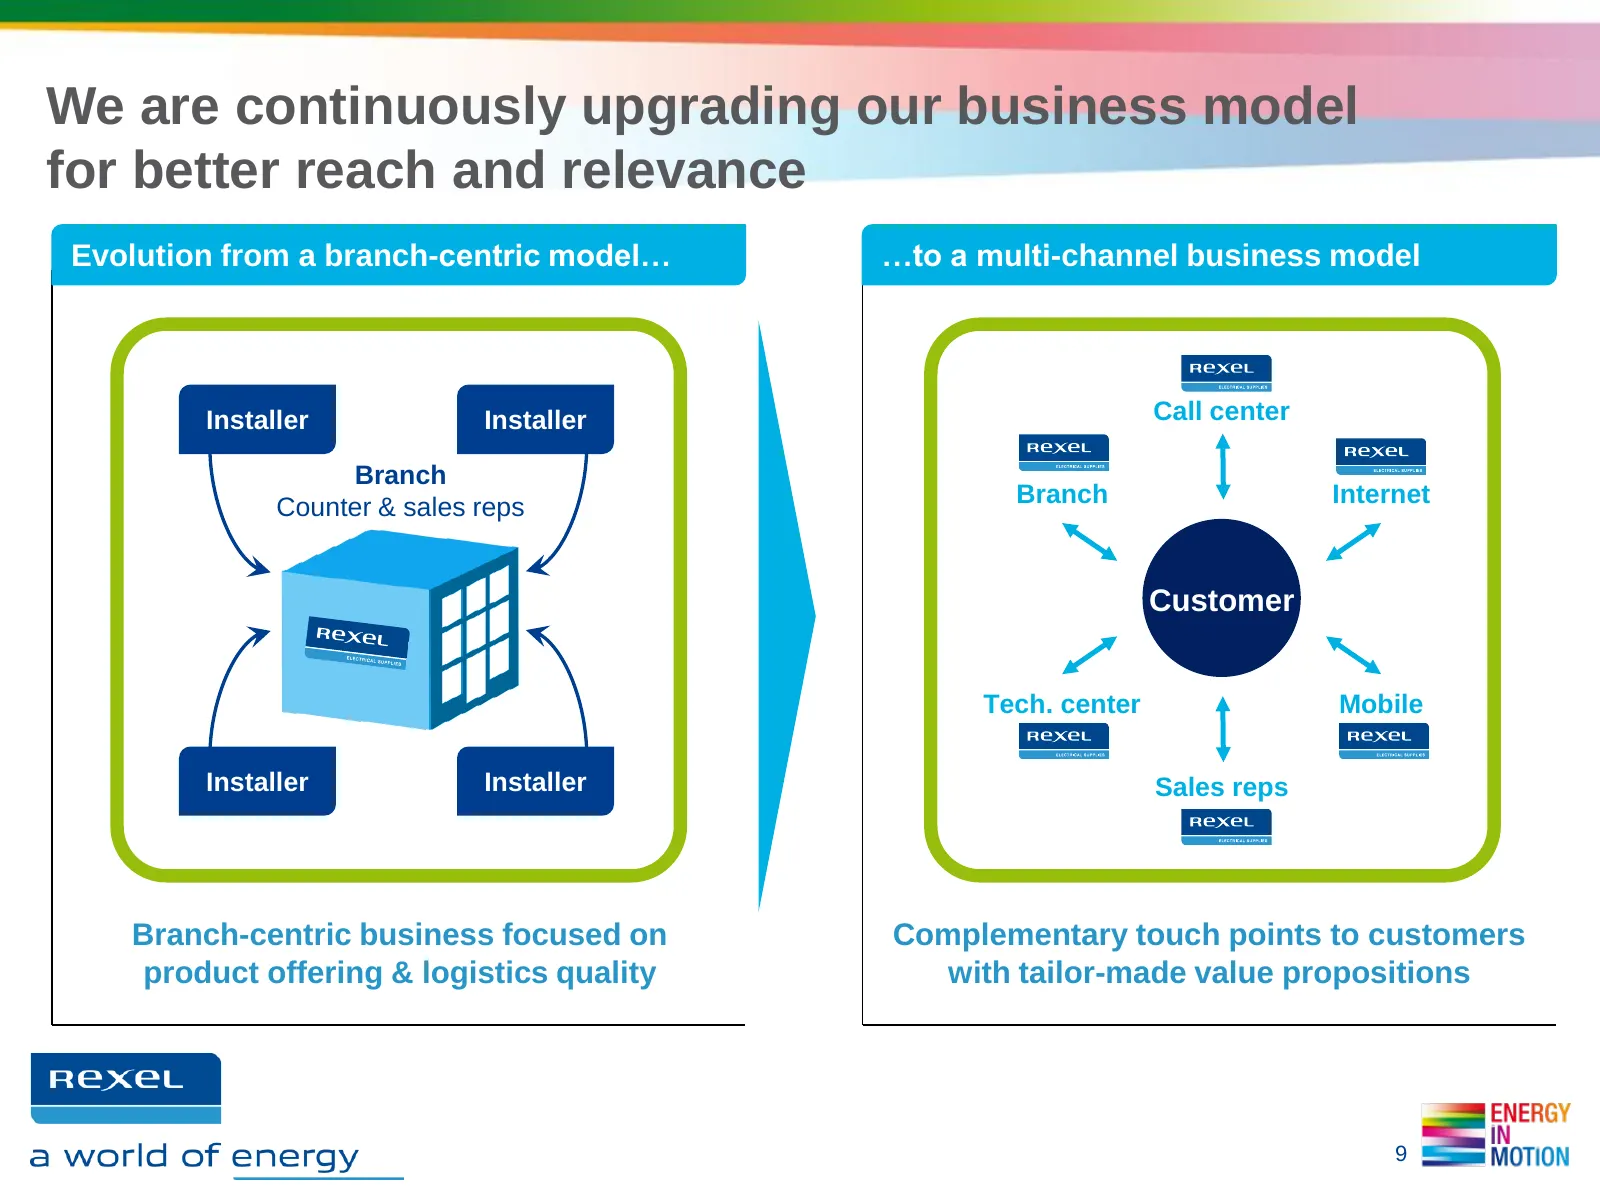
Slide 9: Upgrading our business model for better reach and relevance
We are continuously upgrading our business model for better reach and relevance Evolution from a branch-centric model… …to a multi-channel business model Installer Installer Call center Branch Counter & sales reps Branch Internet Customer Tech. center Mobile Installer Installer Sales reps Branch-cen
Slide 10: Our performance at a glance
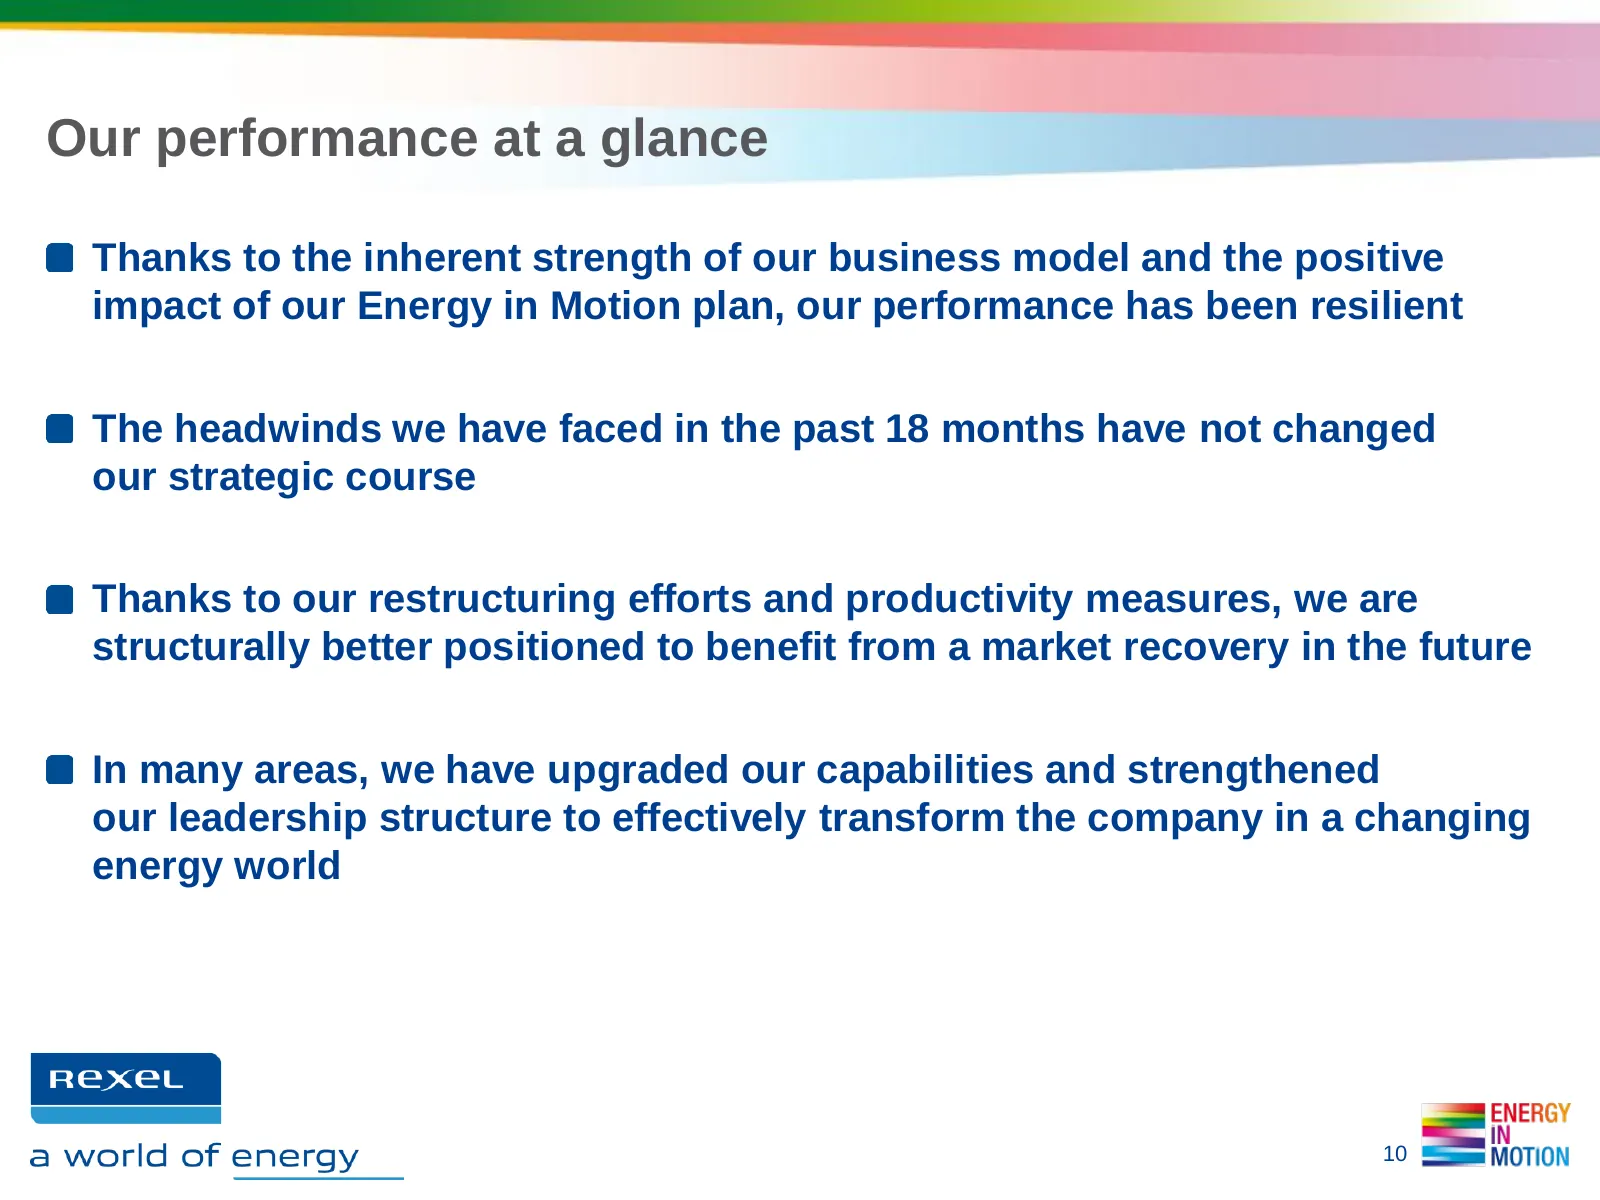
Our performance at a glance Thanks to the inherent strength of our business model and the positive impact of our Energy in Motion plan, our performance has been resilient The headwinds we have faced in the past 18 months have not changed our strategic course Thanks to our restructuring efforts and p
Slide 11: Our medium-term ambitions
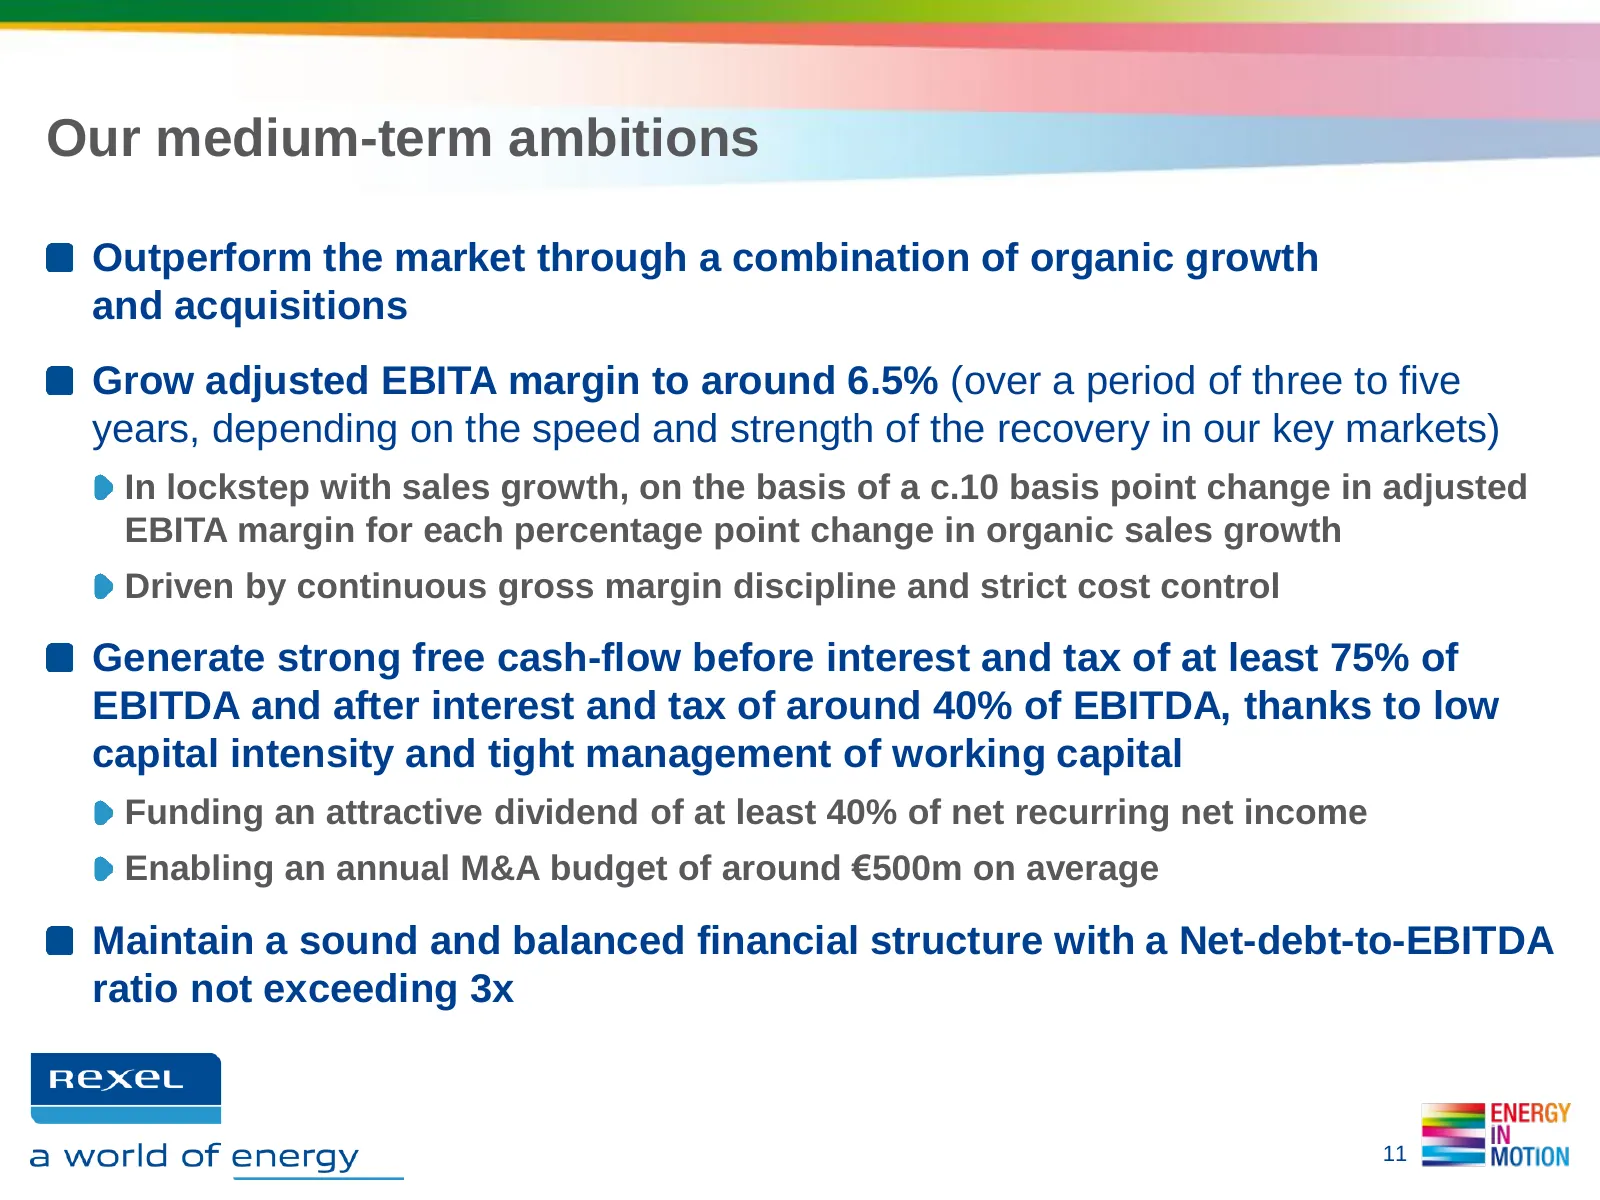
Our medium-term ambitions Outperform the market through a combination of organic growth and acquisitions Grow adjusted EBITA margin to around 6.5% (over a period of three to five years, depending on the speed and strength of the recovery in our key markets) In lockstep with sales growth, on the basi
Slide 12: Today's Investor Day focuses on four business imperatives
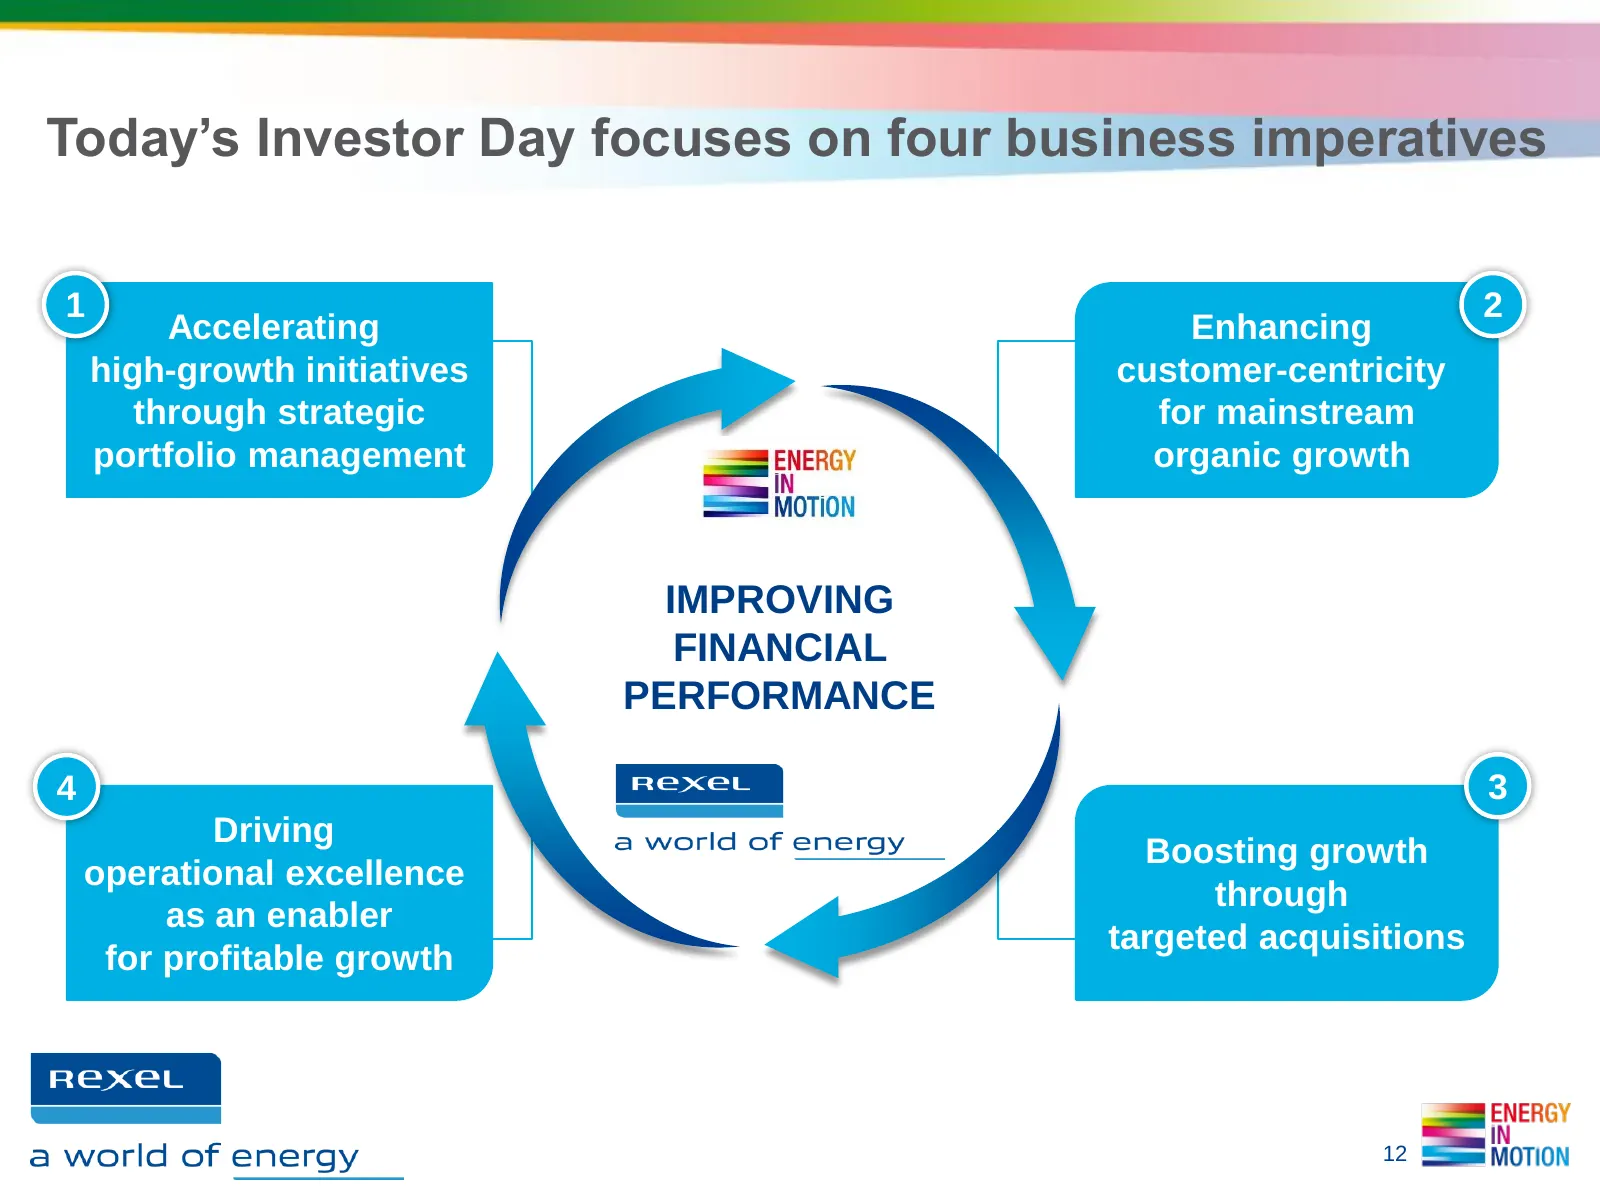
Today’s Investor Day focuses on four business imperatives 1 2 Accelerating Enhancing high-growth initiatives customer-centricity through strategic for mainstream portfolio management organic growth IMPROVING FINANCIAL PERFORMANCE 4 3 Driving Boosting growth operational excellence through as an enabl
Slide 13: 1. Accelerating strategic high-growth initiatives
1. ACCELERATING STRATEGIC HIGH-GROWTH INITIATIVES Pascal MARTIN, Management Board member, Group Senior VP, Corporate Strategy, Business Portfolio Management and Business Development
Slide 14: Energy in Motion: Accelerating high-growth initiatives
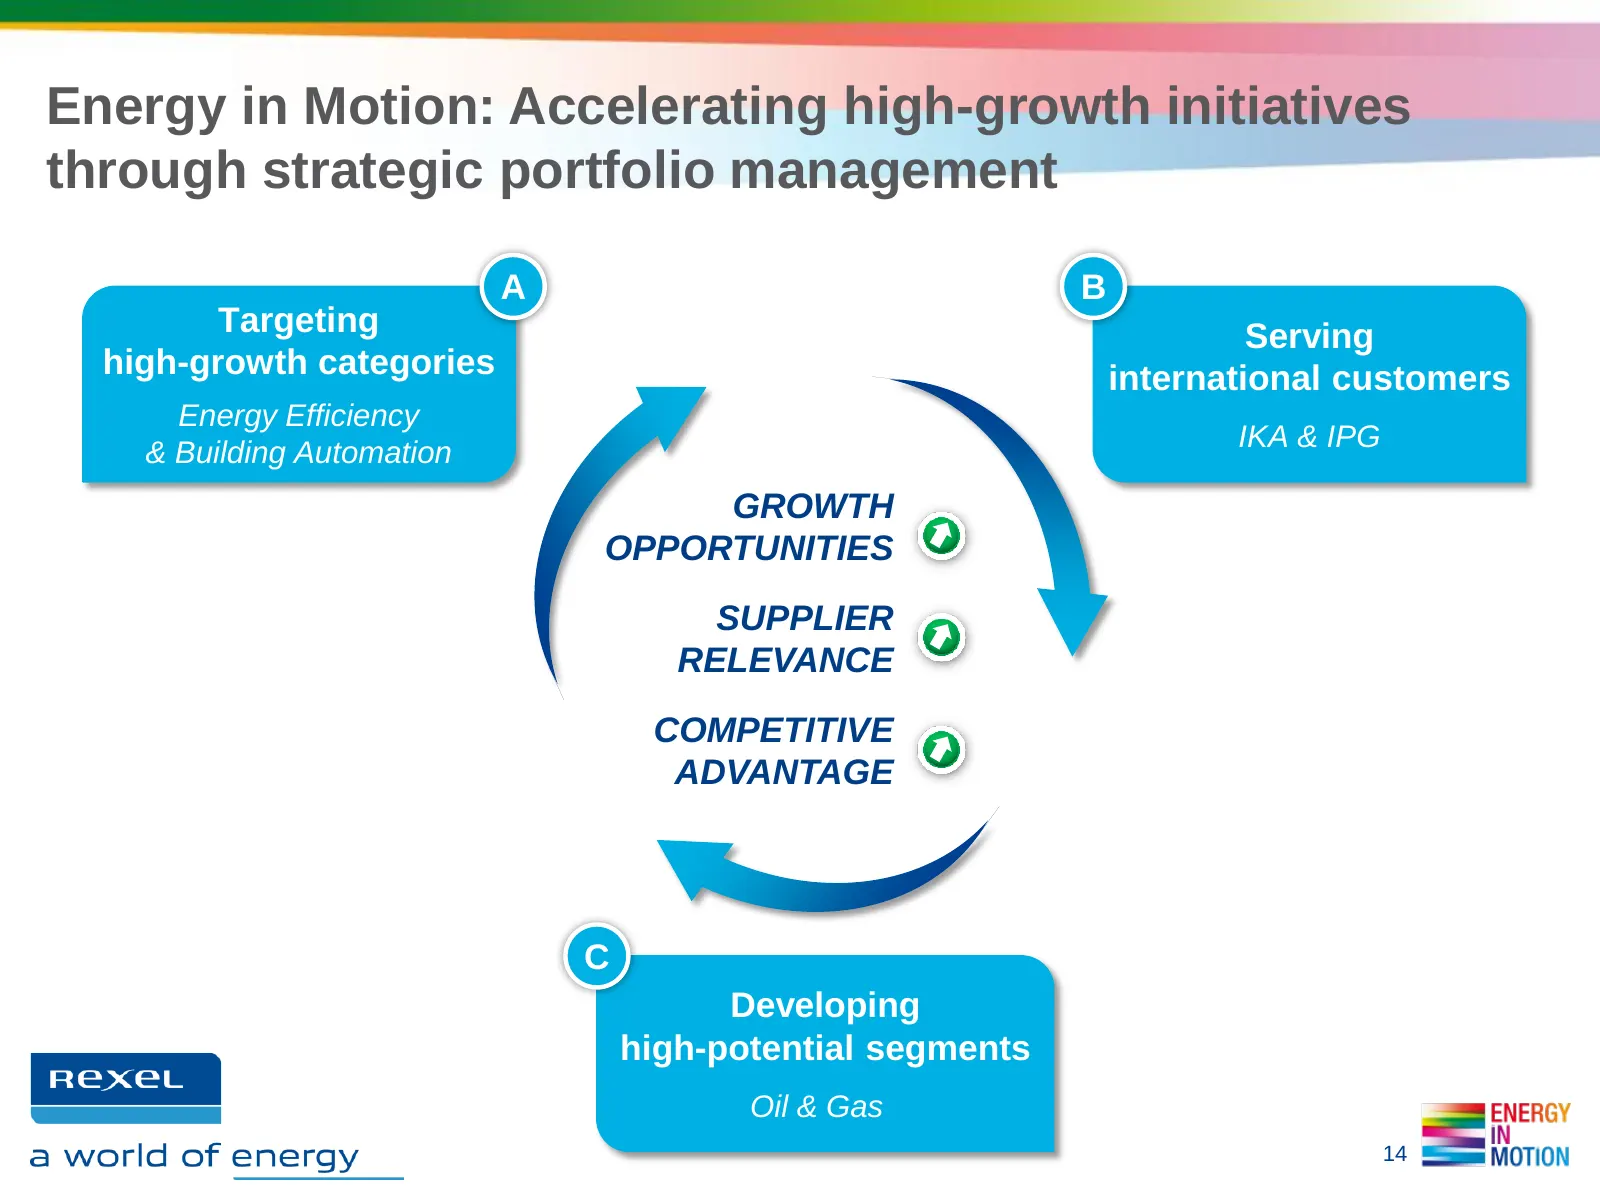
Energy in Motion: Accelerating high-growth initiatives through strategic portfolio management A B Targeting Serving high-growth categories international customers Energy Efficiency IKA & IPG & Building Automation GROWTH OPPORTUNITIES SUPPLIER RELEVANCE COMPETITIVE ADVANTAGE C Developing high-potenti
Slide 15: 1.1 Targeting high-growth categories
1.1. TARGETING HIGH-GROWTH CATEGORIES Energy Efficiency & Building Automation
Slide 16: Energy Efficiency: €620m of sales in 2012
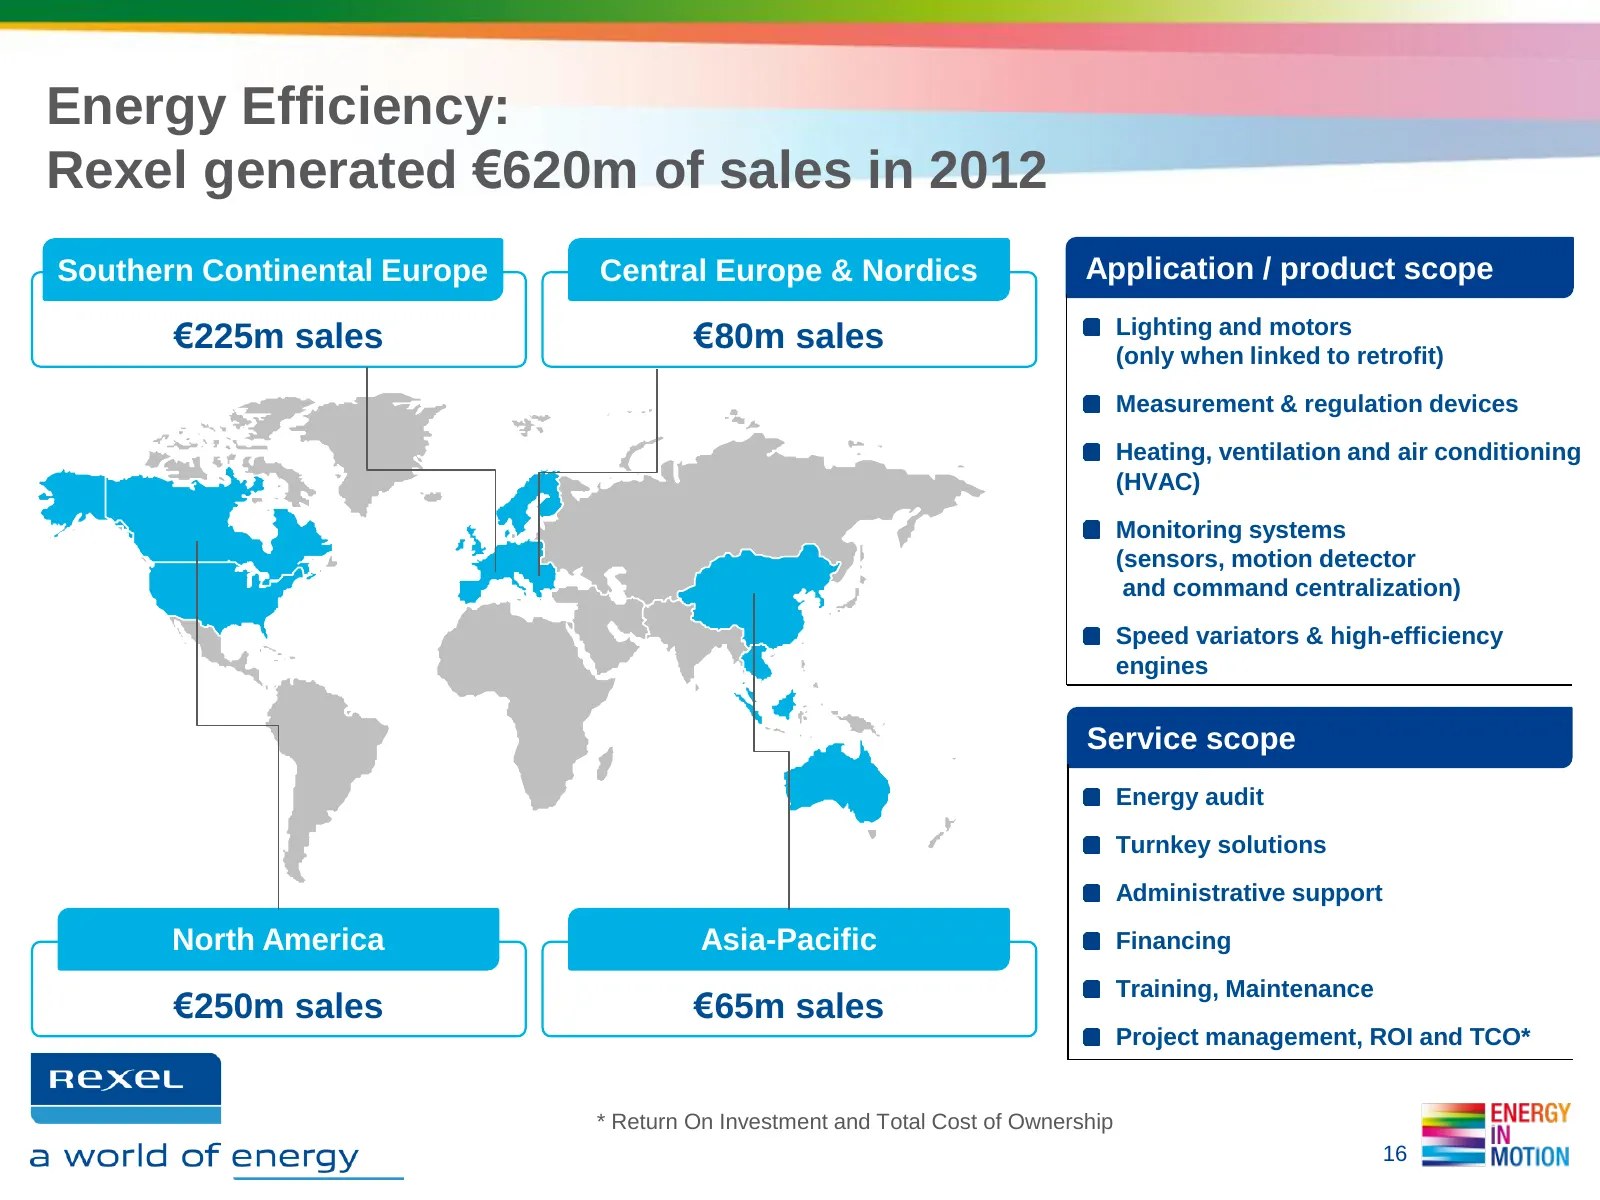
Energy Efficiency: Rexel generated €620m of sales in 2012 Southern Continental Europe Central Europe & Nordics Application / product scope €225m sales €80m sales Lighting and motors (only when linked to retrofit) Measurement & regulation devices Heating, ventilation and air conditioning (HVAC) Monit
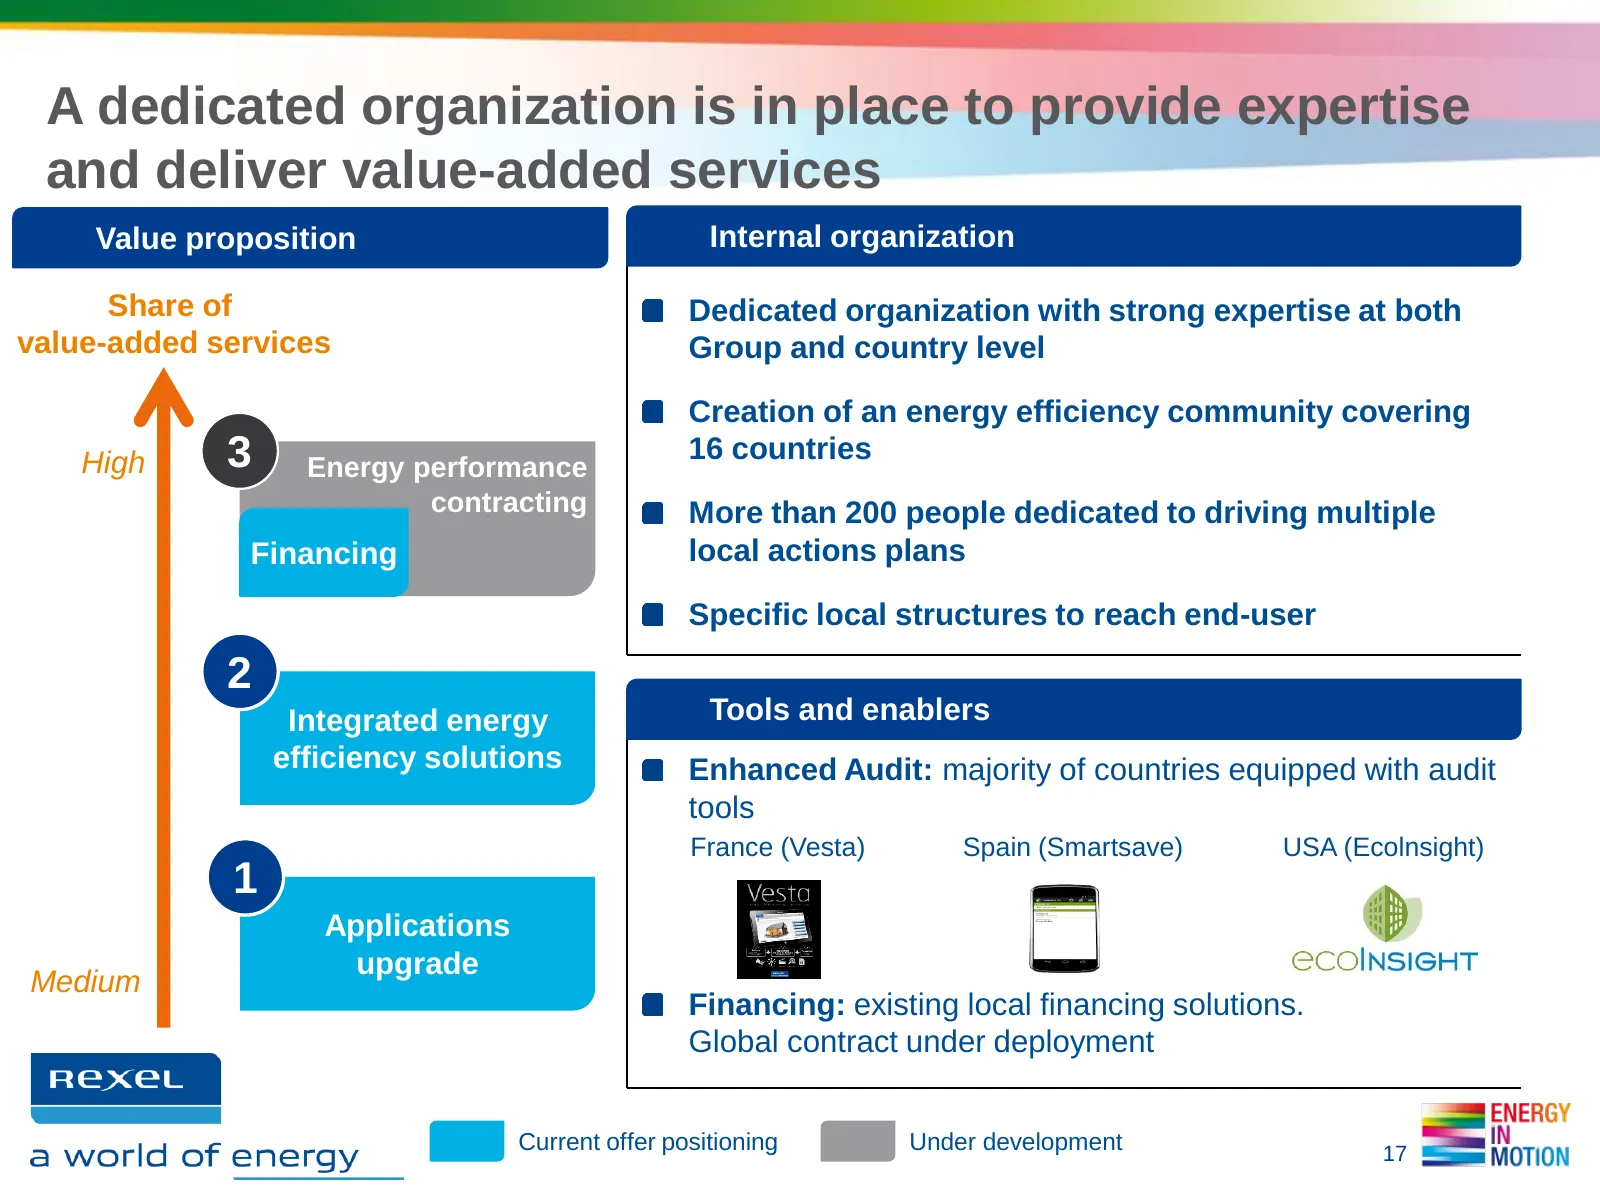
Slide 17: Dedicated organization to deliver value-added services
A dedicated organization is in place to provide expertise and deliver value-added services Value proposition Internal organization Share of Dedicated organization with strong expertise at both value-added services Group and country level Creation of an energy efficiency community covering High 3 Ene
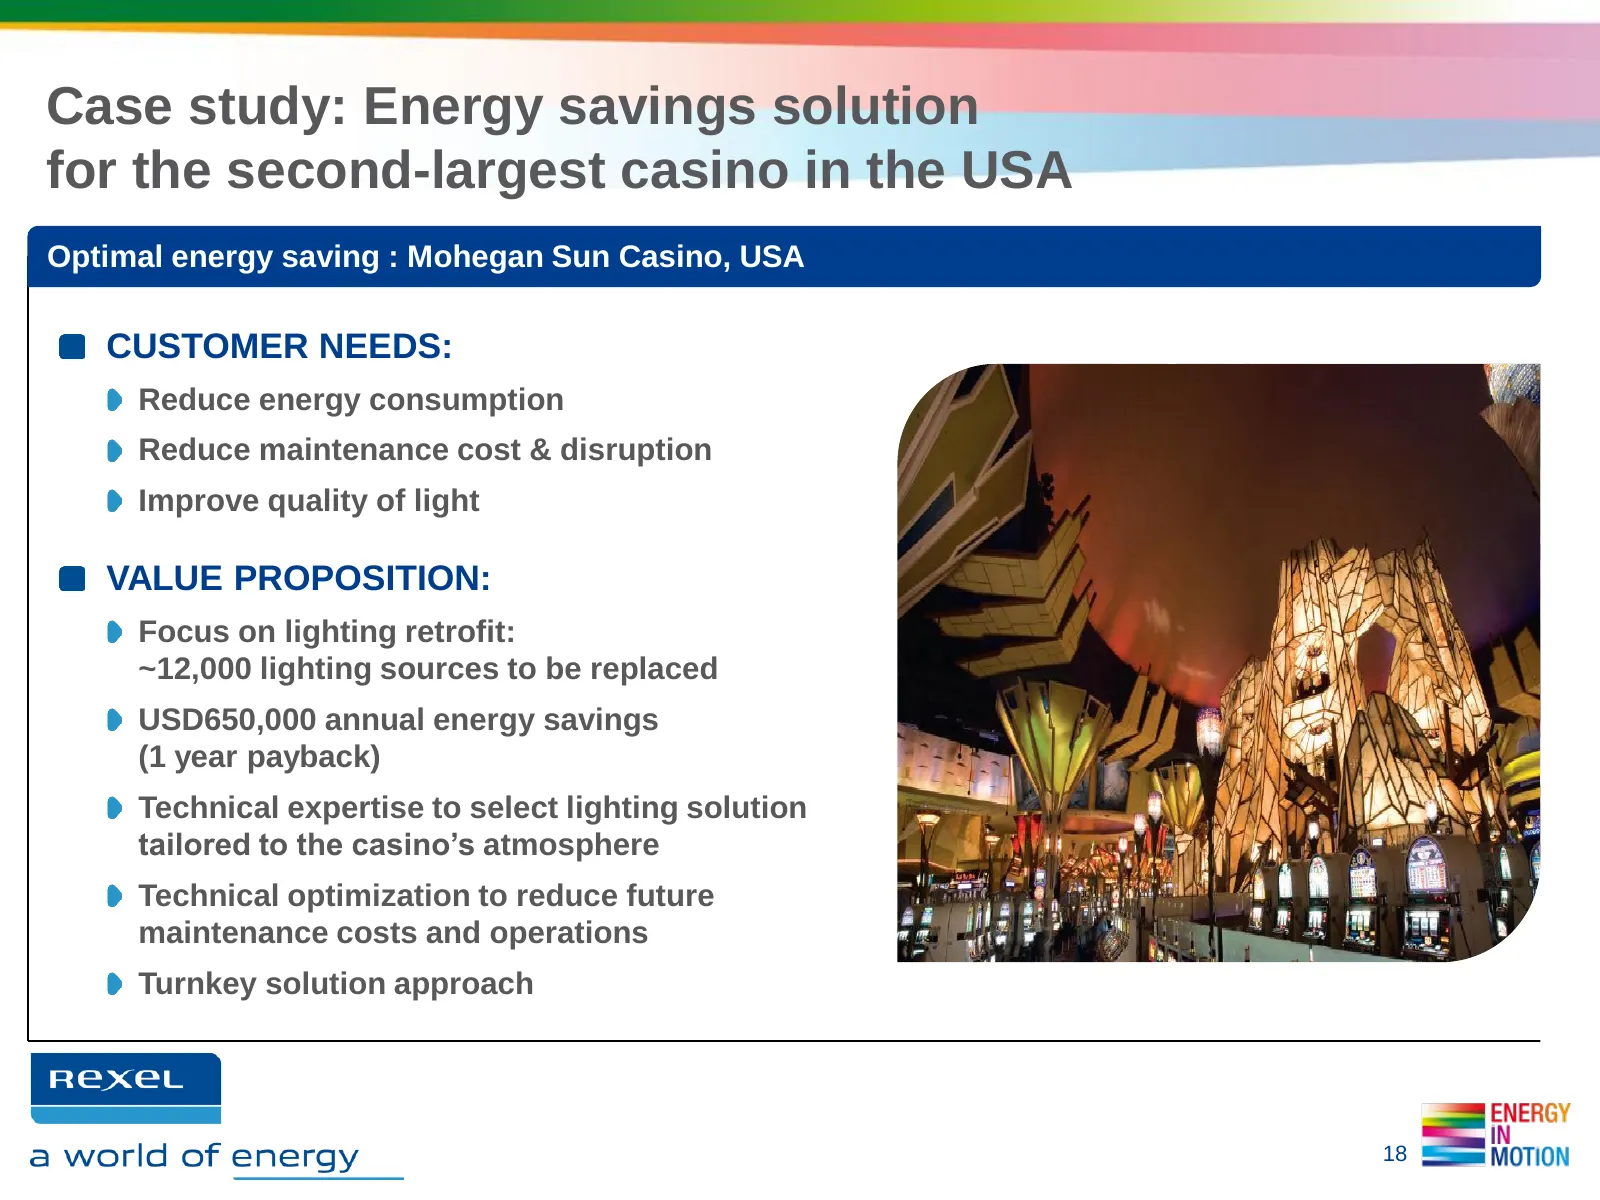
Slide 18: Energy savings solution for second-largest casino in the USA
Case study: Energy savings solution for the second-largest casino in the USA Optimal energy saving : Mohegan Sun Casino, USA CUSTOMER NEEDS: Reduce energy consumption Reduce maintenance cost & disruption Improve quality of light VALUE PROPOSITION: Focus on lighting retrofit: ~12,000 lighting sources
Slide 19: Energy Efficiency: key growth drivers
Energy Efficiency: key growth drivers Highly driven by government regulatory pressure and energy price increases Upgrade our expertise in branches with energy efficiency programs (training, merchandising, etc.) Leverage the know-how of more than 200 people dedicated to the energy efficiency business
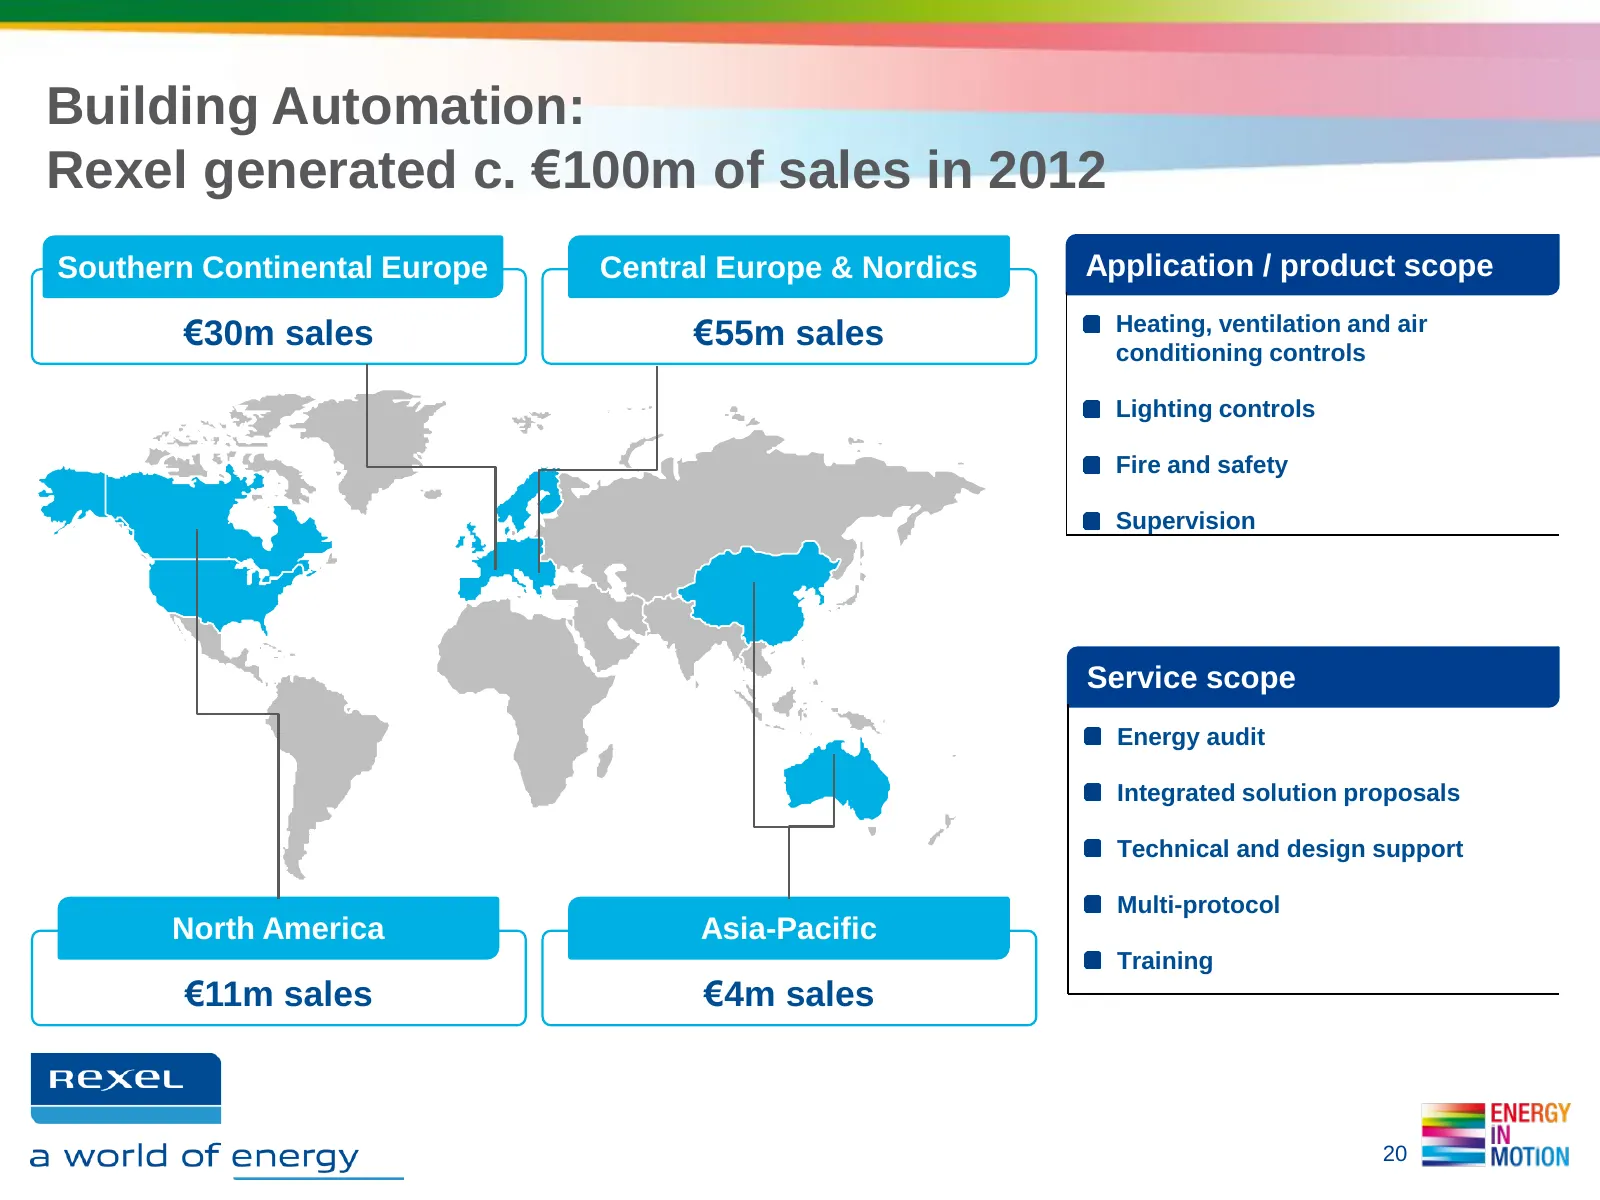
Slide 20: Building Automation: c. €100m of sales in 2012
Building Automation: Rexel generated c. €100m of sales in 2012 Southern Continental Europe Central Europe & Nordics Application / product scope €30m sales €55m sales Heating, ventilation and air conditioning controls Lighting controls Fire and safety Supervision Service scope Energy audit Integrated
Slide 21: Organization in place to ensure effective execution
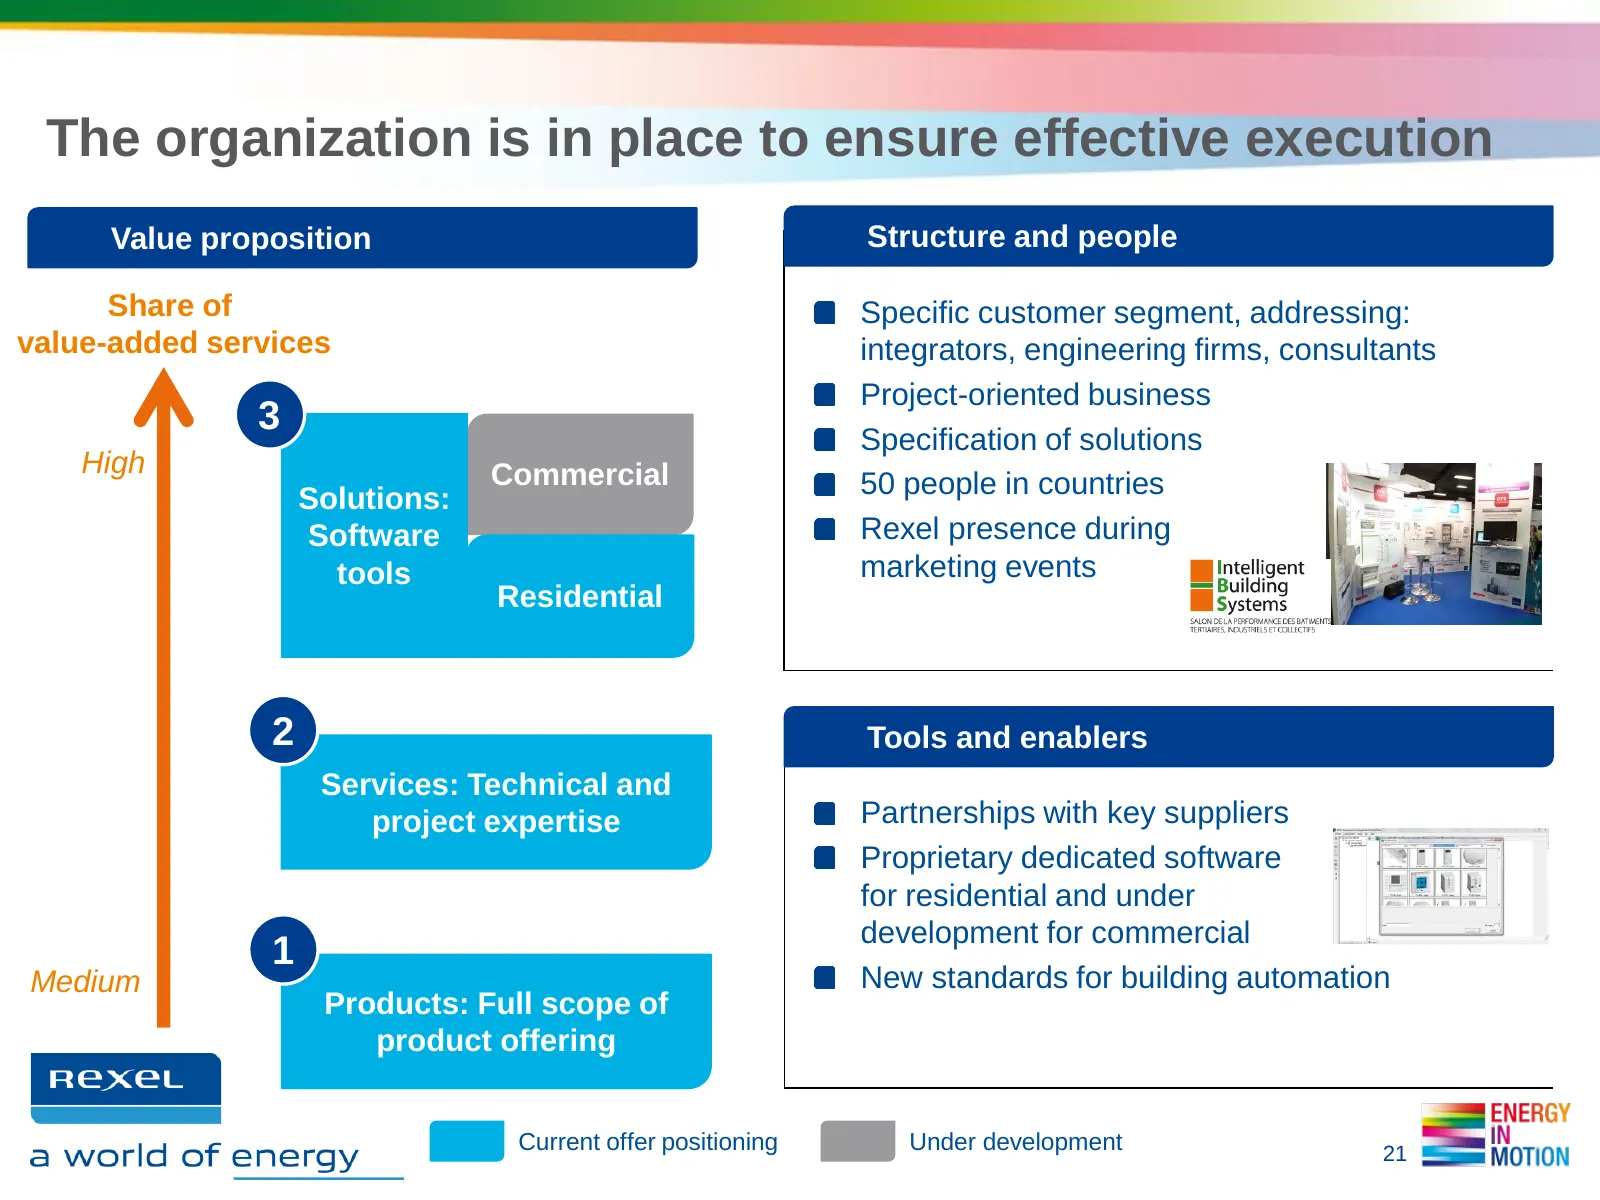
The organization is in place to ensure effective execution Value proposition Structure and people Share of Specific customer segment, addressing: value-added services integrators, engineering firms, consultants Project-oriented business 3 Specification of solutions High Commercial Solutions: 50 peop
Slide 22: Success story in commercial building
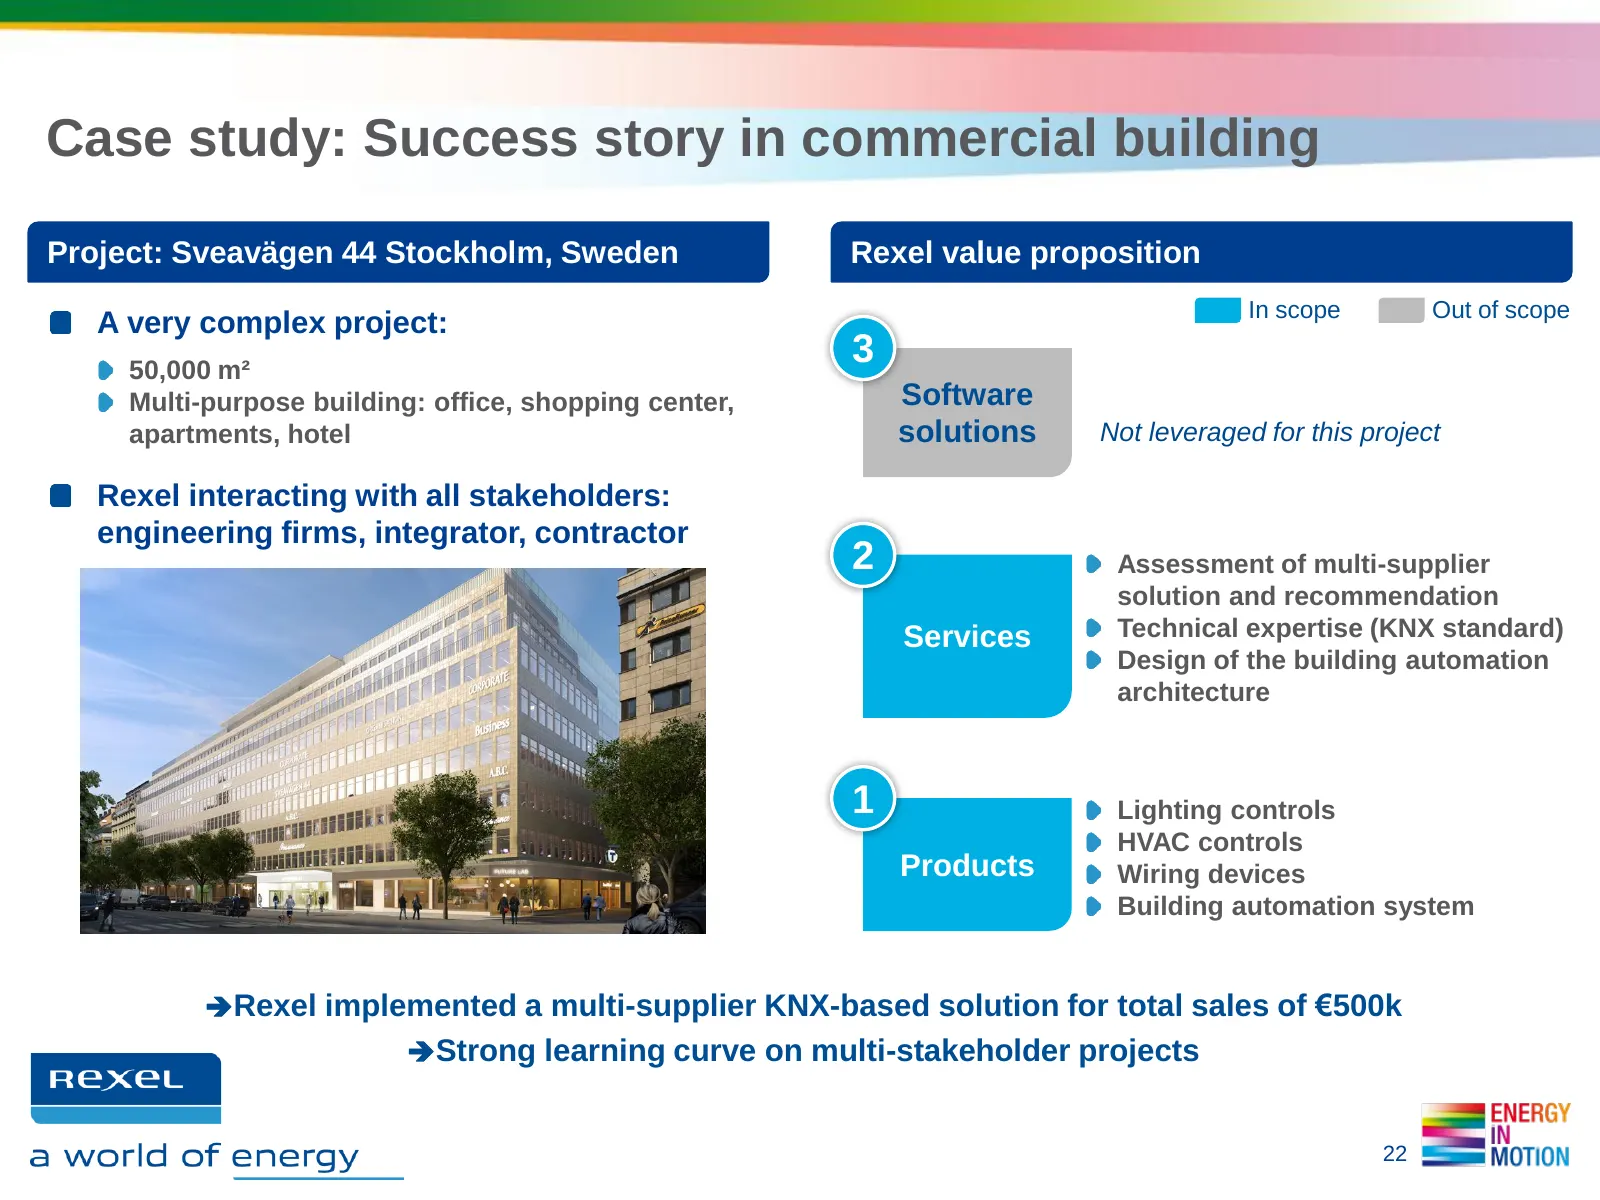
Case study: Success story in commercial building Project: Sveavägen 44 Stockholm, Sweden Rexel value proposition In scope Out of scope A very complex project: 50,000 m² 3 Multi-purpose building: office, shopping center, Software apartments, hotel solutions Not leveraged for this project Rexel intera
Slide 23: Building automation: Key growth drivers
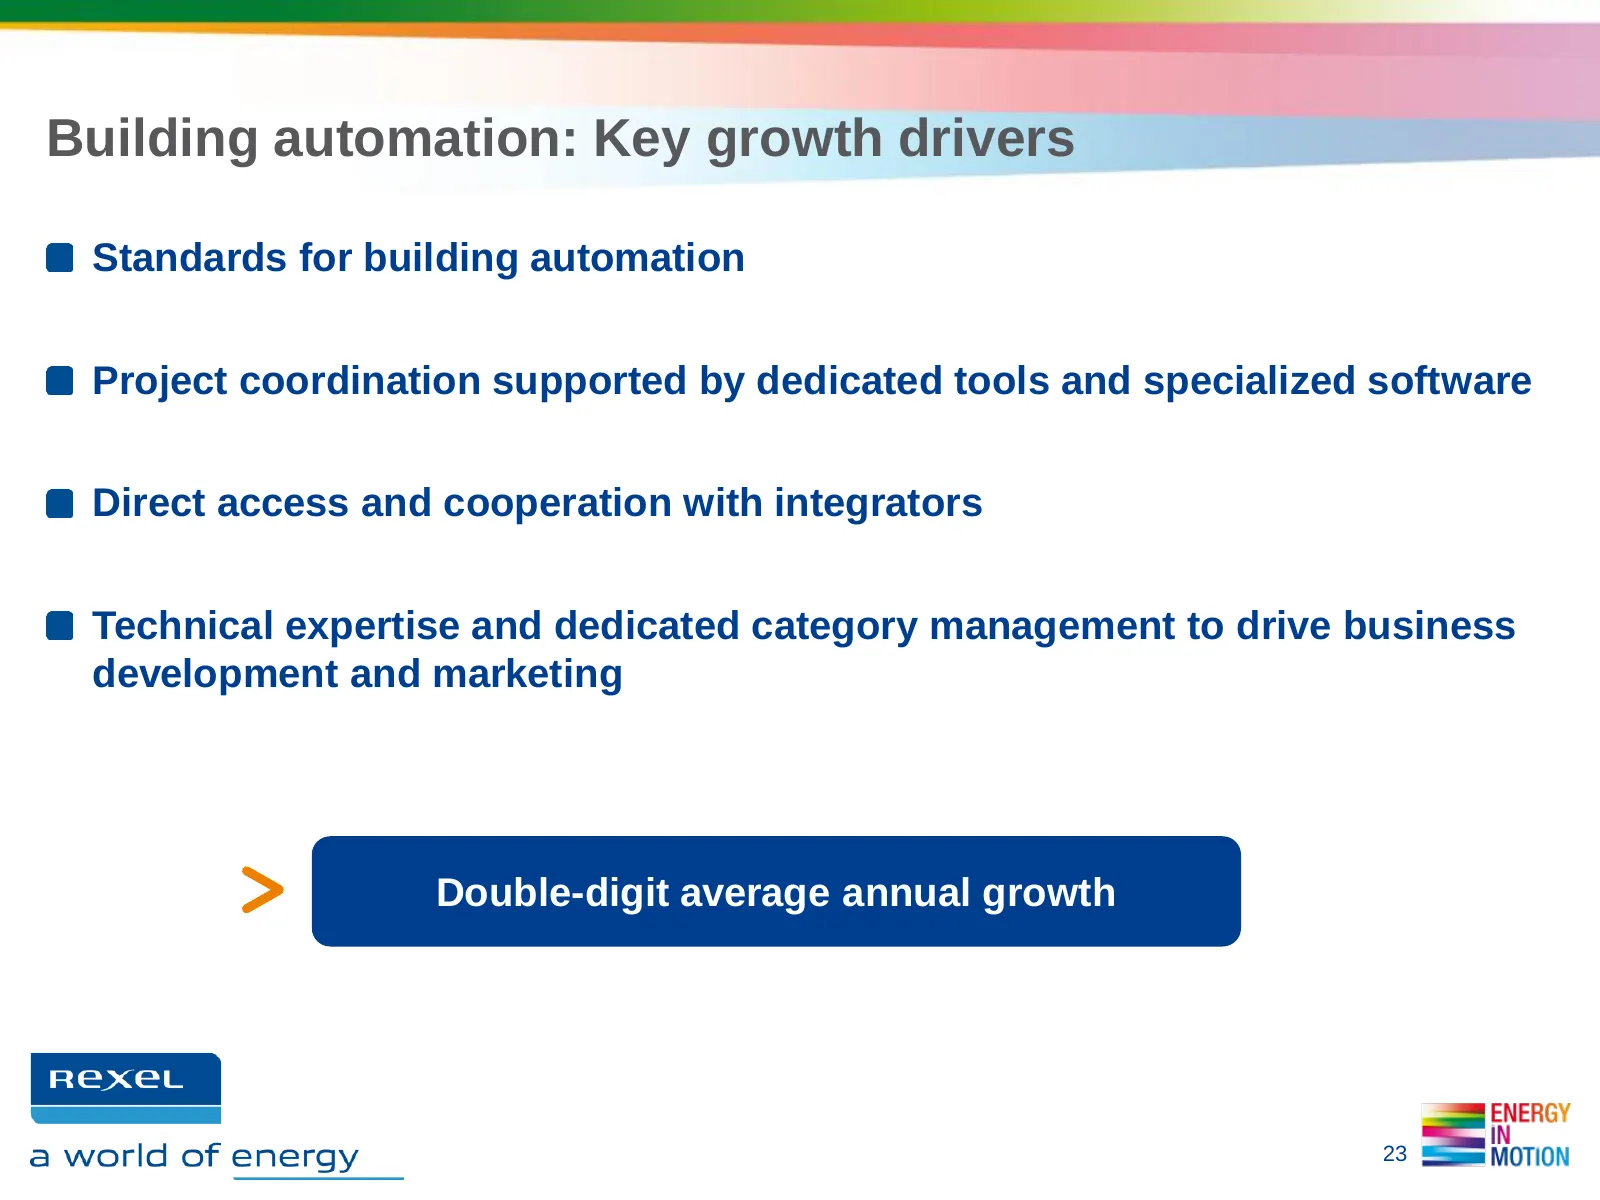
Building automation: Key growth drivers Standards for building automation Project coordination supported by dedicated tools and specialized software Direct access and cooperation with integrators Technical expertise and dedicated category management to drive business development and marketing Double
Slide 24: 1.2 Serving international customers
1.2. SERVING INTERNATIONAL CUSTOMERS International Key Accounts (IKA) & International Project Group (IPG)
Slide 25: International Key Accounts generated €580m in 2012
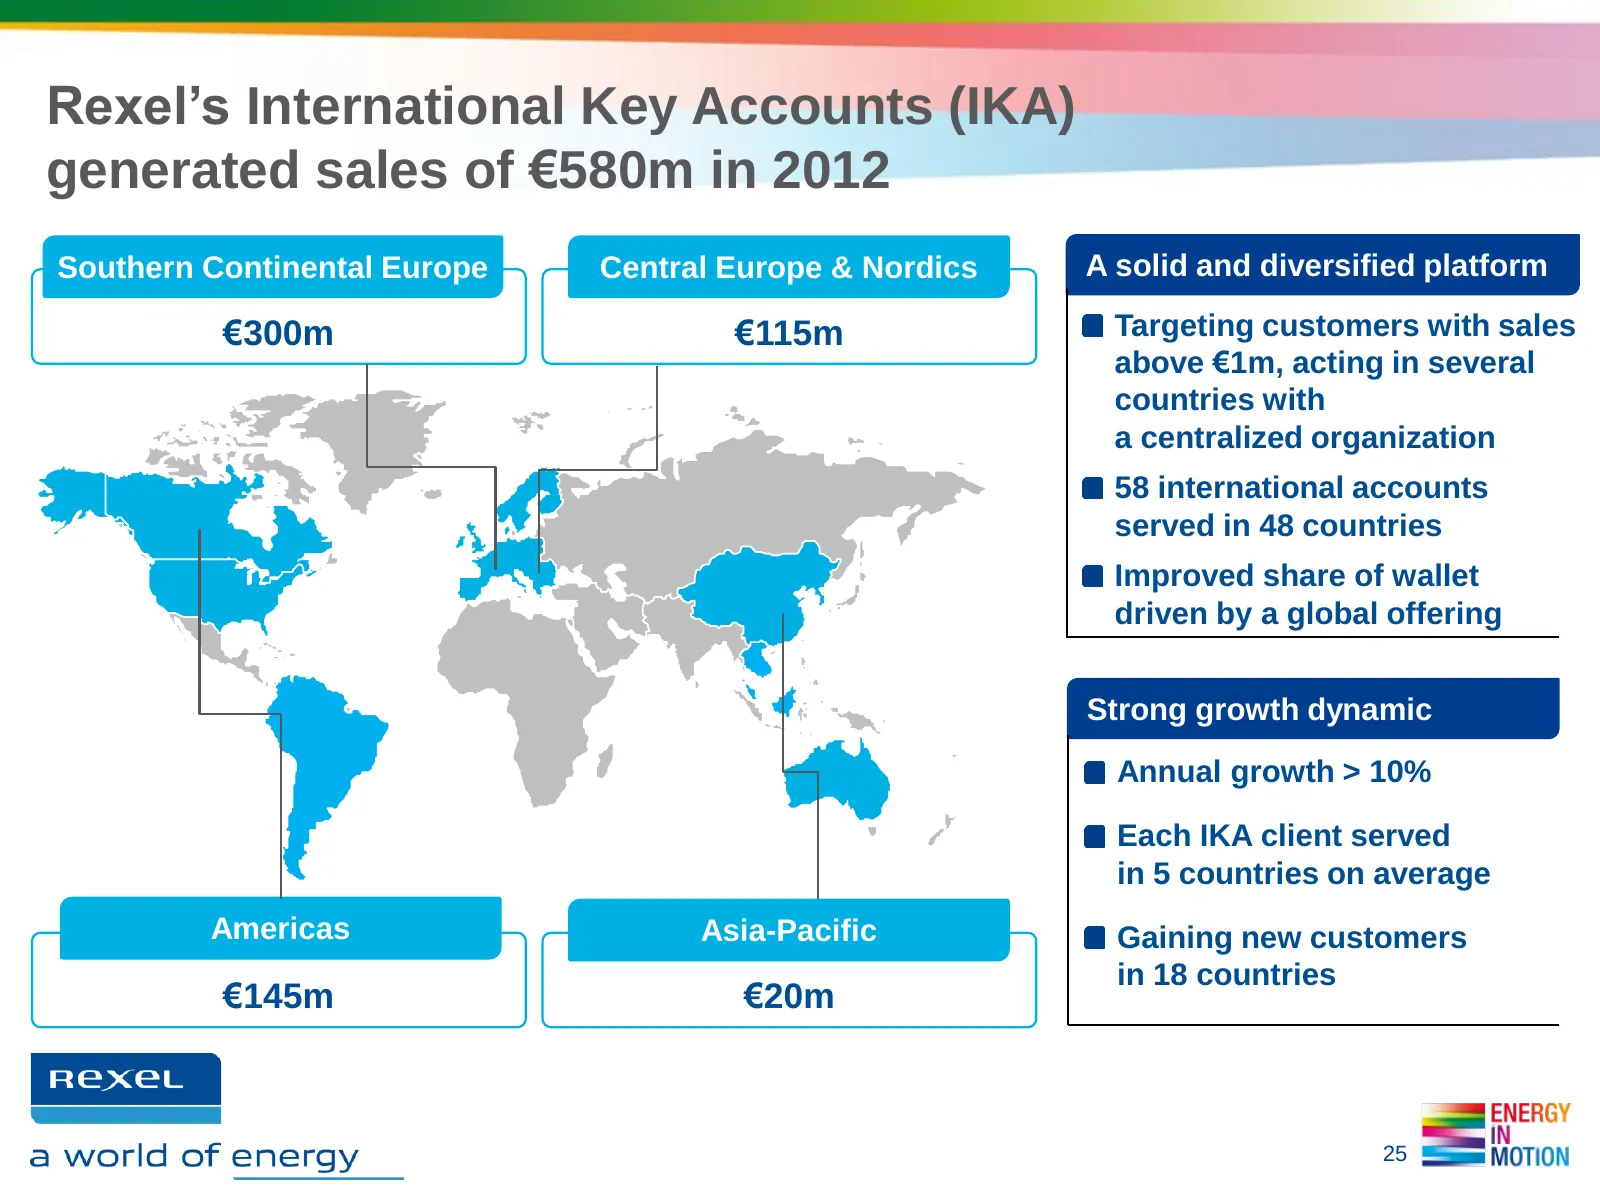
Rexel’s International Key Accounts (IKA) generated sales of €580m in 2012 Southern Continental Europe Central Europe & Nordics A solid and diversified platform €300m €115m Targeting customers with sales above €1m, acting in several countries with a centralized organization 58 international accounts
Slide 26: IKA: global power and local presence
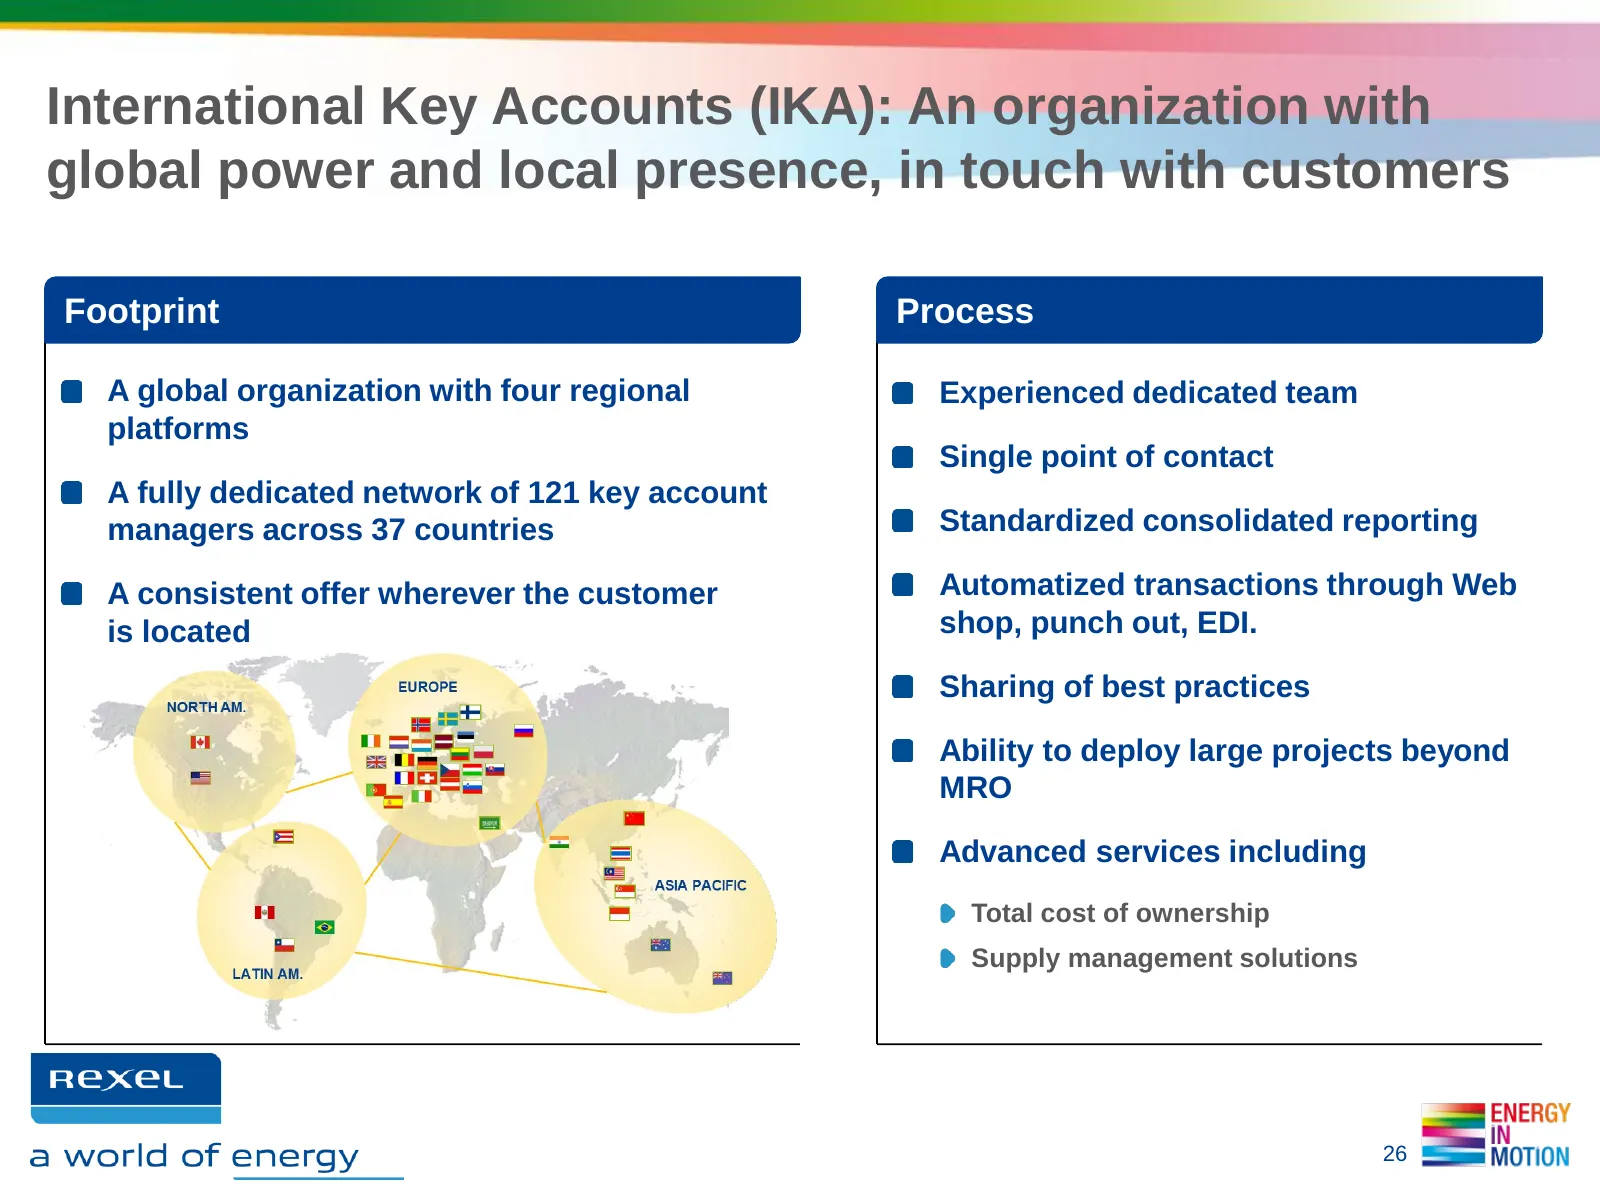
International Key Accounts (IKA): An organization with global power and local presence, in touch with customers Footprint Process A global organization with four regional Experienced dedicated team platforms Single point of contact A fully dedicated network of 121 key account managers across 37 coun
Slide 27: IKA at work across Europe
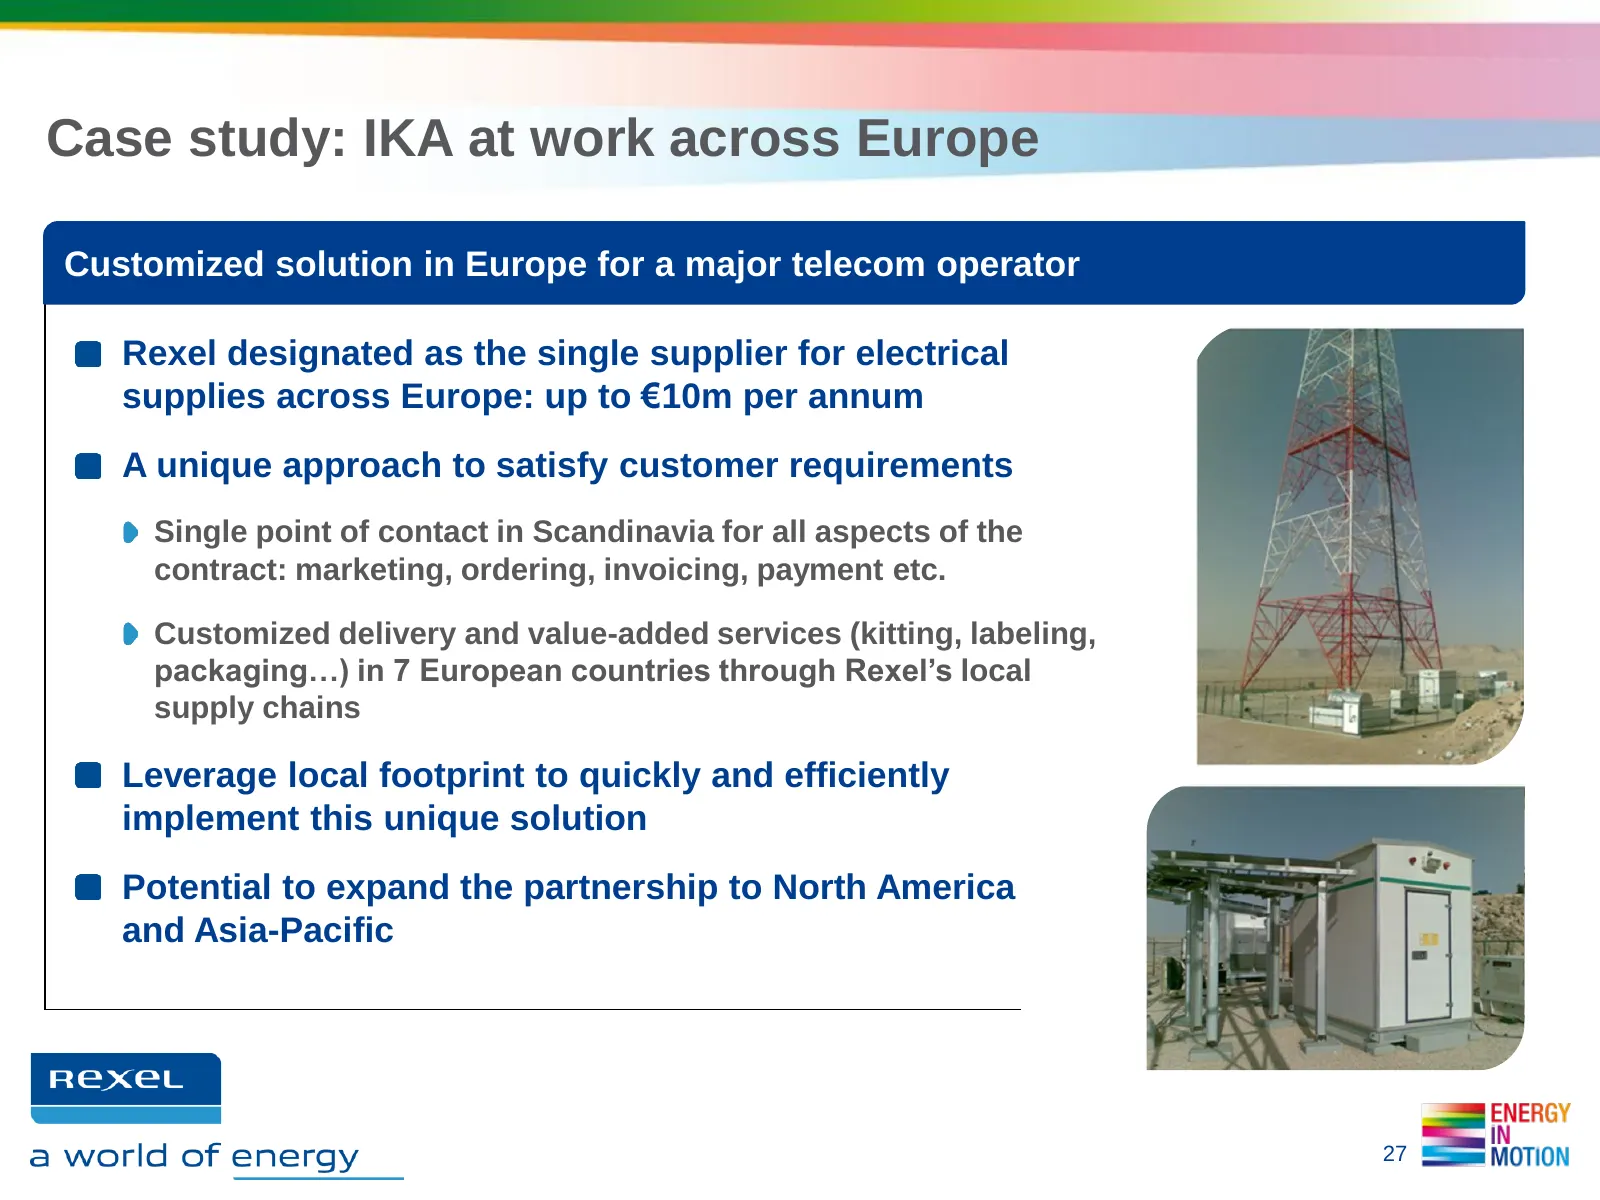
Case study: IKA at work across Europe Customized solution in Europe for a major telecom operator Rexel designated as the single supplier for electrical supplies across Europe: up to €10m per annum A unique approach to satisfy customer requirements Single point of contact in Scandinavia for all aspec
Slide 28: IKA: Key growth drivers
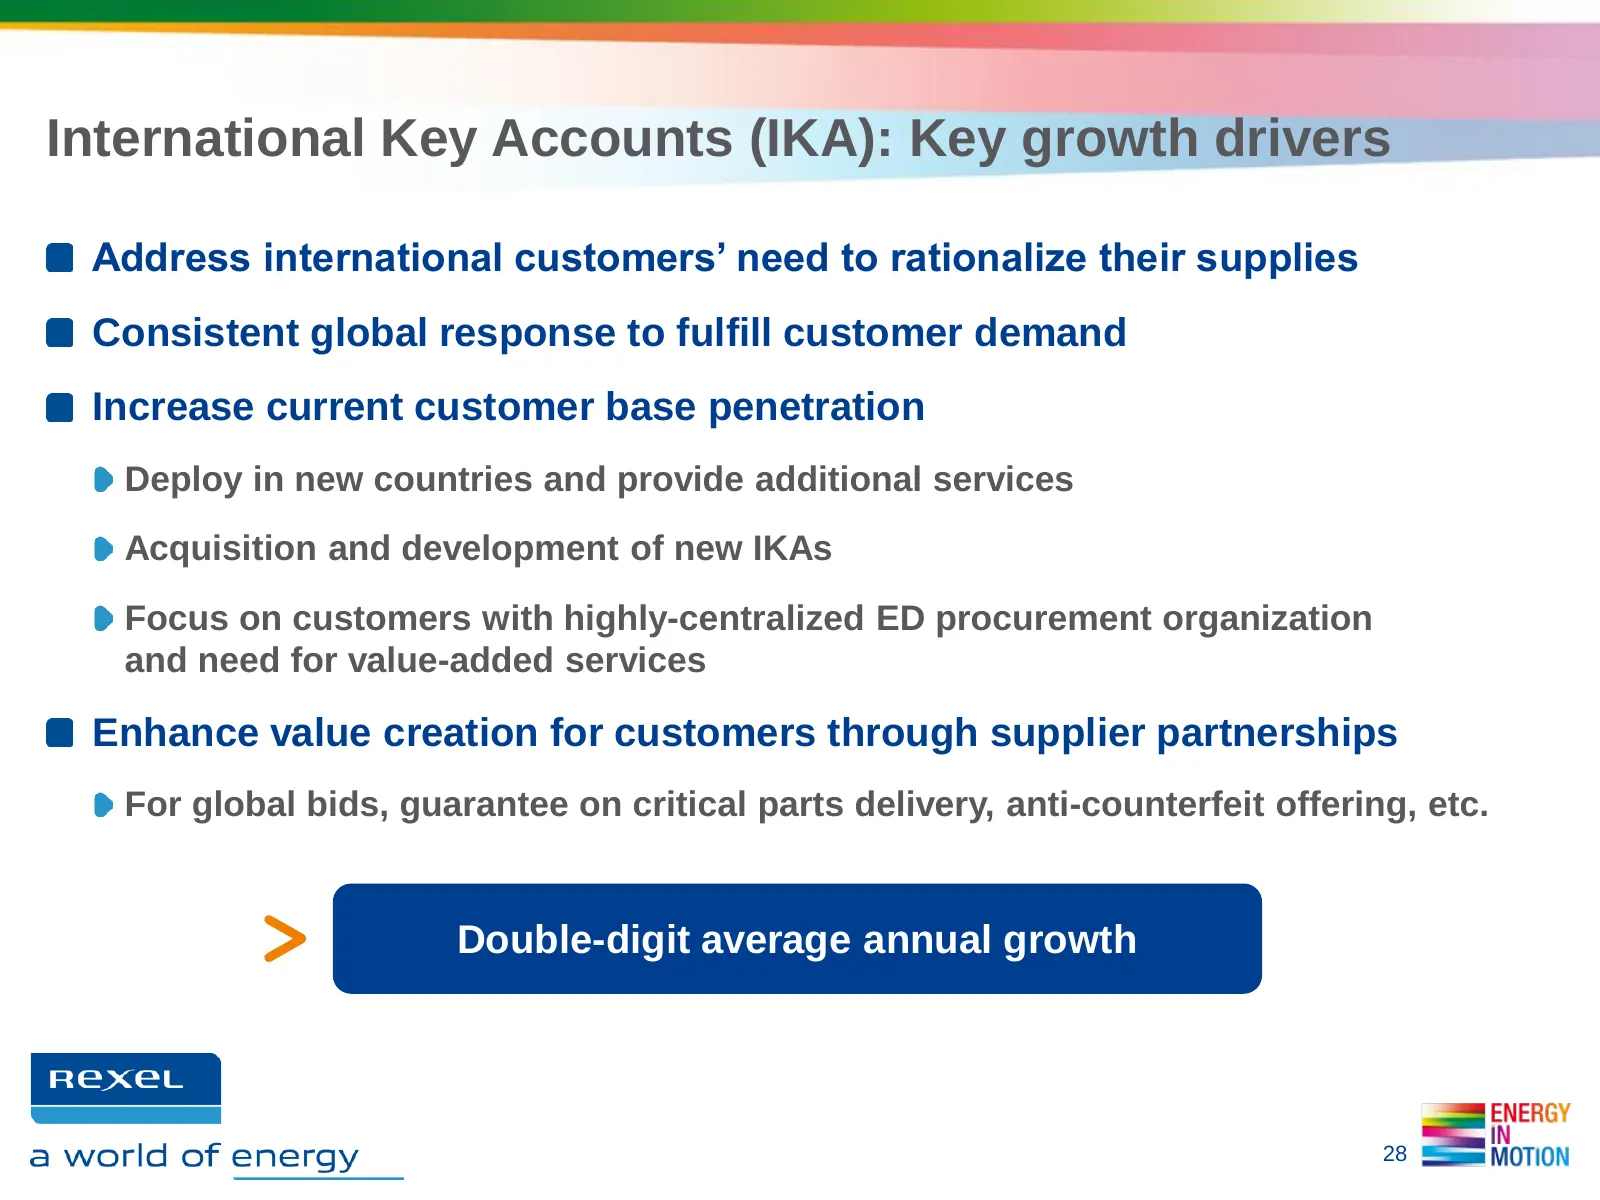
International Key Accounts (IKA): Key growth drivers Address international customers’ need to rationalize their supplies Consistent global response to fulfill customer demand Increase current customer base penetration Deploy in new countries and provide additional services Acquisition and developmen
Slide 29: International Projects Group generated €77m in 2012
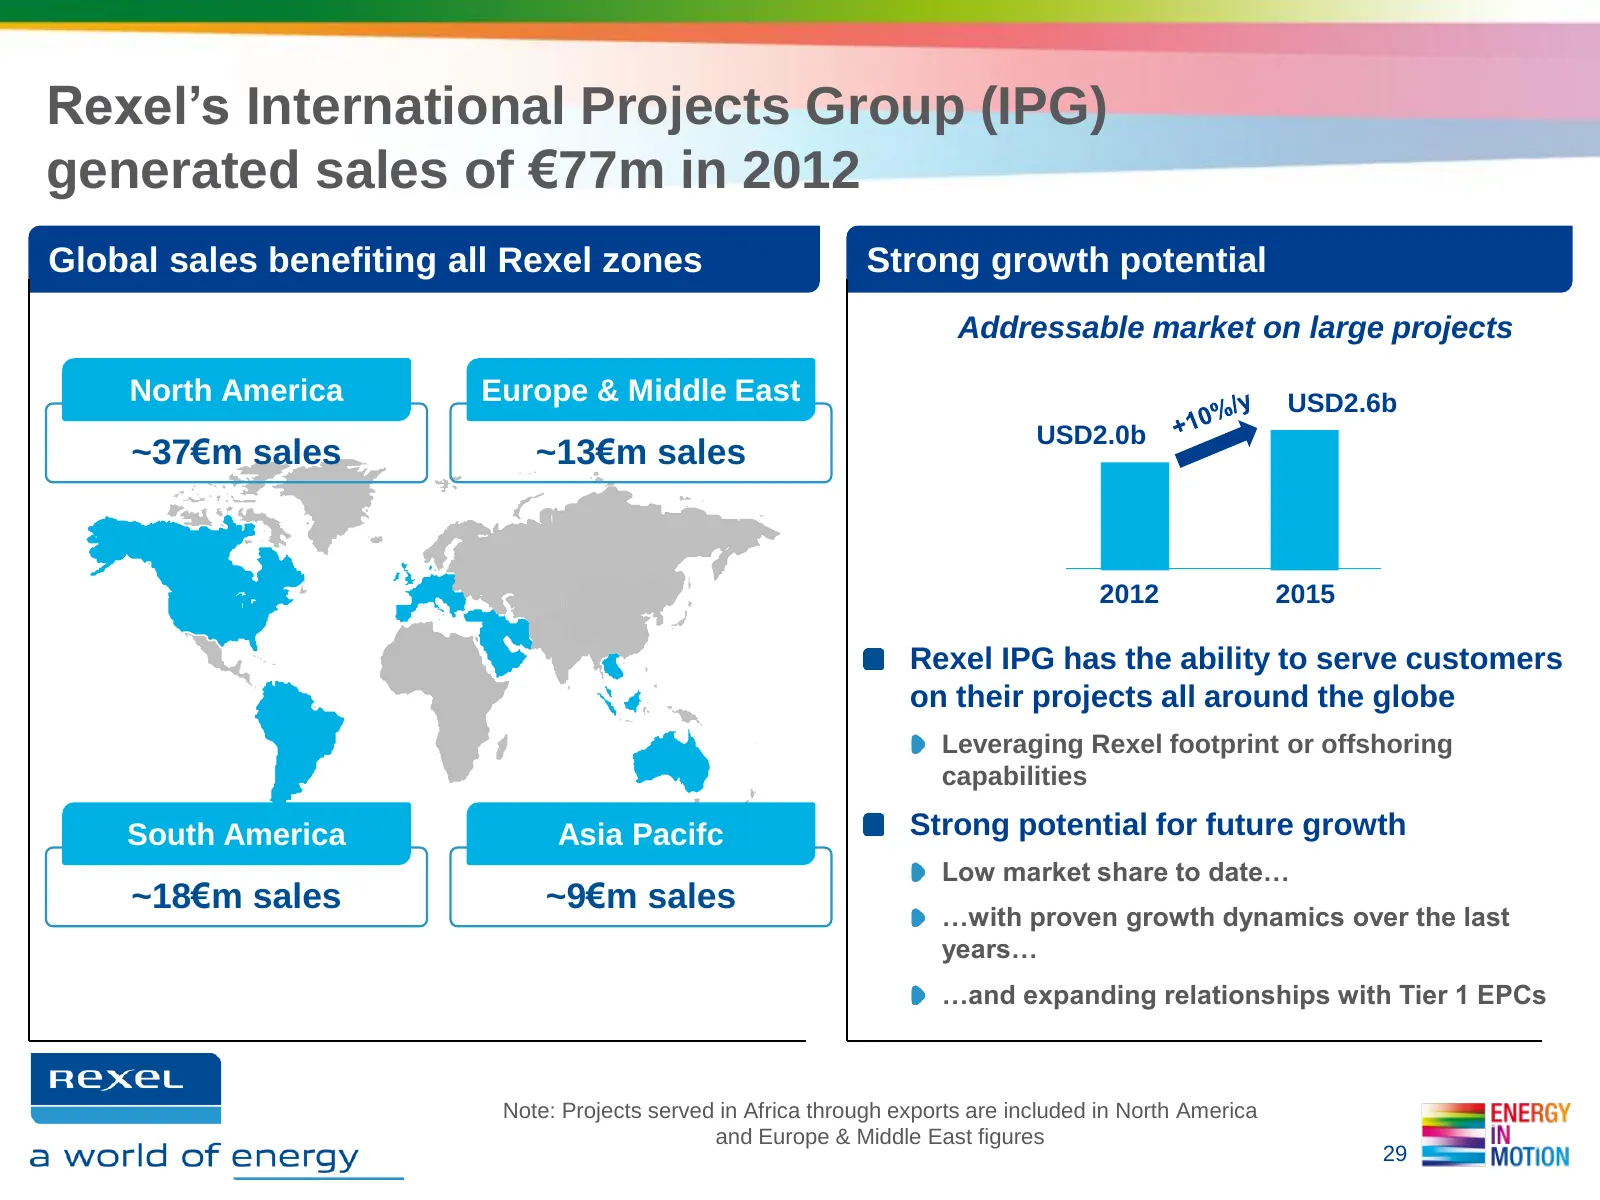
Rexel’s International Projects Group (IPG) generated sales of €77m in 2012 Global sales benefiting all Rexel zones Strong growth potential Addressable market on large projects North America Europe & Middle East USD2.6b USD2.0b ~37€m sales ~13€m sales 2012 2015 Rexel IPG has the ability to serve cust
Slide 30: IPG: strategic partner for major contractors and industrials
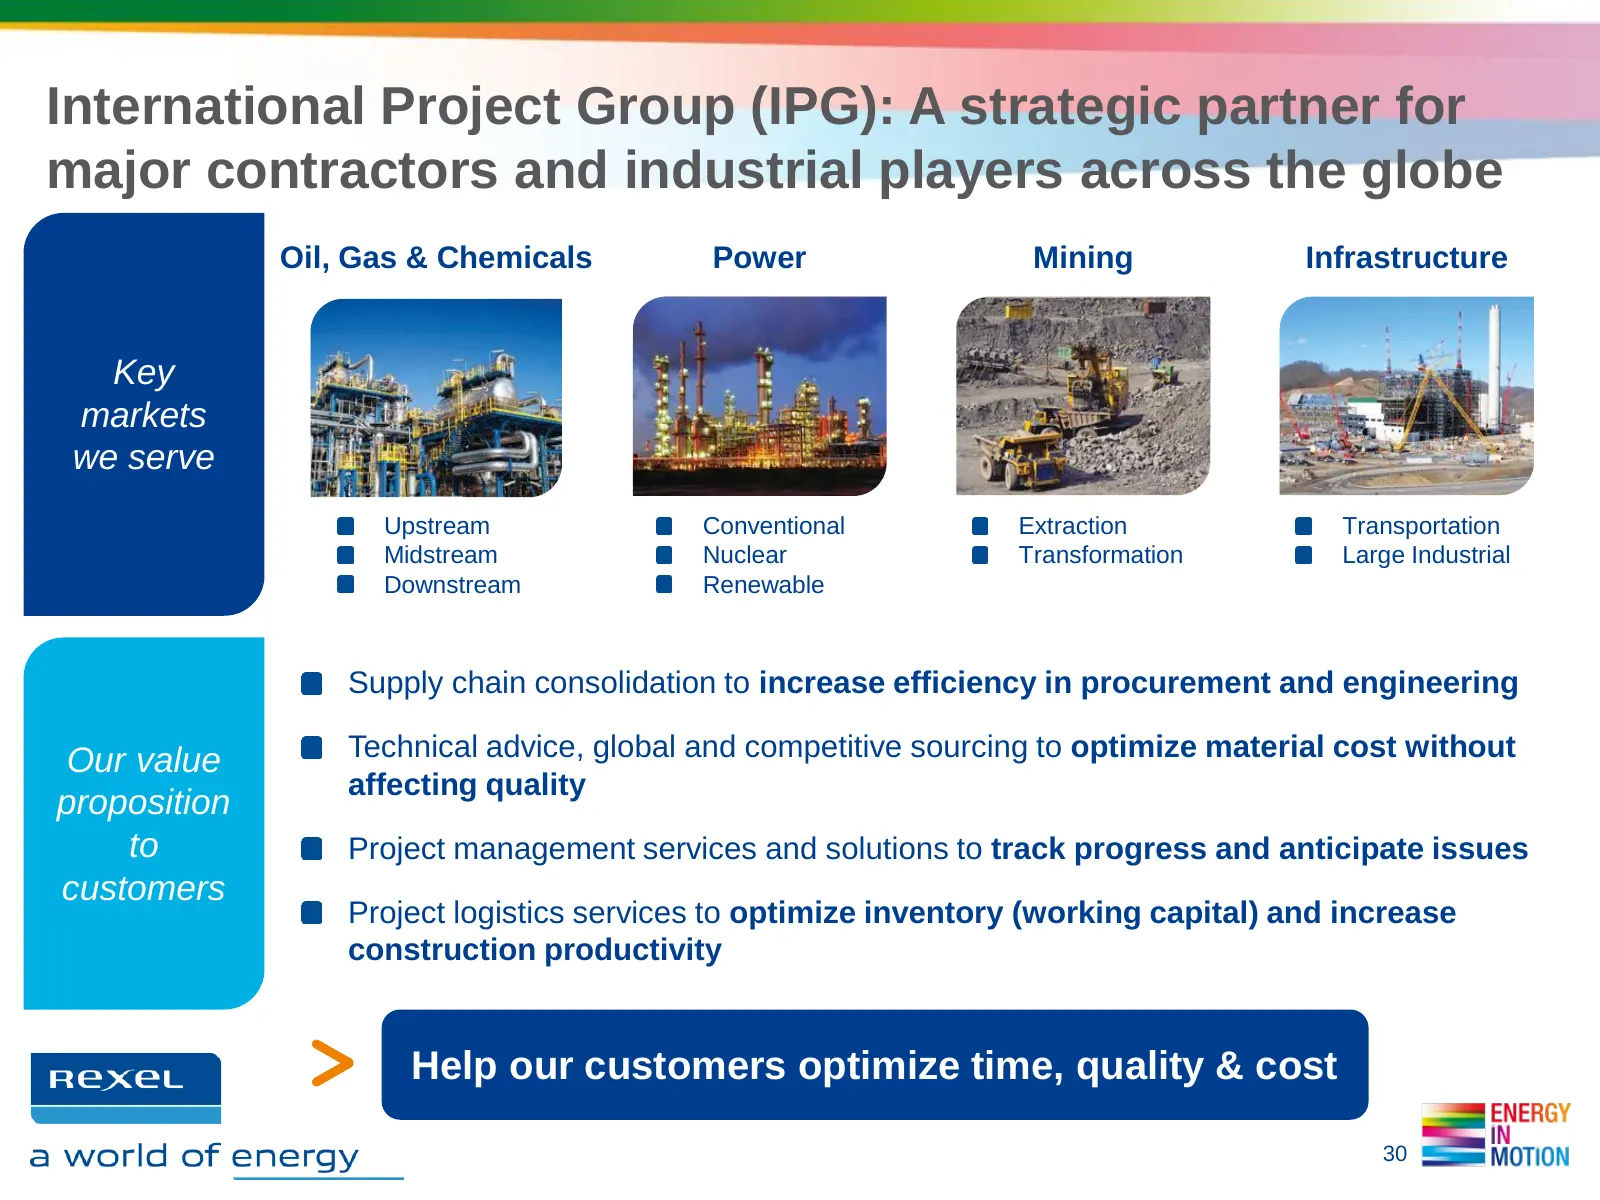
International Project Group (IPG): A strategic partner for major contractors and industrial players across the globe Oil, Gas & Chemicals Power Mining Infrastructure Key markets we serve Upstream Conventional Extraction Transportation Midstream Nuclear Transformation Large Industrial Downstream Rene
Slide 31: Integrated approach to contract negotiation and project execution
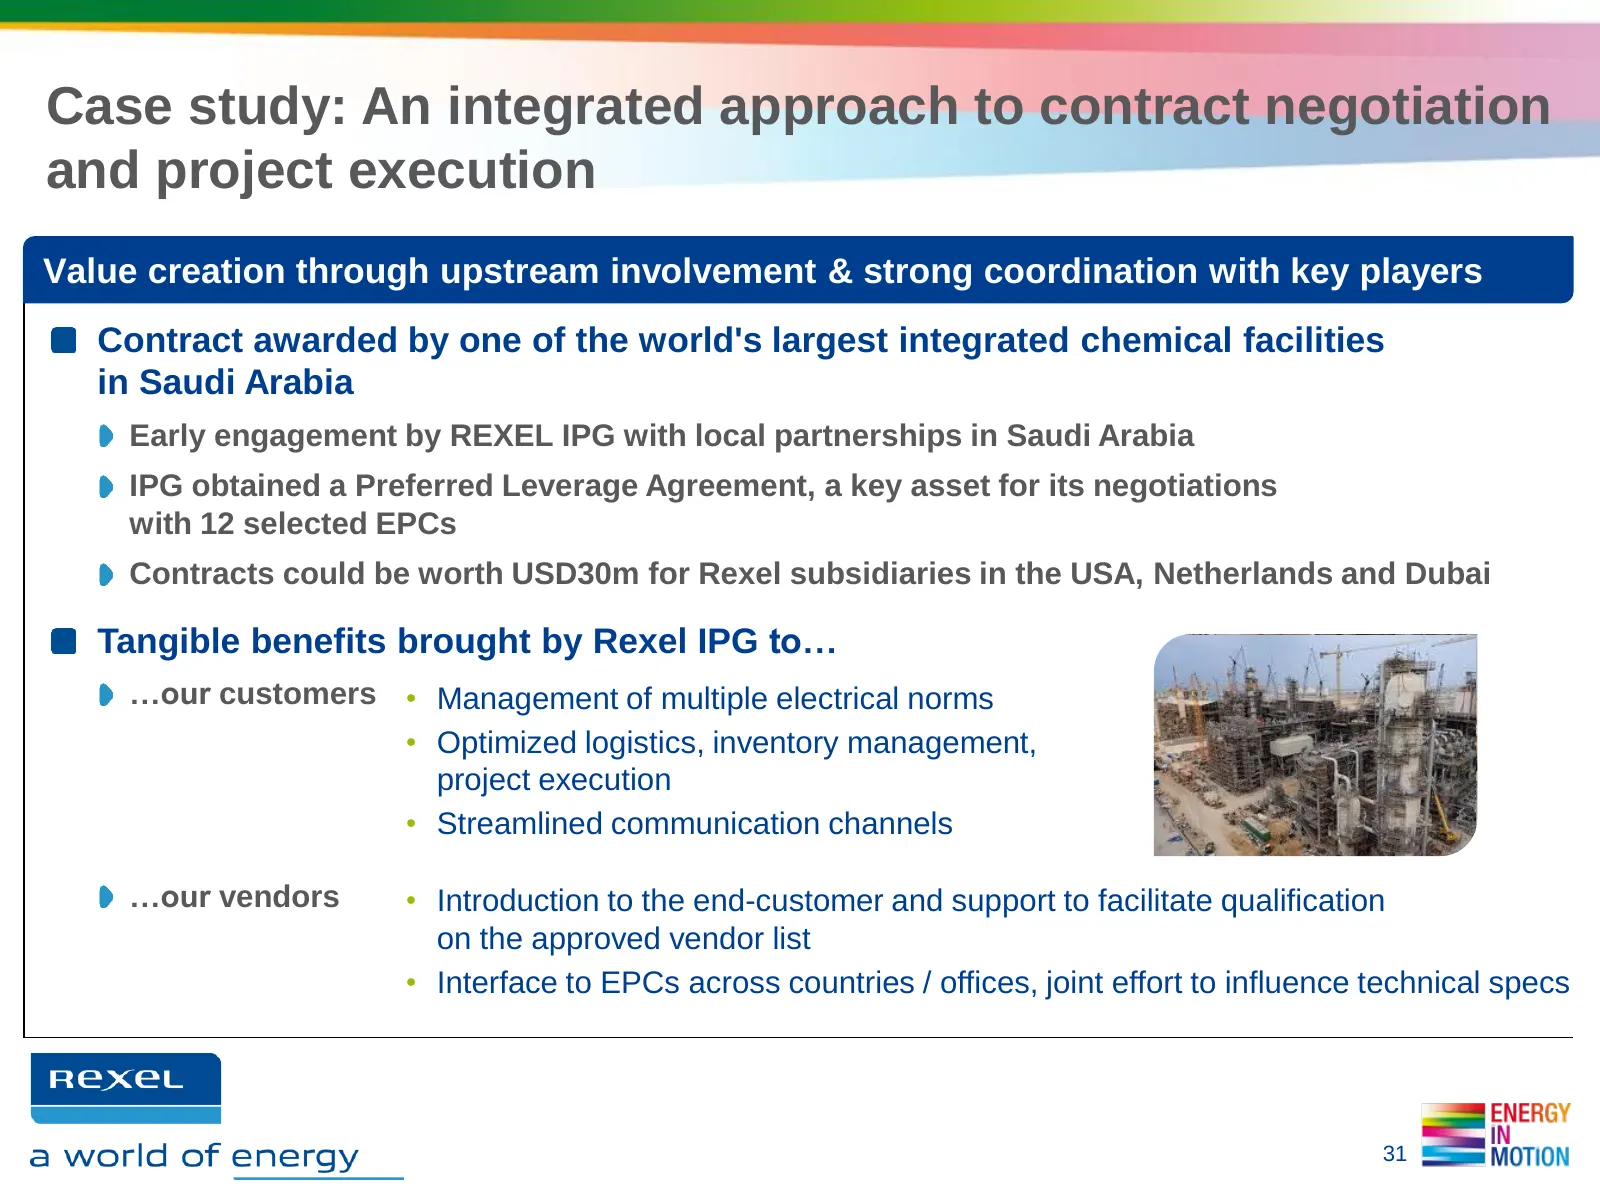
Case study: An integrated approach to contract negotiation and project execution Value creation through upstream involvement & strong coordination with key players Contract awarded by one of the world's largest integrated chemical facilities in Saudi Arabia Early engagement by REXEL IPG with local p
Slide 32: IPG: Key growth drivers
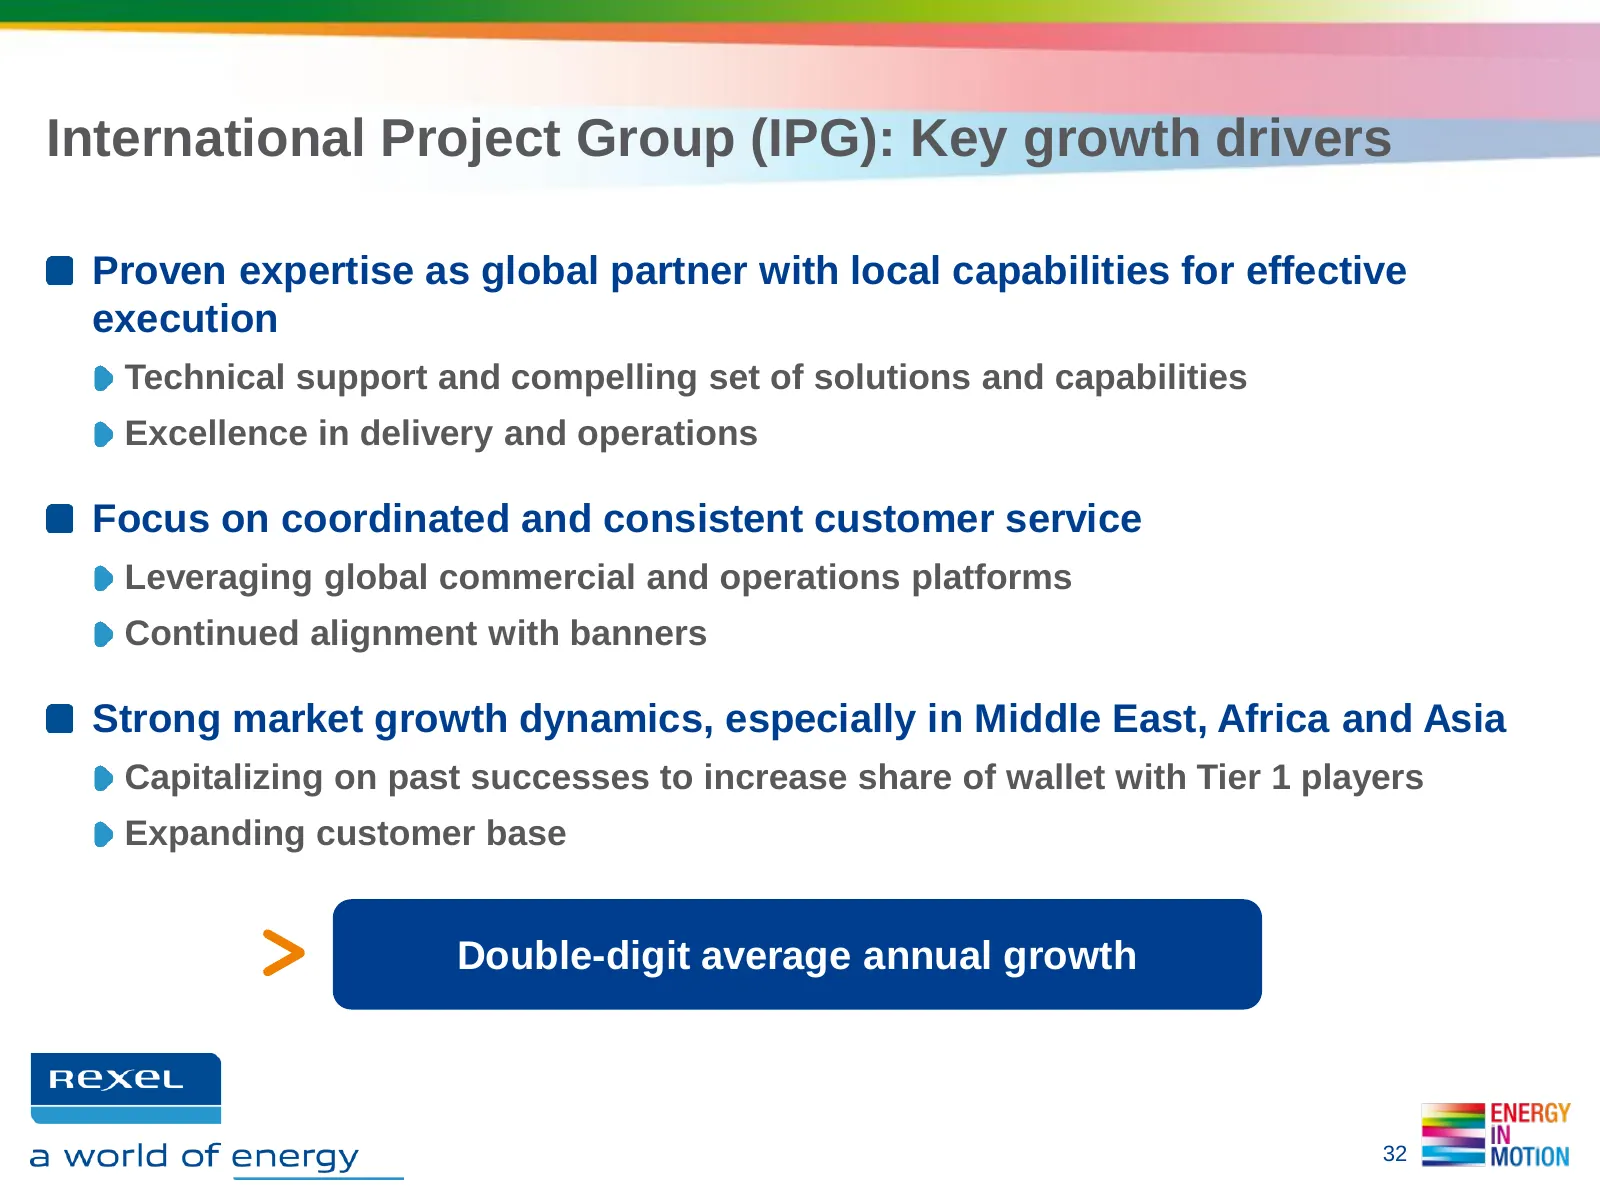
International Project Group (IPG): Key growth drivers Proven expertise as global partner with local capabilities for effective execution Technical support and compelling set of solutions and capabilities Excellence in delivery and operations Focus on coordinated and consistent customer service Lever
Slide 33: 1.3 Developing high-potential segments: Oil & Gas
1.3. DEVELOPING HIGH-POTENTIAL SEGMENTS Oil & Gas
Slide 34: Oil & Gas: €390m of sales in 2012
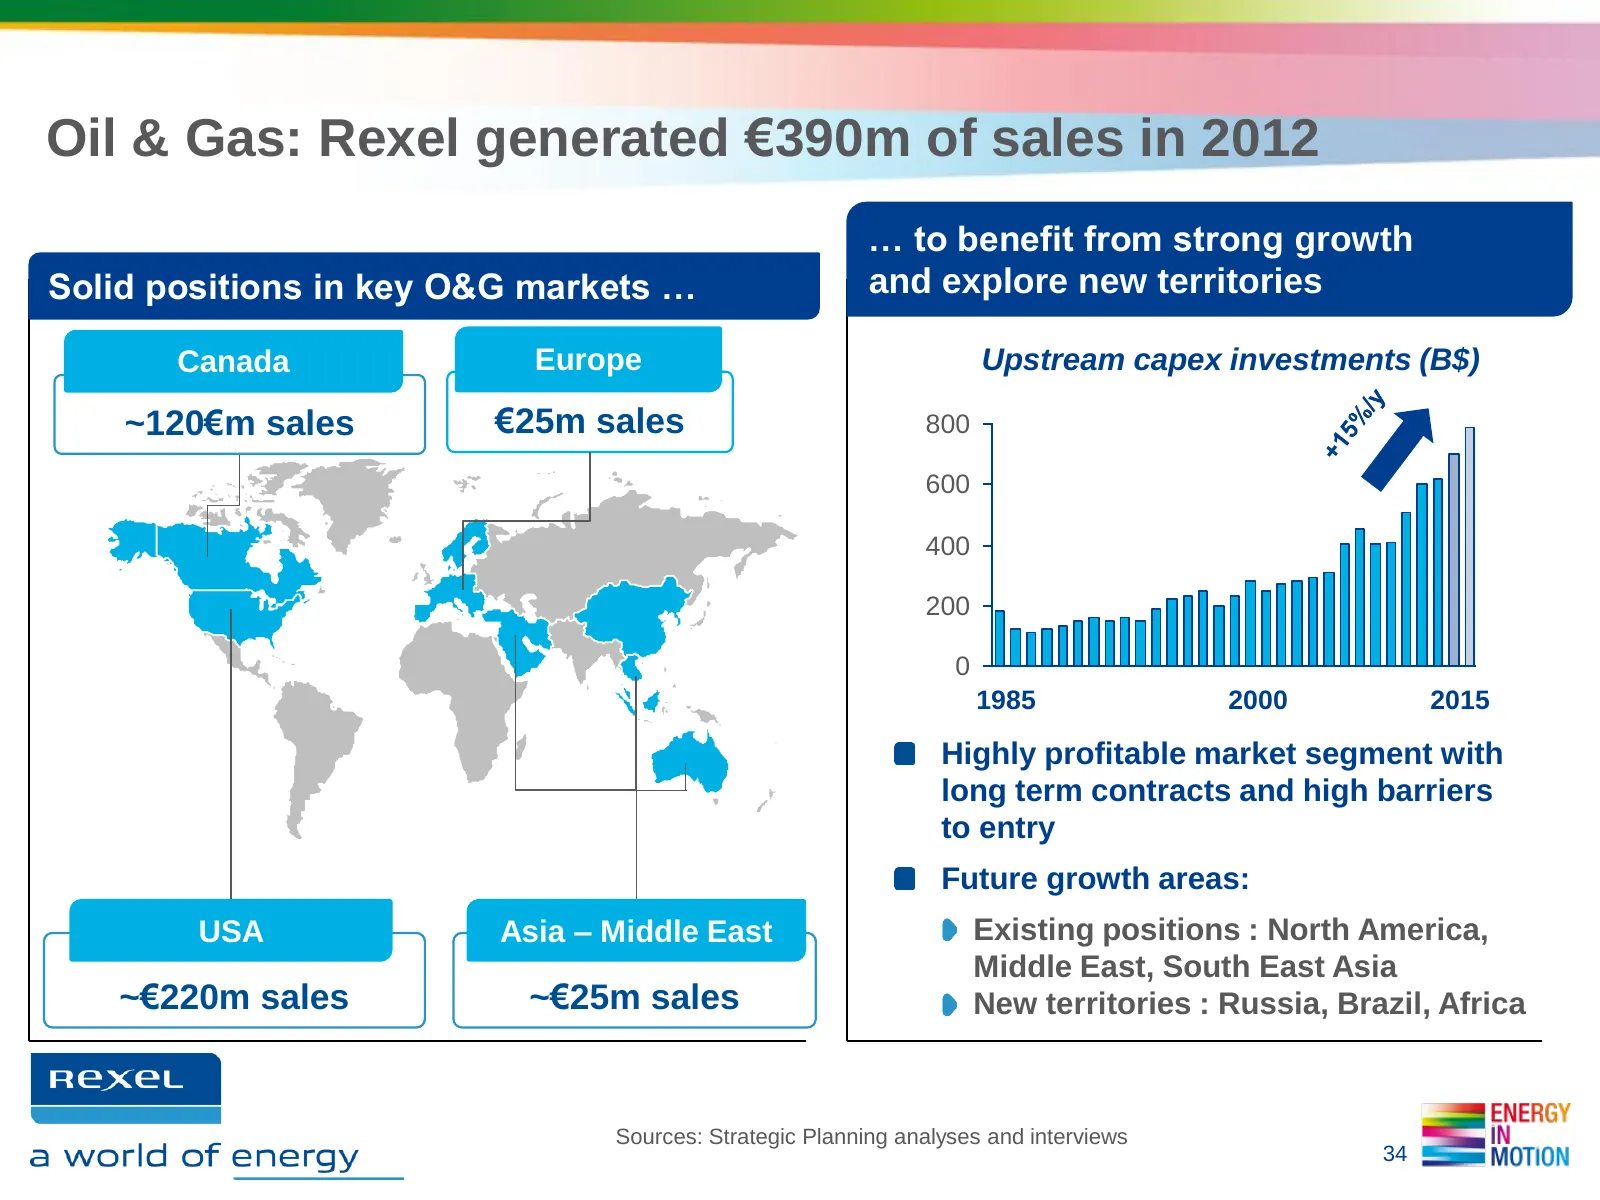
Oil & Gas: Rexel generated €390m of sales in 2012 … to benefit from strong growth Solid positions in key O&G markets … and explore new territories Canada Europe Upstream capex investments (B$) ~120€m sales €25m sales 800 600 400 200 0 1985 2000 2015 Highly profitable market segment with long term co
Slide 35: Customized value propositions in Oil & Gas
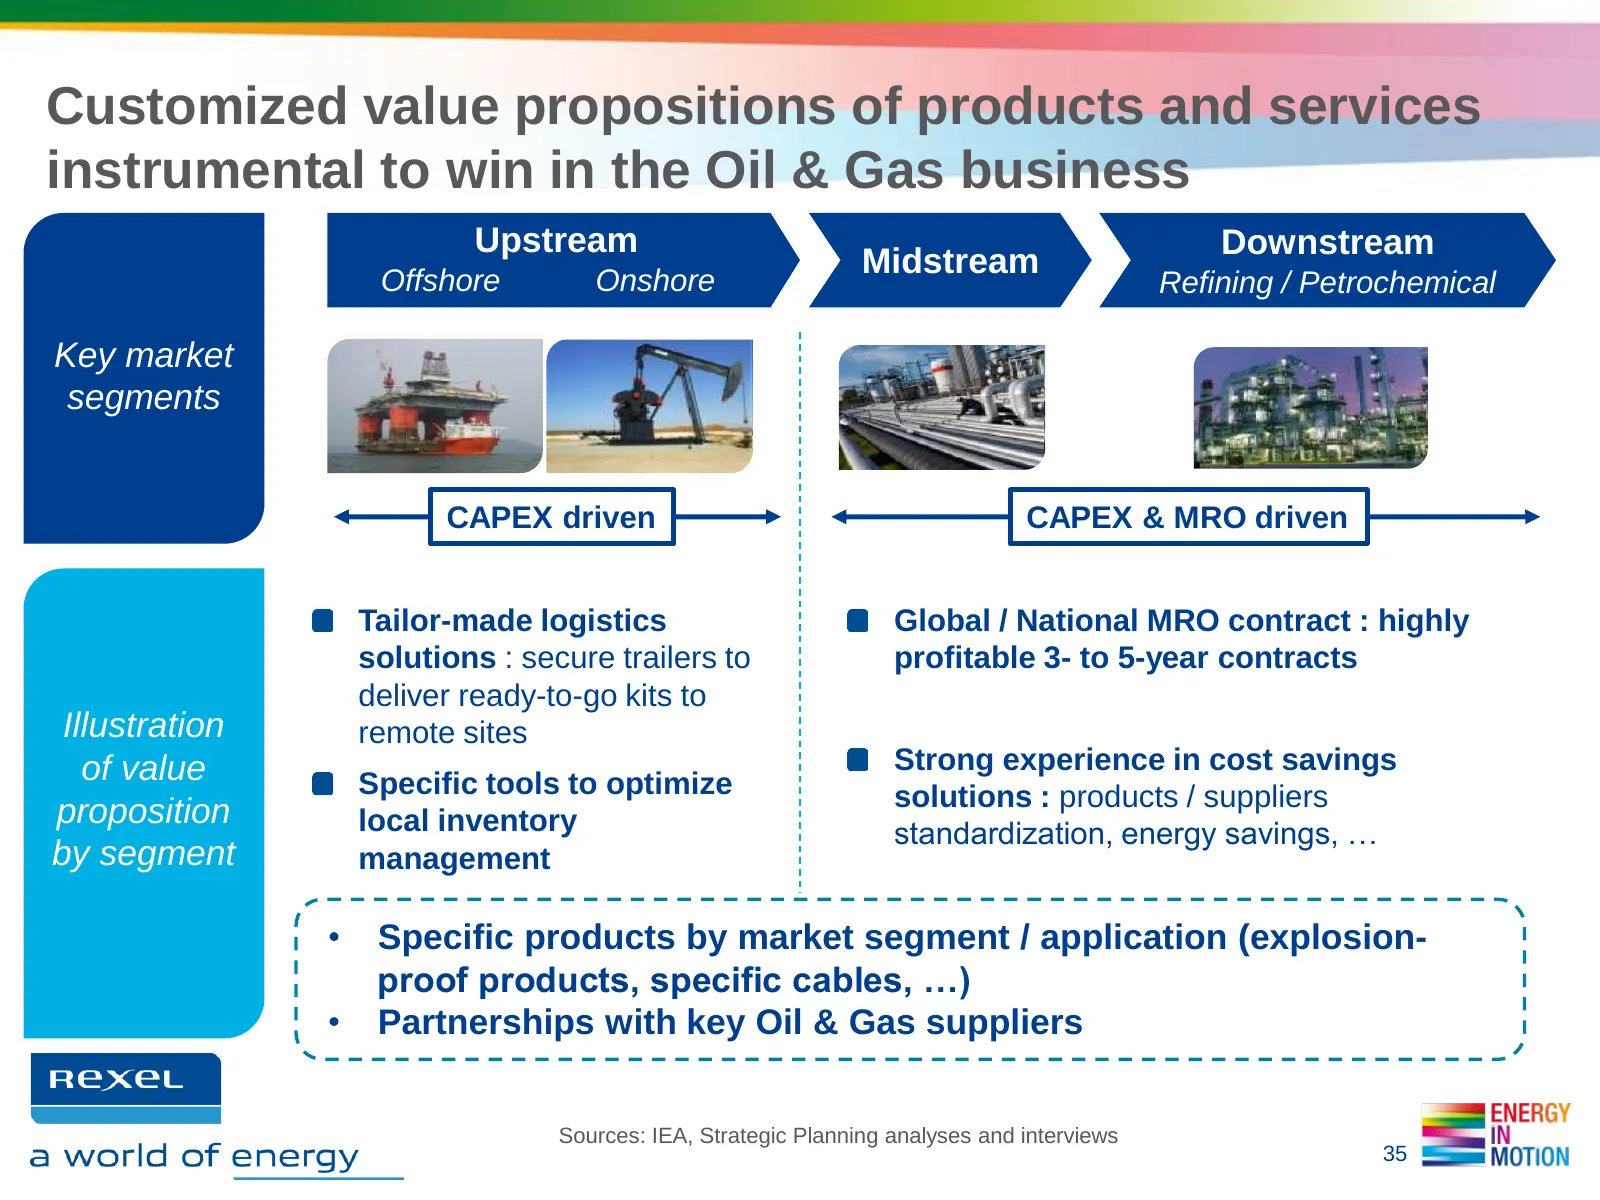
Customized value propositions of products and services instrumental to win in the Oil & Gas business Upstream Downstream Midstream Offshore Onshore Refining / Petrochemical Key market segments CAPEX driven CAPEX & MRO driven Tailor-made logistics Global / National MRO contract : highly solutions : s
Slide 36: Managing a major project in Canada
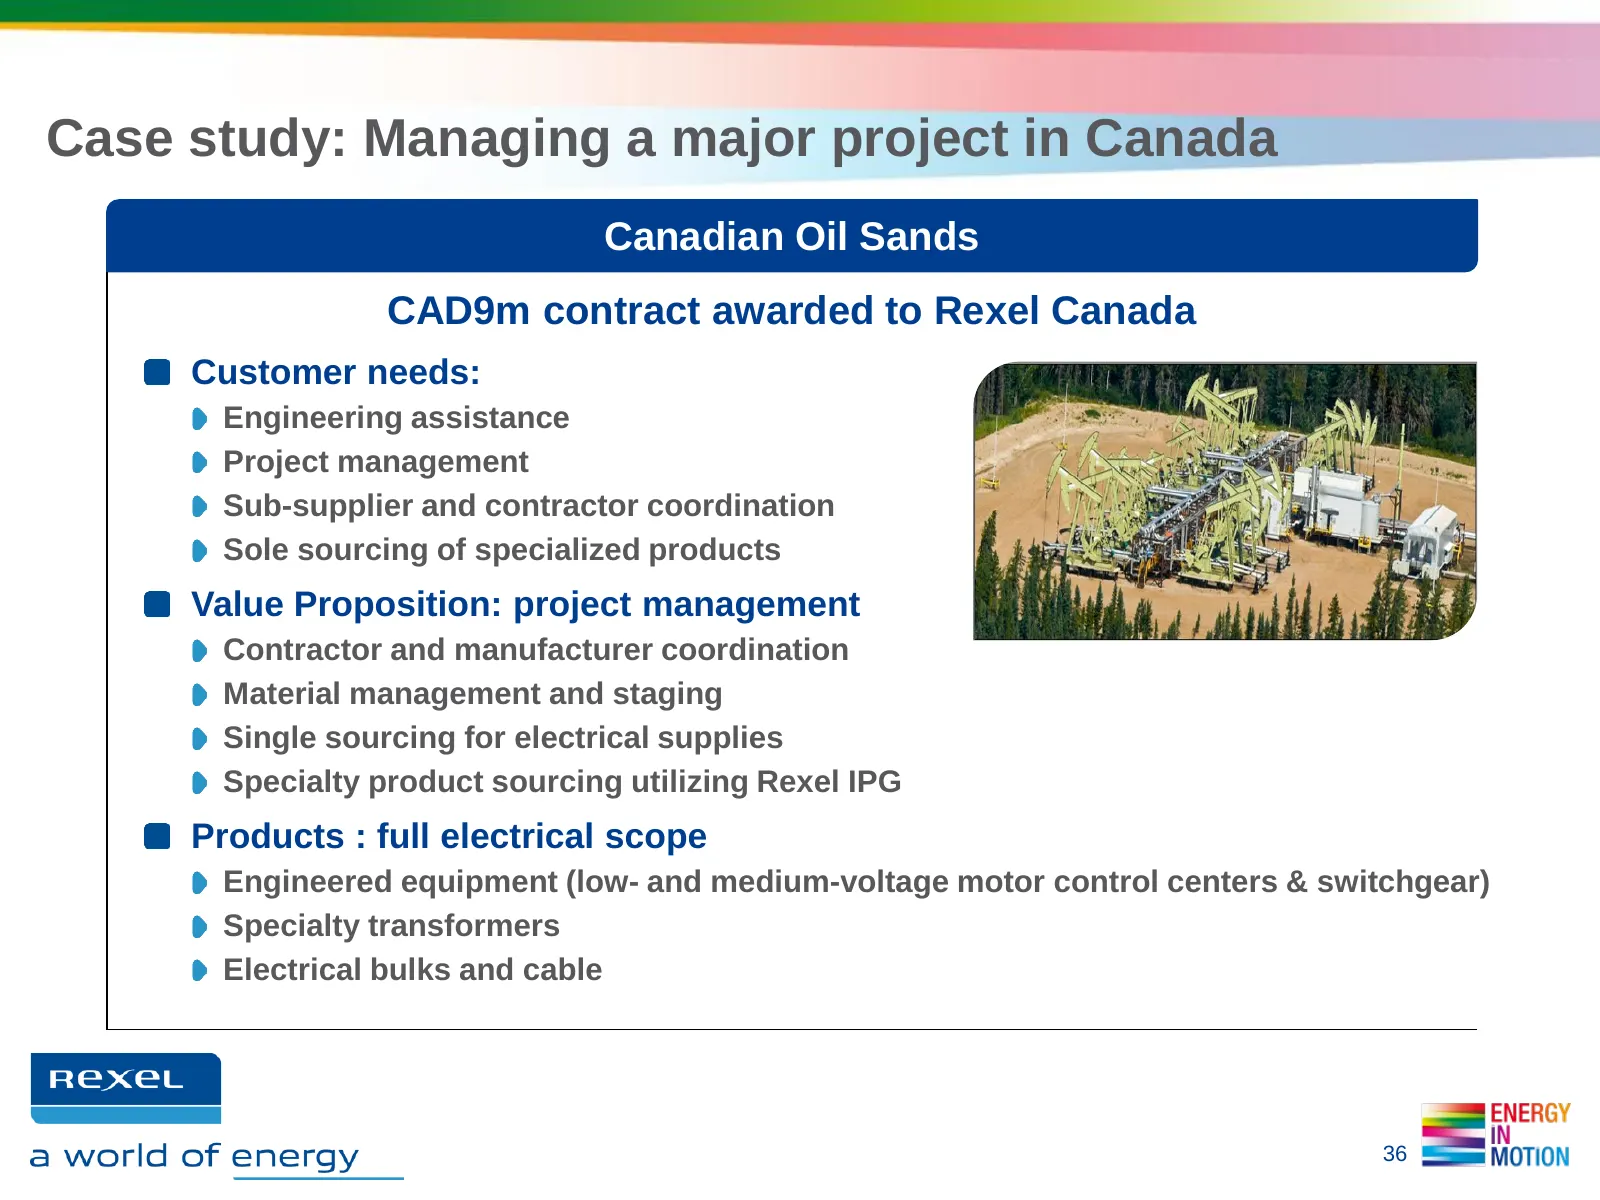
Case study: Managing a major project in Canada Canadian Oil Sands CAD9m contract awarded to Rexel Canada Customer needs: Engineering assistance Project management Sub-supplier and contractor coordination Sole sourcing of specialized products Value Proposition: project management Contractor and manuf
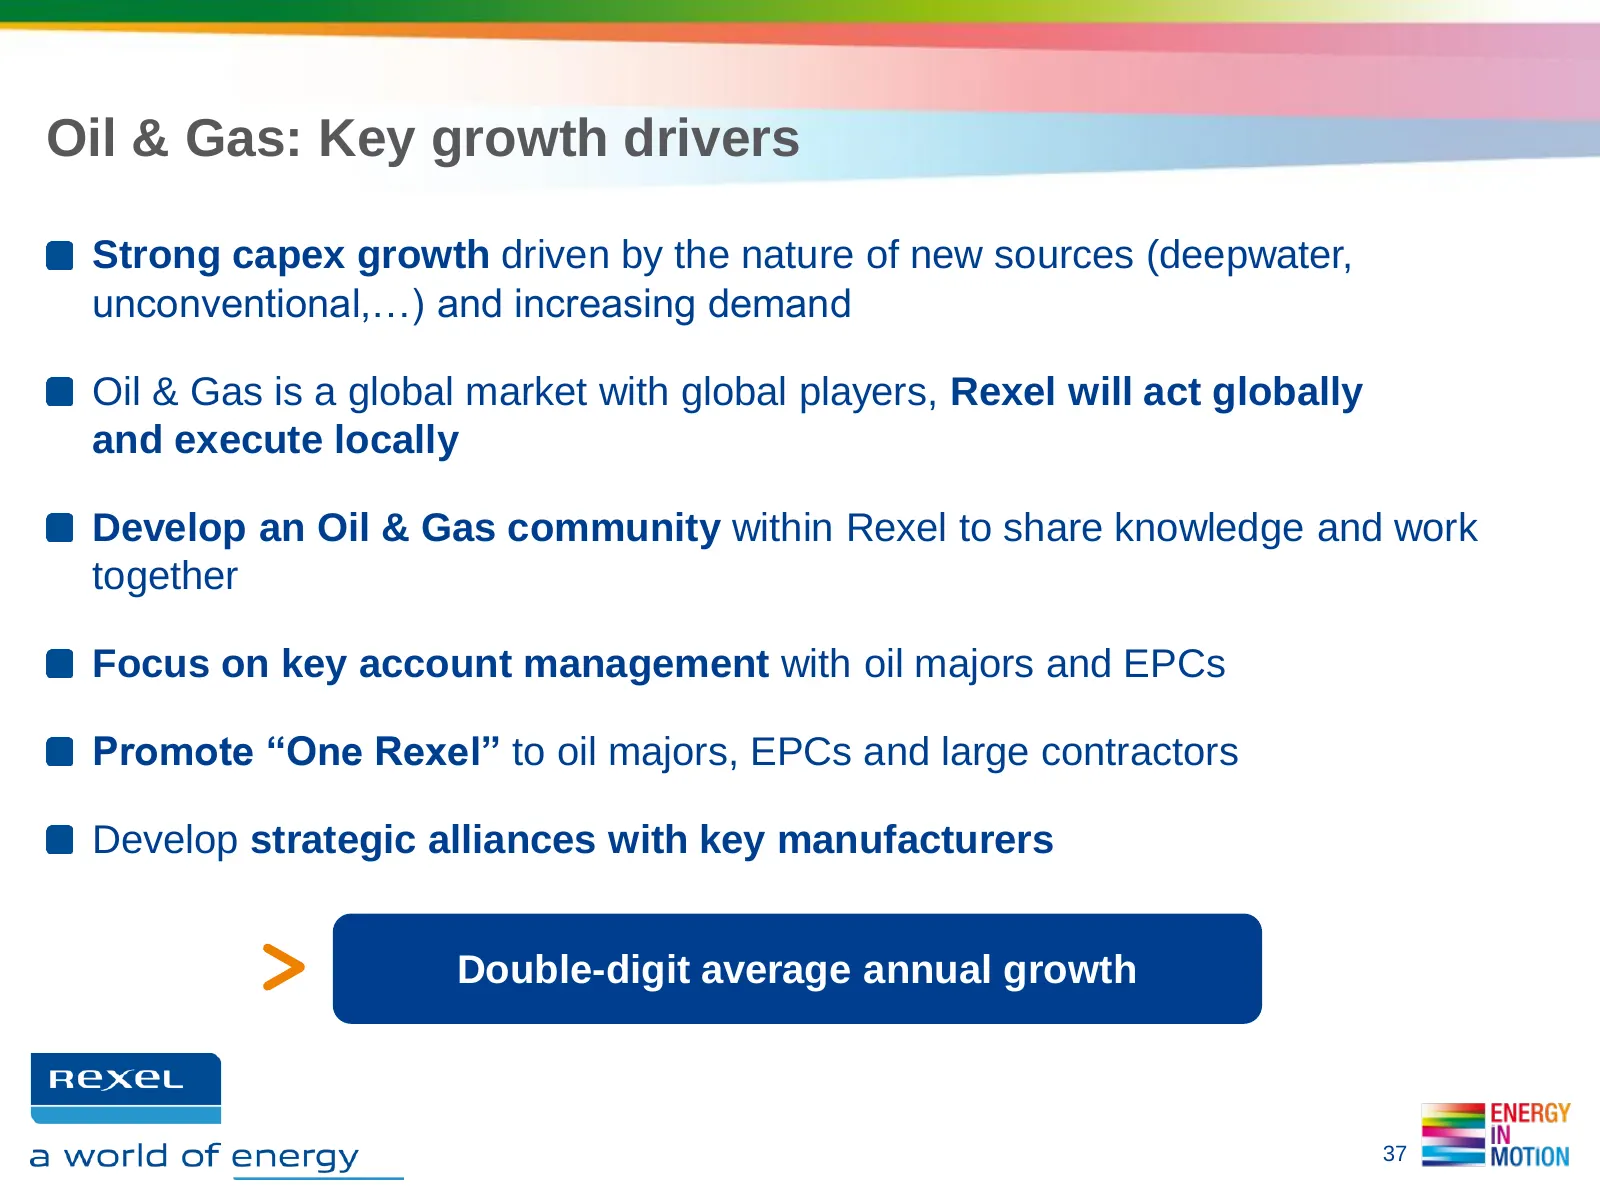
Slide 37: Oil & Gas: Key growth drivers
Oil & Gas: Key growth drivers Strong capex growth driven by the nature of new sources (deepwater, unconventional,…) and increasing demand Oil & Gas is a global market with global players, Rexel will act globally and execute locally Develop an Oil & Gas community within Rexel to share knowledge and w
Slide 38: 2. Enhancing customer-centricity for mainstream organic growth
2. ENHANCING CUSTOMER-CENTRICITY FOR MAINSTREAM ORGANIC GROWTH Rudy PROVOOST, Chairman of the Management Board and CEO
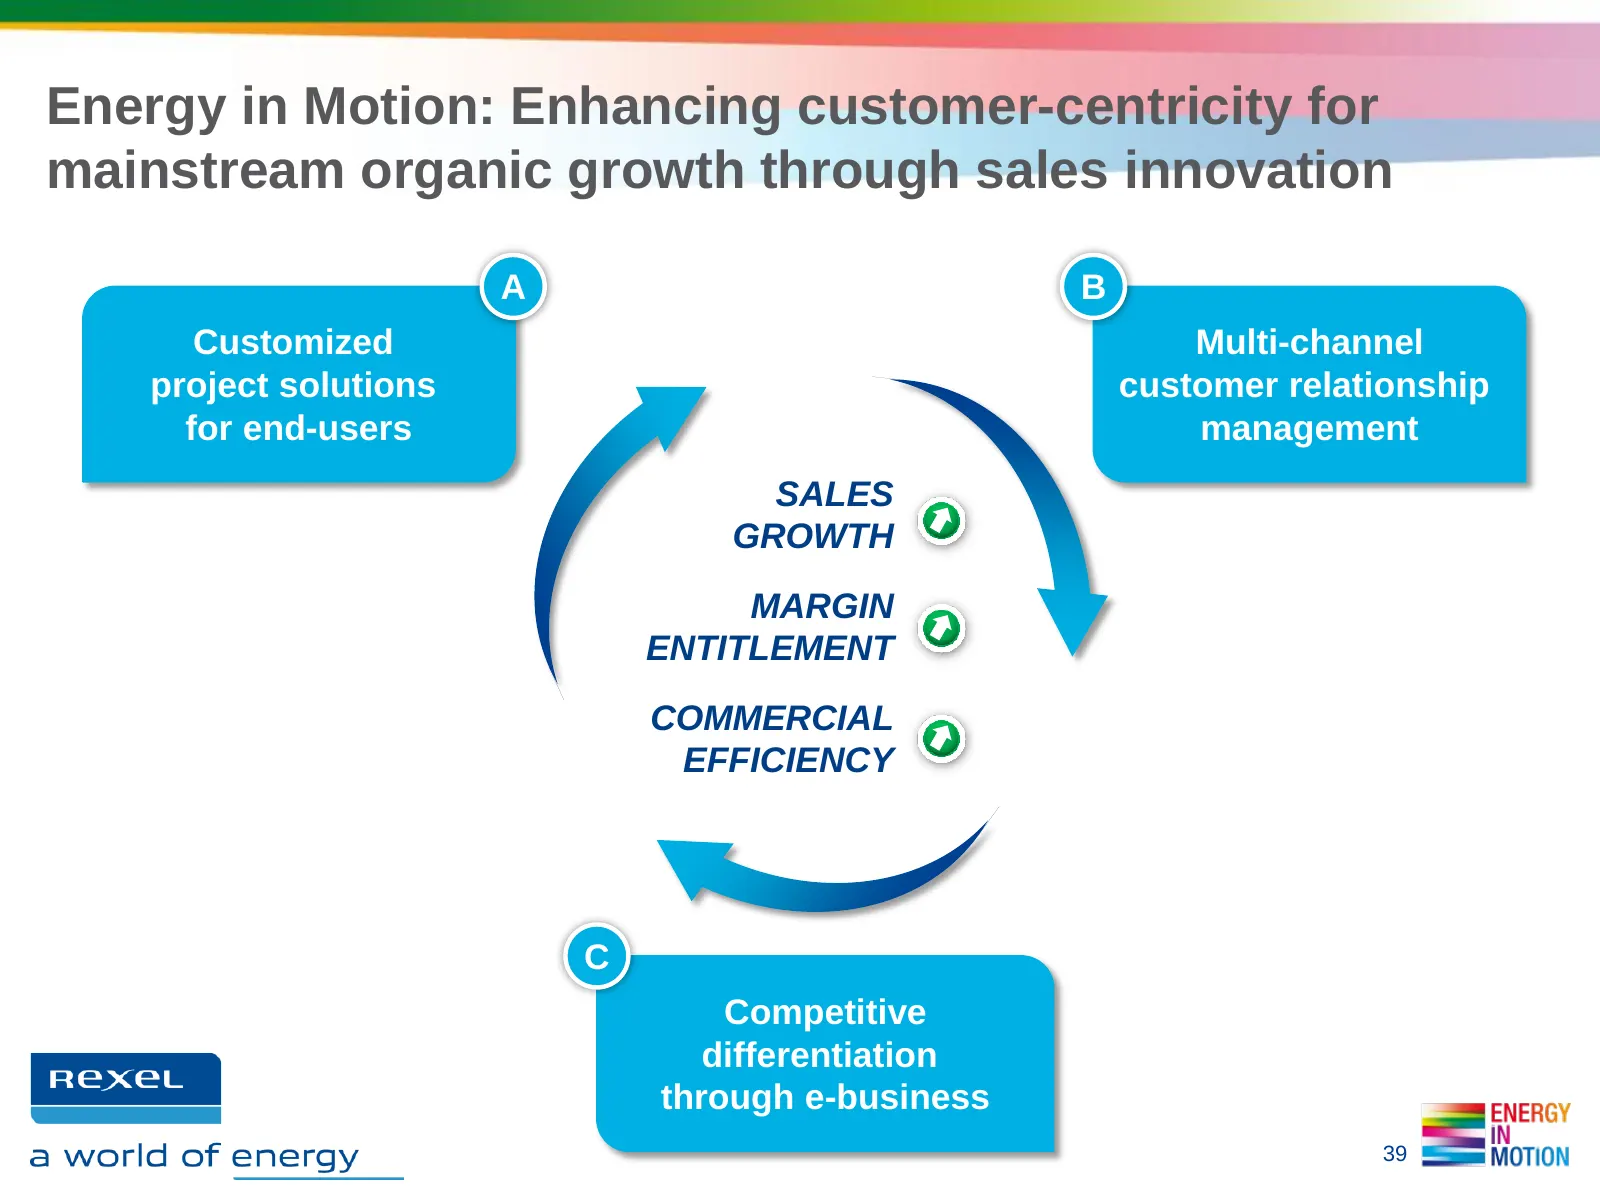
Slide 39: Enhancing customer-centricity through sales innovation
Energy in Motion: Enhancing customer-centricity for mainstream organic growth through sales innovation A B Customized Multi-channel project solutions customer relationship for end-users management SALES GROWTH MARGIN ENTITLEMENT COMMERCIAL EFFICIENCY C Competitive differentiation through e-business
Slide 40: 2.1 Sales innovation: customized project solutions
2.1. SALES INNOVATION AT WORK: CUSTOMIZED PROJECT SOLUTIONS Example: Success stories in France Mathieu LARROUMET, Key Accounts & Large Projects Director, Southern Europe
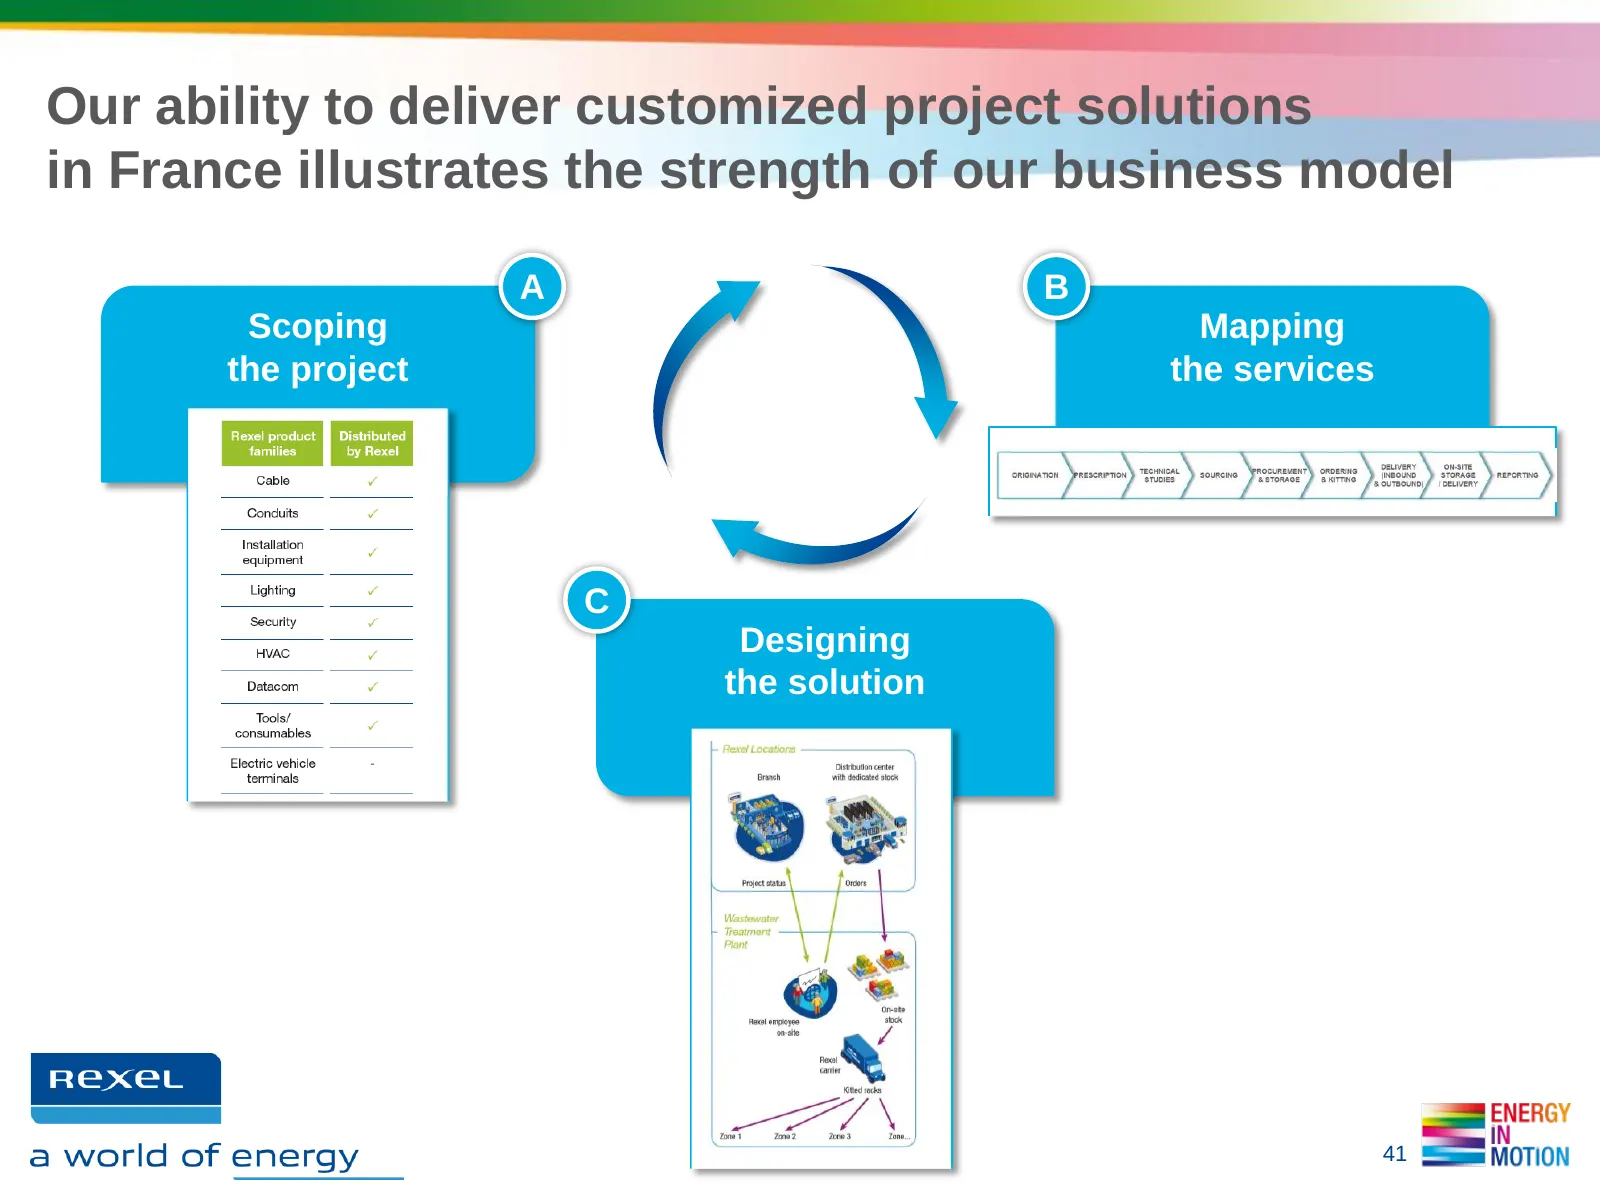
Slide 41: Delivering customized project solutions in France
Our ability to deliver customized project solutions in France illustrates the strength of our business model A B Scoping Mapping the project the services C Designing the solution 41
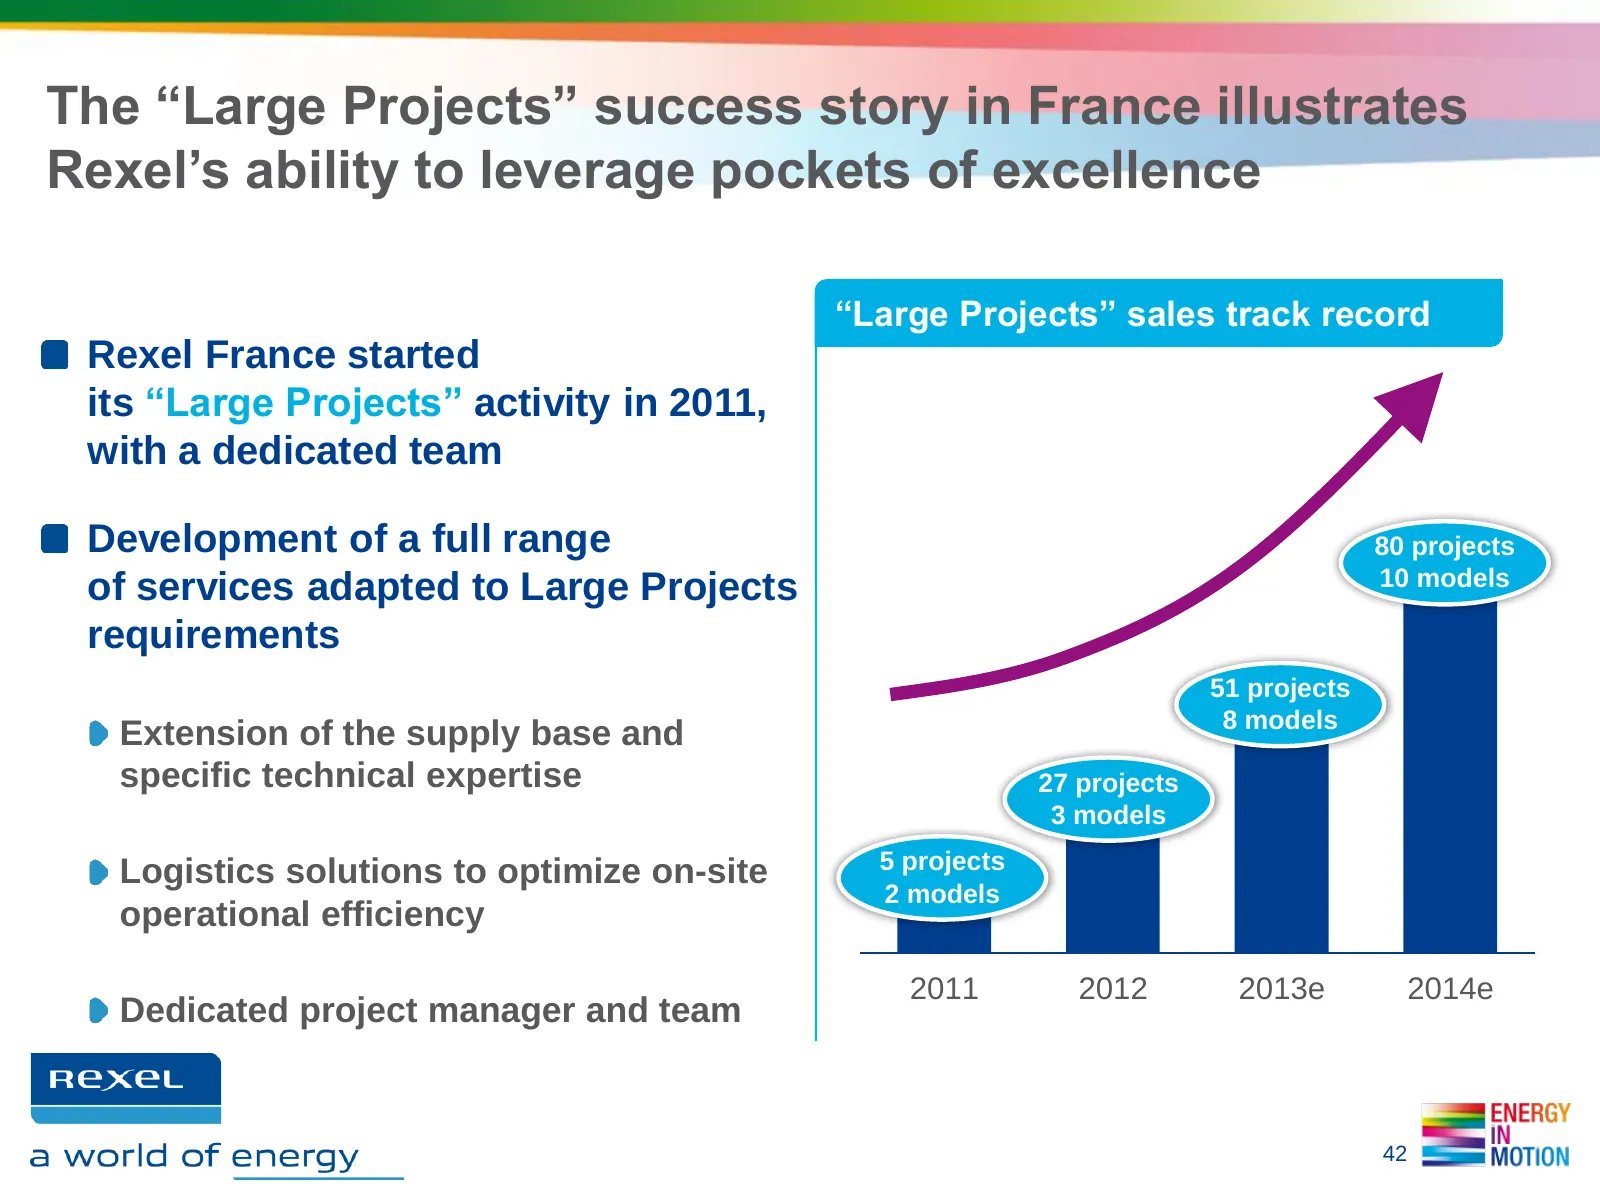
Slide 42: Large Projects success story in France
The “Large Projects” success story in France illustrates Rexel’s ability to leverage pockets of excellence “Large Projects” sales track record Rexel France started its “Large Projects” activity in 2011, with a dedicated team Development of a full range 80 projects of services adapted to Large Projec
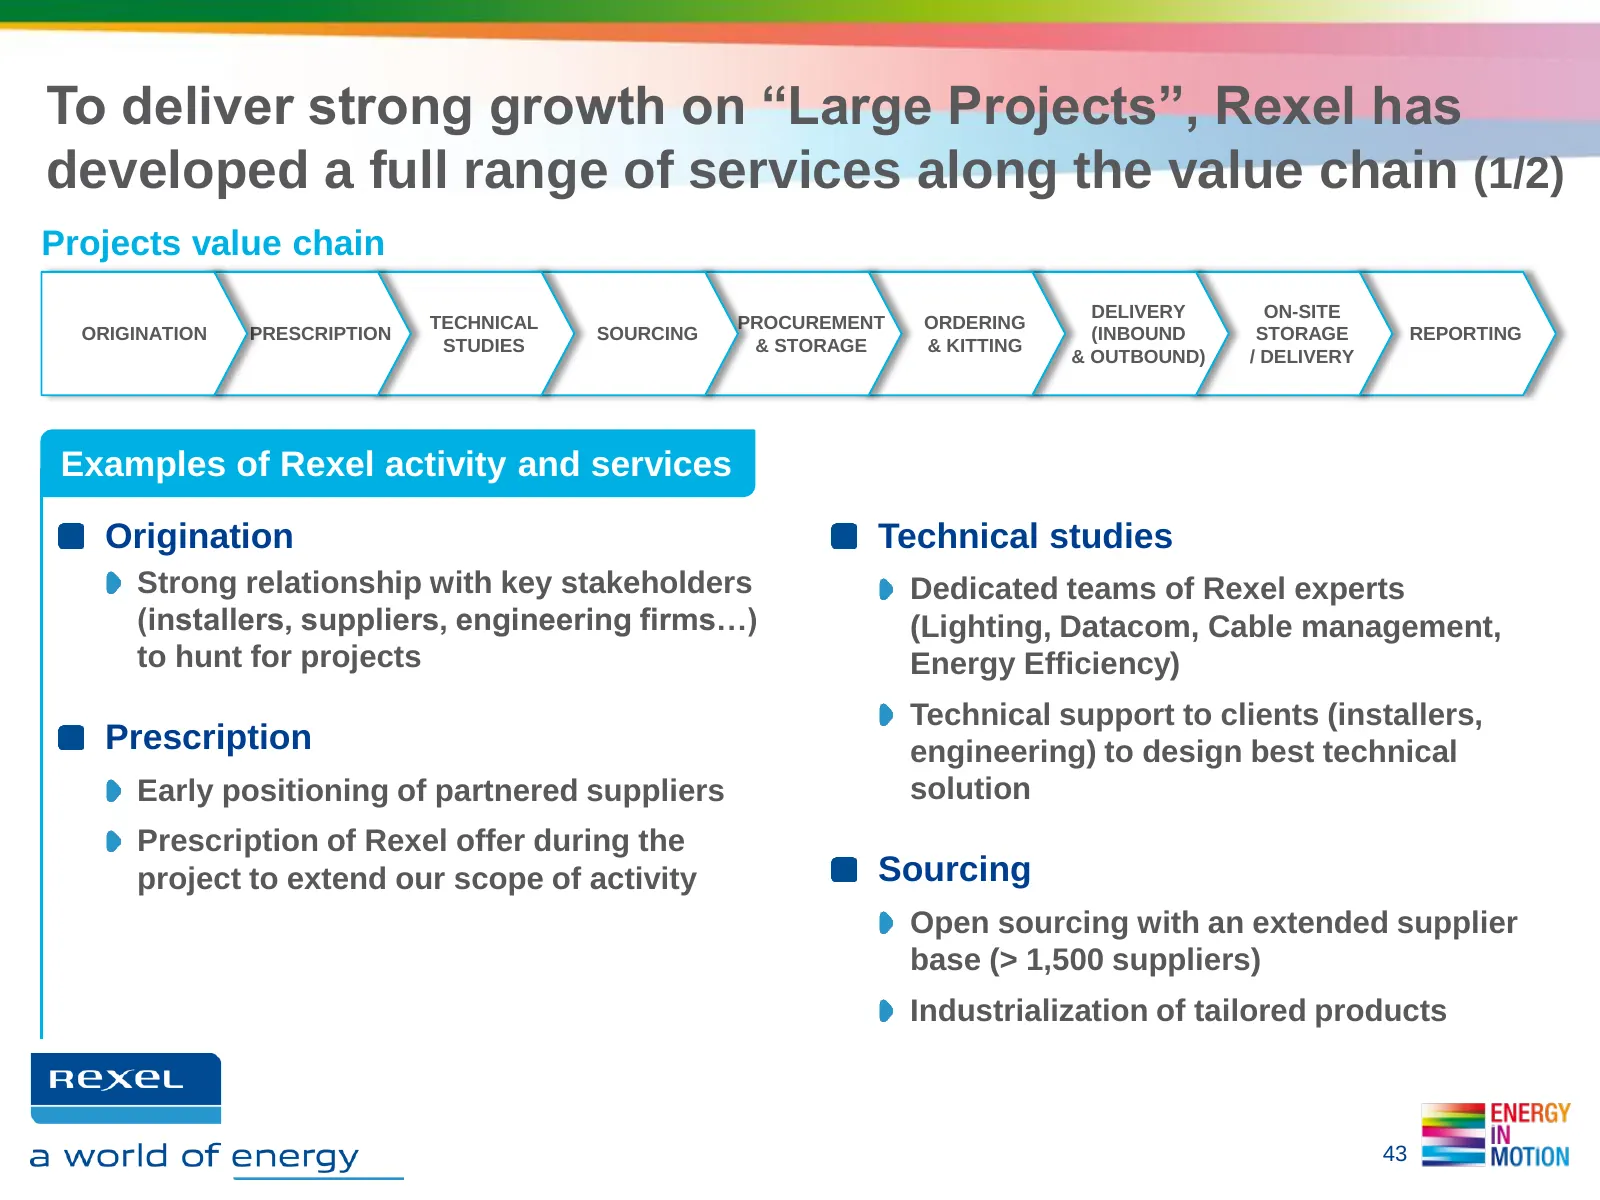
Slide 43: Full range of services along the value chain (1/2)
To deliver strong growth on “Large Projects”, Rexel has developed a full range of services along the value chain (1/2) Projects value chain DELIVERY ON-SITE TECHNICAL PROCUREMENT ORDERING ORIGINATION PRESCRIPTION SOURCING (INBOUND STORAGE REPORTING STUDIES & STORAGE & KITTING & OUTBOUND) / DELIVERY
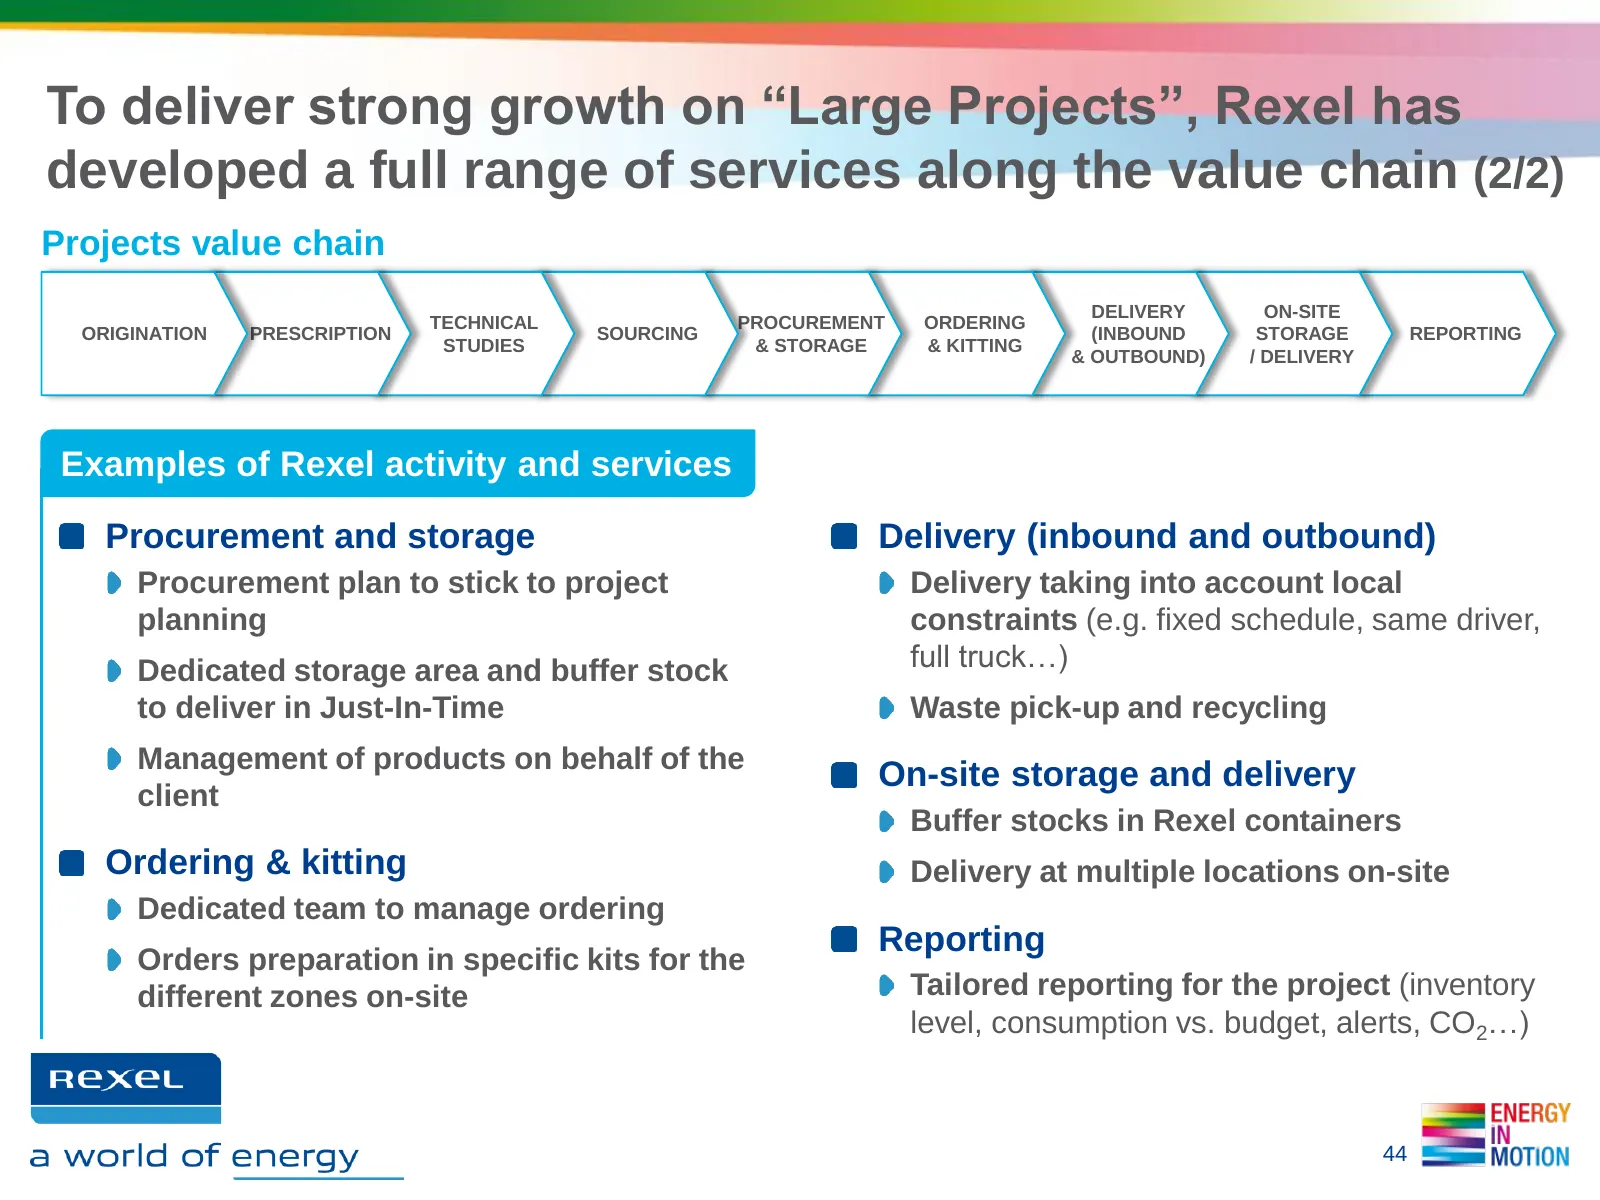
Slide 44: Full range of services along the value chain (2/2)
To deliver strong growth on “Large Projects”, Rexel has developed a full range of services along the value chain (2/2) Projects value chain DELIVERY ON-SITE TECHNICAL PROCUREMENT ORDERING ORIGINATION PRESCRIPTION SOURCING (INBOUND STORAGE REPORTING STUDIES & STORAGE & KITTING & OUTBOUND) / DELIVERY
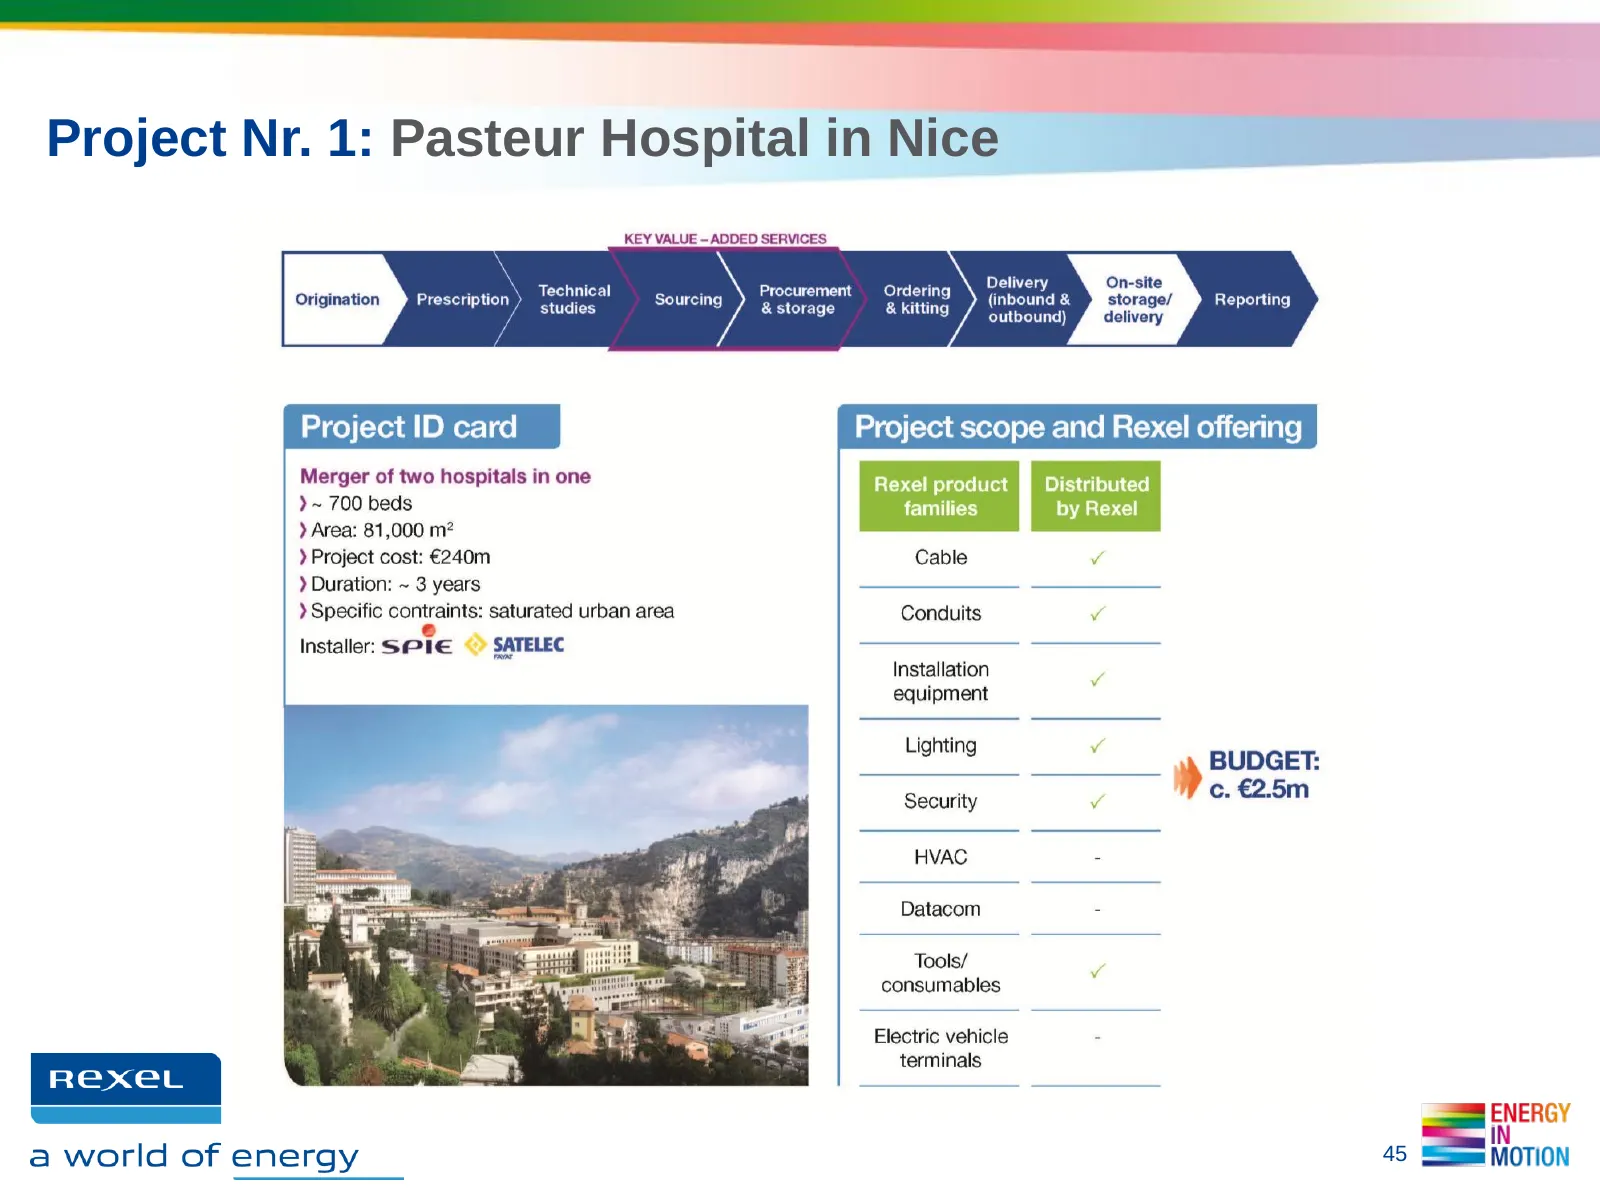
Slide 45: Project Nr. 1: Pasteur Hospital in Nice
Project Nr. 1: Pasteur Hospital in Nice 45
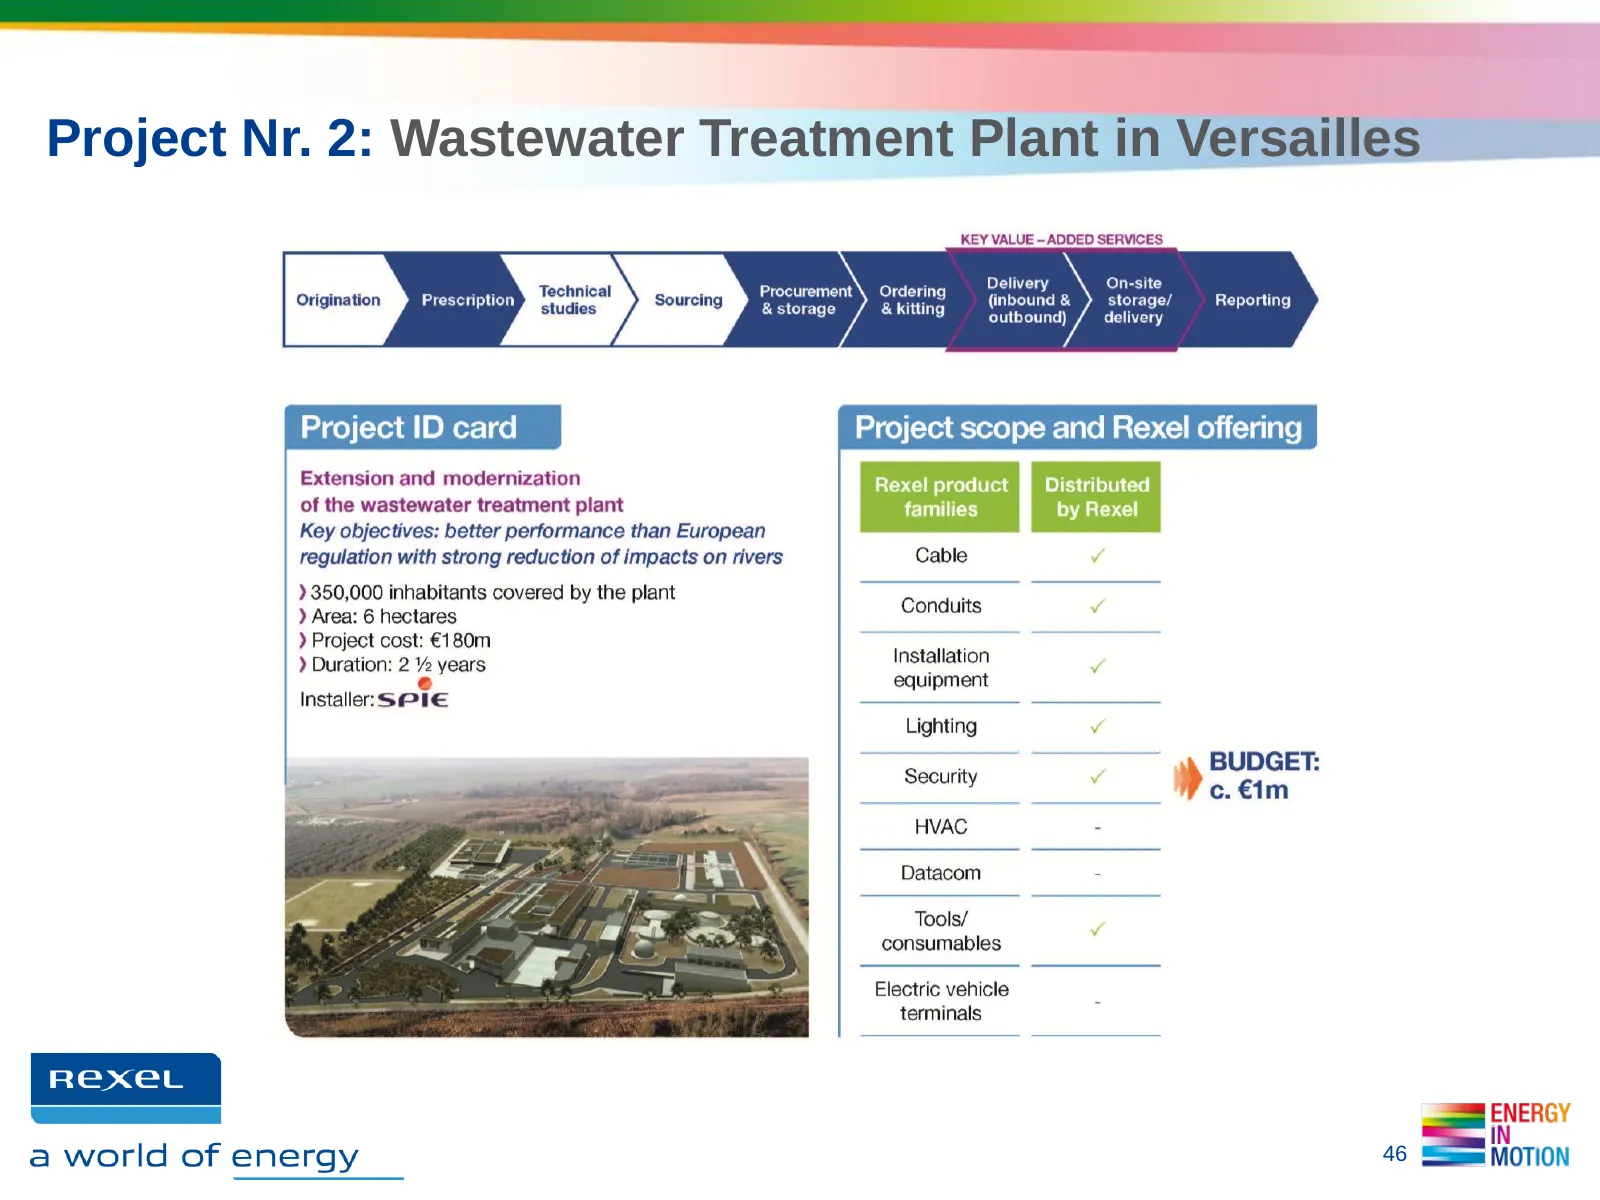
Slide 46: Project Nr. 2: Wastewater Treatment Plant in Versailles
Project Nr. 2: Wastewater Treatment Plant in Versailles 46
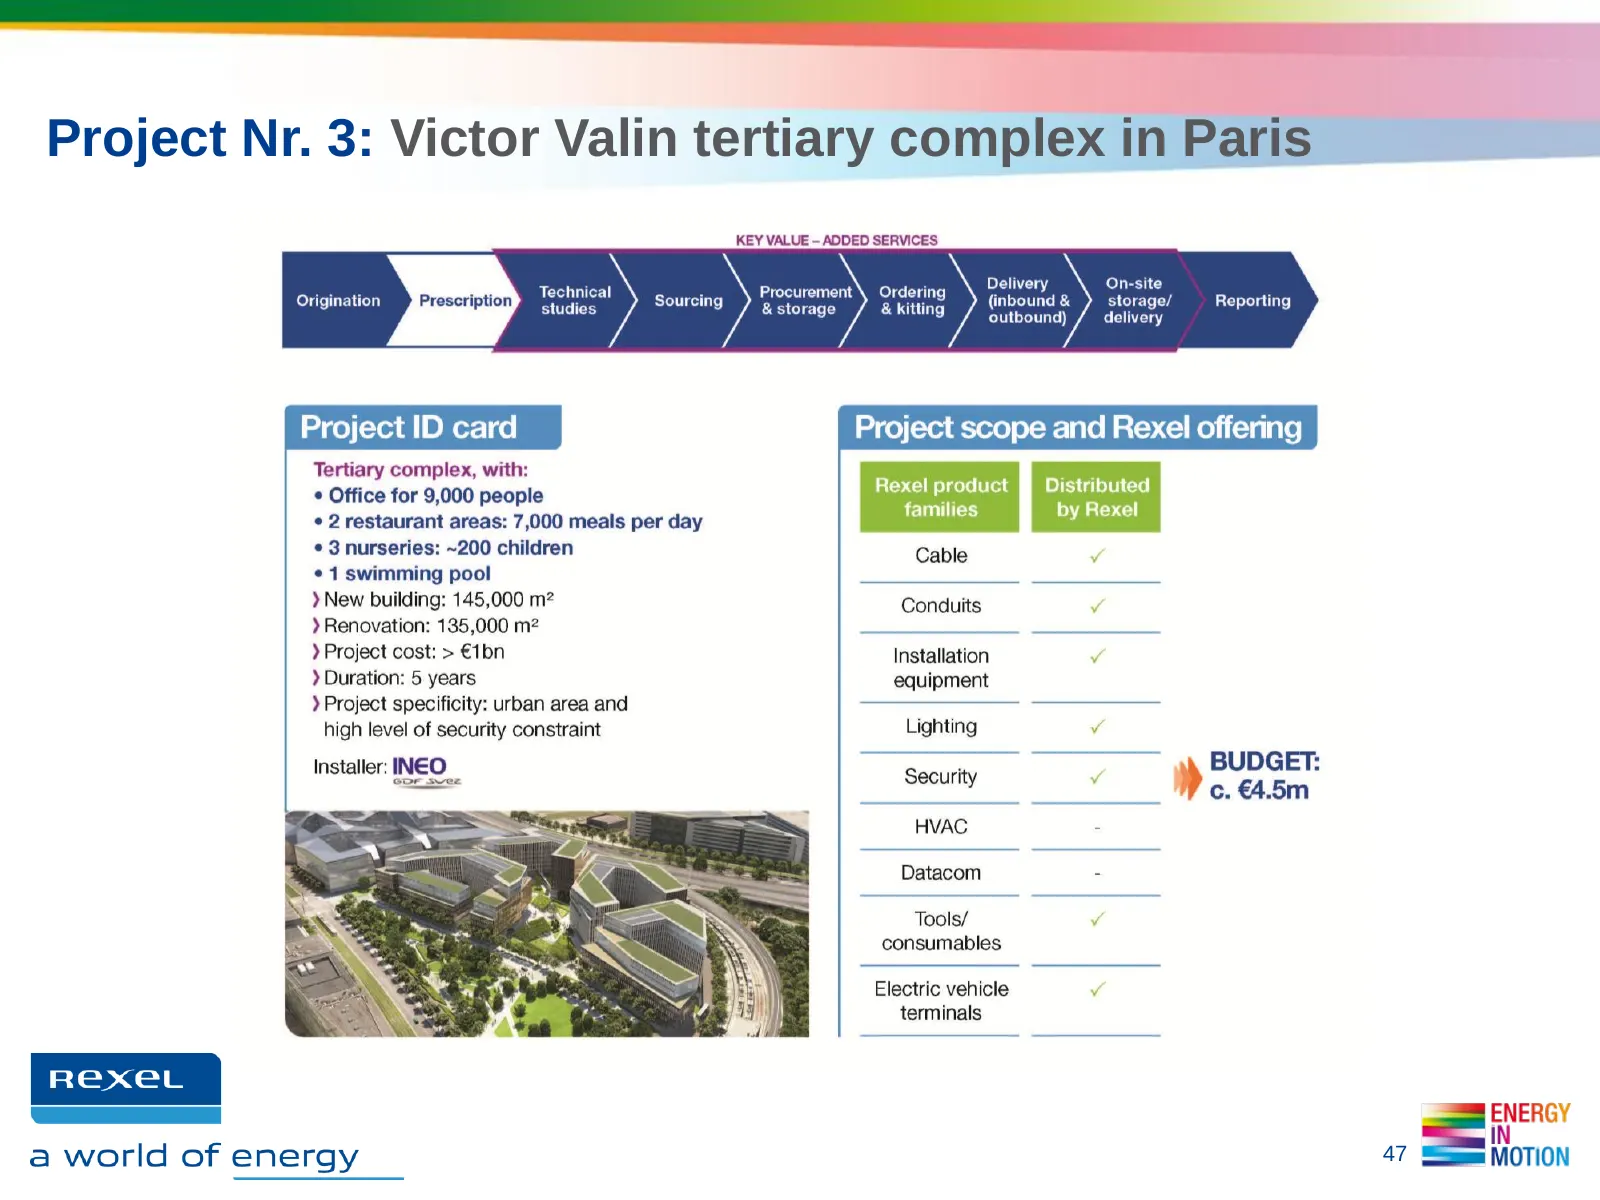
Slide 47: Project Nr. 3: Victor Valin tertiary complex in Paris
Project Nr. 3: Victor Valin tertiary complex in Paris 47
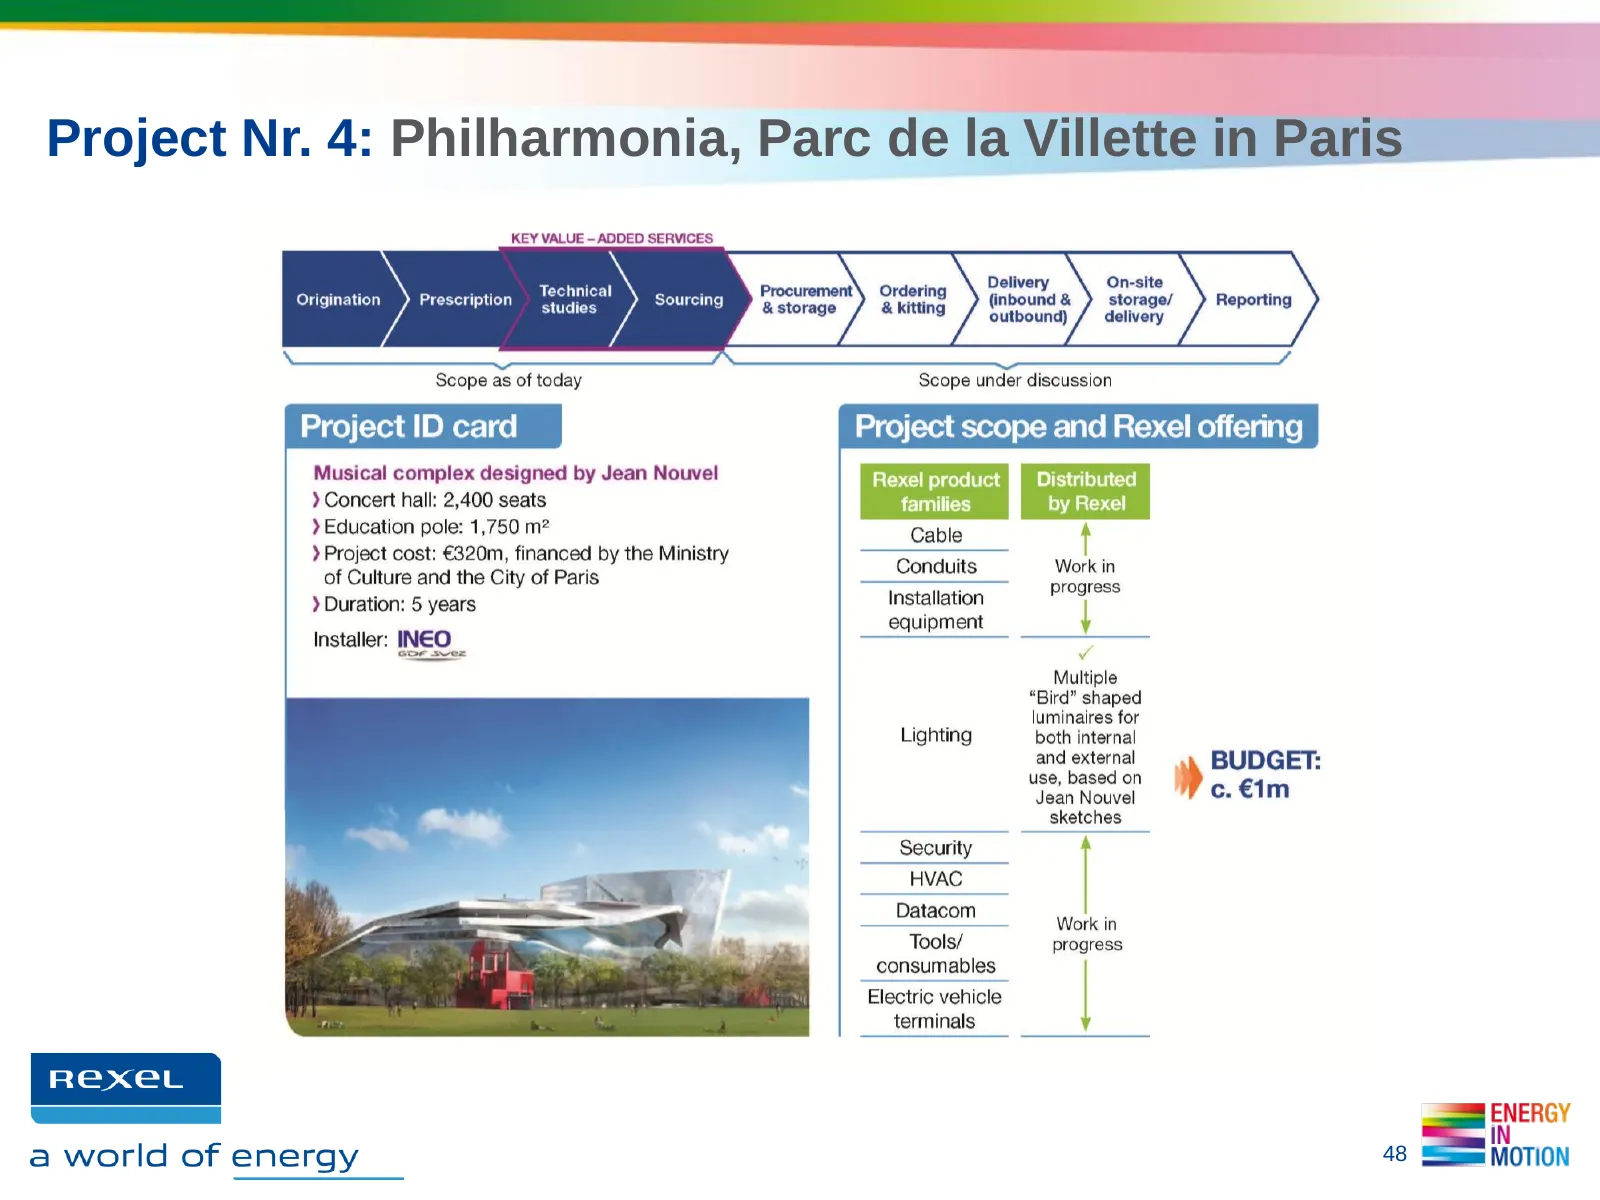
Slide 48: Project Nr. 4: Philharmonia, Parc de la Villette
Project Nr. 4: Philharmonia, Parc de la Villette in Paris 48
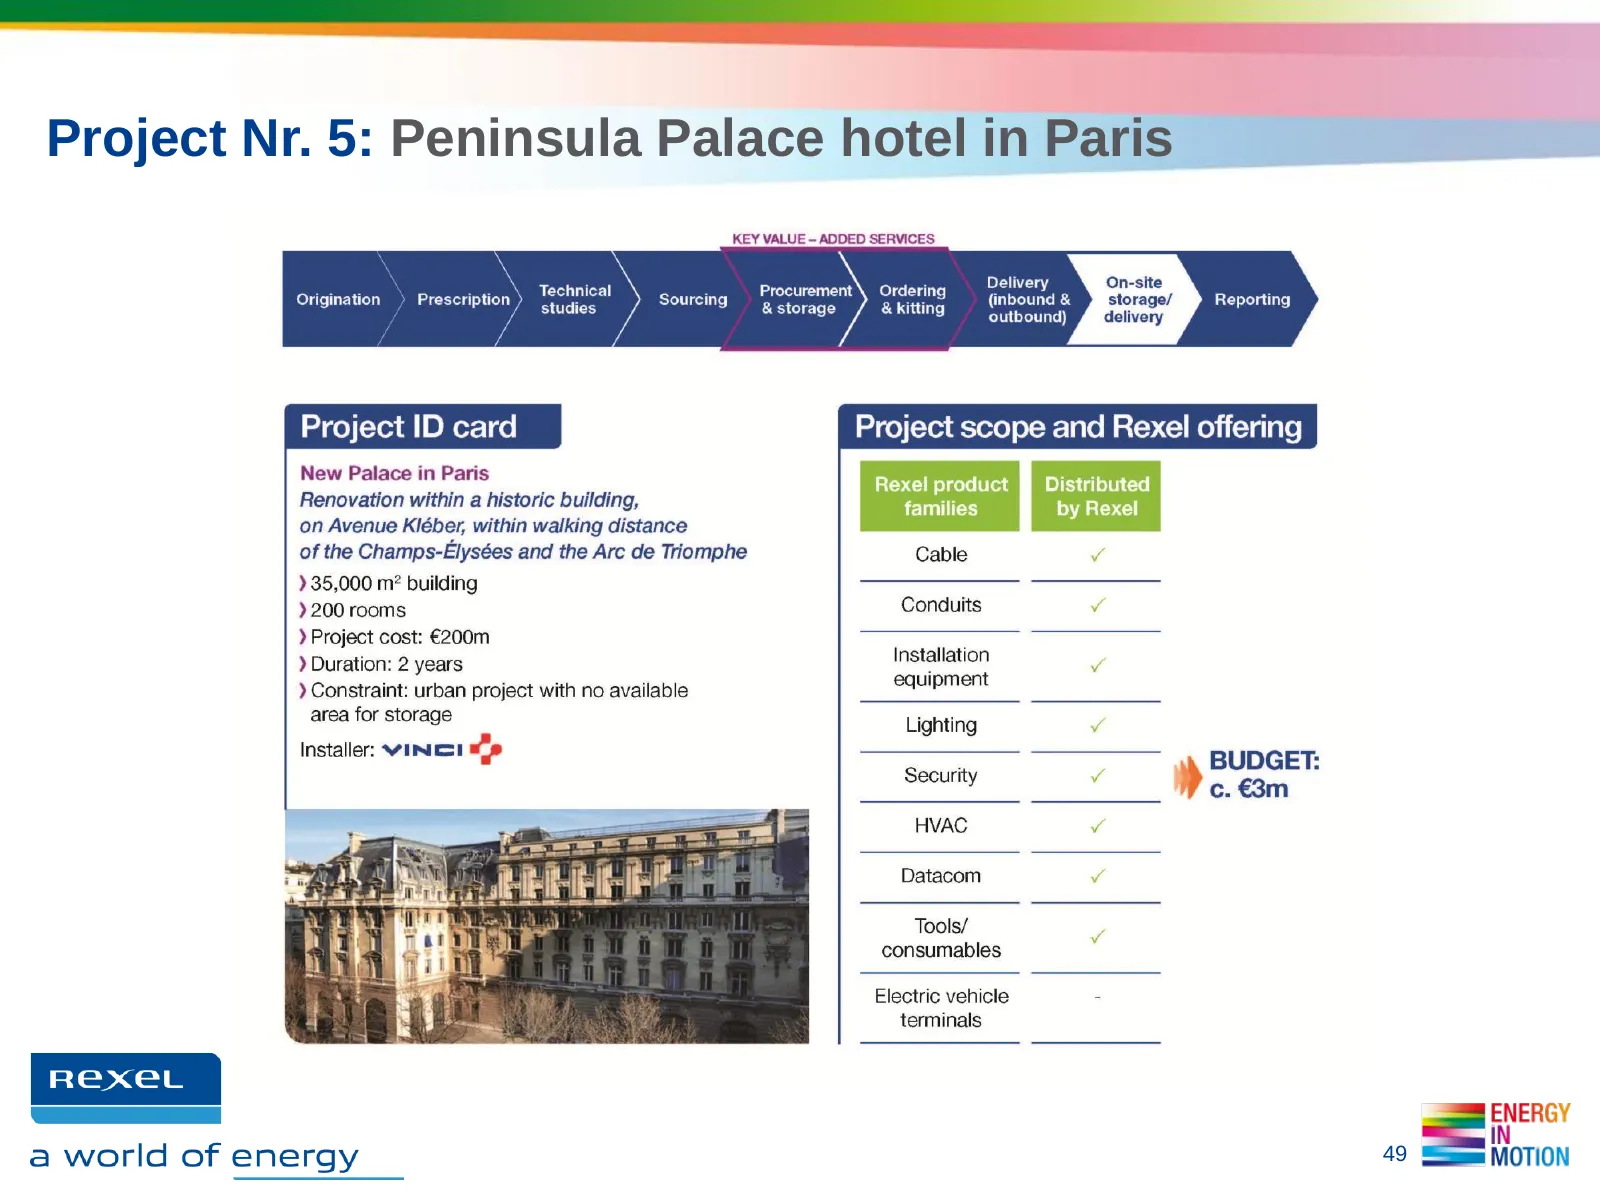
Slide 49: Project Nr. 5: Peninsula Palace hotel in Paris
Project Nr. 5: Peninsula Palace hotel in Paris 49
Slide 50: 2.2 Multi-channel customer relationship management
2.2. SALES INNOVATION AT WORK: MULTI-CHANNEL CUSTOMER RELATIONSHIP MANAGEMENT Example: CRM in France Patrick BERARD, Group Senior VP, Southern Europe
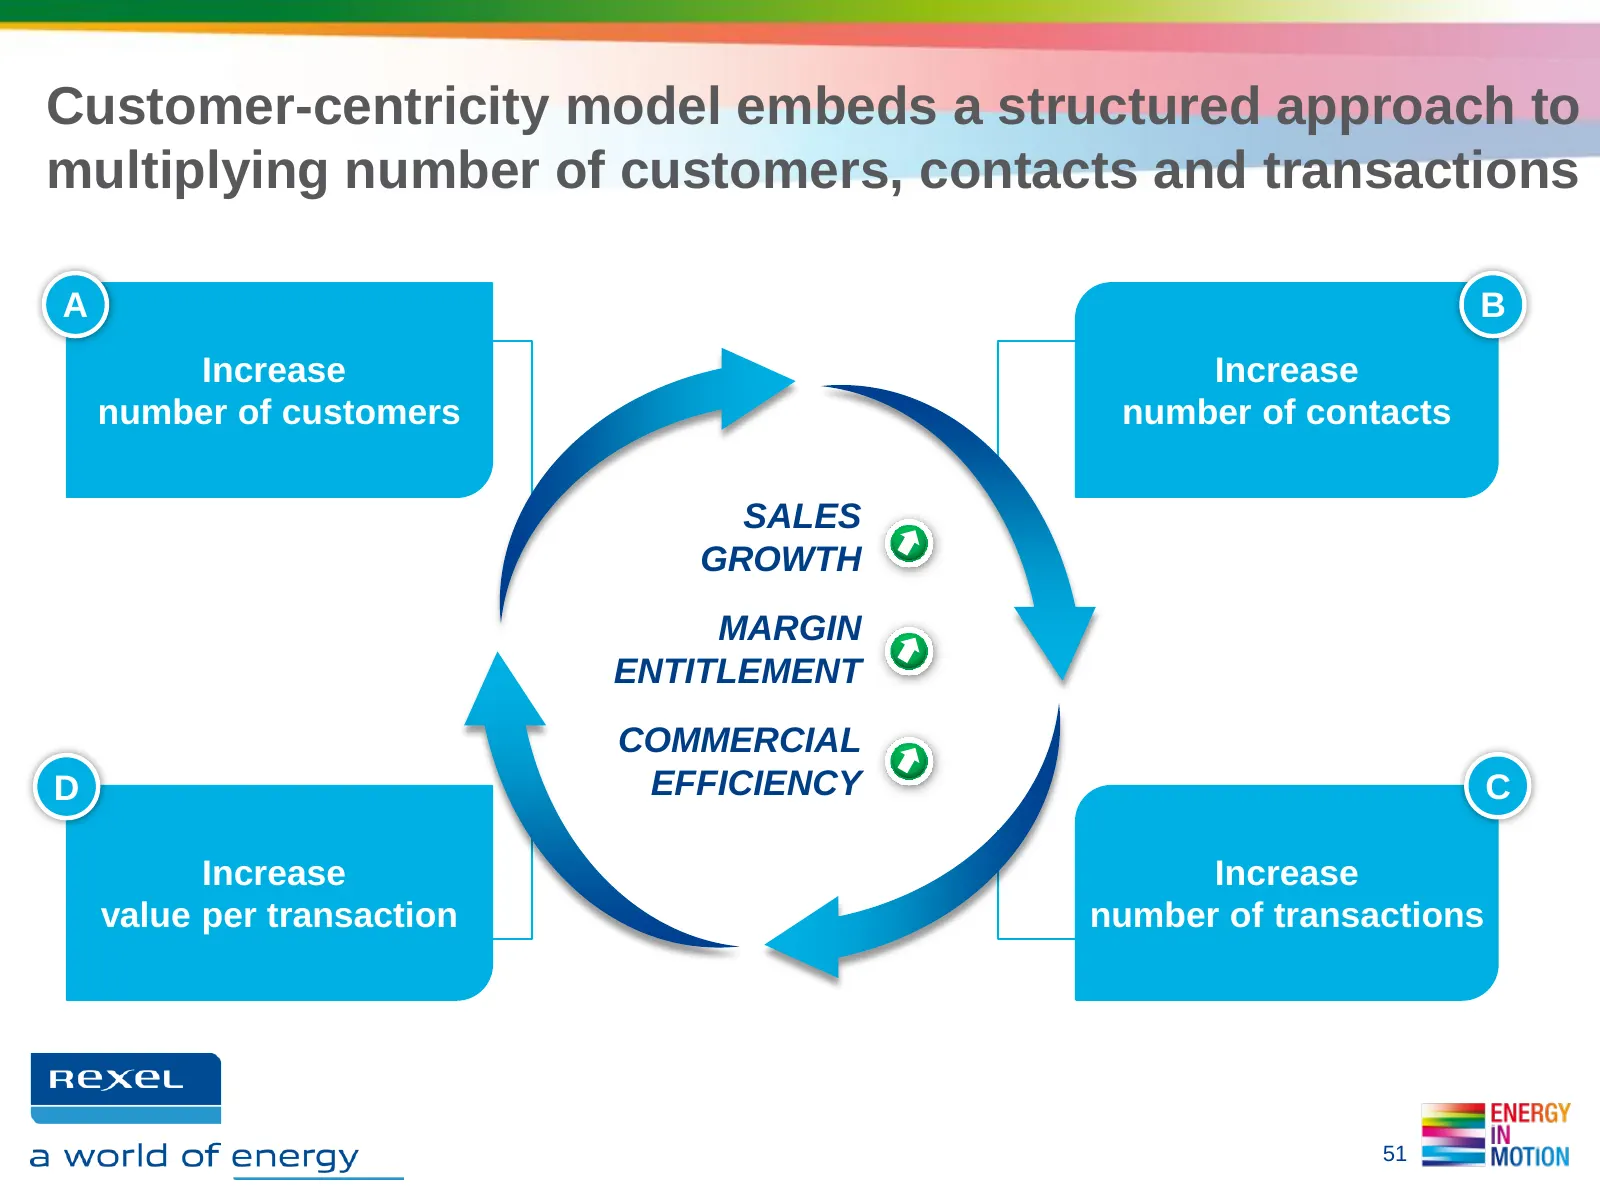
Slide 51: Customer-centricity model multiplies customers, contacts and transactions
Customer-centricity model embeds a structured approach to multiplying number of customers, contacts and transactions A B Increase Increase number of customers number of contacts SALES GROWTH MARGIN ENTITLEMENT COMMERCIAL D EFFICIENCY C Increase Increase value per transaction number of transactions 5
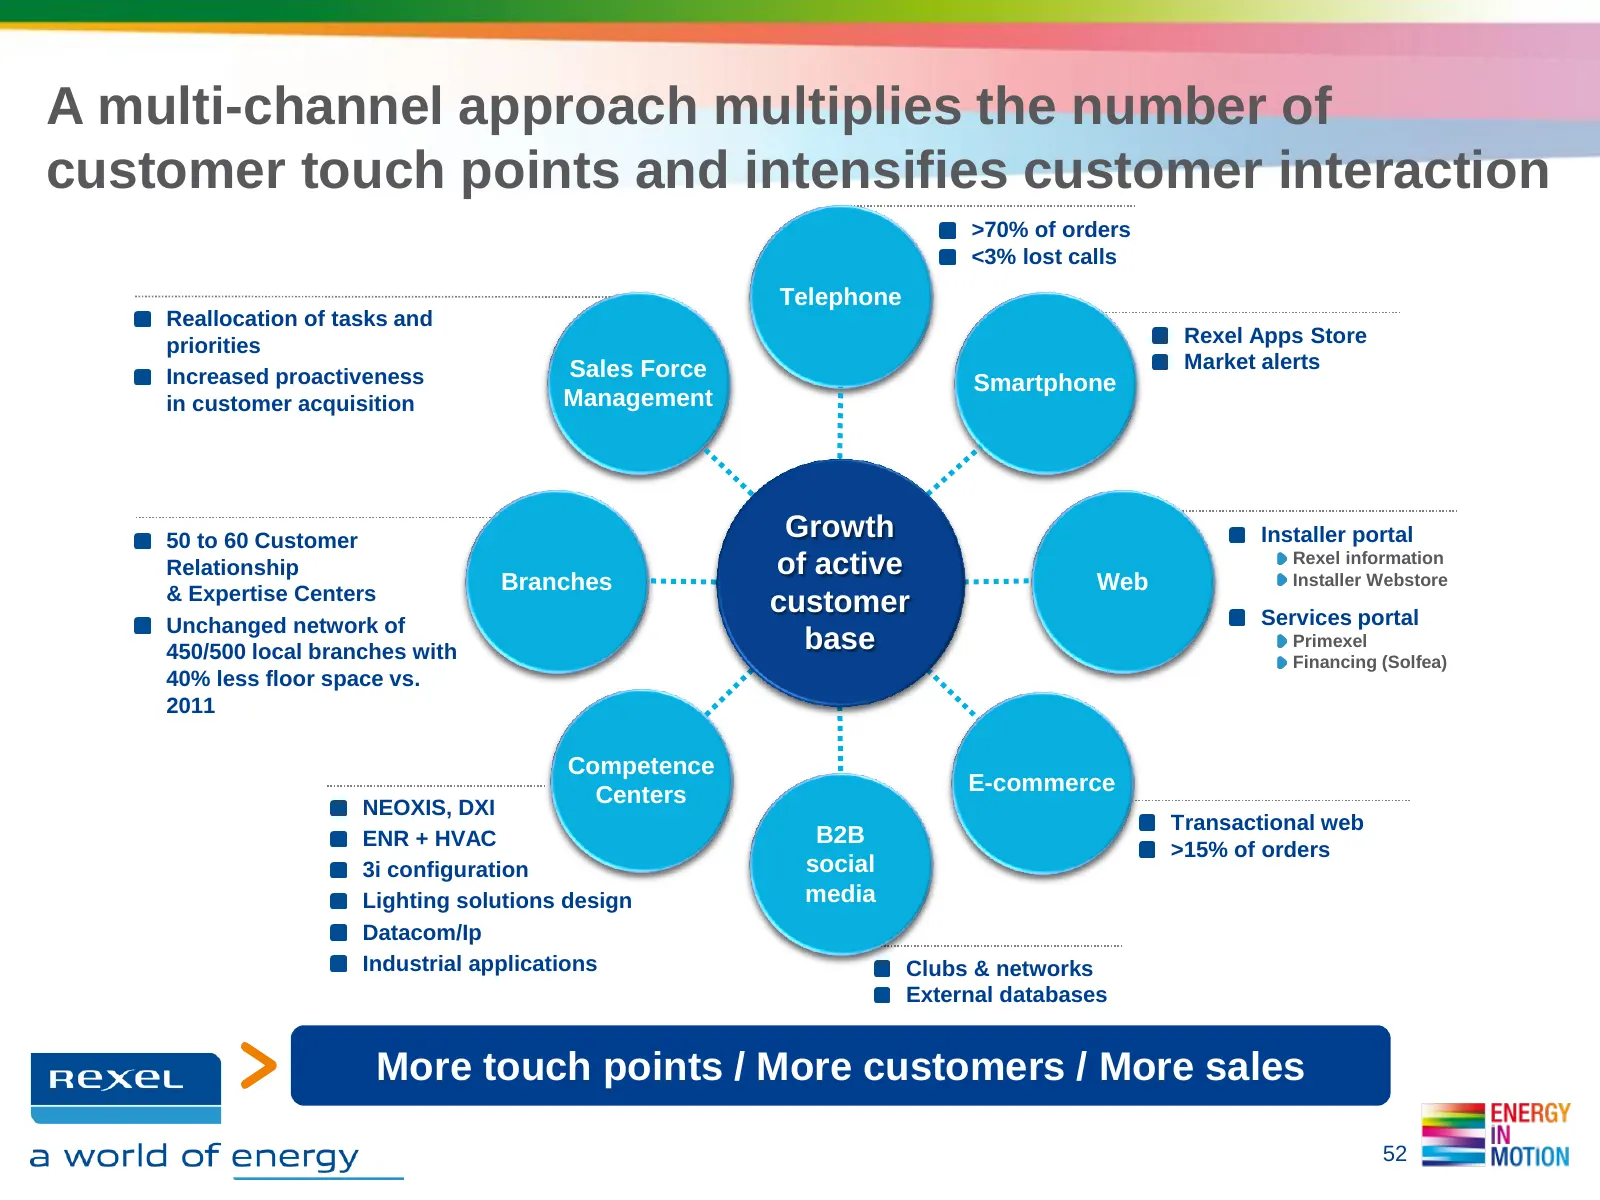
Slide 52: Multi-channel approach multiplies customer touch points
A multi-channel approach multiplies the number of customer touch points and intensifies customer interaction >70% of orders <3% lost calls Telephone Reallocation of tasks and priorities Rexel Apps Store Sales Force Market alerts Increased proactiveness Smartphone in customer acquisition Management 5
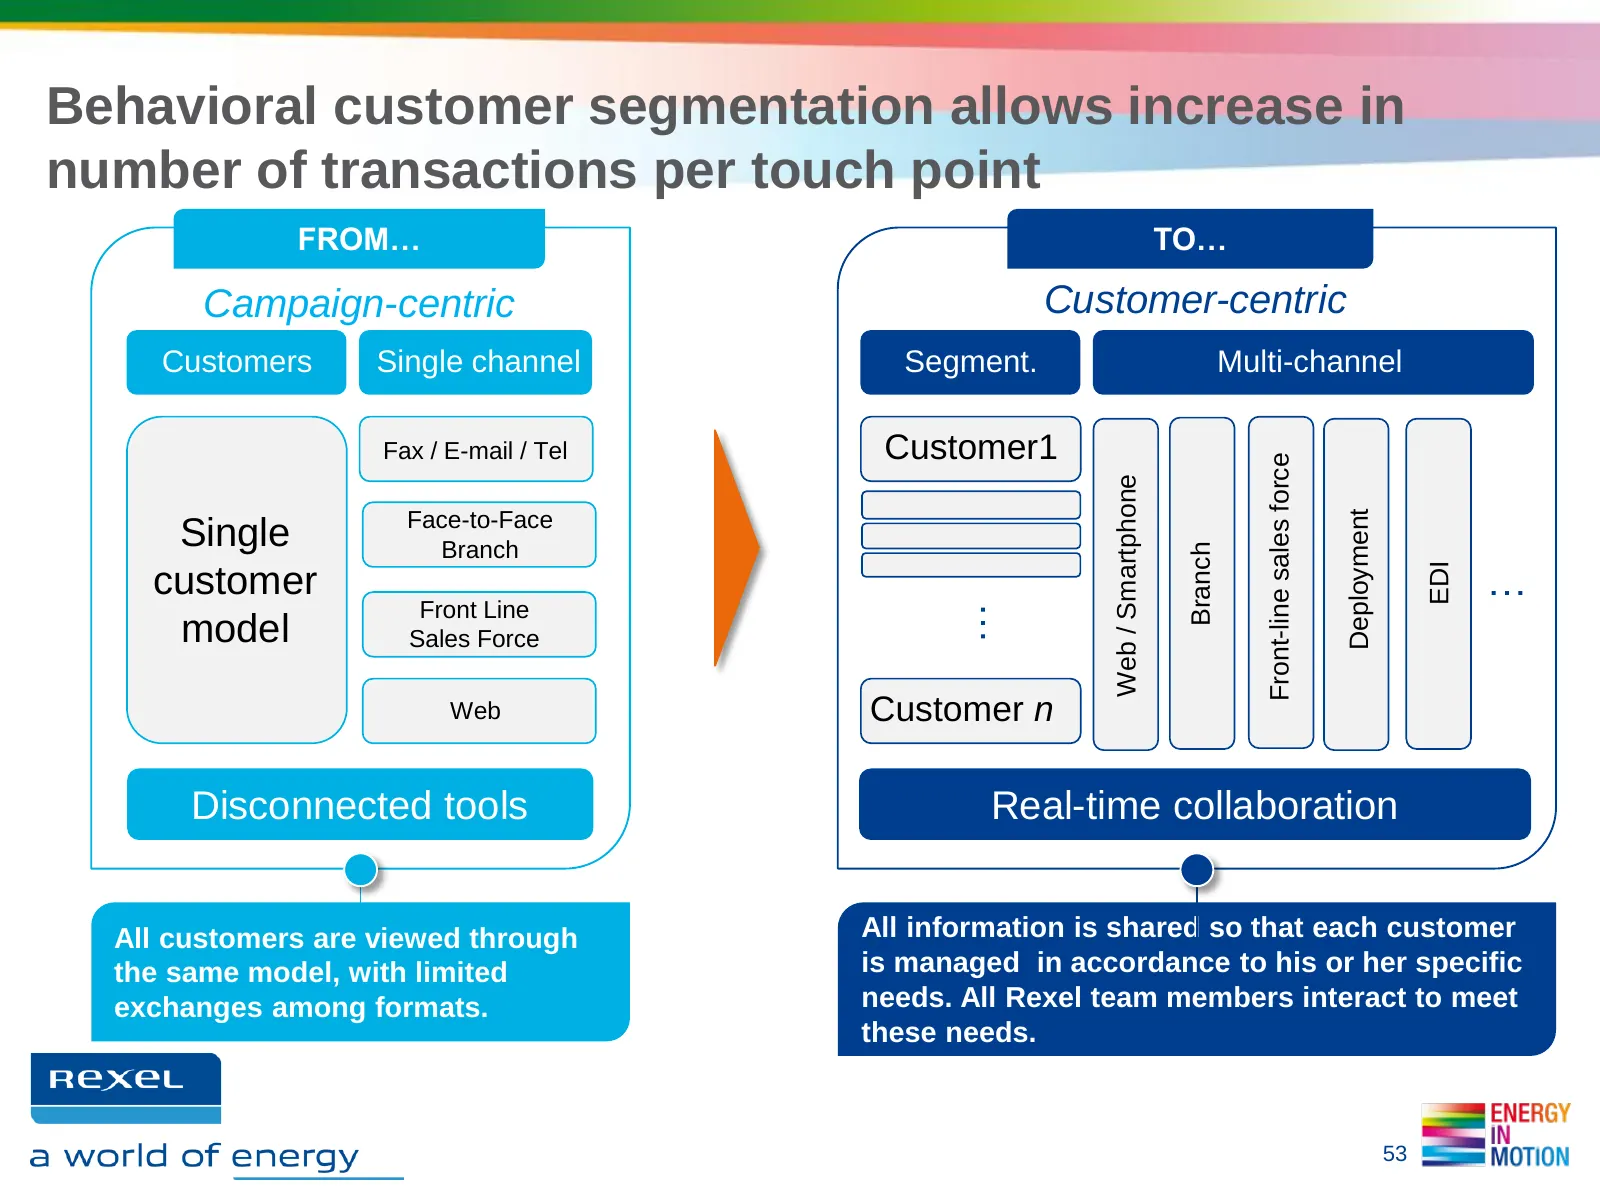
Slide 53: Behavioral customer segmentation
Behavioral customer segmentation allows increase in number of transactions per touch point FROM… TO… Campaign-centric Customer-centric Customers Single channel Segment. Multi-channel Fax / E-mail / Tel Customer1 Front-line sales force Web / Smartphone Deployment Face-to-Face Single Branch Branch … E
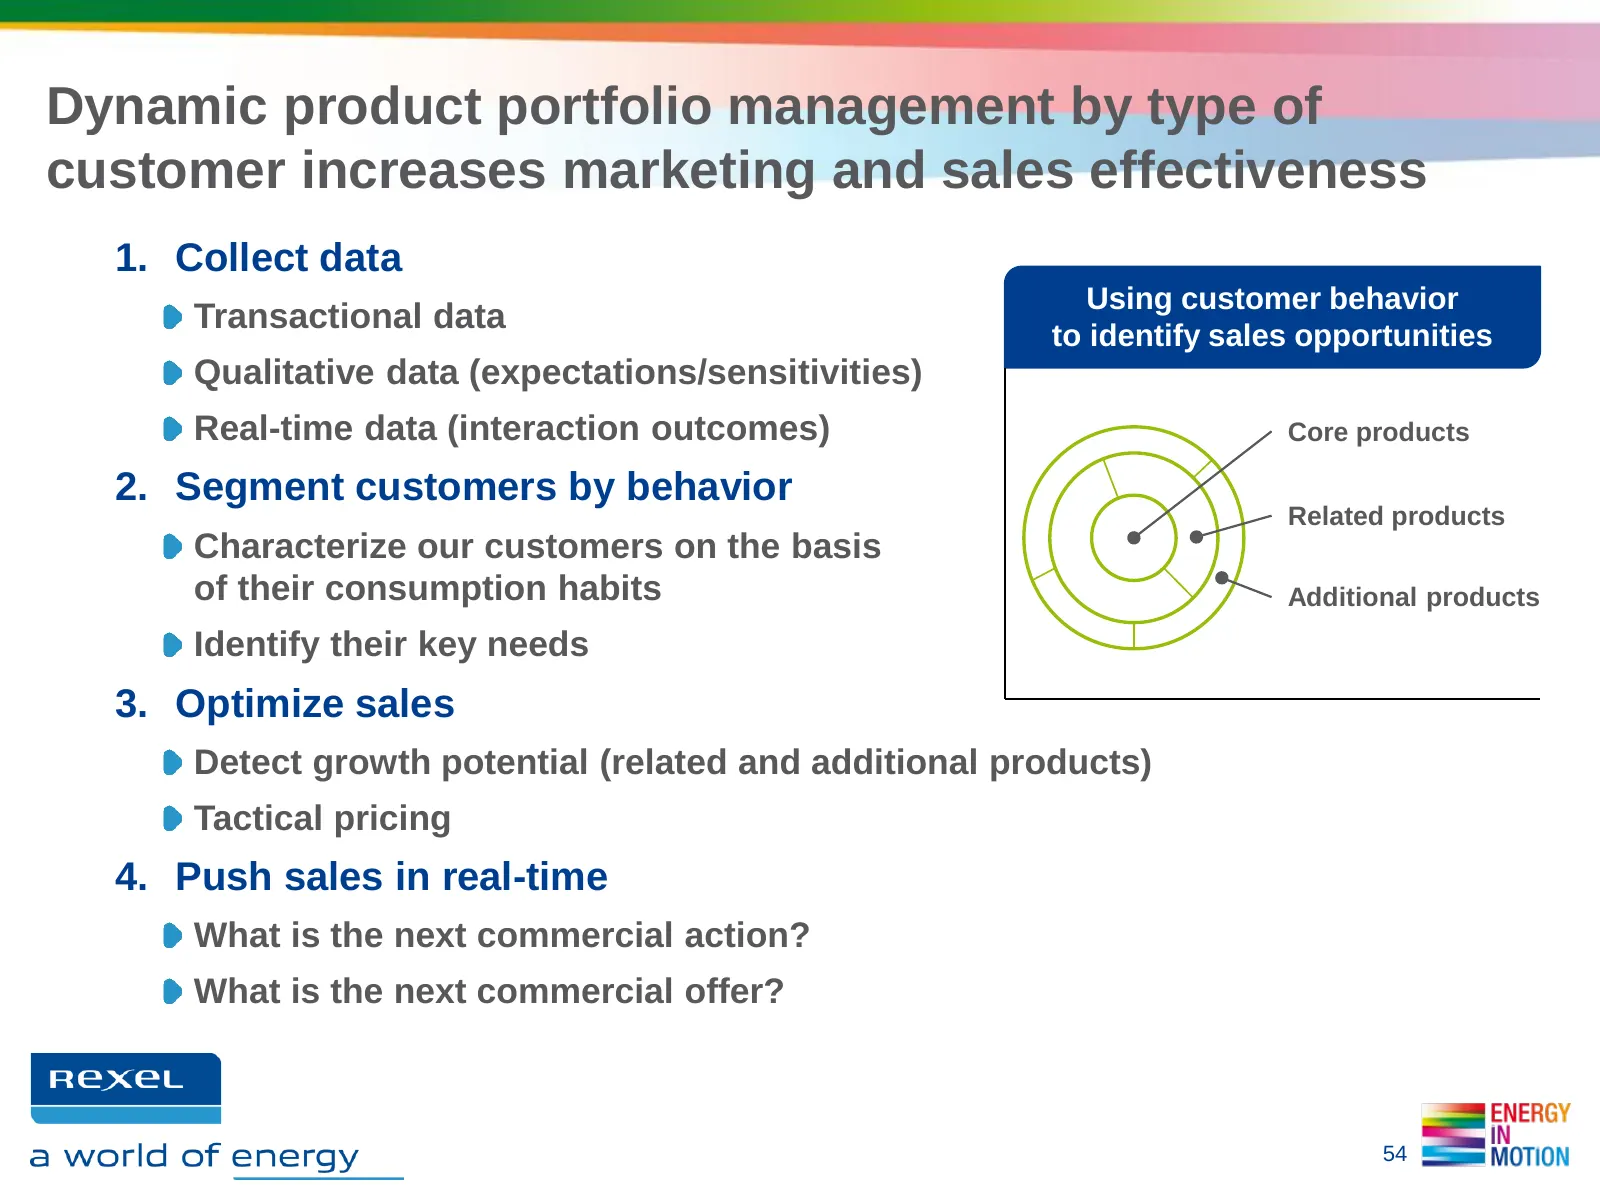
Slide 54: Dynamic product portfolio management by customer type
Dynamic product portfolio management by type of customer increases marketing and sales effectiveness 1. Collect data Using customer behavior Transactional data to identify sales opportunities Qualitative data (expectations/sensitivities) Real-time data (interaction outcomes) Core products 2. Segment
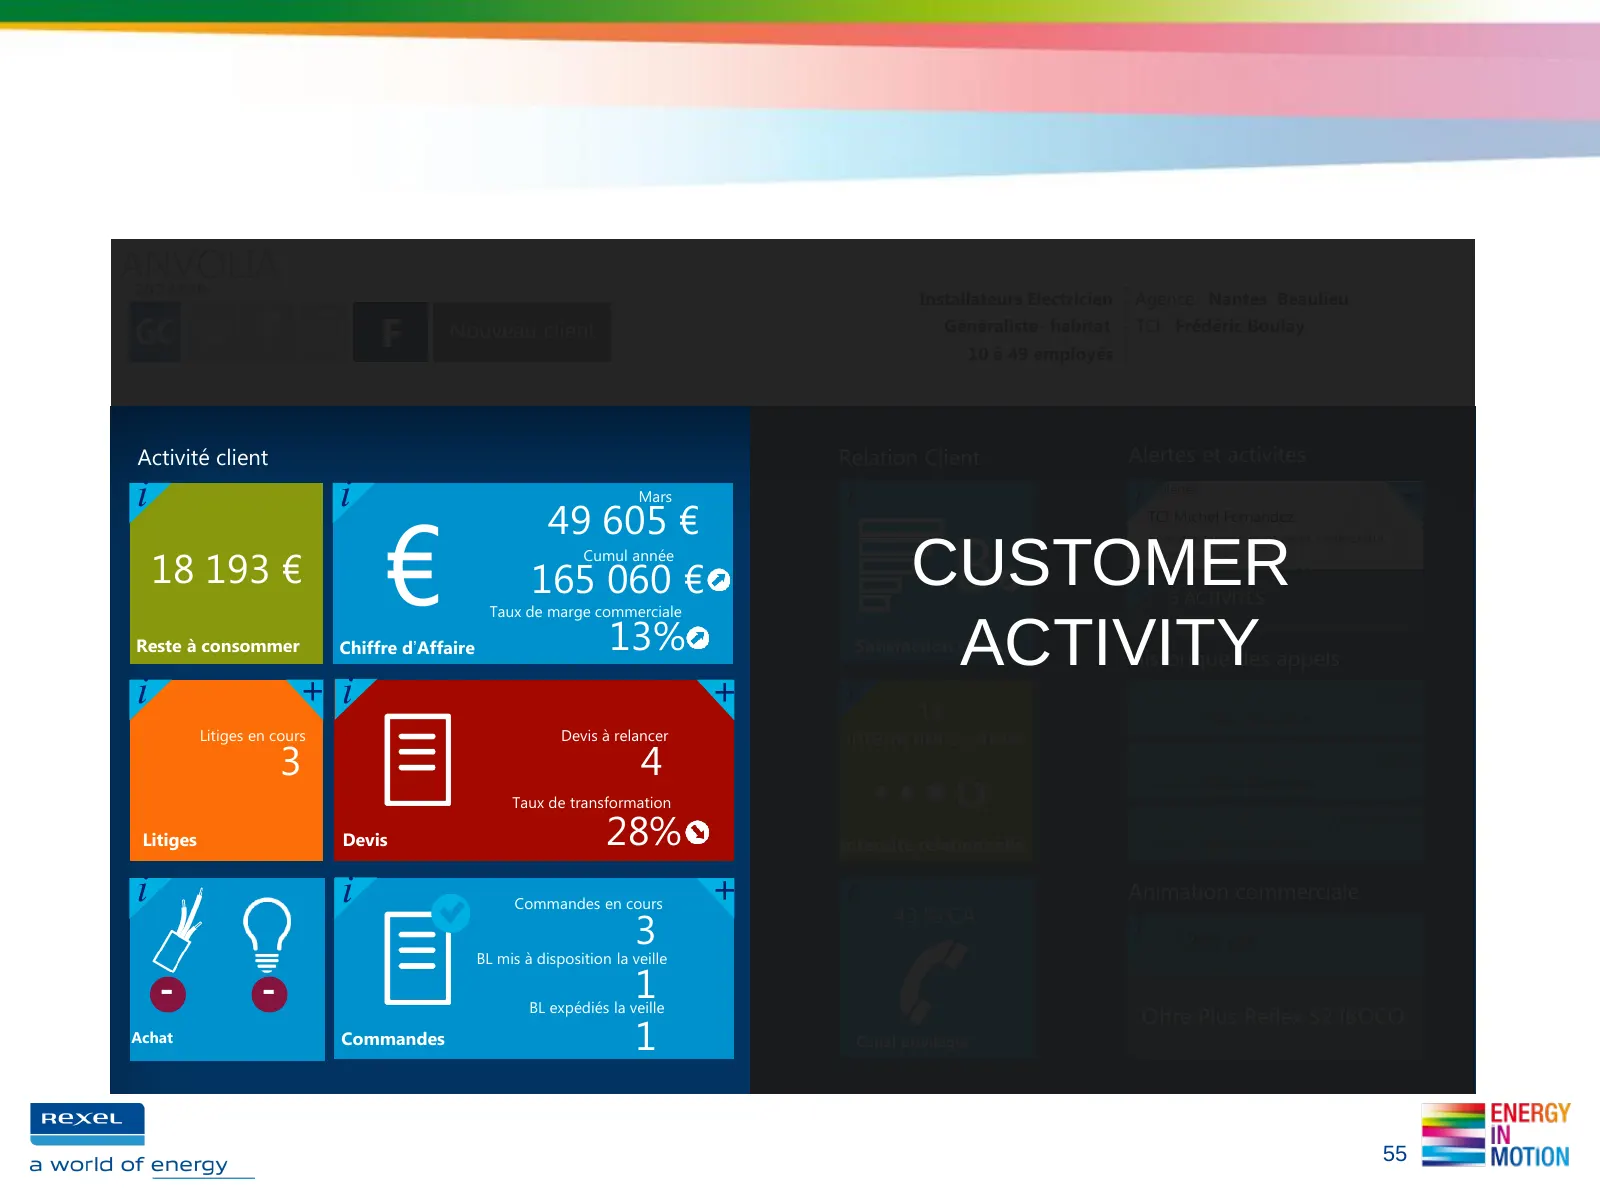
Slide 55: CRM tool: customer activity
ANVOLIA 2023298 Installateurs Electricien Agence : Nantes Beaulieu F Nouveau client Généraliste- habitat 10 à 49 employés TCI : Frédéric Boulay Activité client Relation Client Alertes et activités i i i i 3 alertes + € Mars 49 605 € TCI Michel Fernandez B Lorem ipsum dolor sit amet, consectetur 18 1
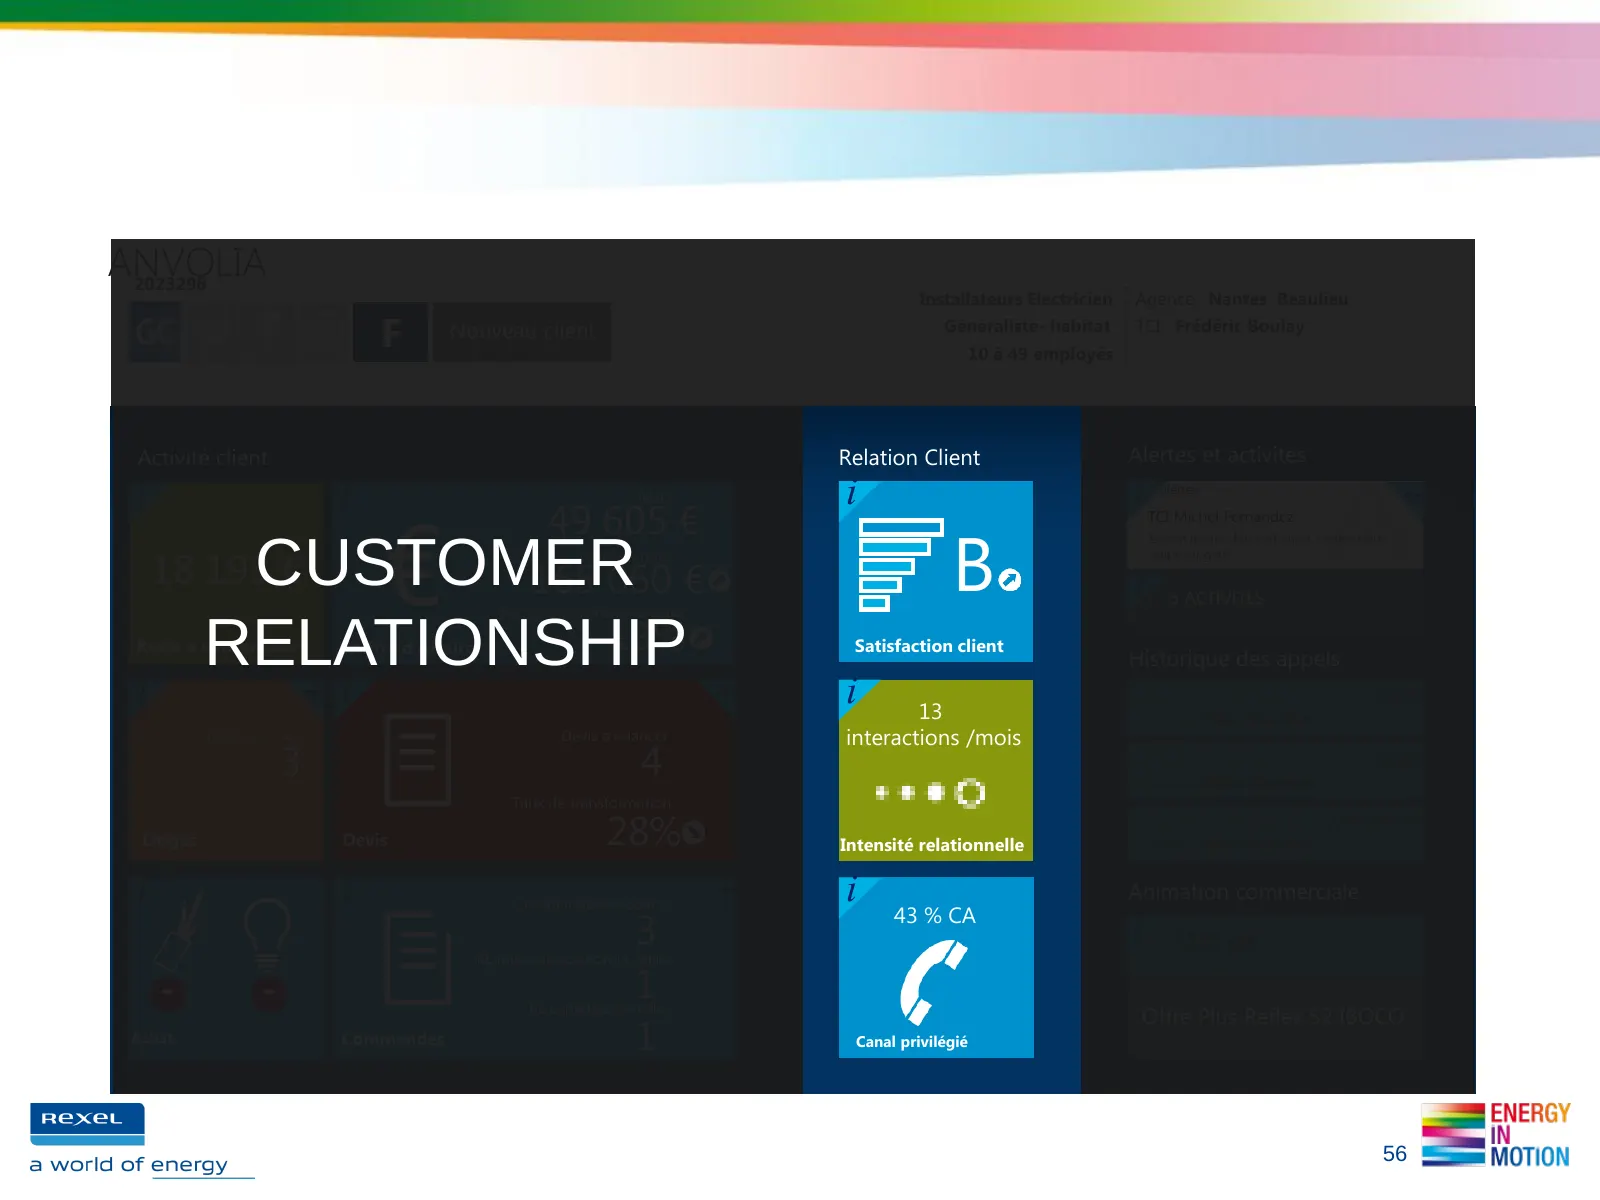
Slide 56: CRM tool: customer relationship
ANVOLIA 2023298 Installateurs Electricien Agence : Nantes Beaulieu F Nouveau client Généraliste- habitat 10 à 49 employés TCI : Frédéric Boulay Activité client Relation Client Alertes et activités i i i i 3 alertes + € Mars 49 605 € TCI Michel Fernandez B Lorem ipsum dolor sit amet, consectetur 18 1
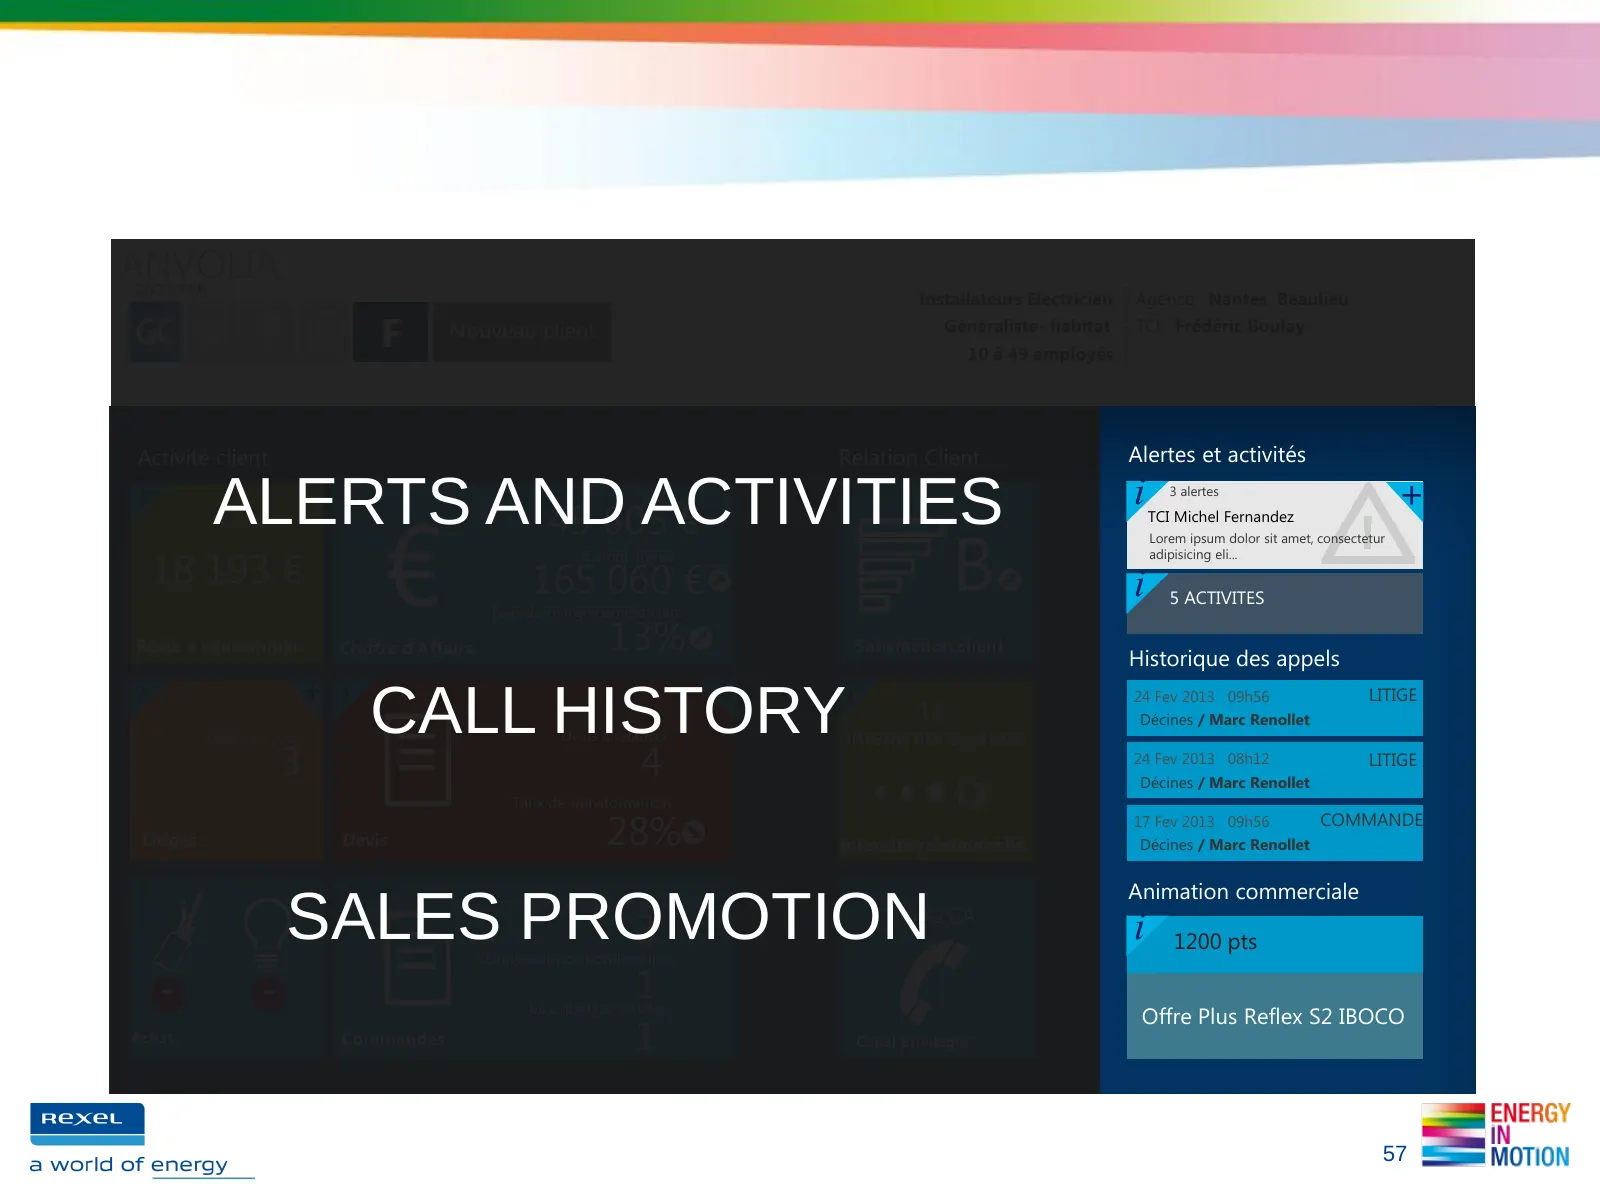
Slide 57: CRM tool: alerts and activities
ANVOLIA 2023298 Installateurs Electricien Agence : Nantes Beaulieu F Nouveau client Généraliste- habitat 10 à 49 employés TCI : Frédéric Boulay Activité client Relation Client Alertes et activités i i ALERTS AND i ACTIVITIES i 3 alertes + € Mars 49 605 € TCI Michel Fernandez B Lorem ipsum dolor sit
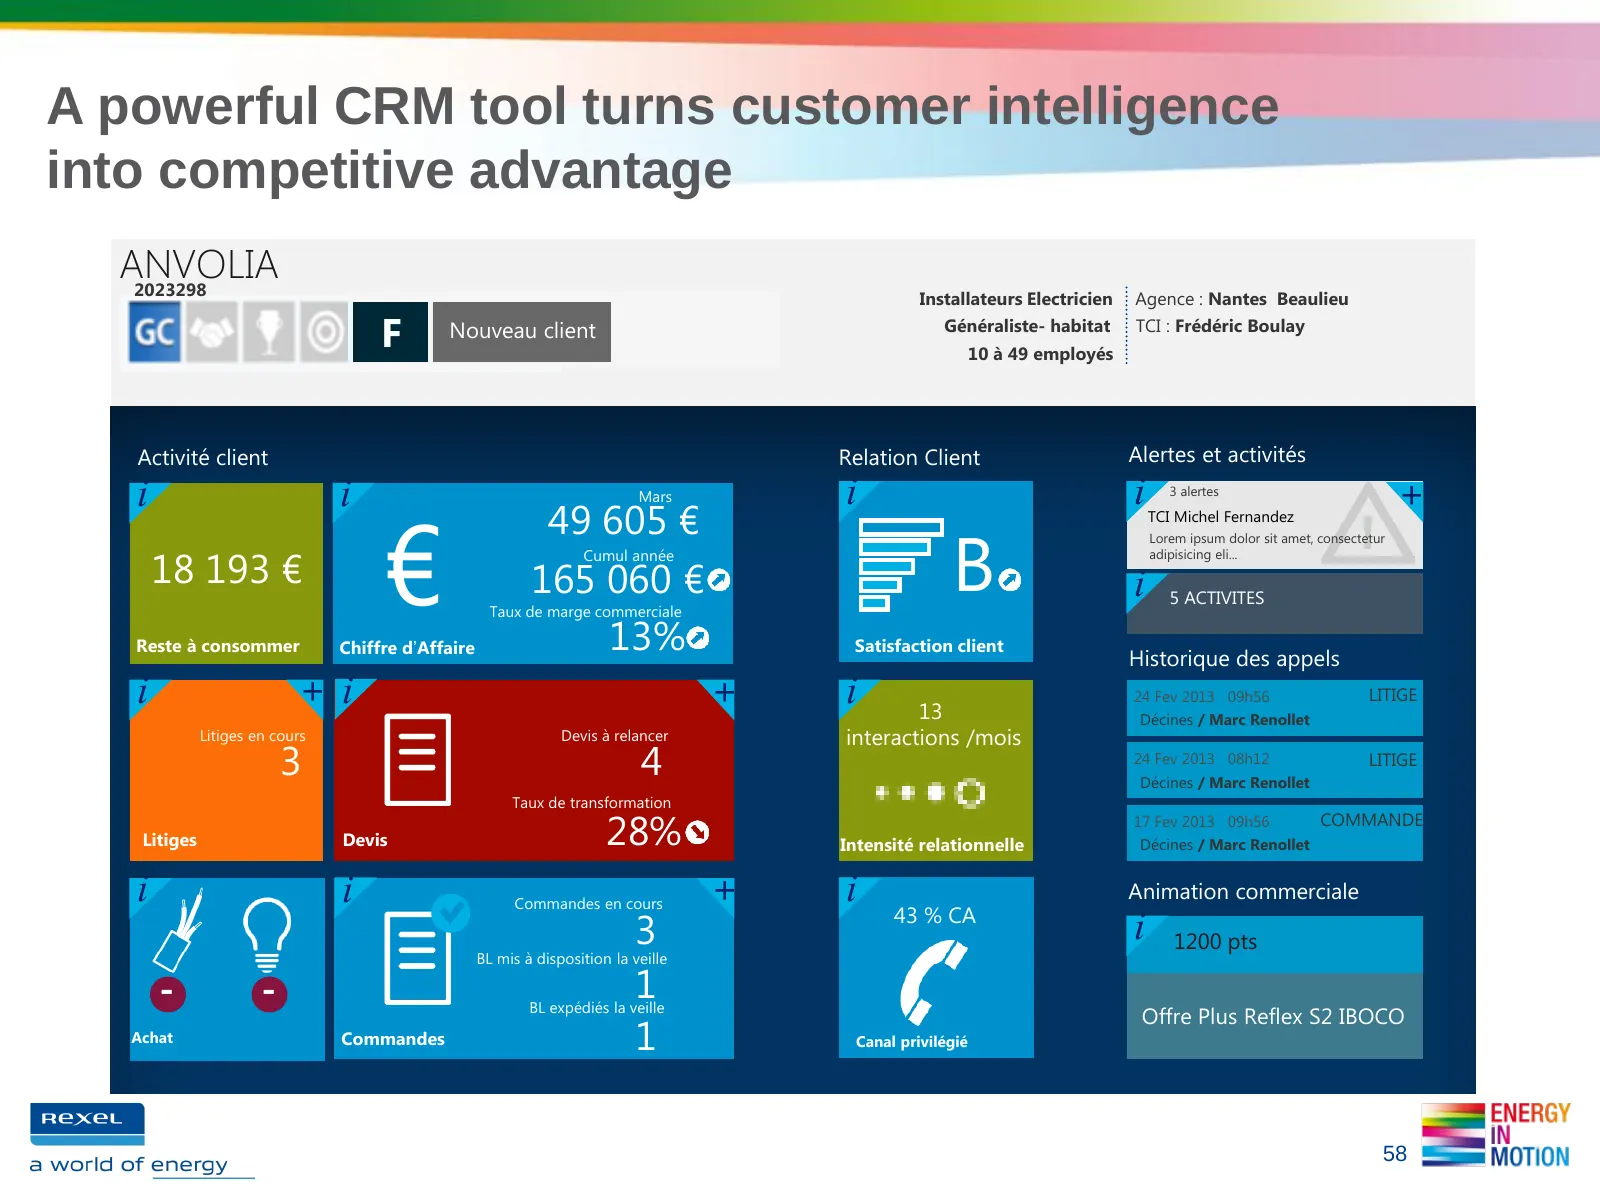
Slide 58: A powerful CRM tool turns customer intelligence into advantage
A powerful CRM tool turns customer intelligence into competitive advantage ANVOLIA 2023298 Installateurs Electricien Agence : Nantes Beaulieu F Nouveau client Généraliste- habitat 10 à 49 employés TCI : Frédéric Boulay Activité client Relation Client Alertes et activités i i i i 3 alertes + € Mars 4
Slide 59: 2.3 Competitive differentiation through e-business
2.3. SALES INNOVATION AT WORK: COMPETITIVE DIFFERENTIATION THROUGH E-BUSINESS Example: Switzerland and Austria Michel KLEIN, Group Senior VP, Central & Eastern Europe
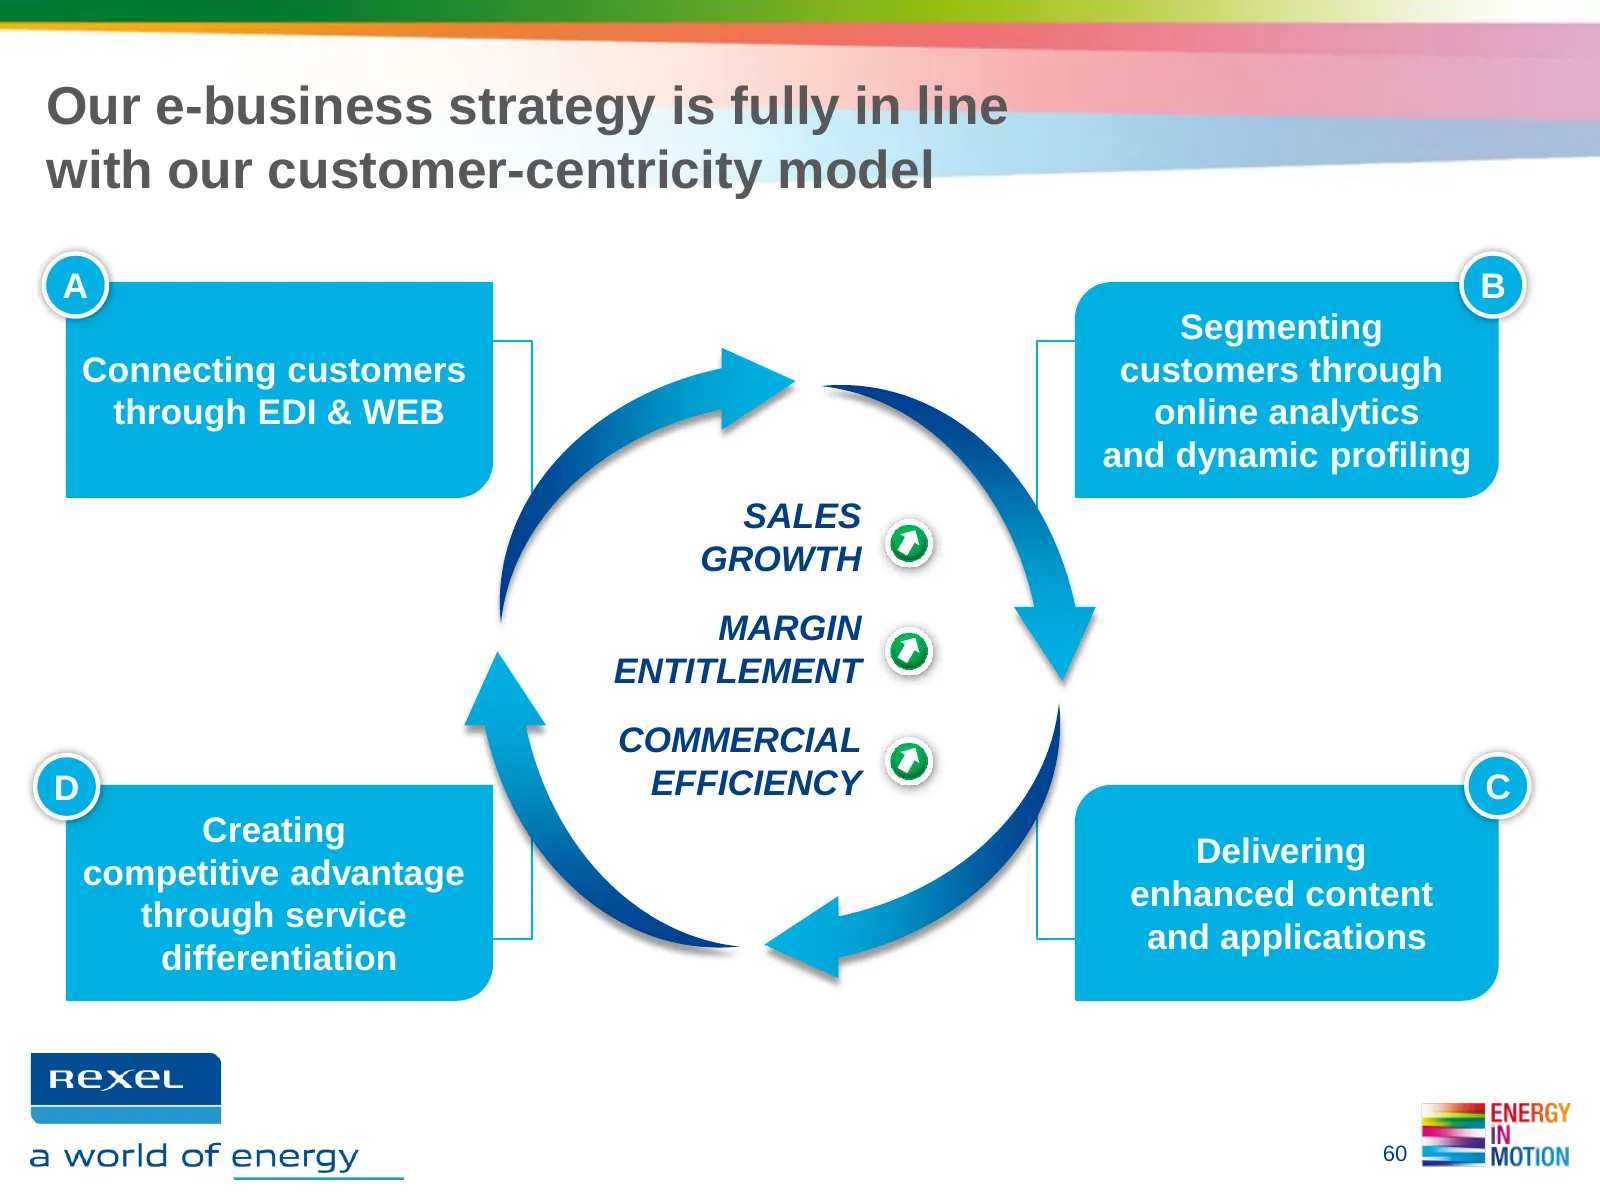
Slide 60: E-business strategy in line with customer-centricity model
Our e-business strategy is fully in line with our customer-centricity model A B Segmenting Connecting customers customers through through EDI & WEB online analytics and dynamic profiling SALES GROWTH MARGIN ENTITLEMENT COMMERCIAL D EFFICIENCY C Creating Delivering competitive advantage enhanced cont
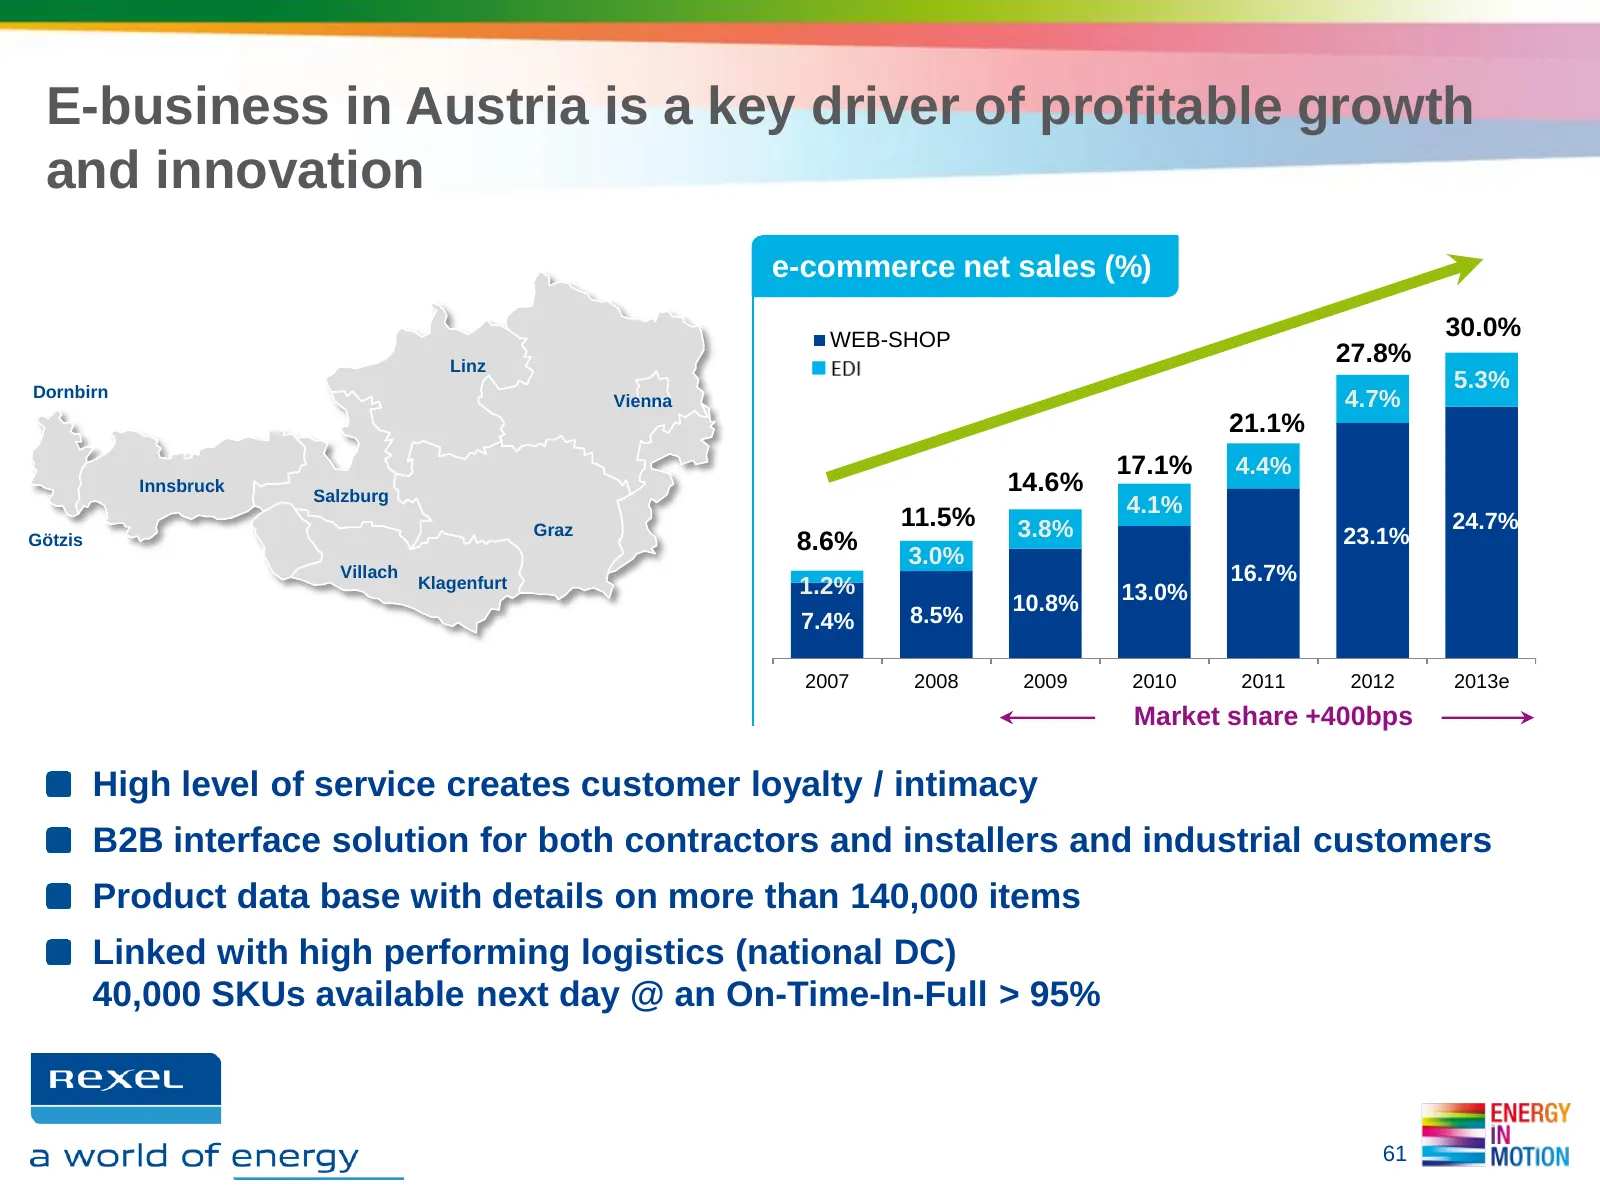
Slide 61: E-business in Austria drives profitable growth
E-business in Austria is a key driver of profitable growth and innovation e-commerce net sales (%) WEB-SHOP 30.0% Linz 27.8% Dornbirn 5.3% Vienna 4.7% 21.1% 17.1% 4.4% Innsbruck Salzburg 14.6% 4.1% Graz 11.5% 3.8% 24.7% Götzis 8.6% 23.1% 3.0% Villach Klagenfurt 16.7% 1.2% 13.0% 8.5% 10.8% 7.4% 2007
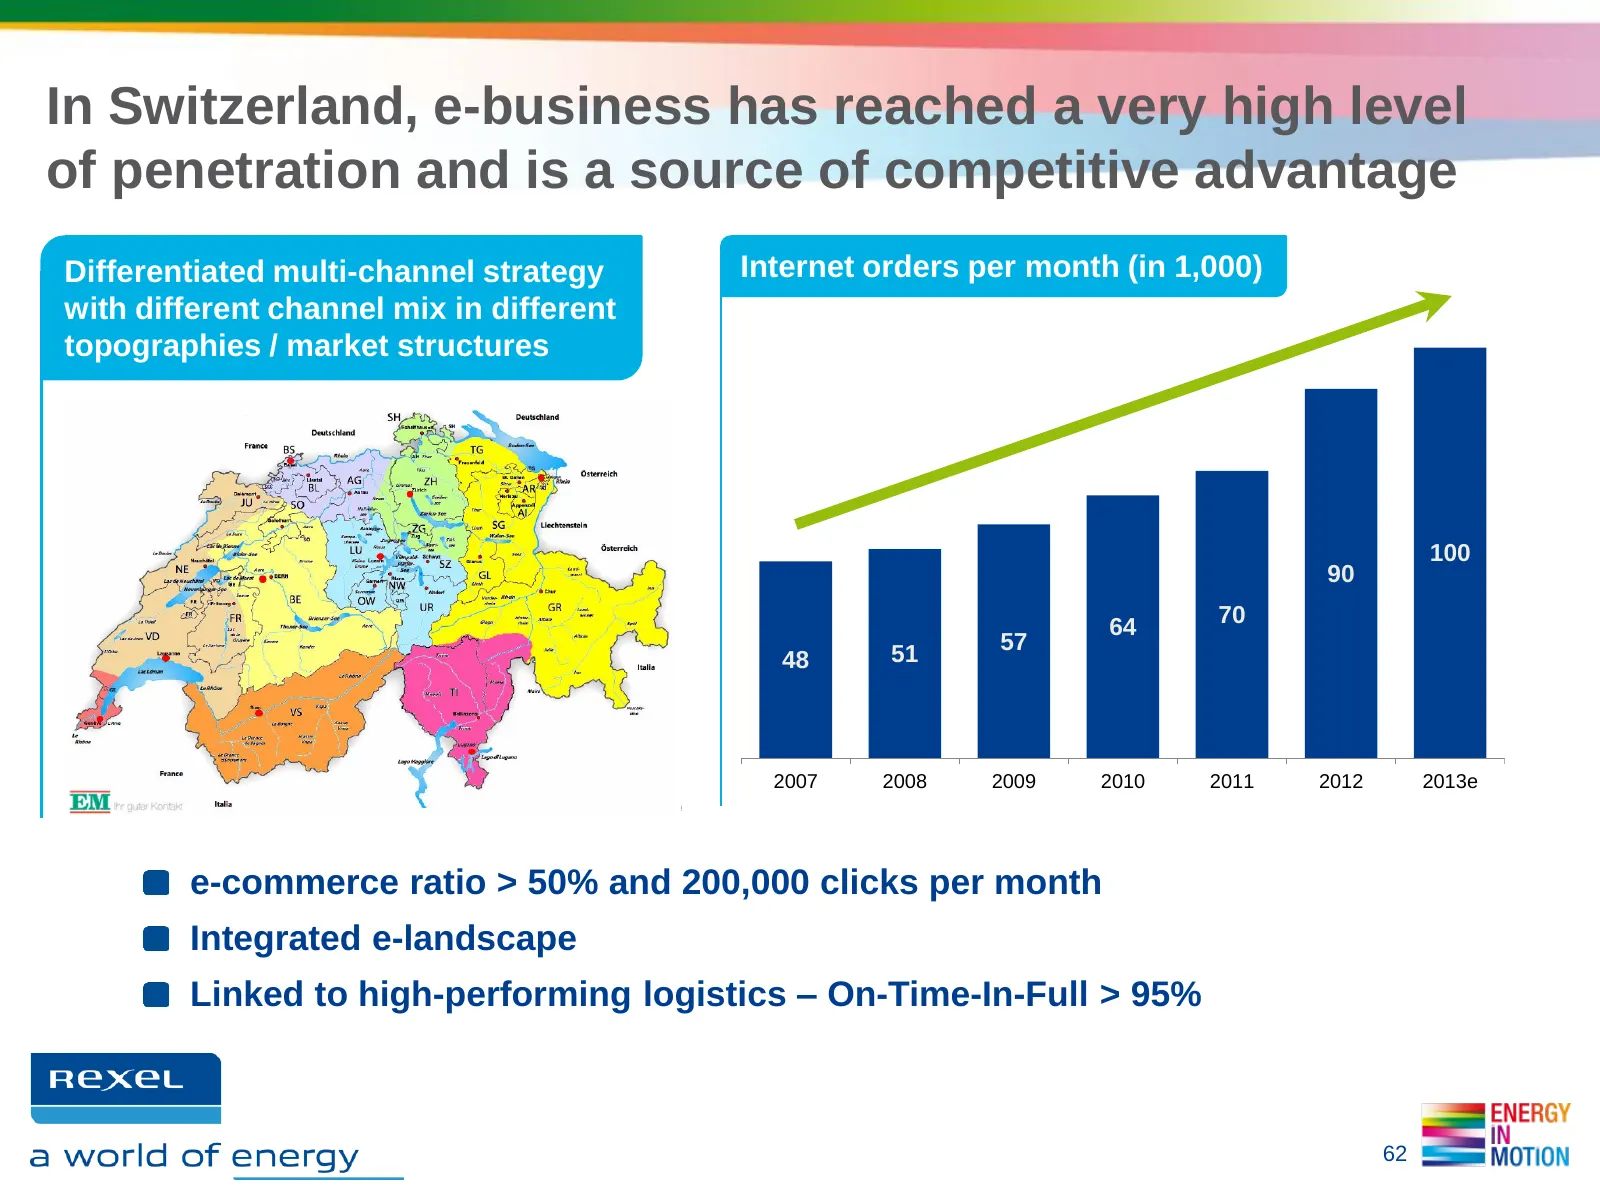
Slide 62: E-business in Switzerland a source of competitive advantage
In Switzerland, e-business has reached a very high level of penetration and is a source of competitive advantage Differentiated multi-channel strategy Internet orders per month (in 1,000) with different channel mix in different topographies / market structures 100 90 70 64 57 48 51 2007 2008 2009 20
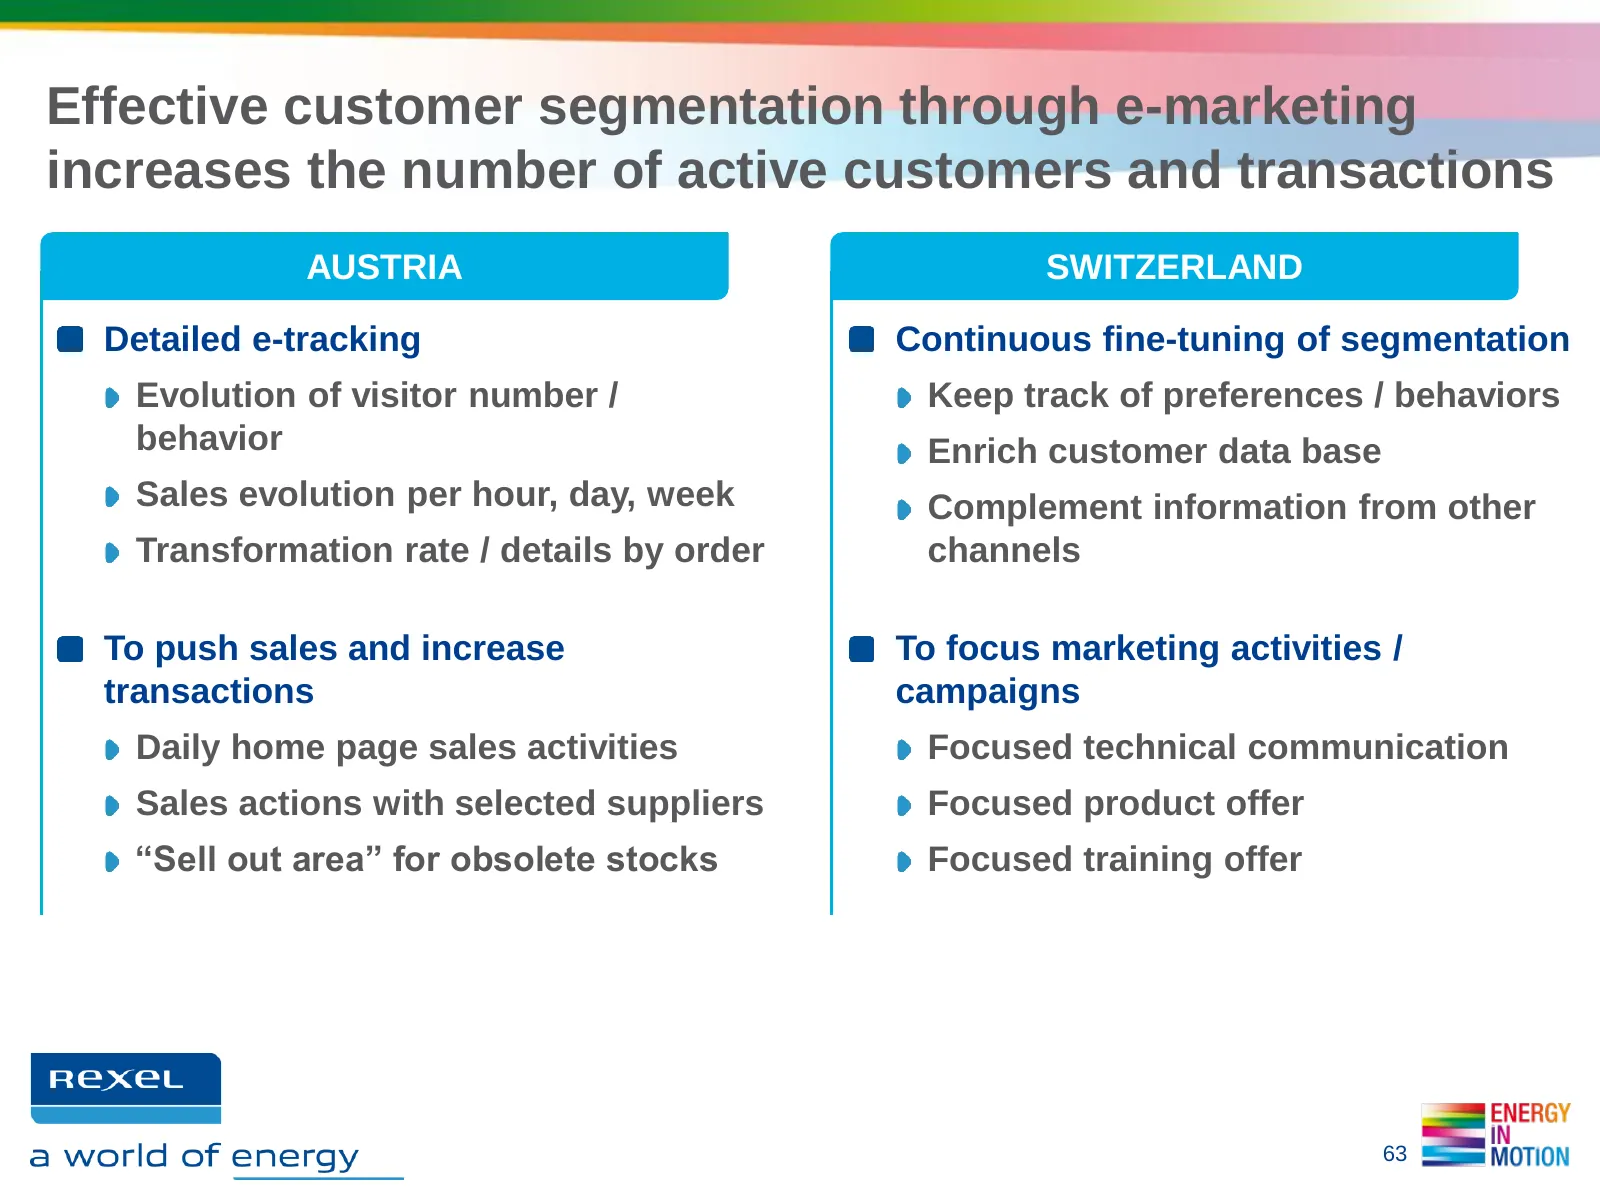
Slide 63: Effective customer segmentation through e-marketing
Effective customer segmentation through e-marketing increases the number of active customers and transactions AUSTRIA SWITZERLAND Detailed e-tracking Continuous fine-tuning of segmentation Evolution of visitor number / Keep track of preferences / behaviors behavior Enrich customer data base Sales ev
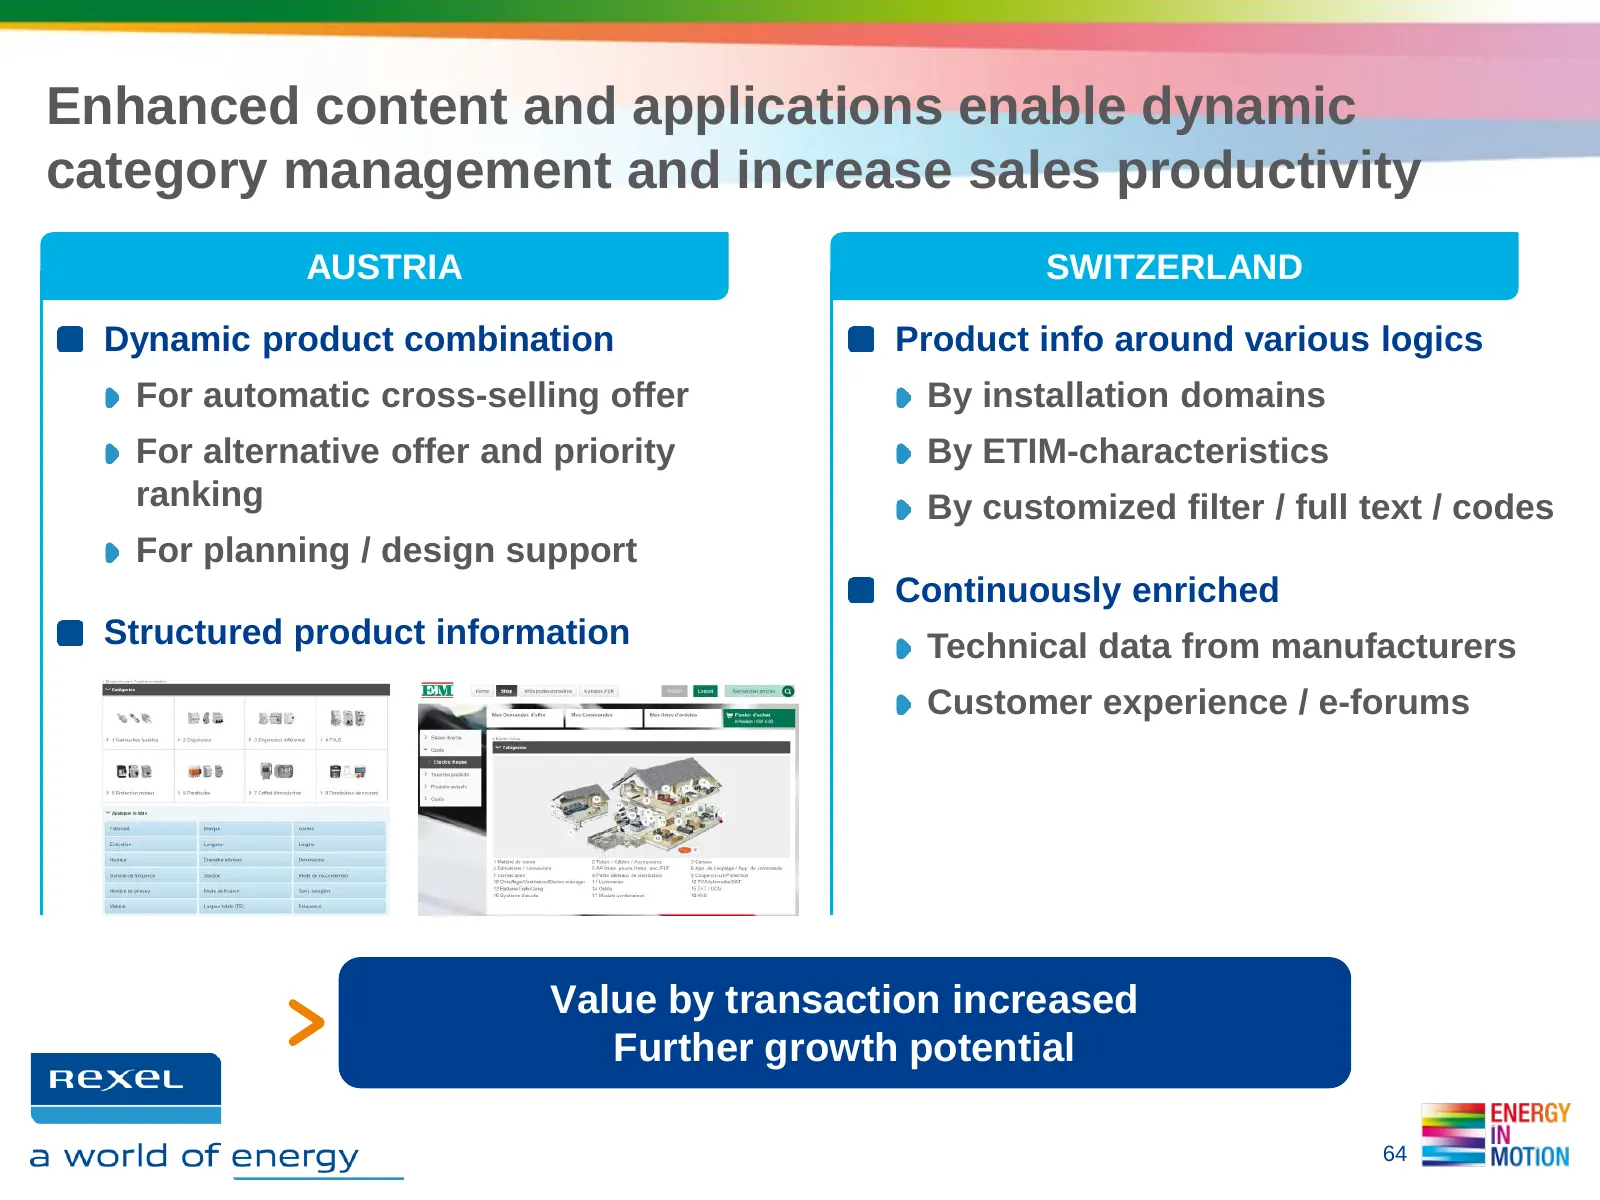
Slide 64: Enhanced content and applications enable category management
Enhanced content and applications enable dynamic category management and increase sales productivity AUSTRIA SWITZERLAND Dynamic product combination Product info around various logics For automatic cross-selling offer By installation domains For alternative offer and priority By ETIM-characteristics
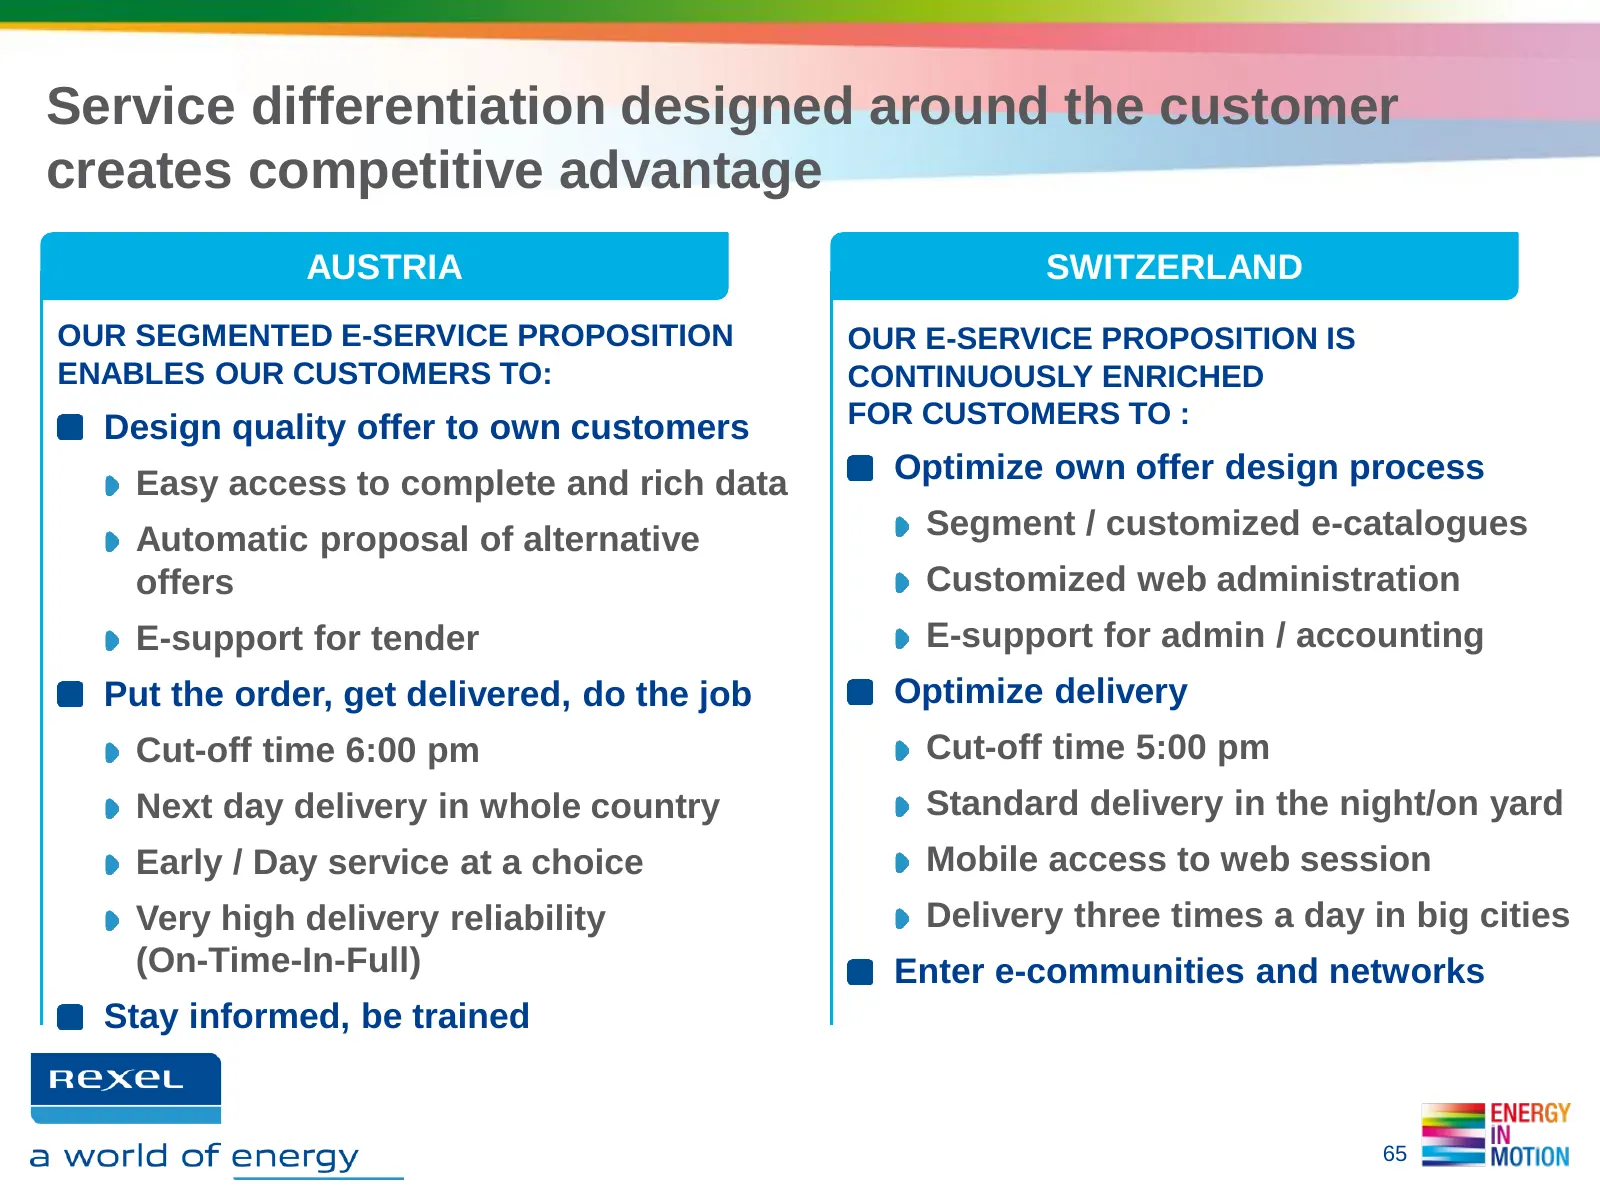
Slide 65: Service differentiation creates competitive advantage
Service differentiation designed around the customer creates competitive advantage AUSTRIA SWITZERLAND OUR SEGMENTED E-SERVICE PROPOSITION OUR E-SERVICE PROPOSITION IS ENABLES OUR CUSTOMERS TO: CONTINUOUSLY ENRICHED Design quality offer to own customers FOR CUSTOMERS TO : Easy access to complete and
Slide 66: 3. Boosting growth through targeted acquisitions
3. BOOSTING GROWTH THROUGH TARGETED ACQUISITIONS Rudy PROVOOST, Chairman of the Management Board and CEO
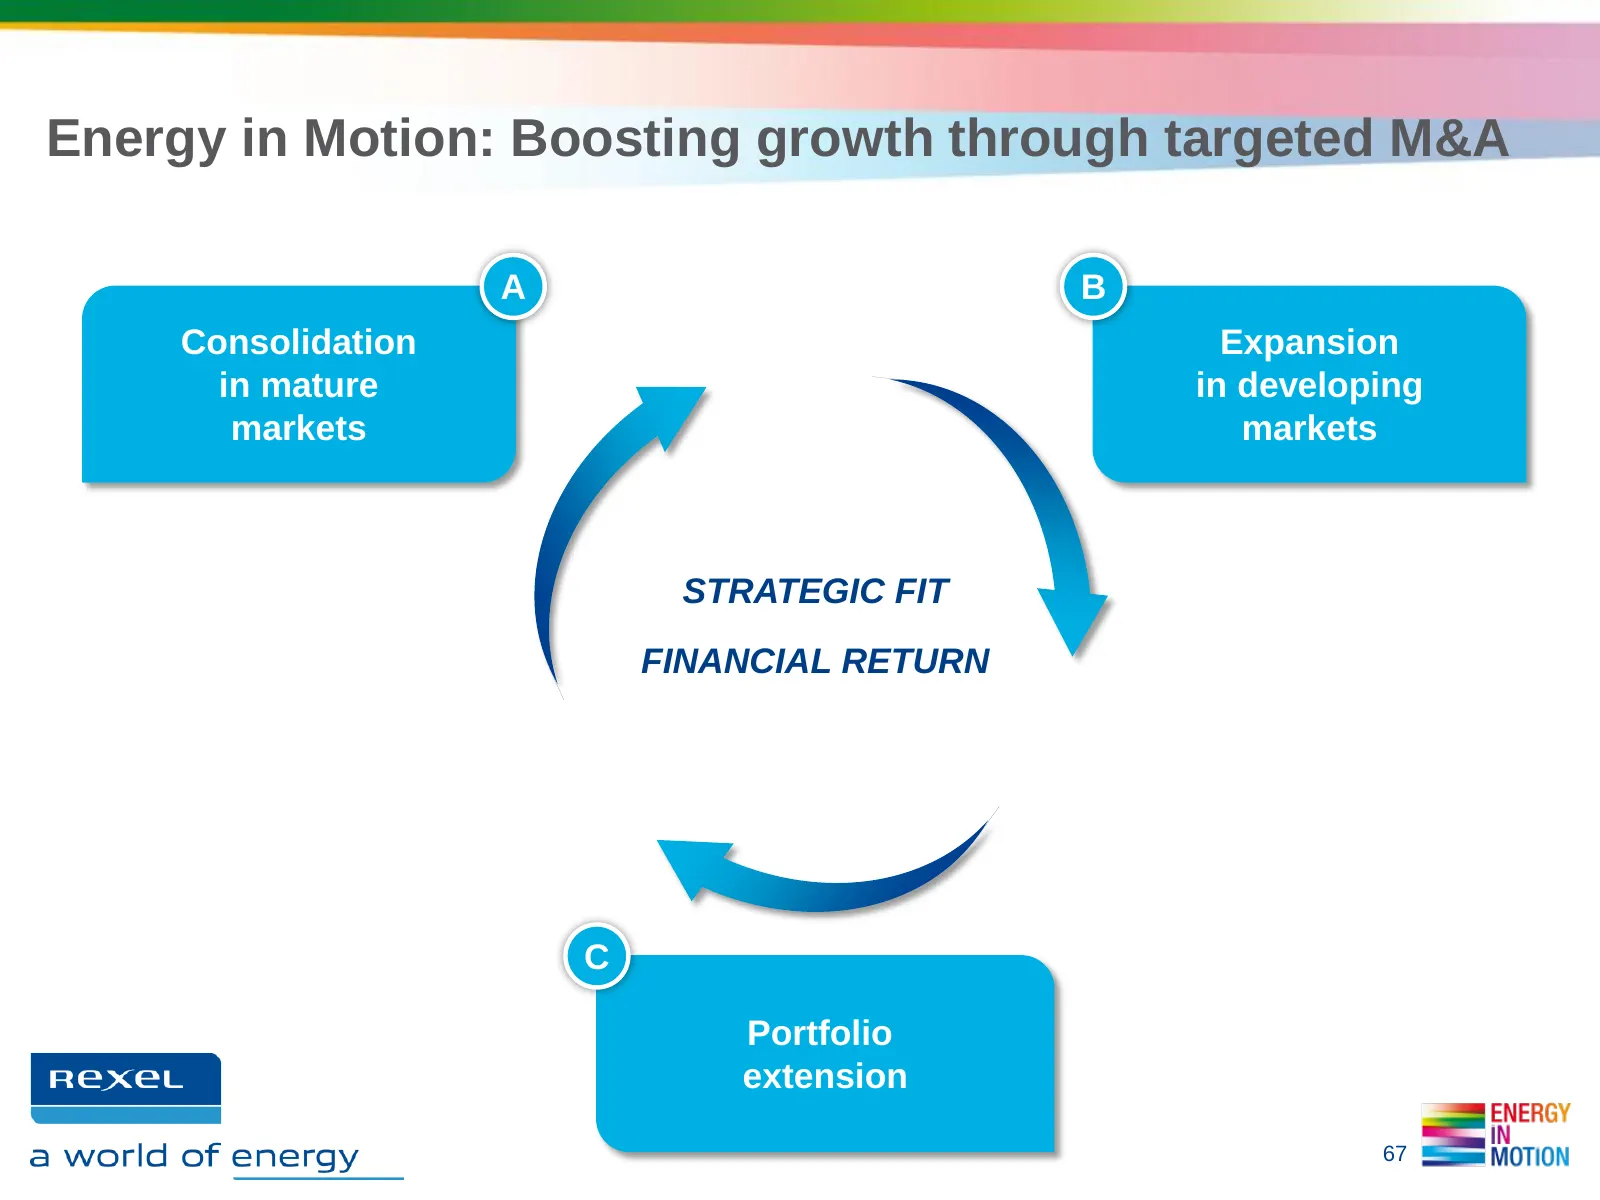
Slide 67: Energy in Motion: Boosting growth through targeted M&A
Energy in Motion: Boosting growth through targeted M&A A B Consolidation Expansion in mature in developing markets markets STRATEGIC FIT FINANCIAL RETURN C Portfolio extension 67
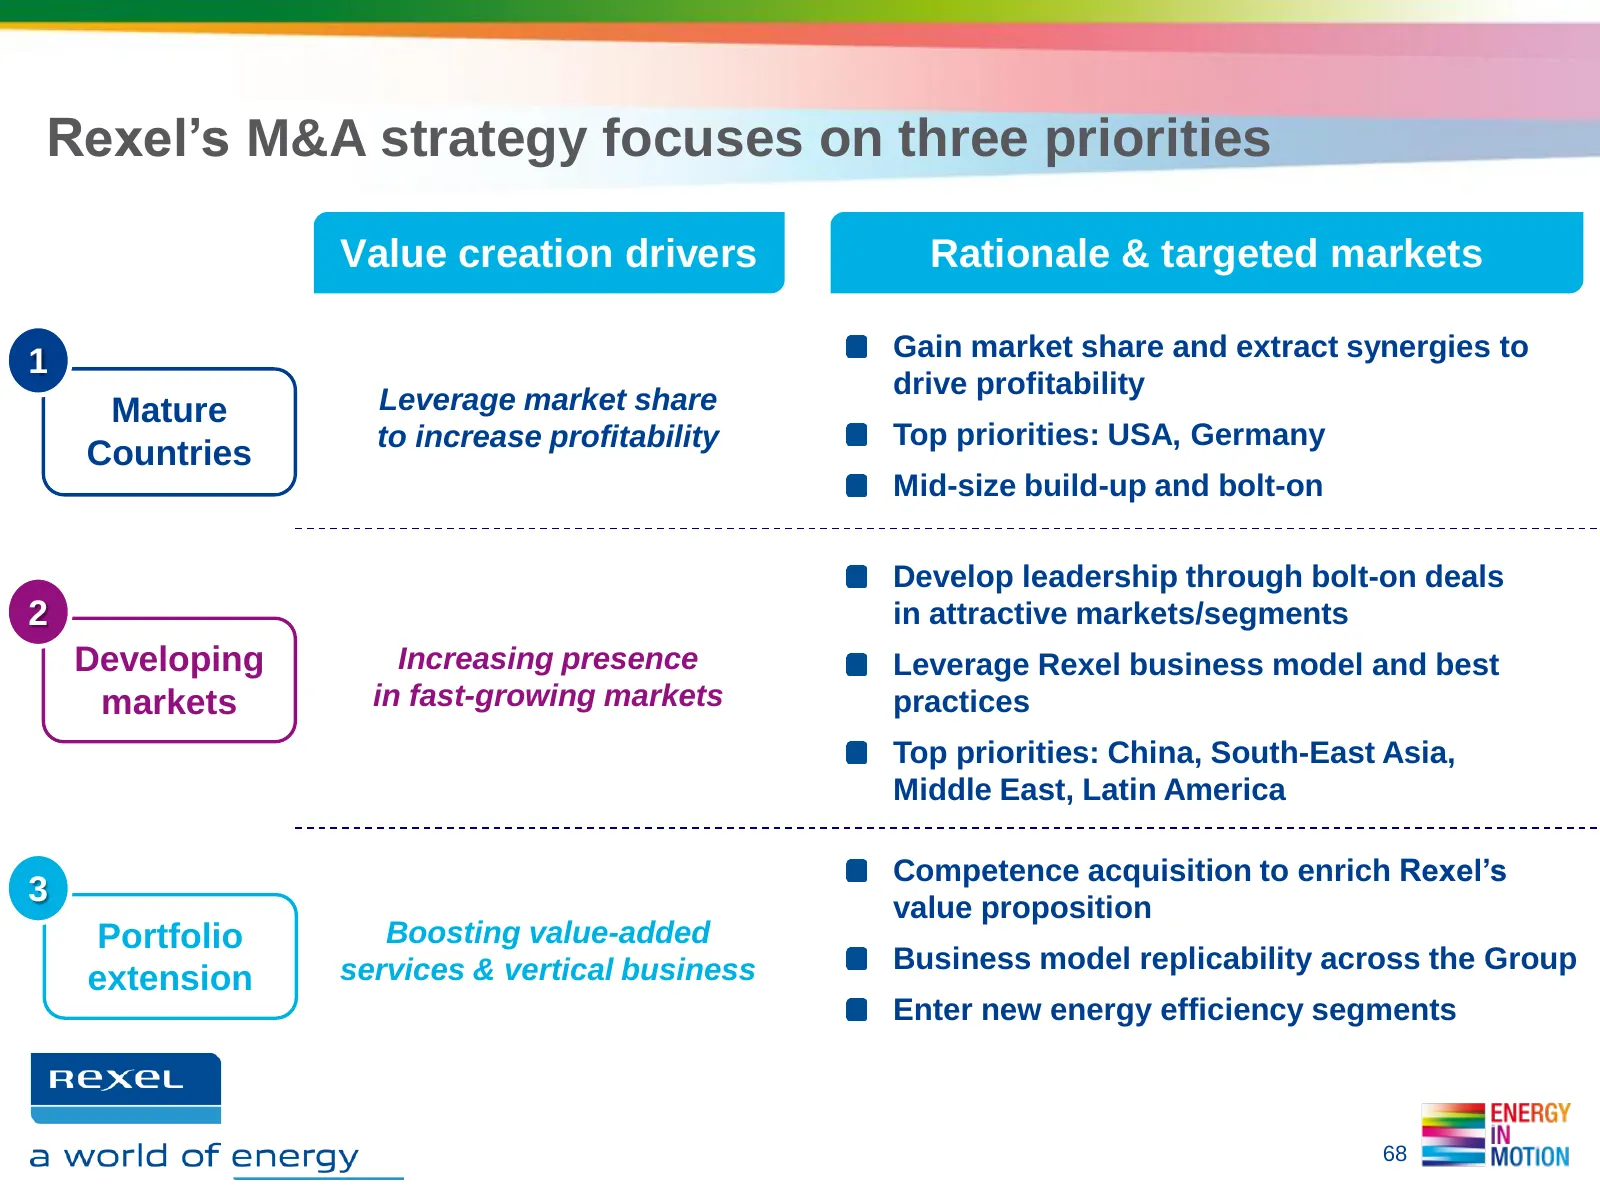
Slide 68: Rexel's M&A strategy focuses on three priorities
Rexel’s M&A strategy focuses on three priorities Value creation drivers Rationale & targeted markets Gain market share and extract synergies to 1 drive profitability Mature Leverage market share to increase profitability Top priorities: USA, Germany Countries Mid-size build-up and bolt-on Develop le
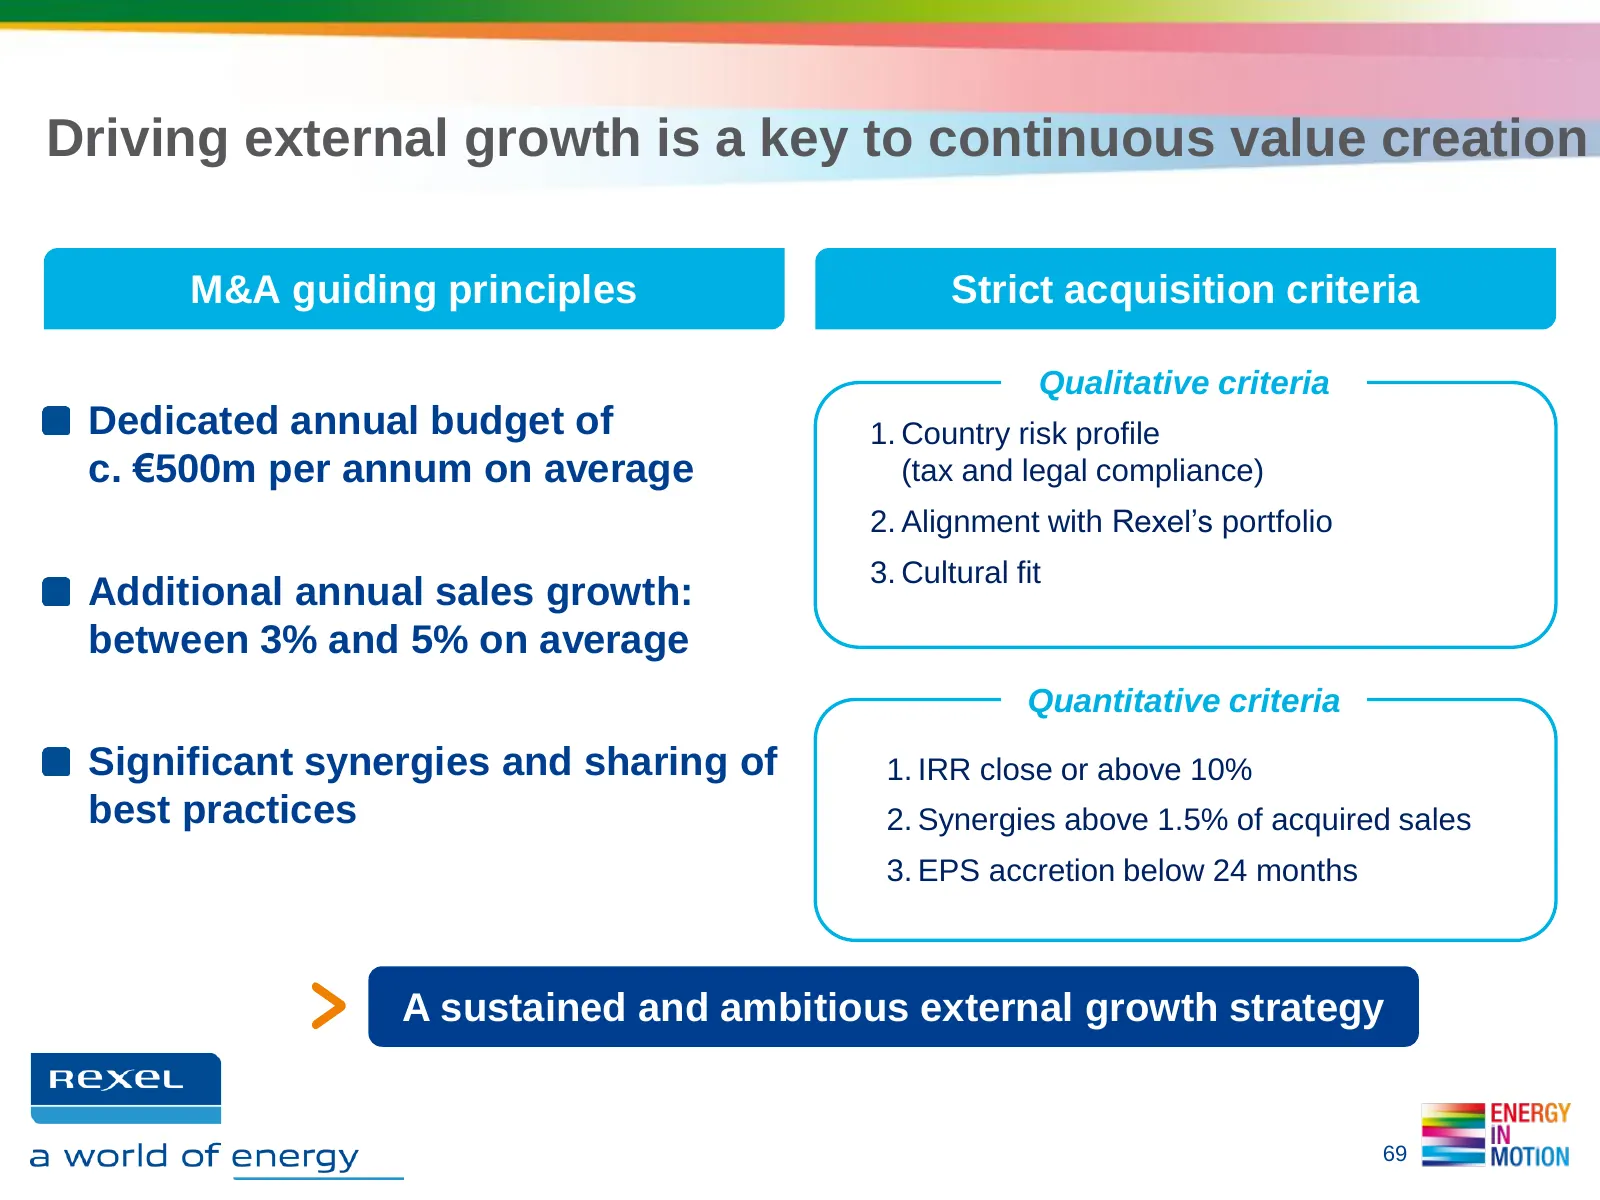
Slide 69: External growth: c. €500m per annum
Driving external growth is a key to continuous value creation M&A guiding principles Strict acquisition criteria Qualitative criteria Dedicated annual budget of 1. Country risk profile c. €500m per annum on average (tax and legal compliance) 2. Alignment with Rexel’s portfolio 3. Cultural fit Additi
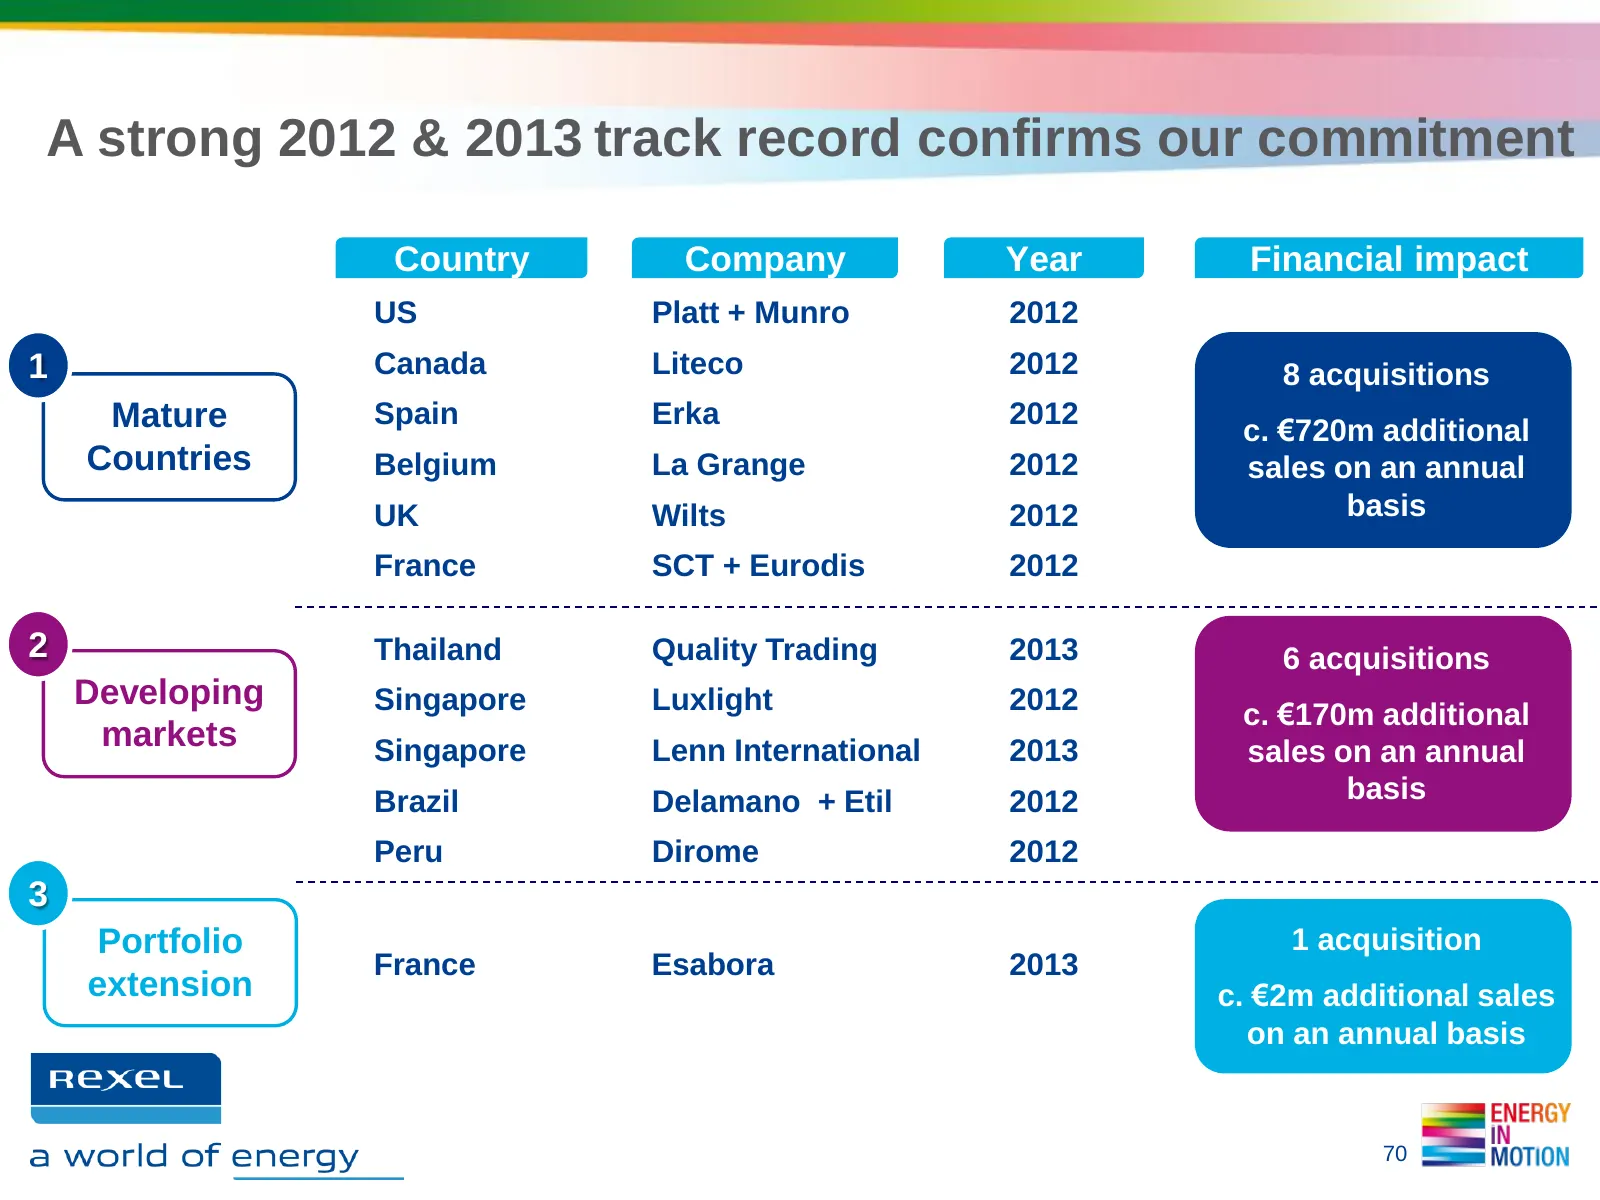
Slide 70: Strong 2012 & 2013 acquisition track record
A strong 2012 & 2013 track record confirms our commitment Country Company Year Financial impact US Platt + Munro 2012 1 Canada Liteco 2012 8 acquisitions Mature Spain Erka 2012 c. €720m additional Countries Belgium La Grange 2012 sales on an annual UK Wilts 2012 basis France SCT + Eurodis 2012 2 Tha
Slide 71: 3.1 New acquisitions
3.1. NEW ACQUISITIONS Rudy PROVOOST, Chairman of the Management Board and CEO
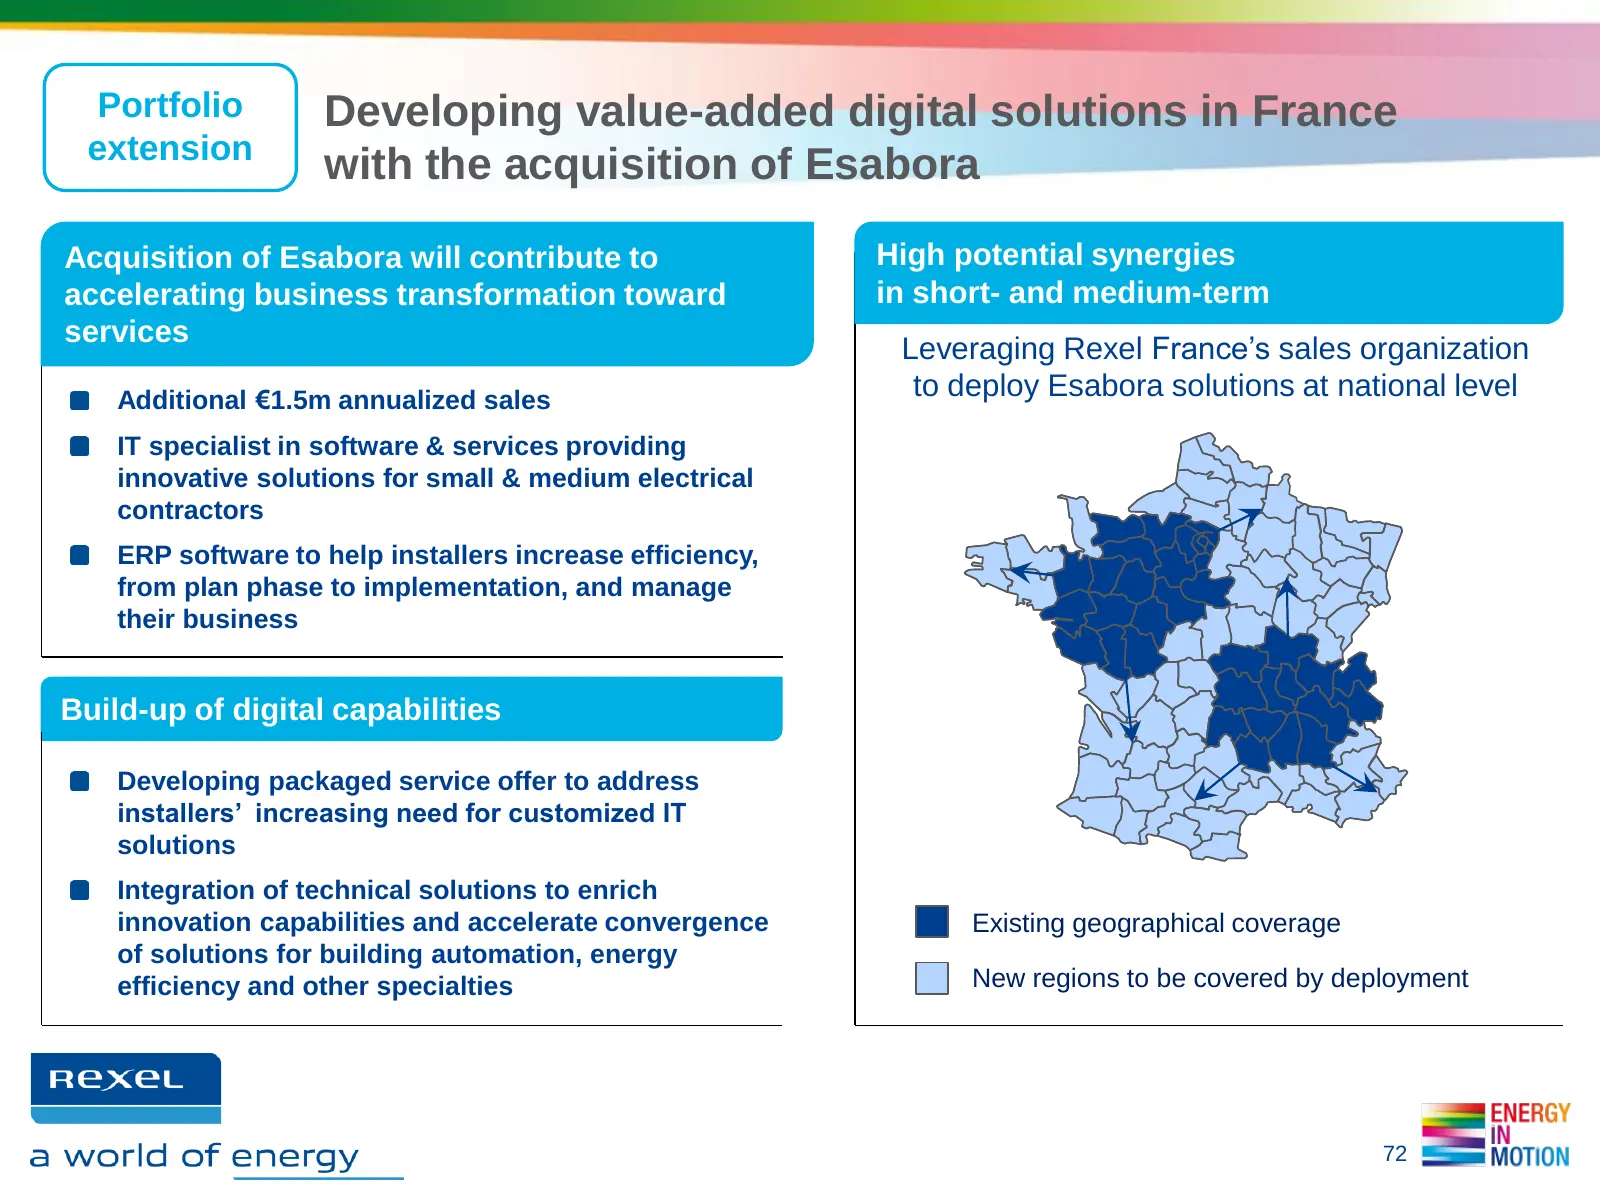
Slide 72: Acquisition of Esabora in France
Portfolio Developing value-added digital solutions in France extension with the acquisition of Esabora Acquisition of Esabora will contribute to High potential synergies accelerating business transformation toward in short- and medium-term services Leveraging Rexel France’s sales organization Additi
Slide 73: Entry into Thai market with Quality Trading
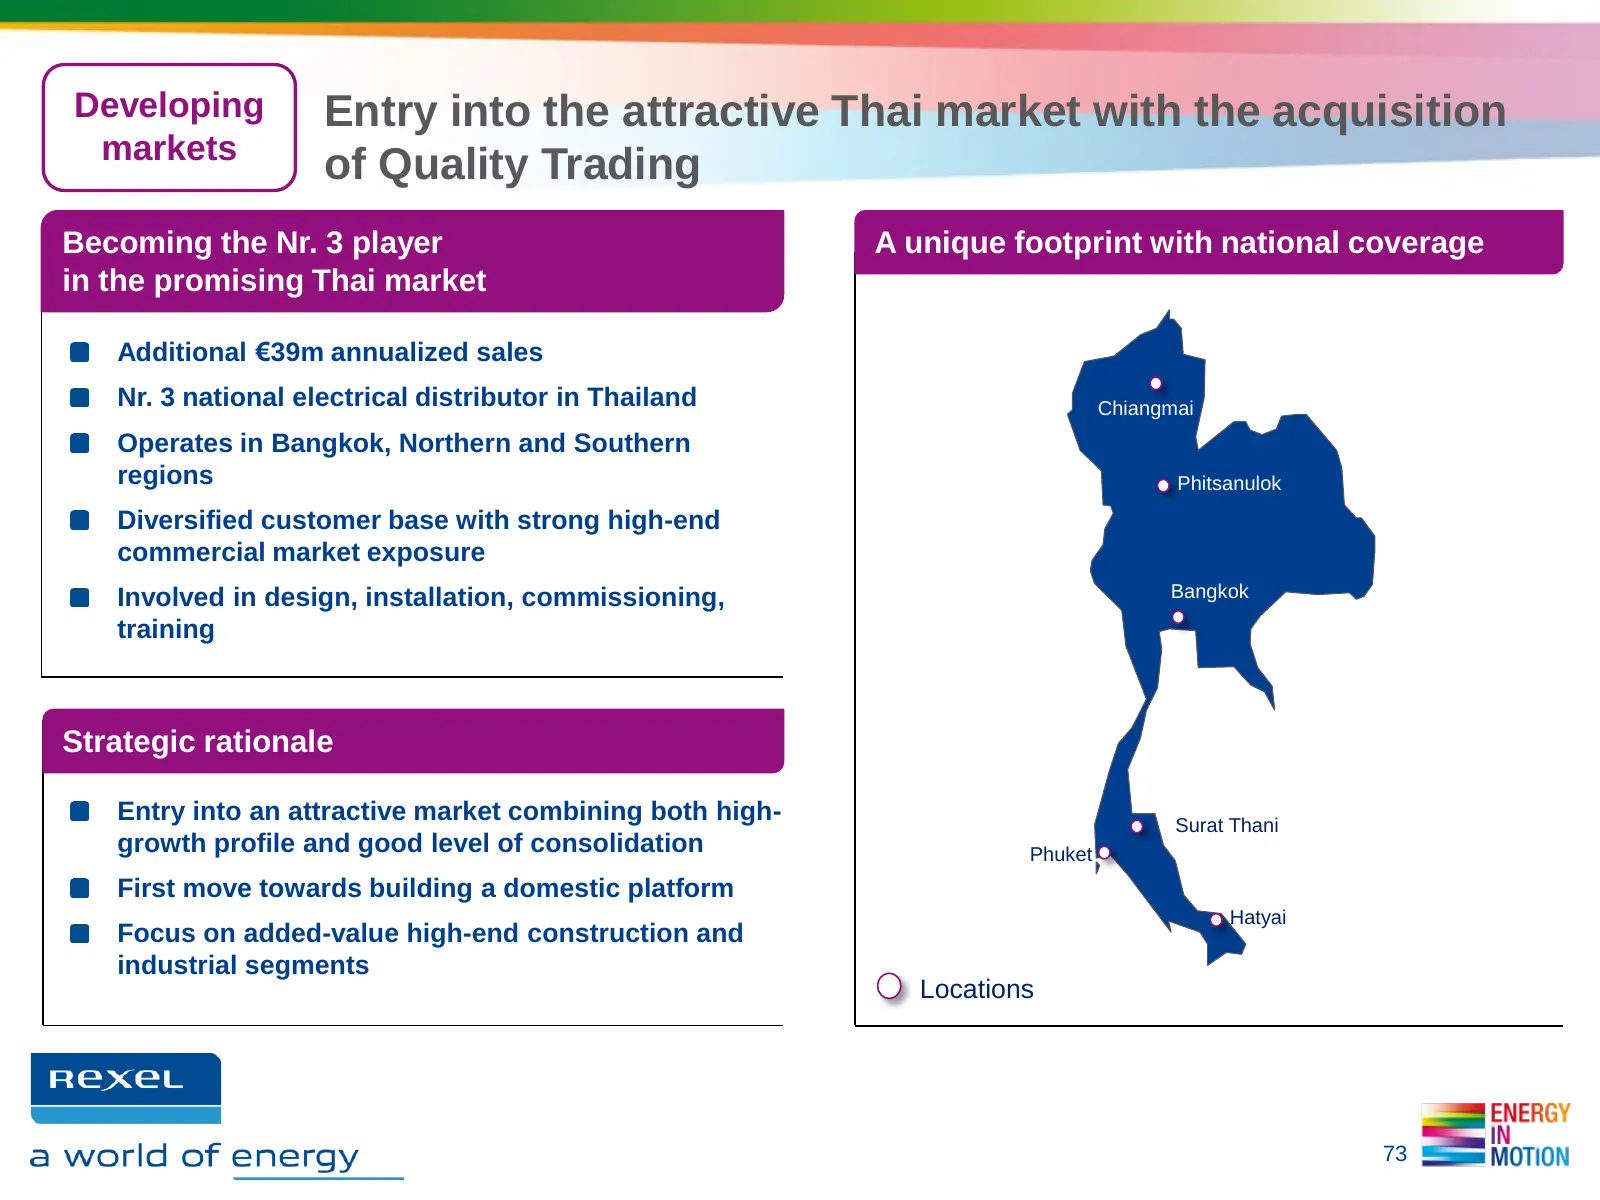
Developing Entry into the attractive Thai market with the acquisition markets of Quality Trading Becoming the Nr. 3 player A unique footprint with national coverage in the promising Thai market Additional €39m annualized sales Nr. 3 national electrical distributor in Thailand Chiangmai Operates in B
Slide 74: Enriching Oil & Gas offer in South-East Asia with Lenn
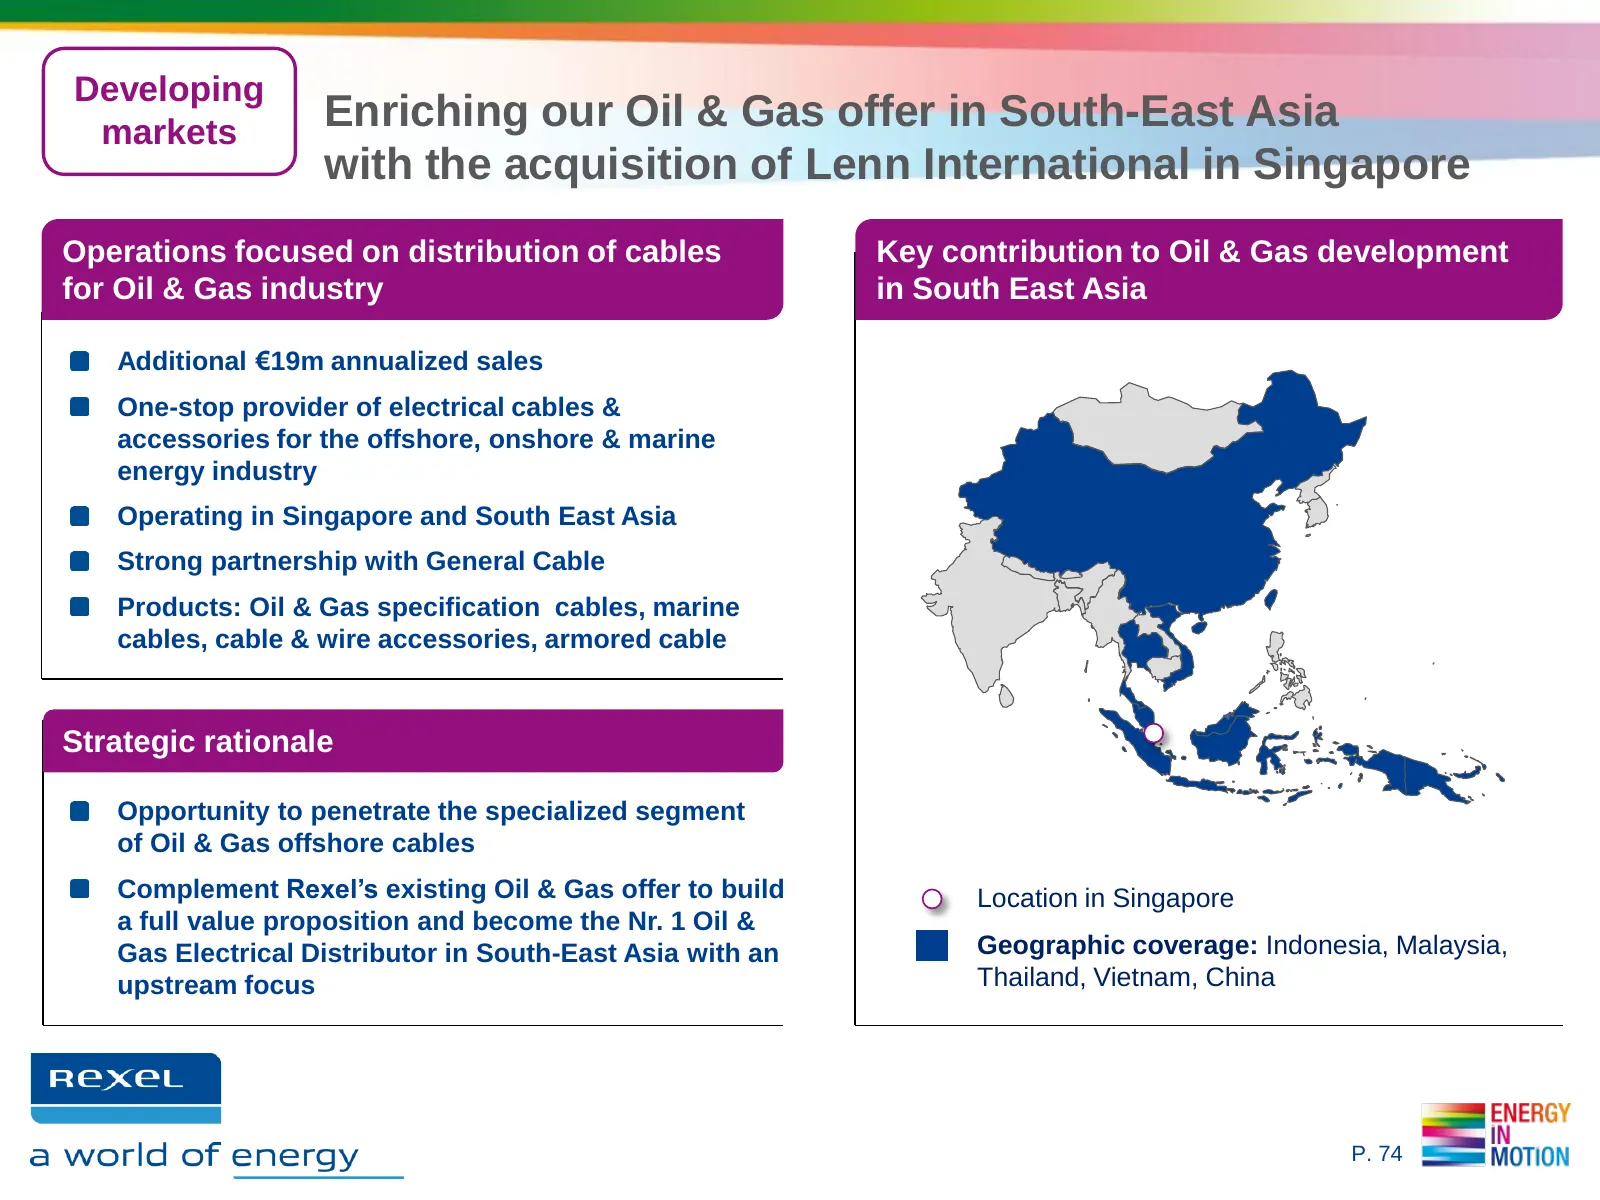
Developing markets Enriching our Oil & Gas offer in South-East Asia with the acquisition of Lenn International in Singapore Operations focused on distribution of cables Key contribution to Oil & Gas development for Oil & Gas industry in South East Asia Additional €19m annualized sales One-stop provi
Slide 75: 3.2 Expansion in developing countries: Asia
3.2. EXPANSION IN DEVELOPING COUNTRIES: ASIA Mitch WILLIAMS, Group Senior VP, Asia-Pacific
Slide 76: Rexel in Asia: a growing footprint
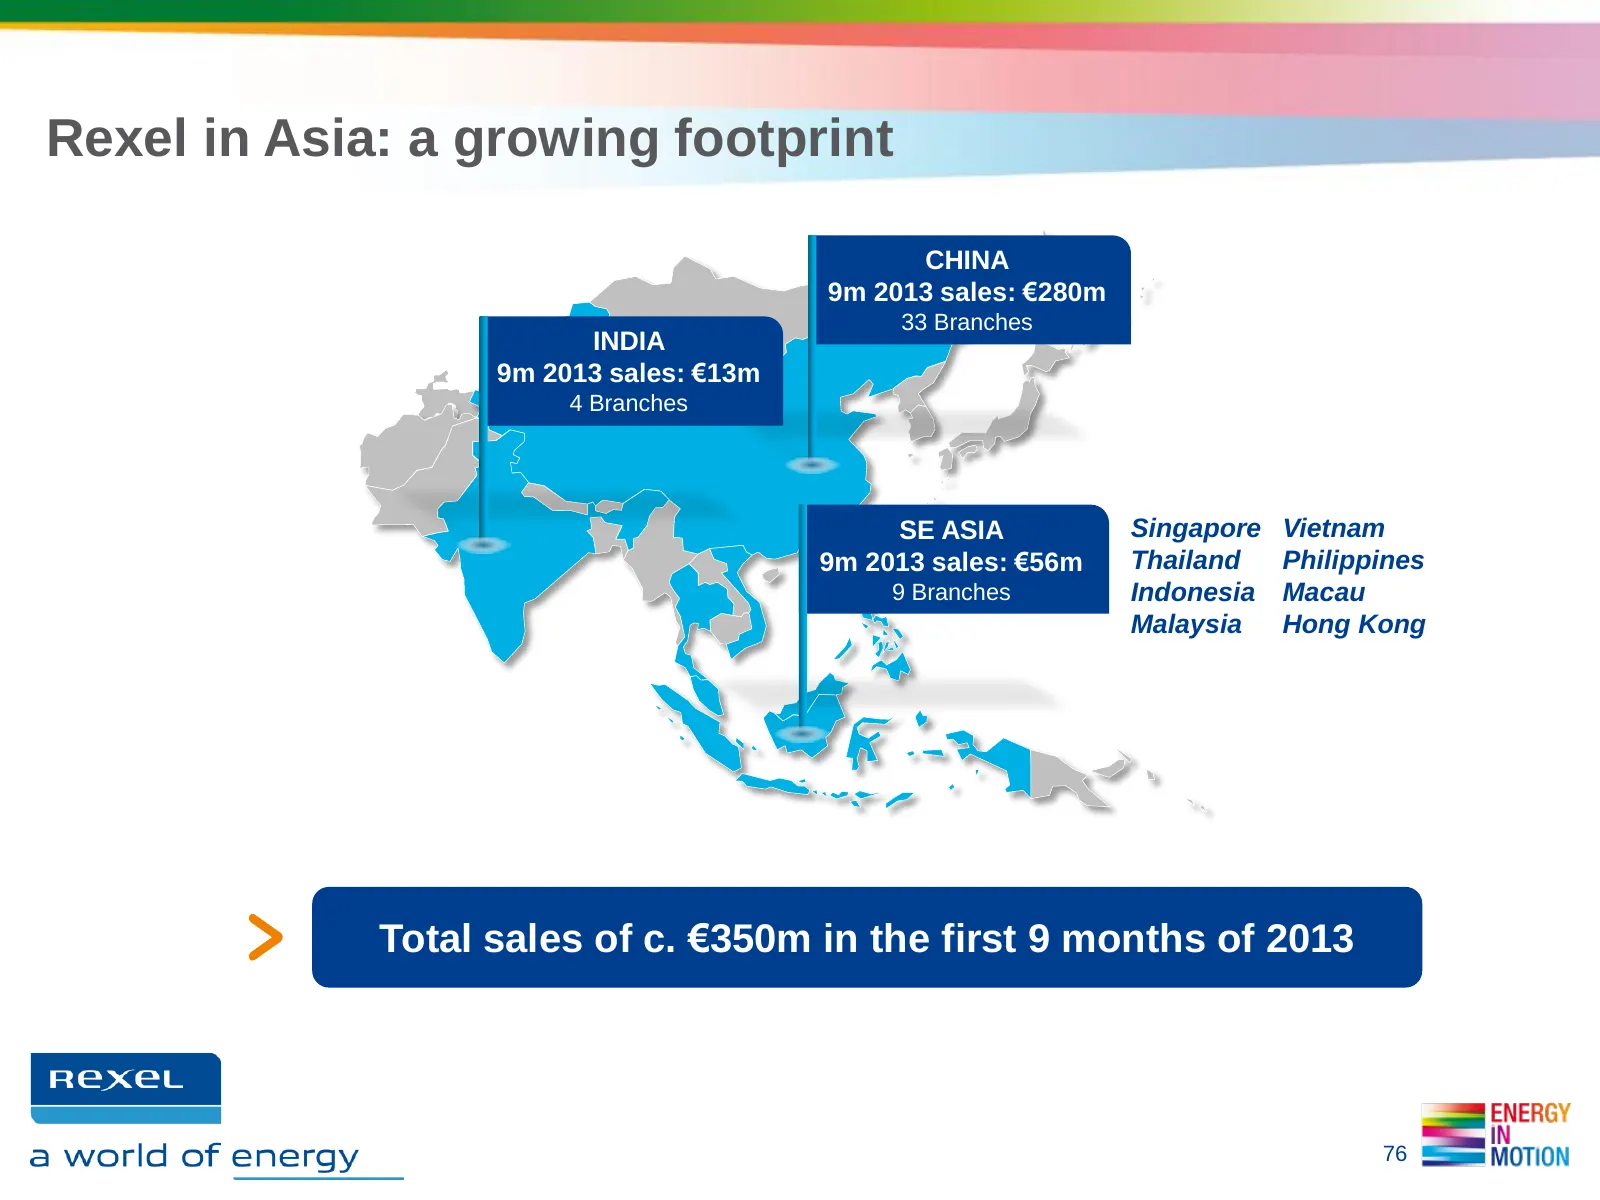
Rexel in Asia: a growing footprint CHINA 9m 2013 sales: €280m 33 Branches INDIA 9m 2013 sales: €13m 4 Branches SE ASIA Singapore Vietnam 9m 2013 sales: €56m Thailand Philippines 9 Branches Indonesia Macau Malaysia Hong Kong Total sales of c. €350m in the first 9 months of 2013 76
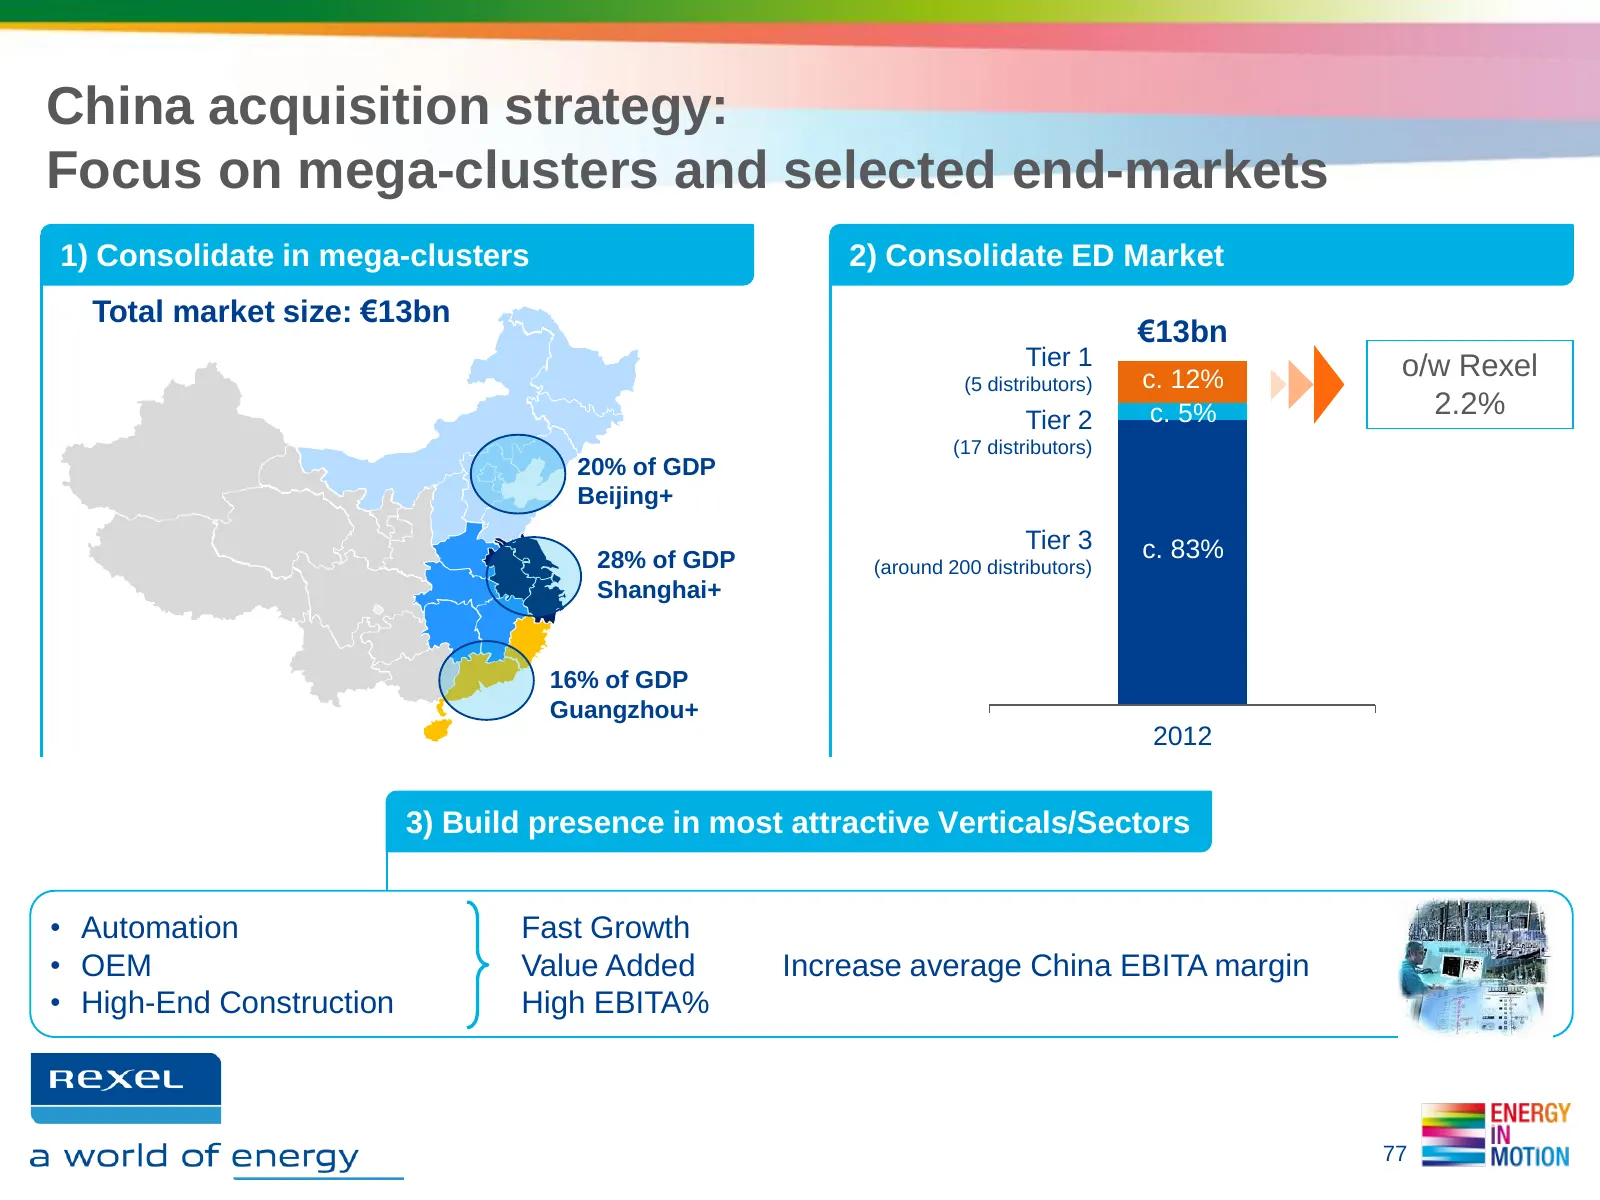
Slide 77: China acquisition strategy
China acquisition strategy: Focus on mega-clusters and selected end-markets 1) Consolidate in mega-clusters 2) Consolidate ED Market Total market size: €13bn €13bn Tier 1 o/w Rexel (5 distributors) c. 12% Tier 2 c. 5% 2.2% (17 distributors) 20% of GDP Beijing+ Tier 3 c. 83% 28% of GDP (around 200 di
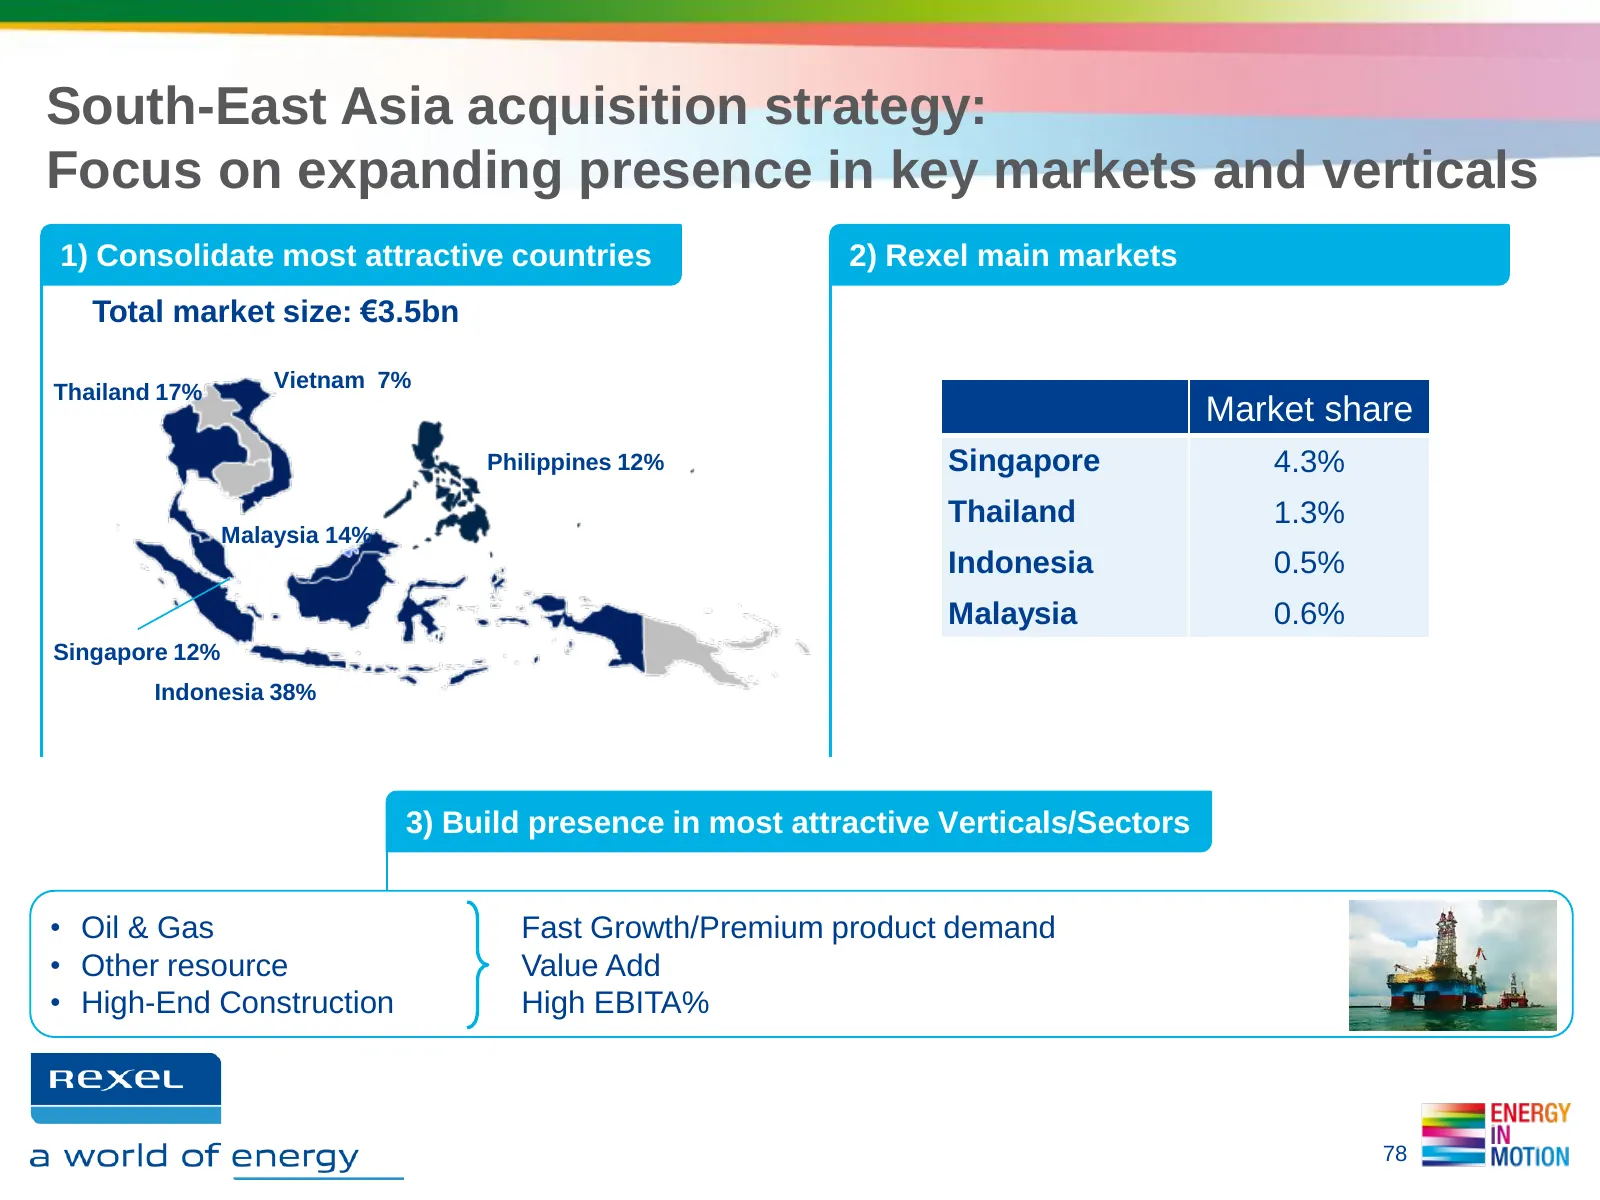
Slide 78: South-East Asia acquisition strategy
South-East Asia acquisition strategy: Focus on expanding presence in key markets and verticals 1) Consolidate most attractive countries 2) Rexel main markets Total market size: €3.5bn Vietnam 7% Thailand 17% Market share Philippines 12% Singapore 4.3% Thailand 1.3% Malaysia 14% Indonesia 0.5% Malays
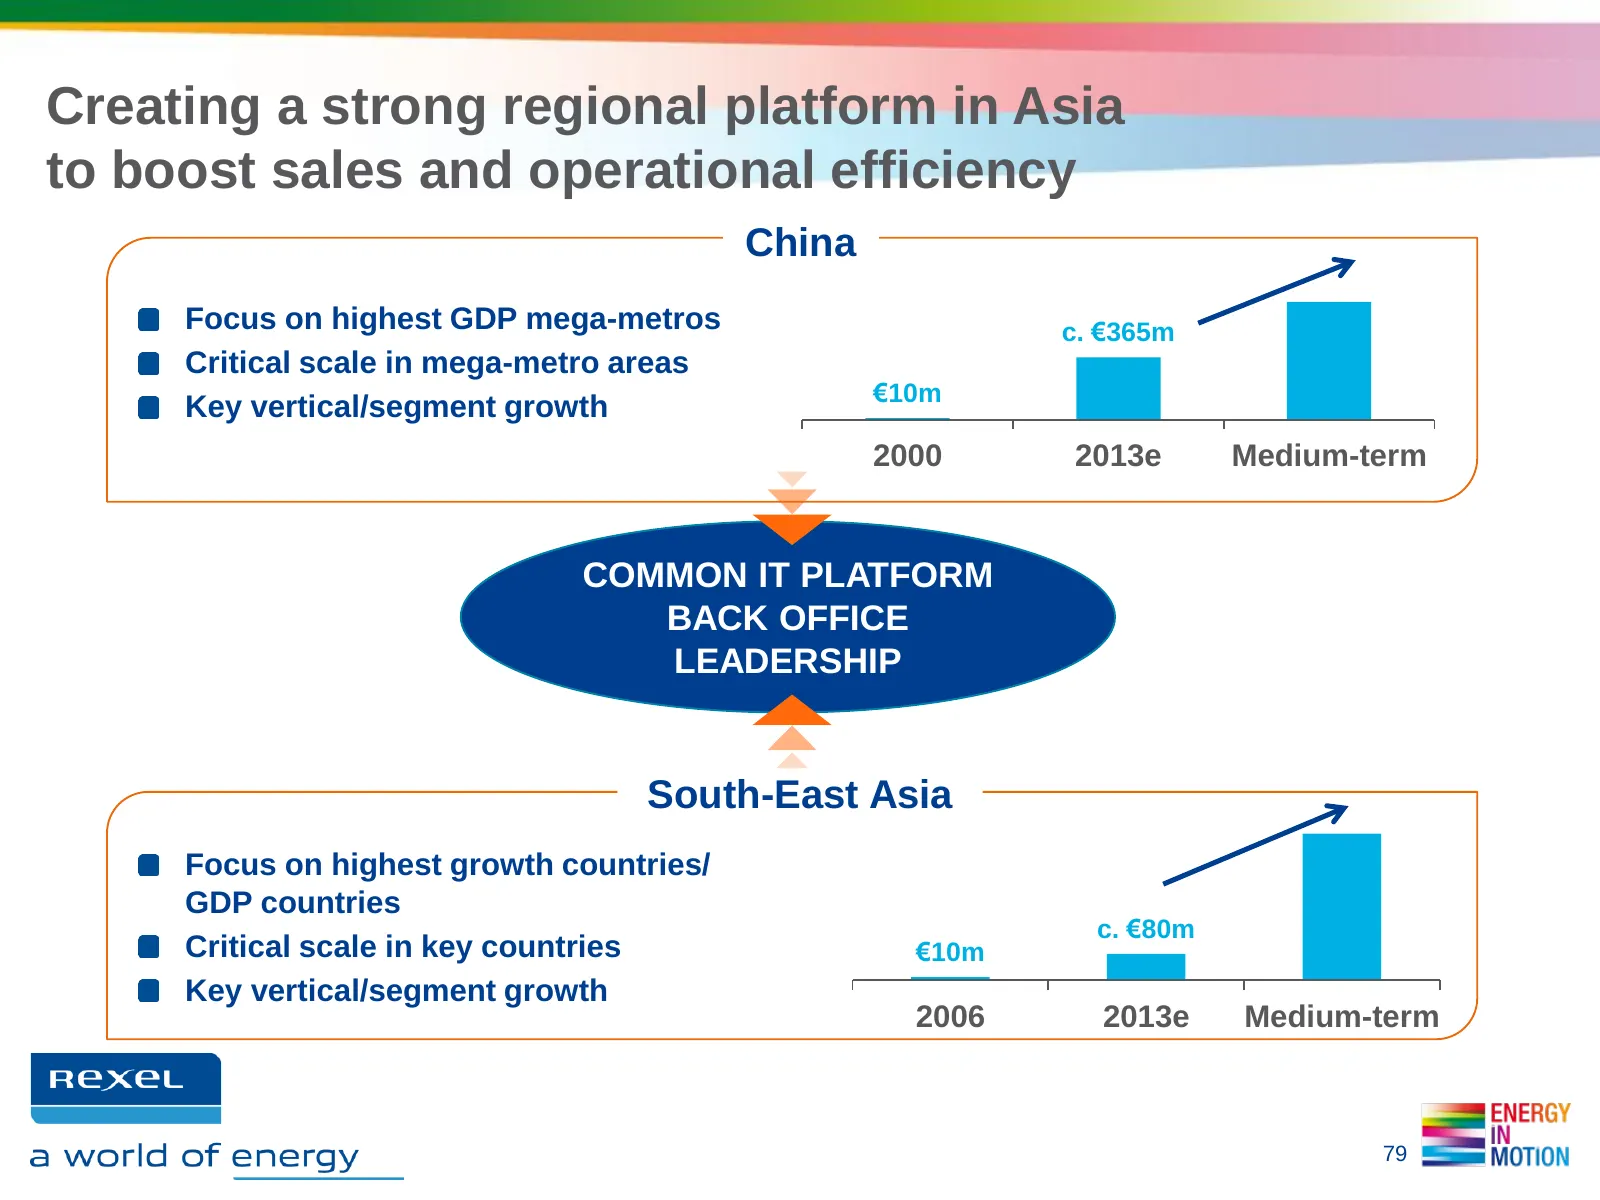
Slide 79: Creating a strong regional platform in Asia
Creating a strong regional platform in Asia to boost sales and operational efficiency China Focus on highest GDP mega-metros c. €365m Critical scale in mega-metro areas €10m Key vertical/segment growth 2000 2013e Medium-term COMMON IT PLATFORM BACK OFFICE LEADERSHIP South-East Asia Focus on highest
Slide 80: 3.3 Consolidation in mature countries: USA
3.3. CONSOLIDATION IN MATURE COUNTRIES: USA Chris HARTMANN, Executive VP and CEO, USA
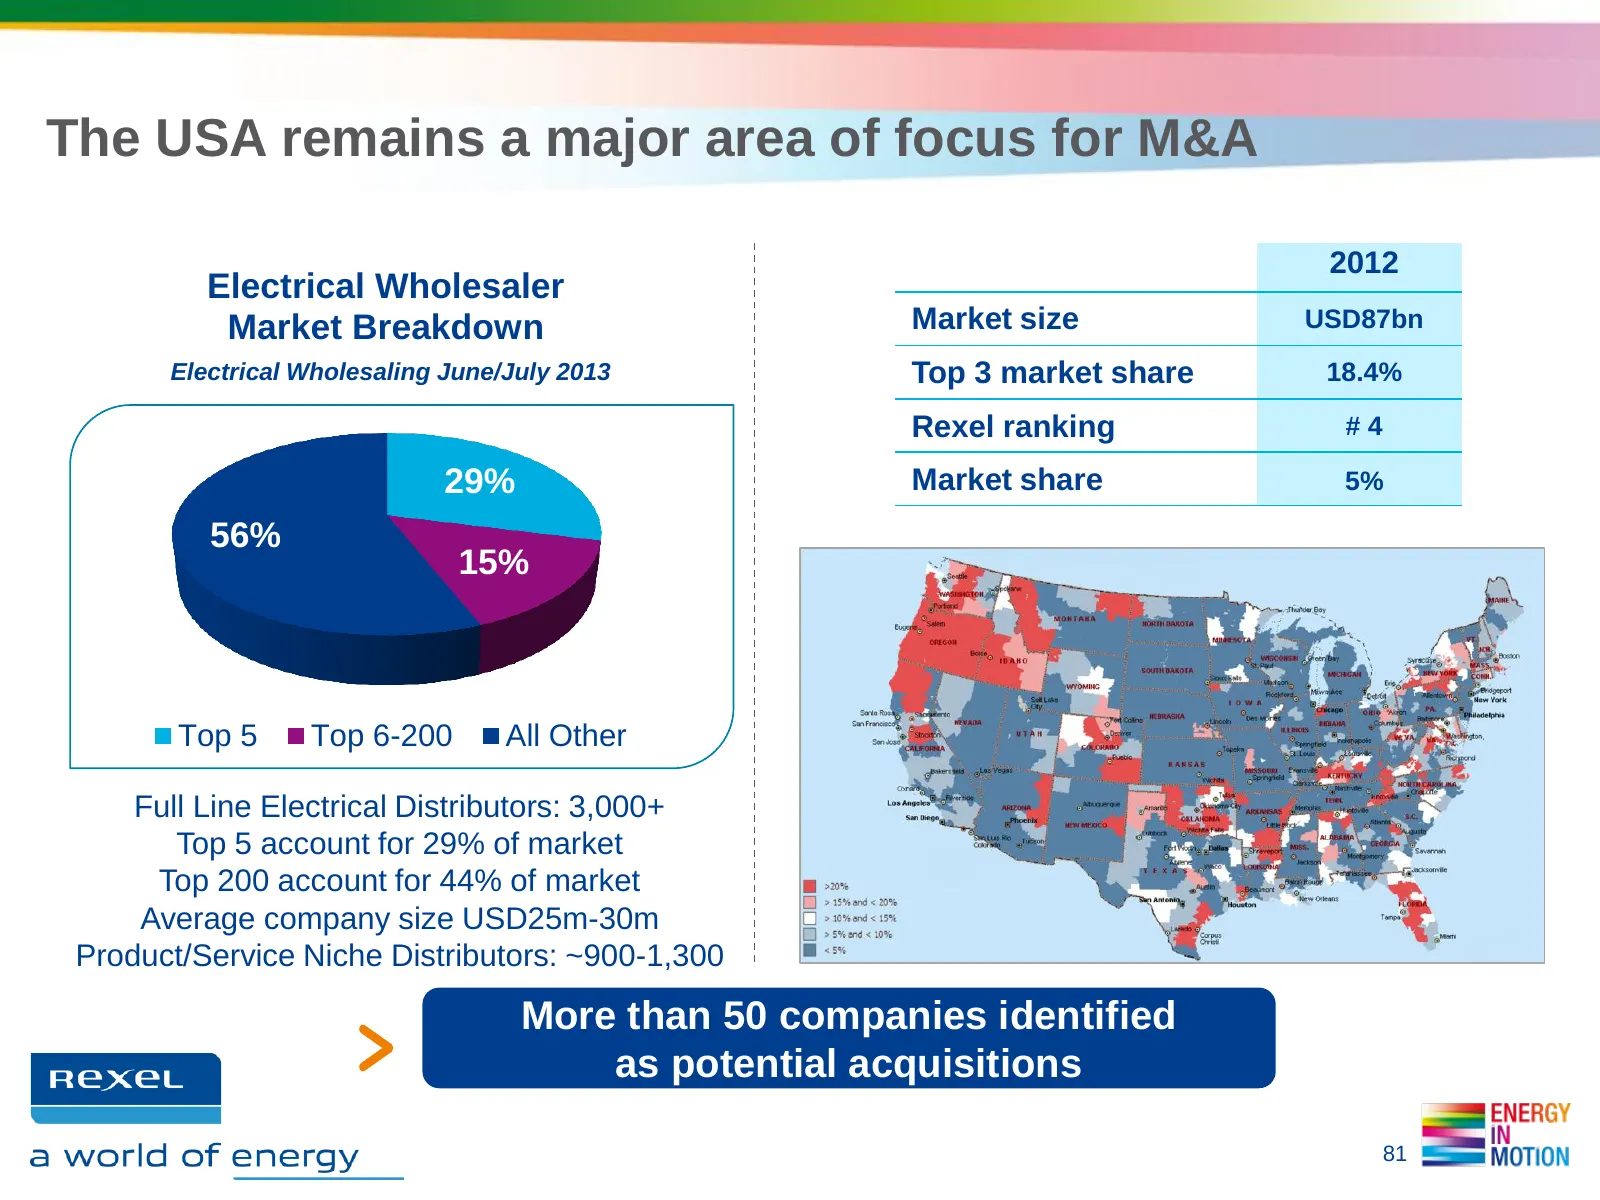
Slide 81: USA remains a major area of focus for M&A
The USA remains a major area of focus for M&A 2012 Electrical Wholesaler Market Breakdown Market size USD87bn Electrical Wholesaling June/July 2013 Top 3 market share 18.4% Rexel ranking #4 29% Market share 5% 56% 15% Top 5 Top 6-200 All Other Full Line Electrical Distributors: 3,000+ Top 5 account
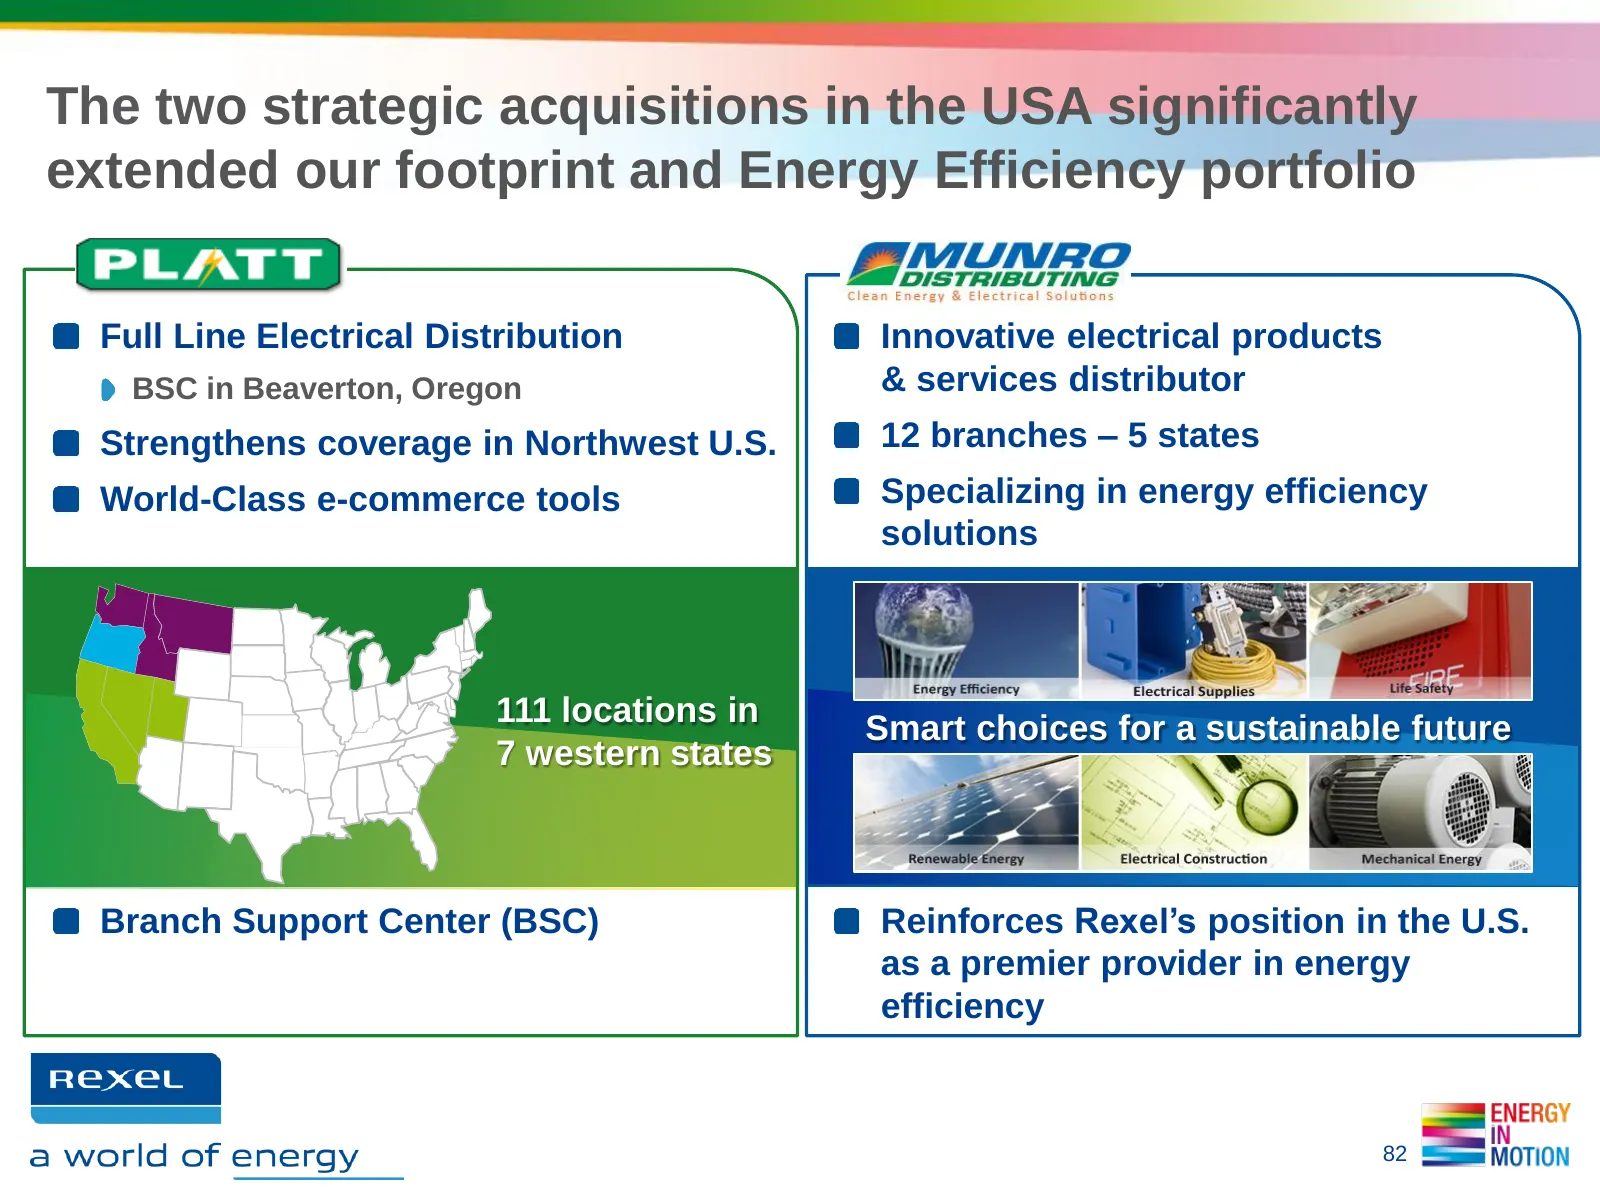
Slide 82: Two strategic acquisitions in the USA
The two strategic acquisitions in the USA significantly extended our footprint and Energy Efficiency portfolio Full Line Electrical Distribution Innovative electrical products BSC in Beaverton, Oregon & services distributor Strengthens coverage in Northwest U.S. 12 branches – 5 states World-Class e-
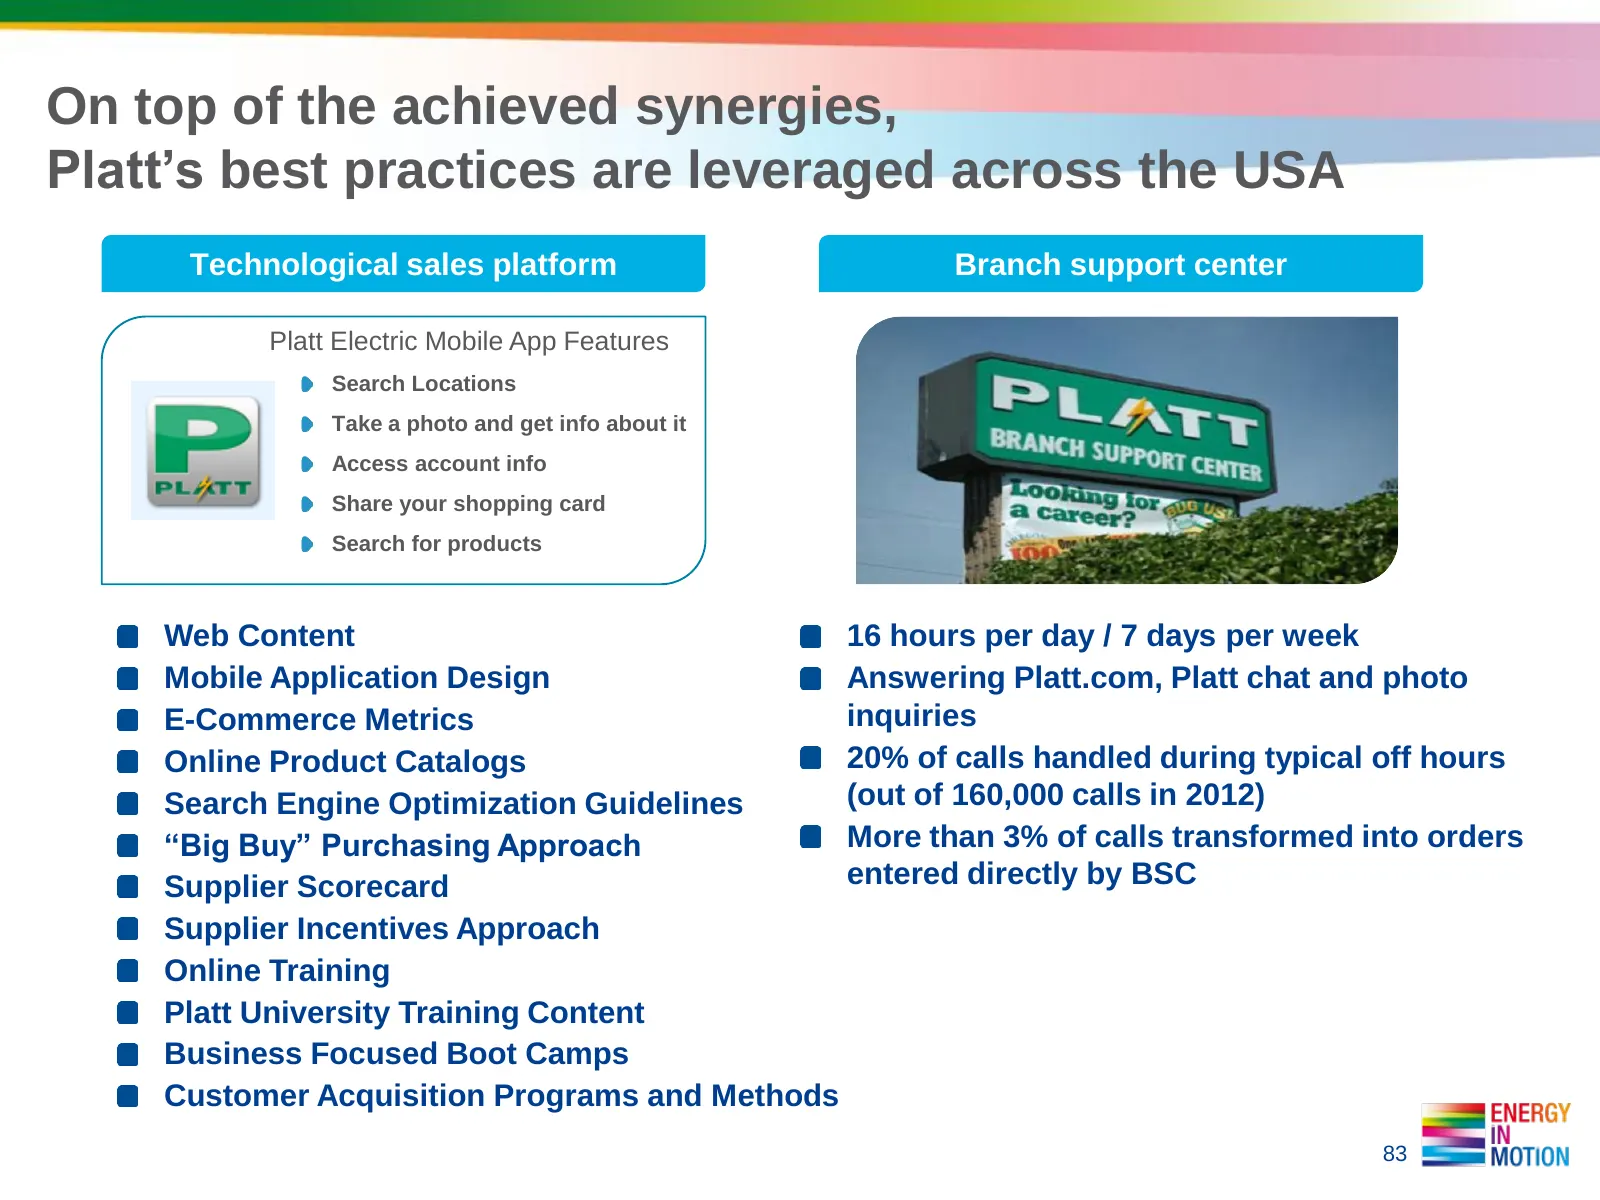
Slide 83: Platt's best practices leveraged across the USA
On top of the achieved synergies, Platt’s best practices are leveraged across the USA Technological sales platform Branch support center Platt Electric Mobile App Features Search Locations Take a photo and get info about it Access account info Share your shopping card Search for products Web Content
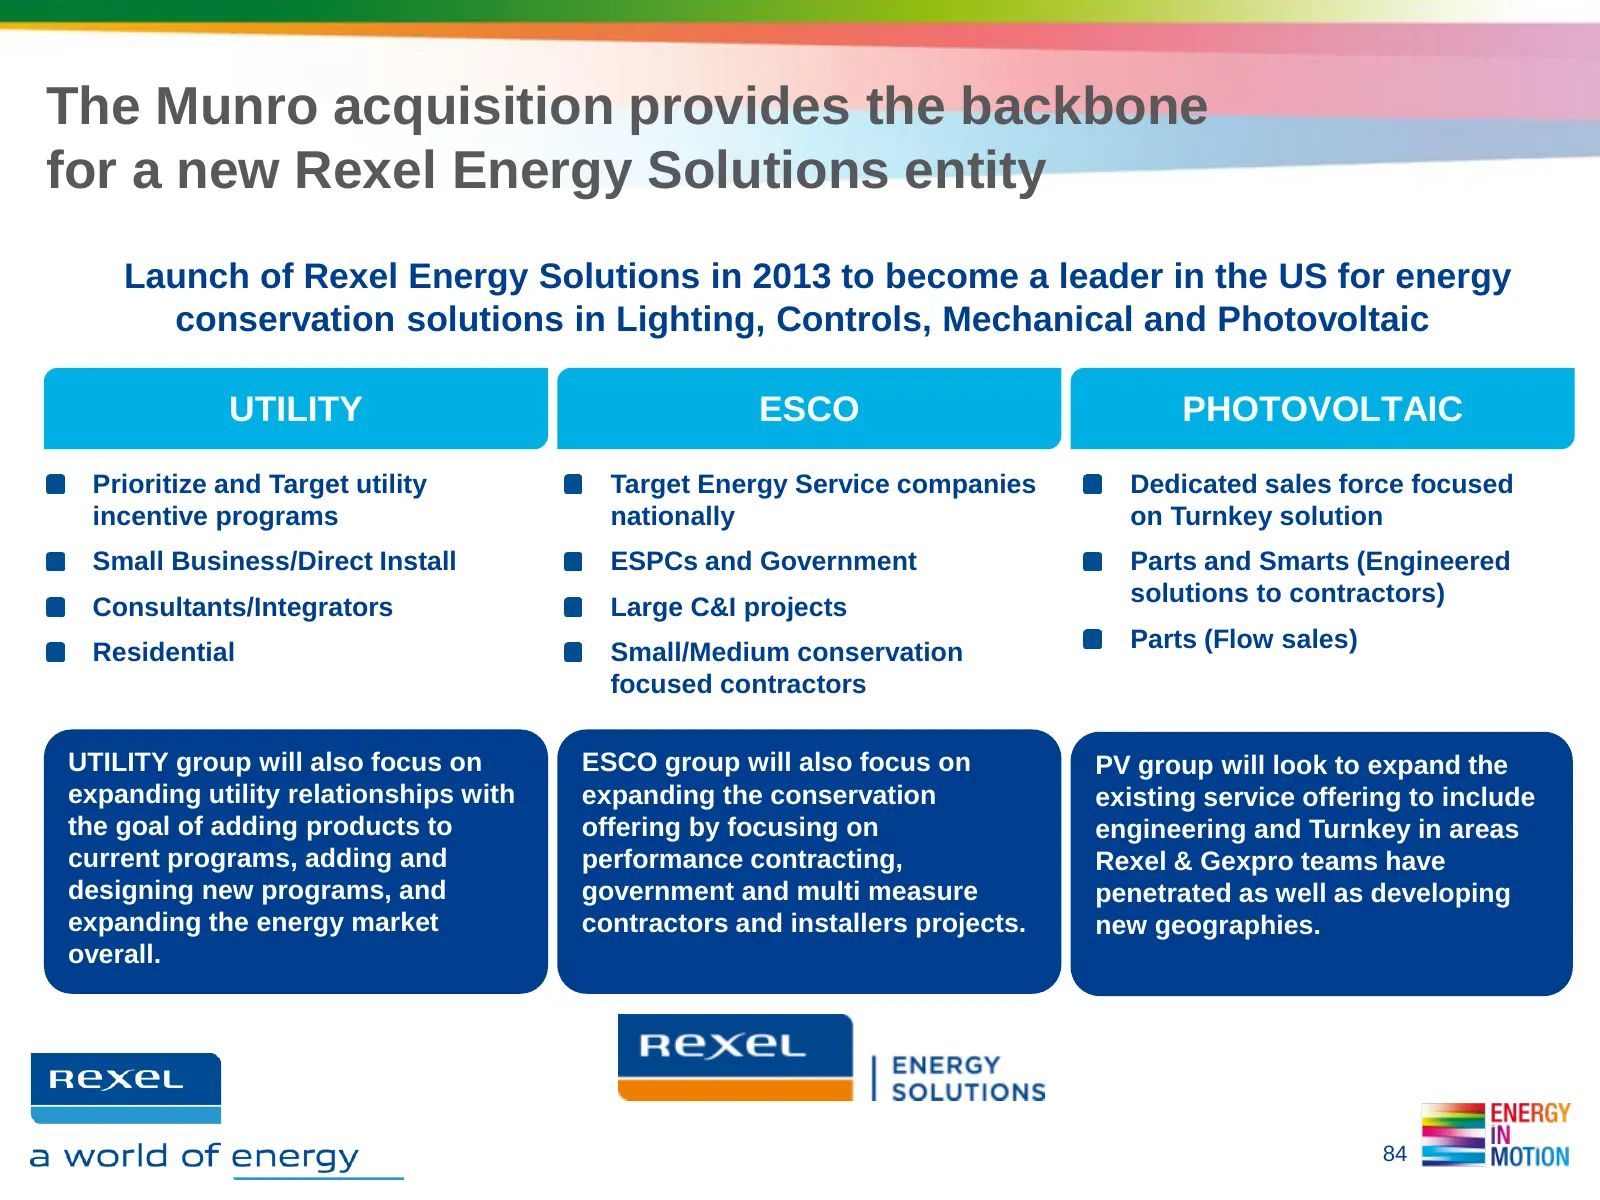
Slide 84: Munro acquisition backbone for Rexel Energy Solutions
The Munro acquisition provides the backbone for a new Rexel Energy Solutions entity Launch of Rexel Energy Solutions in 2013 to become a leader in the US for energy conservation solutions in Lighting, Controls, Mechanical and Photovoltaic UTILITY ESCO PHOTOVOLTAIC Prioritize and Target utility Targe
Slide 85: Rexel Energy Solutions scalable model for ESCOs and utilities
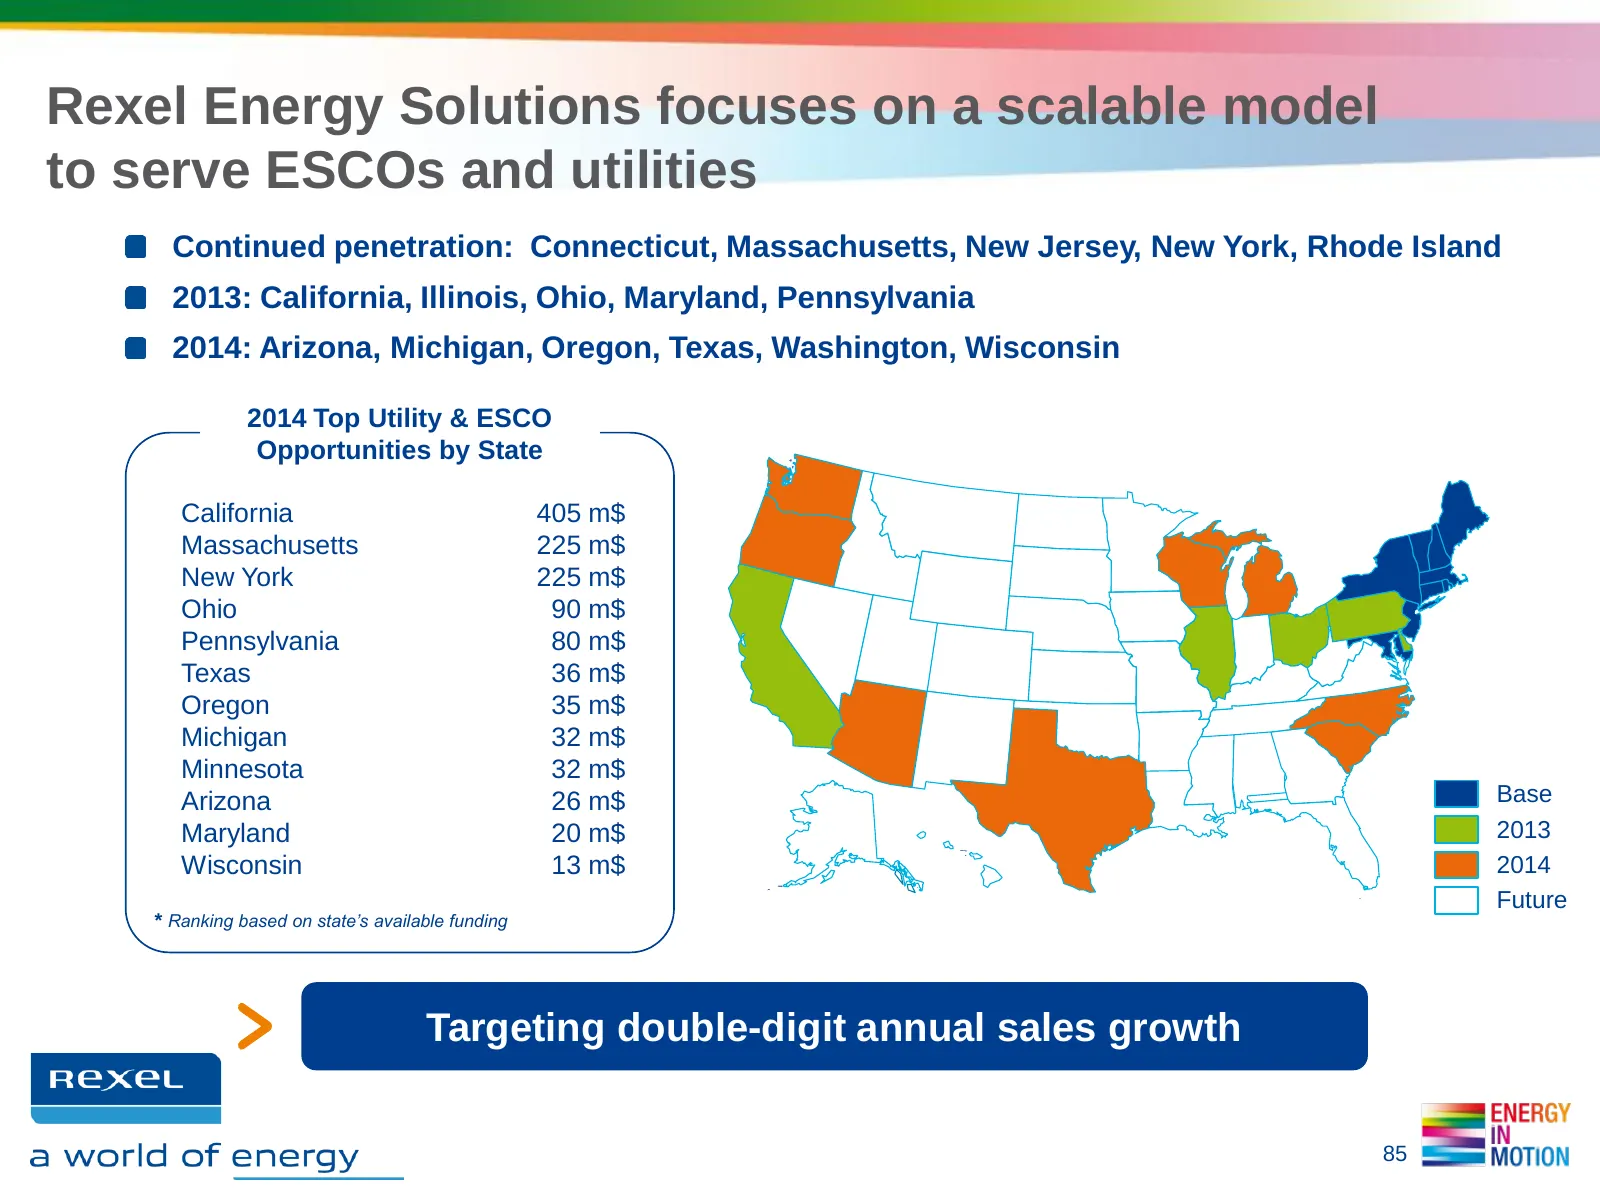
Rexel Energy Solutions focuses on a scalable model to serve ESCOs and utilities Continued penetration: Connecticut, Massachusetts, New Jersey, New York, Rhode Island 2013: California, Illinois, Ohio, Maryland, Pennsylvania 2014: Arizona, Michigan, Oregon, Texas, Washington, Wisconsin 2014 Top Utilit
Slide 86: 4. Driving operational excellence
DRIVING OPERATIONAL 4. EXCELLENCE AS AN ENABLER FOR PROFITABLE GROWTH Peter HAKANSON, Group Senior VP, Operations
Slide 87: Energy in Motion: Driving operational excellence
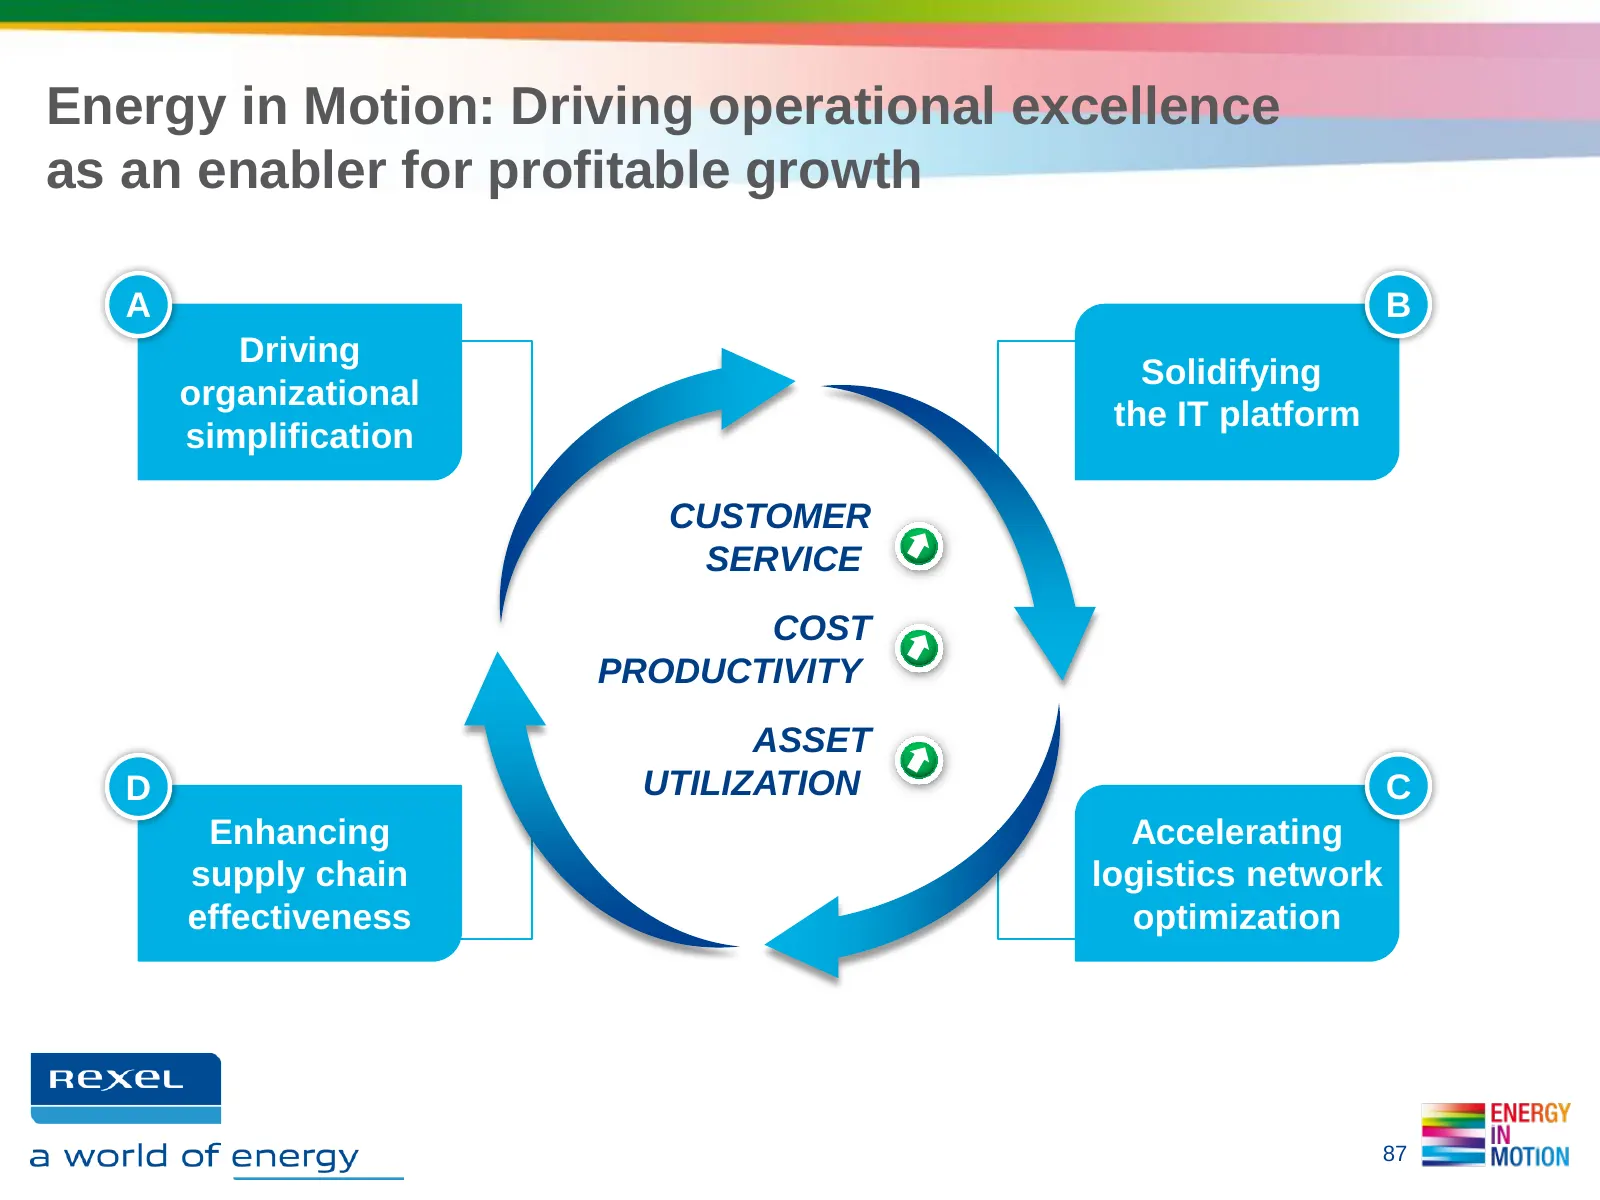
Energy in Motion: Driving operational excellence as an enabler for profitable growth A B Driving Solidifying organizational the IT platform simplification CUSTOMER SERVICE COST PRODUCTIVITY ASSET D UTILIZATION C Enhancing Accelerating supply chain logistics network effectiveness optimization 87
Slide 88: Reducing organizational complexity and taking out costs
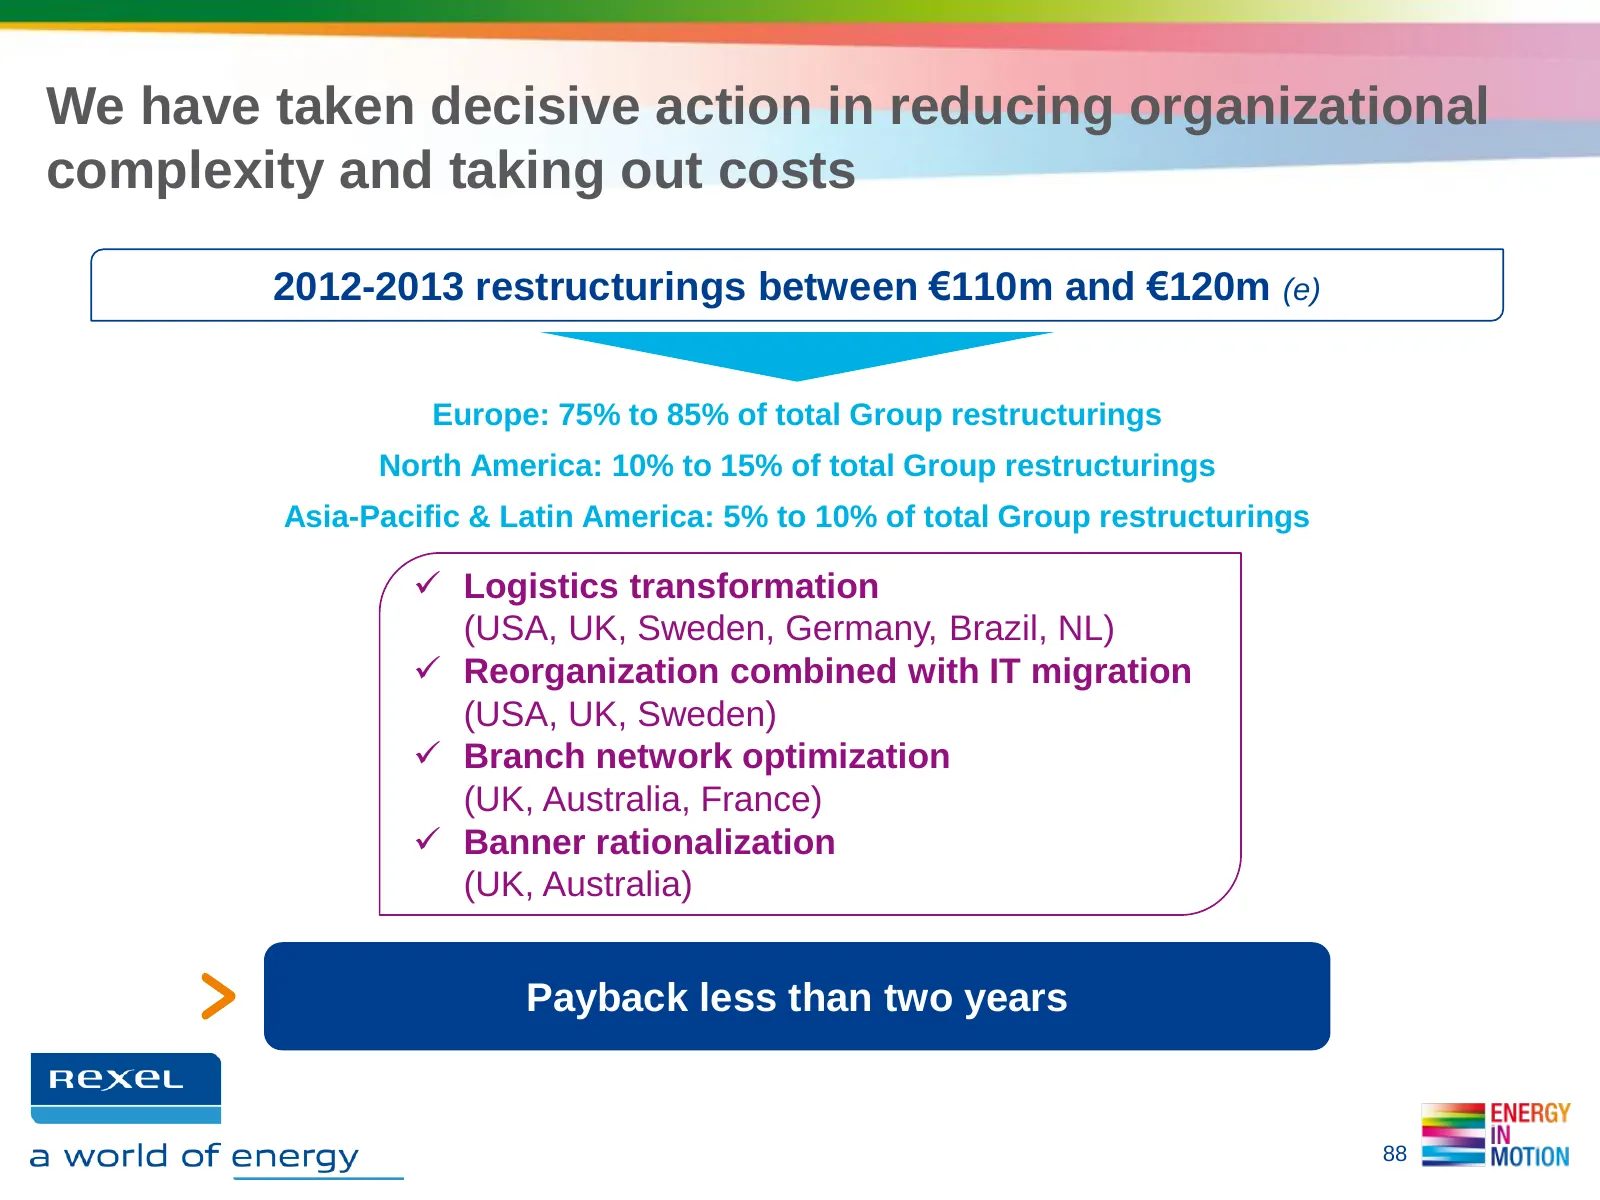
We have taken decisive action in reducing organizational complexity and taking out costs 2012-2013 restructurings between €110m and €120m (e) Europe: 75% to 85% of total Group restructurings North America: 10% to 15% of total Group restructurings Asia-Pacific & Latin America: 5% to 10% of total Grou
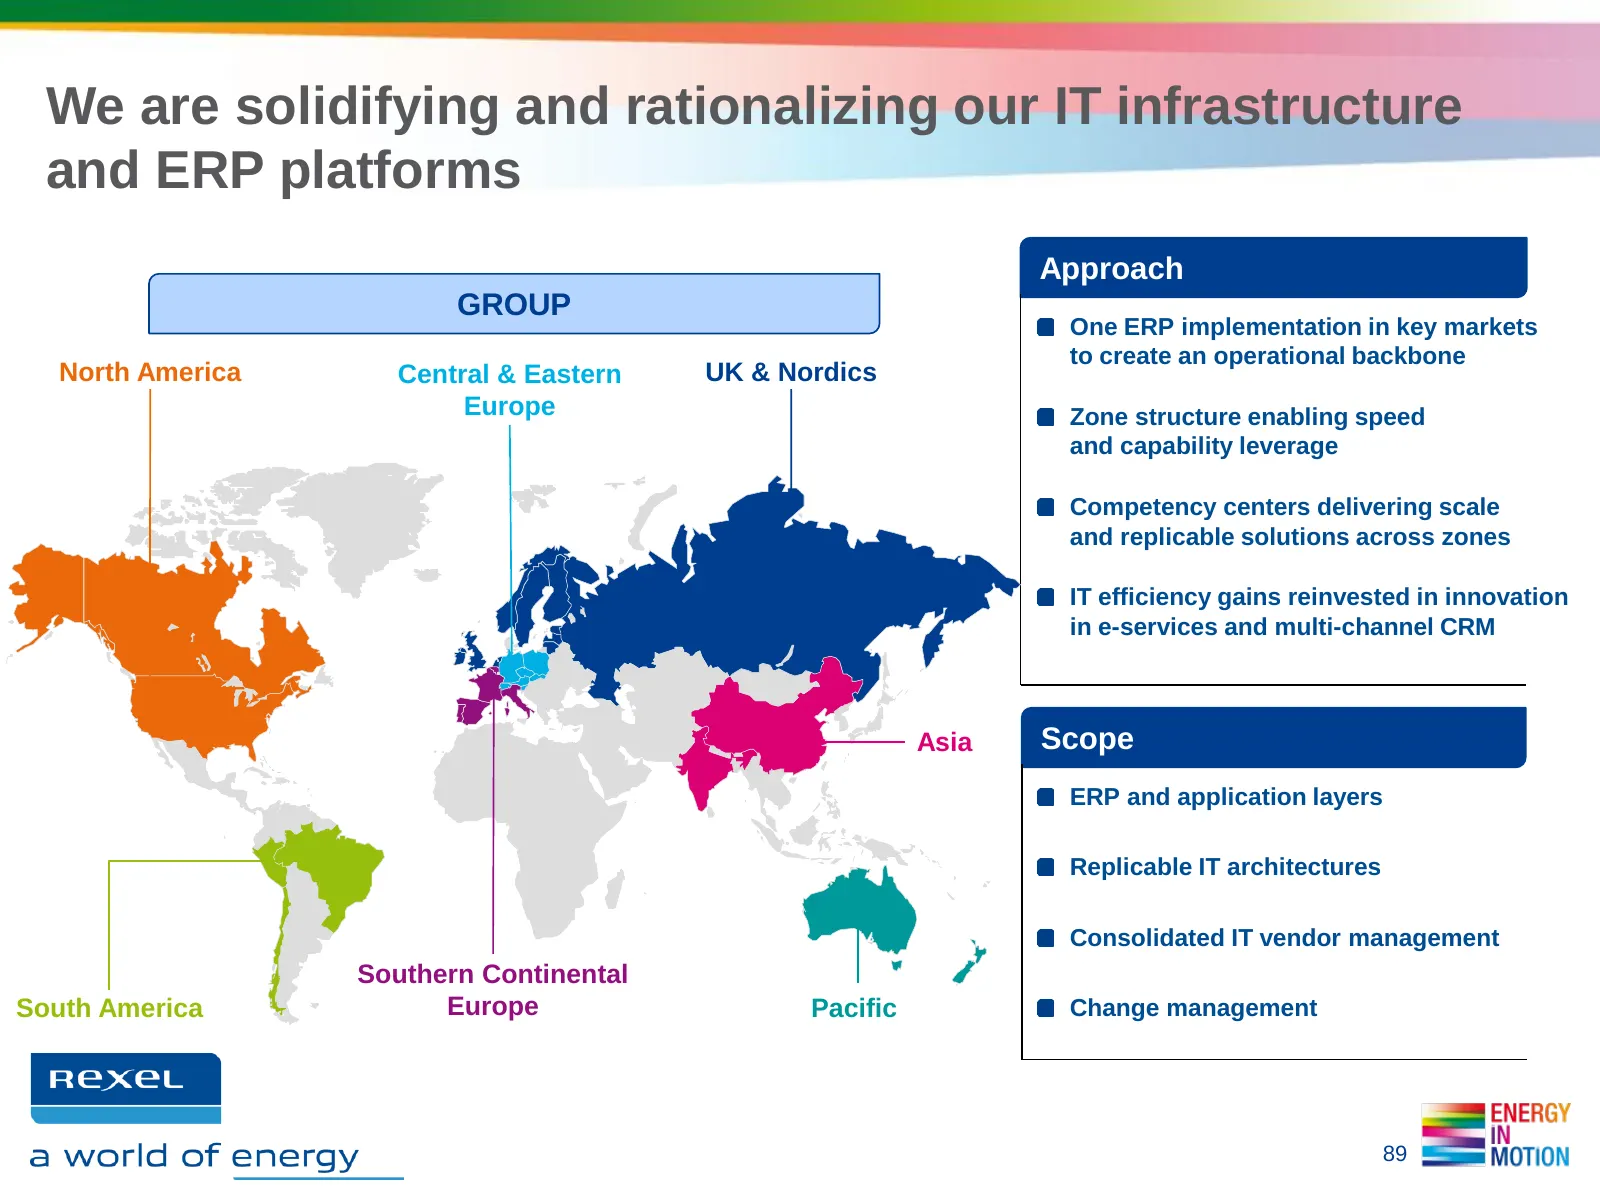
Slide 89: Solidifying and rationalizing IT infrastructure and ERP
We are solidifying and rationalizing our IT infrastructure and ERP platforms Approach GROUP One ERP implementation in key markets to create an operational backbone North America Central & Eastern UK & Nordics Europe Zone structure enabling speed and capability leverage Competency centers delivering
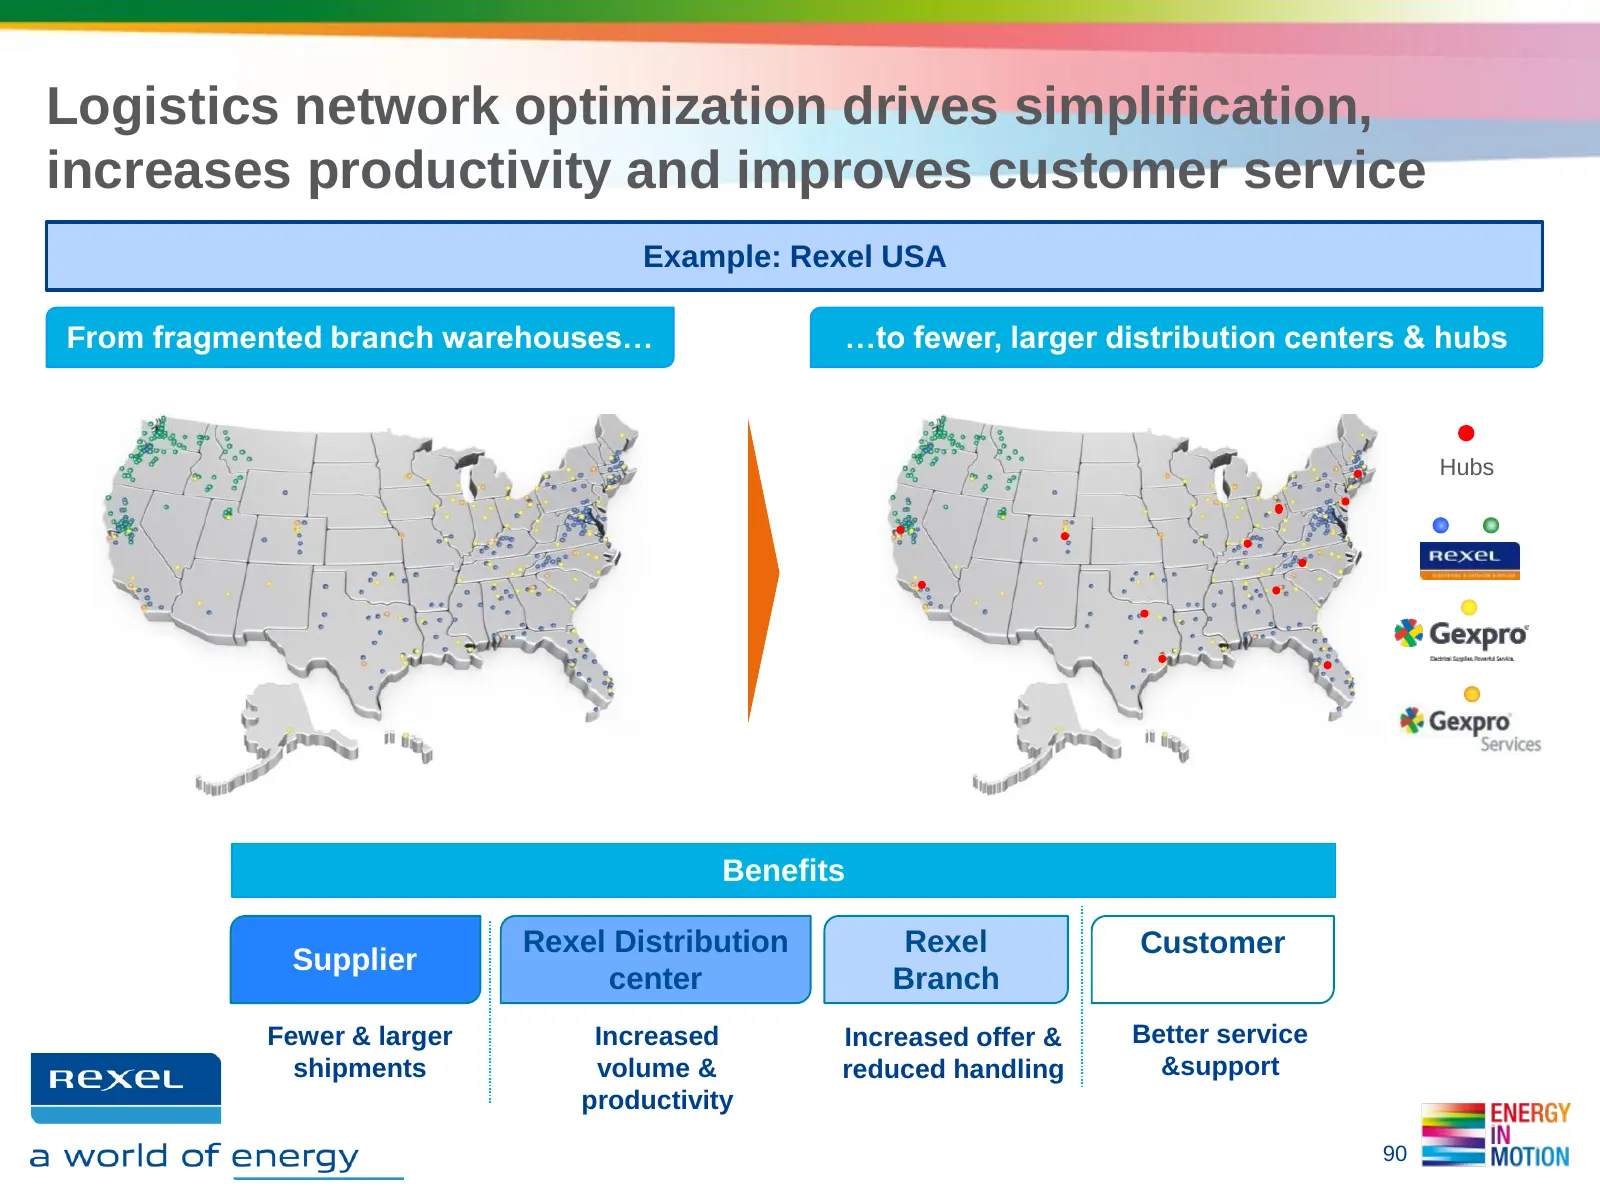
Slide 90: Logistics network optimization
Logistics network optimization drives simplification, increases productivity and improves customer service Example: Rexel USA From fragmented branch warehouses… …to fewer, larger distribution centers & hubs Hubs Benefits Rexel Distribution Rexel Customer Supplier center Branch Fewer & larger Increas
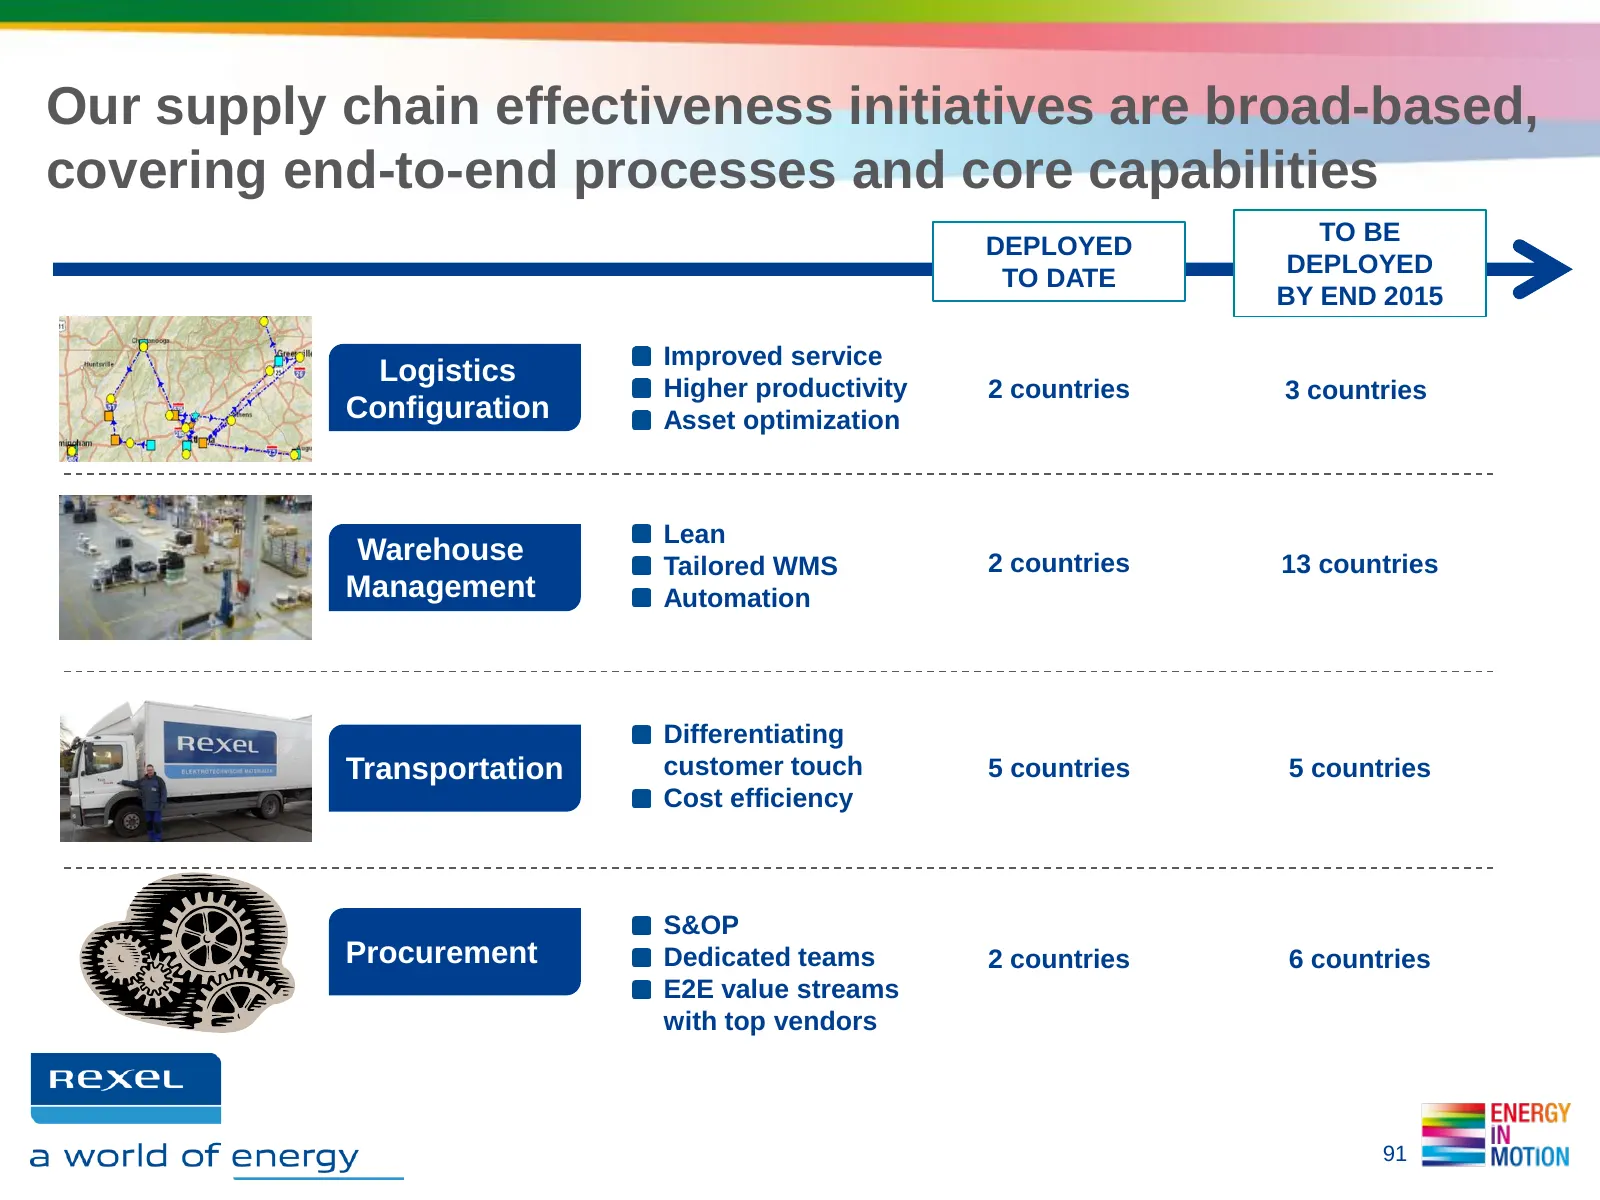
Slide 91: Supply chain effectiveness initiatives
Our supply chain effectiveness initiatives are broad-based, covering end-to-end processes and core capabilities TO BE DEPLOYED DEPLOYED TO DATE BY END 2015 Improved service Logistics Higher productivity 2 countries 3 countries Configuration Asset optimization Lean Warehouse Tailored WMS 2 countries
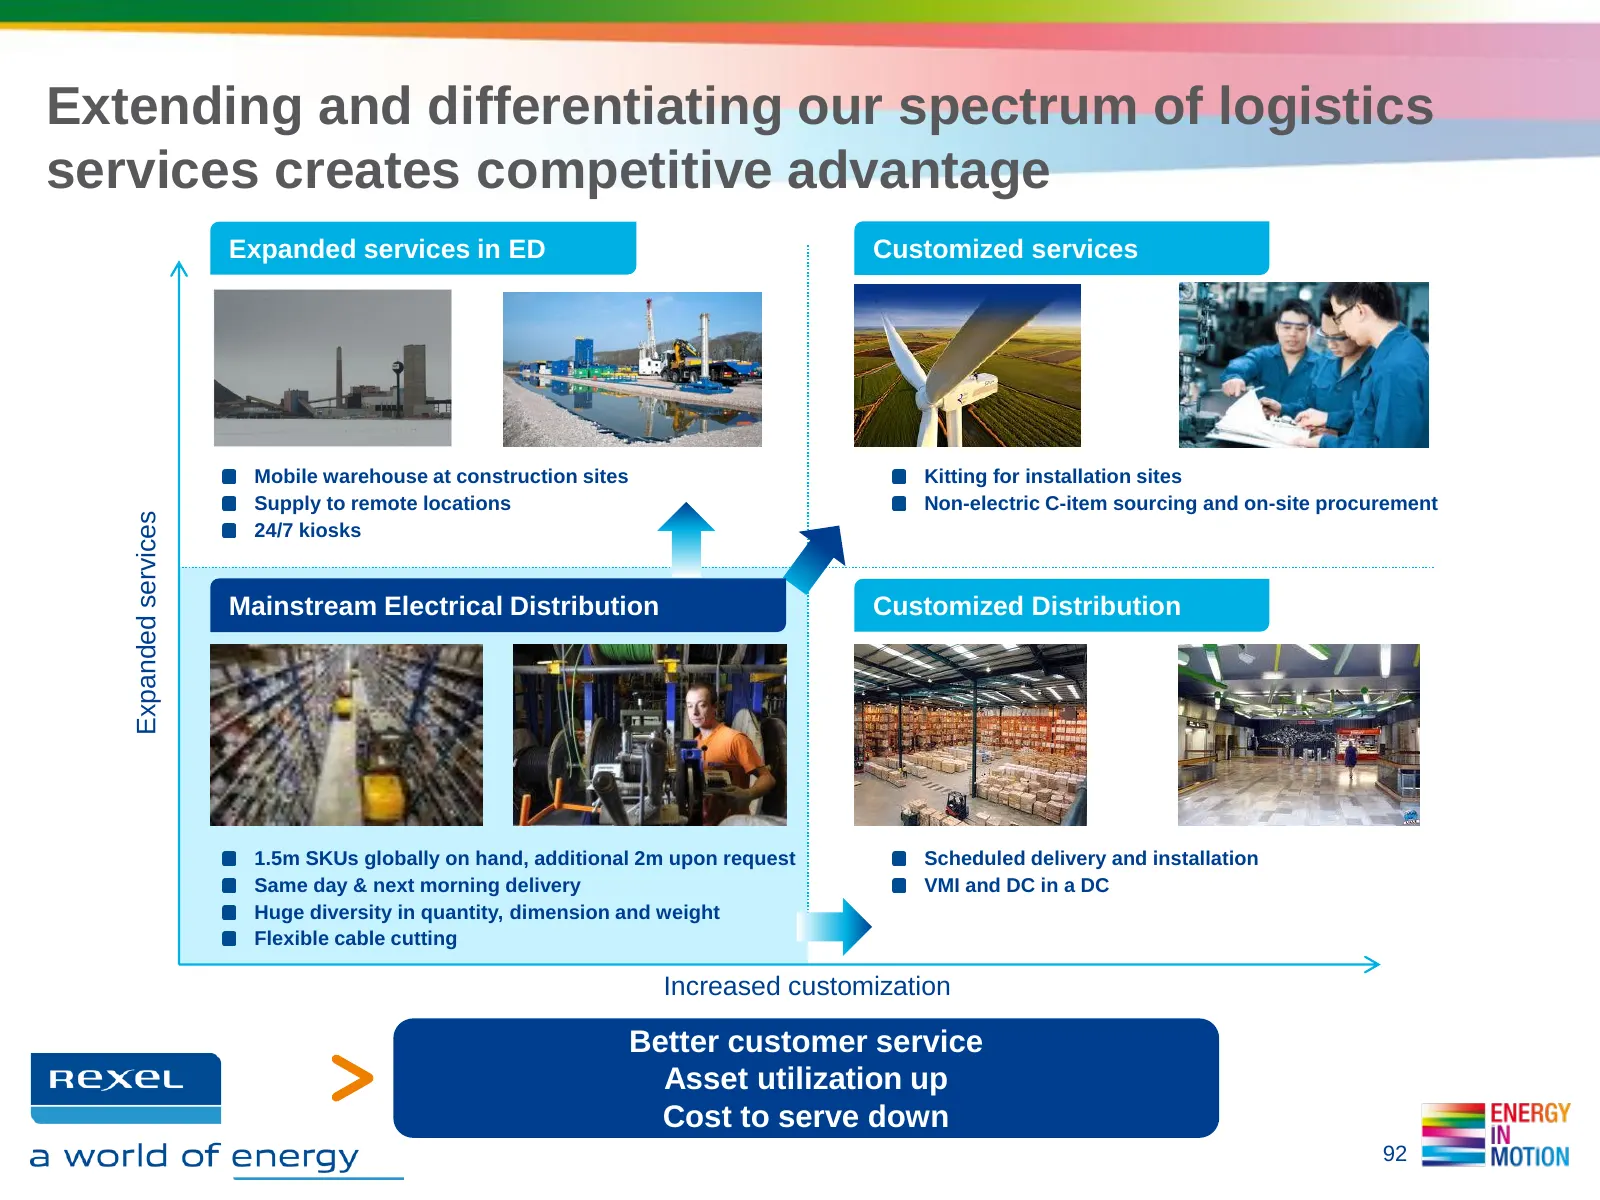
Slide 92: Differentiating logistics services creates competitive advantage
Extending and differentiating our spectrum of logistics services creates competitive advantage Expanded services in ED Customized services Mobile warehouse at construction sites Kitting for installation sites Supply to remote locations Non-electric C-item sourcing and on-site procurement Expanded se
Slide 93: 4.1 Operational excellence at work: UK
4.1. OPERATIONAL EXCELLENCE AT WORK: UK Henri-Paul LASCHKAR, Group Senior VP, Northern Europe
Slide 94: UK business simplification program
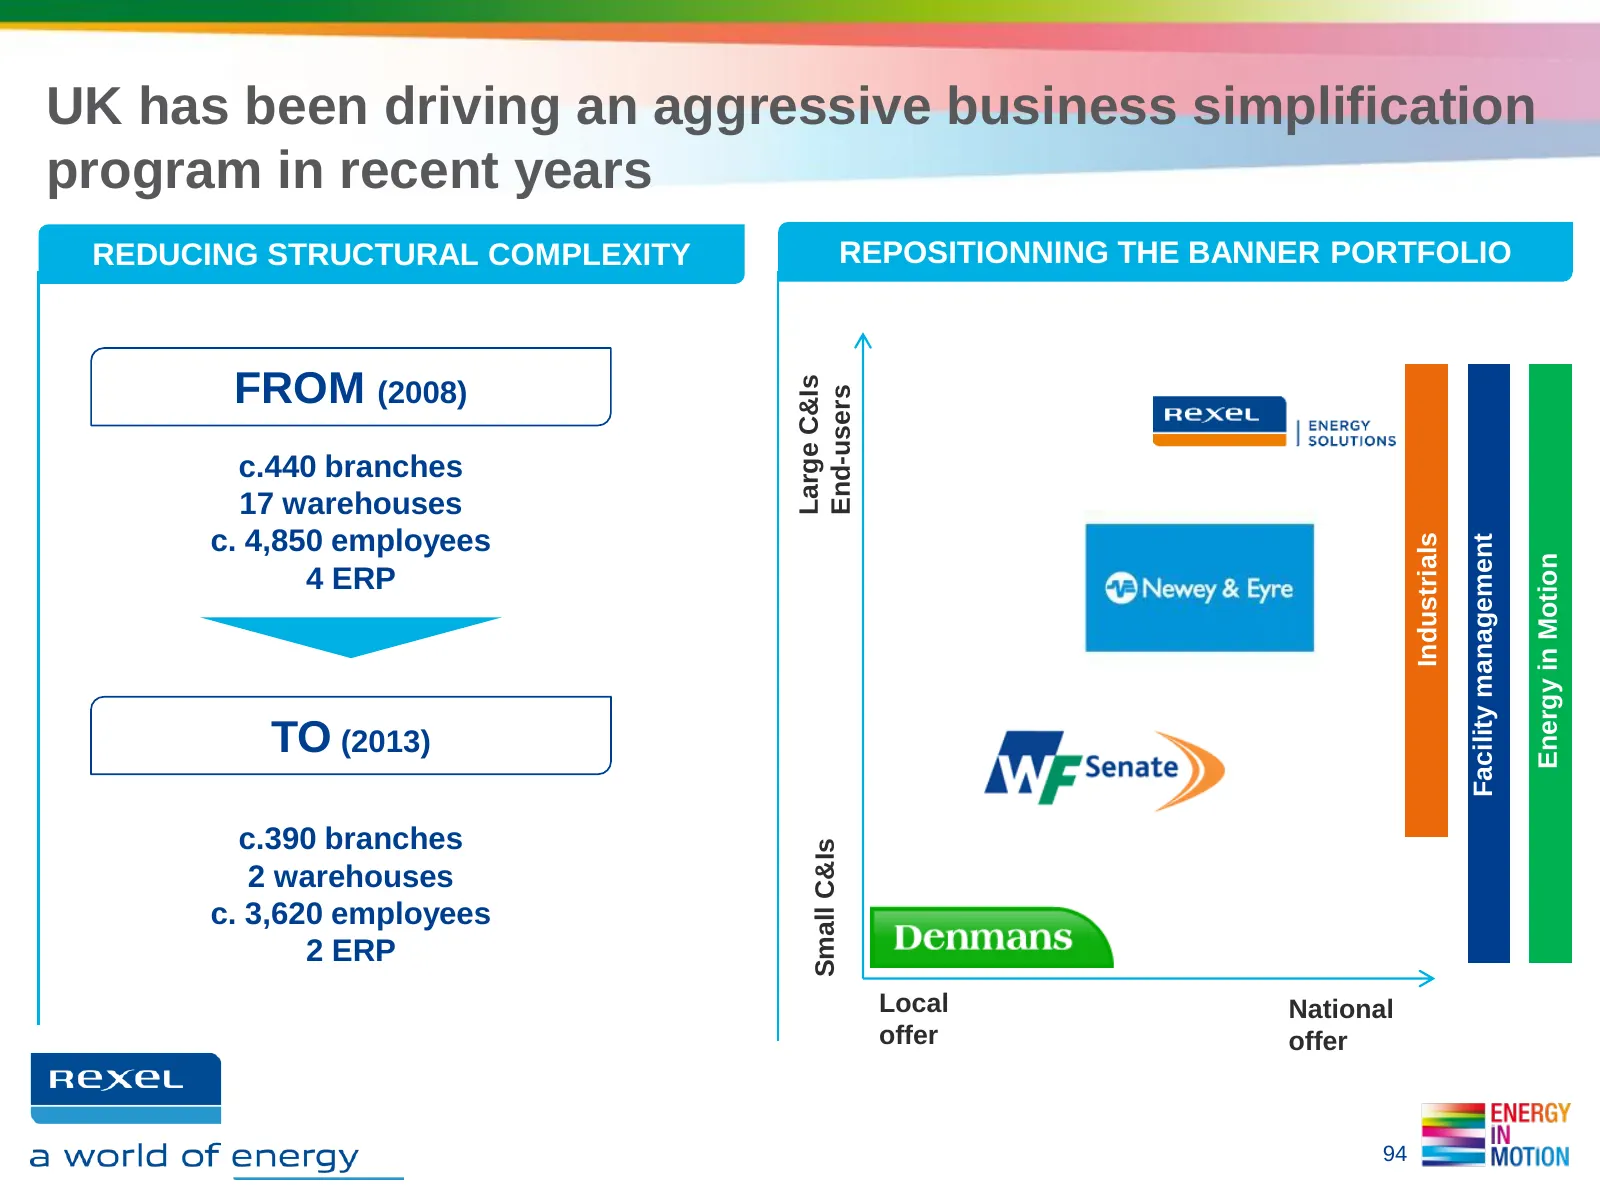
UK has been driving an aggressive business simplification program in recent years REDUCING STRUCTURAL COMPLEXITY REPOSITIONNING THE BANNER PORTFOLIO FROM (2008) Large C&Is End-users c.440 branches 17 warehouses c. 4,850 employees Industrials Facility management Energy in Motion 4 ERP TO (2013) c.390
Slide 95: Implementing a One ERP platform in the UK
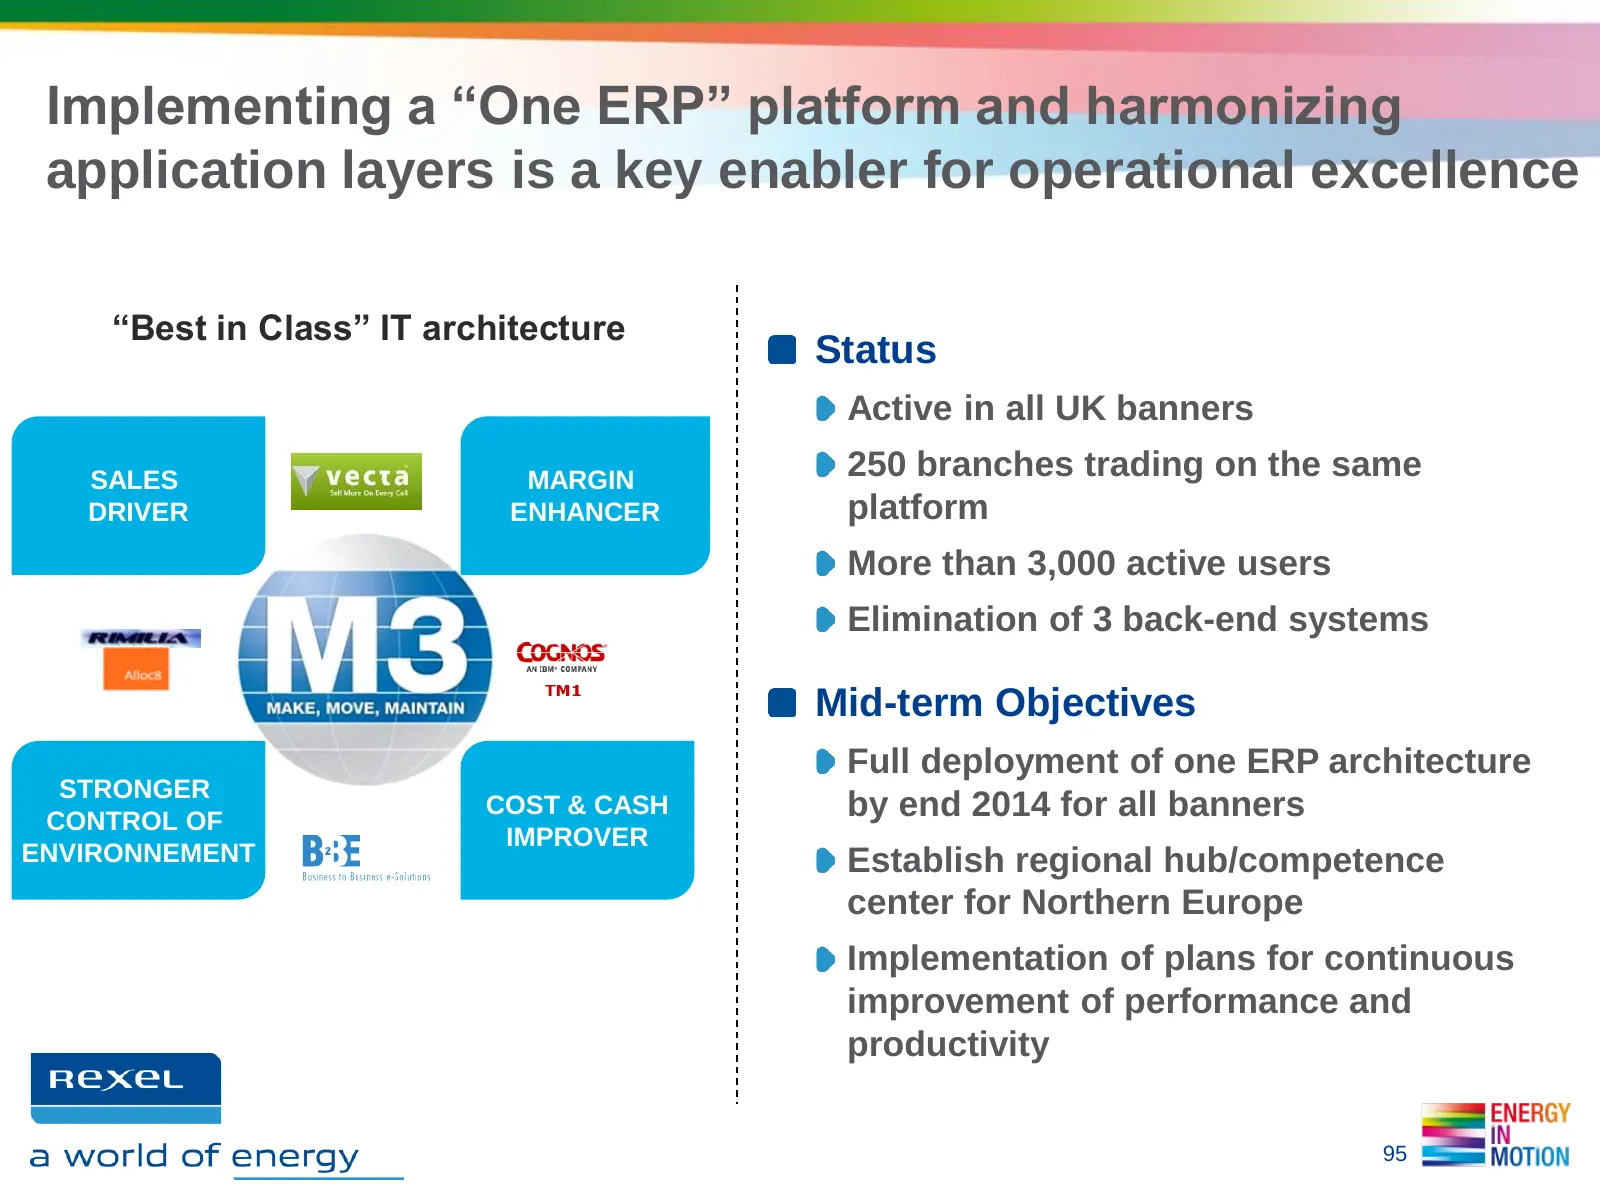
Implementing a “One ERP” platform and harmonizing application layers is a key enabler for operational excellence “Best in Class” IT architecture Status Active in all UK banners SALES MARGIN 250 branches trading on the same DRIVER ENHANCER platform More than 3,000 active users Elimination of 3 back-e
Slide 96: Efficiency gains through network optimization
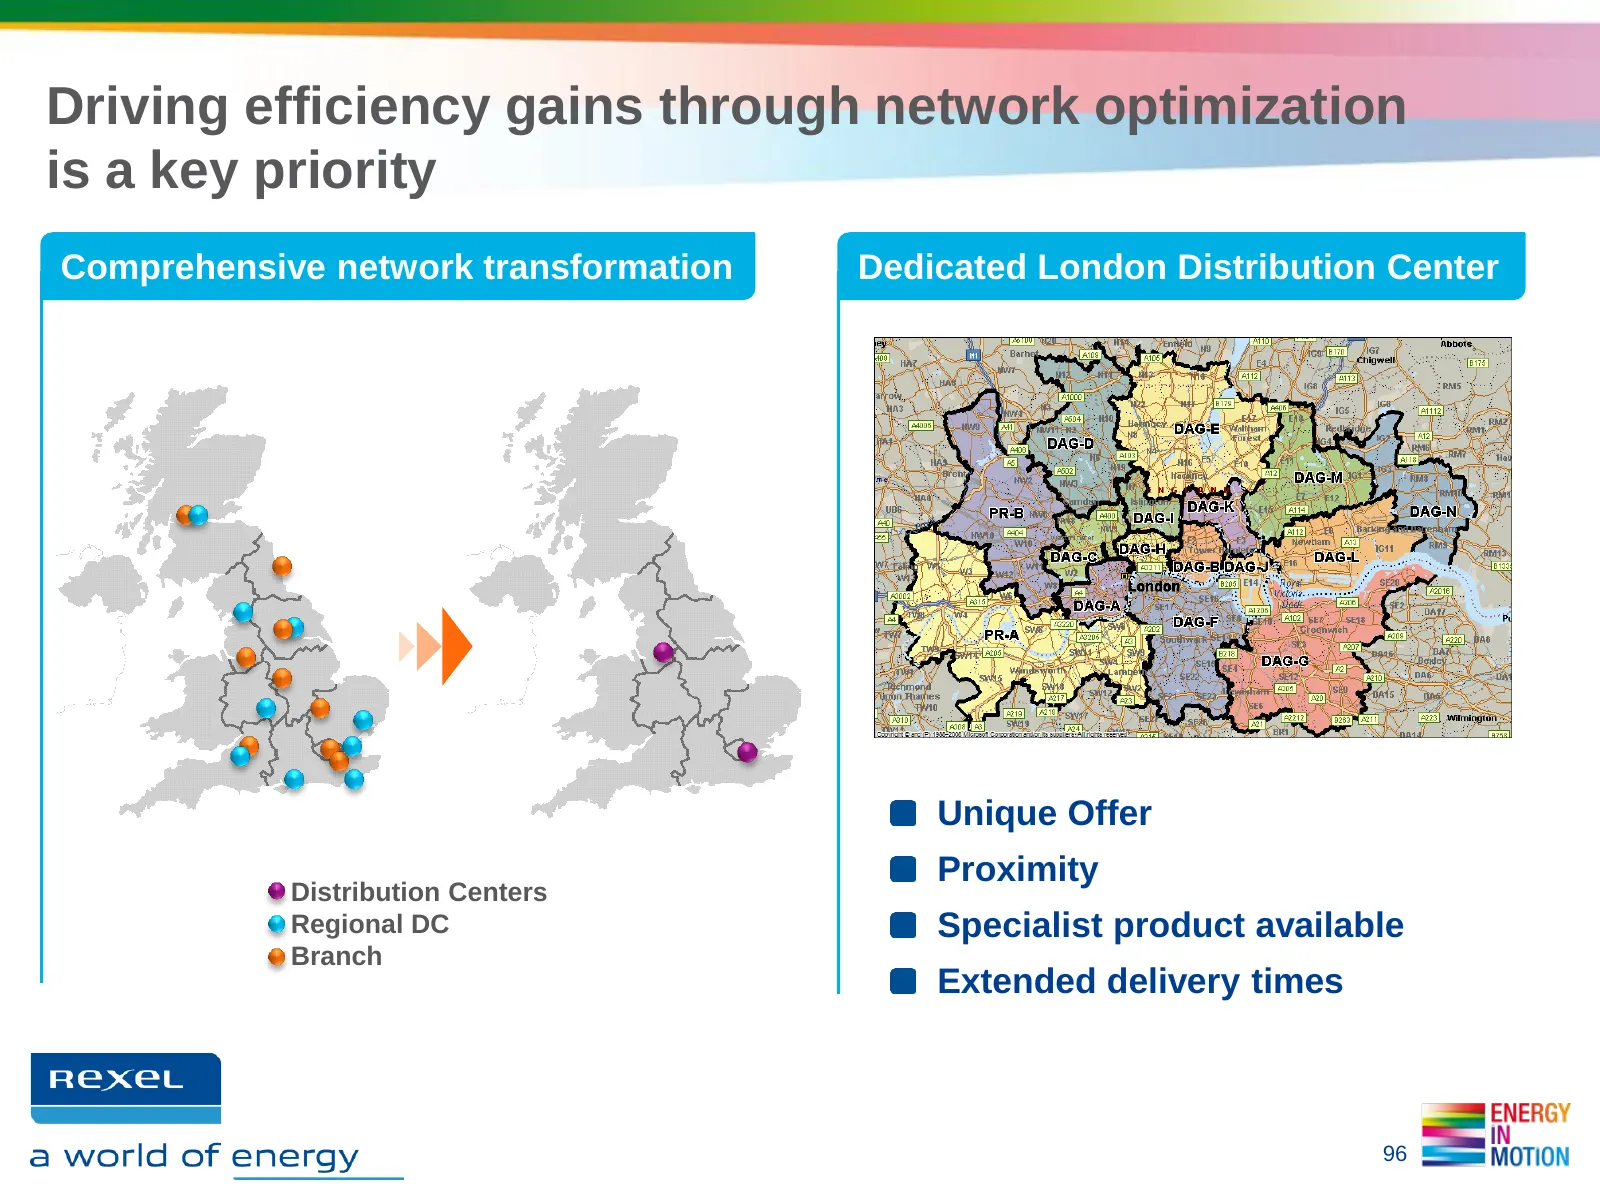
Driving efficiency gains through network optimization is a key priority Comprehensive network transformation Dedicated London Distribution Center Unique Offer Proximity Distribution Centers Regional DC Specialist product available Branch Extended delivery times 96
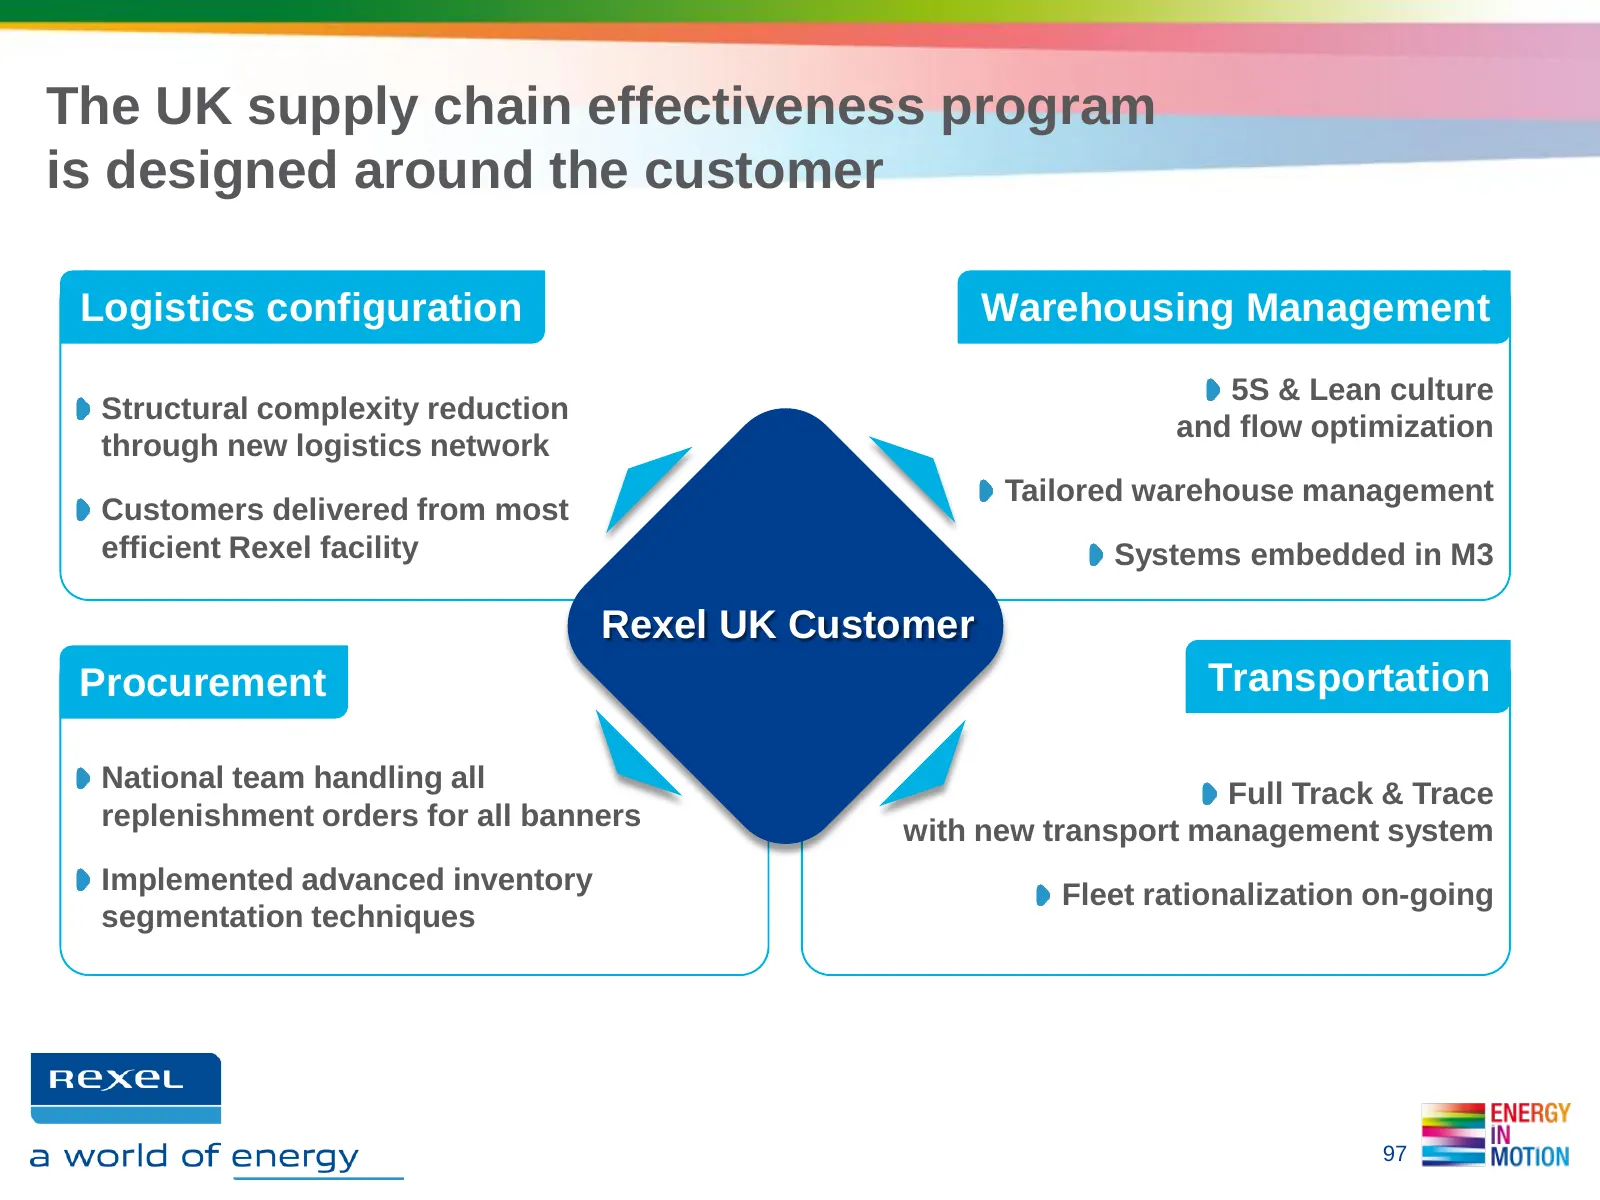
Slide 97: UK supply chain effectiveness program
The UK supply chain effectiveness program is designed around the customer Logistics configuration Warehousing Management 5S & Lean culture Structural complexity reduction and flow optimization through new logistics network Tailored warehouse management Customers delivered from most efficient Rexel f
Slide 98: 4.2 Operational excellence at work: USA
4.2. OPERATIONAL EXCELLENCE AT WORK: USA Chris HARTMANN, Executive VP and CEO, USA
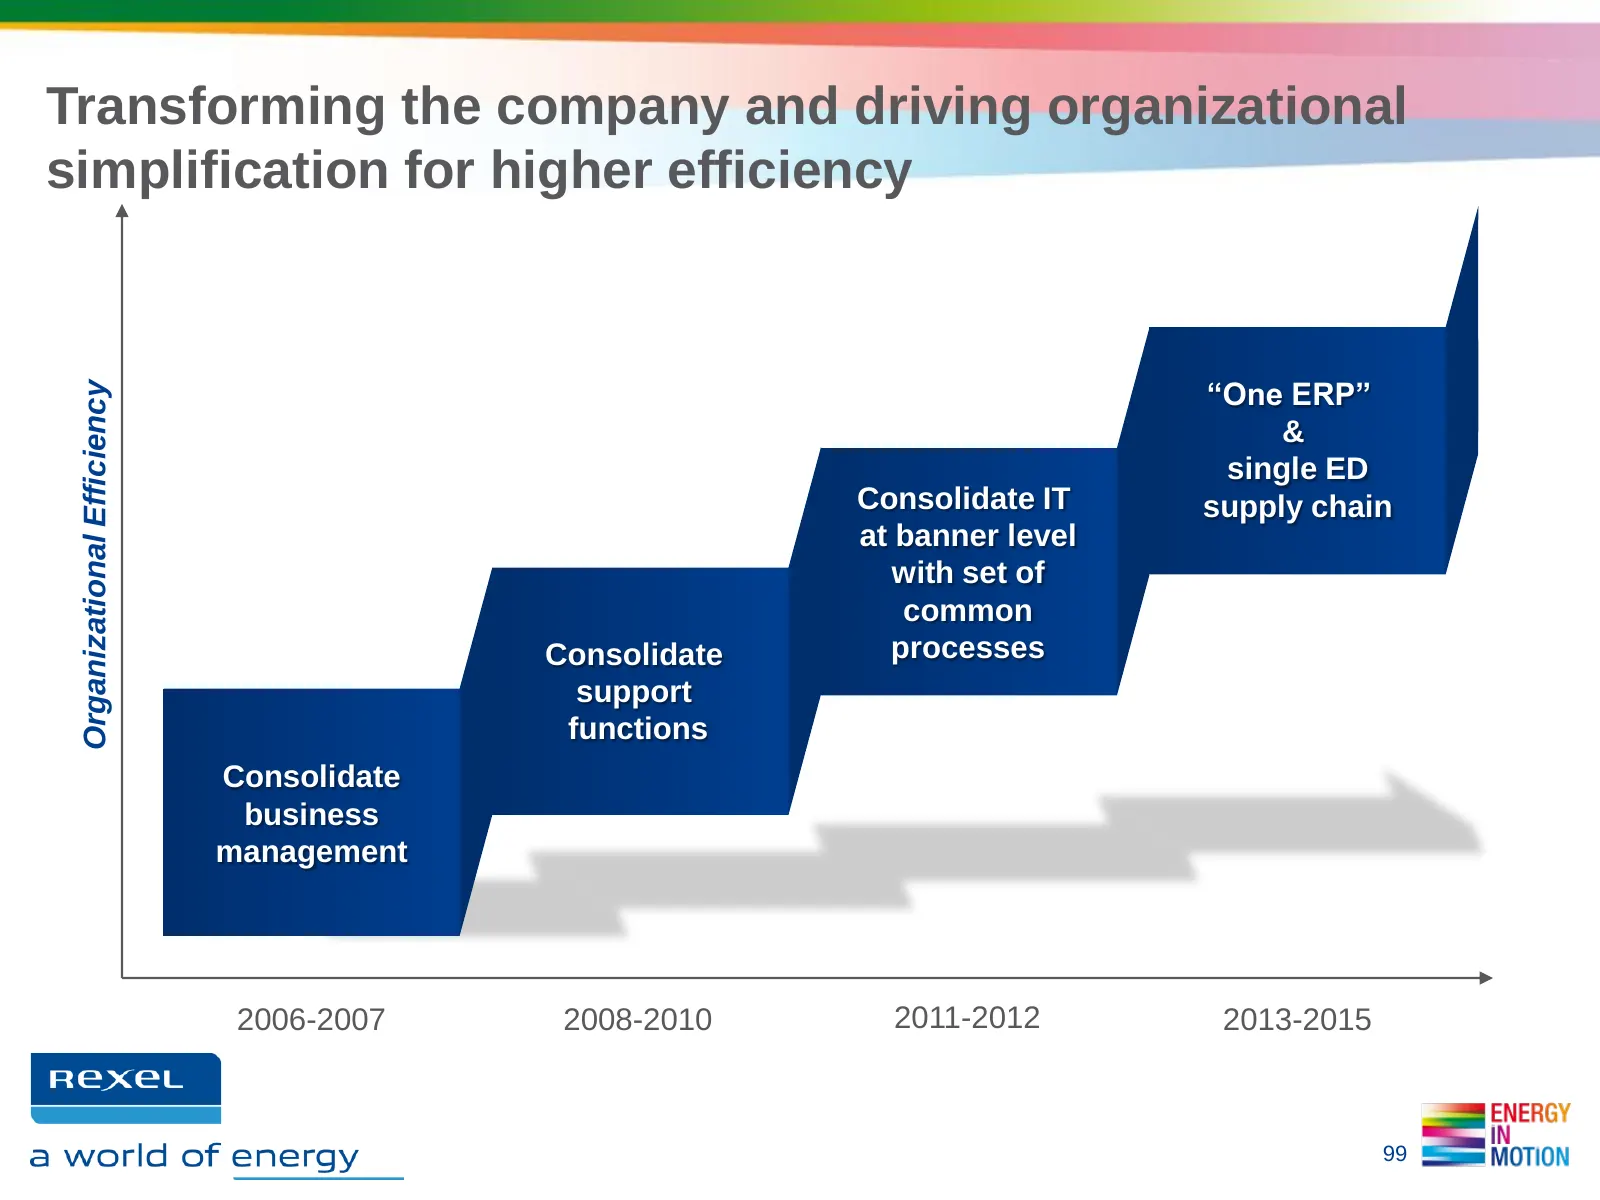
Slide 99: Driving organizational simplification for higher efficiency
Transforming the company and driving organizational simplification for higher efficiency “One ERP” Organizational Efficiency & single ED Consolidate IT supply chain at banner level with set of common Consolidate processes support functions Consolidate business management 2006-2007 2008-2010 2011-201
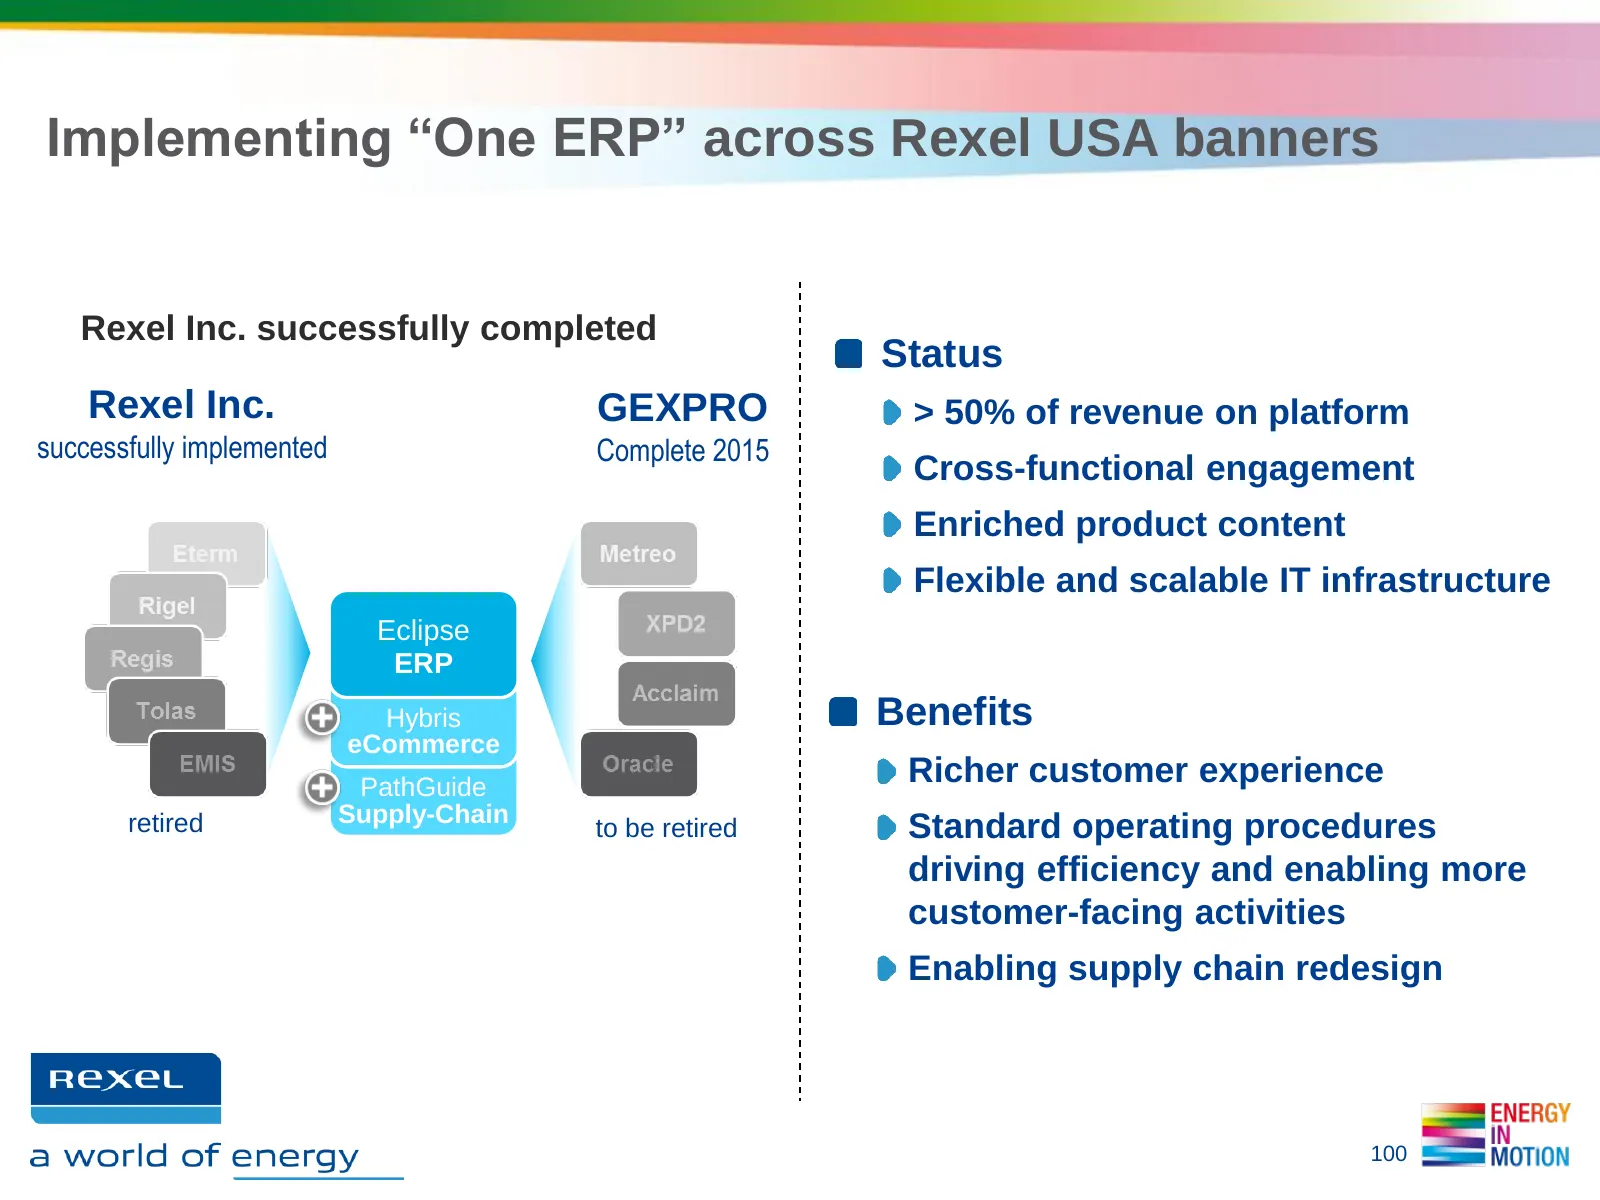
Slide 100: Implementing One ERP across Rexel USA banners
Implementing “One ERP” across Rexel USA banners Rexel Inc. successfully completed Status Rexel Inc. GEXPRO > 50% of revenue on platform successfully implemented Complete 2015 Cross-functional engagement Enriched product content Flexible and scalable IT infrastructure Eclipse ERP Hybris Benefits eCom
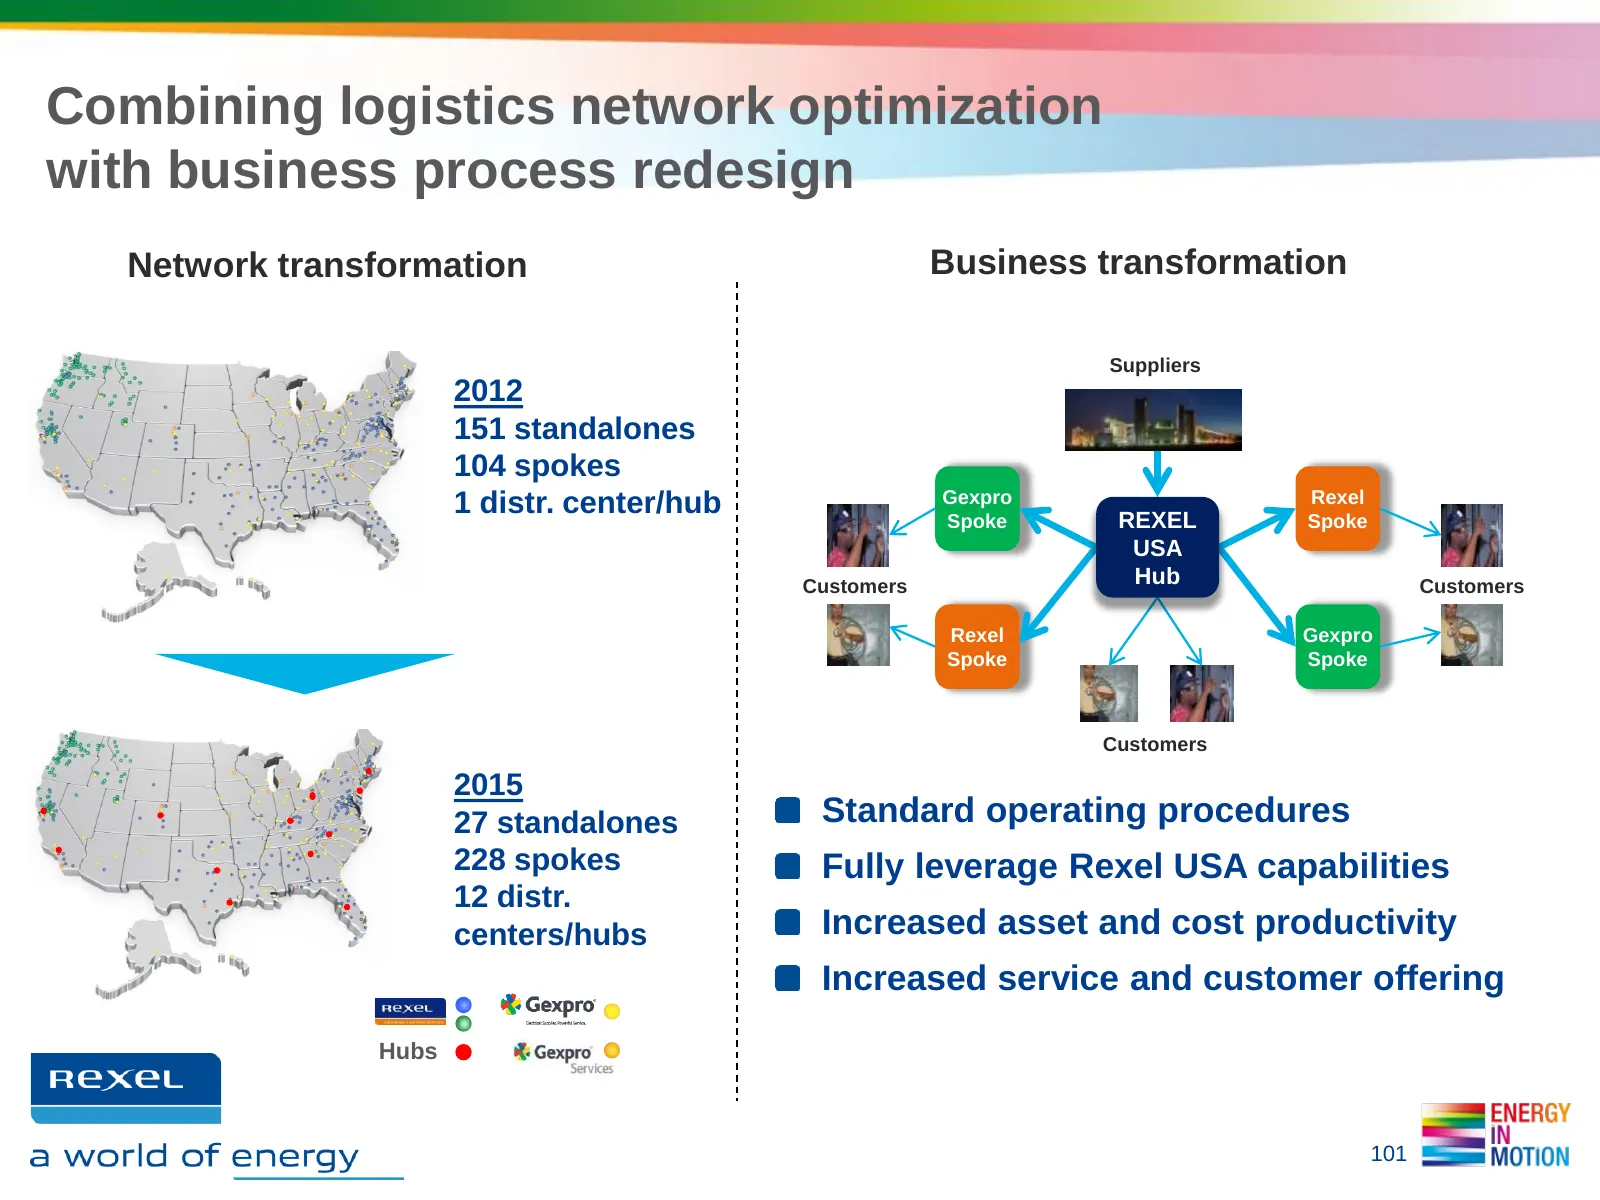
Slide 101: Logistics network optimization with business process redesign
Combining logistics network optimization with business process redesign Network transformation Business transformation Suppliers 2012 151 standalones 104 spokes 1 distr. center/hub Gexpro Rexel Spoke REXEL Spoke USA Customers Hub Customers Rexel Gexpro Spoke Spoke Customers 2015 27 standalones Stand
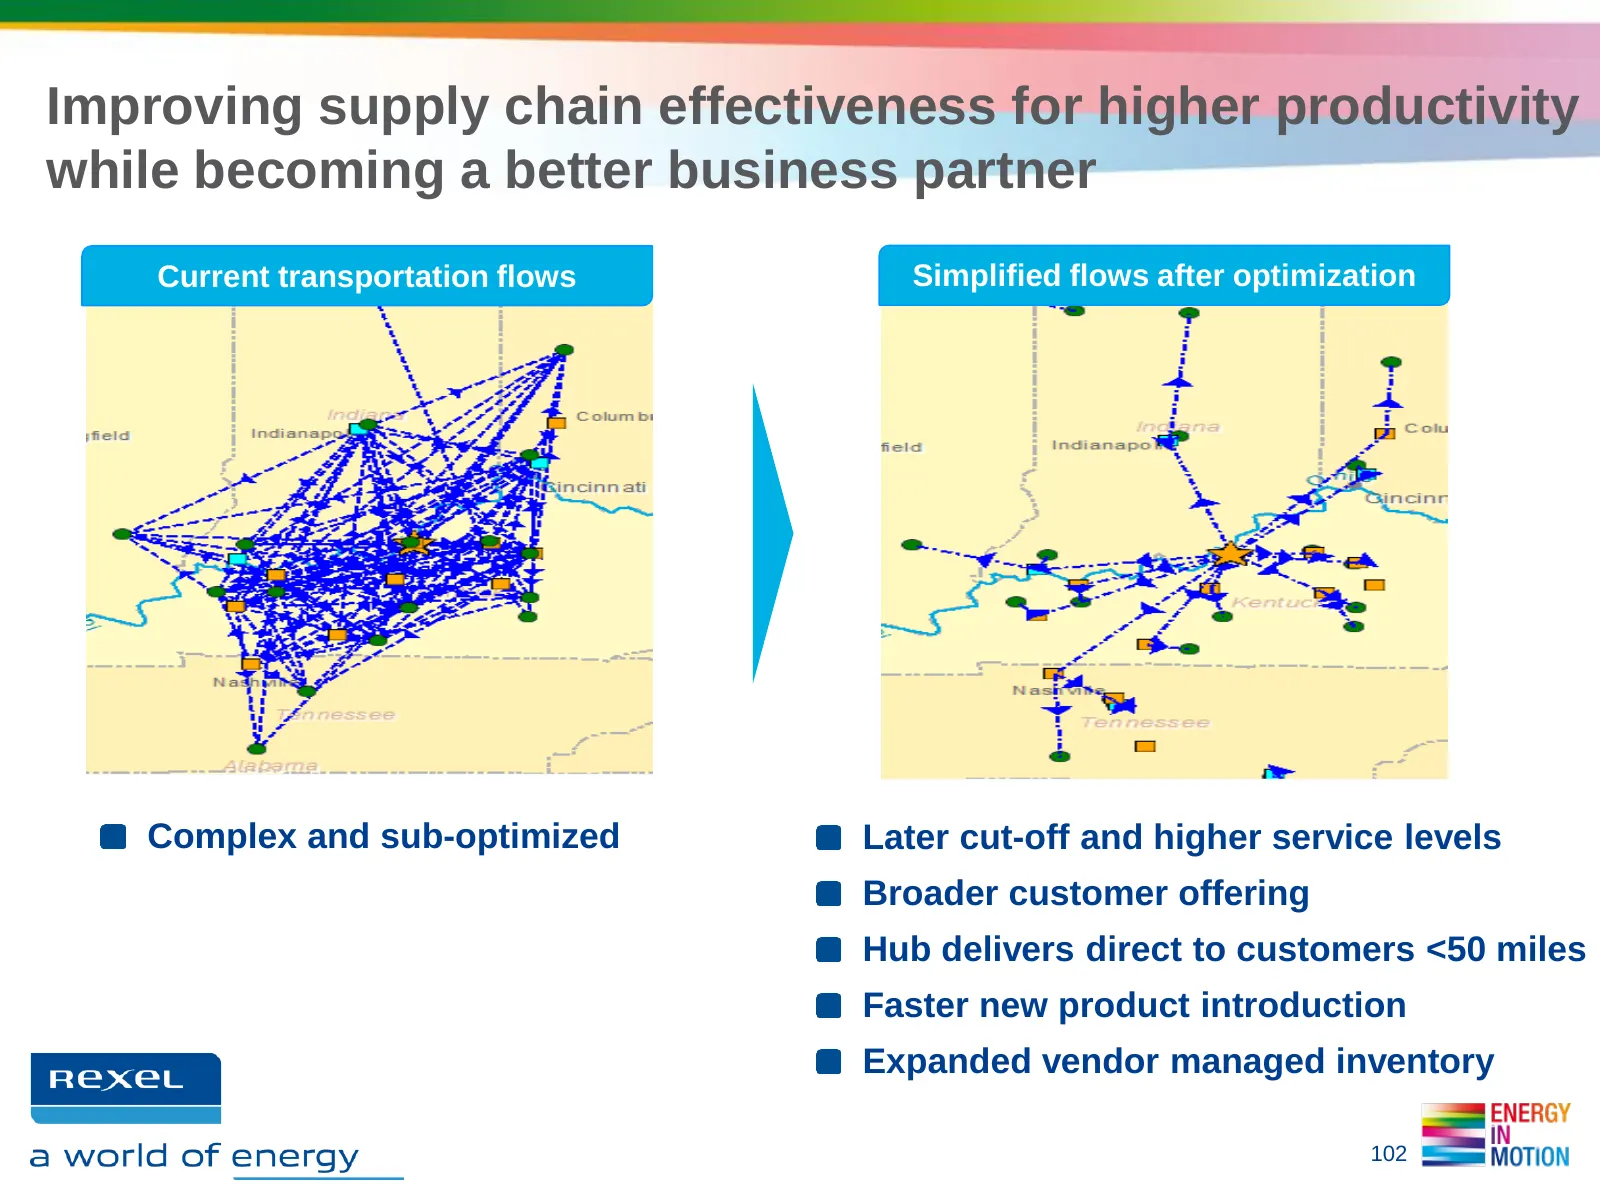
Slide 102: Improving supply chain effectiveness for higher productivity
Improving supply chain effectiveness for higher productivity while becoming a better business partner Current transportation flows Simplified flows after optimization Complex and sub-optimized Later cut-off and higher service levels Broader customer offering Hub delivers direct to customers <50 mile
Slide 103: 5. Enhancing financial performance
5. ENHANCING FINANCIAL PERFORMANCE Catherine GUILLOUARD, Management Board member, Group Senior VP, Group CFO
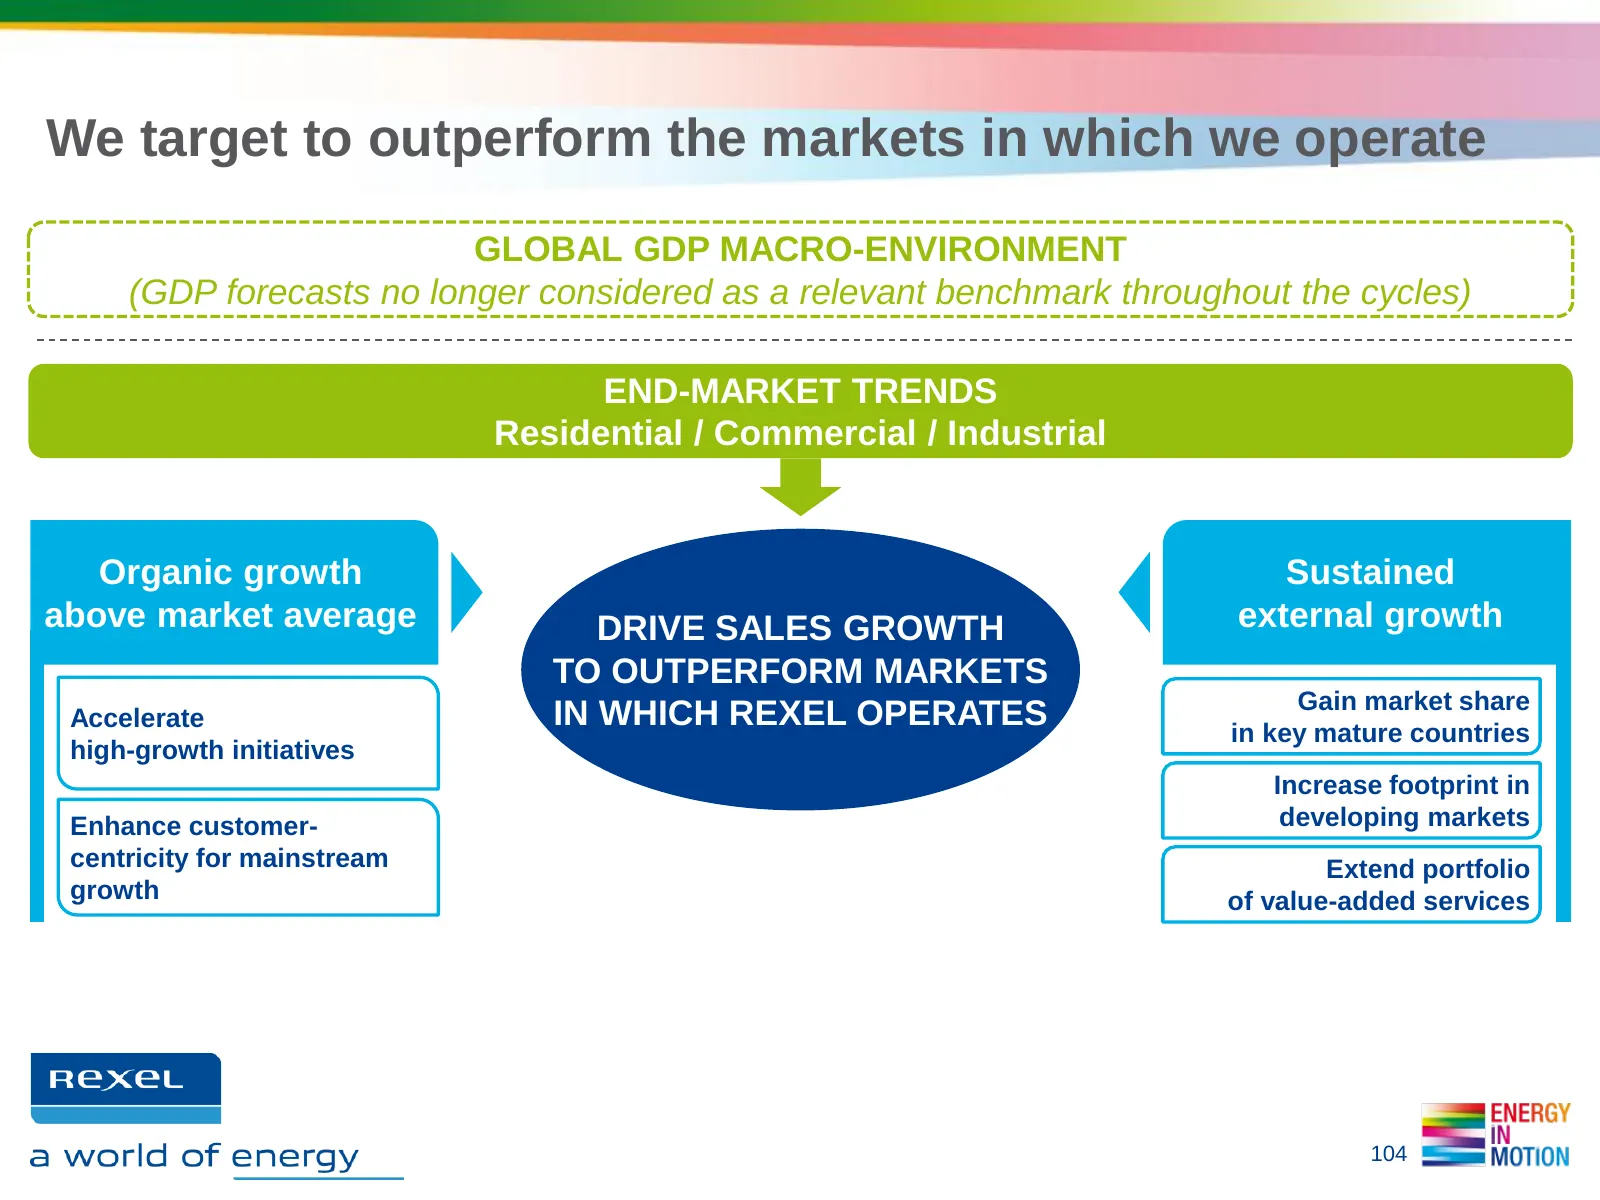
Slide 104: We target to outperform our markets
We target to outperform the markets in which we operate GLOBAL GDP MACRO-ENVIRONMENT (GDP forecasts no longer considered as a relevant benchmark throughout the cycles) END-MARKET TRENDS Residential / Commercial / Industrial Organic growth Sustained above market average DRIVE SALES GROWTH external gr
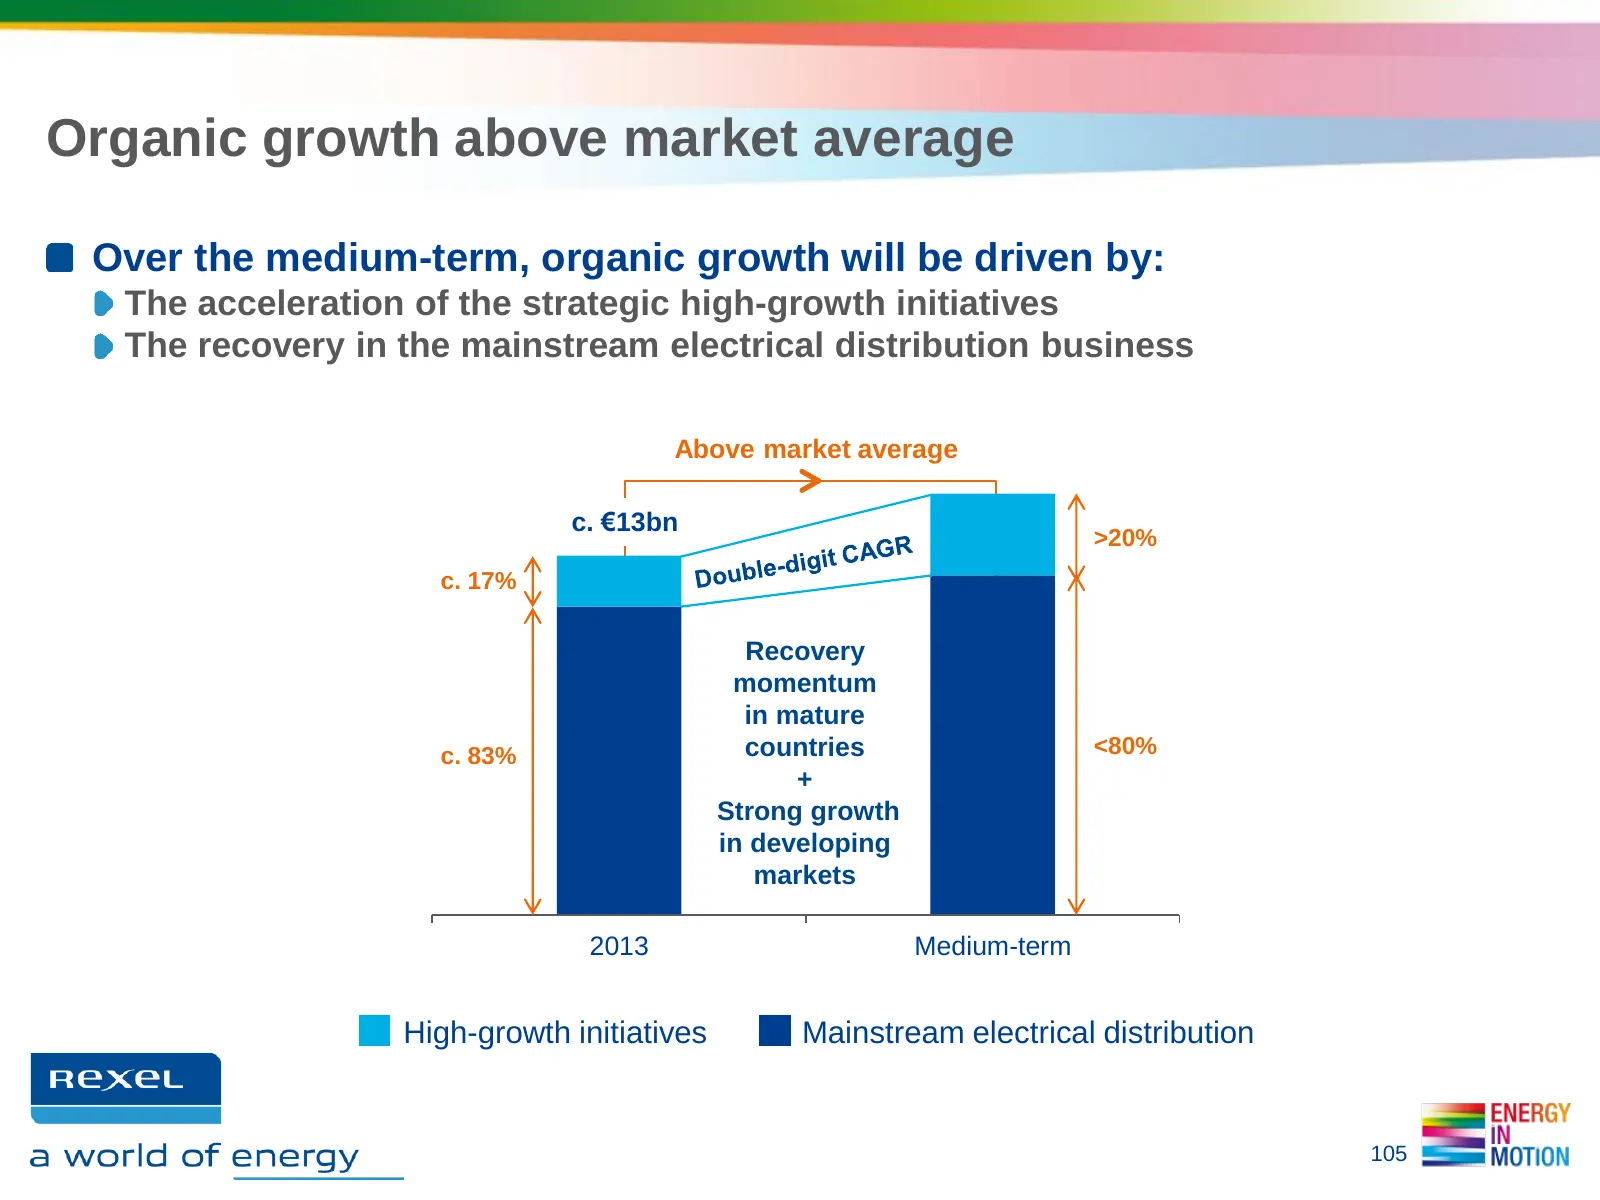
Slide 105: Organic growth above market average
Organic growth above market average Over the medium-term, organic growth will be driven by: The acceleration of the strategic high-growth initiatives The recovery in the mainstream electrical distribution business Above market average c. €13bn >20% c. 17% Recovery momentum in mature c. 83% countries
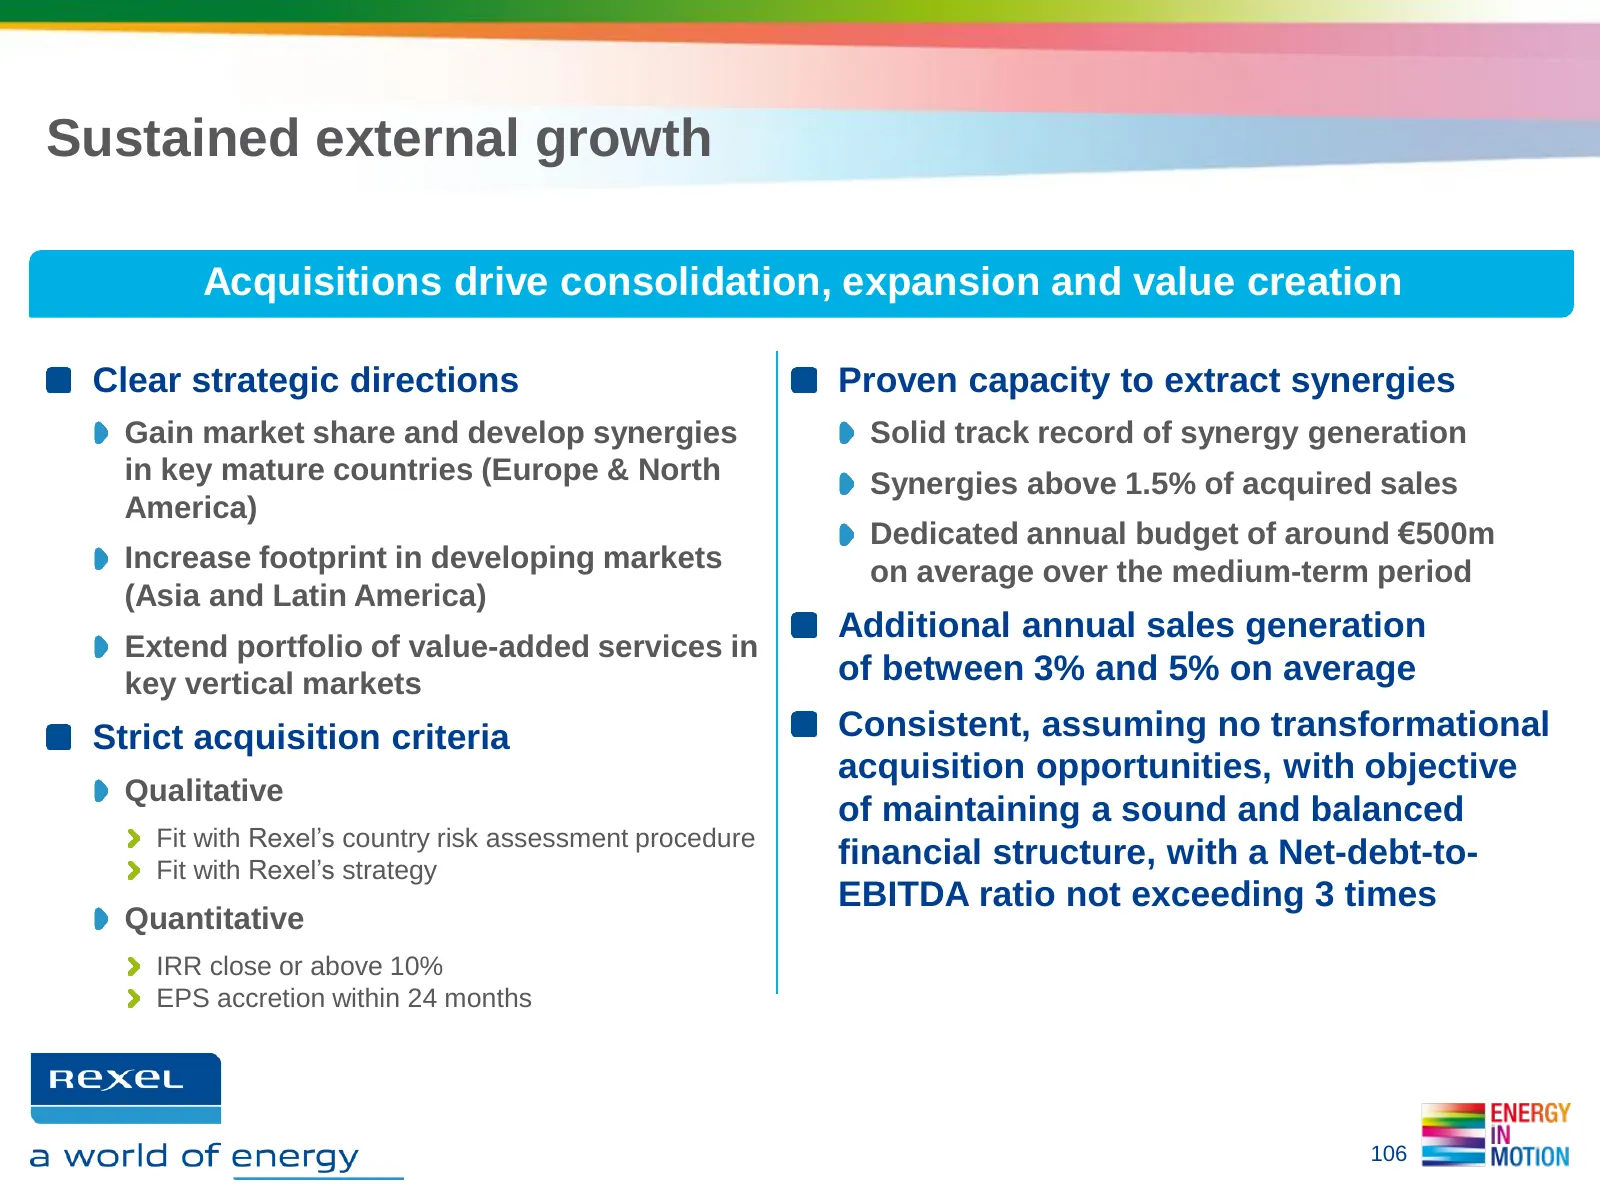
Slide 106: Sustained external growth
Sustained external growth Acquisitions drive consolidation, expansion and value creation Clear strategic directions Proven capacity to extract synergies Gain market share and develop synergies Solid track record of synergy generation in key mature countries (Europe & North Synergies above 1.5% of ac
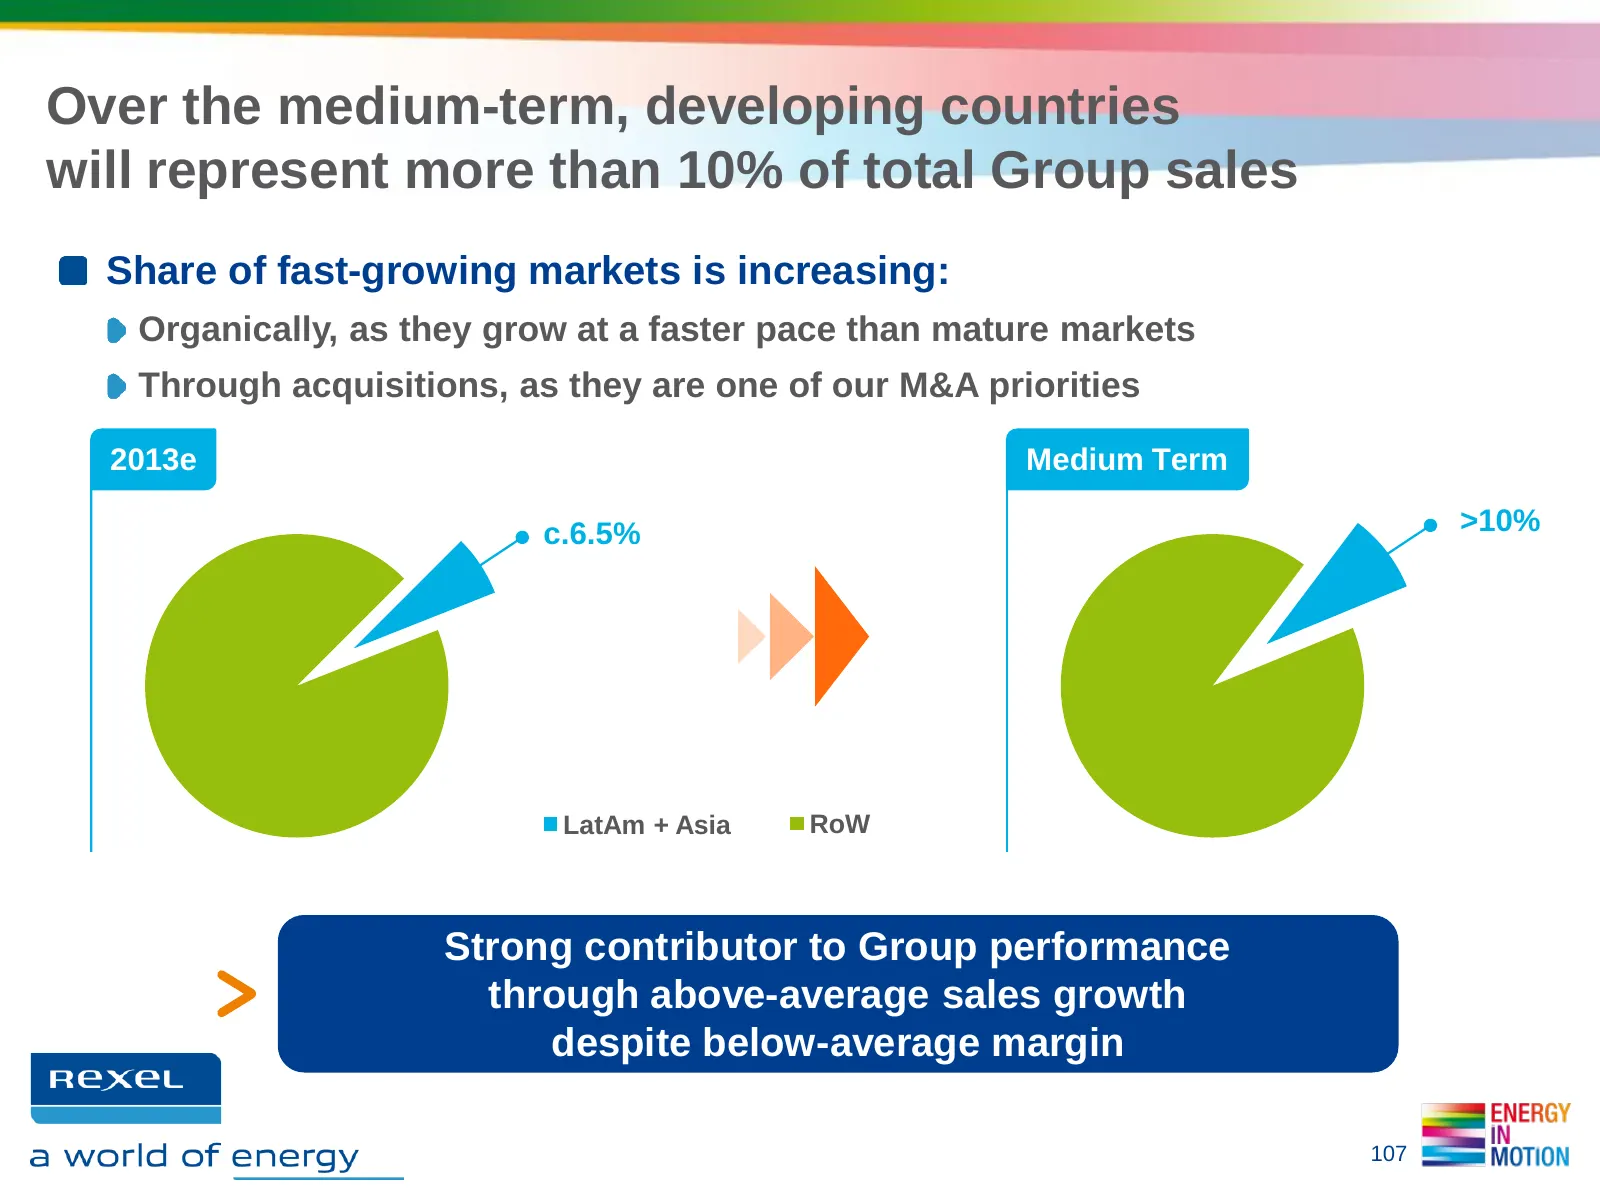
Slide 107: Developing countries above 10% of Group sales
Over the medium-term, developing countries will represent more than 10% of total Group sales Share of fast-growing markets is increasing: Organically, as they grow at a faster pace than mature markets Through acquisitions, as they are one of our M&A priorities 2013e Medium Term c.6.5% >10% LatAm + A
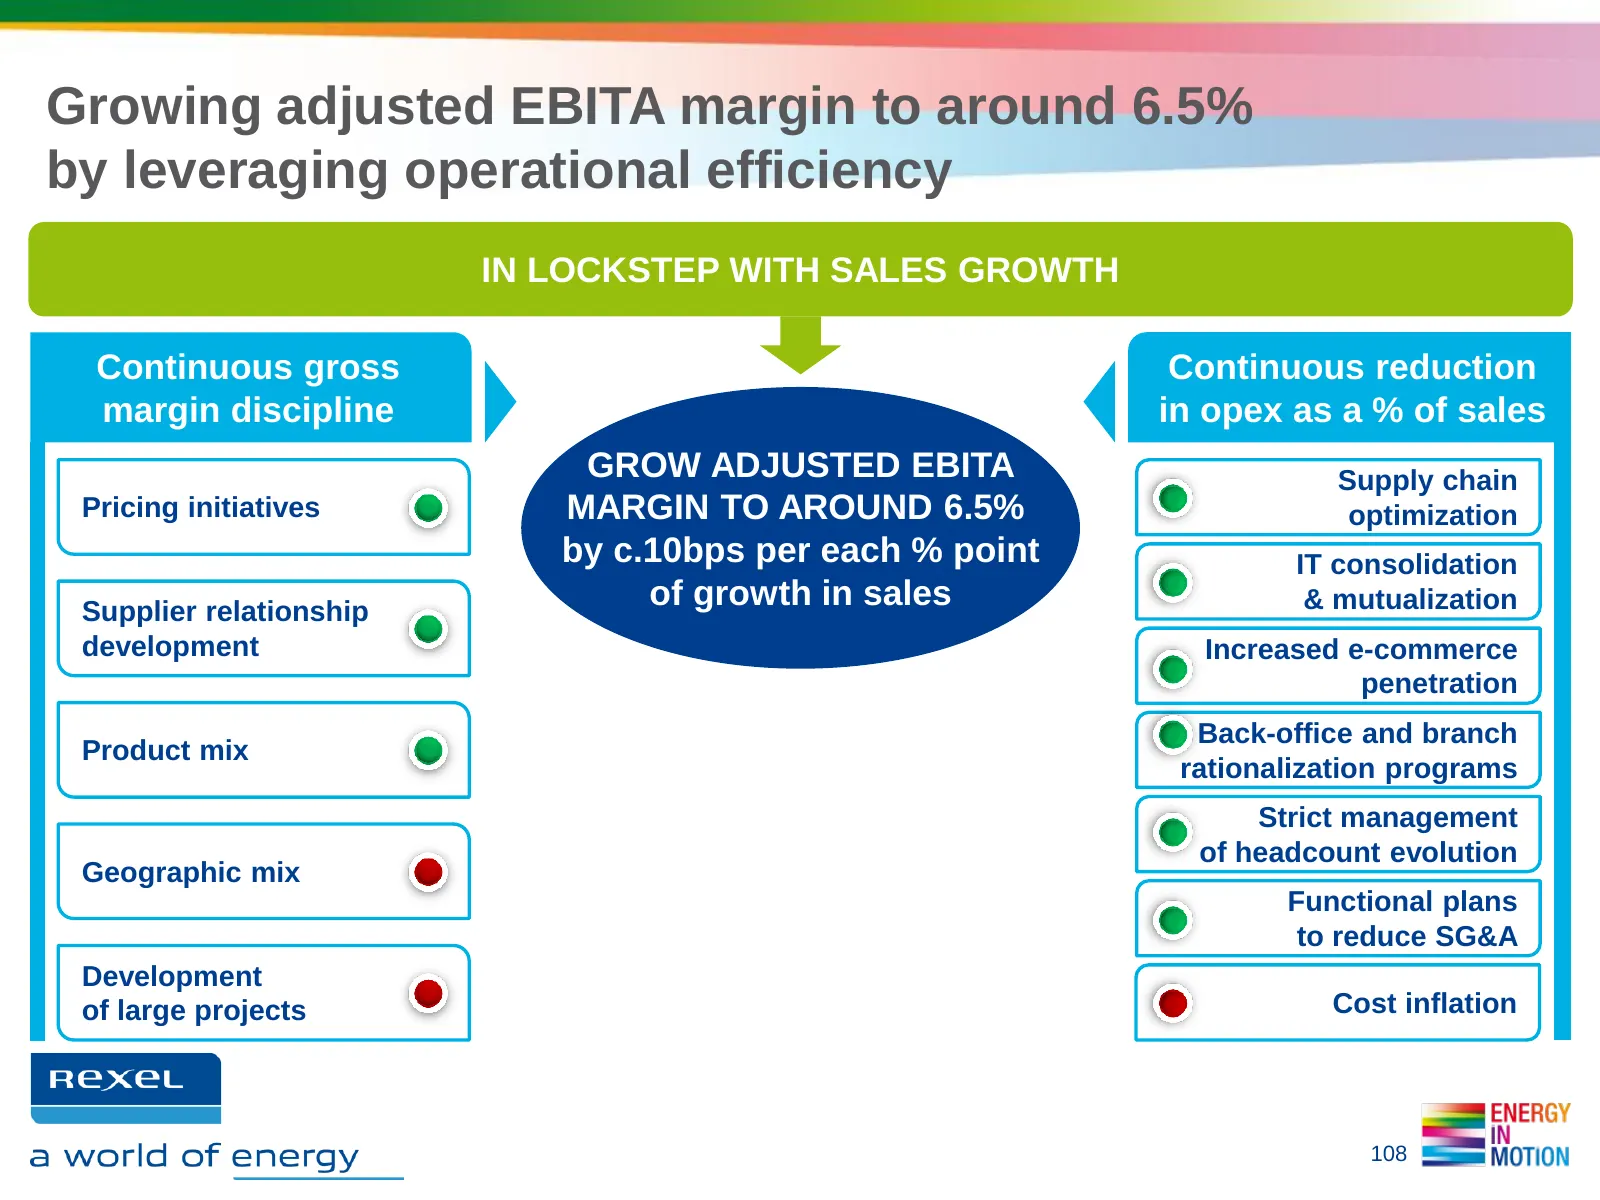
Slide 108: Growing adjusted EBITA margin to around 6.5%
Growing adjusted EBITA margin to around 6.5% by leveraging operational efficiency IN LOCKSTEP WITH SALES GROWTH Continuous gross Continuous reduction margin discipline in opex as a % of sales GROW ADJUSTED EBITA Supply chain Pricing initiatives MARGIN TO AROUND 6.5% optimization by c.10bps per each
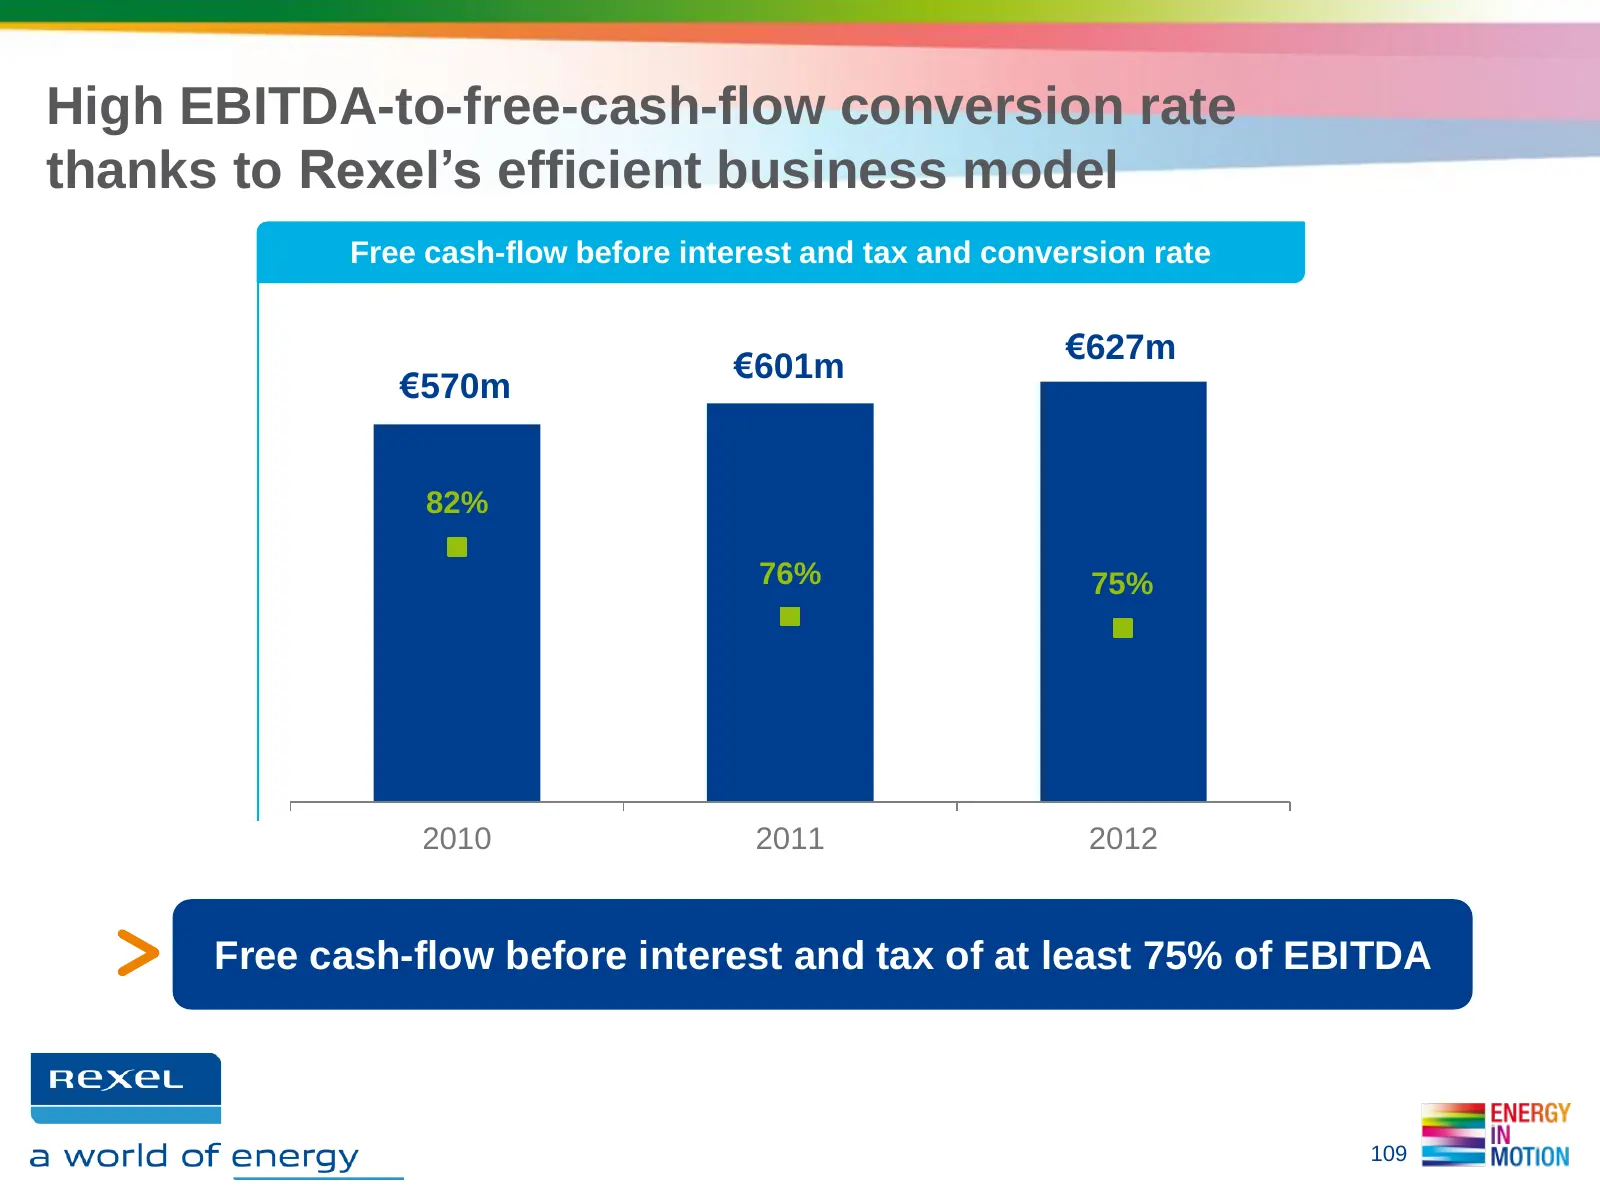
Slide 109: High EBITDA-to-free-cash-flow conversion
High EBITDA-to-free-cash-flow conversion rate thanks to Rexel’s efficient business model Free cash-flow before interest and tax and conversion rate 700 €627m €601m €570m 600 500 82% 400 76% 75% 300 200 100 0 60% 2010 2011 2012 Free cash-flow before interest and tax of at least 75% of EBITDA 109
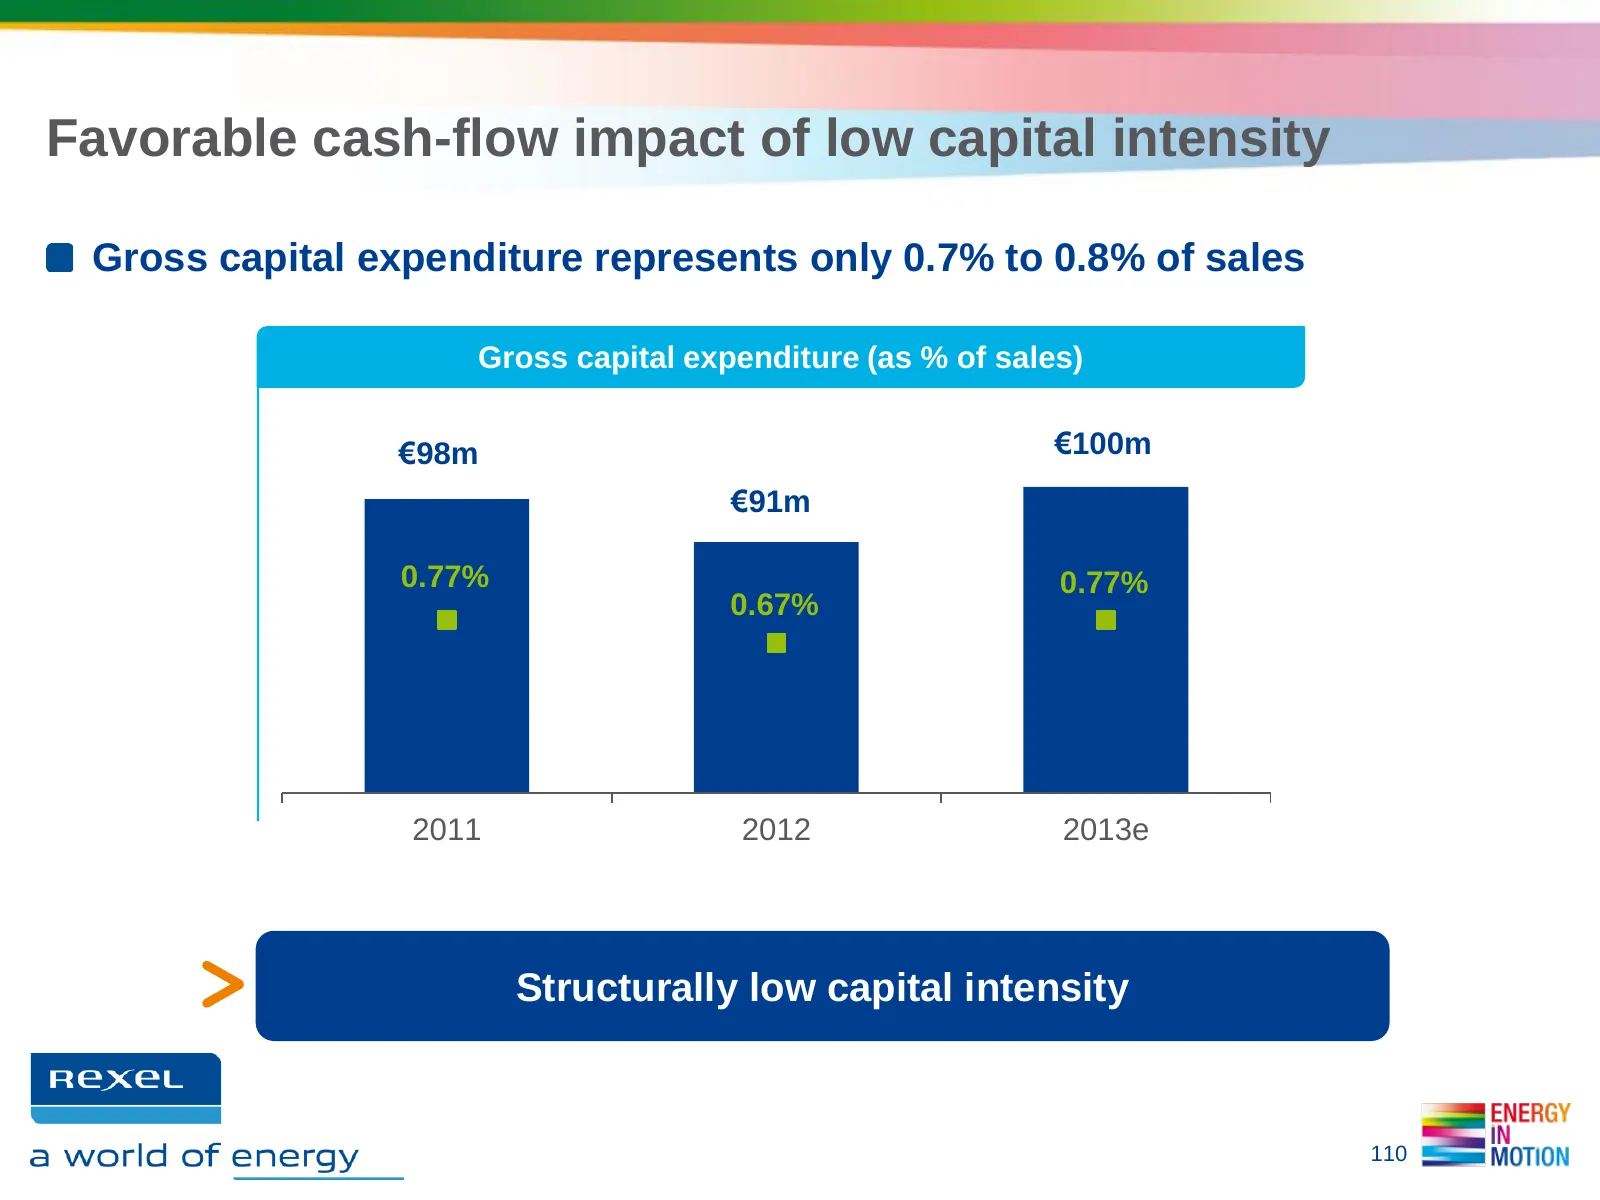
Slide 110: Favorable cash-flow impact of low capital intensity
Favorable cash-flow impact of low capital intensity Gross capital expenditure represents only 0.7% to 0.8% of sales Gross capital expenditure (as % of sales) €98m €100m €91m 0.77% 0.77% 0.67% 2011 2012 2013e Structurally low capital intensity 110
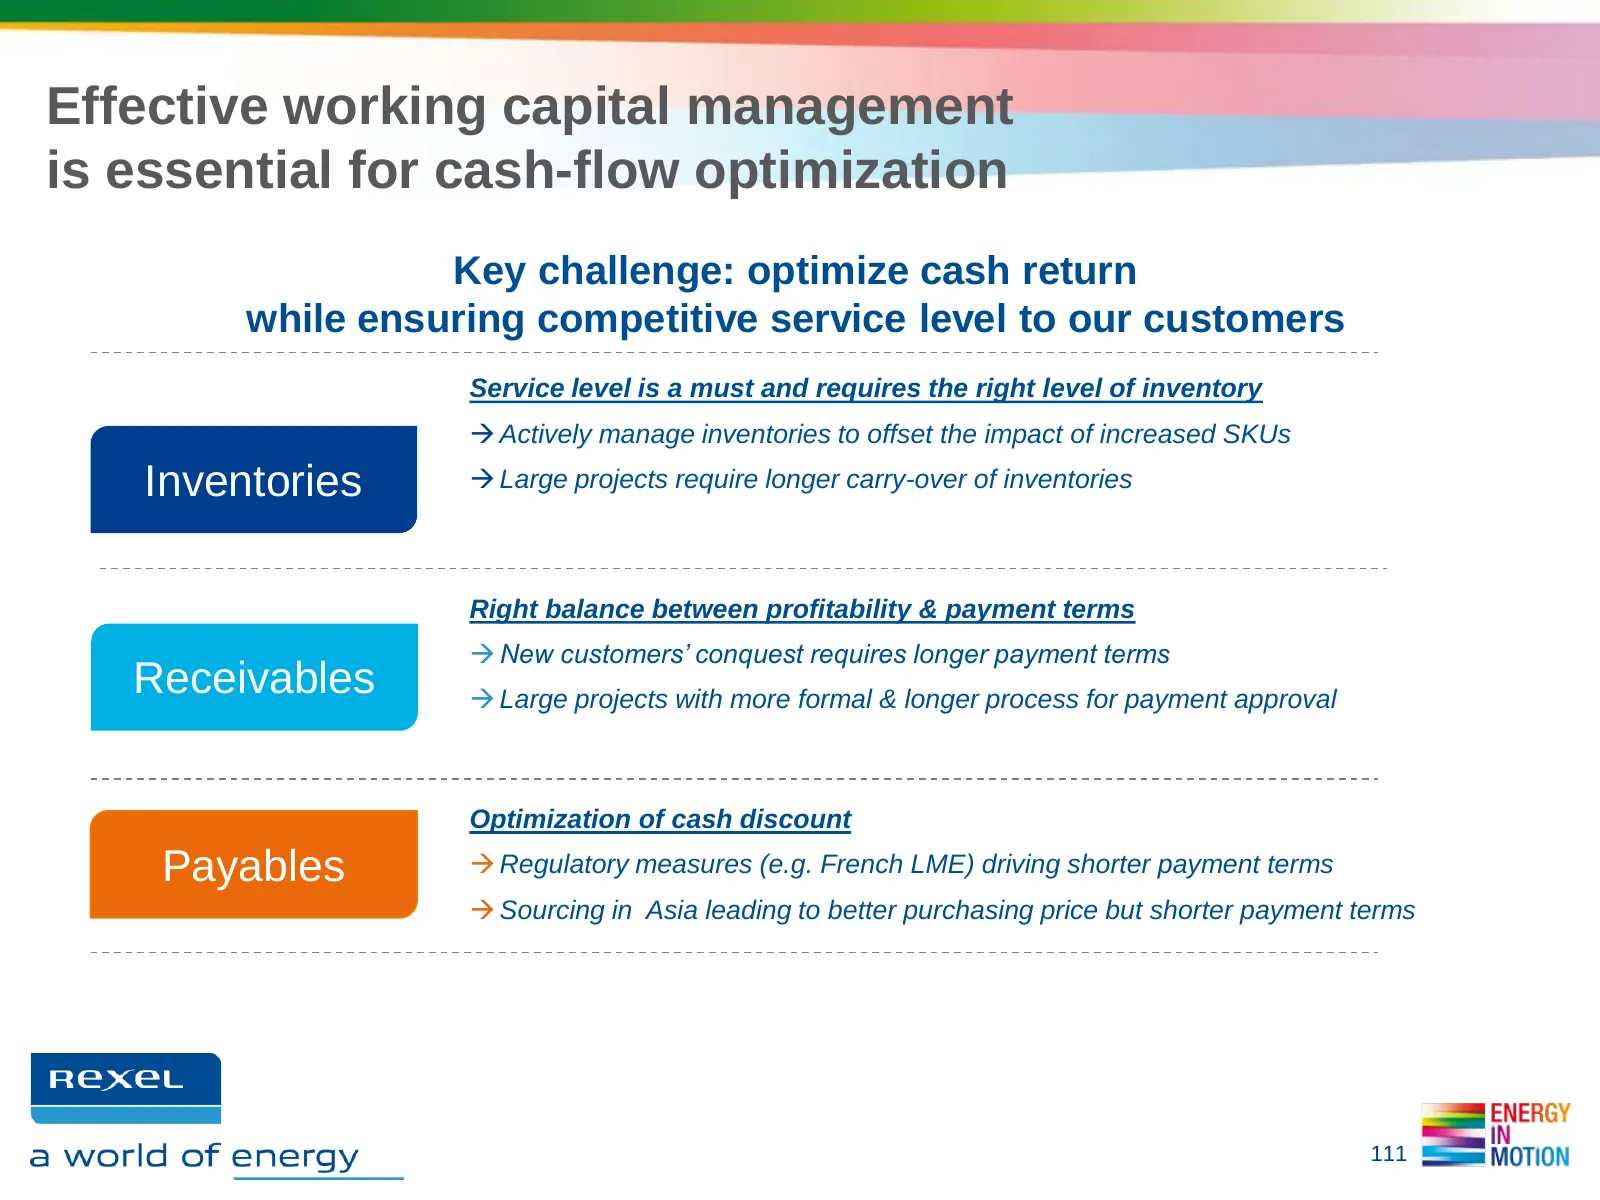
Slide 111: Effective working capital management
Effective working capital management is essential for cash-flow optimization Key challenge: optimize cash return while ensuring competitive service level to our customers Service level is a must and requires the right level of inventory Actively manage inventories to offset the impact of increased
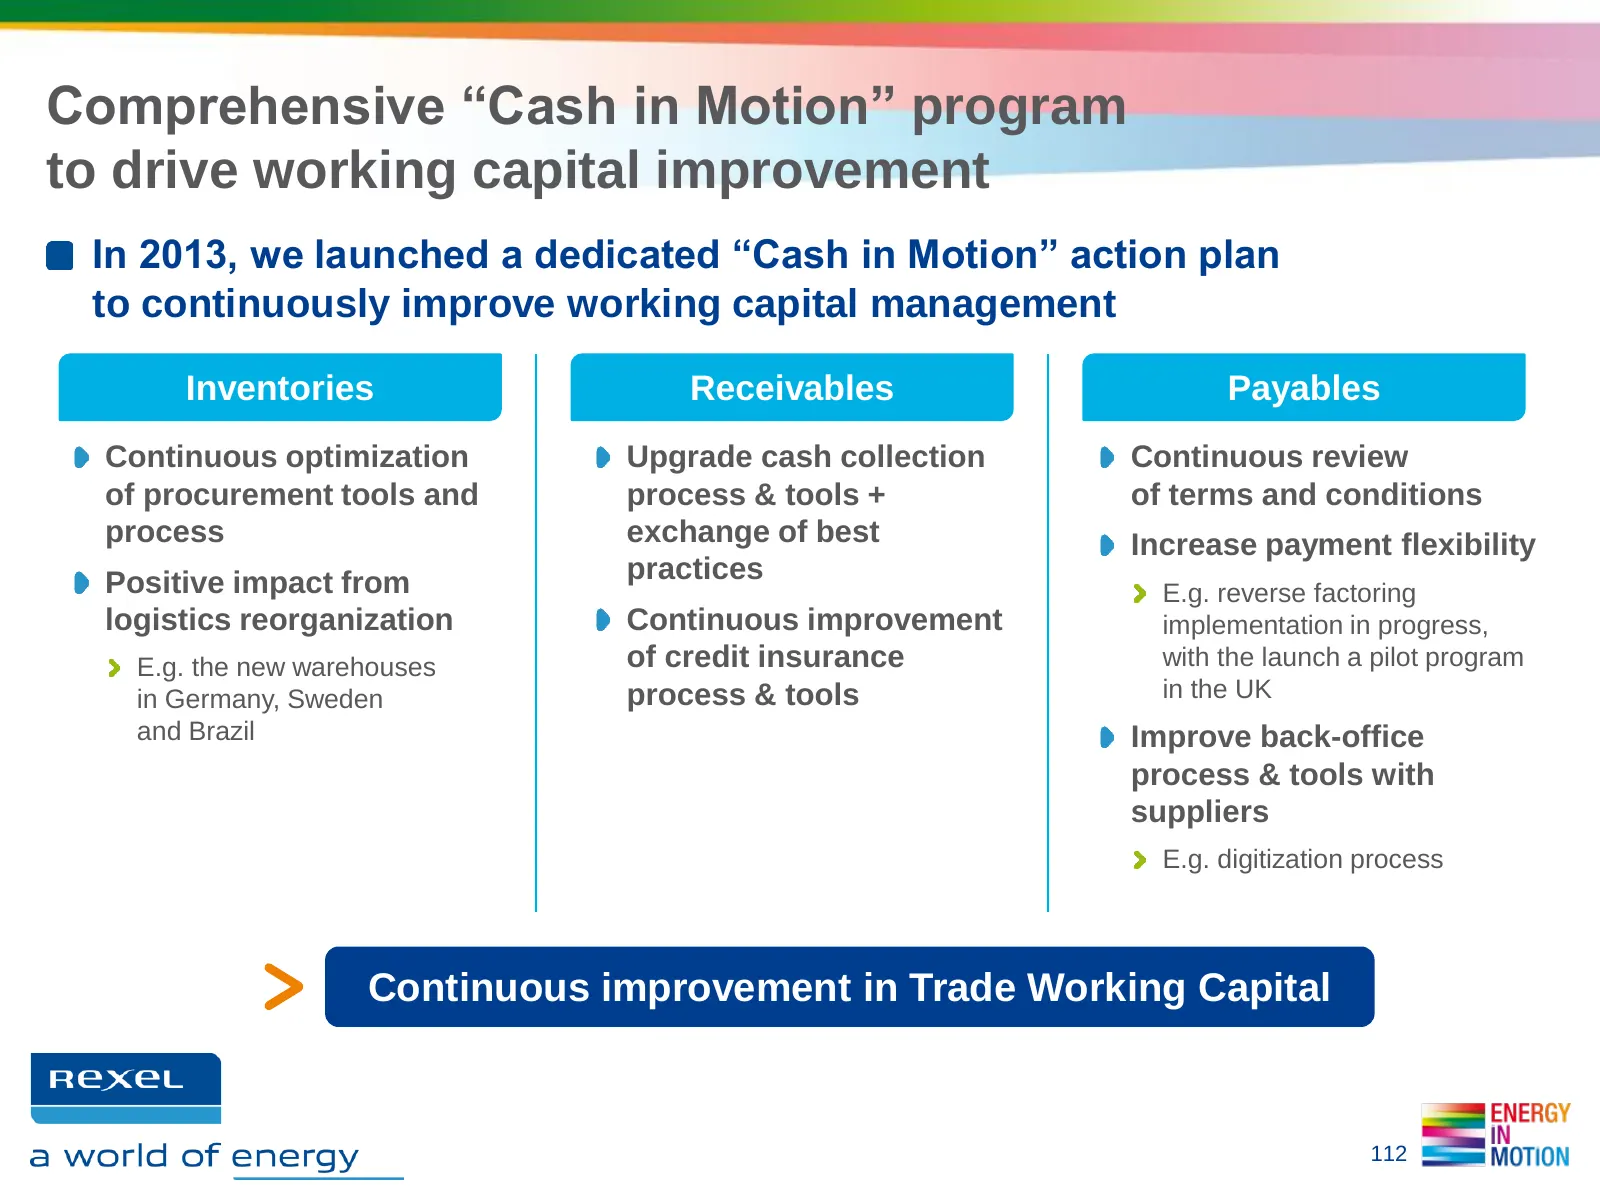
Slide 112: Cash in Motion program
Comprehensive “Cash in Motion” program to drive working capital improvement In 2013, we launched a dedicated “Cash in Motion” action plan to continuously improve working capital management Inventories Receivables Payables Continuous optimization Upgrade cash collection Continuous review of procureme
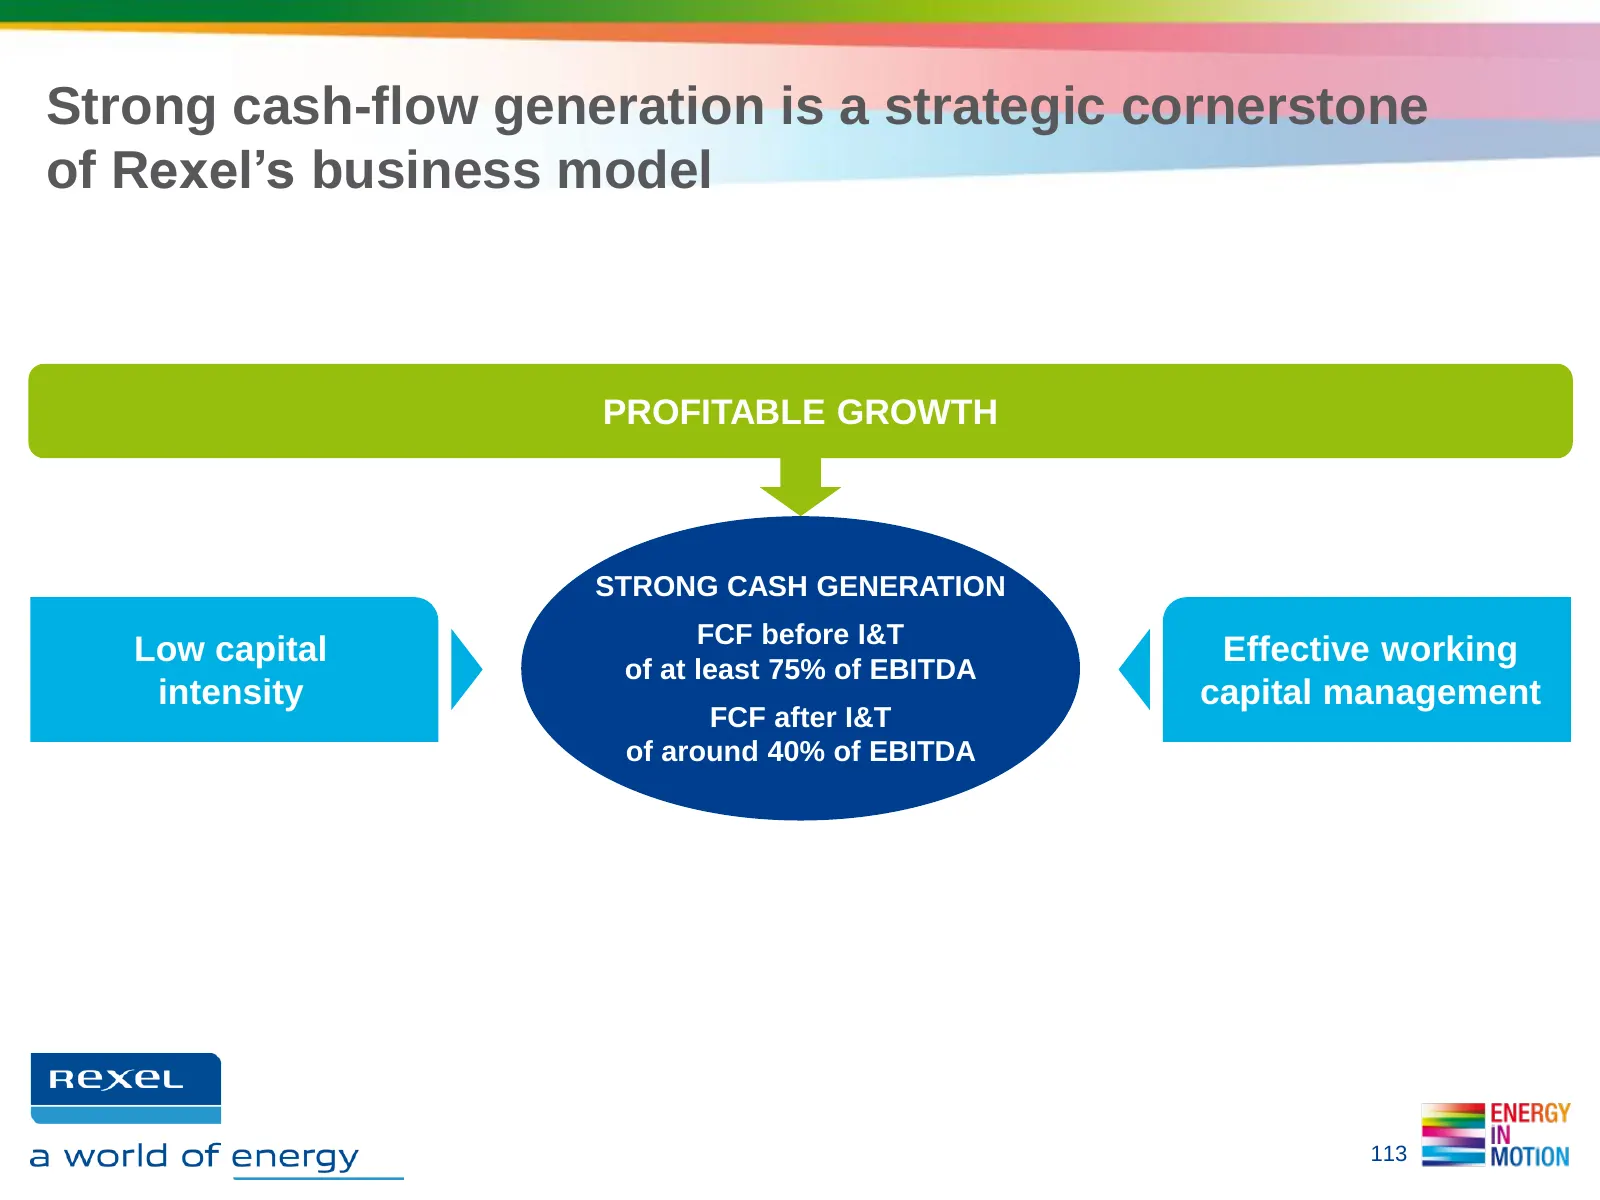
Slide 113: Strong cash-flow generation a strategic cornerstone
Strong cash-flow generation is a strategic cornerstone of Rexel’s business model PROFITABLE GROWTH STRONG CASH GENERATION FCF before I&T Low capital of at least 75% of EBITDA Effective working intensity capital management FCF after I&T of around 40% of EBITDA 113
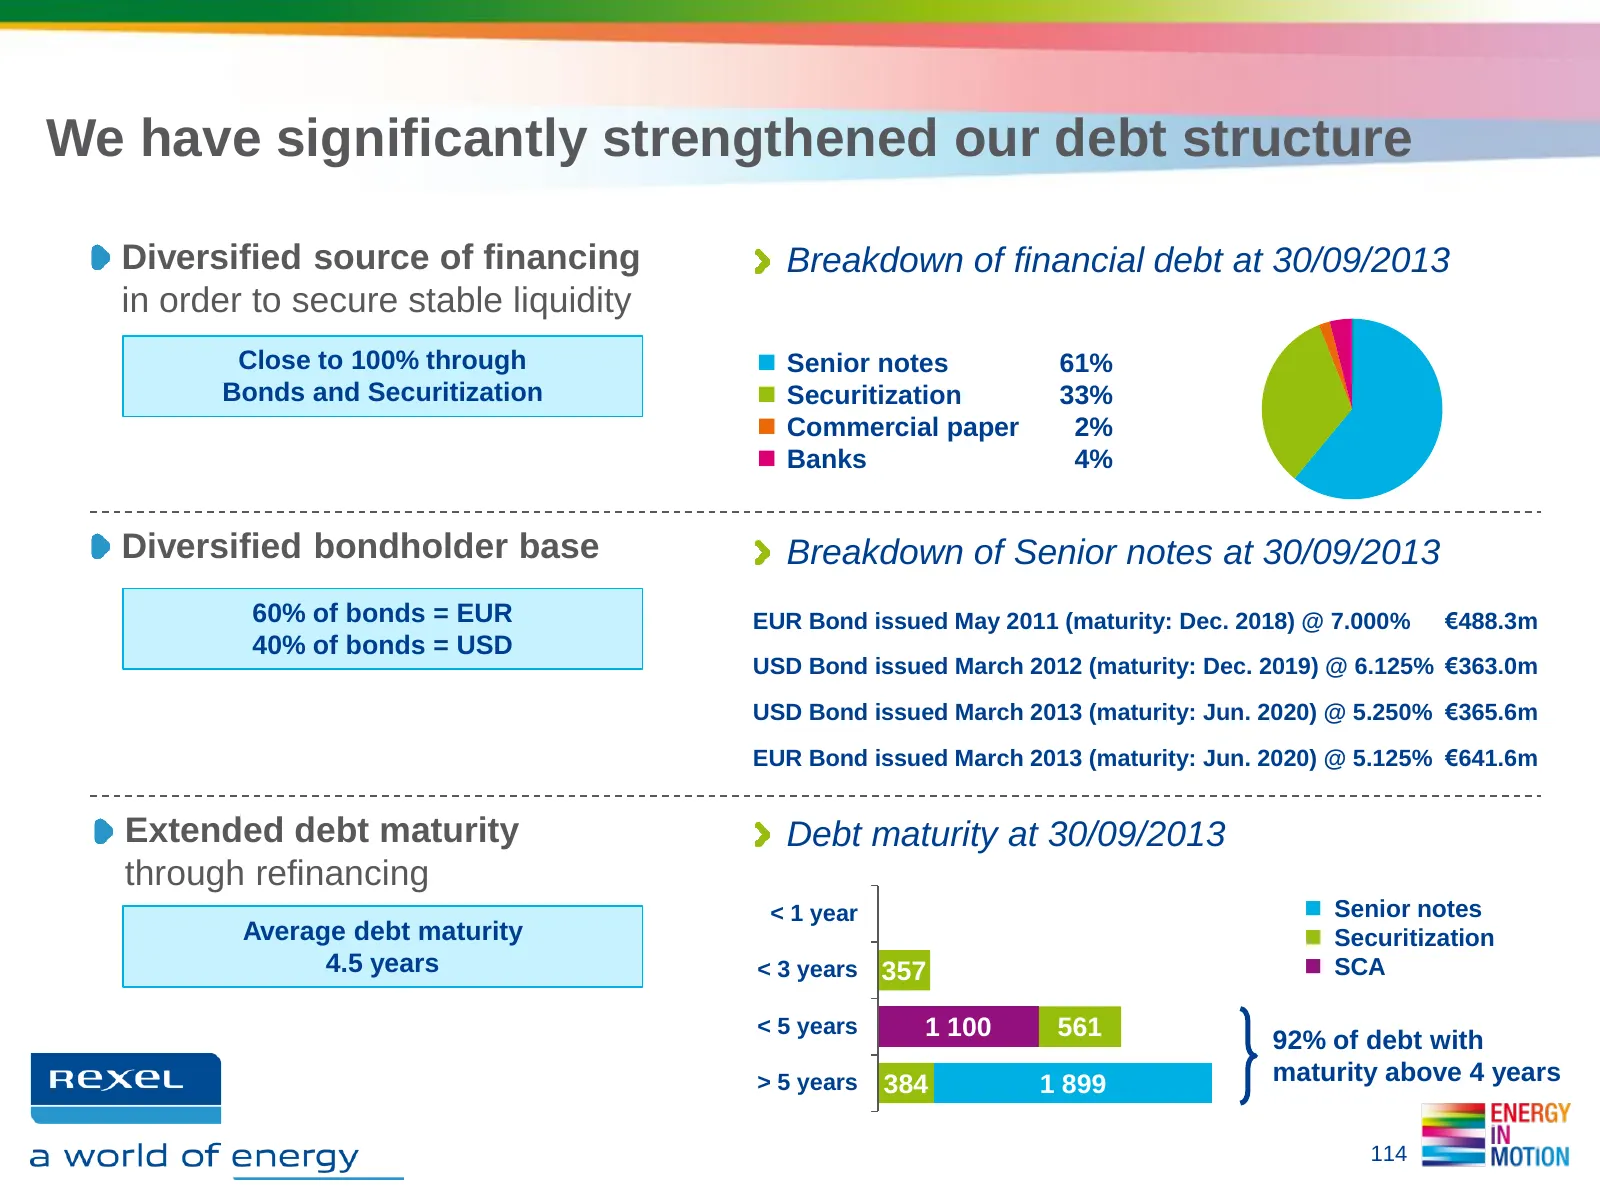
Slide 114: Strengthened debt structure
We have significantly strengthened our debt structure Diversified source of financing Breakdown of financial debt at 30/09/2013 in order to secure stable liquidity Close to 100% through Senior notes 61% Bonds and Securitization Securitization 33% Commercial paper 2% Banks 4% Diversified bond
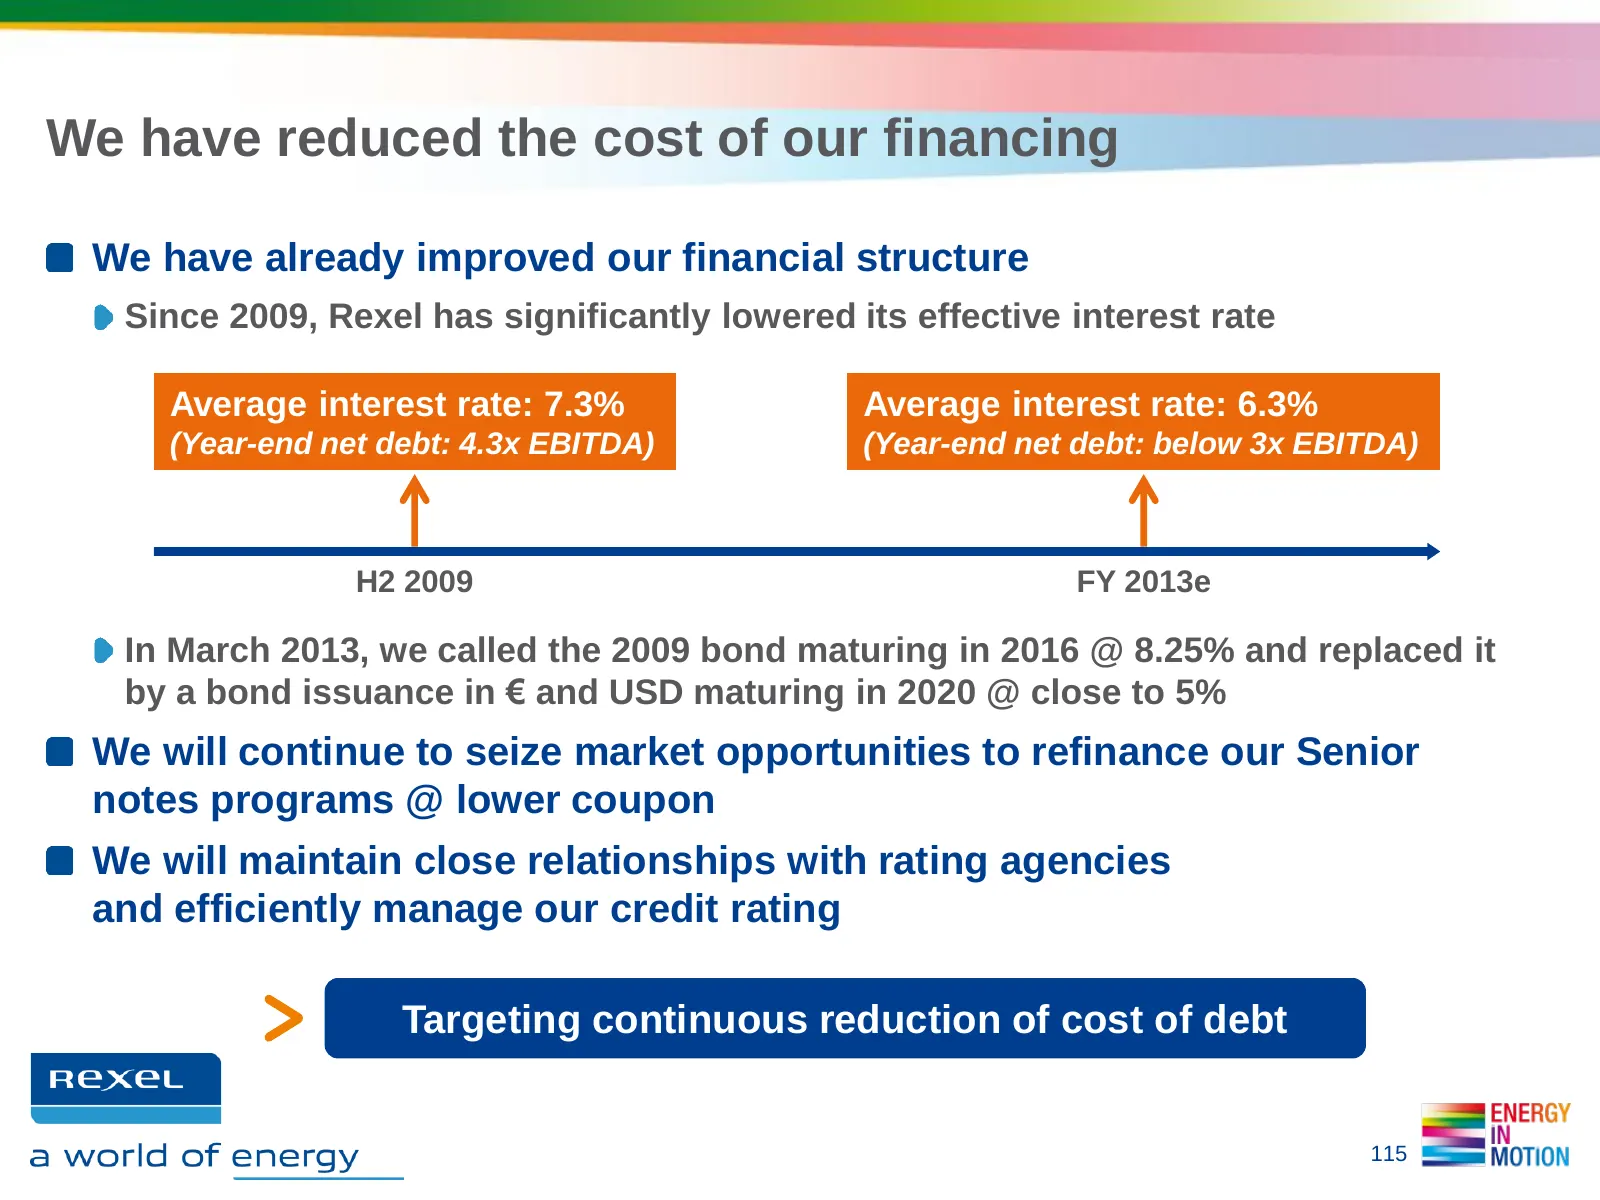
Slide 115: Reduced cost of financing
We have reduced the cost of our financing We have already improved our financial structure Since 2009, Rexel has significantly lowered its effective interest rate Average interest rate: 7.3% Average interest rate: 6.3% (Year-end net debt: 4.3x EBITDA) (Year-end net debt: below 3x EBITDA) H2 2009 FY
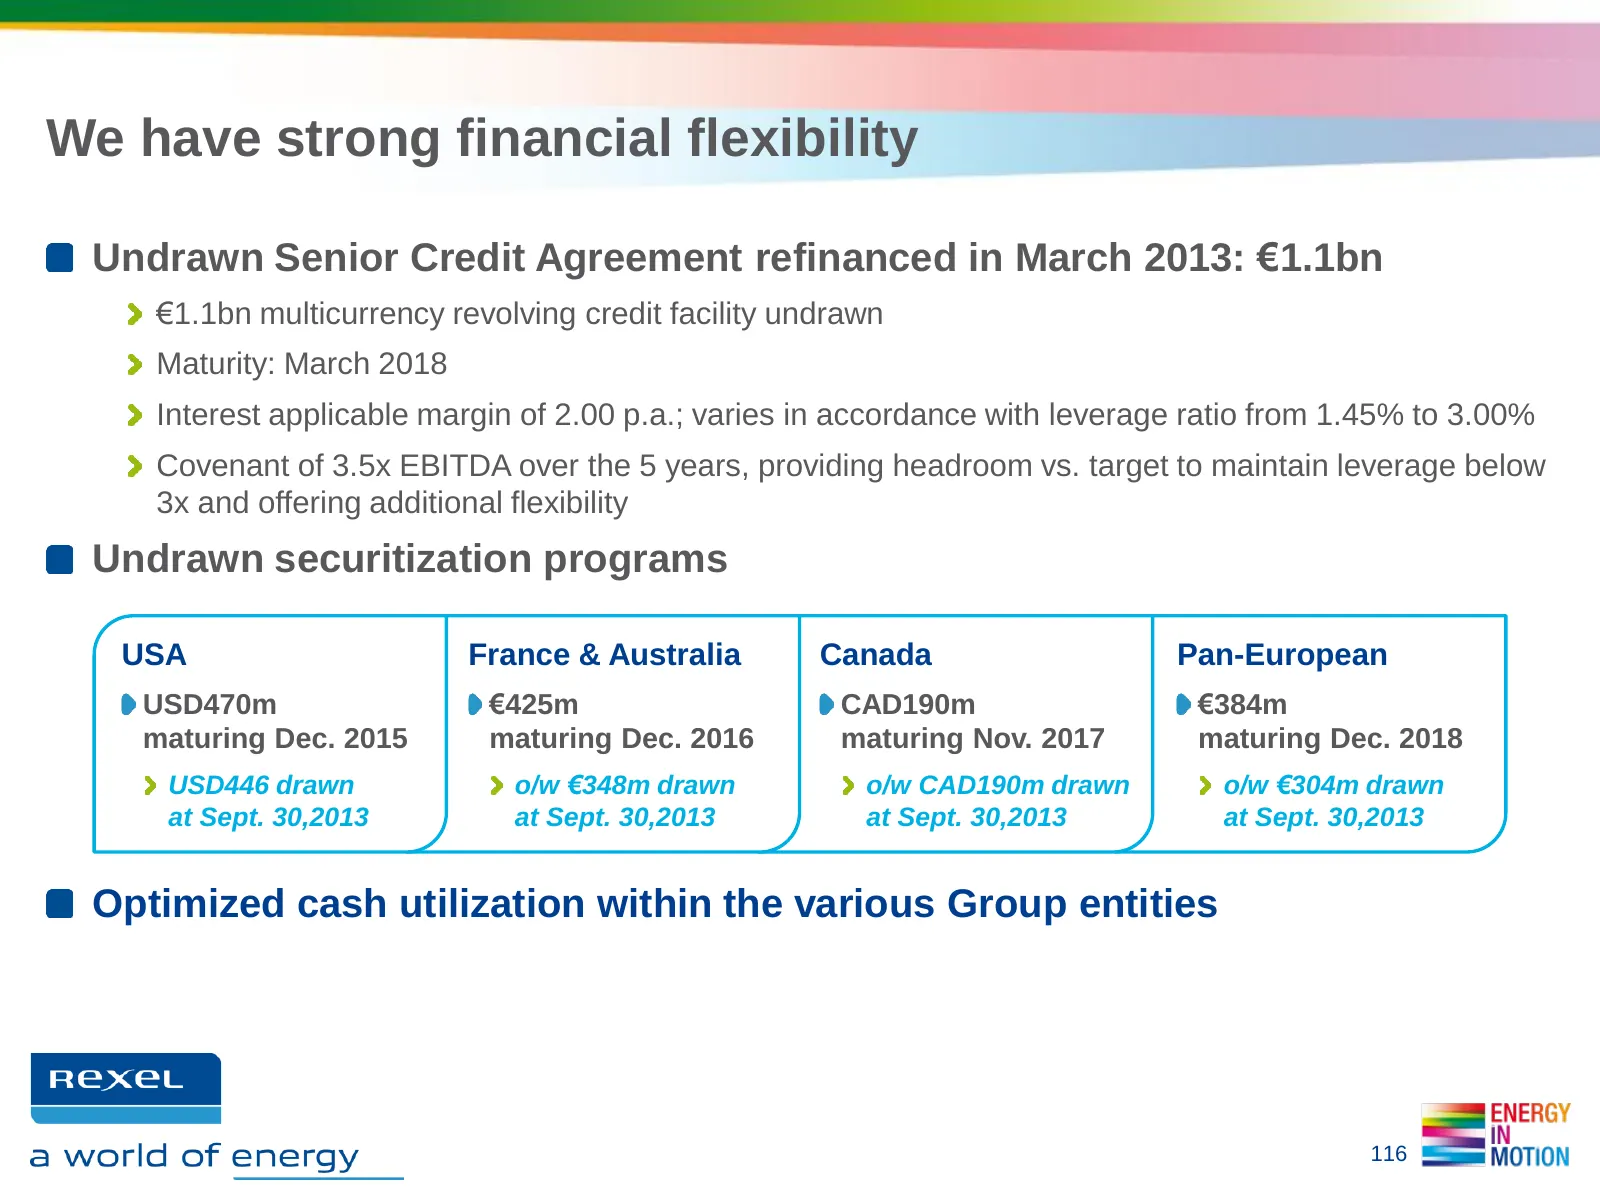
Slide 116: Strong financial flexibility
We have strong financial flexibility Undrawn Senior Credit Agreement refinanced in March 2013: €1.1bn €1.1bn multicurrency revolving credit facility undrawn Maturity: March 2018 Interest applicable margin of 2.00 p.a.; varies in accordance with leverage ratio from 1.45% to 3.00% Covenant of 3.5x EBI
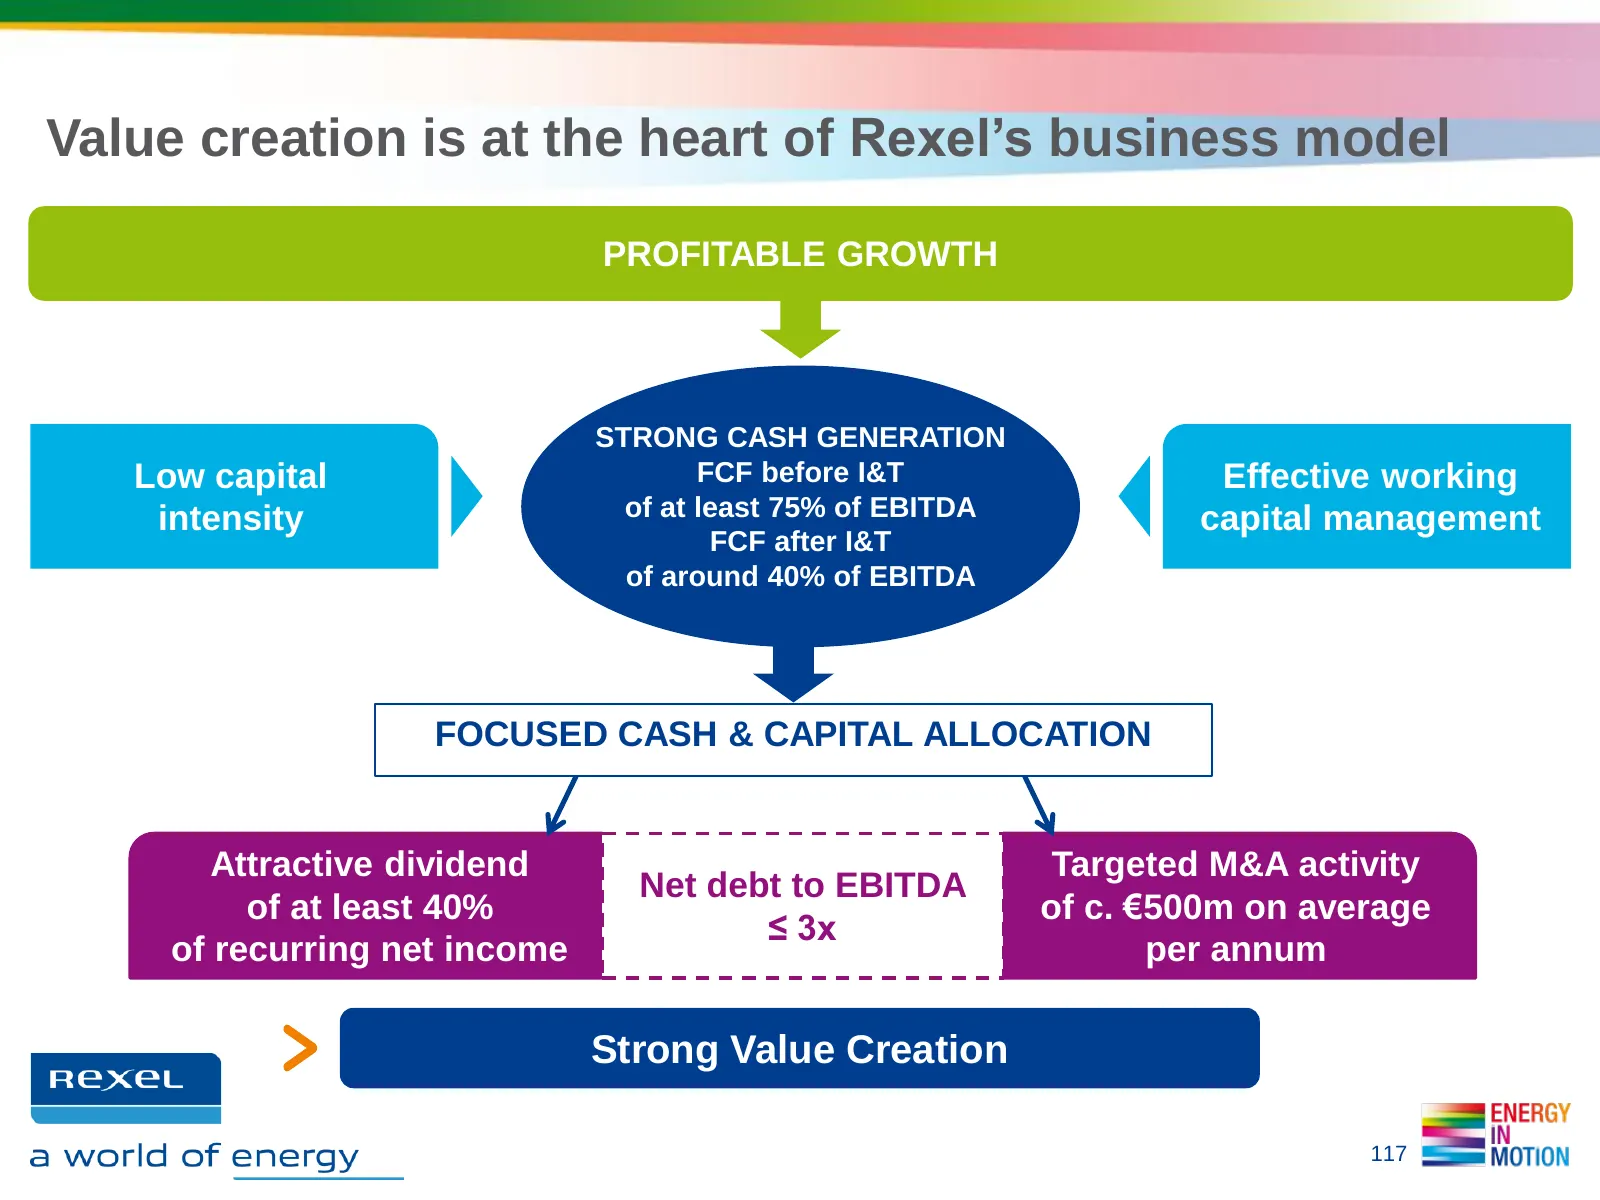
Slide 117: Value creation at the heart of Rexel's business model
Value creation is at the heart of Rexel’s business model PROFITABLE GROWTH STRONG CASH GENERATION Low capital FCF before I&T Effective working intensity of at least 75% of EBITDA capital management FCF after I&T of around 40% of EBITDA FOCUSED CASH & CAPITAL ALLOCATION Attractive dividend Targeted M
Slide 118: 6. Conclusion
6. CONCLUSION Rudy PROVOOST, Chairman of the Management Board and CEO
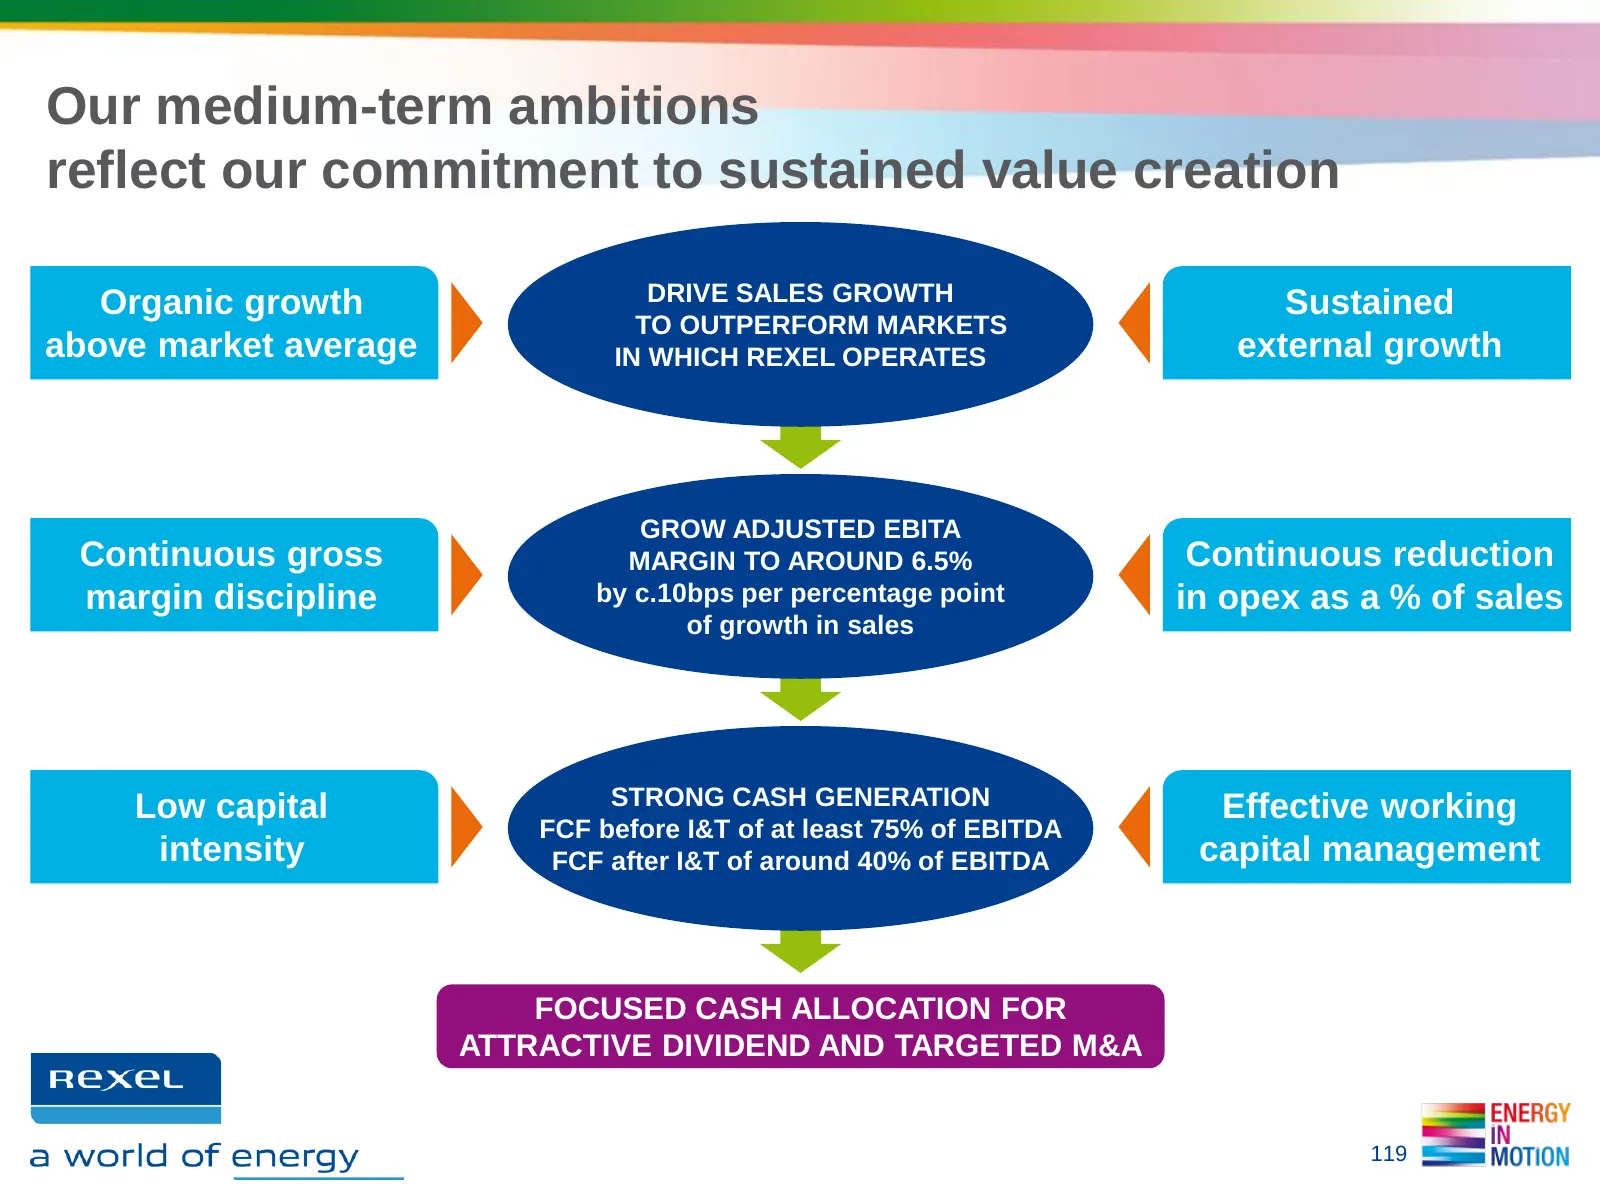
Slide 119: Medium-term ambitions reflect commitment to value creation
Our medium-term ambitions reflect our commitment to sustained value creation Organic growth DRIVE SALES GROWTH Sustained TO OUTPERFORM MARKETS above market average IN WHICH REXEL OPERATES external growth GROW ADJUSTED EBITA Continuous gross MARGIN TO AROUND 6.5% Continuous reduction margin disciplin
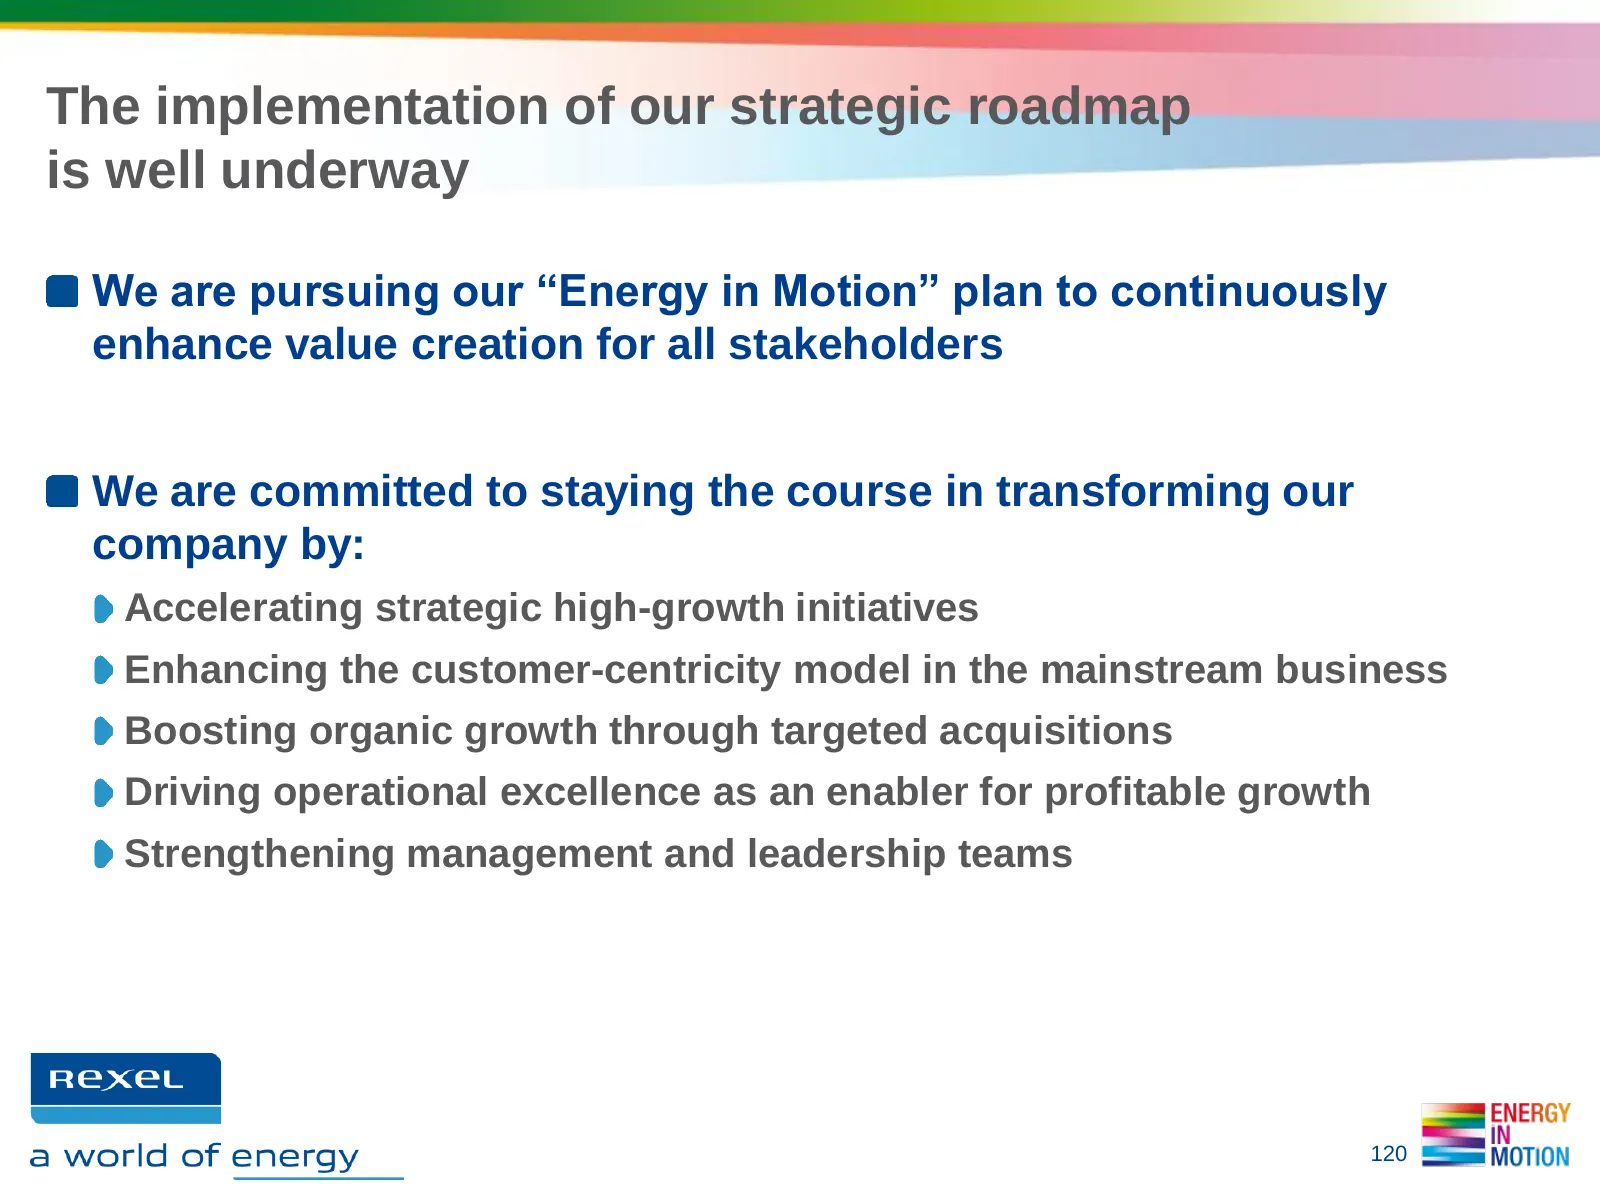
Slide 120: Implementation of our strategic roadmap is well underway
The implementation of our strategic roadmap is well underway We are pursuing our “Energy in Motion” plan to continuously enhance value creation for all stakeholders We are committed to staying the course in transforming our company by: Accelerating strategic high-growth initiatives Enhancing the cus
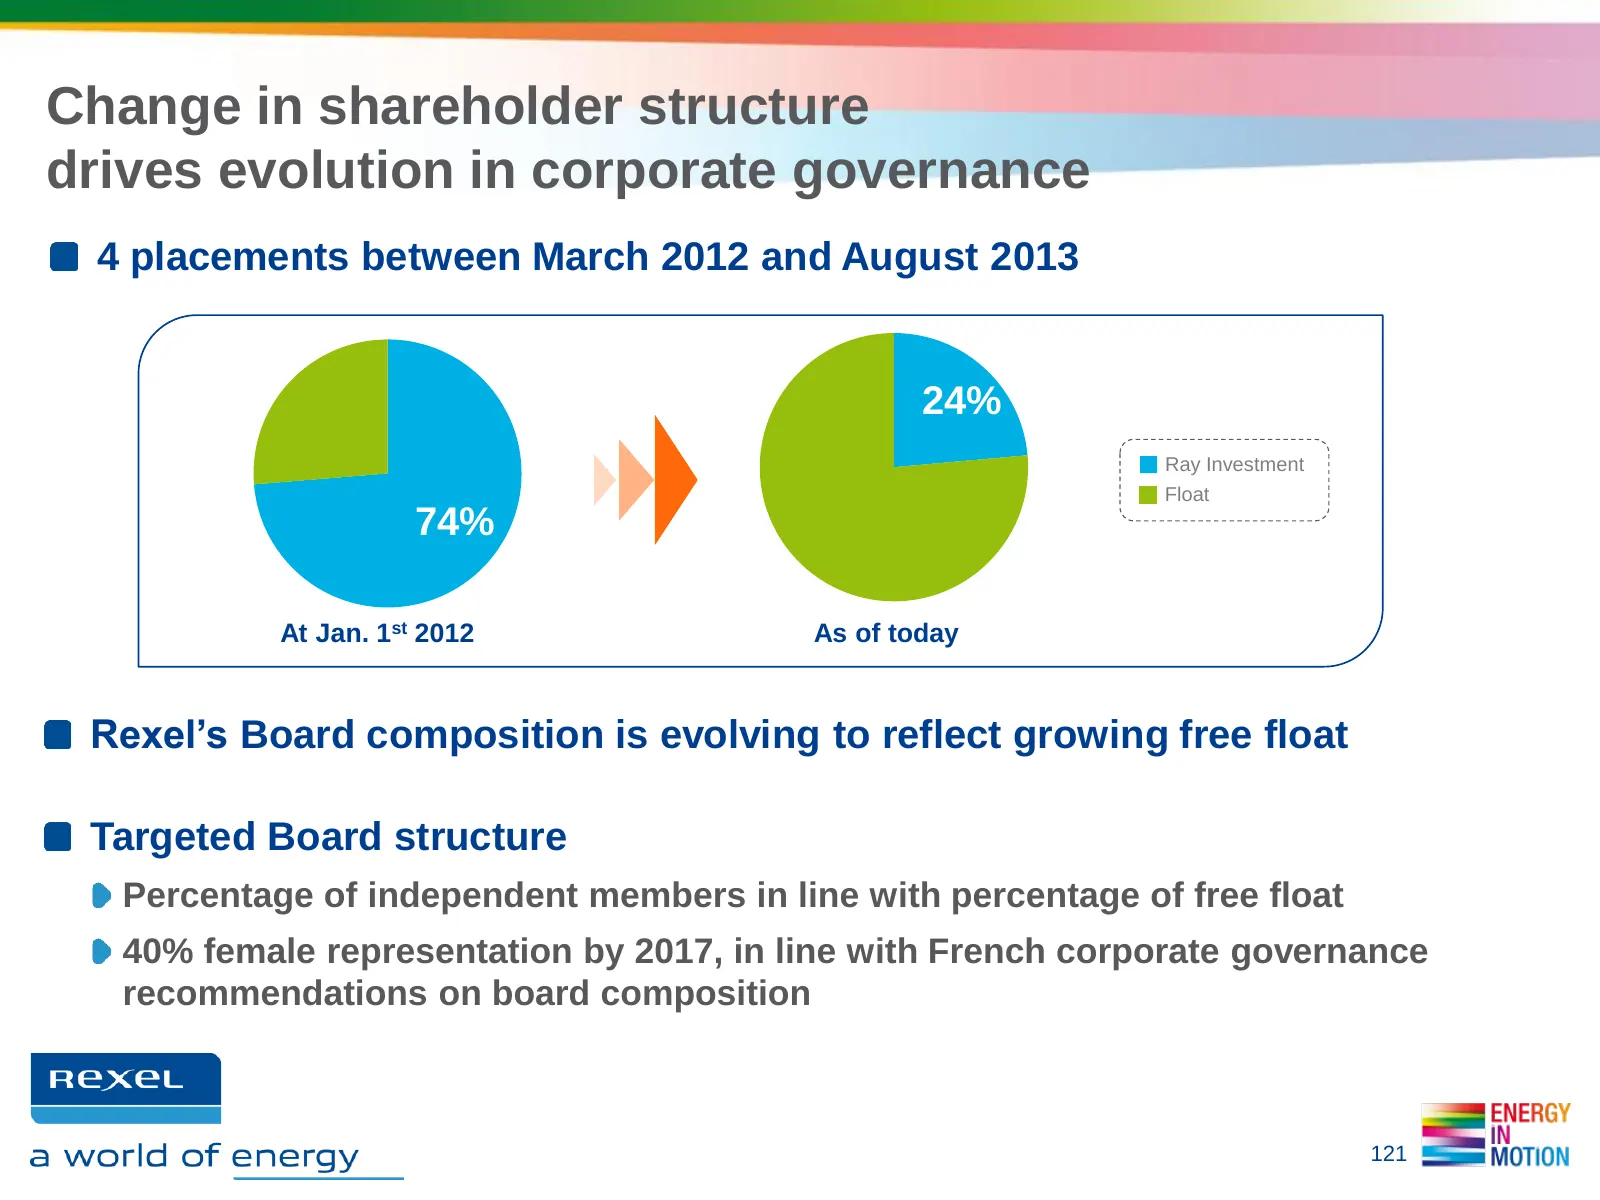
Slide 121: Change in shareholder structure drives corporate governance evolution
Change in shareholder structure drives evolution in corporate governance 4 placements between March 2012 and August 2013 24% Ray Investment Float 74% At Jan. 1st 2012 As of today Rexel’s Board composition is evolving to reflect growing free float Targeted Board structure Percentage of independent me
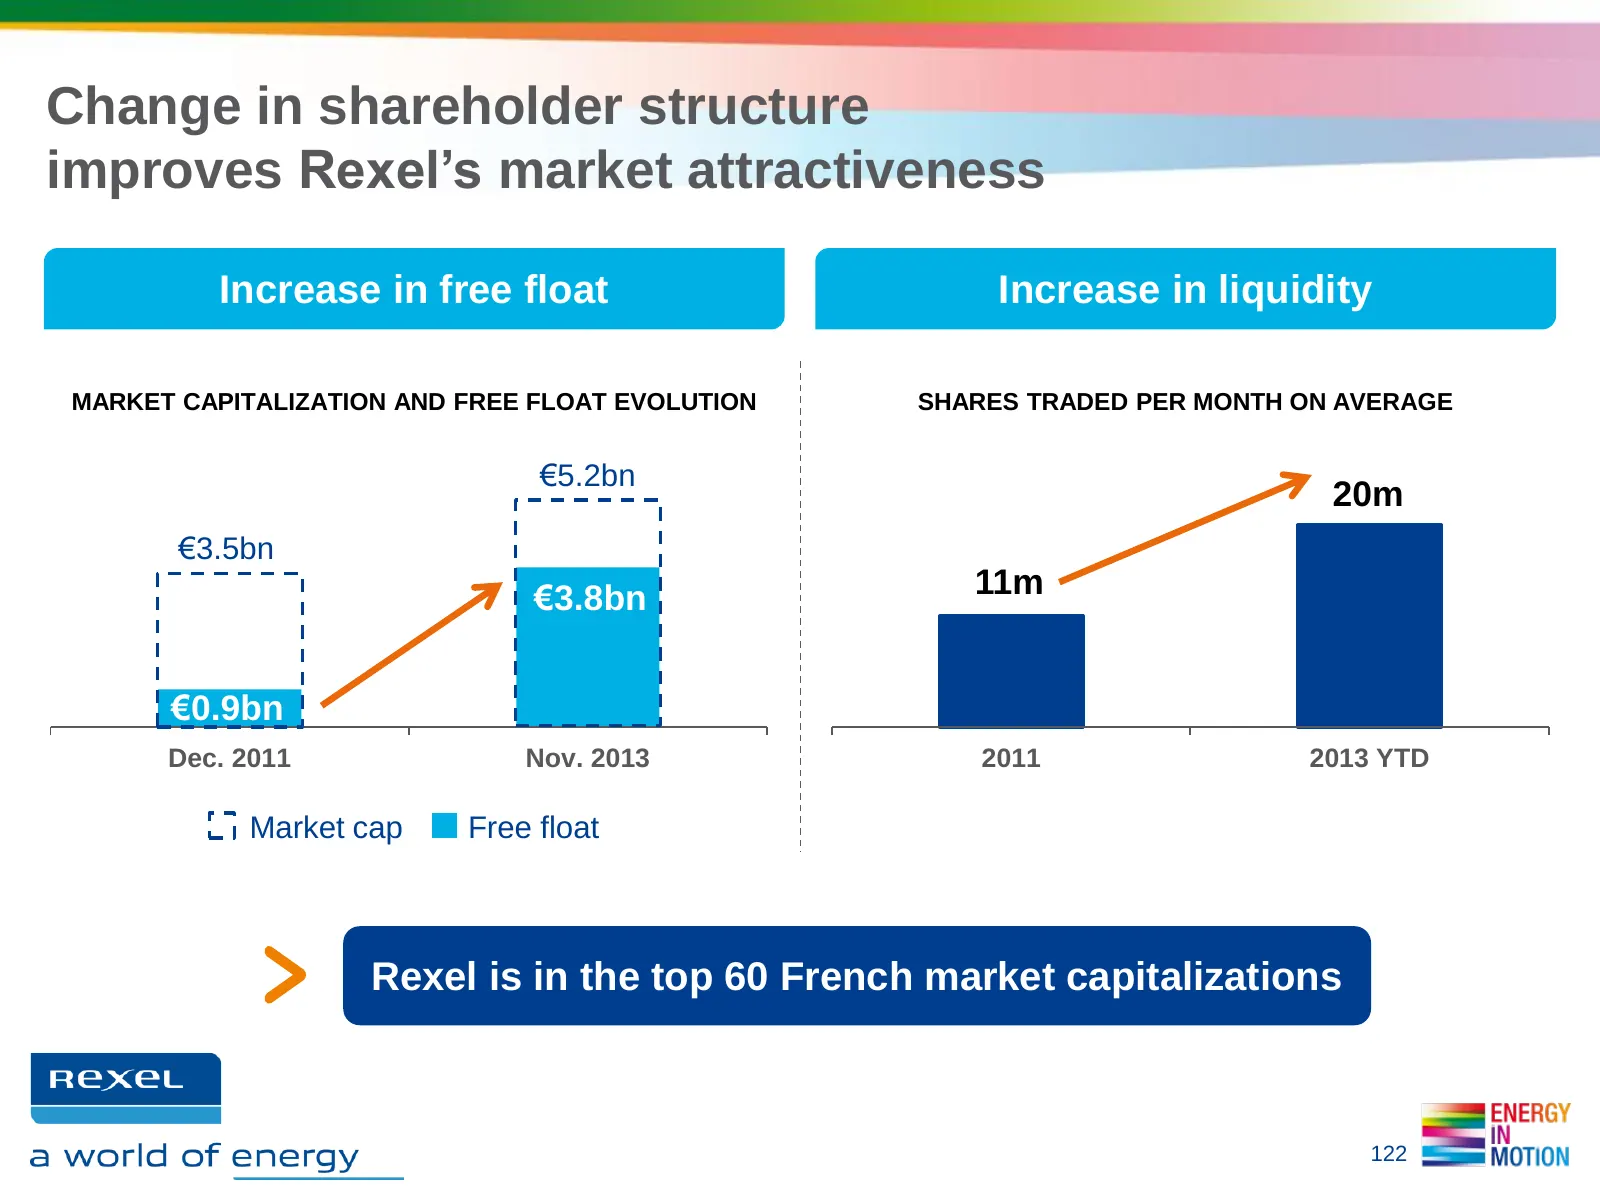
Slide 122: Change in shareholder structure improves market attractiveness
Change in shareholder structure improves Rexel’s market attractiveness Increase in free float Increase in liquidity MARKET CAPITALIZATION AND FREE FLOAT EVOLUTION SHARES TRADED PER MONTH ON AVERAGE €5.2bn 20m €3.5bn c. 5% €3.8bn 11m c. 3% €0.9bn Dec. 2011 Nov. 2013 2011 2013 YTD Market cap Free floa
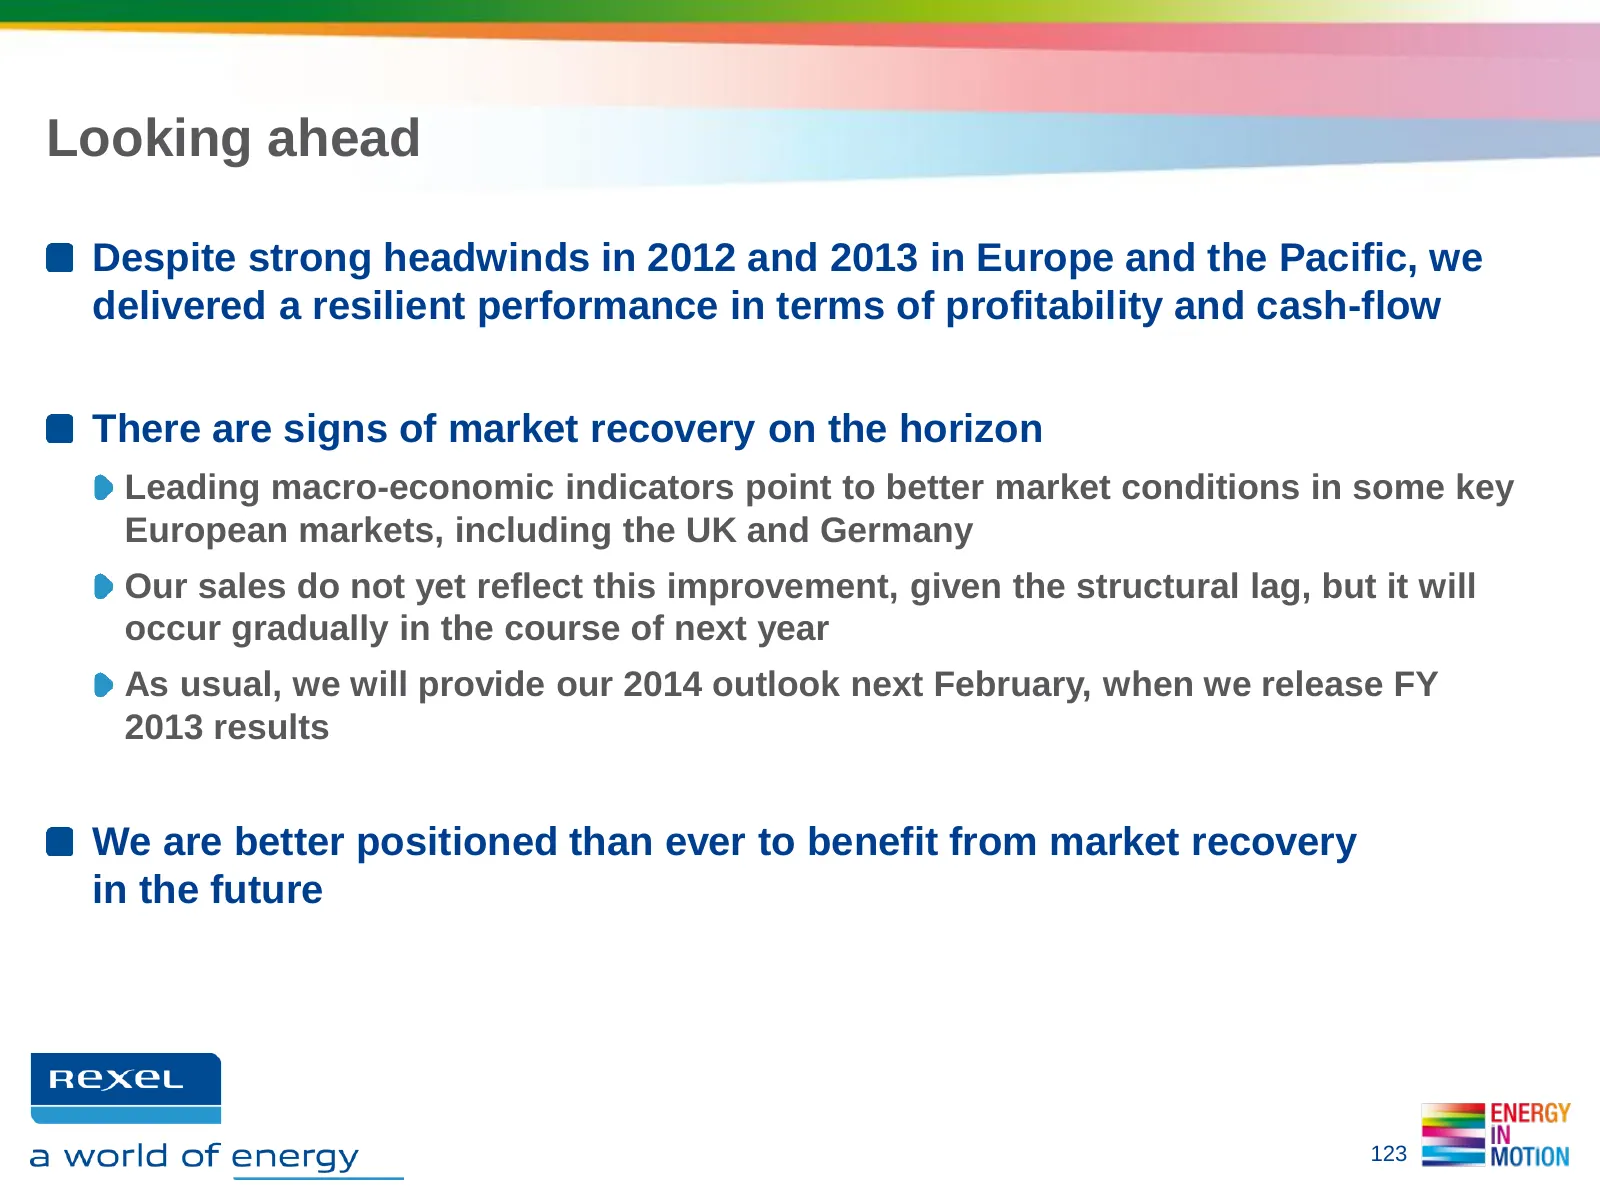
Slide 123: Looking ahead
Looking ahead Despite strong headwinds in 2012 and 2013 in Europe and the Pacific, we delivered a resilient performance in terms of profitability and cash-flow There are signs of market recovery on the horizon Leading macro-economic indicators point to better market conditions in some key European m
Slide 124: Contacts
Contacts INVESTORS & ANALYSTS PRESS Marc MAILLET Pénélope LINAGE-COHEN Tel: +33 1 42 85 76 12 Tel: +33 1 42 85 76 28 Email: marc.maillet@rexel.com Email: penelope.linage@rexel.com Florence MEILHAC Brunswick - Thomas KAMM Tel: +33 1 42 85 57 61 Tel: +33 1 53 96 83 92 Email: florence.meilhac@rexel.com
Slide 125: Disclaimer
Disclaimer The Group is exposed to fluctuations in copper prices in connection with its distribution of cable products. Cables accounted for approximately 15% of the Group's sales, and copper accounts for approximately 60% of the composition of cables. This exposure is indirect since cable prices al
Source: Internet Archive copy of rexel.com
More decks from Rexel SA
 Q3 2026 Earnings Presentation13 slides · Oct 22, 2026
 Q2 2026 Earnings Presentation24 slides · Jul 27, 2026
 FY 2025 Earnings Presentation31 slides · Feb 11, 2026
 Q3 2025 Earnings Presentation15 slides · Oct 15, 2025
 Q2 2025 Earnings Presentation20 slides · Jul 28, 2025
 Q1 2025 Earnings Presentation16 slides · Apr 29, 2025