GrafTech International Ltd. · NYSE:EAF
GrafTech International — Investor Presentation (November 2023)
34 slides from GrafTech International's investor presentation, November 2023
Slide 1: Investor Overview Presentation
Investor Overview Presentation November 2023 NYSE: EAF www.graftech.com
Slide 2: Forward-Looking Statements
Forward-Looking Statements CAUTIONARY NOTE REGARDING FORWARD-LOOKING STATEMENTS: This presentation and related discussions may contain forward-looking statements within the meaning of the safe harbor provisions of the U.S. Private Securities Litigation Reform Act of 1995. Forward-looking statements
Slide 3: Business Overview
Business Overview Grar oc
Slide 4: Why GrafTech?
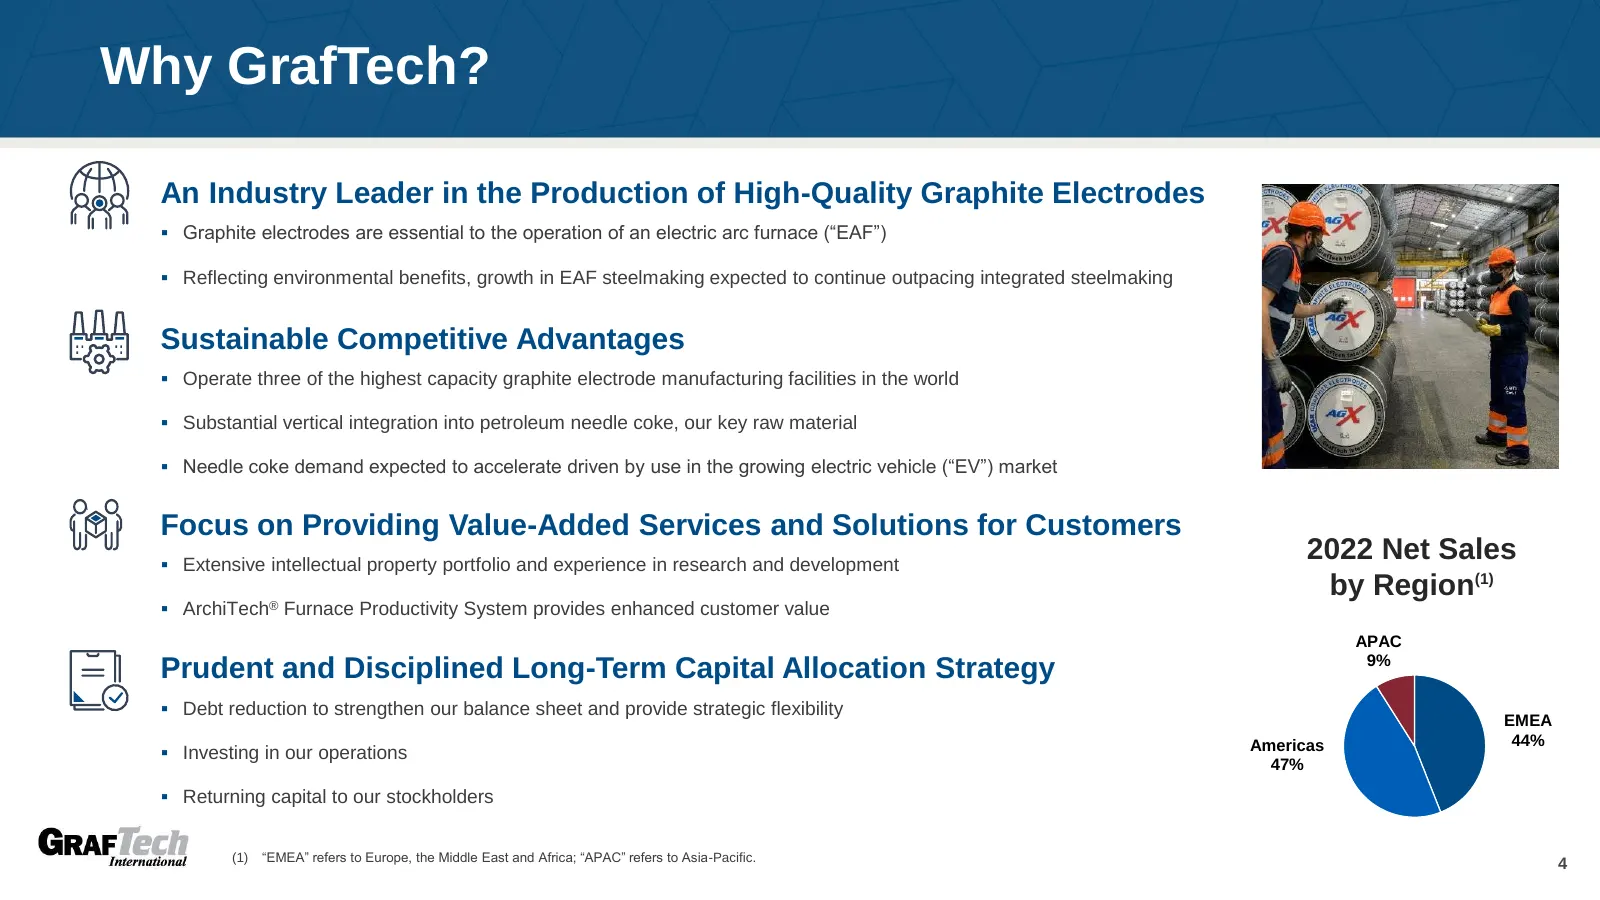
Why GrafTech? An Industry Leader in the Production of High-Quality Graphite Electrodes ▪ Graphite electrodes are essential to the operation of an electric arc furnace (“EAF”) ▪ Reflecting environmental benefits, growth in EAF steelmaking expected to continue outpacing integrated steelmaking Sustaina
Slide 5: Graphite Electrodes – Mission Critical Consumable for EAF Steel Production
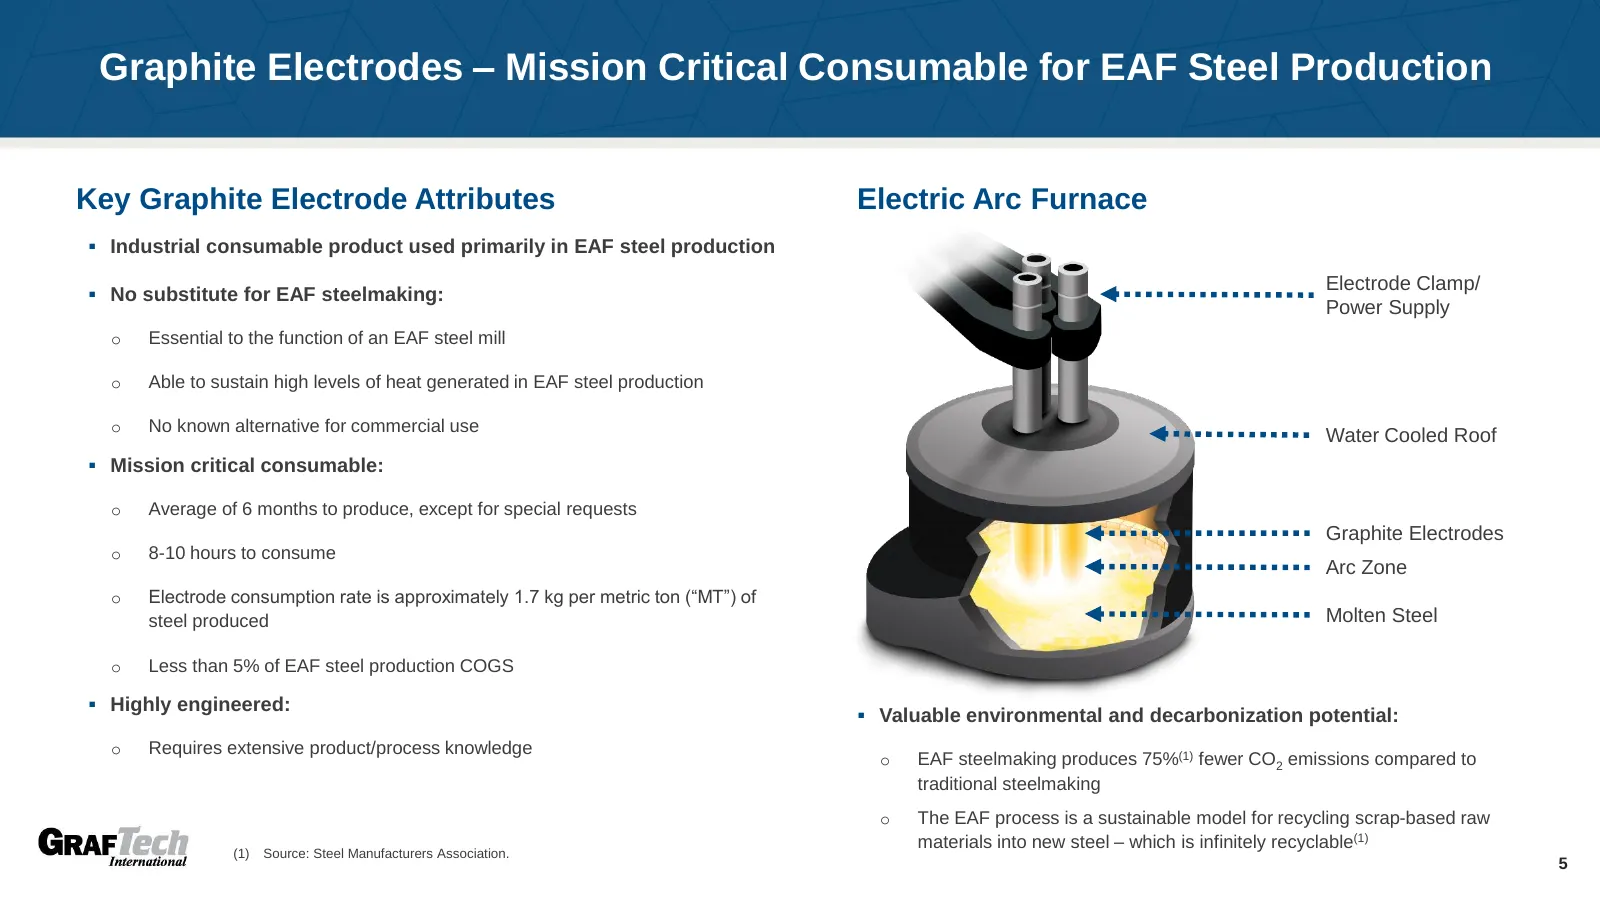
Graphite Electrodes – Mission Critical Consumable for EAF Steel Production Key Graphite Electrode Attributes Electric Arc Furnace ▪ Industrial consumable product used primarily in EAF steel production Electrode Clamp/ ▪ No substitute for EAF steelmaking: Power Supply o Essential to the function of a
Slide 6: Global Network of Production, Sales & Service
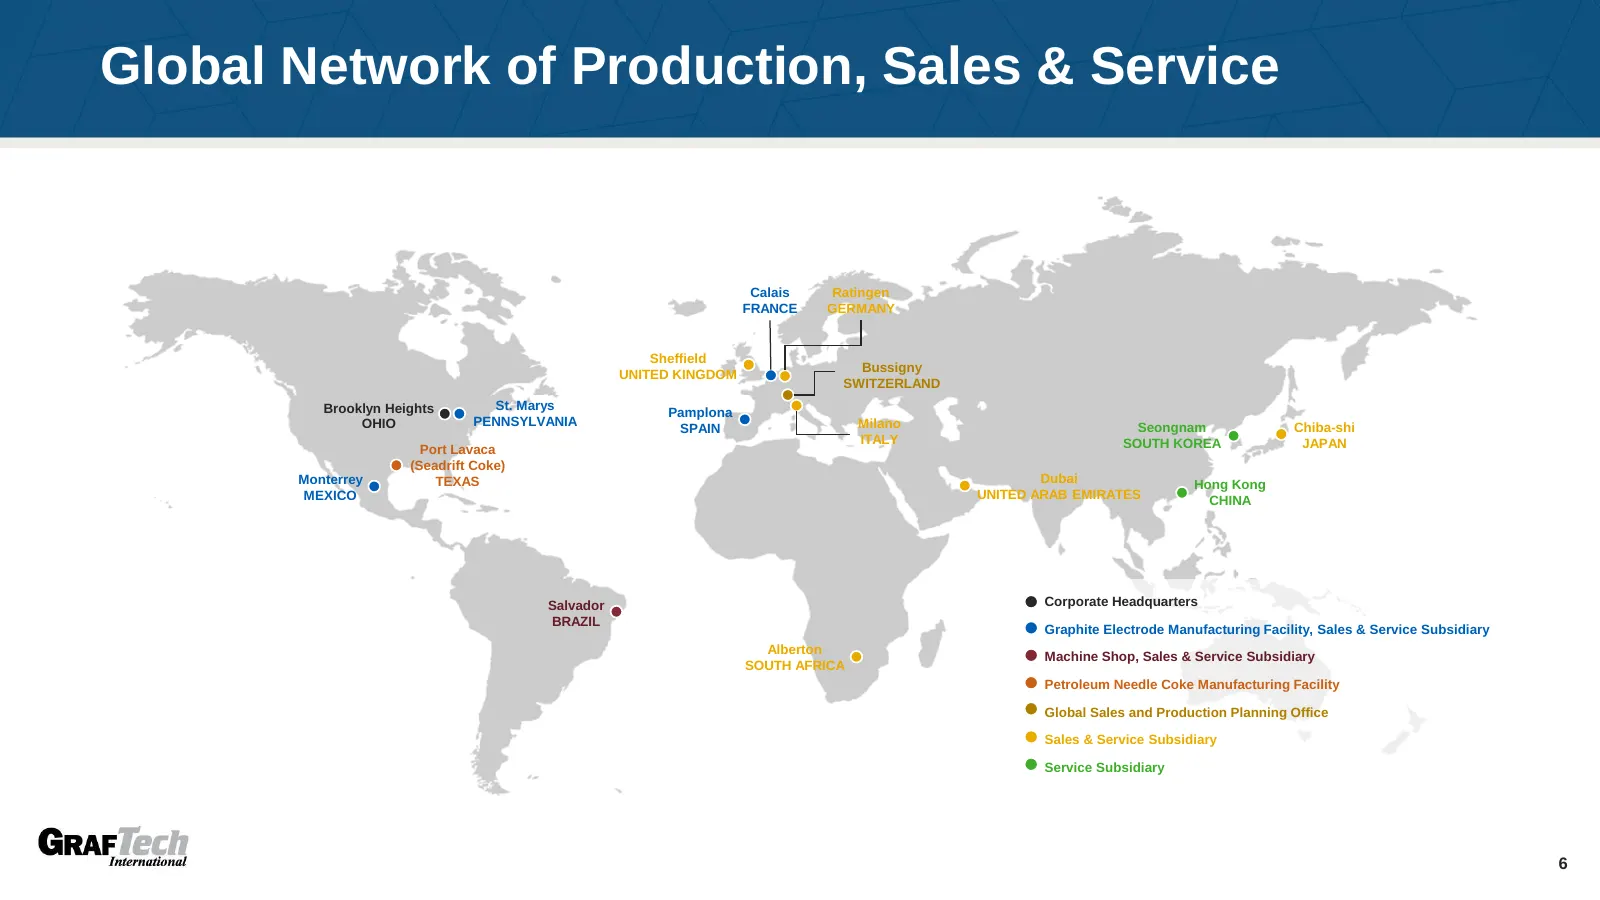
Global Network of Production, Sales & Service Calais Ratingen FRANCE GERMANY Sheffield Bussigny UNITED KINGDOM SWITZERLAND Brooklyn Heights St. Marys Pamplona OHIO PENNSYLVANIA Milano Seongnam Chiba-shi SPAIN ITALY SOUTH KOREA JAPAN Port Lavaca (Seadrift Coke) Monterrey TEXAS Dubai Hong Kong MEXICO
Slide 7: Supply Chain Summary
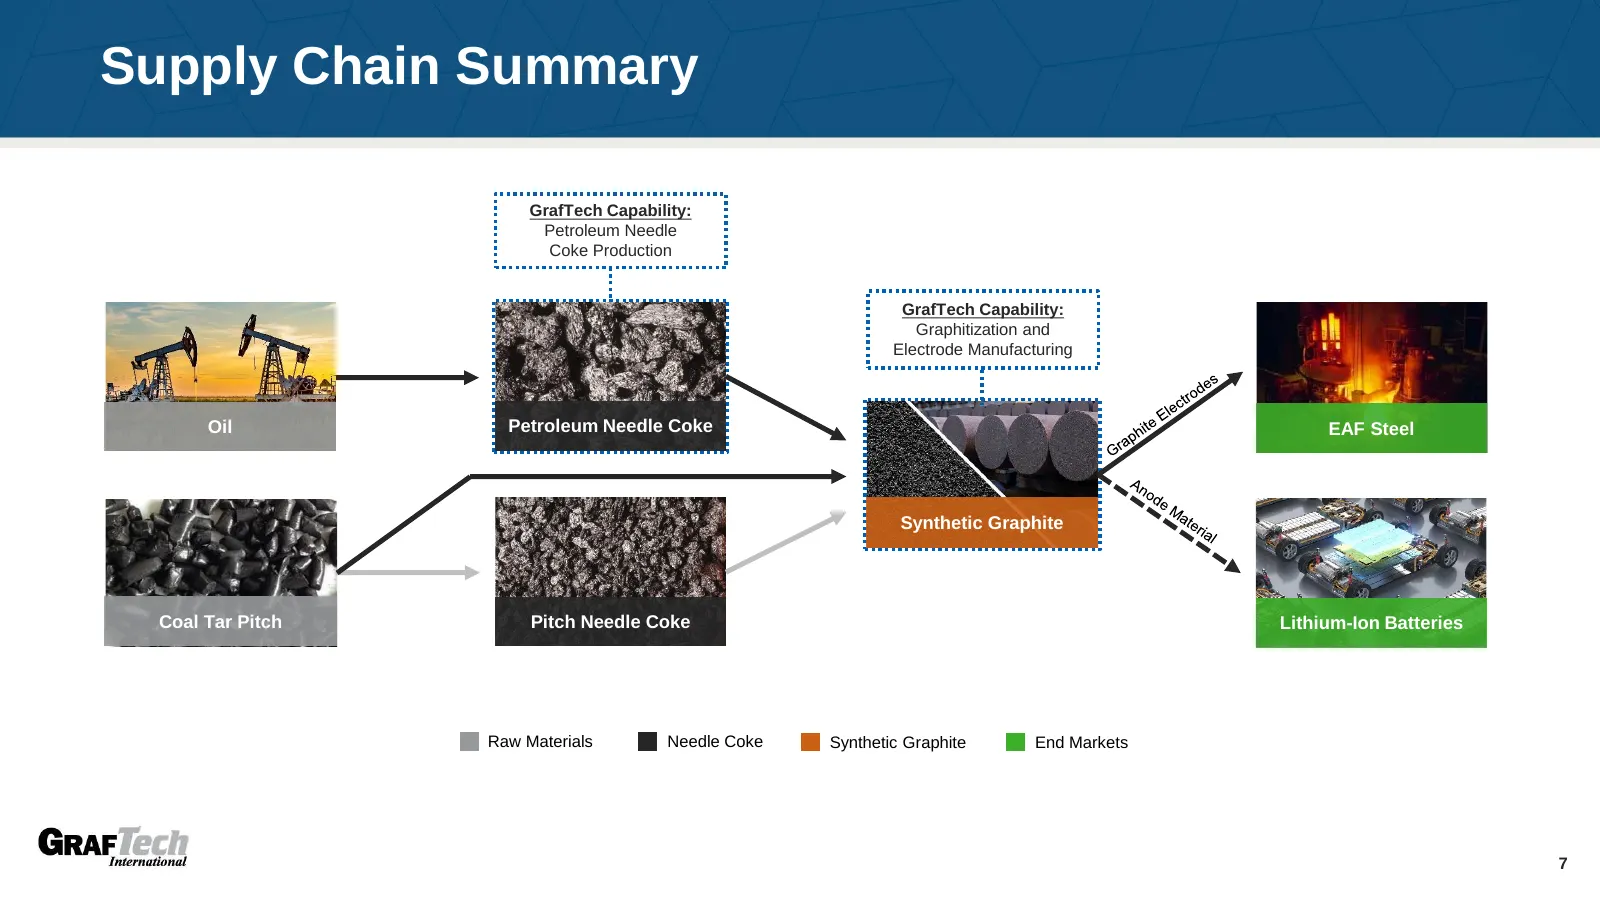
Supply Chain Summary GrafTech Capability: Petroleum Needle Coke Production GrafTech Capability: Graphitization and Electrode Manufacturing Oil Petroleum Needle Coke EAF Steel Synthetic Graphite Coal Tar Pitch Pitch Needle Coke Lithium-Ion Batteries Raw Materials Needle Coke Synthetic Graphite End Ma
Slide 8: Graphite Electrodes – Manufacturing Process
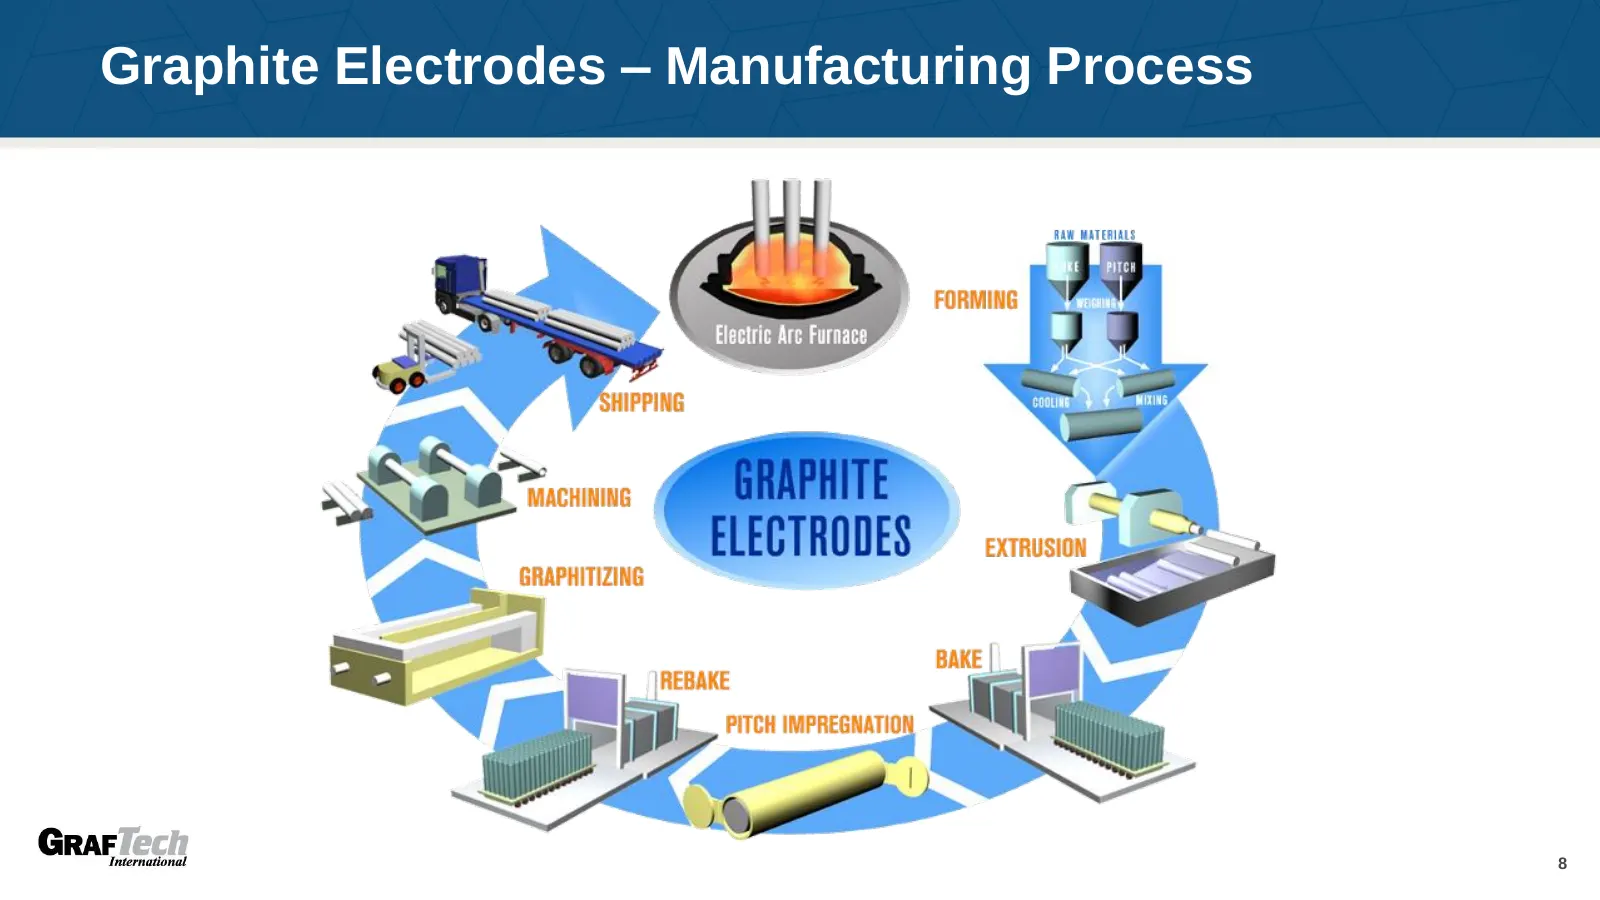
Graphite Electrodes – Manufacturing Process 8
Slide 9: Business Highlights
Business Highlights Grar oc
Slide 10: Business Highlights
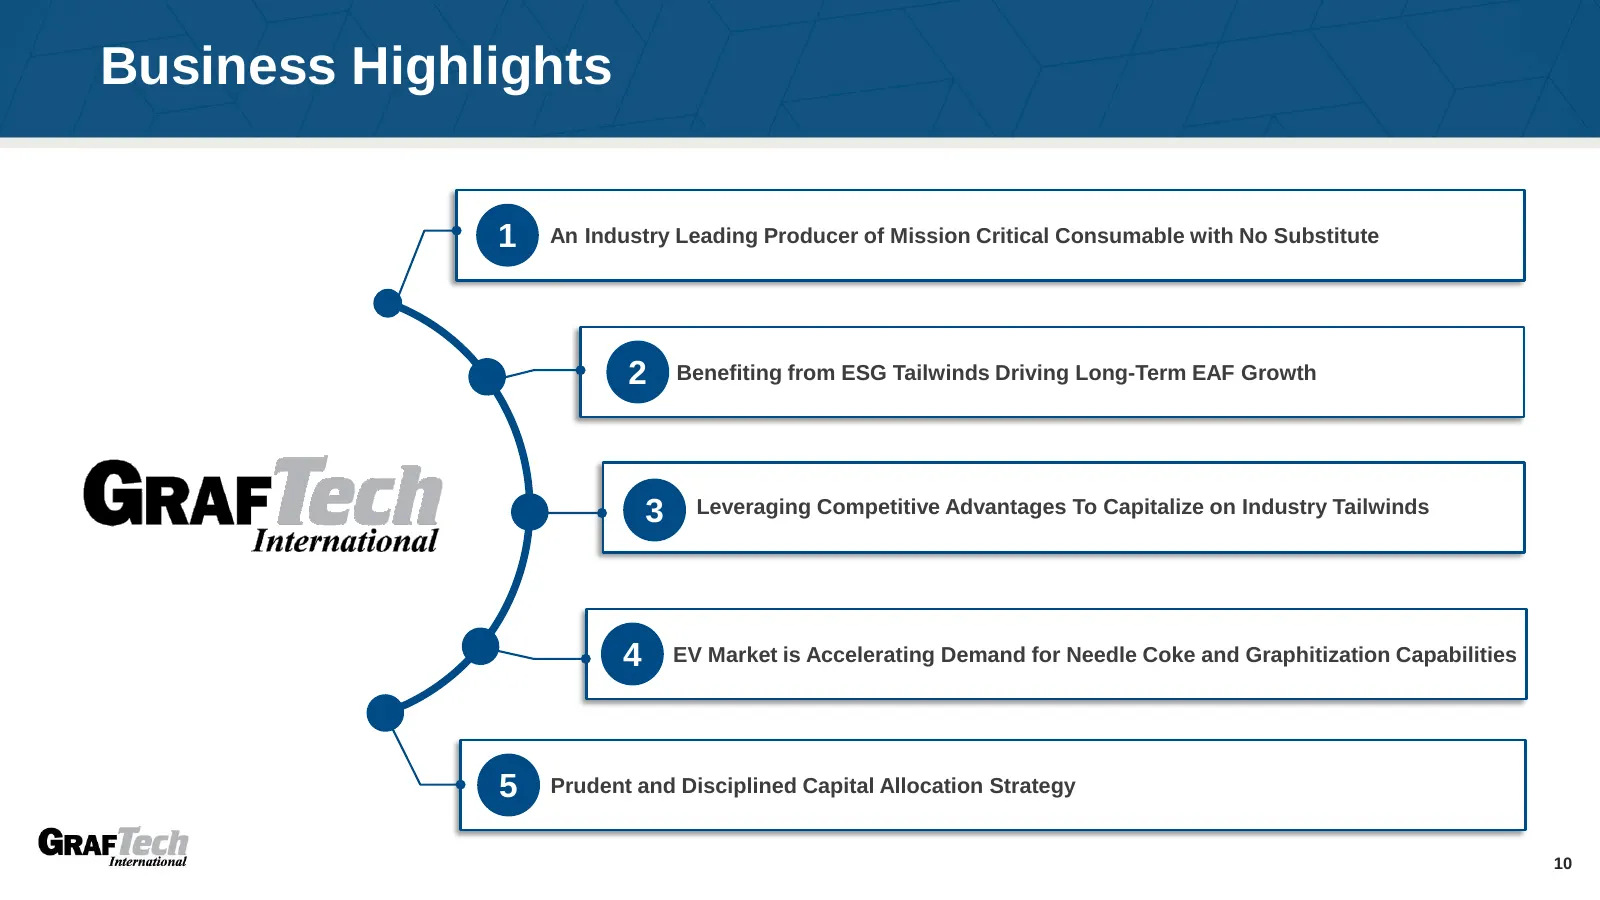
Business Highlights 1 An Industry Leading Producer of Mission Critical Consumable with No Substitute 2 Benefiting from ESG Tailwinds Driving Long-Term EAF Growth 3 Leveraging Competitive Advantages To Capitalize on Industry Tailwinds 4 EV Market is Accelerating Demand for Needle Coke and Graphitizat
Slide 11: An Industry Leading Producer of Mission Critical Consumable with No Substitute
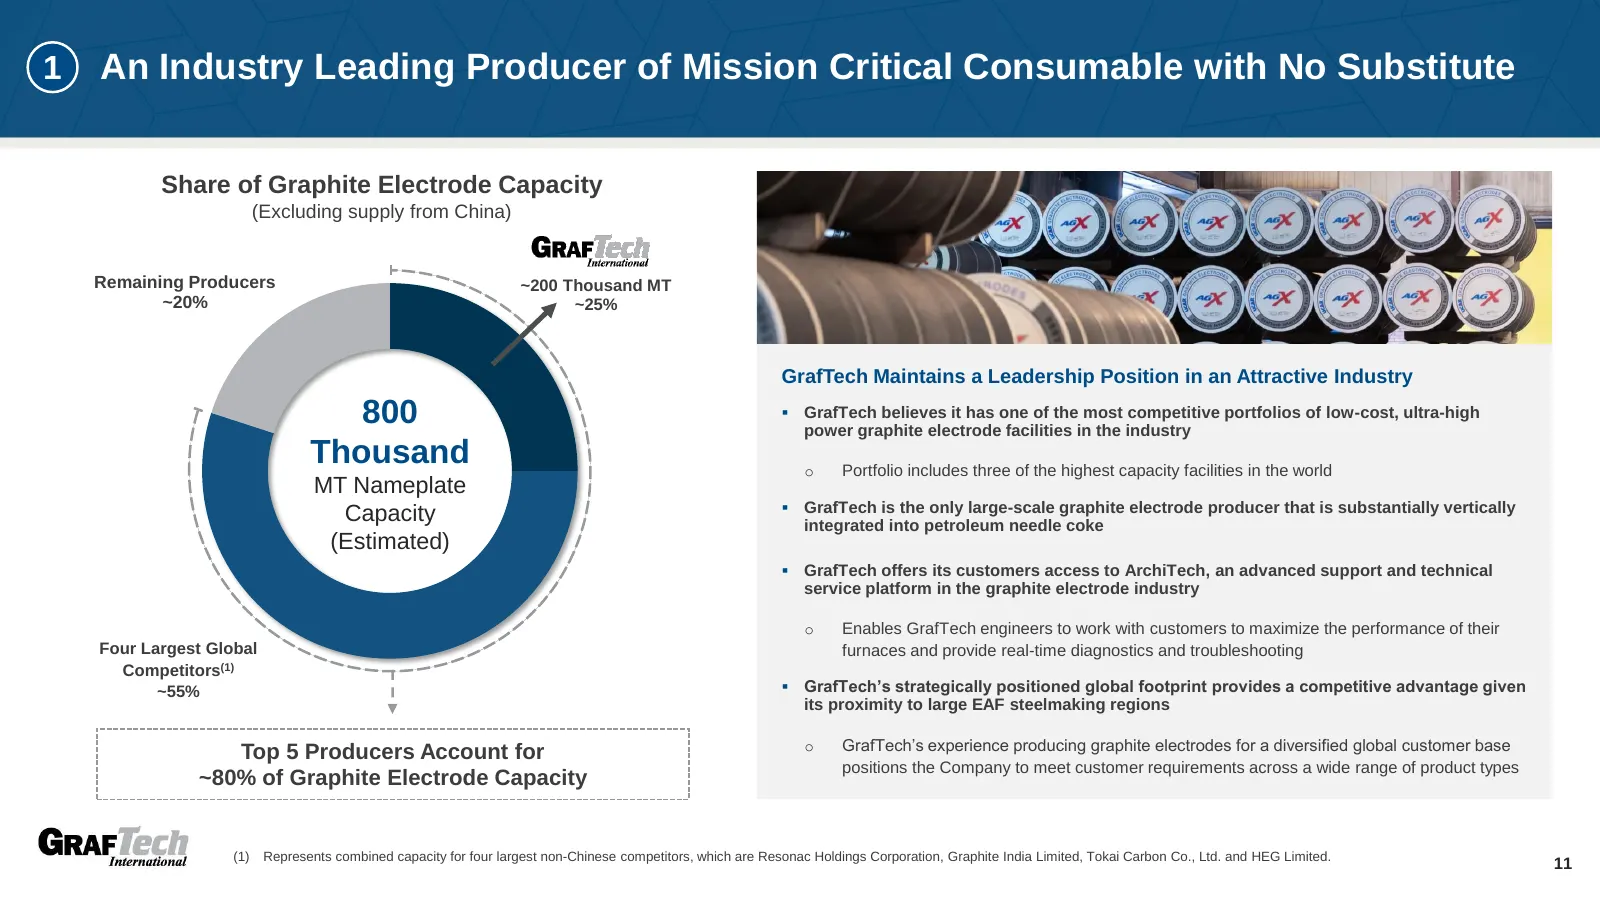
1 An Industry Leading Producer of Mission Critical Consumable with No Substitute Share of Graphite Electrode Capacity (Excluding supply from China) Remaining Producers ~200 Thousand MT ~20% ~25% GrafTech Maintains a Leadership Position in an Attractive Industry 800 ▪ GrafTech believes it has one of
Slide 12: Benefiting from ESG Tailwinds Driving Long-Term EAF Growth
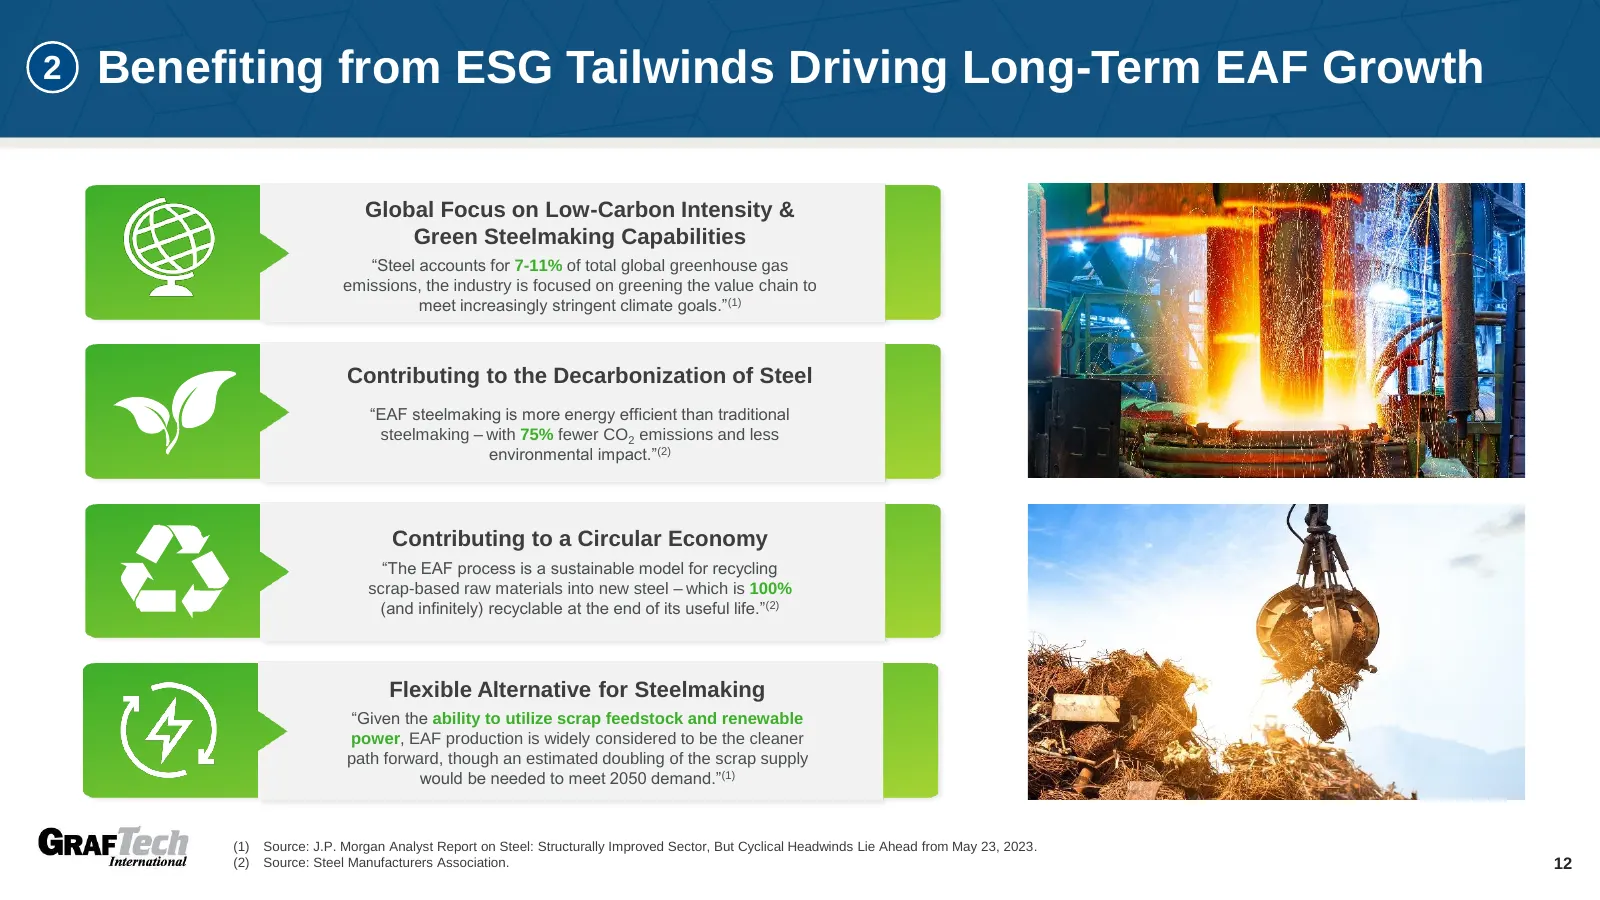
2 Benefiting from ESG Tailwinds Driving Long-Term EAF Growth Global Focus on Low-Carbon Intensity & Green Steelmaking Capabilities “Steel accounts for 7-11% of total global greenhouse gas emissions, the industry is focused on greening the value chain to meet increasingly stringent climate goals.”(1)
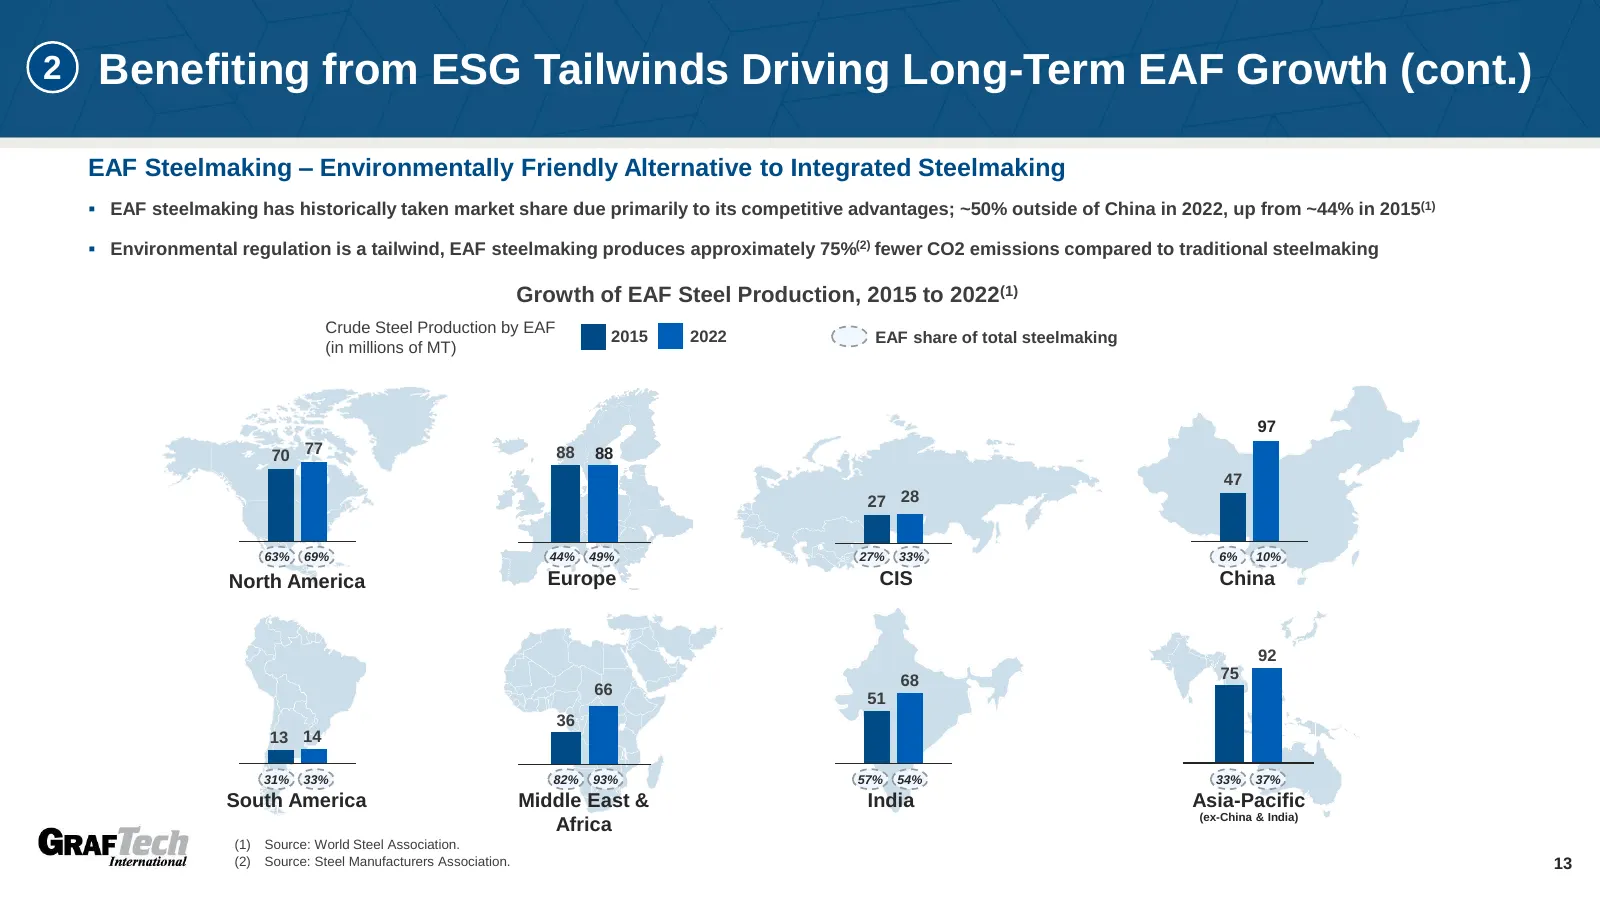
Slide 13: Benefiting from ESG Tailwinds Driving Long-Term EAF Growth (cont.)
2 Benefiting from ESG Tailwinds Driving Long-Term EAF Growth (cont.) EAF Steelmaking – Environmentally Friendly Alternative to Integrated Steelmaking ▪ EAF steelmaking has historically taken market share due primarily to its competitive advantages; ~50% outside of China in 2022, up from ~44% in 2015
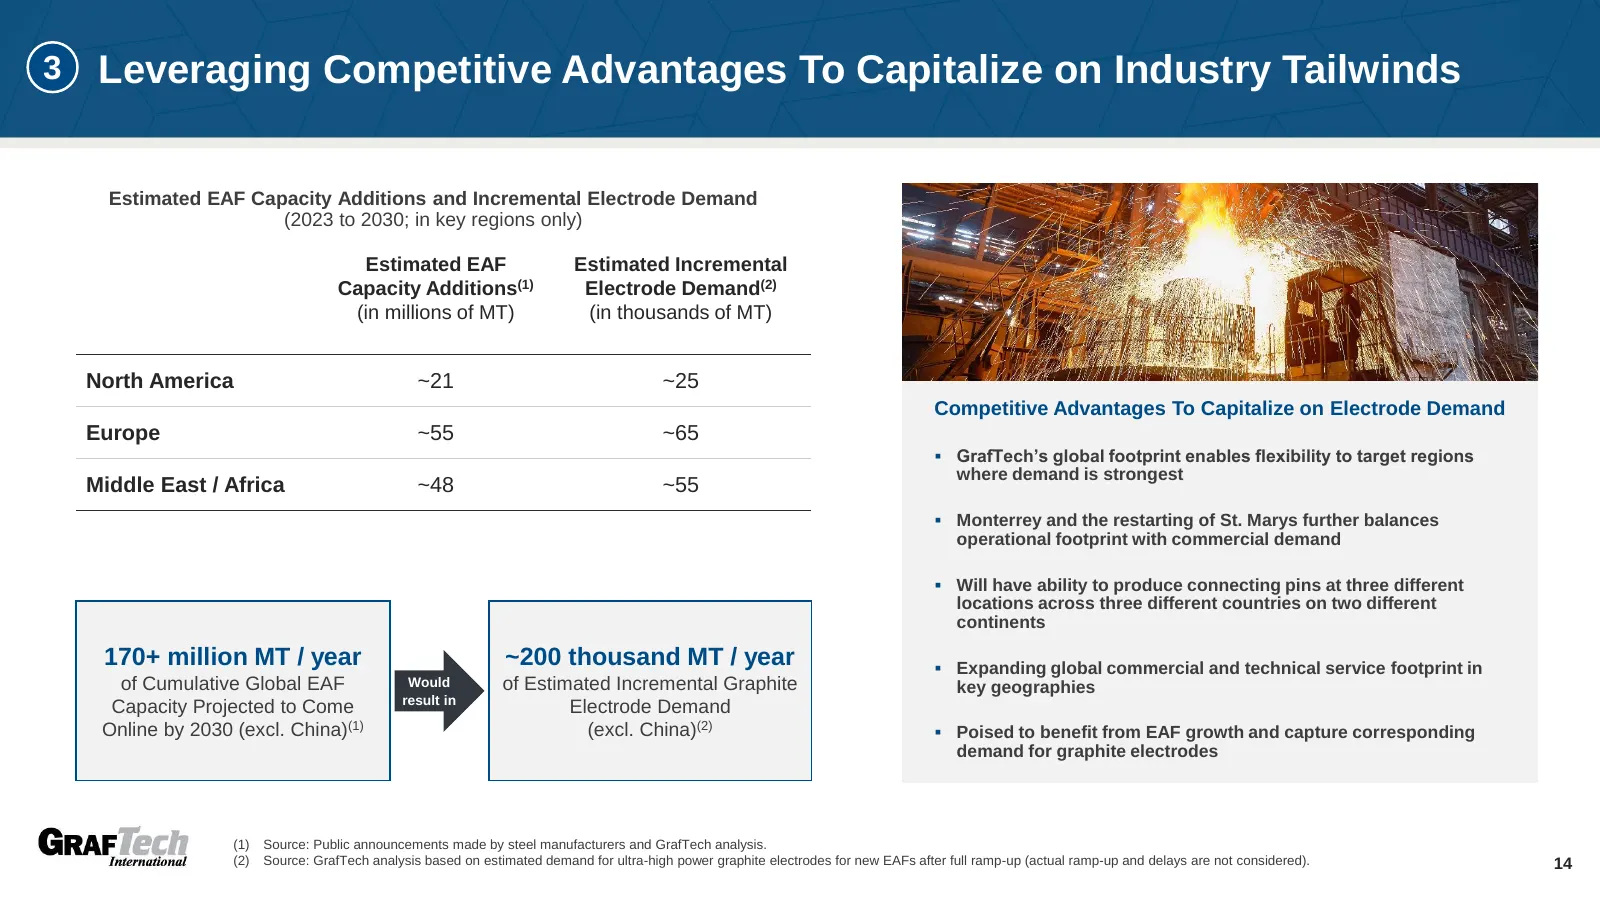
Slide 14: Leveraging Competitive Advantages To Capitalize on Industry Tailwinds
3 Leveraging Competitive Advantages To Capitalize on Industry Tailwinds Estimated EAF Capacity Additions and Incremental Electrode Demand (2023 to 2030; in key regions only) Estimated EAF Estimated Incremental Capacity Additions(1) Electrode Demand(2) (in millions of MT) (in thousands of MT) North A
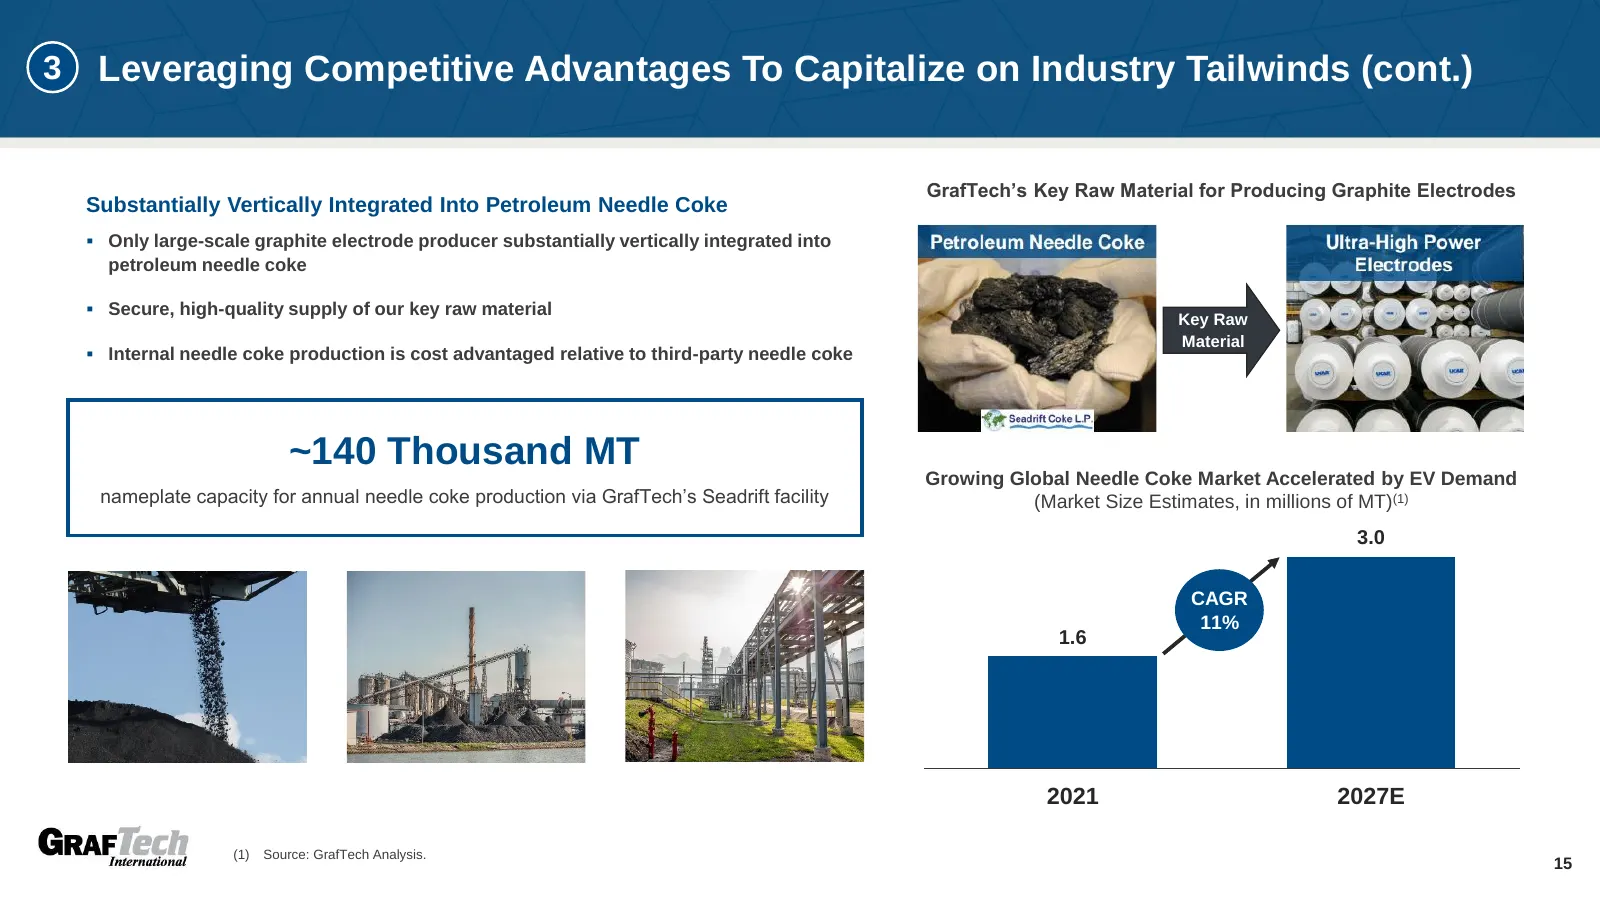
Slide 15: Leveraging Competitive Advantages To Capitalize on Industry Tailwinds (cont.)
3 Leveraging Competitive Advantages To Capitalize on Industry Tailwinds (cont.) GrafTech’s Key Raw Material for Producing Graphite Electrodes Substantially Vertically Integrated Into Petroleum Needle Coke ▪ Only large-scale graphite electrode producer substantially vertically integrated into petrole
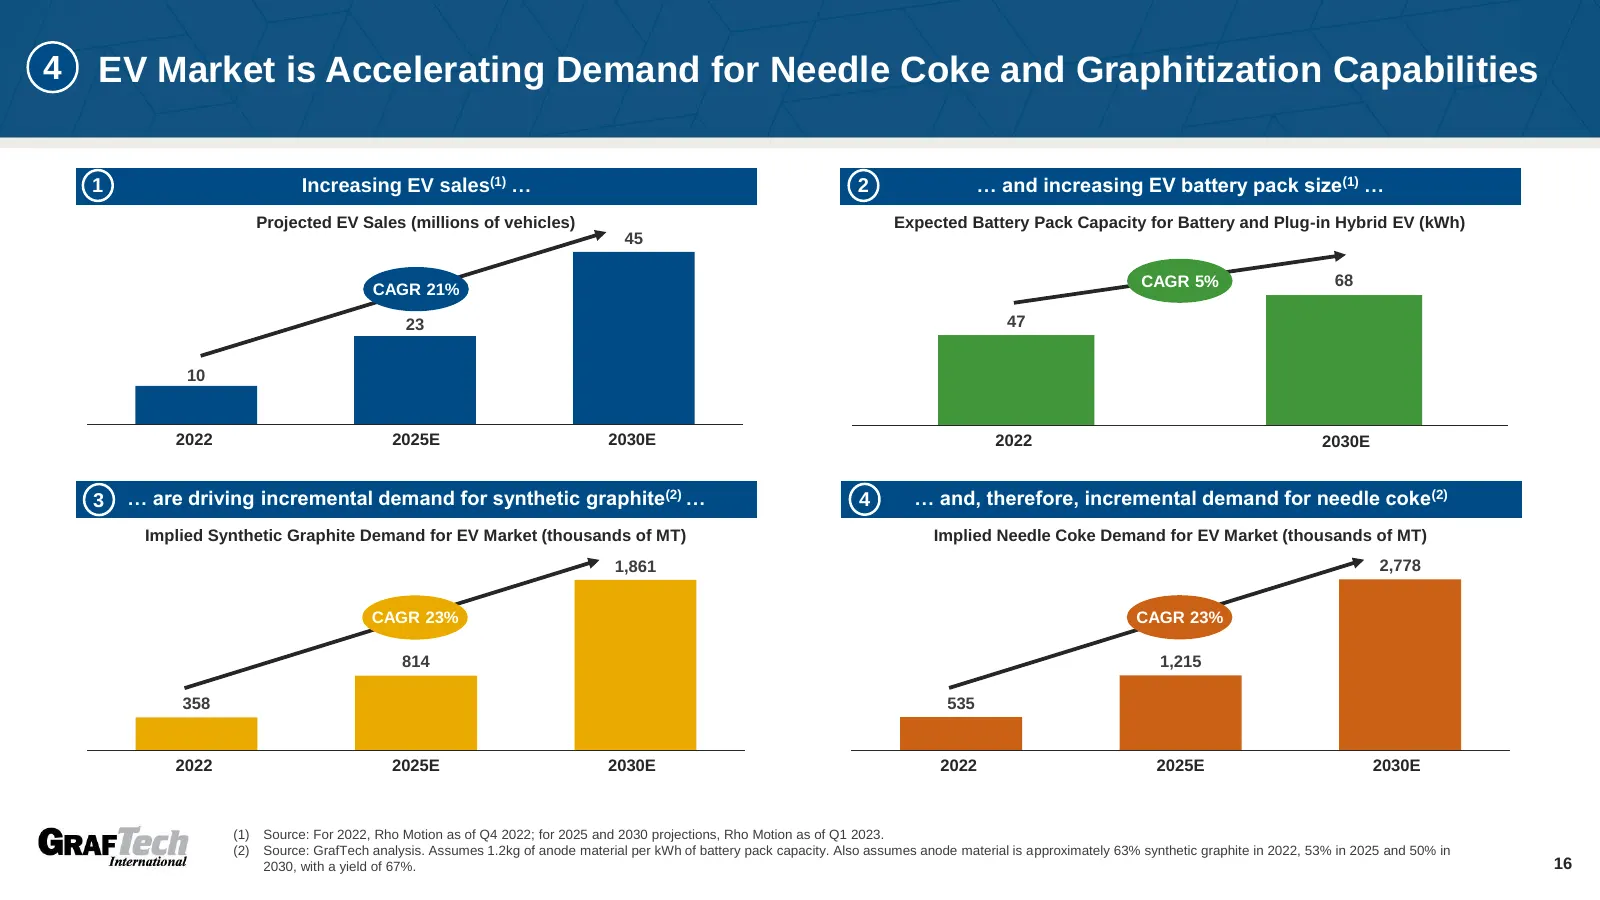
Slide 16: EV Market is Accelerating Demand for Needle Coke and Graphitization Capabilities
4 EV Market is Accelerating Demand for Needle Coke and Graphitization Capabilities 1 Increasing EV sales(1) … 2 … and increasing EV battery pack size(1) … Projected EV Sales (millions of vehicles) Expected Battery Pack Capacity for Battery and Plug-in Hybrid EV (kWh) 45 CAGR 5% 68 CAGR 21% 23 47 10
Slide 17: EV Market is Accelerating Demand for Needle Coke and Graphitization Capabilities (cont.)
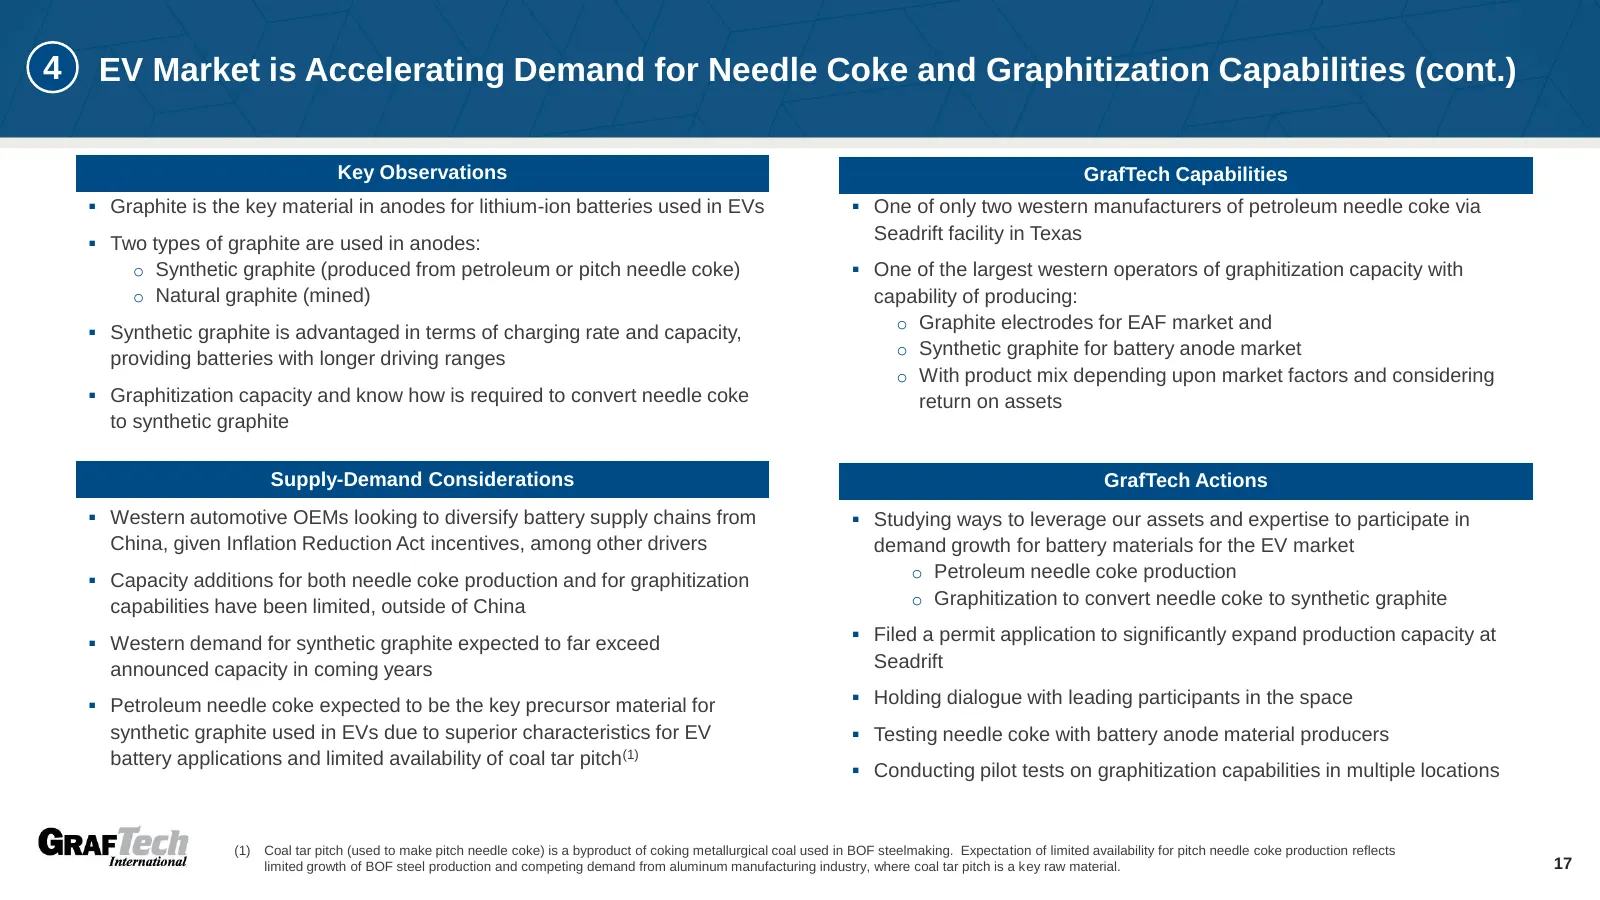
4 EV Market is Accelerating Demand for Needle Coke and Graphitization Capabilities (cont.) Key Observations GrafTech Capabilities ▪ Graphite is the key material in anodes for lithium-ion batteries used in EVs ▪ One of only two western manufacturers of petroleum needle coke via ▪ Two types of graphit
Slide 18: Prudent and Disciplined Capital Allocation Strategy
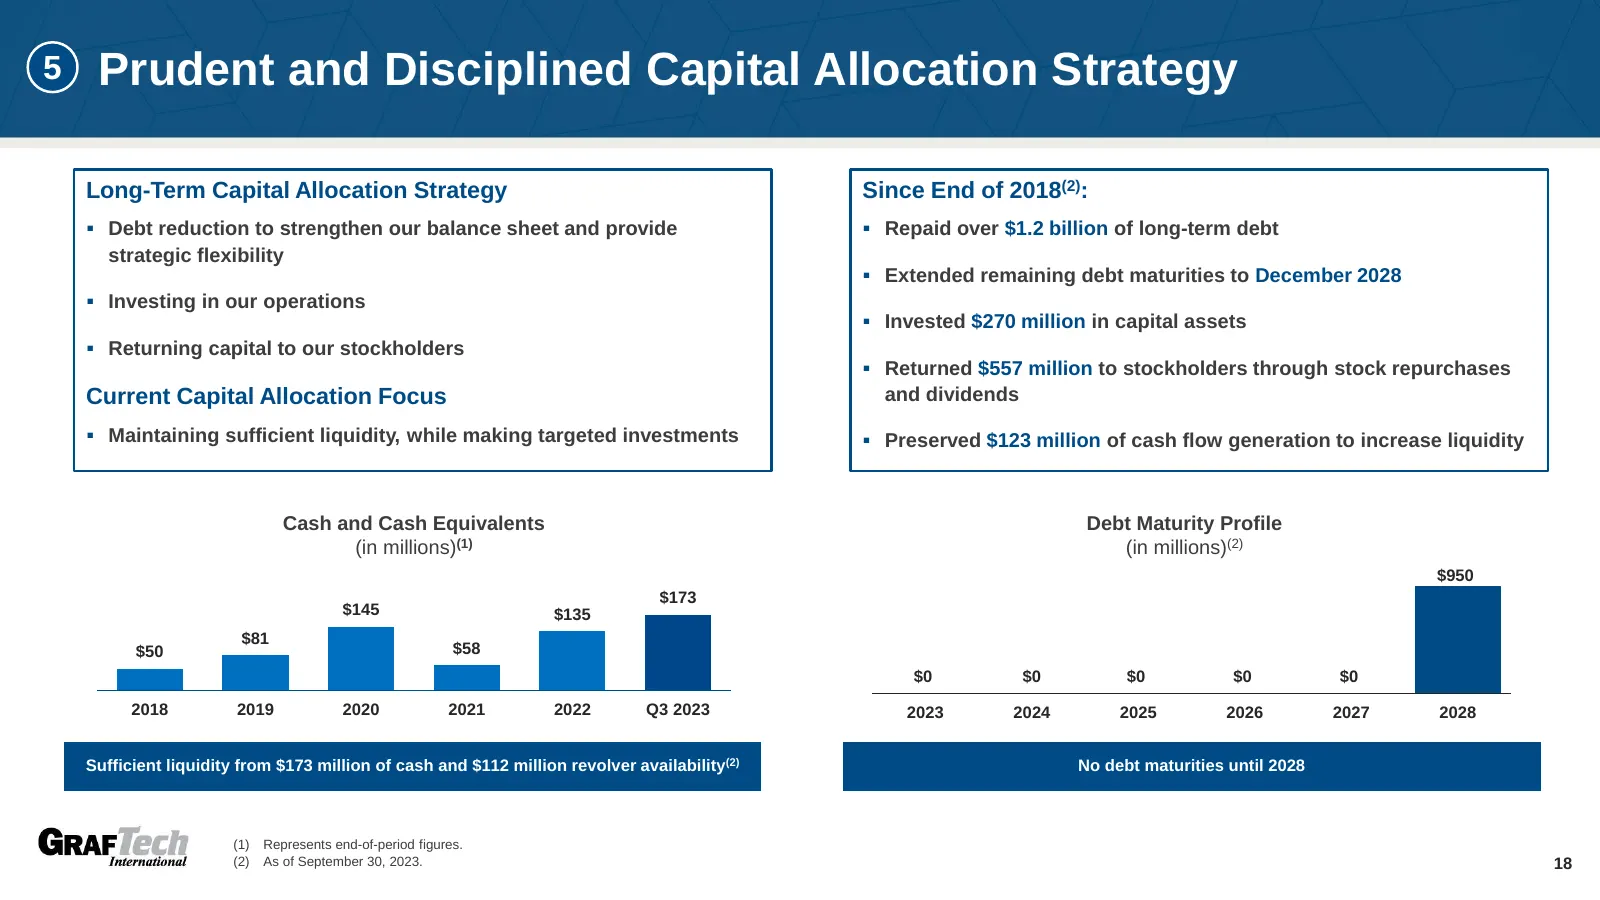
5 Prudent and Disciplined Capital Allocation Strategy Long-Term Capital Allocation Strategy Since End of 2018(2): ▪ Debt reduction to strengthen our balance sheet and provide ▪ Repaid over $1.2 billion of long-term debt strategic flexibility ▪ Extended remaining debt maturities to December 2028 ▪ In
Slide 19: Business Update as of Q3 2023
Business Update as of Q3 2023 Note: The following slides were published on the Company’s website on November 3, 2023, in connection with the Company’s Q3 2023 earnings release, and have not been revised or updated. 19
Slide 20: Key Discussion Topics
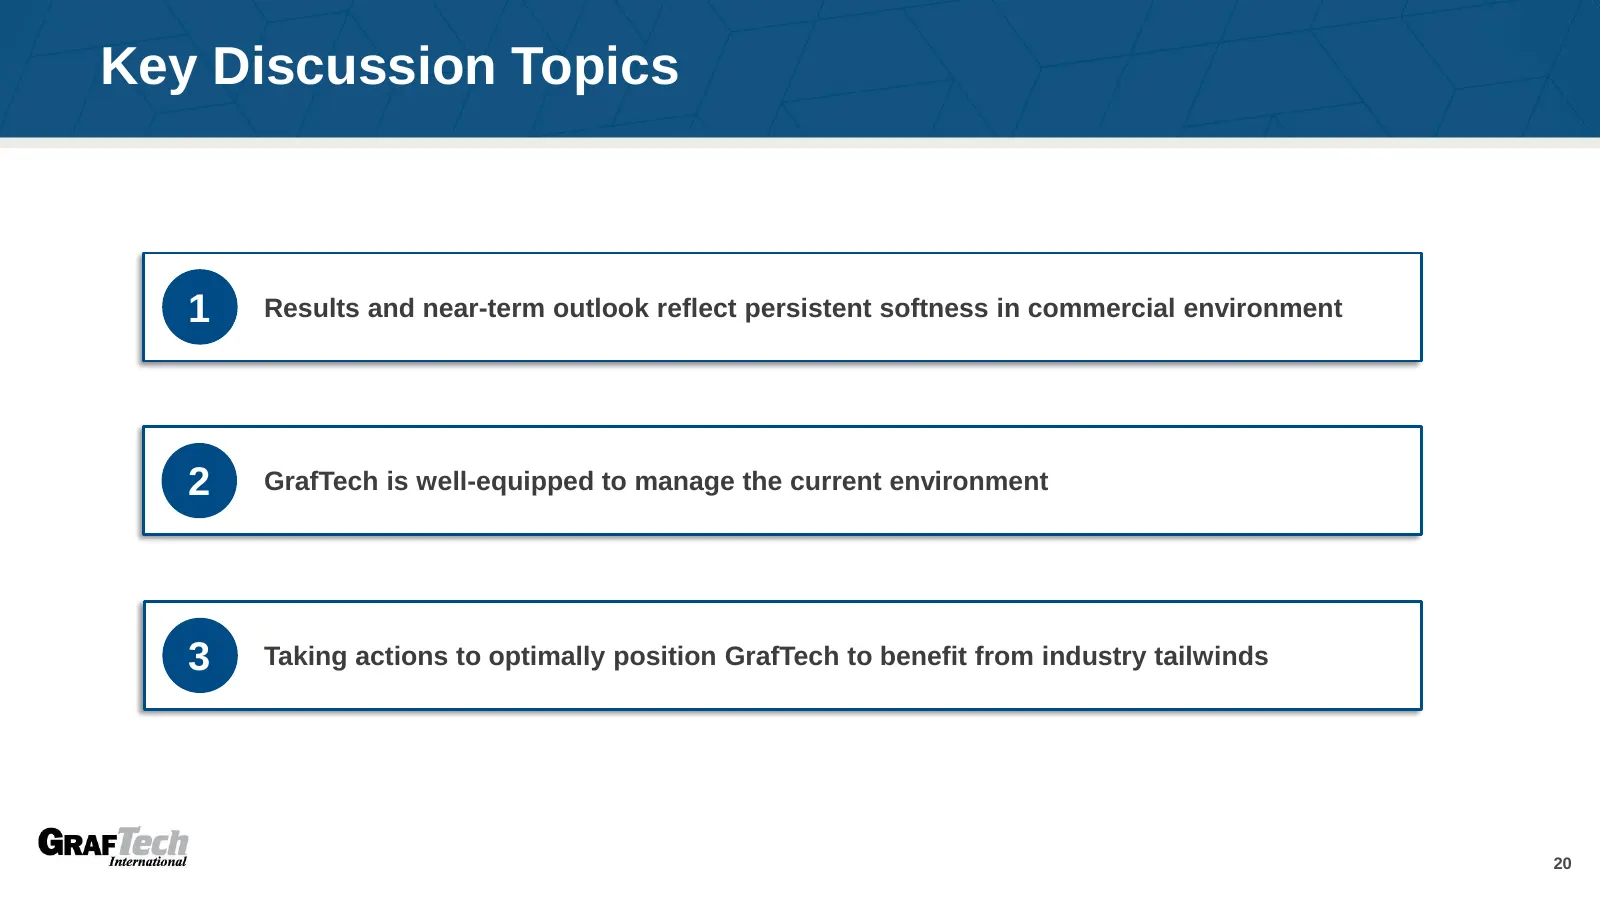
Key Discussion Topics 1 Results and near-term outlook reflect persistent softness in commercial environment 2 GrafTech is well-equipped to manage the current environment 3 Taking actions to optimally position GrafTech to benefit from industry tailwinds 20
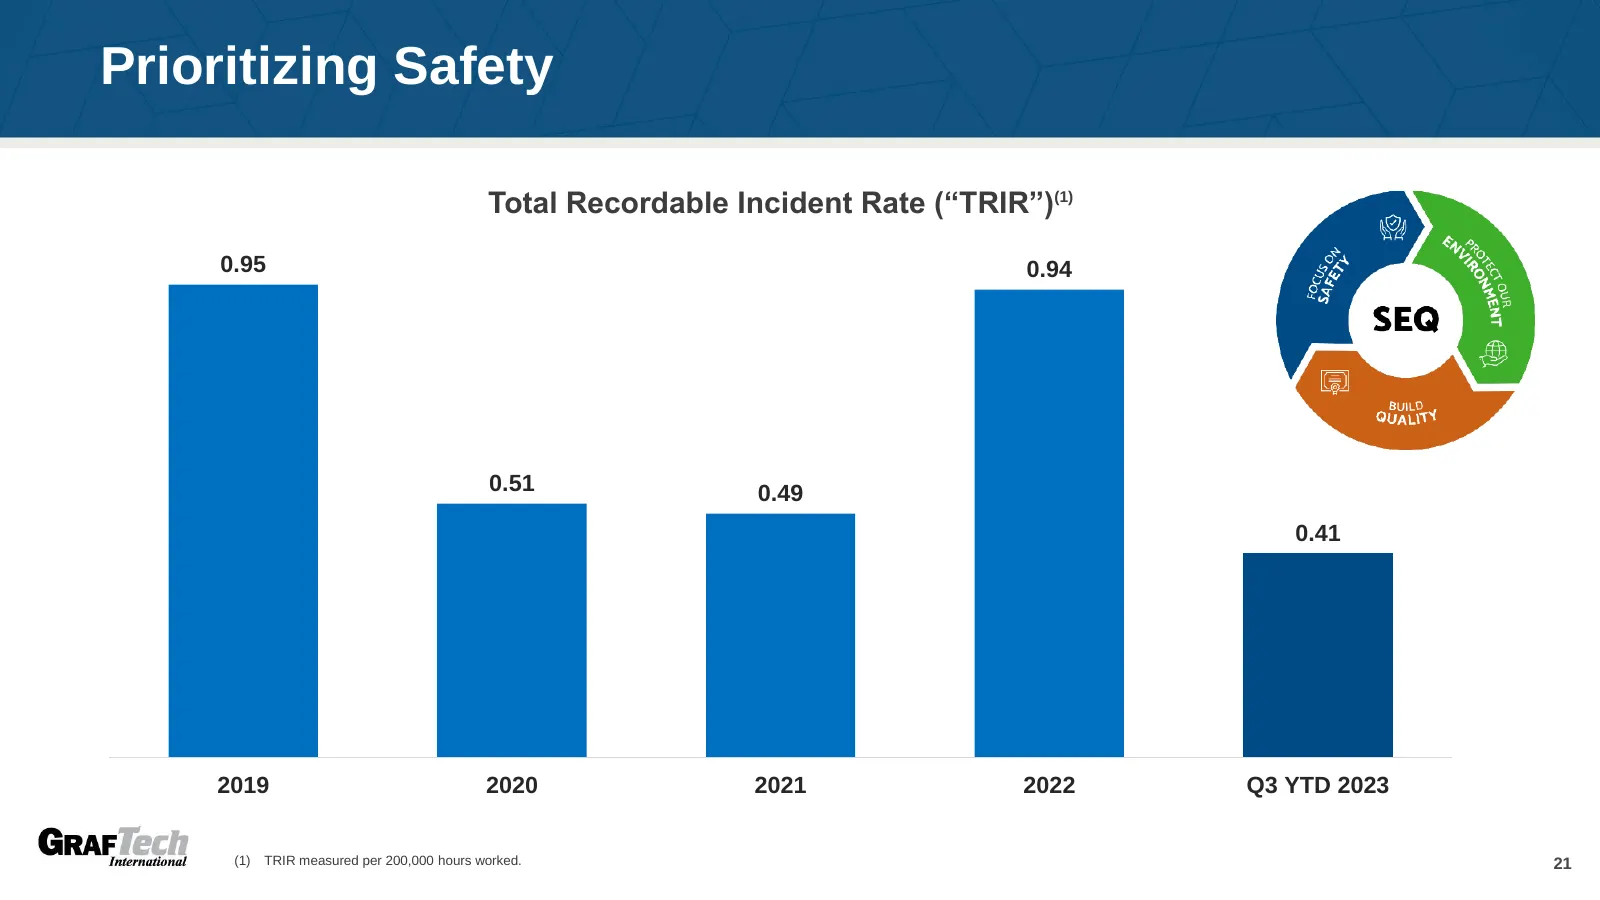
Slide 21: Prioritizing Safety
Prioritizing Safety Total Recordable Incident Rate (“TRIR”)(1) 0.95 0.94 0.51 0.49 0.41 2019 2020 2021 2022 Q3 YTD 2023 (1) TRIR measured per 200,000 hours worked. 21
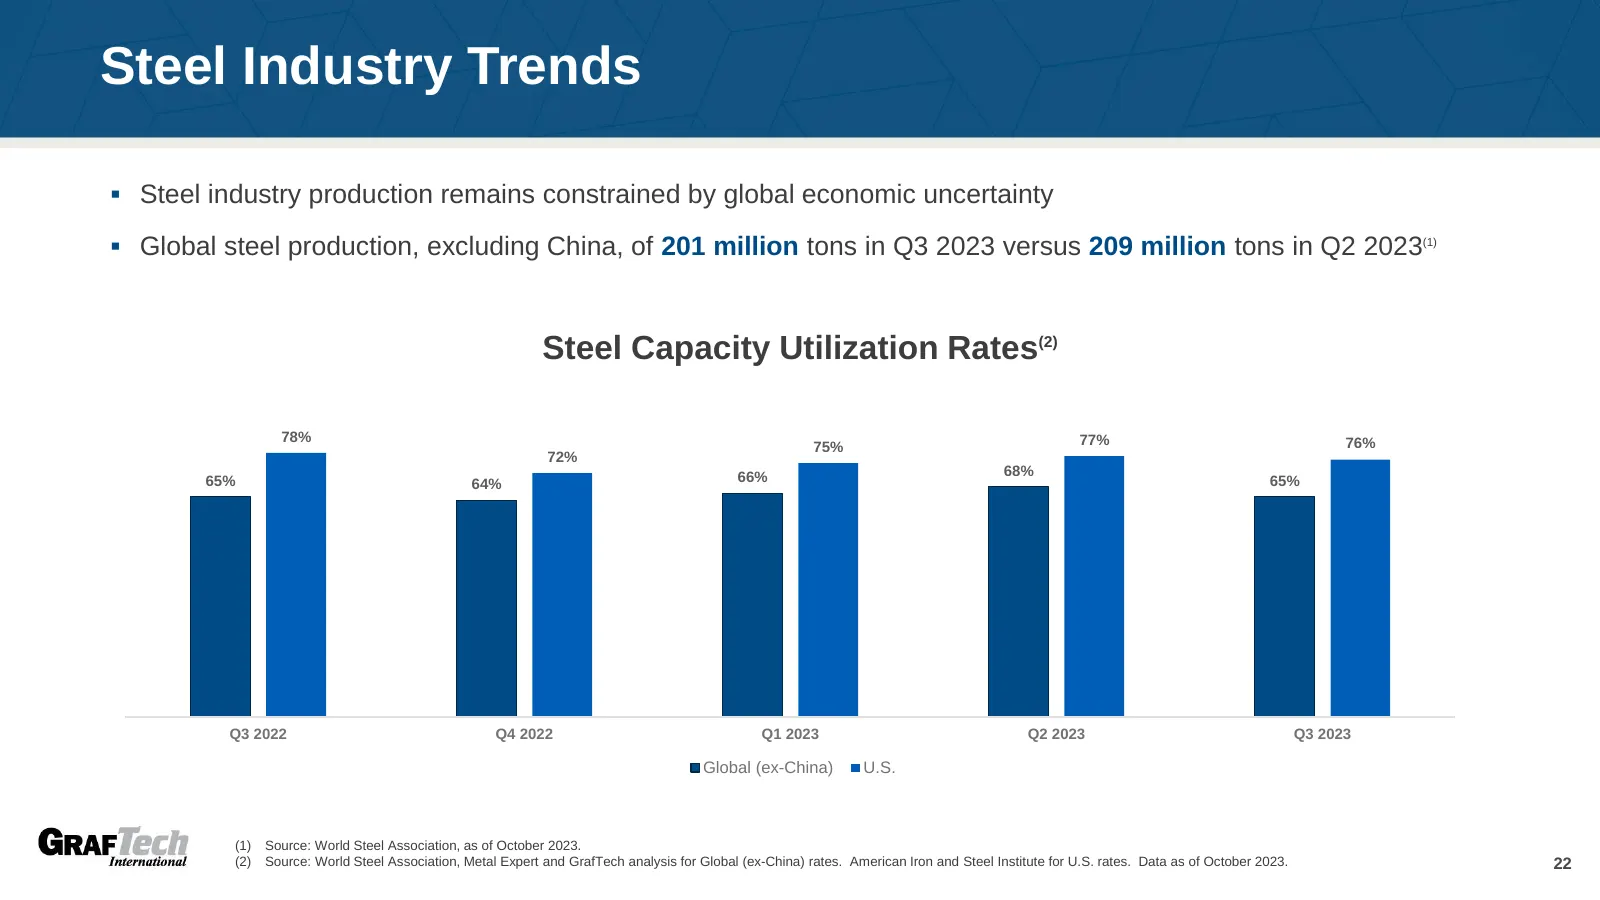
Slide 22: Steel Industry Trends
Steel Industry Trends ▪ Steel industry production remains constrained by global economic uncertainty ▪ Global steel production, excluding China, of 201 million tons in Q3 2023 versus 209 million tons in Q2 2023(1) Steel Capacity Utilization Rates(2) 78% 77% 76% 75% 72% 66% 68% 65% 64% 65% Q3 2022 Q4
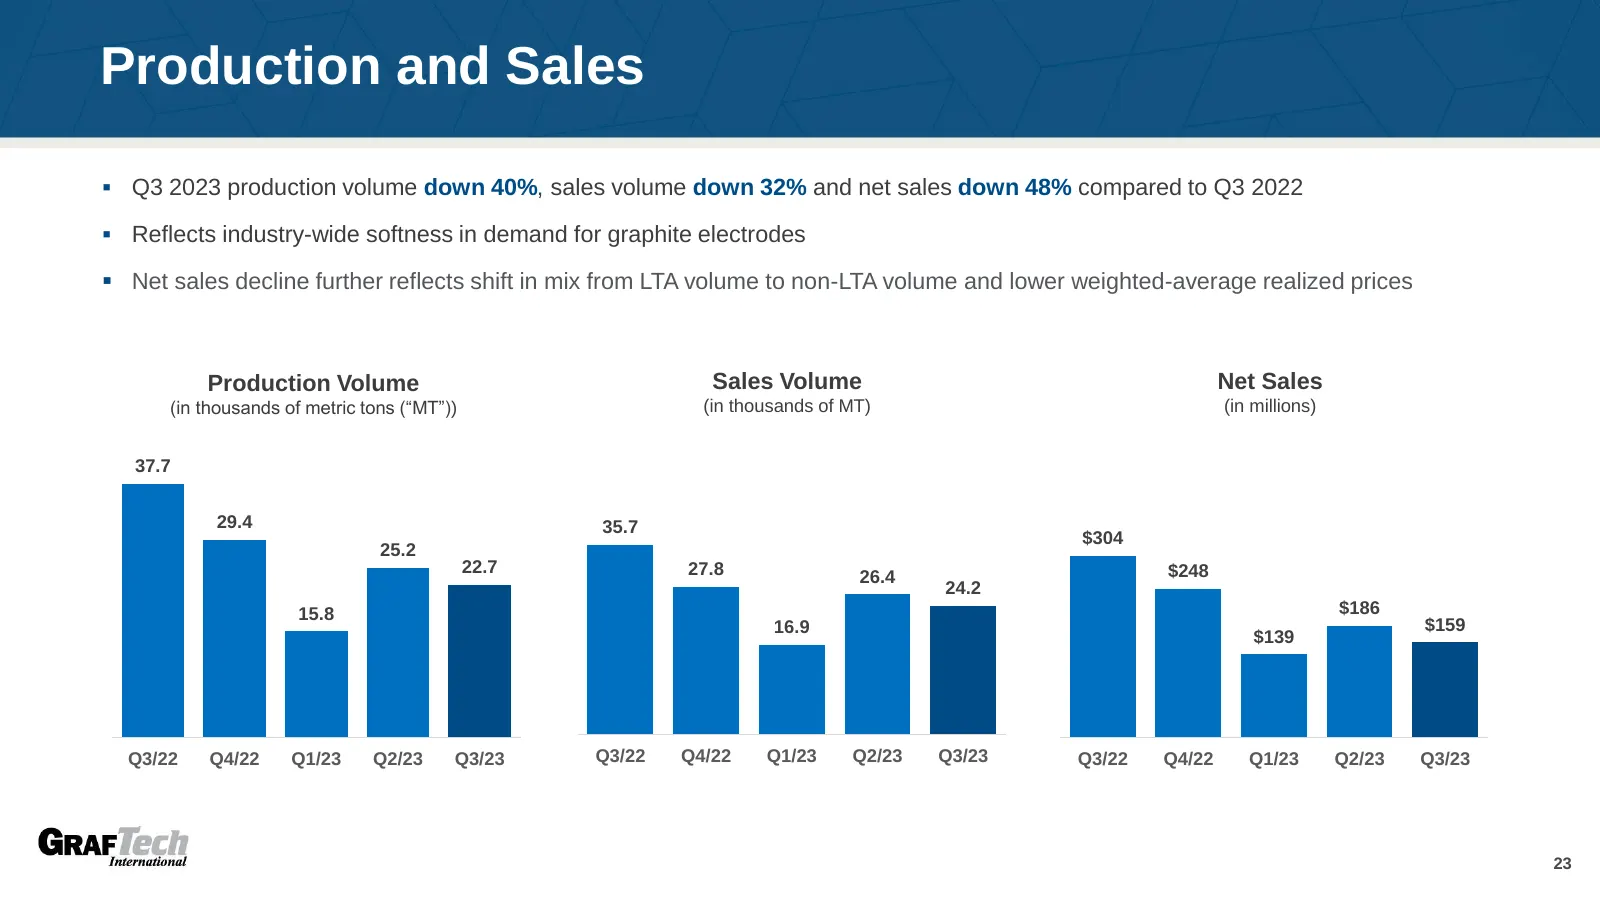
Slide 23: Production and Sales
Production and Sales ▪ Q3 2023 production volume down 40%, sales volume down 32% and net sales down 48% compared to Q3 2022 ▪ Reflects industry-wide softness in demand for graphite electrodes ▪ Net sales decline further reflects shift in mix from LTA volume to non-LTA volume and lower weighted-avera
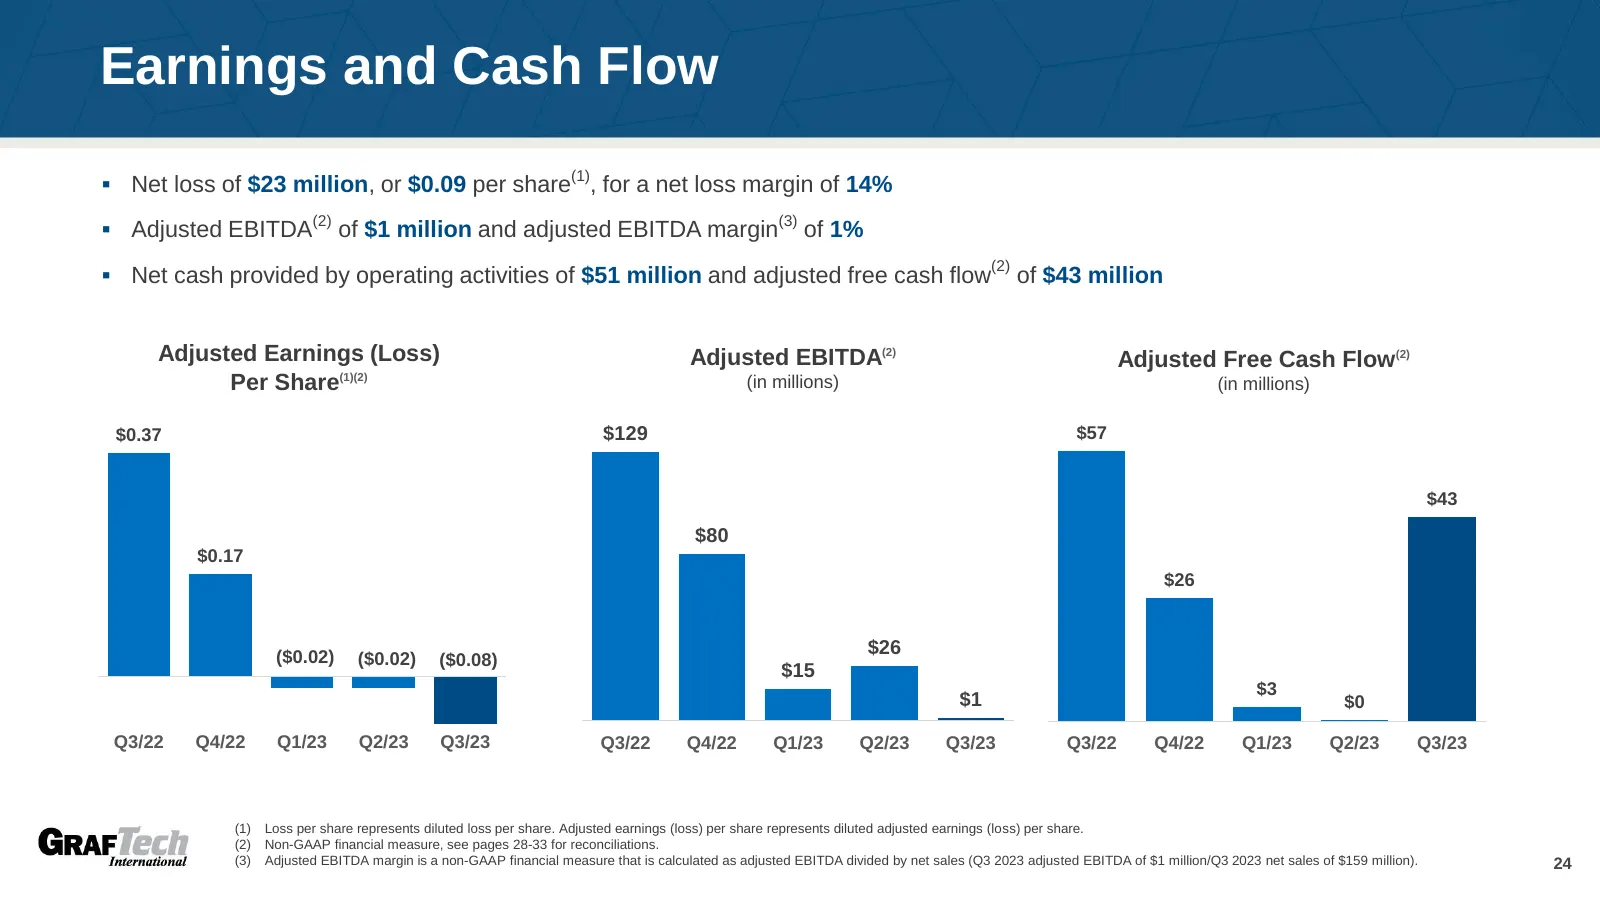
Slide 24: Earnings and Cash Flow
Earnings and Cash Flow (1) ▪ Net loss of $23 million, or $0.09 per share , for a net loss margin of 14% (2) ▪ Adjusted EBITDA of $1 million and adjusted EBITDA margin(3) of 1% (2) ▪ Net cash provided by operating activities of $51 million and adjusted free cash flow of $43 million Adjusted Earnings
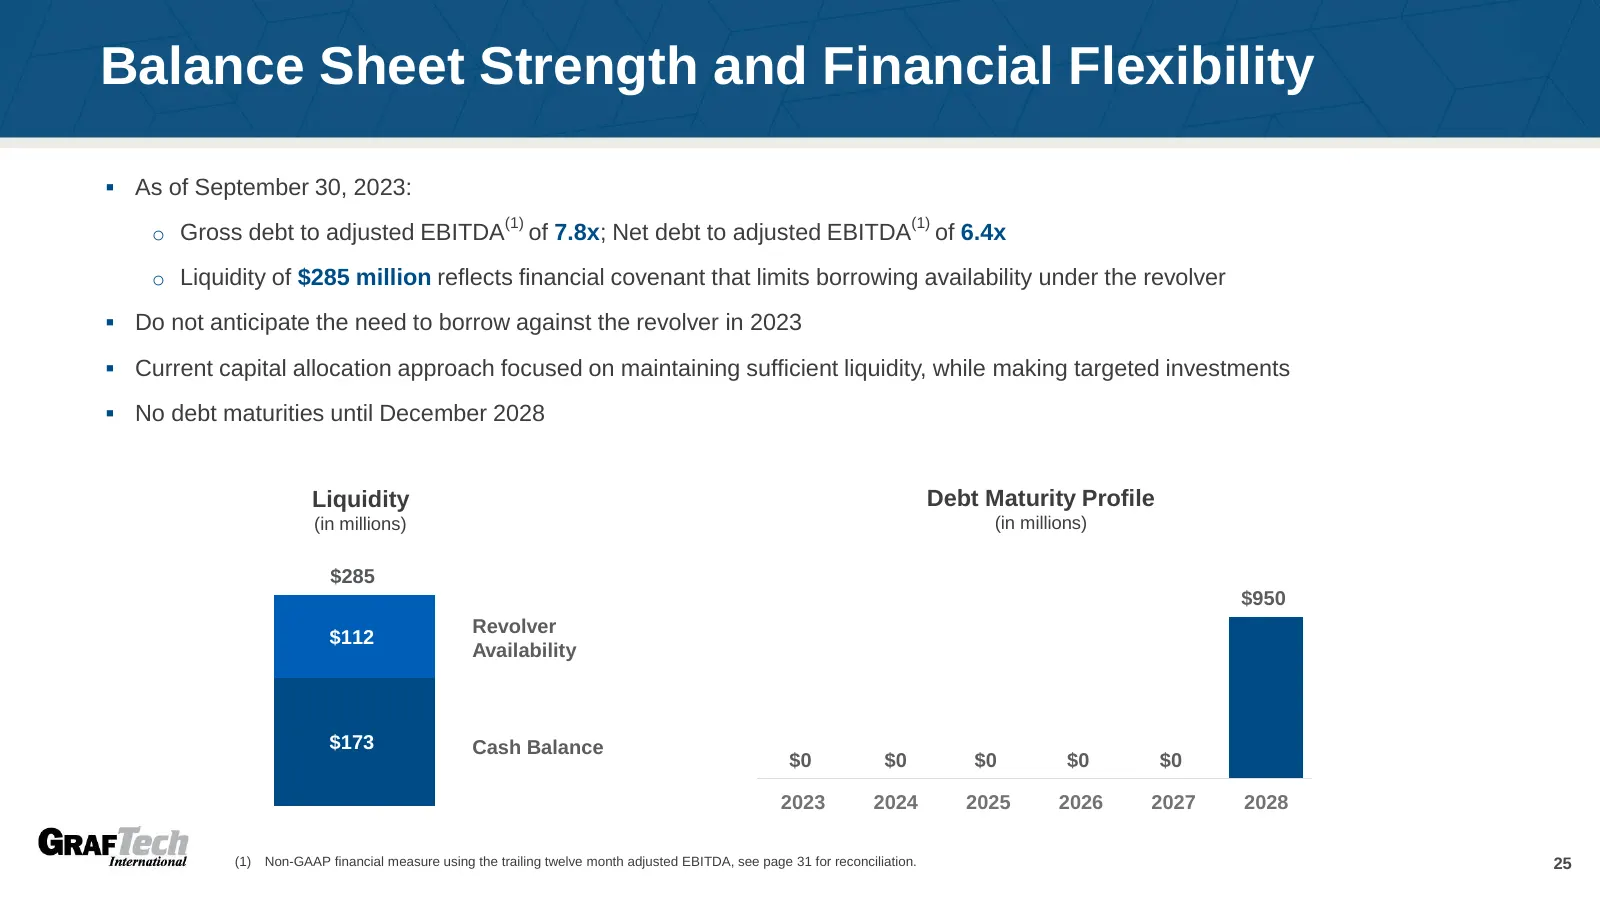
Slide 25: Balance Sheet Strength and Financial Flexibility
Balance Sheet Strength and Financial Flexibility ▪ As of September 30, 2023: (1) o Gross debt to adjusted EBITDA of 7.8x; Net debt to adjusted EBITDA(1) of 6.4x o Liquidity of $285 million reflects financial covenant that limits borrowing availability under the revolver ▪ Do not anticipate the need
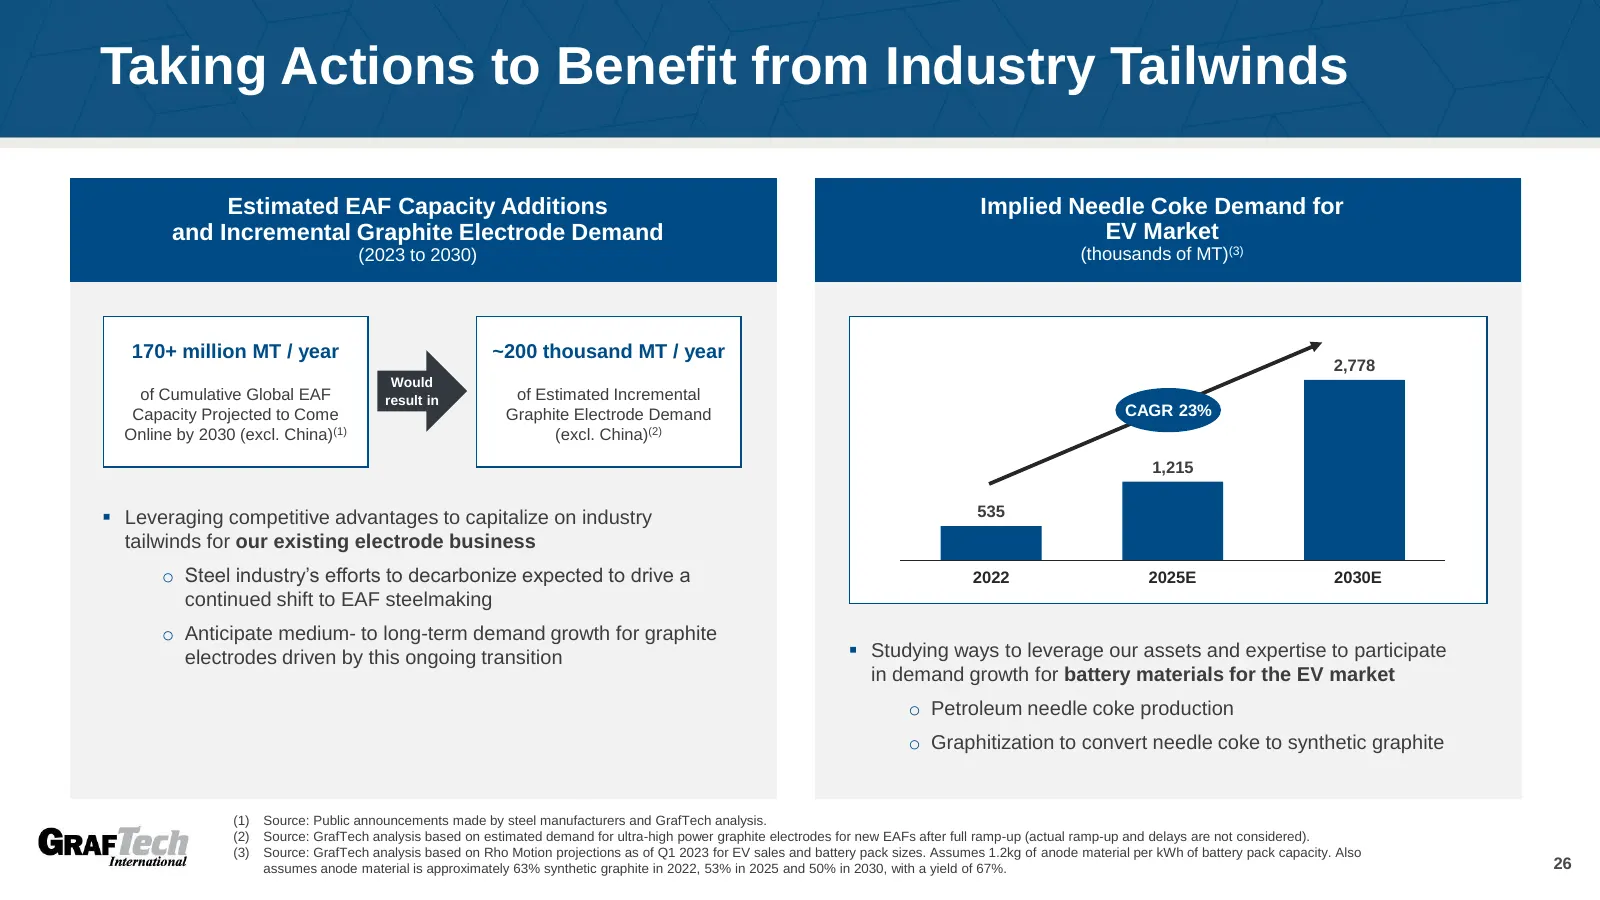
Slide 26: Taking Actions to Benefit from Industry Tailwinds
Taking Actions to Benefit from Industry Tailwinds Estimated EAF Capacity Additions Implied Needle Coke Demand for and Incremental Graphite Electrode Demand EV Market (2023 to 2030) (thousands of MT)(3) 170+ million MT / year ~200 thousand MT / year 2,778 Would of Cumulative Global EAF result in of E
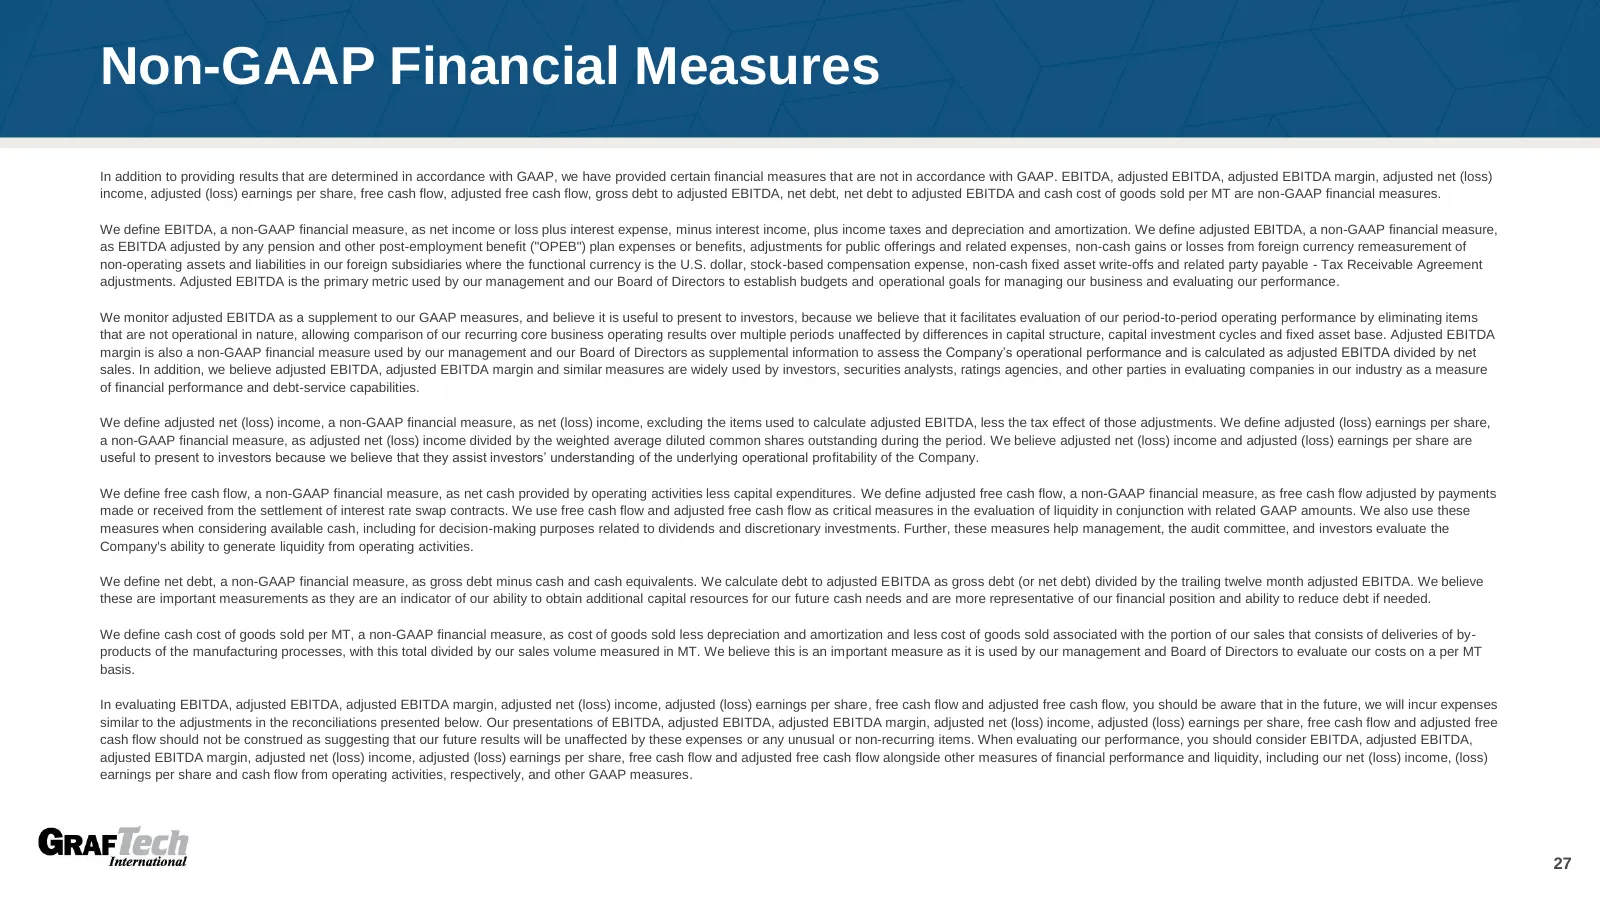
Slide 27: Non-GAAP Financial Measures
Non-GAAP Financial Measures In addition to providing results that are determined in accordance with GAAP, we have provided certain financial measures that are not in accordance with GAAP. EBITDA, adjusted EBITDA, adjusted EBITDA margin, adjusted net (loss) income, adjusted (loss) earnings per share,
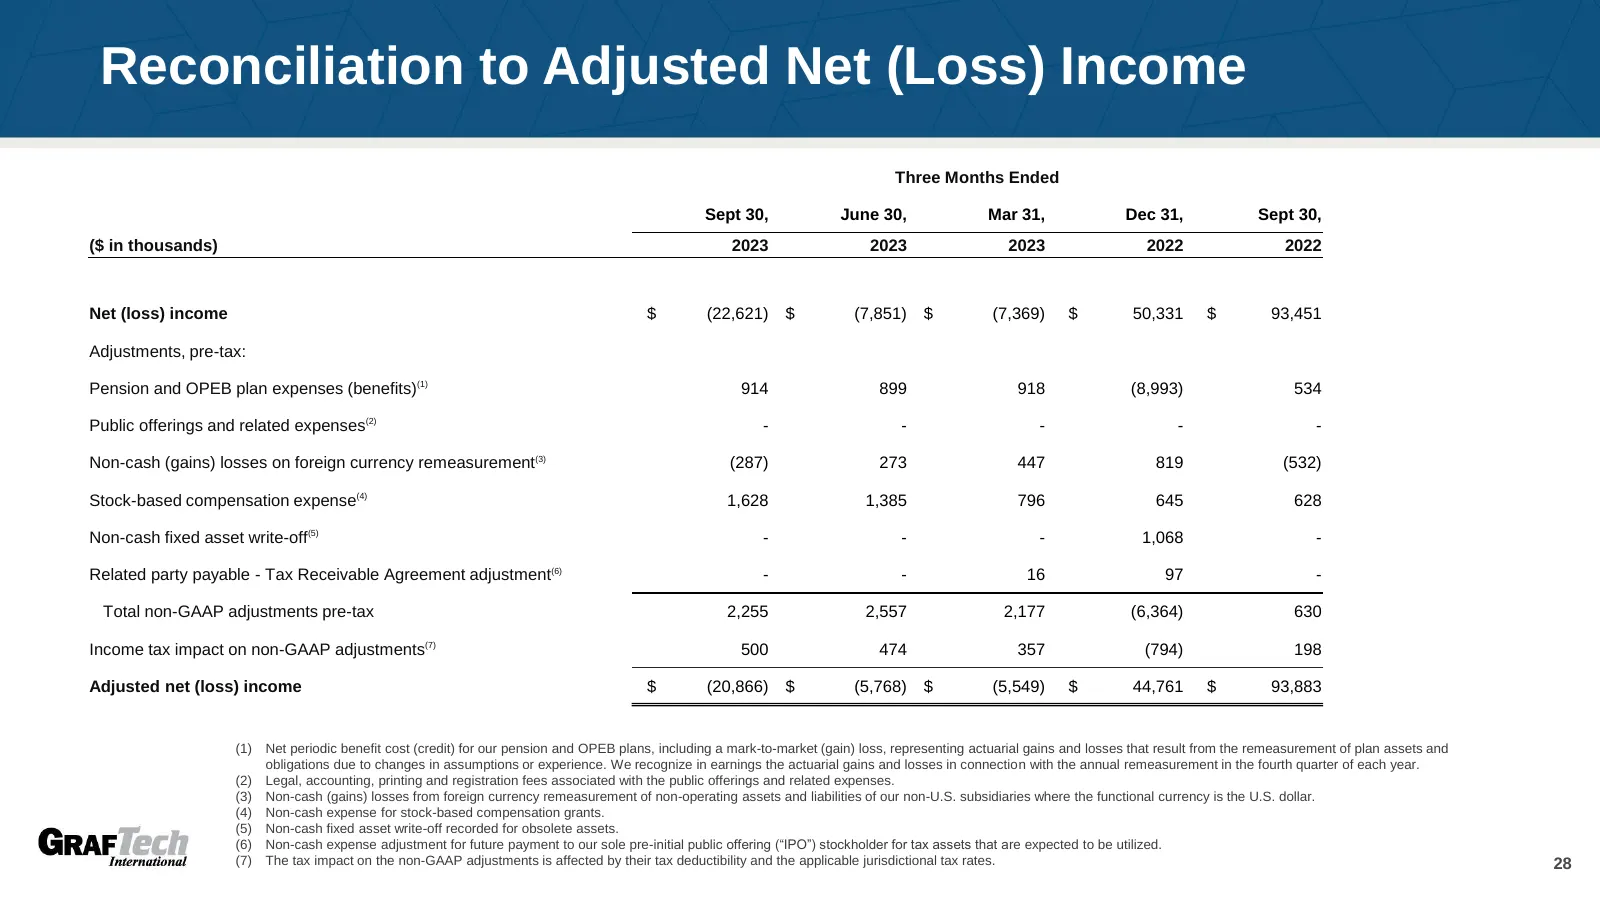
Slide 28: Reconciliation to Adjusted Net (Loss) Income
Reconciliation to Adjusted Net (Loss) Income Three Months Ended Sept 30, June 30, Mar 31, Dec 31, Sept 30, ($ in thousands) 2023 2023 2023 2022 2022 Net (loss) income $ (22,621) $ (7,851) $ (7,369) $ 50,331 $ 93,451 Adjustments, pre-tax: Pension and OPEB plan expenses (benefits)(1) 914 899 918 (8,99
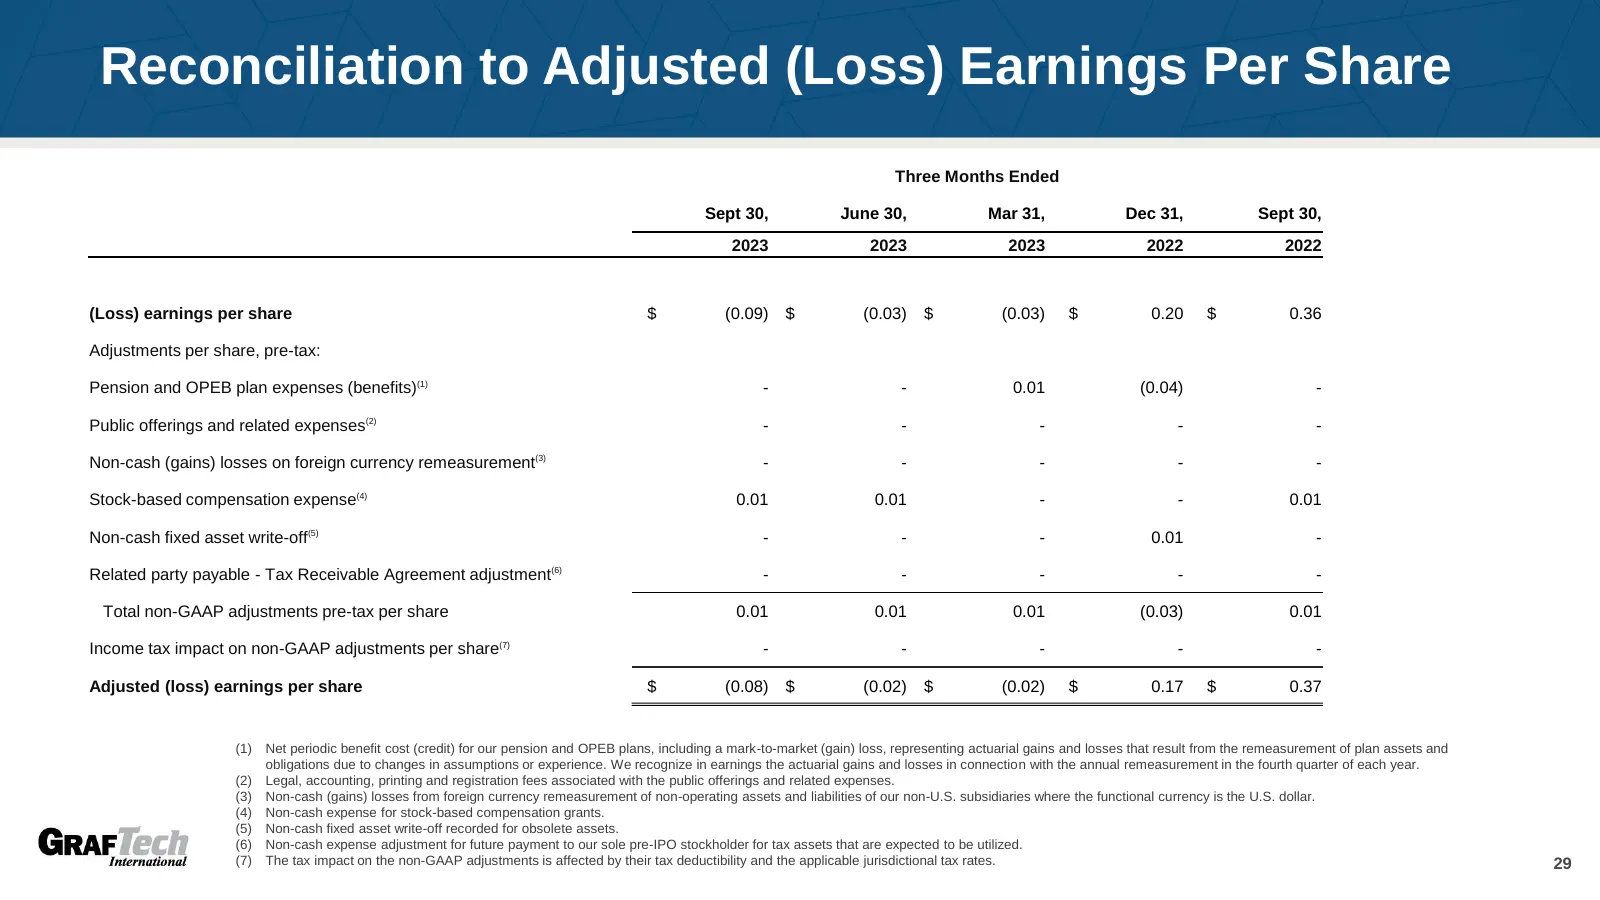
Slide 29: Reconciliation to Adjusted (Loss) Earnings Per Share
Reconciliation to Adjusted (Loss) Earnings Per Share Three Months Ended Sept 30, June 30, Mar 31, Dec 31, Sept 30, 2023 2023 2023 2022 2022 (Loss) earnings per share $ (0.09) $ (0.03) $ (0.03) $ 0.20 $ 0.36 Adjustments per share, pre-tax: Pension and OPEB plan expenses (benefits)(1) - - 0.01 (0.04)
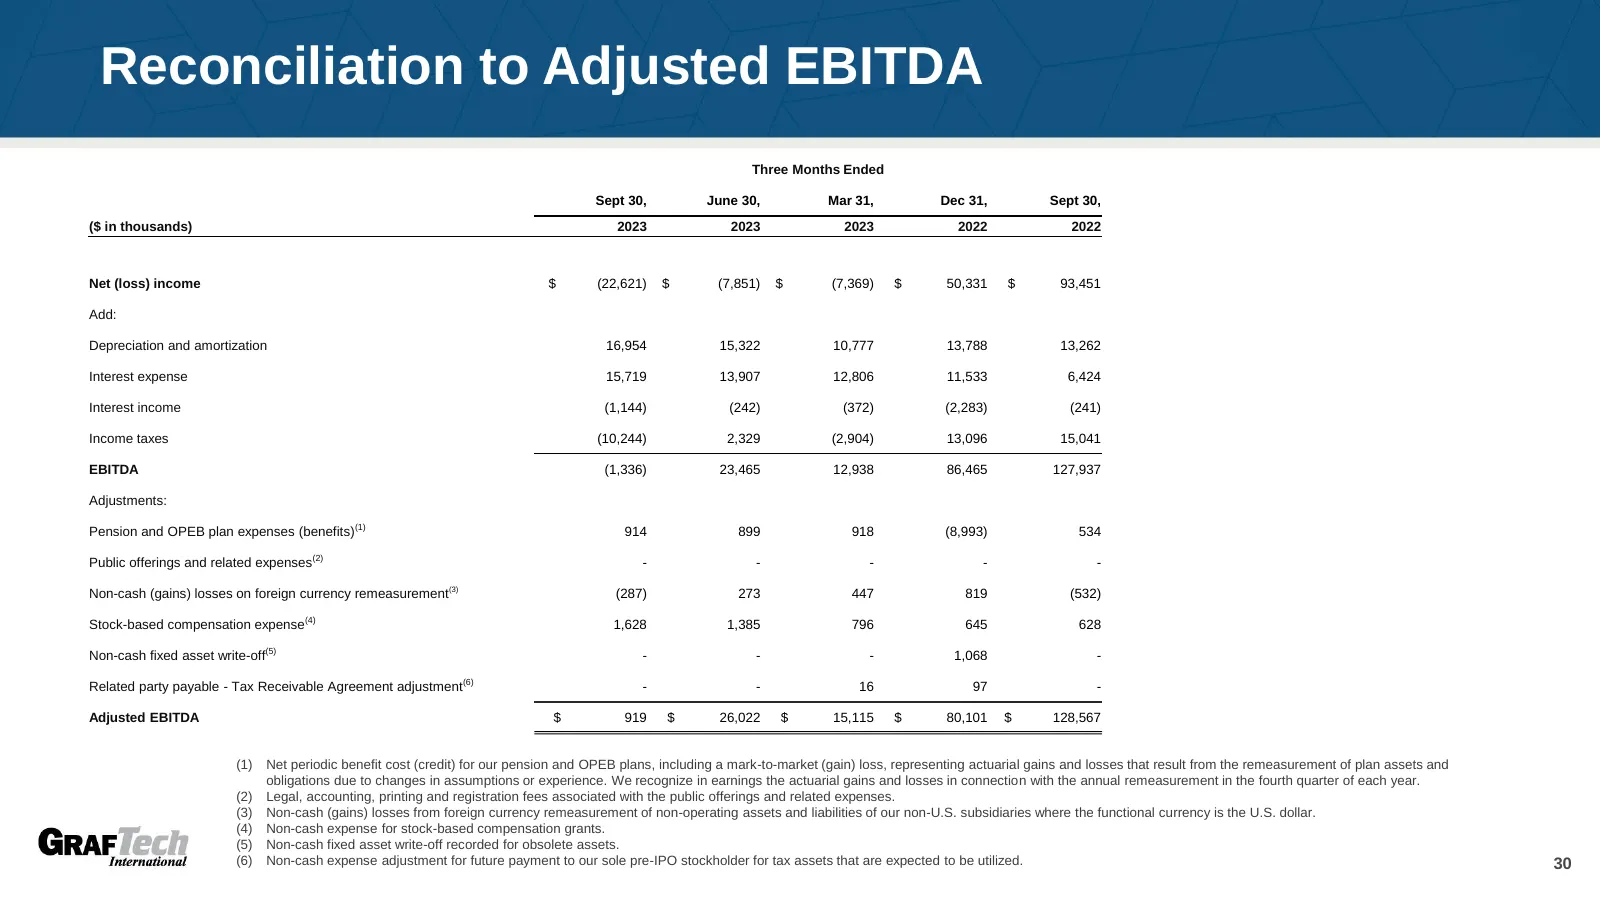
Slide 30: Reconciliation to Adjusted EBITDA
Reconciliation to Adjusted EBITDA Three Months Ended Sept 30, June 30, Mar 31, Dec 31, Sept 30, ($ in thousands) 2023 2023 2023 2022 2022 Net (loss) income $ (22,621) $ (7,851) $ (7,369) $ 50,331 $ 93,451 Add: Depreciation and amortization 16,954 15,322 10,777 13,788 13,262 Interest expense 15,719 1
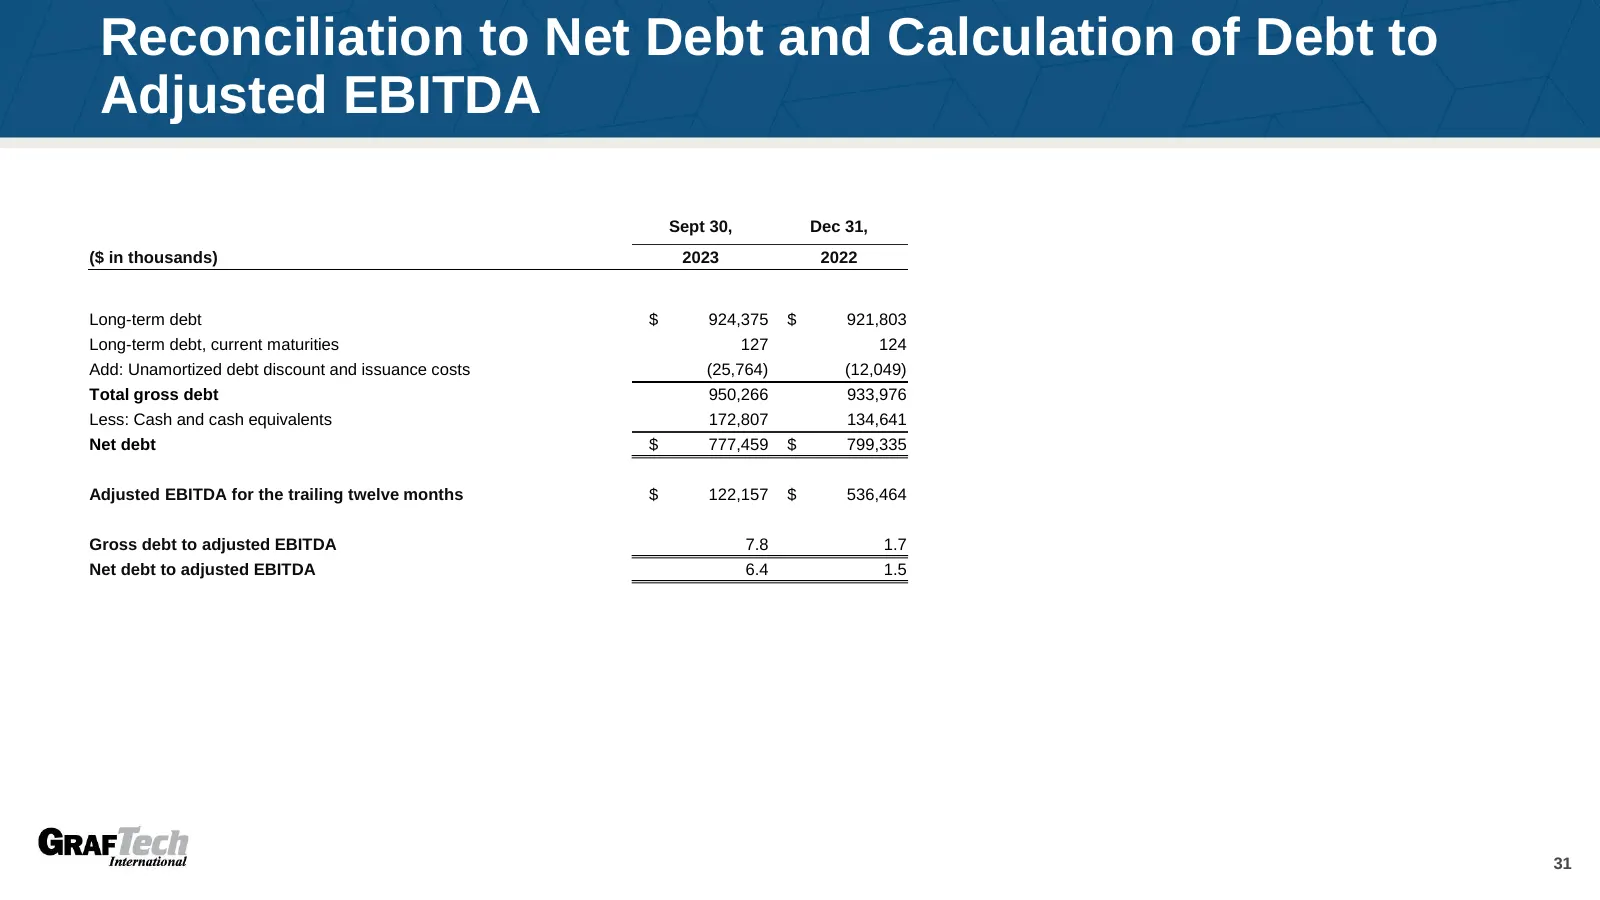
Slide 31: Reconciliation to Net Debt and Calculation of Debt to Adjusted EBITDA
Reconciliation to Net Debt and Calculation of Debt to Adjusted EBITDA Sept 30, Dec 31, ($ in thousands) 2023 2022 Long-term debt $ 924,375 $ 921,803 Long-term debt, current maturities 127 124 Add: Unamortized debt discount and issuance costs (25,764) (12,049) Total gross debt 950,266 933,976 Less: C
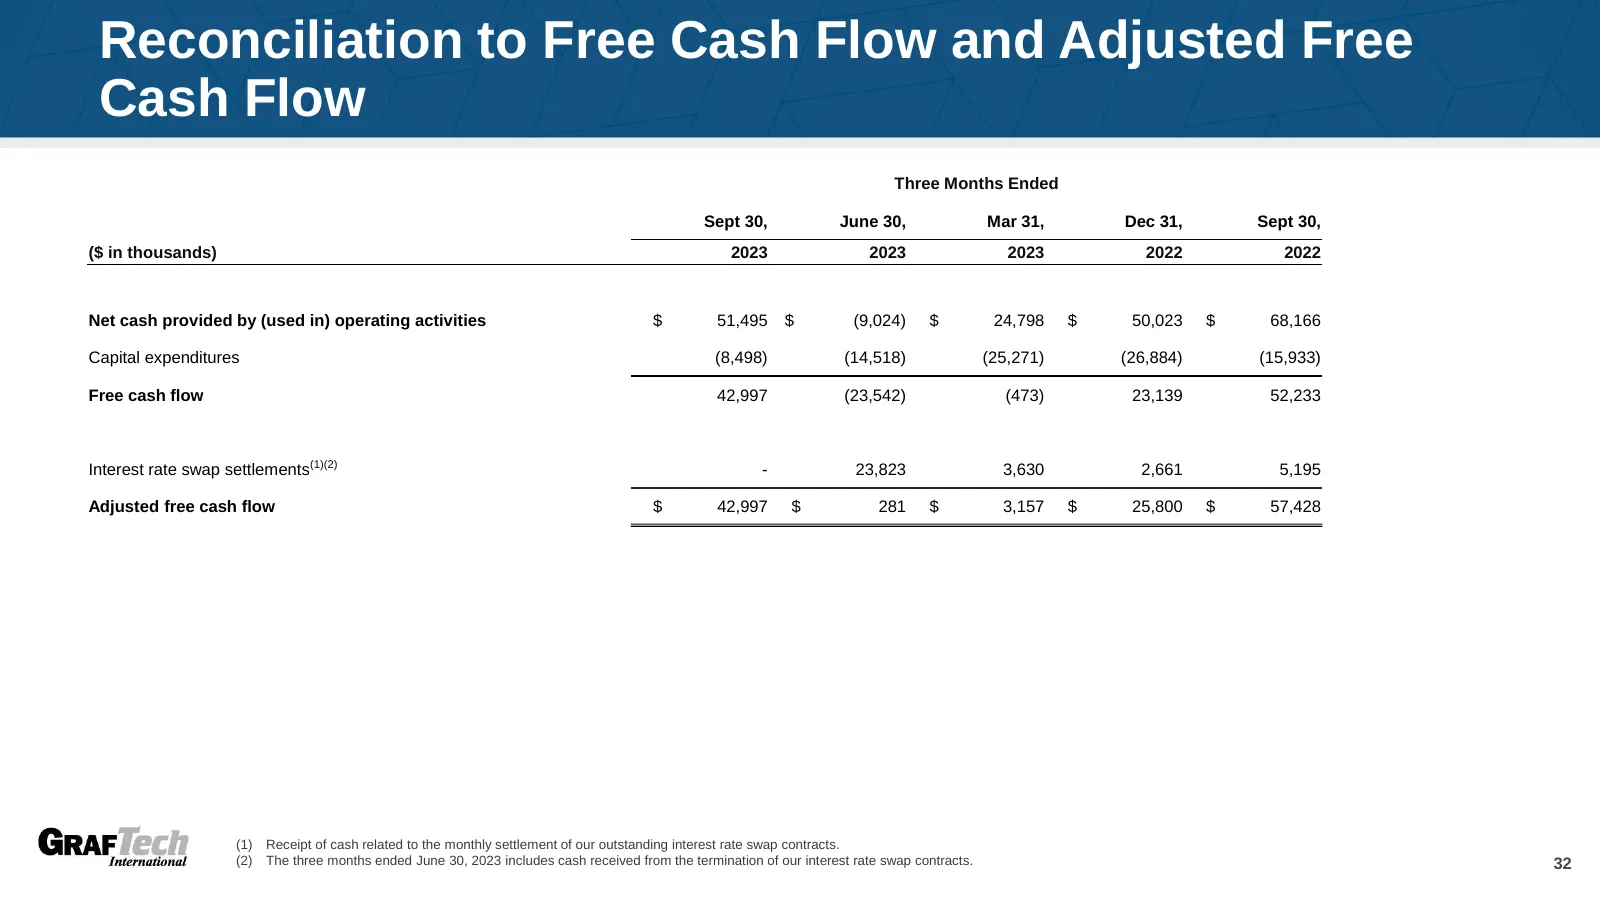
Slide 32: Reconciliation to Free Cash Flow and Adjusted Free Cash Flow
Reconciliation to Free Cash Flow and Adjusted Free Cash Flow Three Months Ended Sept 30, June 30, Mar 31, Dec 31, Sept 30, ($ in thousands) 2023 2023 2023 2022 2022 Net cash provided by (used in) operating activities $ 51,495 $ (9,024) $ 24,798 $ 50,023 $ 68,166 Capital expenditures (8,498) (14,518)
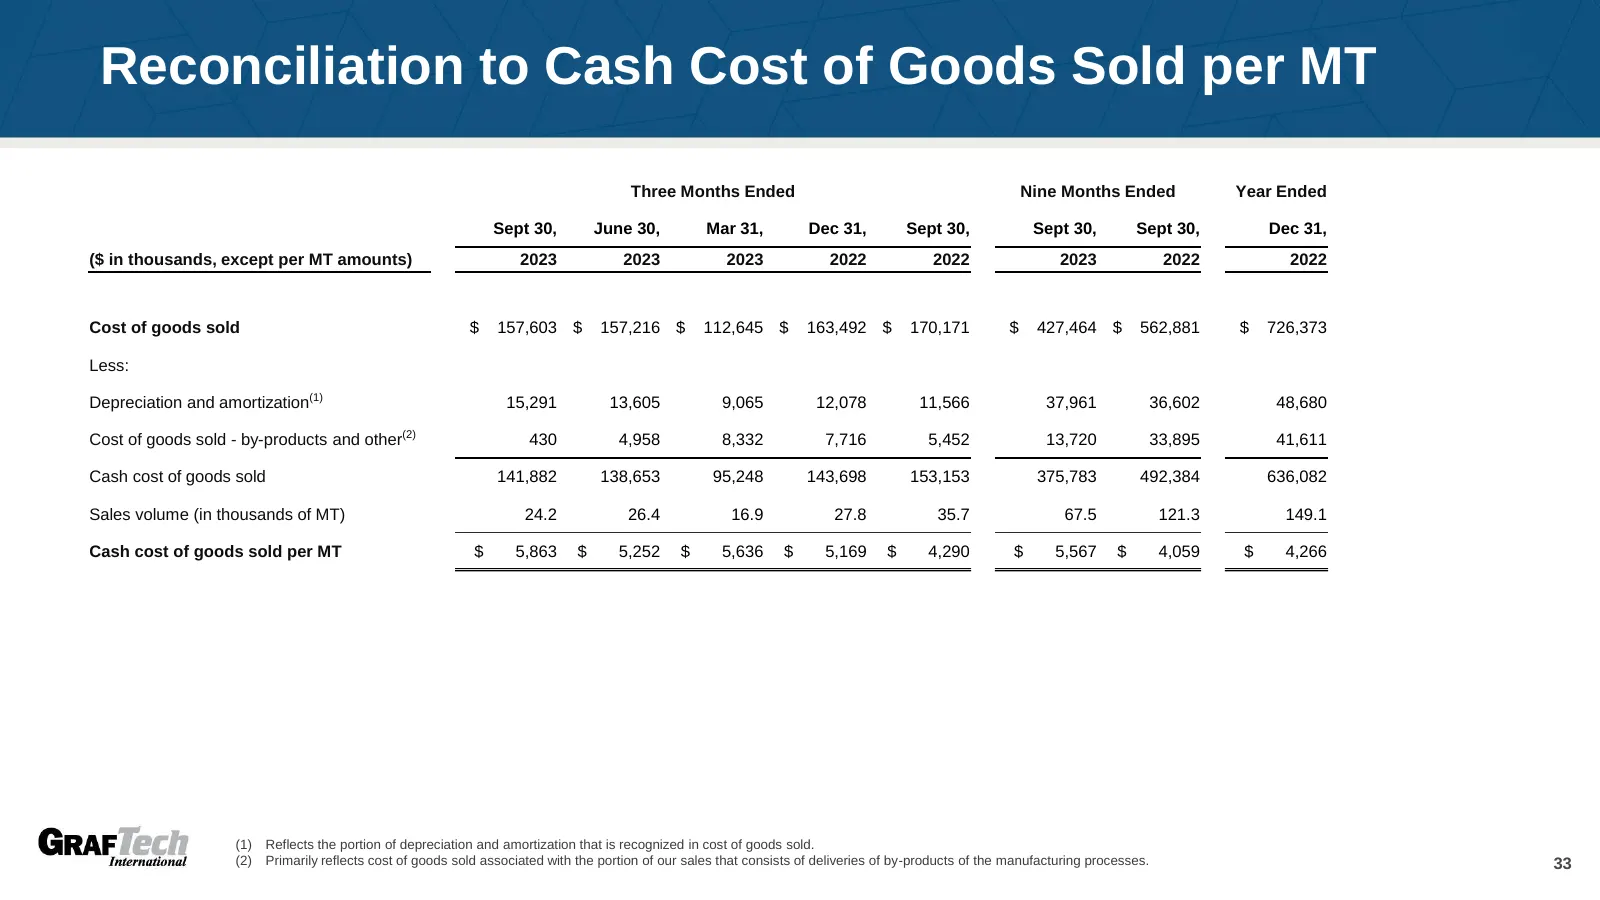
Slide 33: Reconciliation to Cash Cost of Goods Sold per MT
Reconciliation to Cash Cost of Goods Sold per MT Three Months Ended Nine Months Ended Year Ended Sept 30, June 30, Mar 31, Dec 31, Sept 30, Sept 30, Sept 30, Dec 31, ($ in thousands, except per MT amounts) 2023 2023 2023 2022 2022 2023 2022 2022 Cost of goods sold $ 157,603 $ 157,216 $ 112,645 $ 163

Slide 34: GrafTech International Ltd. Contact Information
GrafTech International Ltd. 982 Keynote Circle Brooklyn Heights, Ohio 44131 Ticker: EAF (NYSE) Website: www.graftech.com Contact: Michael Dillon Email: investor.relations@graftech.com Phone: 1.216.676.2000
Source: Internet Archive copy of s202.q4cdn.com
More decks from GrafTech International Ltd.
 Q3 2026 Earnings Presentation20 slides · Oct 23, 2026
 Q2 2026 Earnings Presentation20 slides · Jul 24, 2026
 Q1 2026 Earnings Presentation20 slides · May 1, 2026
 Q4 2025 Earnings Presentation23 slides · Feb 6, 2026
 Q3 2025 Earnings Presentation22 slides · Oct 24, 2025
 Q2 2025 Earnings Presentation20 slides · Jul 25, 2025