G Mining Ventures Corp · TSX:GMIN
G Mining Ventures — Q3 2026 Earnings Presentation
25 slides from G Mining Ventures's earnings presentation, Nov 13, 2026
Slide 1: Q3 2026 Earnings Conference Call
TSX: GMIN | OTCOQX: GMINF GMIN.GOLD Q3 2026 Earnings Conference Call Friday, November 13, 2026 All figures are in U.S. dollars unless otherwise noted. Build, Operate & Explore for More.
Slide 2: Cautionary Statements
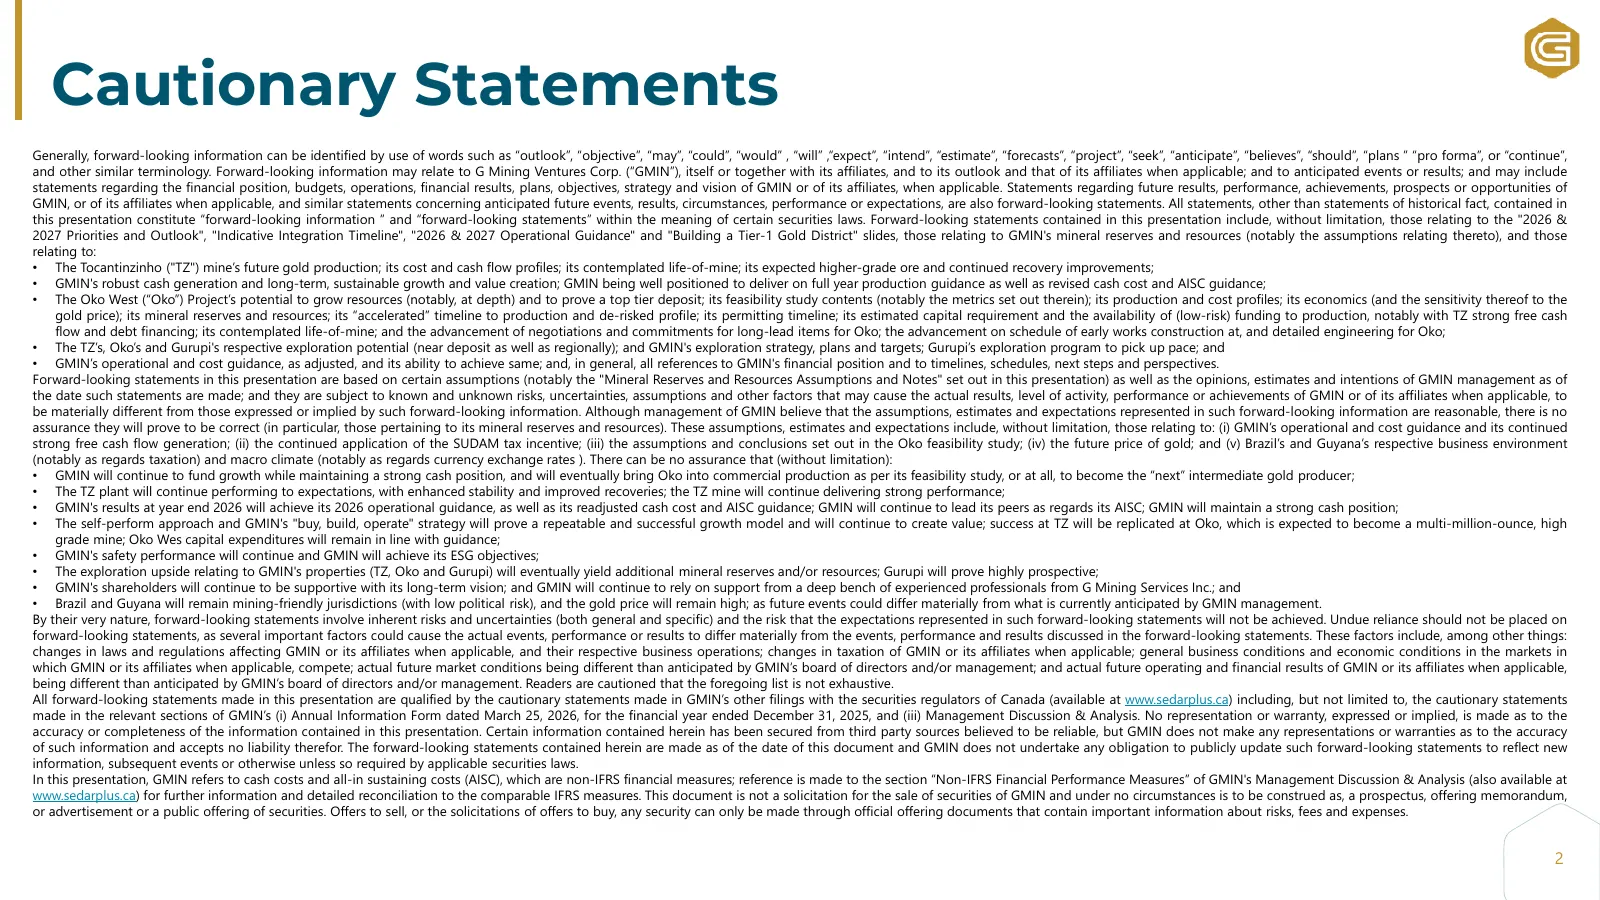
Cautionary Statements Generally, forward-looking information can be identified by use of words such as “outlook”, “objective”, “may”, “could”, “would” , “will” ,“expect”, “intend”, “estimate”, “forecasts”, “project”, “seek”, “anticipate”, “believes”, “should”, “plans ” “pro forma”, or “continue”, an
Slide 3: Agenda & Speakers
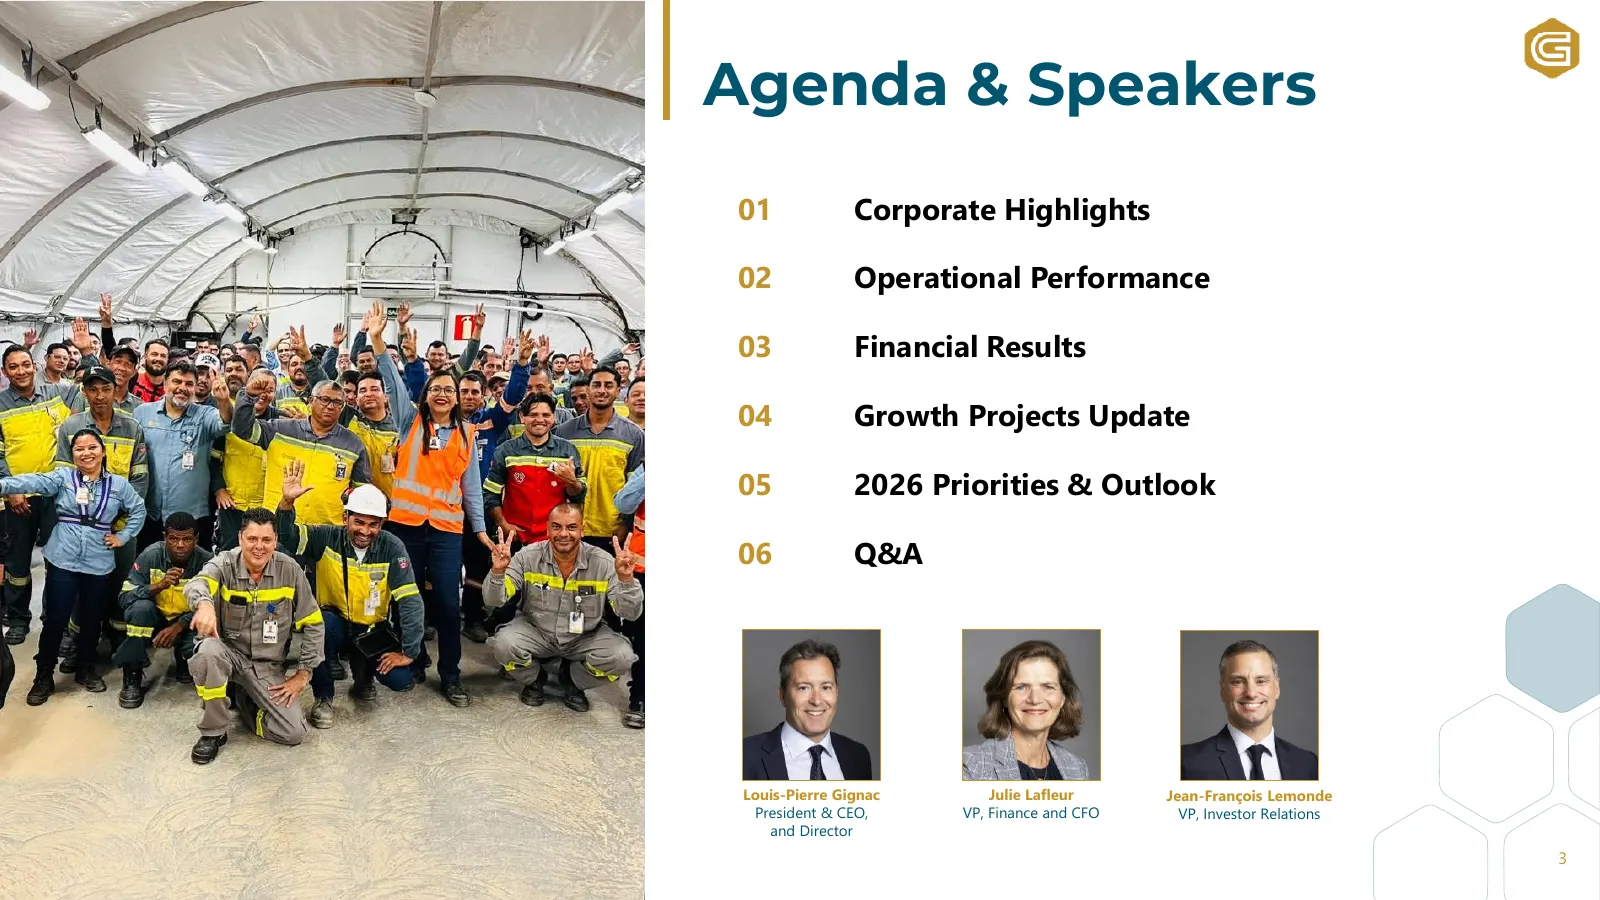
Agenda & Speakers 01 Corporate Highlights 02 Operational Performance 03 Financial Results 04 Growth Projects Update 05 2026 Priorities & Outlook 06 Q&A Louis-Pierre Gignac Julie Lafleur Jean-François Lemonde President & CEO, VP, Finance and CFO VP, Investor Relations and Director 3
Slide 4: Q3 2026 Operating and Financial Highlights
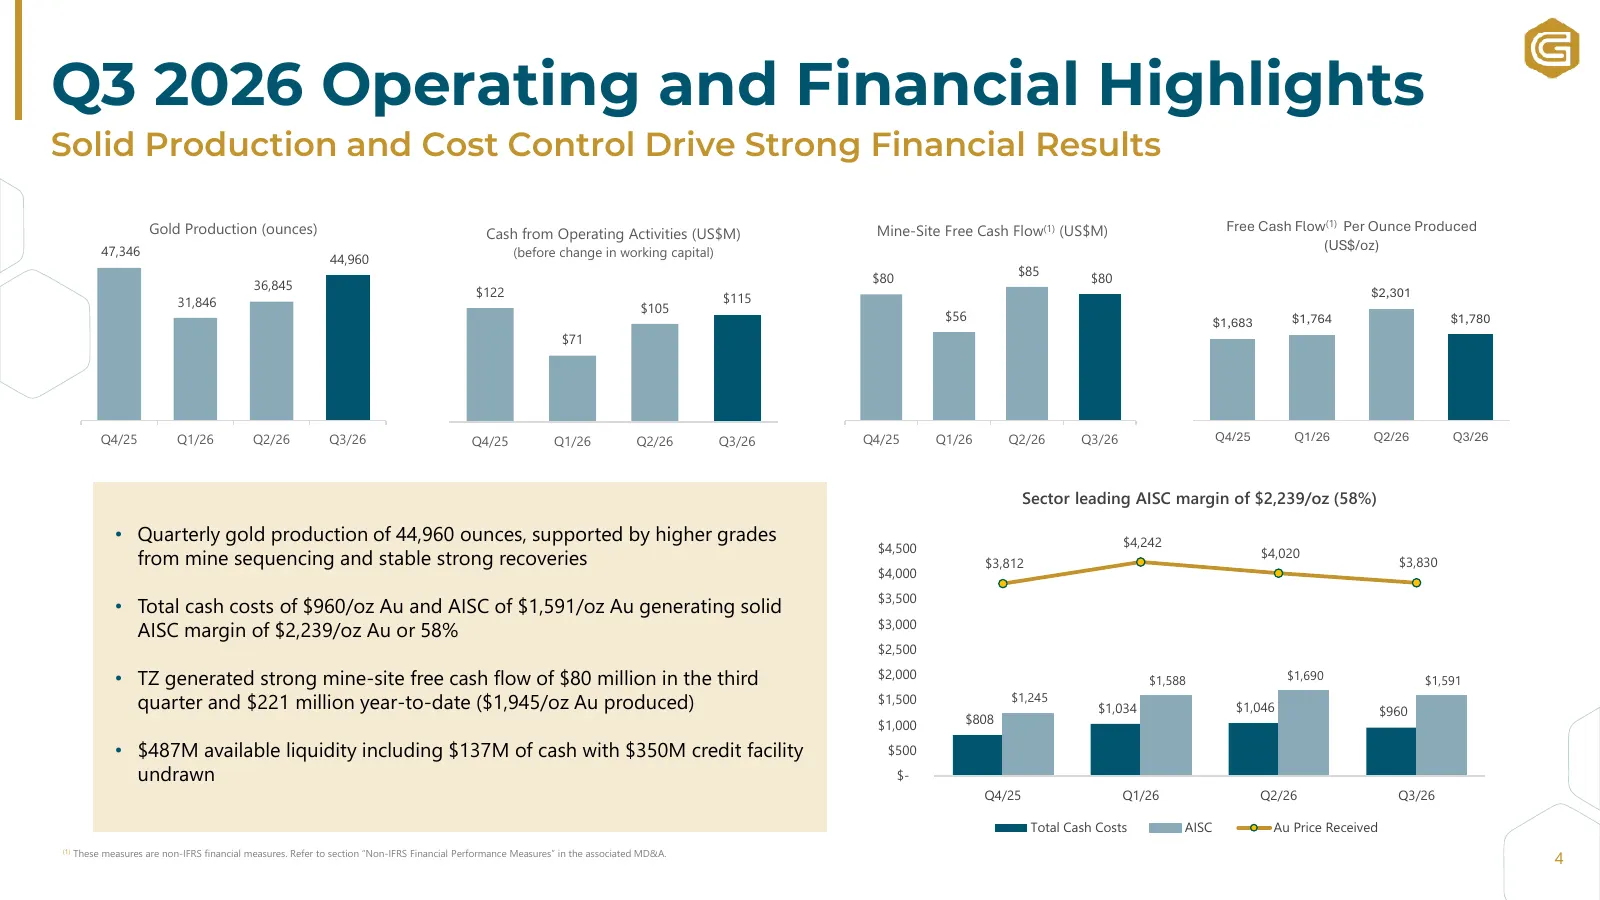
Q3 2026 Operating and Financial Highlights Solid Production and Cost Control Drive Strong Financial Results Gold Production (ounces) Mine-Site Free Cash Flow(1) (US$M) Free Cash Flow(1) Per Ounce Produced Cash from Operating Activities (US$M) 47,346 (US$/oz) (before change in working capital) 44,960
Slide 5: Operational Highlights
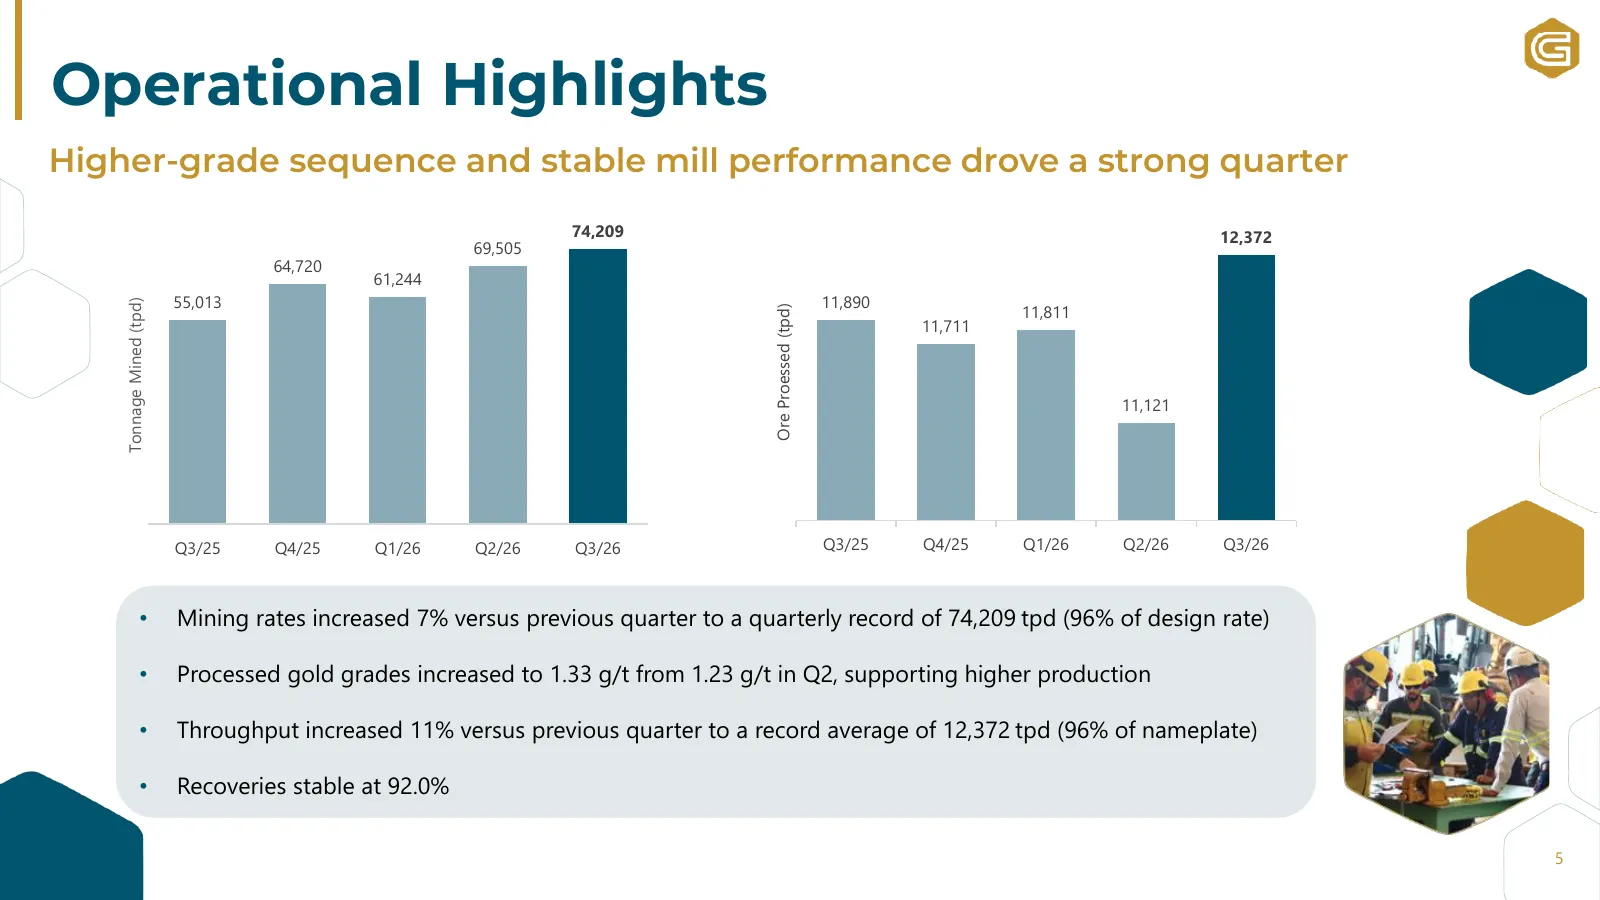
Operational Highlights Higher-grade sequence and stable mill performance drove a strong quarter 74,209 12,372 69,505 64,720 61,244 55,013 11,890 Tonnage Mined (tpd) 11,811 Ore Proessed (tpd) 11,711 11,121 Q3/25 Q4/25 Q1/26 Q2/26 Q3/26 Q3/25 Q4/25 Q1/26 Q2/26 Q3/26 • Mining rates increased 7% versus
Slide 6: Financial Highlights
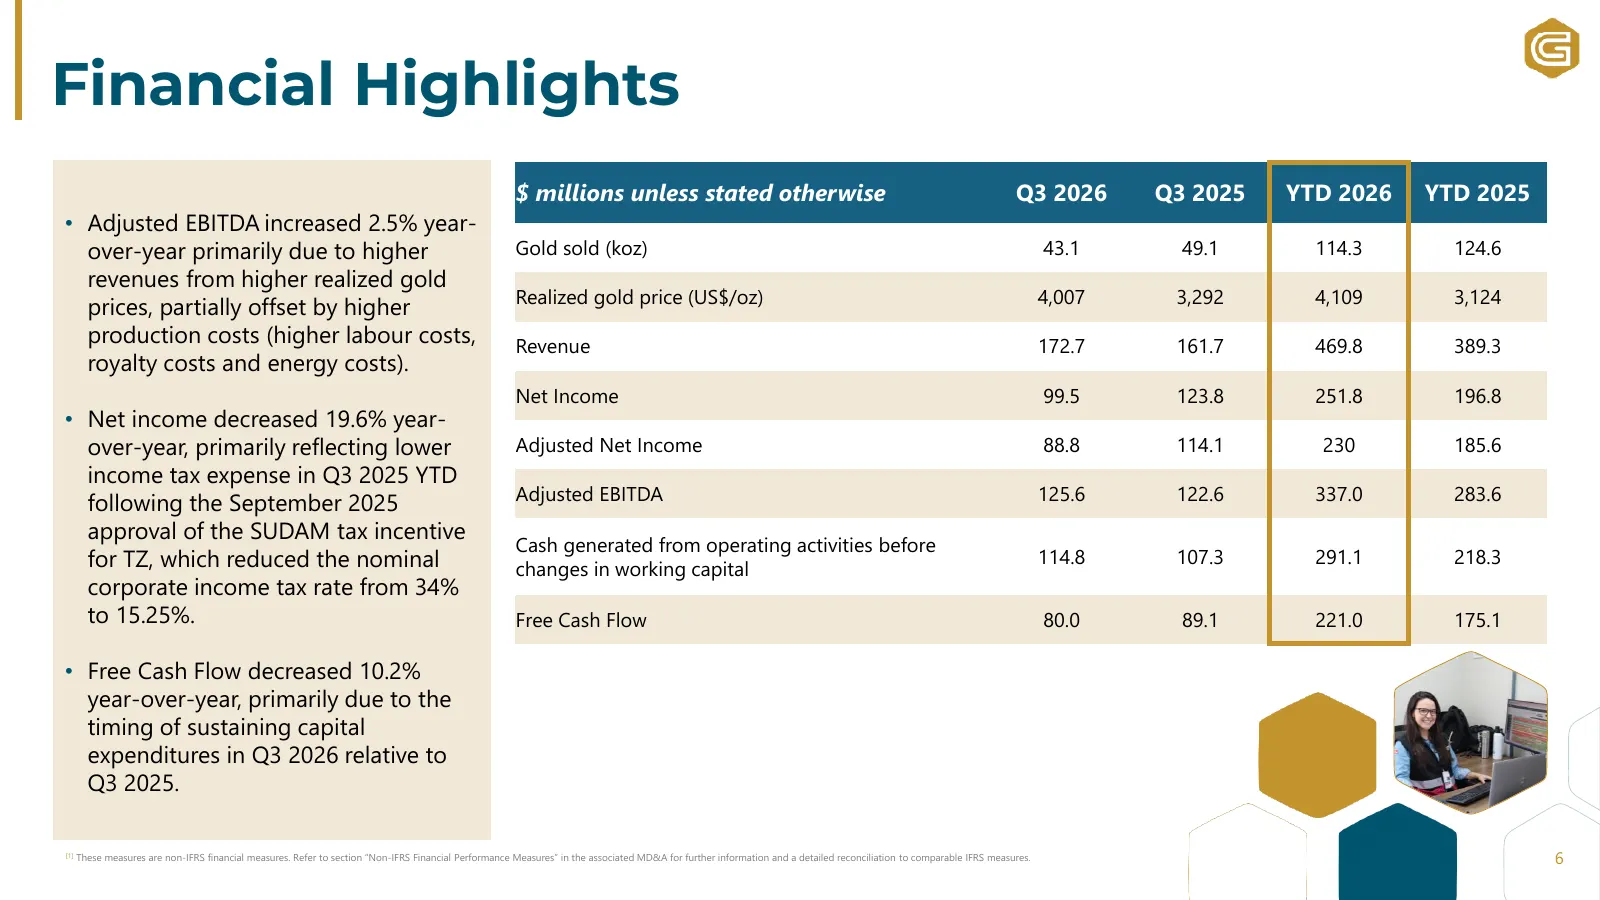
Financial Highlights $ millions unless stated otherwise Q3 2026 Q3 2025 YTD 2026 YTD 2025 • Adjusted EBITDA increased 2.5% year- over-year primarily due to higher Gold sold (koz) 43.1 49.1 114.3 124.6 revenues from higher realized gold Realized gold price (US$/oz) 4,007 3,292 4,109 3,124 prices, par
Slide 7: Capital Expenditures In Line with Guidance
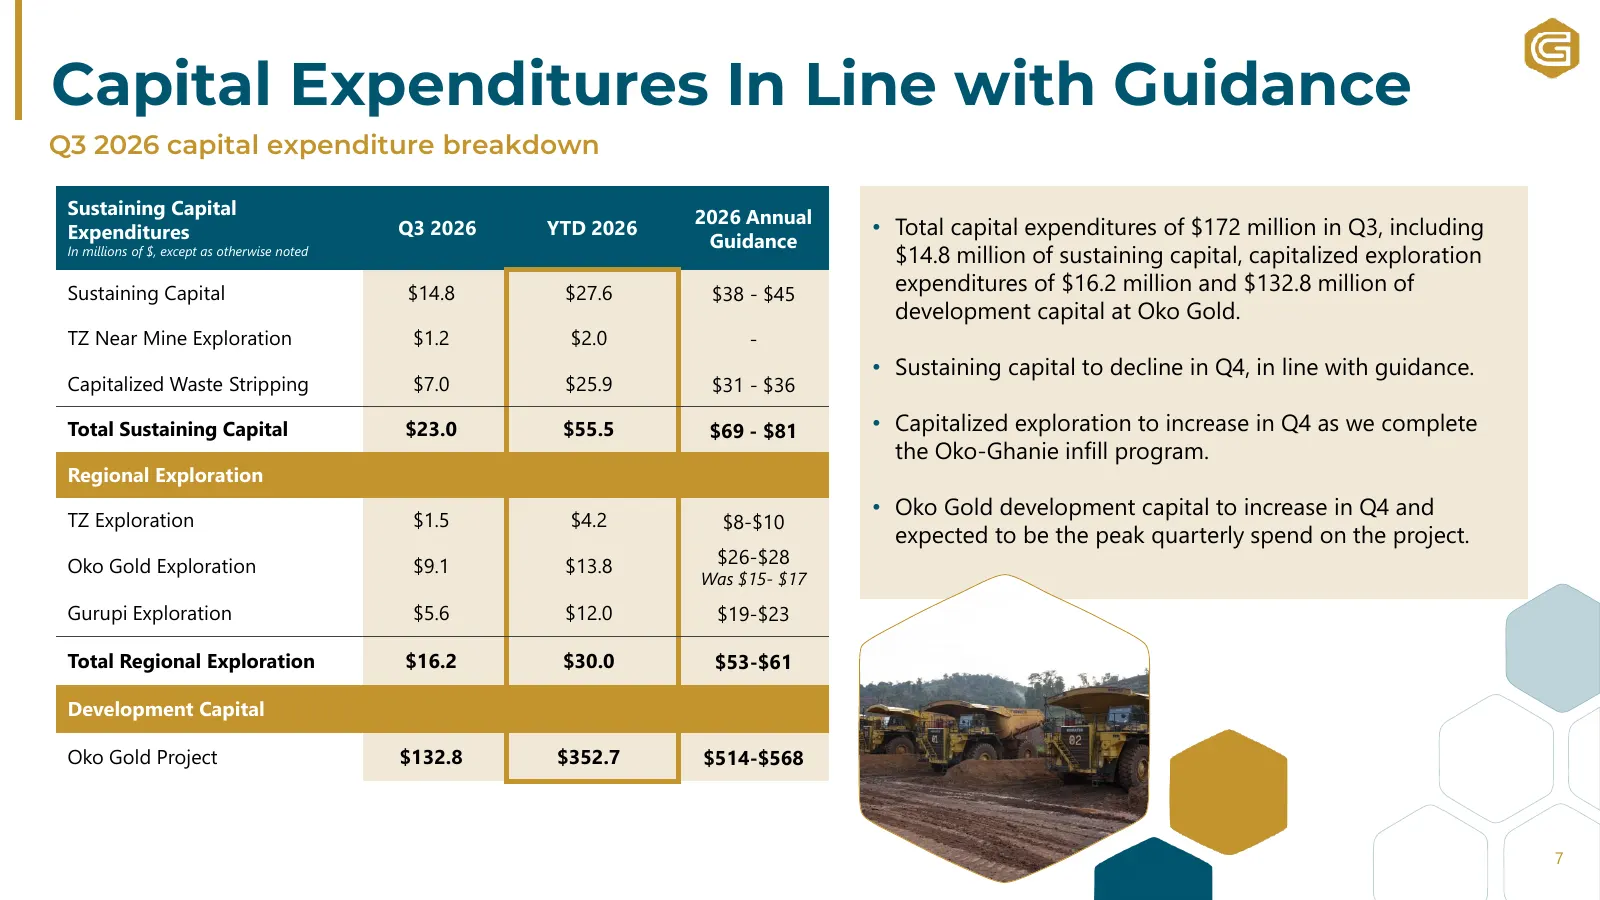
Capital Expenditures In Line with Guidance Q3 2026 capital expenditure breakdown Sustaining Capital 2026 Annual Expenditures Q3 2026 YTD 2026 • Total capital expenditures of $172 million in Q3, including Guidance In millions of $, except as otherwise noted $14.8 million of sustaining capital, capita
Slide 8: 2026 & 2027 Guidance
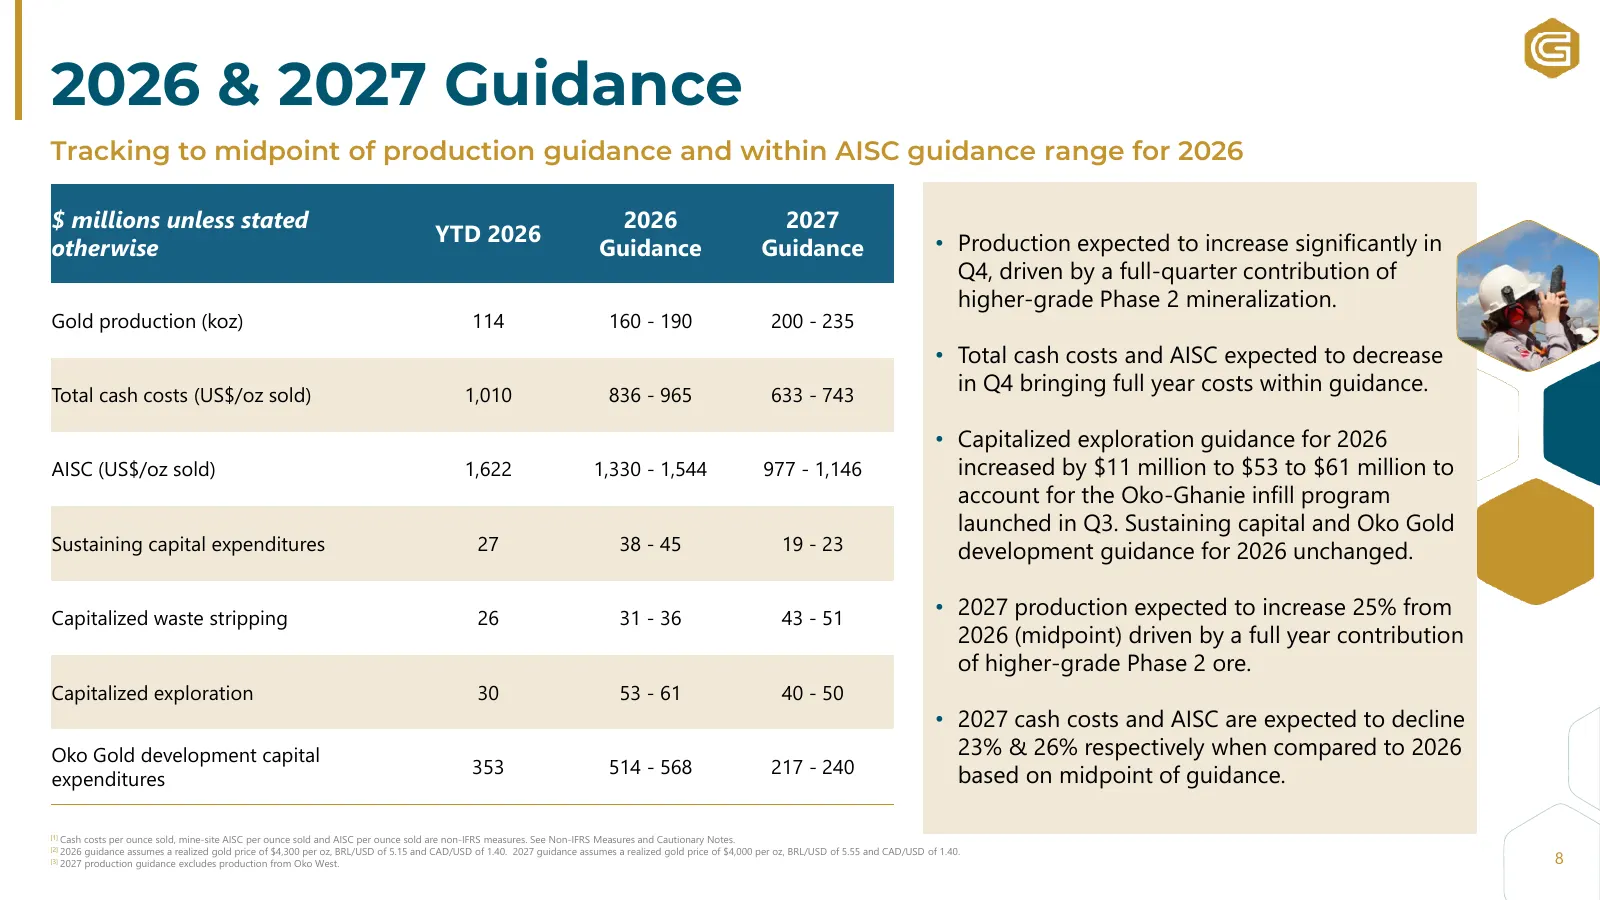
2026 & 2027 Guidance Tracking to midpoint of production guidance and within AISC guidance range for 2026 $ millions unless stated 2026 2027 YTD 2026 • Production expected to increase significantly in otherwise Guidance Guidance Q4, driven by a full-quarter contribution of higher-grade Phase 2 minera
Slide 9: Growth Projects Update
Growth Projects Update
Slide 10: Oko Gold Construction Rapidly Advancing Toward First Gold Pour
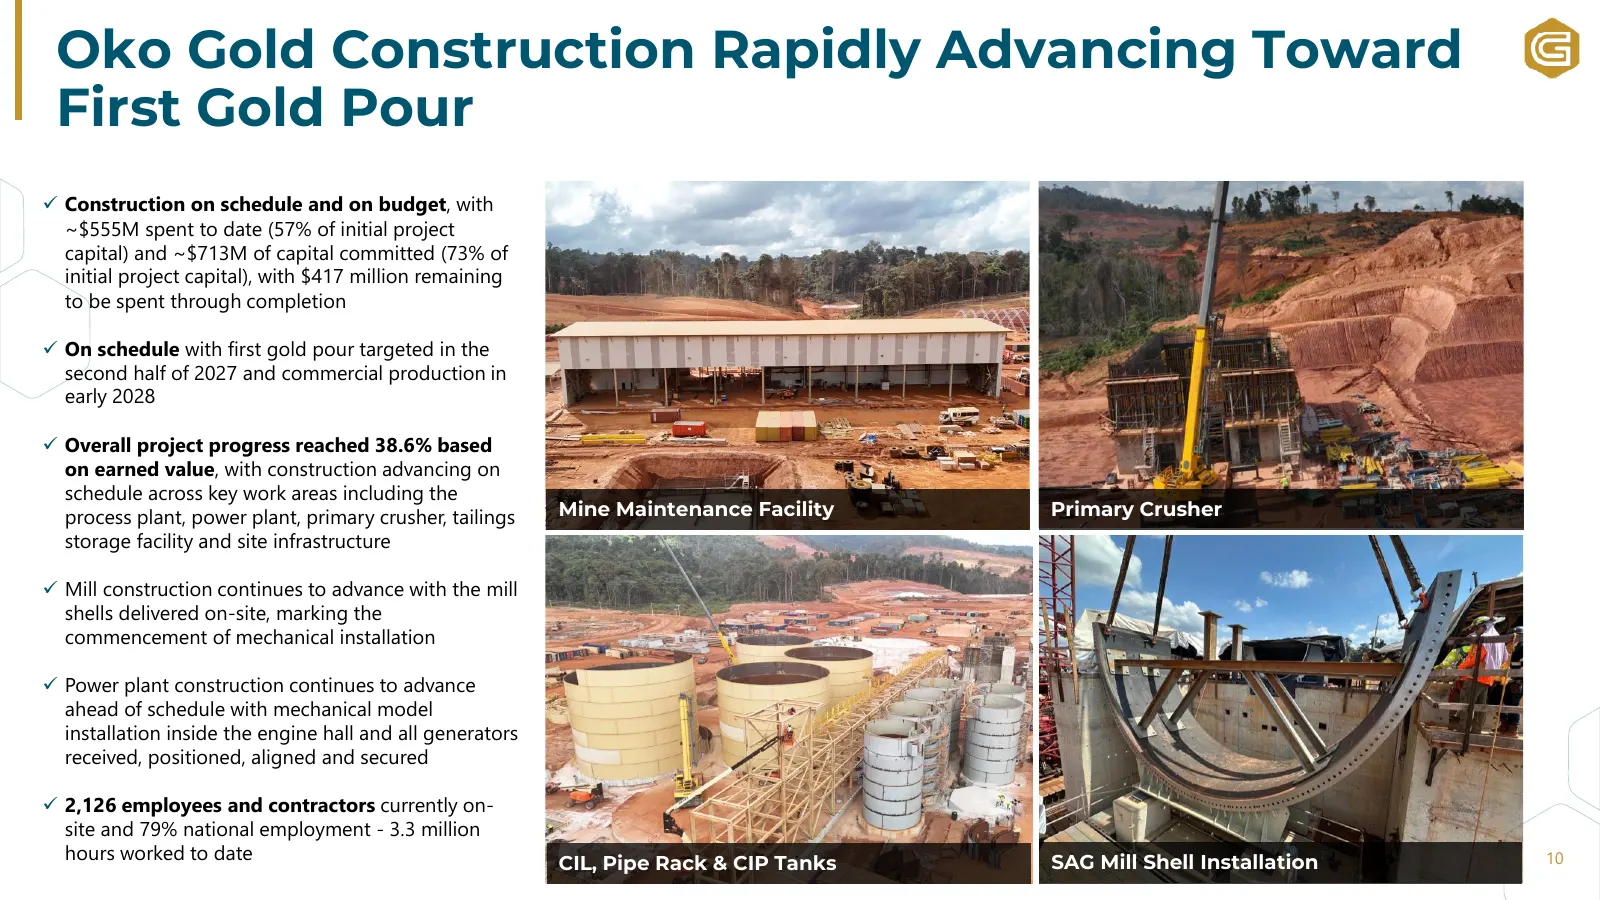
Oko Gold Construction Rapidly Advancing Toward First Gold Pour ✓ Construction on schedule and on budget, with ~$555M spent to date (57% of initial project capital) and ~$713M of capital committed (73% of initial project capital), with $417 million remaining to be spent through completion ✓ On schedu
Slide 11: Indicative Integration Timeline
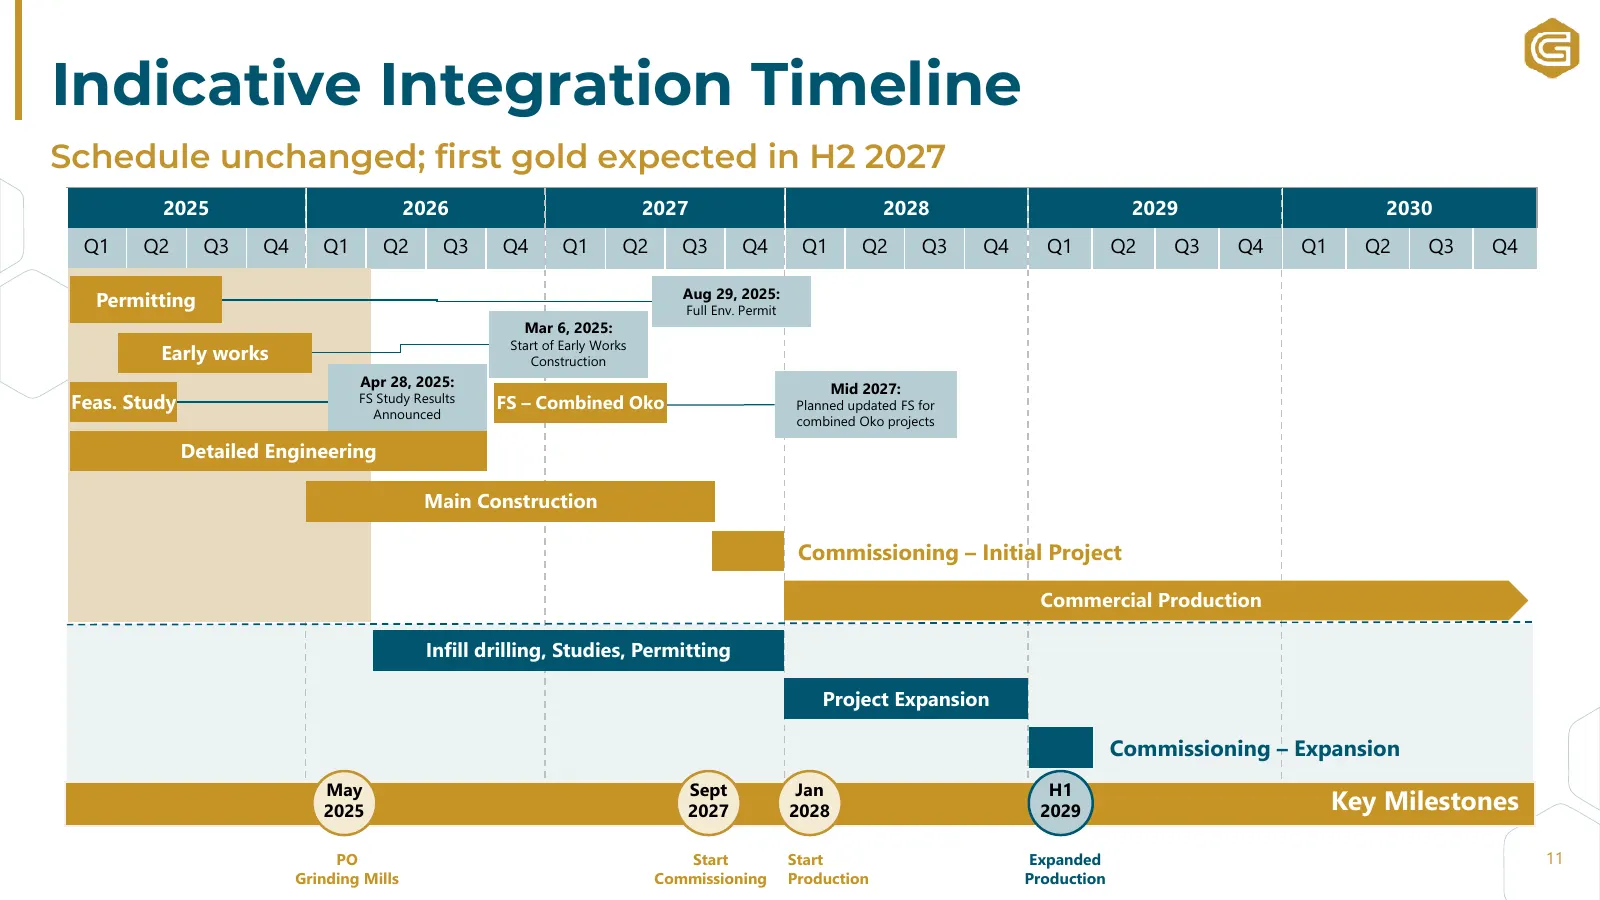
Indicative Integration Timeline Schedule unchanged; first gold expected in H2 2027 2025 2026 2027 2028 2029 2030 Q1 Q2 Q3 Q4 Q1 Q2 Q3 Q4 Q1 Q2 Q3 Q4 Q1 Q2 Q3 Q4 Q1 Q2 Q3 Q4 Q1 Q2 Q3 Q4 Aug 29, 2025: Permitting Full Env. Permit Mar 6, 2025: Start of Early Works Early works Construction Apr 28, 2025:
Slide 12: A True Tier-1 Gold Development Project
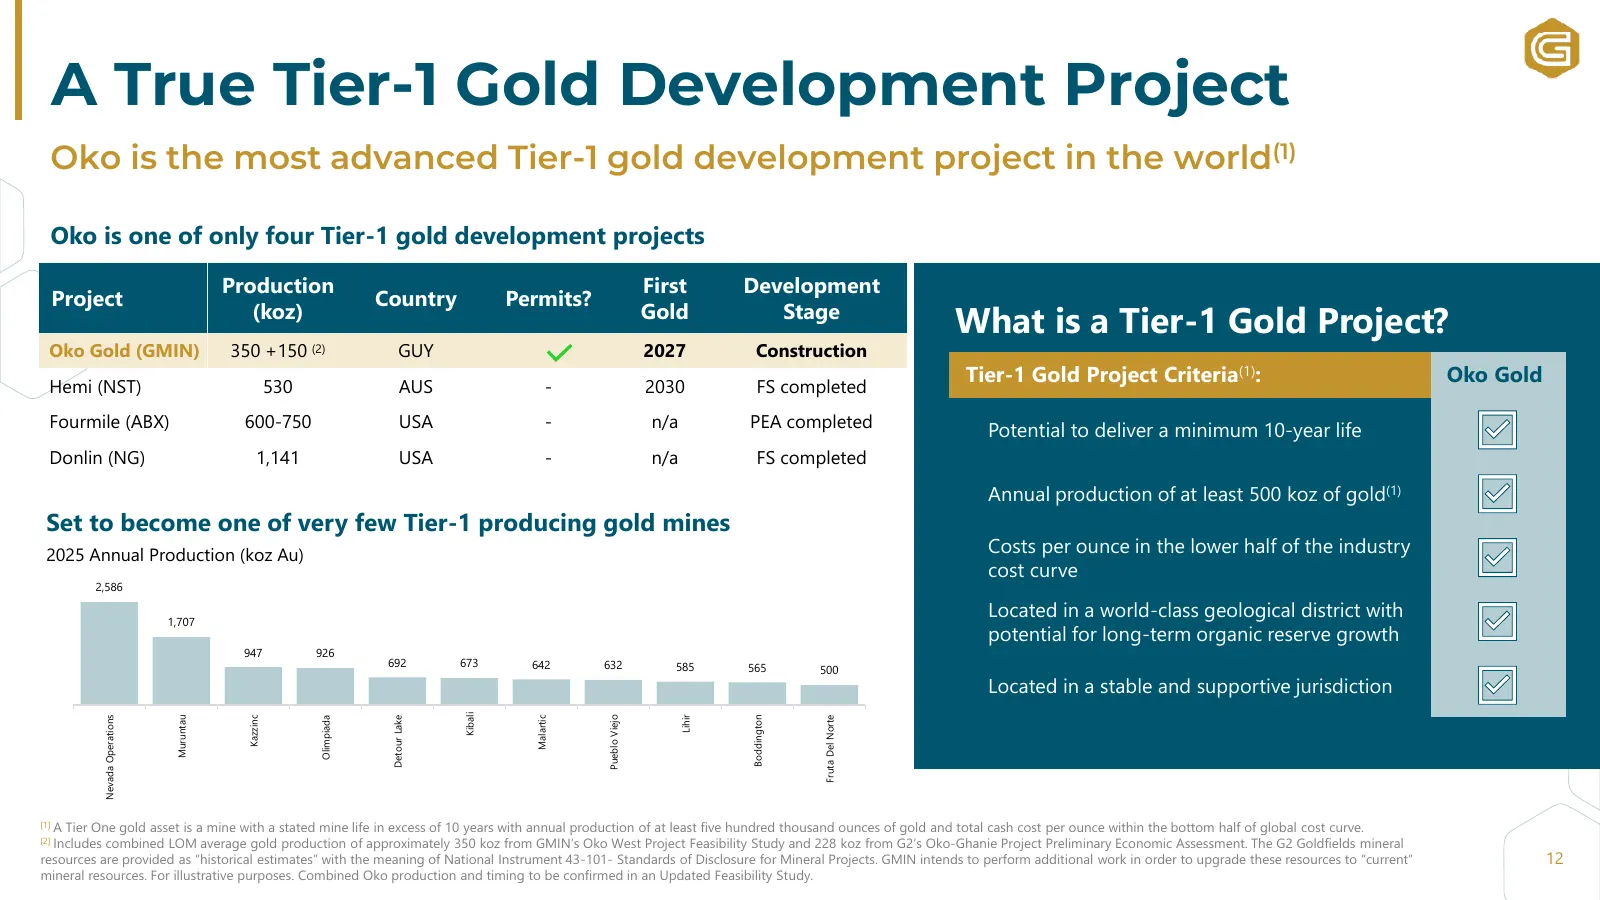
A True Tier-1 Gold Development Project Oko is the most advanced Tier-1 gold development project in the world(1) Oko is one of only four Tier-1 gold development projects Production First Development Project Country Permits? (koz) Gold Stage What is a Tier-1 Gold Project? Oko Gold (GMIN) 350 +150 (2)
Slide 13: Sources & Uses of Capital for First Gold Pour at Oko Gold
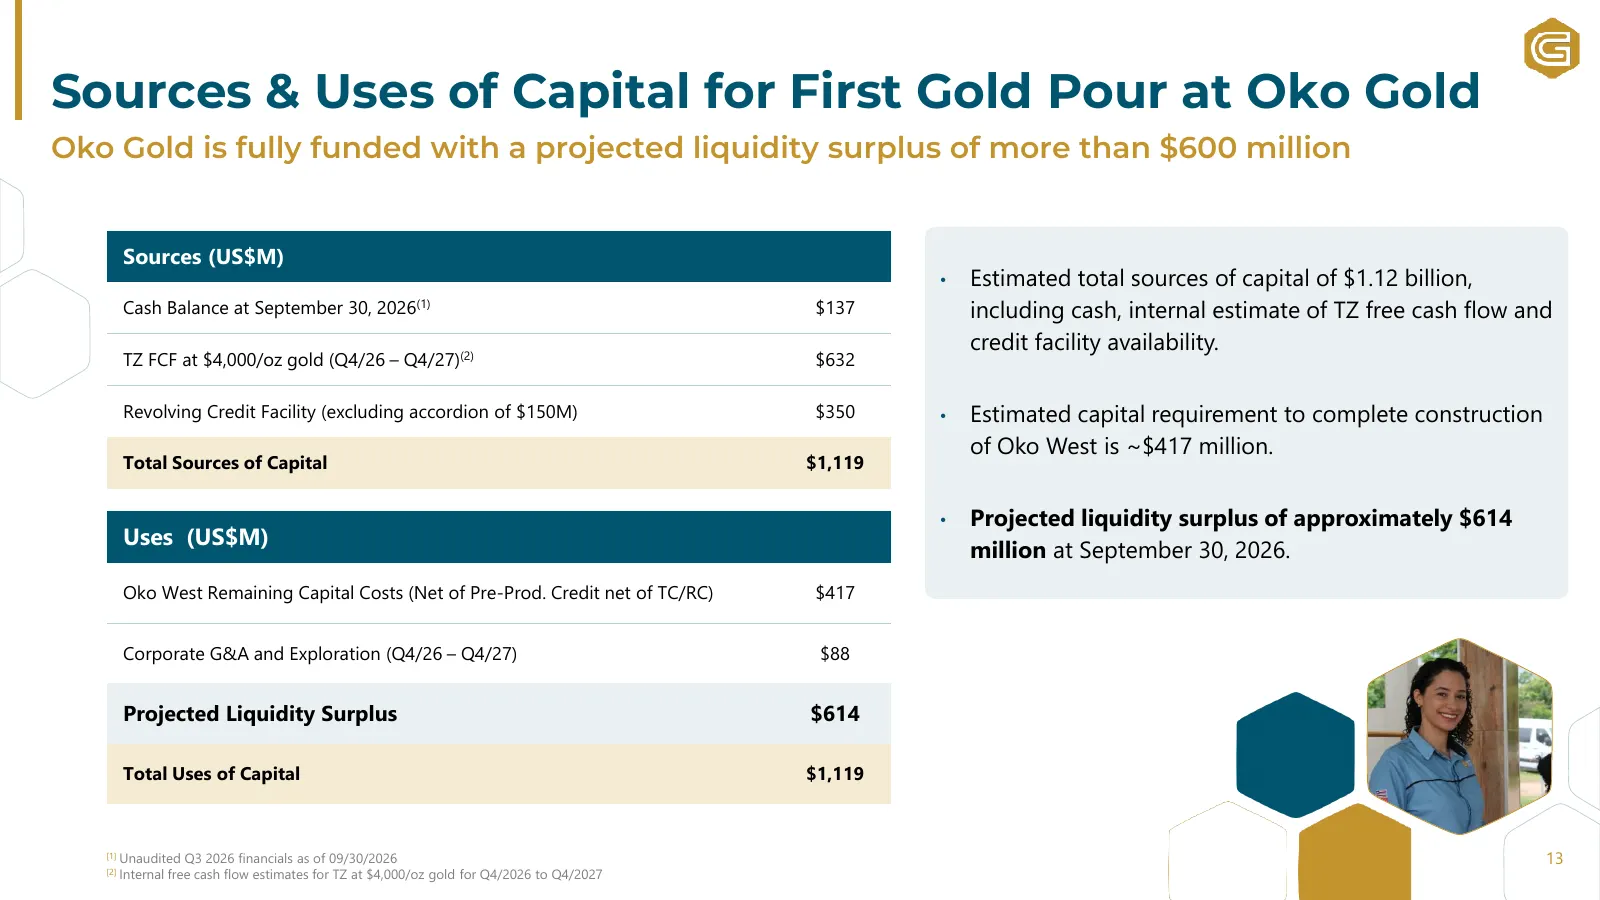
Sources & Uses of Capital for First Gold Pour at Oko Gold Oko Gold is fully funded with a projected liquidity surplus of more than $600 million Sources (US$M) • Estimated total sources of capital of $1.12 billion, Cash Balance at September 30, 2026(1) $137 including cash, internal estimate of TZ fre
Slide 14: 2026 & 2027 Priorities & Outlook
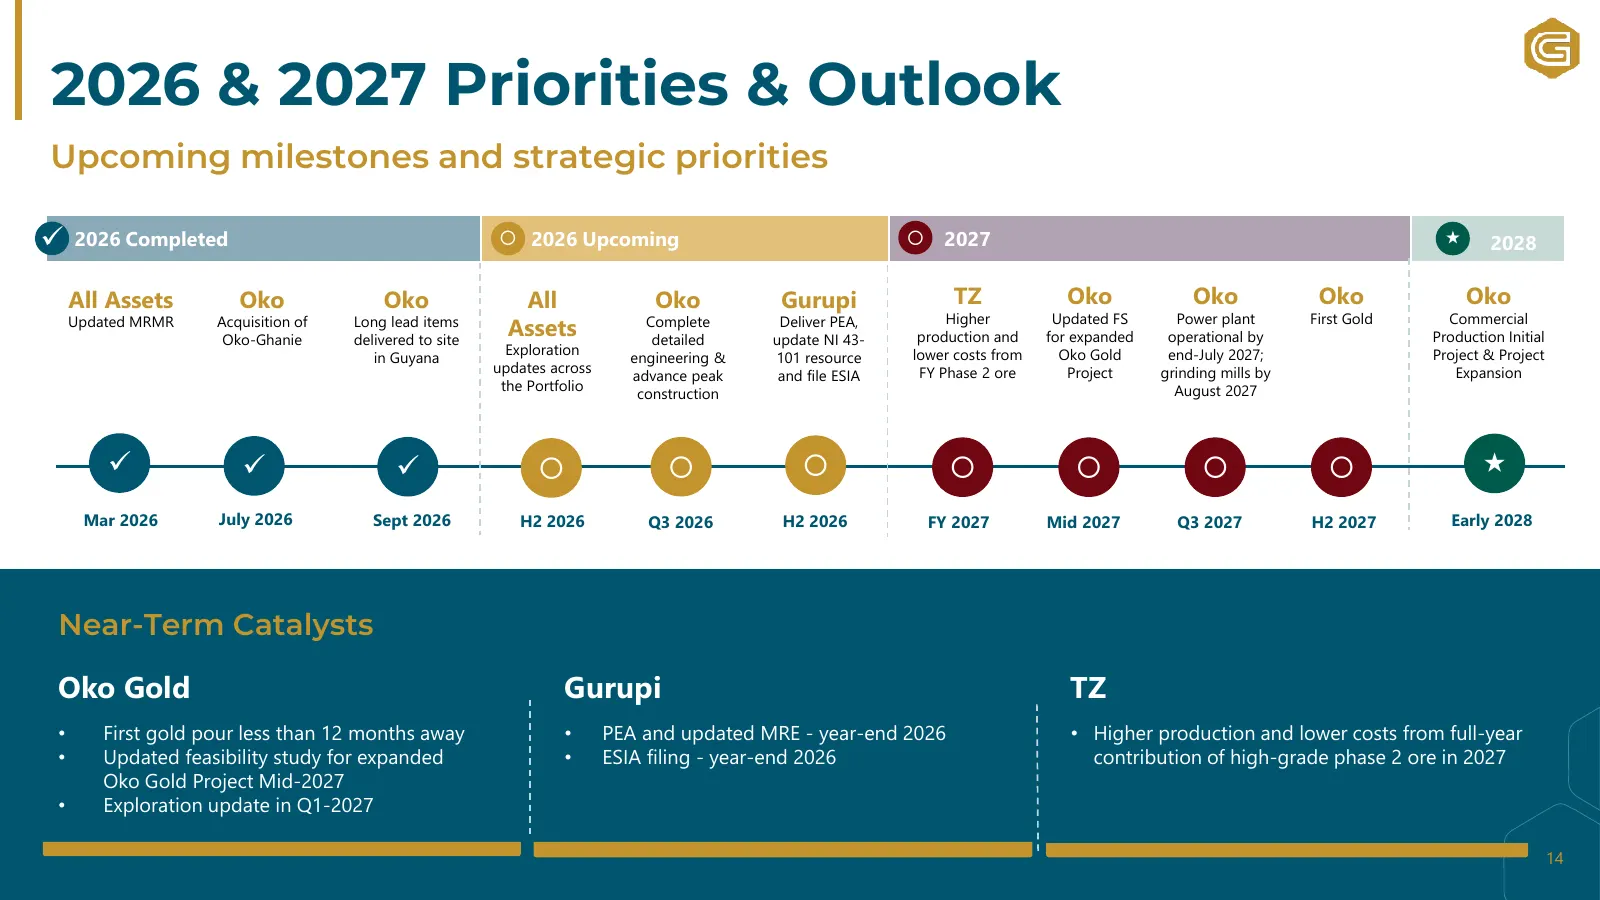
2026 & 2027 Priorities & Outlook Upcoming milestones and strategic priorities ✓ 2026 Completed 2026 Upcoming 2027 2028 2028 All Assets Oko Oko All Oko Gurupi TZ Oko Oko Oko Oko Higher Updated FS Power plant First Gold Commercial Updated MRMR Acquisition of Oko-Ghanie Long lead items delivered
Slide 15: Question Period: Oko Construction Progress
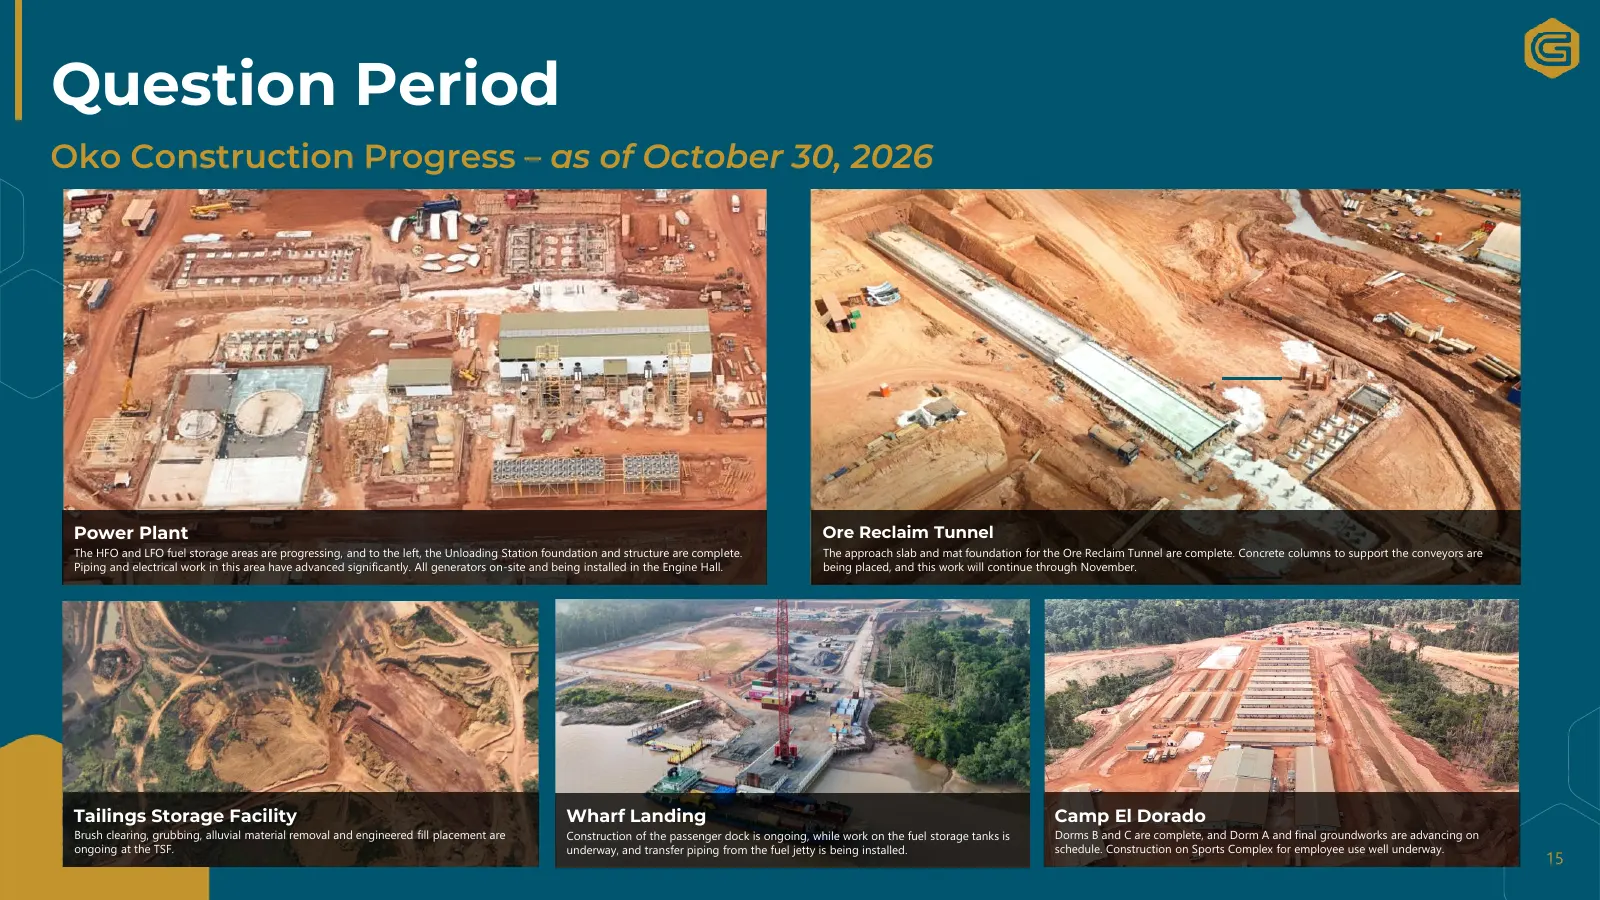
Question Period Oko Construction Progress – as of October 30, 2026 Power Plant Ore Reclaim Tunnel The HFO and LFO fuel storage areas are progressing, and to the left, the Unloading Station foundation and structure are complete. The approach slab and mat foundation for the Ore Reclaim Tunnel are comp
Slide 16: Investment Thesis
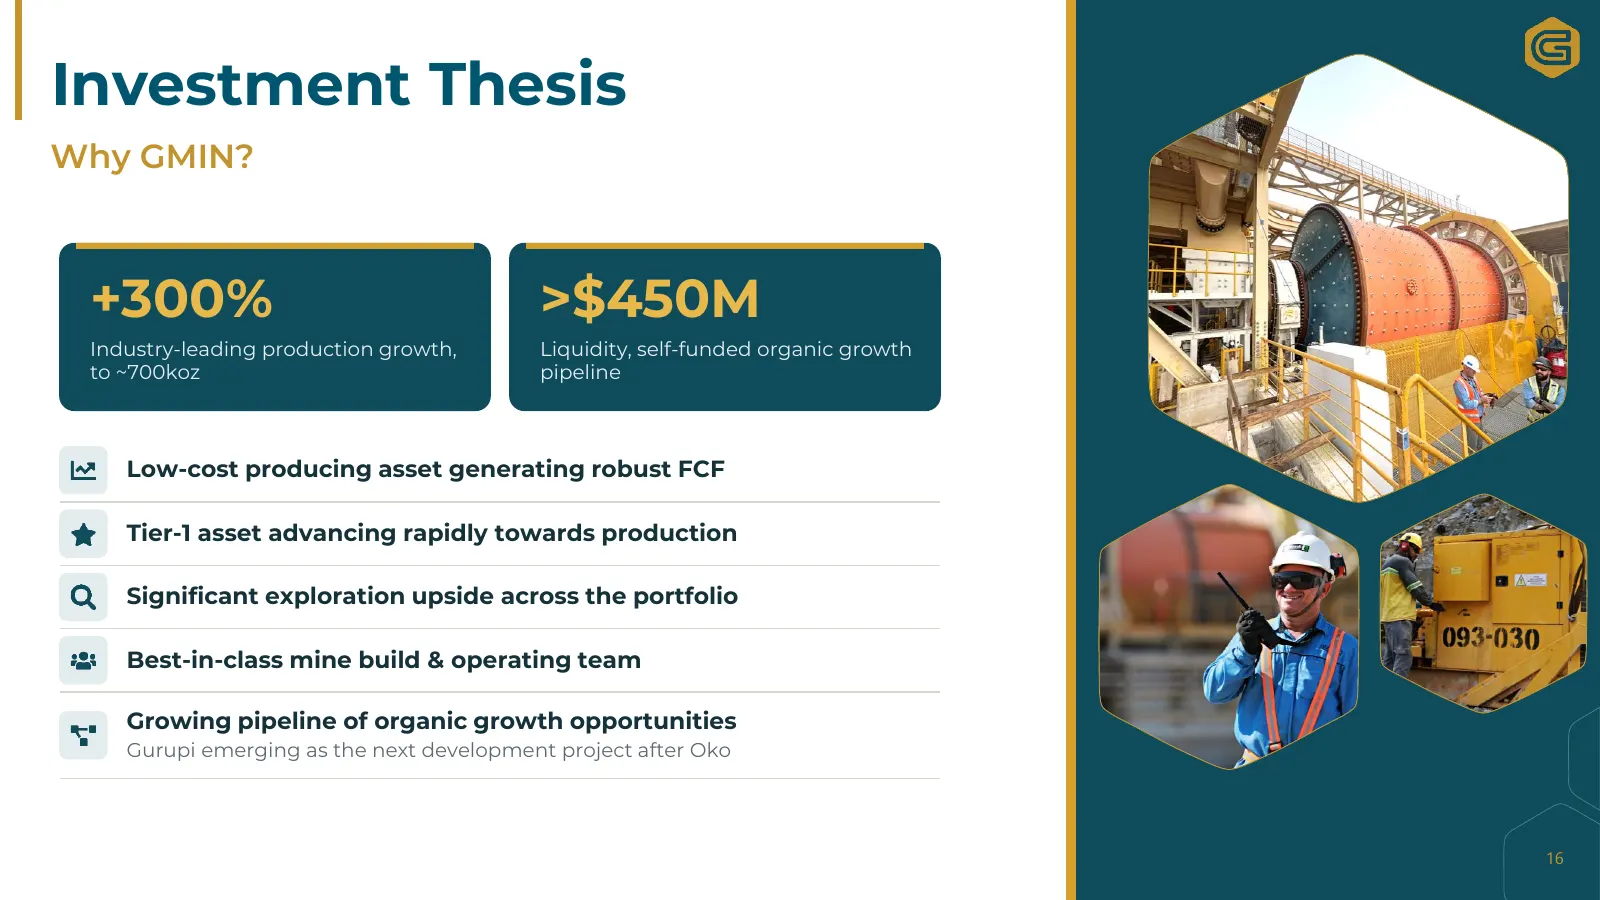
Investment Thesis Why GMIN? +300% >$450M Industry-leading production growth, Liquidity, self-funded organic growth to ~700koz pipeline Low-cost producing asset generating robust FCF Tier-1 asset advancing rapidly towards production Significant exploration upside across the portfolio Best-in-class mi
Slide 17: Thank you for joining us today!
TSX: GMIN | OTCOQX: GMINF GMIN.GOLD Thank you for joining us today! INVESTOR RELATIONS Jean-François Lemonde Vice President, Investor Relations Phone: 514.299.4926 Email: jflemonde@gmin.gold
Slide 18: Appendix – Additional Information
Appendix – Additional Information 18
Slide 19: Building a Tier-1 Gold District
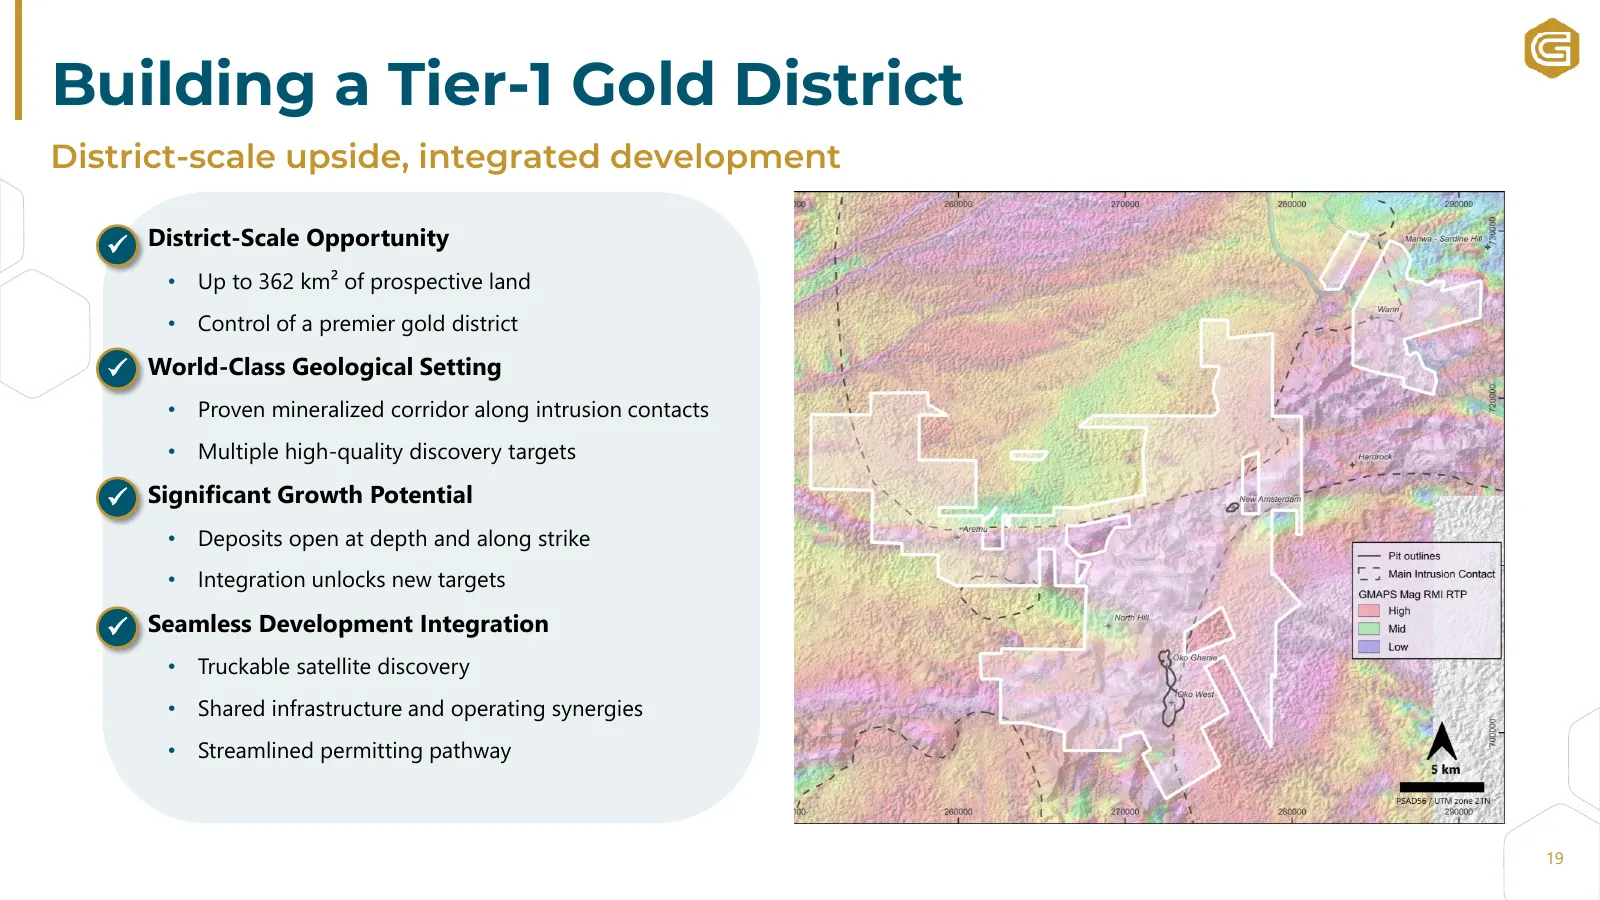
Building a Tier-1 Gold District District-scale upside, integrated development • District-Scale Opportunity ✓ • Up to 362 km² of prospective land • Control of a premier gold district • World-Class Geological Setting ✓ • Proven mineralized corridor along intrusion contacts • Multiple high-quality disc
Slide 20: Q3 2026 Operating Cost Breakdown
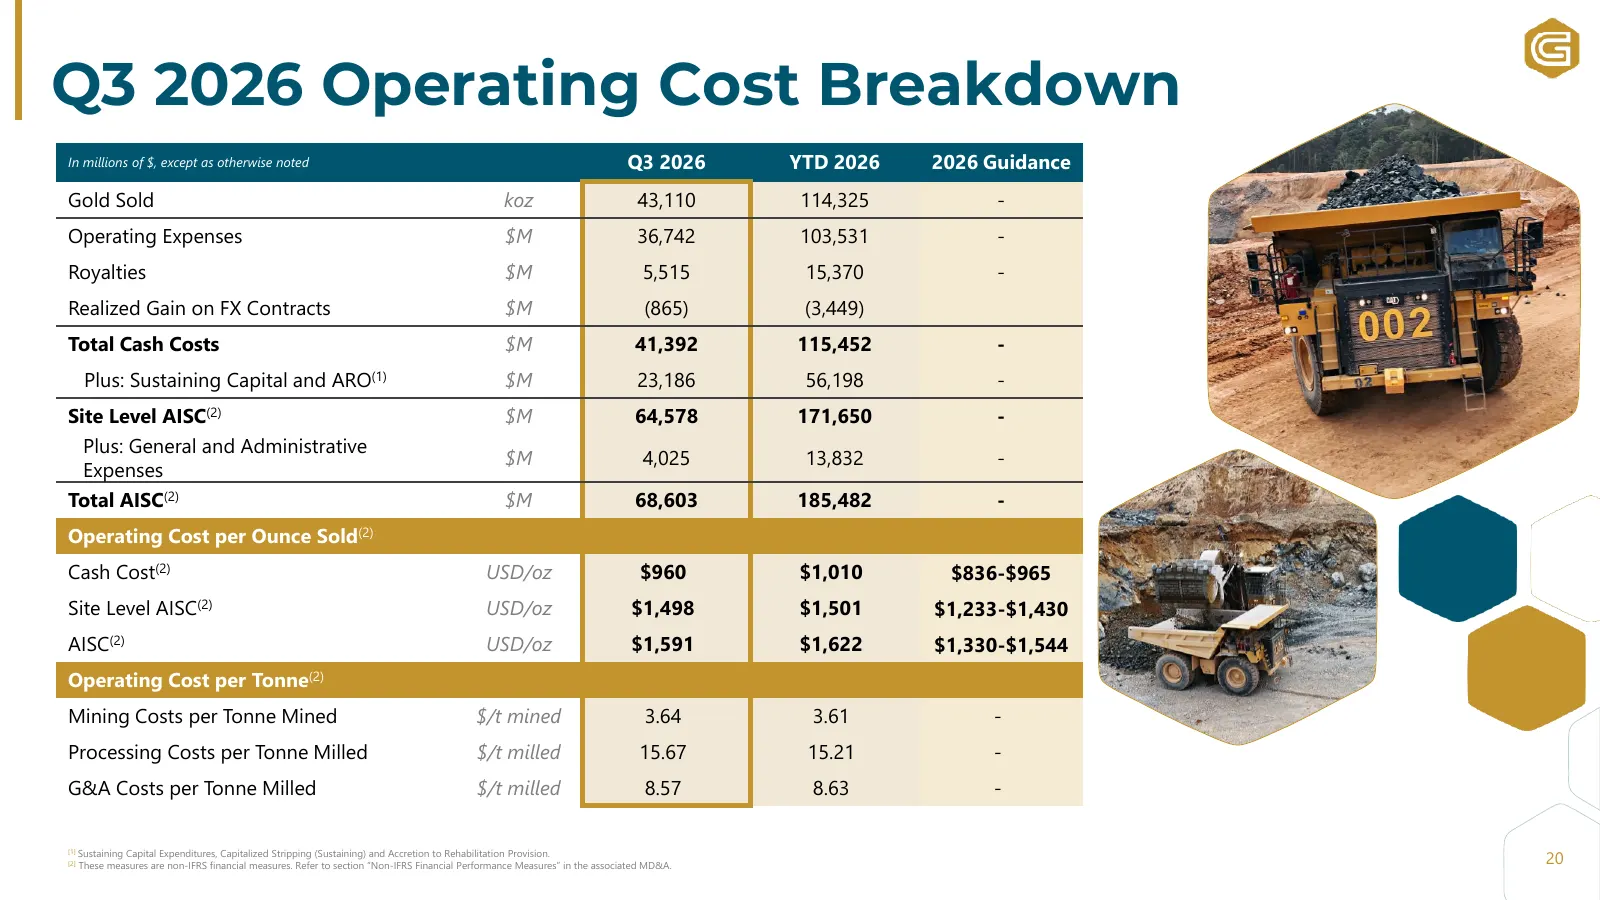
Q3 2026 Operating Cost Breakdown In millions of $, except as otherwise noted Q3 2026 YTD 2026 2026 Guidance Gold Sold koz 43,110 114,325 - Operating Expenses $M 36,742 103,531 - Royalties $M 5,515 15,370 - Realized Gain on FX Contracts $M (865) (3,449) Total Cash Costs $M 41,392 115,452 - Plus: Sust
Slide 21: Q3 AISC to Cost of Sales Reconciliation
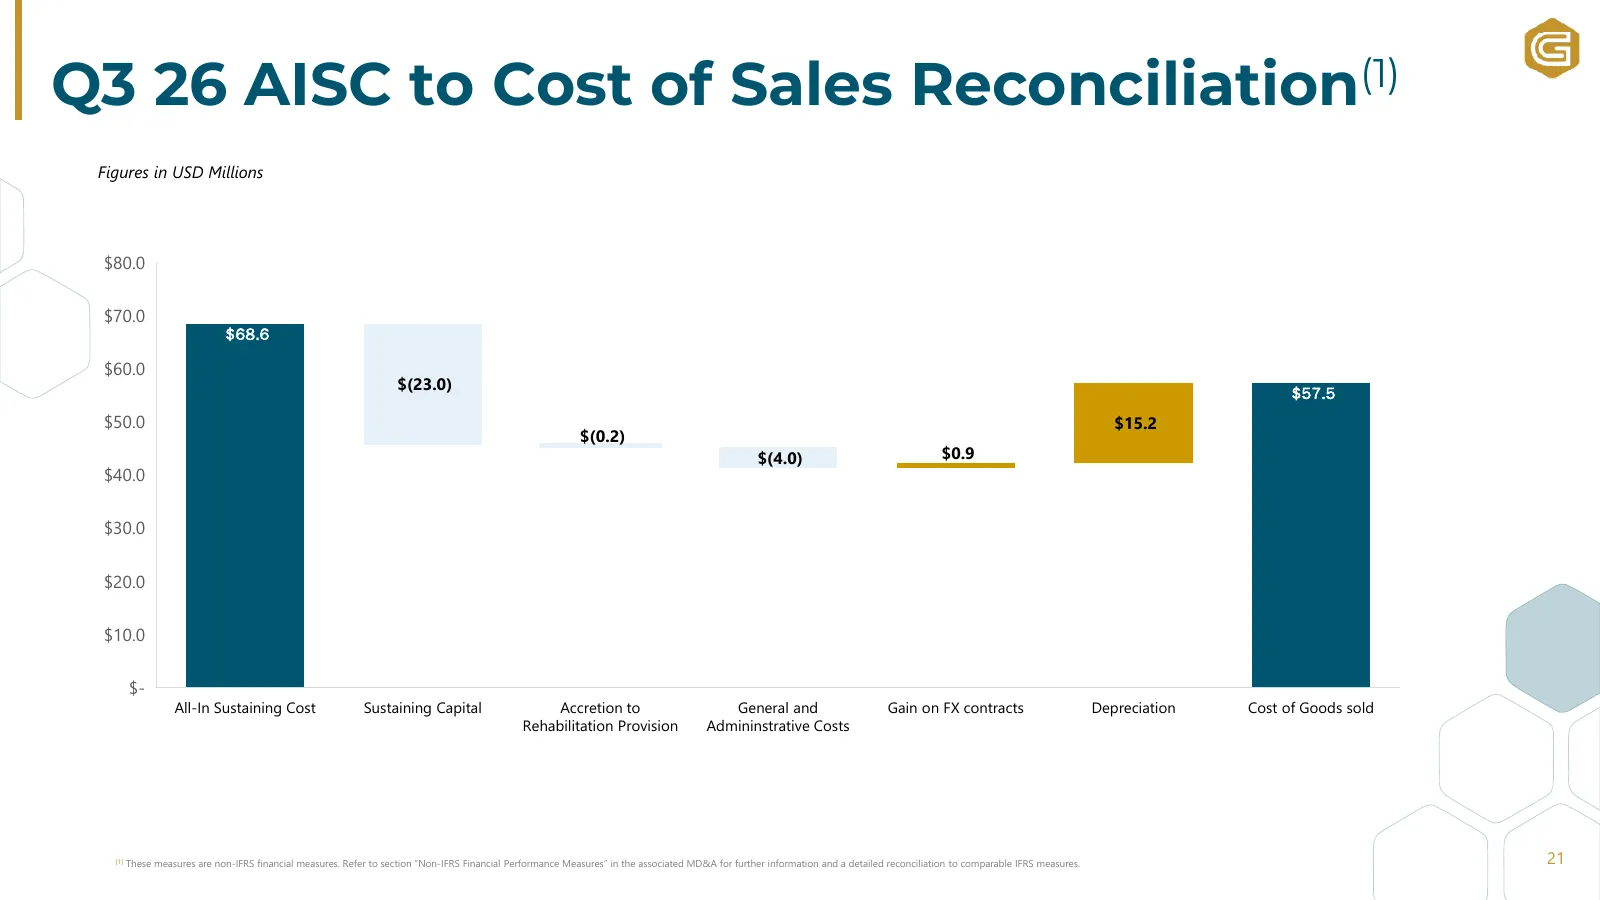
Q3 26 AISC to Cost of Sales Reconciliation(1) Figures in USD Millions $80.0 $70.0 $68.6 $60.0 $(23.0) $57.5 $50.0 $15.2 $(0.2) $(4.0) $0.9 $40.0 $30.0 $20.0 $10.0 $- All-In Sustaining Cost Sustaining Capital Accretion to General and Gain on FX contracts Depreciation Cost of Goods sold Rehabilitation
Slide 22: Maintaining a Strong Cash Position
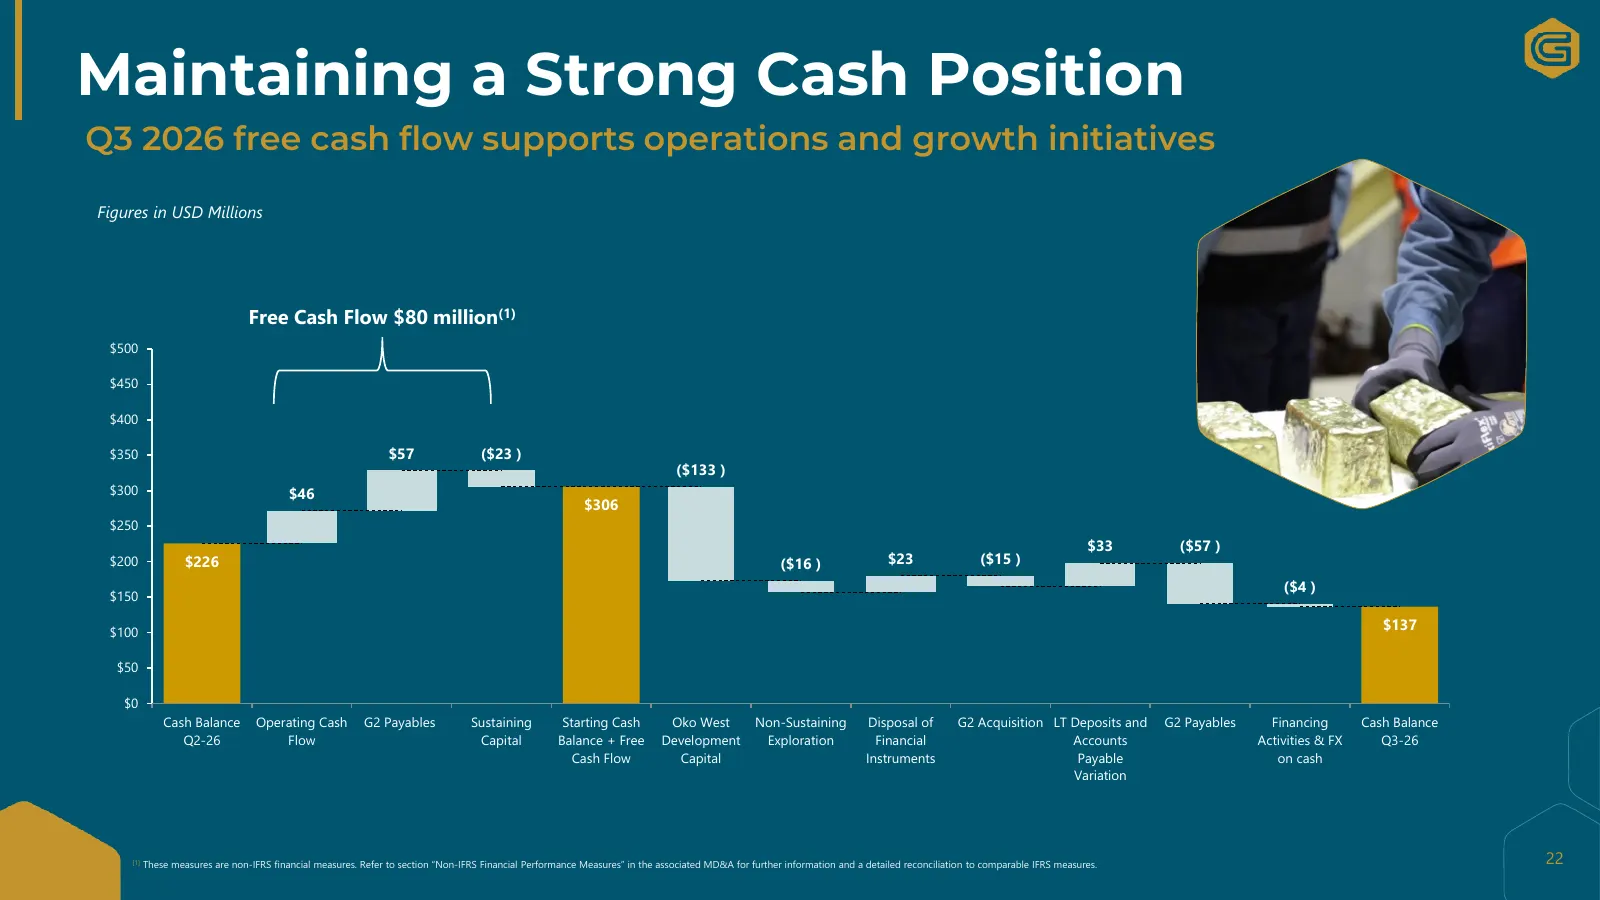
Maintaining a Strong Cash Position Q3 2026 free cash flow supports operations and growth initiatives Figures in USD Millions Free Cash Flow $80 million(1) $500 $450 $400 $350 $57 ($23 ) ($133 ) $300 $46 $306 $250 $33 ($57 ) $200 $226 ($16 ) $23 ($15 ) ($4 ) $150 $100 $137 $50 $0 Cash Balance Operati
Slide 23: Mineral Reserves and Resources
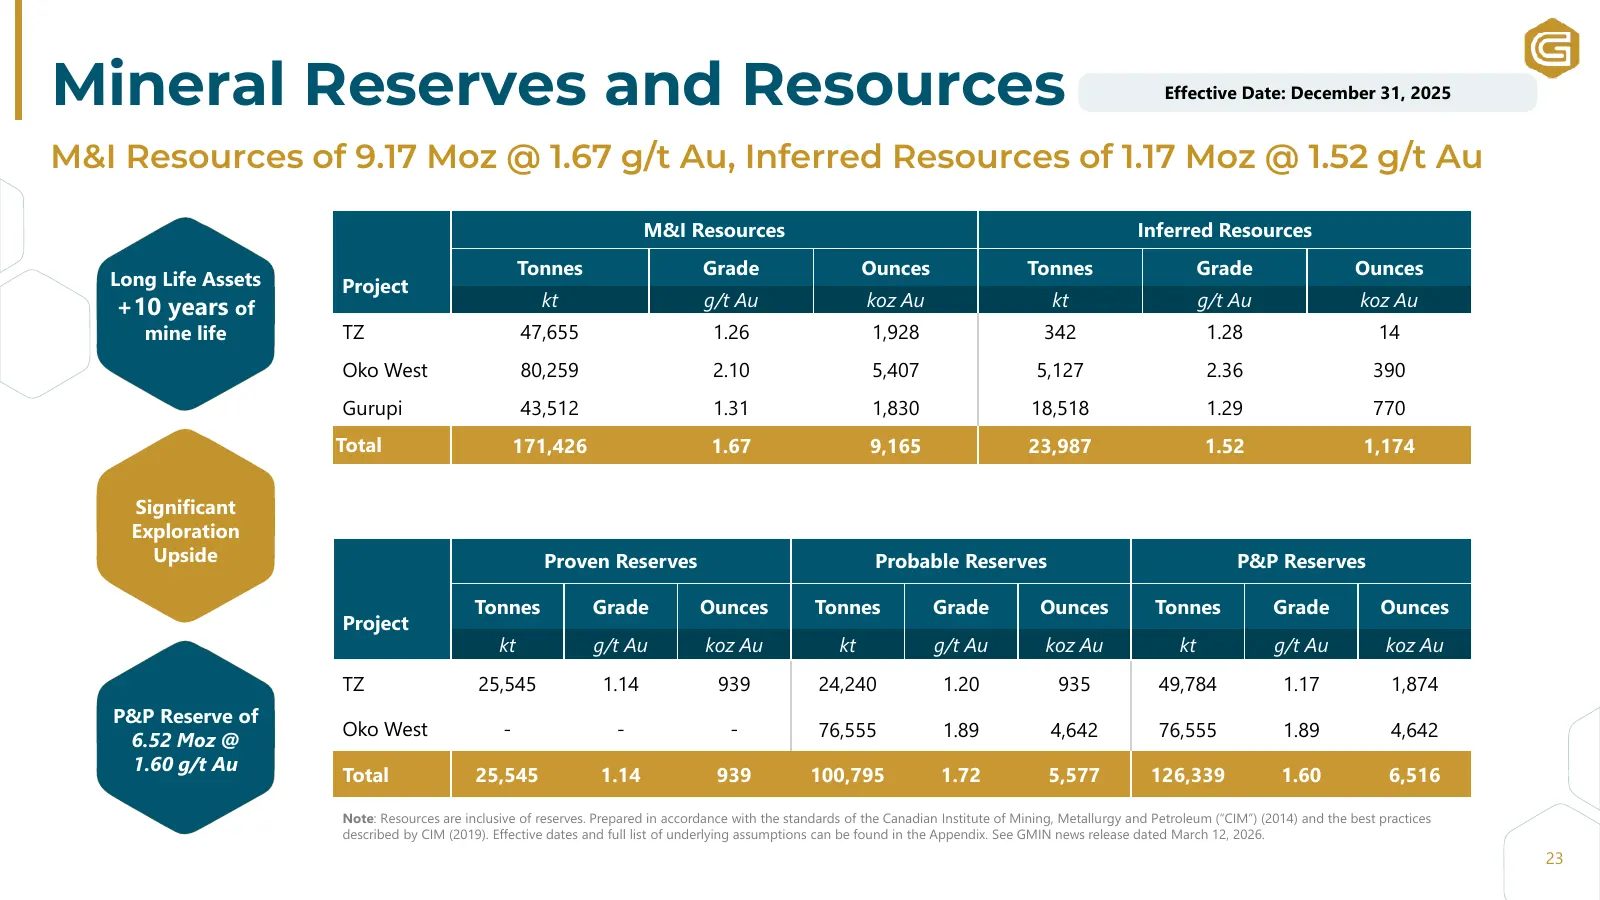
Mineral Reserves and Resources Effective Date: December 31, 2025 M&I Resources of 9.17 Moz @ 1.67 g/t Au, Inferred Resources of 1.17 Moz @ 1.52 g/t Au M&I Resources Inferred Resources Tonnes Grade Ounces Tonnes Grade Ounces Long Life Assets Project +10 years of kt g/t Au koz Au kt g/t Au koz Au mine
Slide 24: Mineral Reserves and Resources: Assumptions and Notes
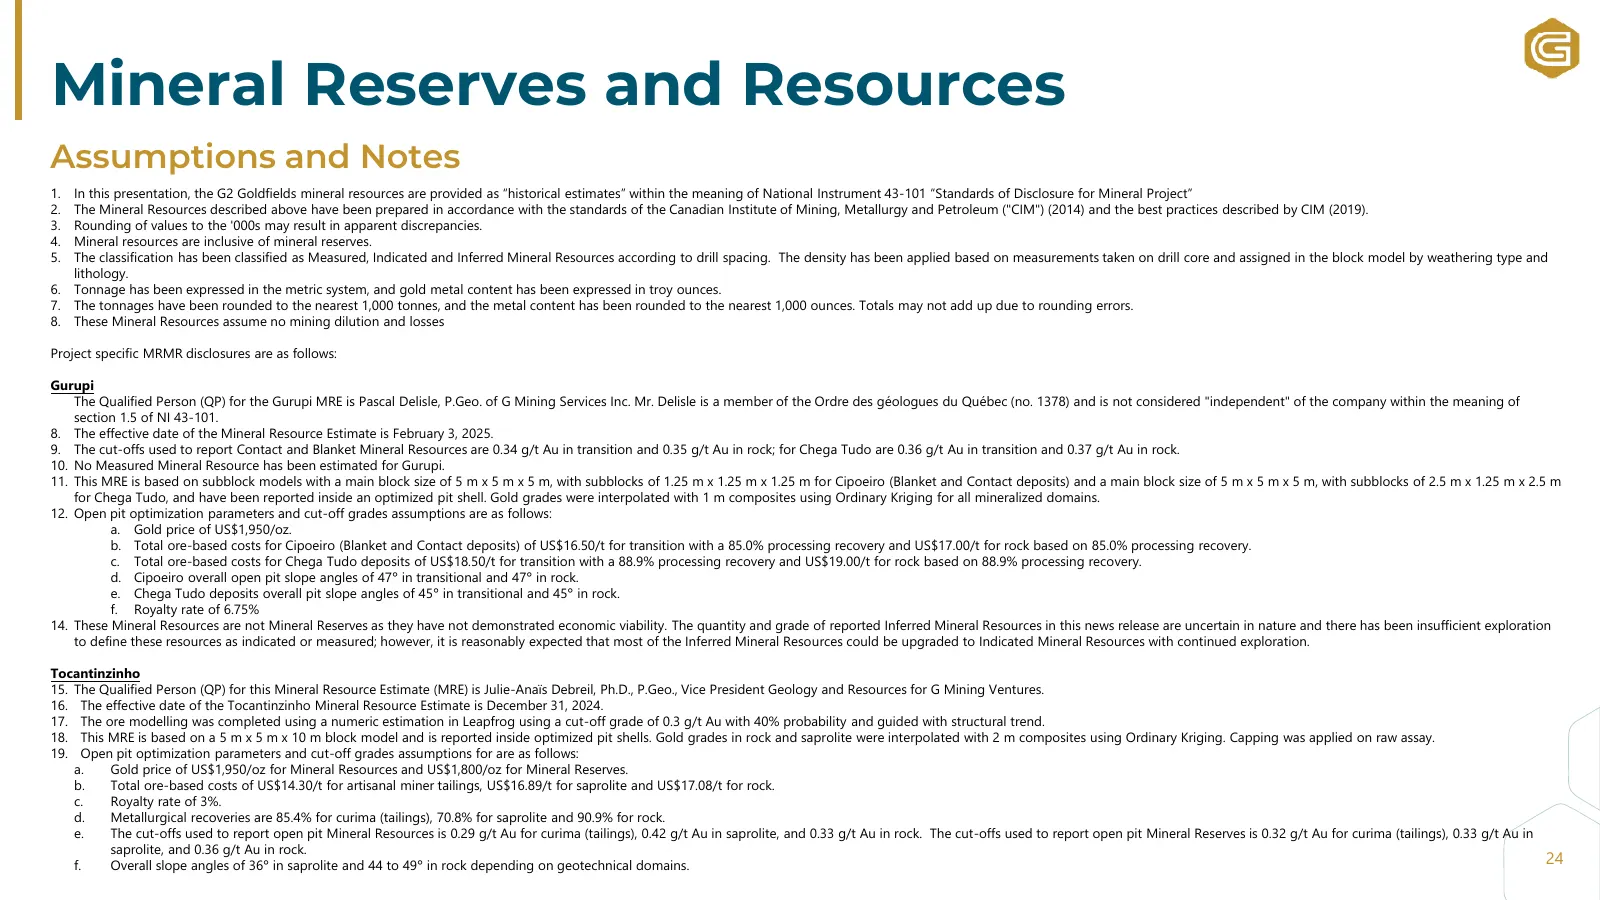
Mineral Reserves and Resources Assumptions and Notes 1. In this presentation, the G2 Goldfields mineral resources are provided as “historical estimates” within the meaning of National Instrument 43-101 “Standards of Disclosure for Mineral Project” 2. The Mineral Resources described above have been p
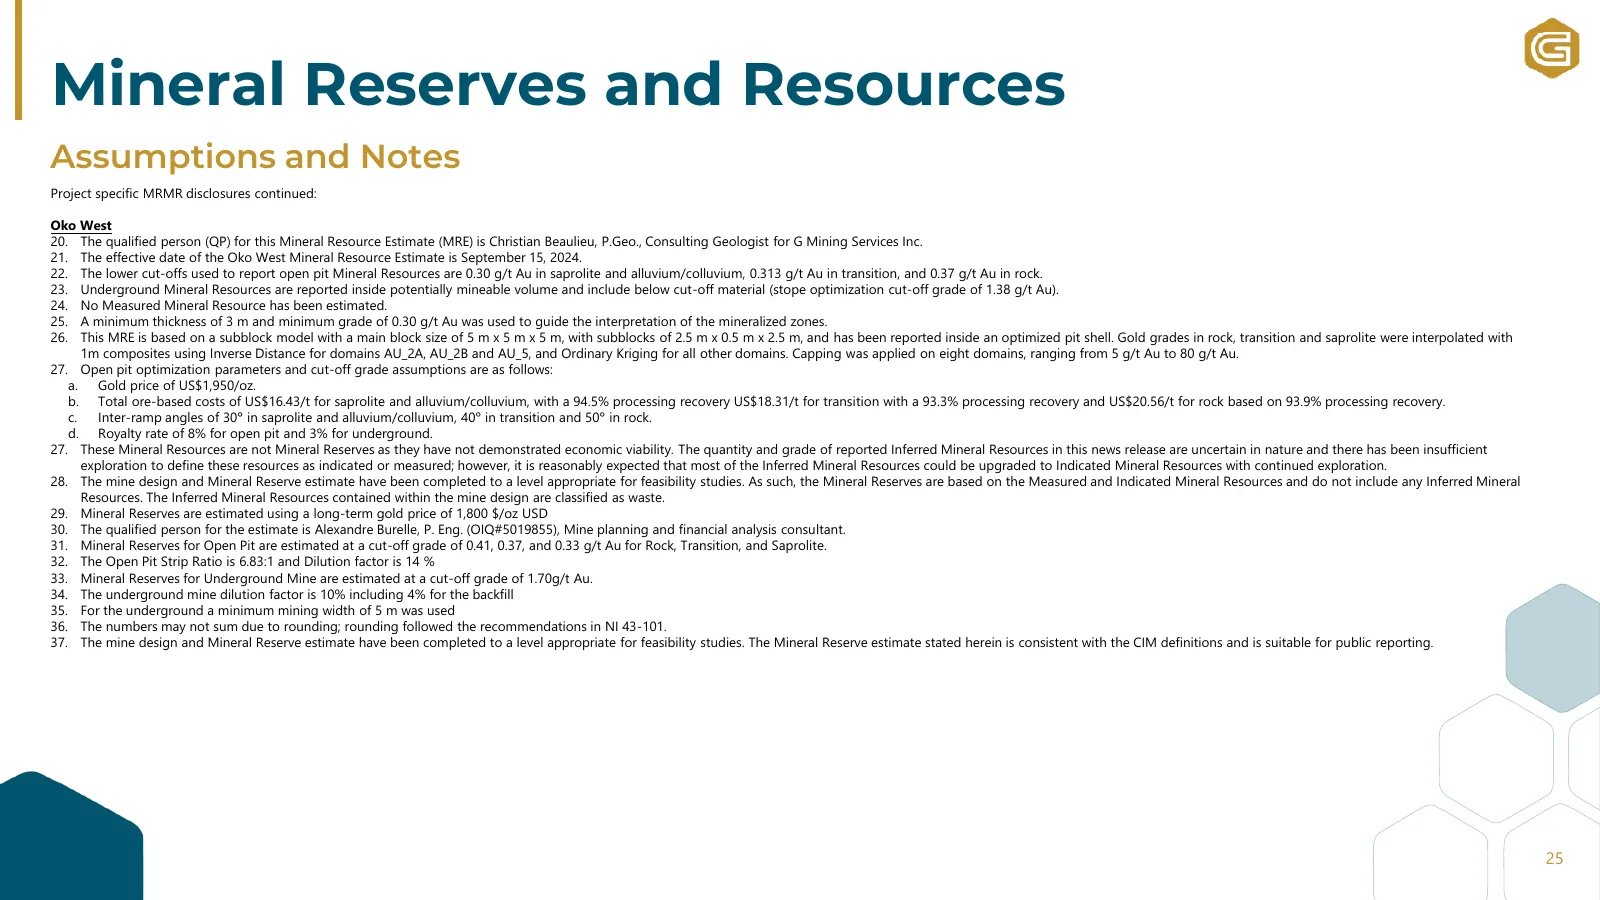
Slide 25: Mineral Reserves and Resources: Assumptions and Notes
Mineral Reserves and Resources Assumptions and Notes Project specific MRMR disclosures continued: Oko West 20. The qualified person (QP) for this Mineral Resource Estimate (MRE) is Christian Beaulieu, P.Geo., Consulting Geologist for G Mining Services Inc. 21. The effective date of the Oko West Mine
Source: company website
More decks from G Mining Ventures Corp
 Q2 2026 Earnings Presentation27 slides · Aug 13, 2026
 Q1 2026 Earnings Presentation27 slides · May 14, 2026
 Q4 2025 Earnings Presentation32 slides · Mar 26, 2026
 Q3 2025 Earnings Presentation36 slides · Nov 13, 2025
 Q2 2025 Earnings Presentation31 slides · Aug 14, 2025
 Q1 2025 Earnings Presentation34 slides · May 15, 2025