G Mining Ventures Corp · TSX:GMIN
G Mining Ventures — Q4 2025 Earnings Presentation
32 slides from G Mining Ventures's earnings presentation, Mar 26, 2026
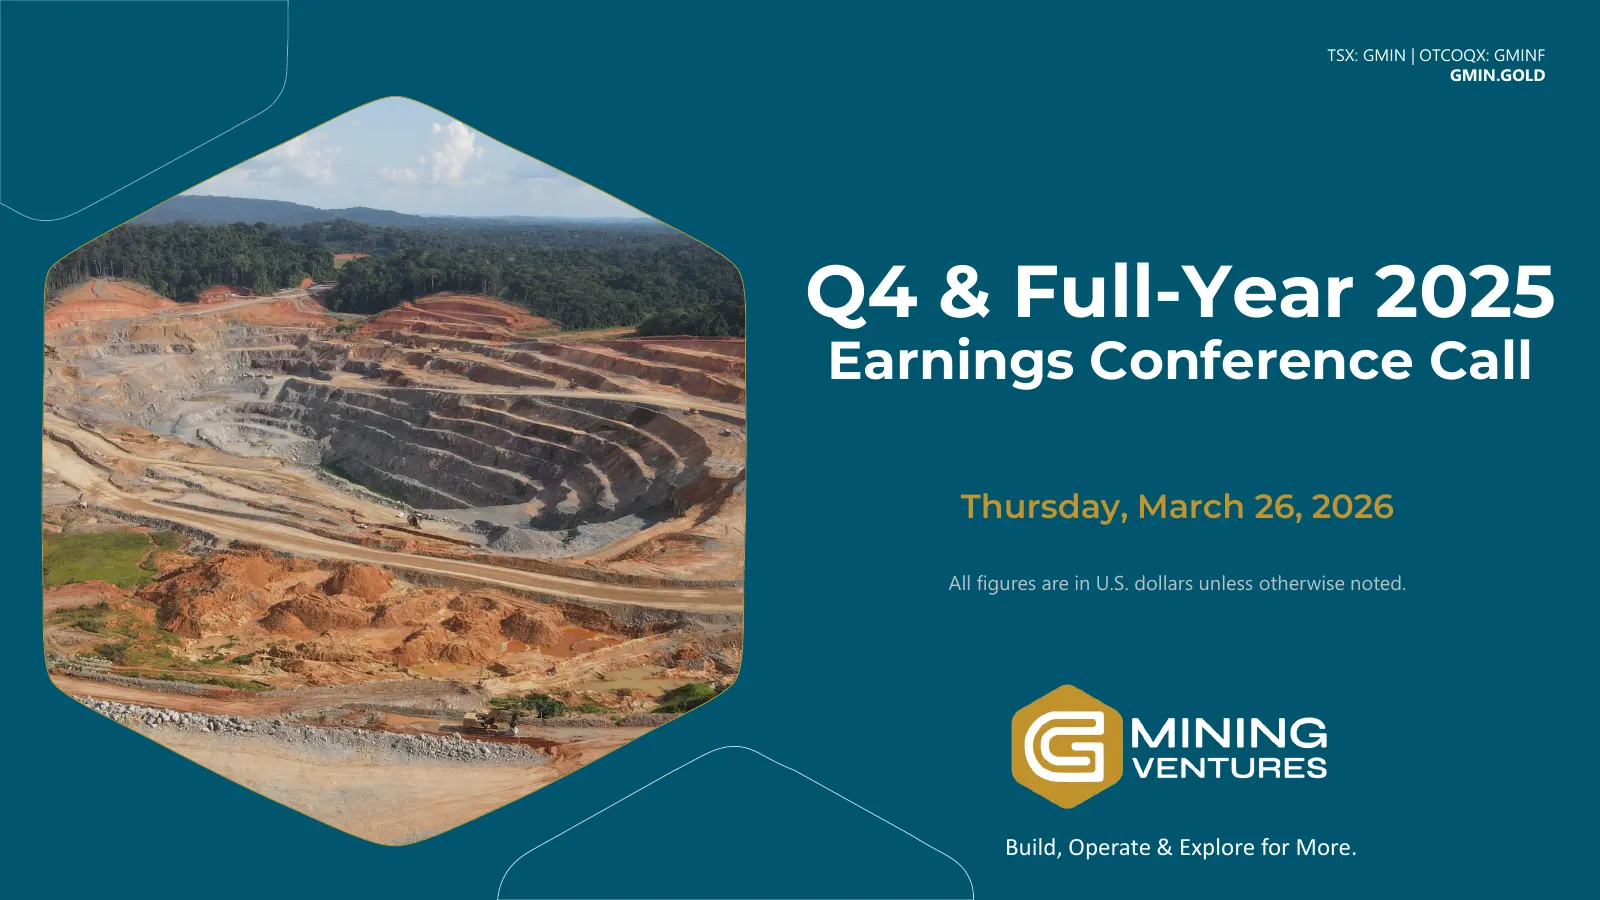
Slide 1: Q4 & Full-Year 2025 Earnings Conference Call
TSX: GMIN | OTCOQX: GMINF GMIN.GOLD Q4 & Full-Year 2025 Earnings Conference Call Thursday, March 26, 2026 All figures are in U.S. dollars unless otherwise noted. Build, Operate & Explore for More.
Slide 2: Cautionary Statements
Cautionary Statements Generally, forward-looking information can be identified by use of words such as “outlook”, “objective”, “may”, “could”, “would” , “will” ,“expect”, “intend”, “estimate”, “forecasts”, “project”, “seek”, “anticipate”, “believes”, “should”, “plans ” “pro forma”, or “continue”, an
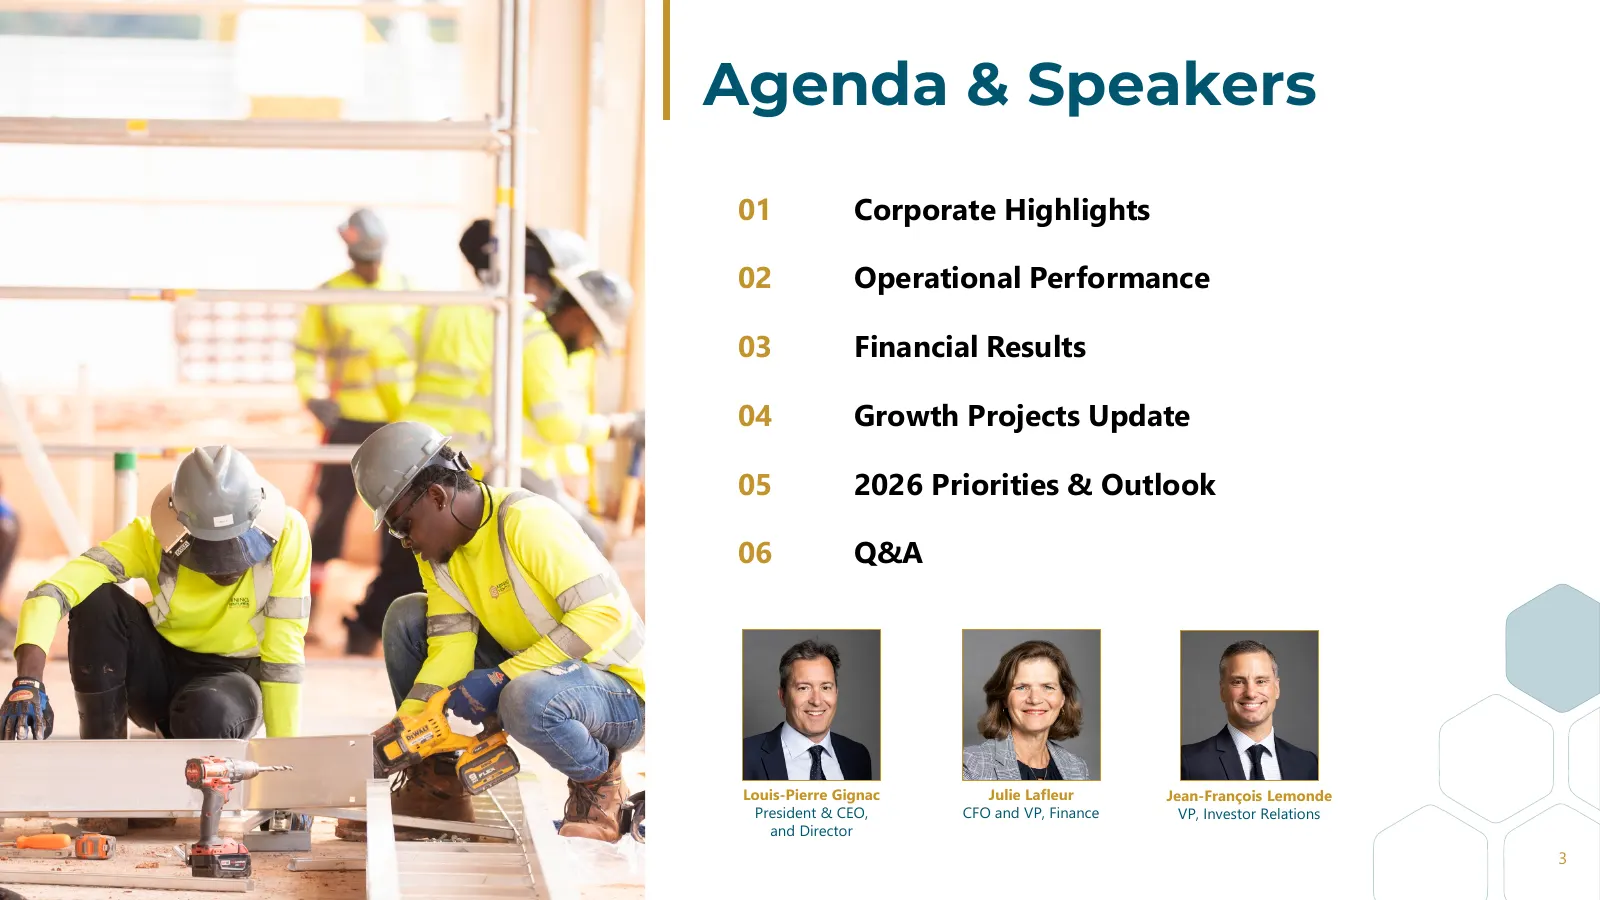
Slide 3: Agenda & Speakers
Agenda & Speakers 01 Corporate Highlights 02 Operational Performance 03 Financial Results 04 Growth Projects Update 05 2026 Priorities & Outlook 06 Q&A Louis-Pierre Gignac Julie Lafleur Jean-François Lemonde President & CEO, CFO and VP, Finance VP, Investor Relations and Director 3
Slide 4: Corporate Highlights
Corporate Highlights
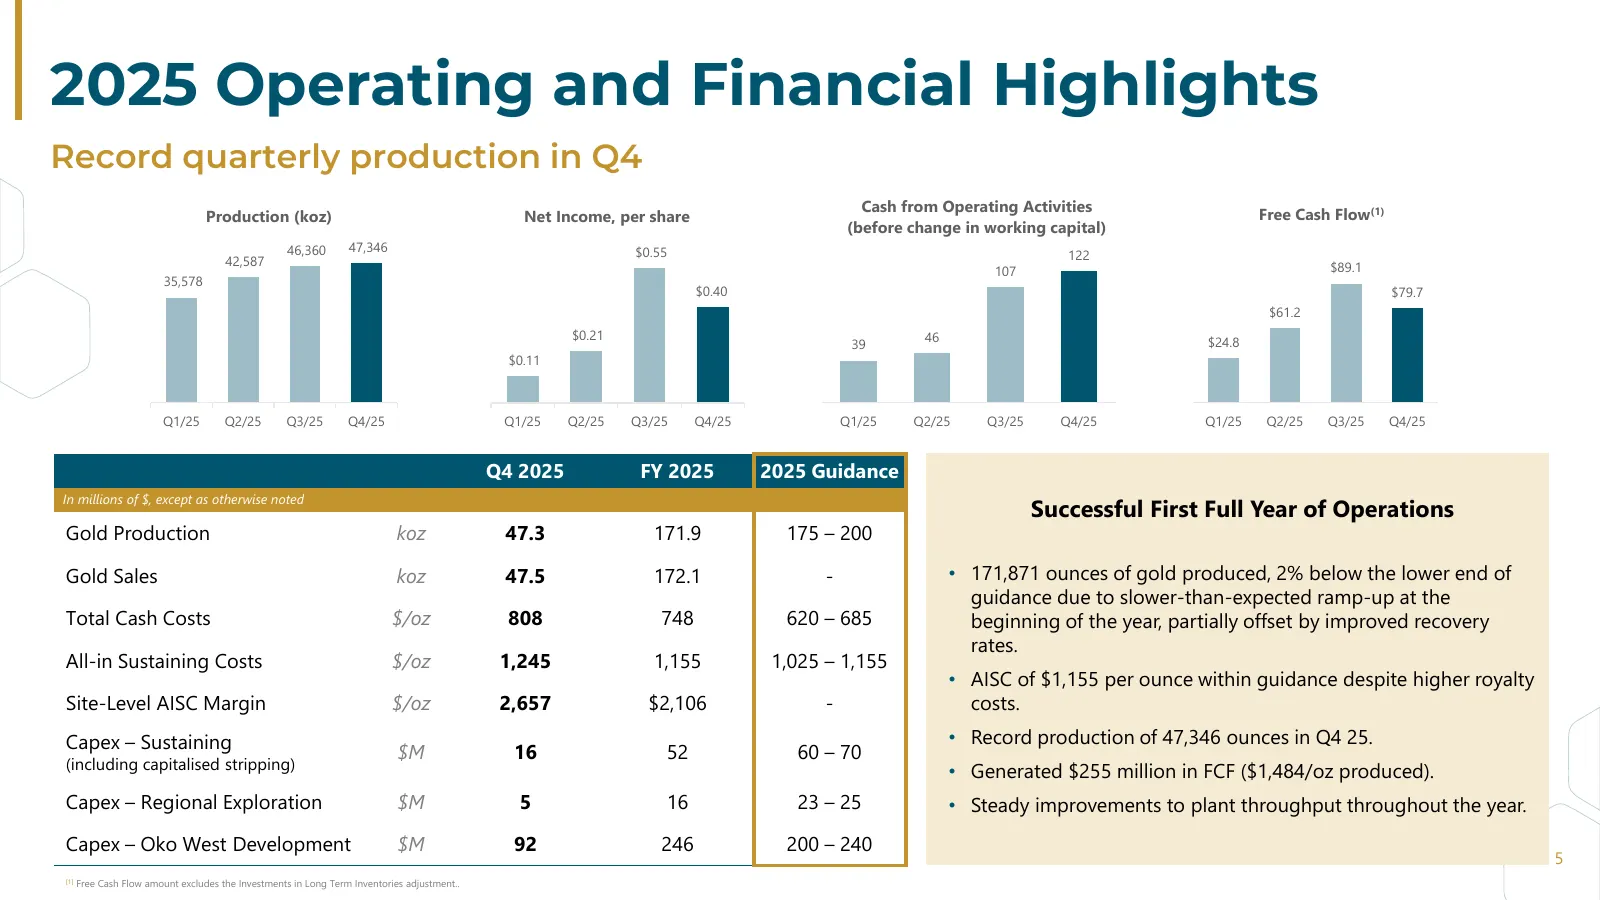
Slide 5: 2025 Operating and Financial Highlights
2025 Operating and Financial Highlights Record quarterly production in Q4 Cash from Operating Activities Production (koz) Net Income, per share Free Cash Flow(1) (before change in working capital) 46,360 47,346 $0.55 42,587 122 107 $89.1 35,578 $0.40 $79.7 $61.2 $0.21 46 $24.8 39 $0.11 Q1/25 Q2/25 Q
Slide 6: Operational Performance
Operational Performance
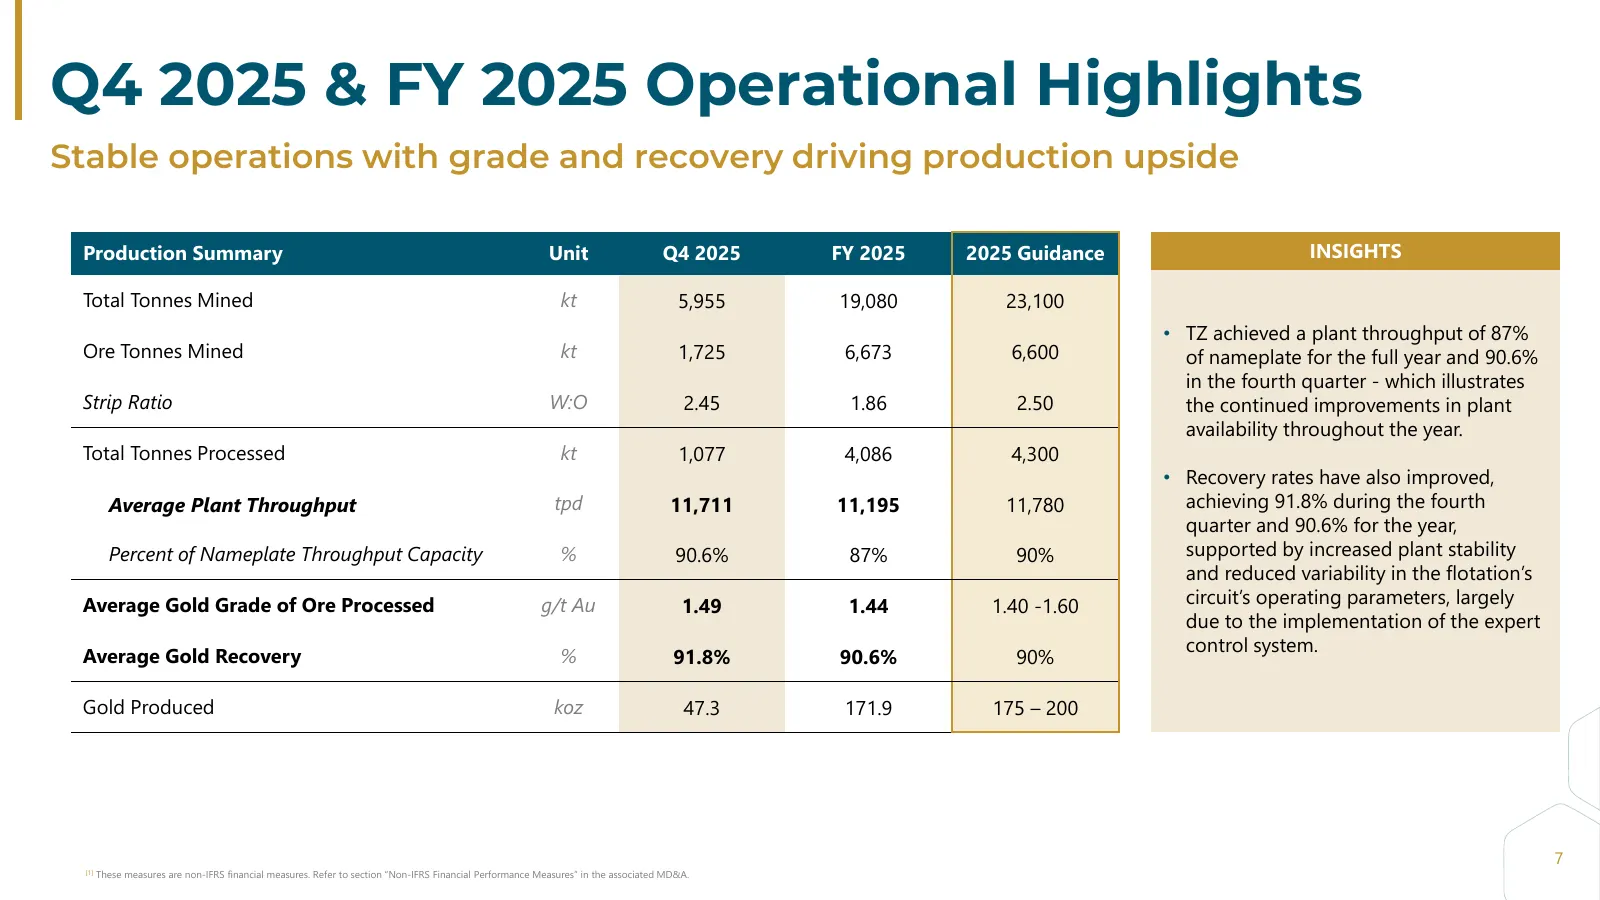
Slide 7: Q4 2025 & FY 2025 Operational Highlights
Q4 2025 & FY 2025 Operational Highlights Stable operations with grade and recovery driving production upside Production Summary Unit Q4 2025 FY 2025 2025 Guidance INSIGHTS Total Tonnes Mined kt 5,955 19,080 23,100 • TZ achieved a plant throughput of 87% Ore Tonnes Mined kt 1,725 6,673 6,600 of namep
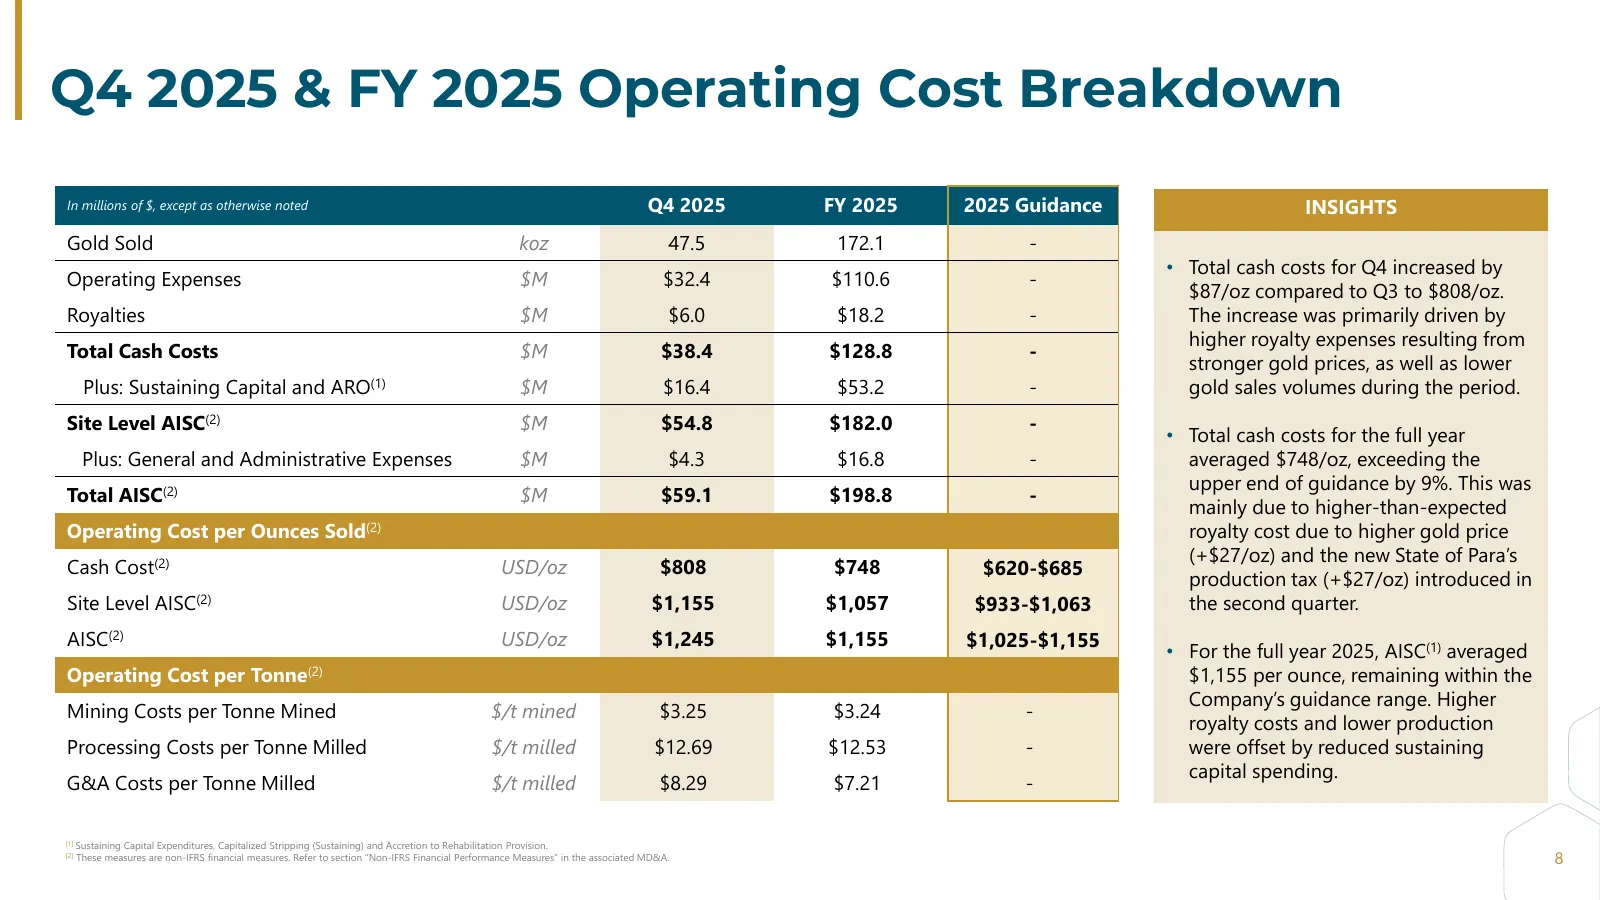
Slide 8: Q4 2025 & FY 2025 Operating Cost Breakdown
Q4 2025 & FY 2025 Operating Cost Breakdown In millions of $, except as otherwise noted Q4 2025 FY 2025 2025 Guidance INSIGHTS Gold Sold koz 47.5 172.1 - • Total cash costs for Q4 increased by Operating Expenses $M $32.4 $110.6 - $87/oz compared to Q3 to $808/oz. Royalties $M $6.0 $18.2 - The increas
Slide 9: Financial Highlights
Financial Highlights
Slide 10: Q4 2025 & FY 2025 Financial Highlights
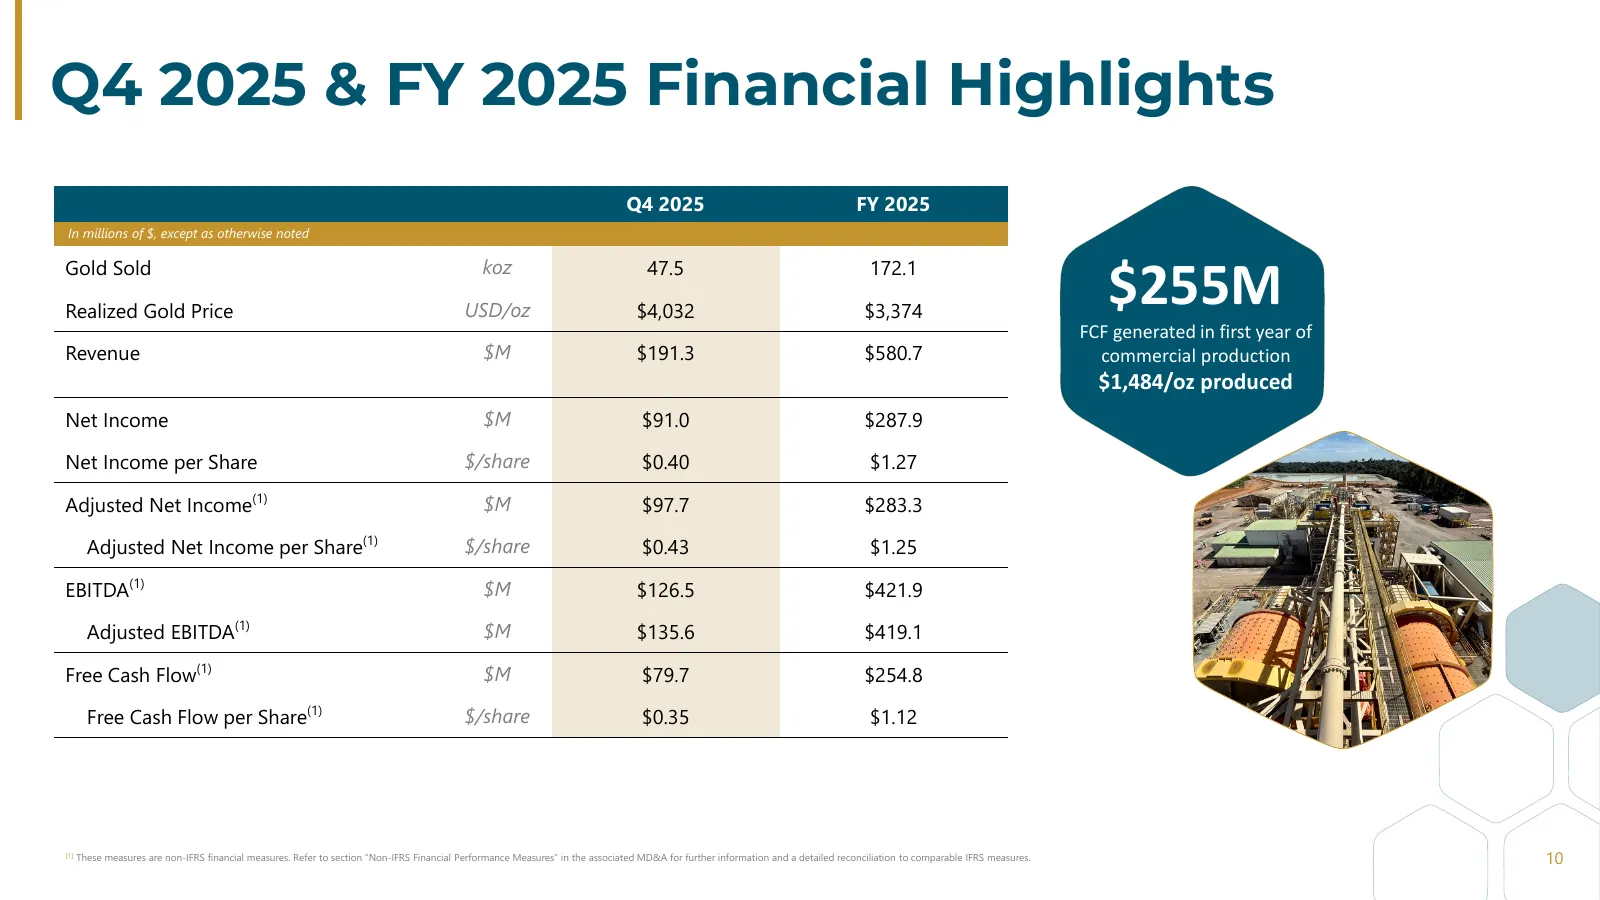
Q4 2025 & FY 2025 Financial Highlights Q4 2025 FY 2025 In millions of $, except as otherwise noted Gold Sold Realized Gold Price koz USD/oz 47.5 $4,032 172.1 $3,374 $255M43% FCF generated in first year of Revenue $M $191.3 $580.7 Free Cash Flow Margin commercial production $1,484/oz produced FY 2025
Slide 11: Q4 2025 & FY 2025 Free Cash Flow Summary
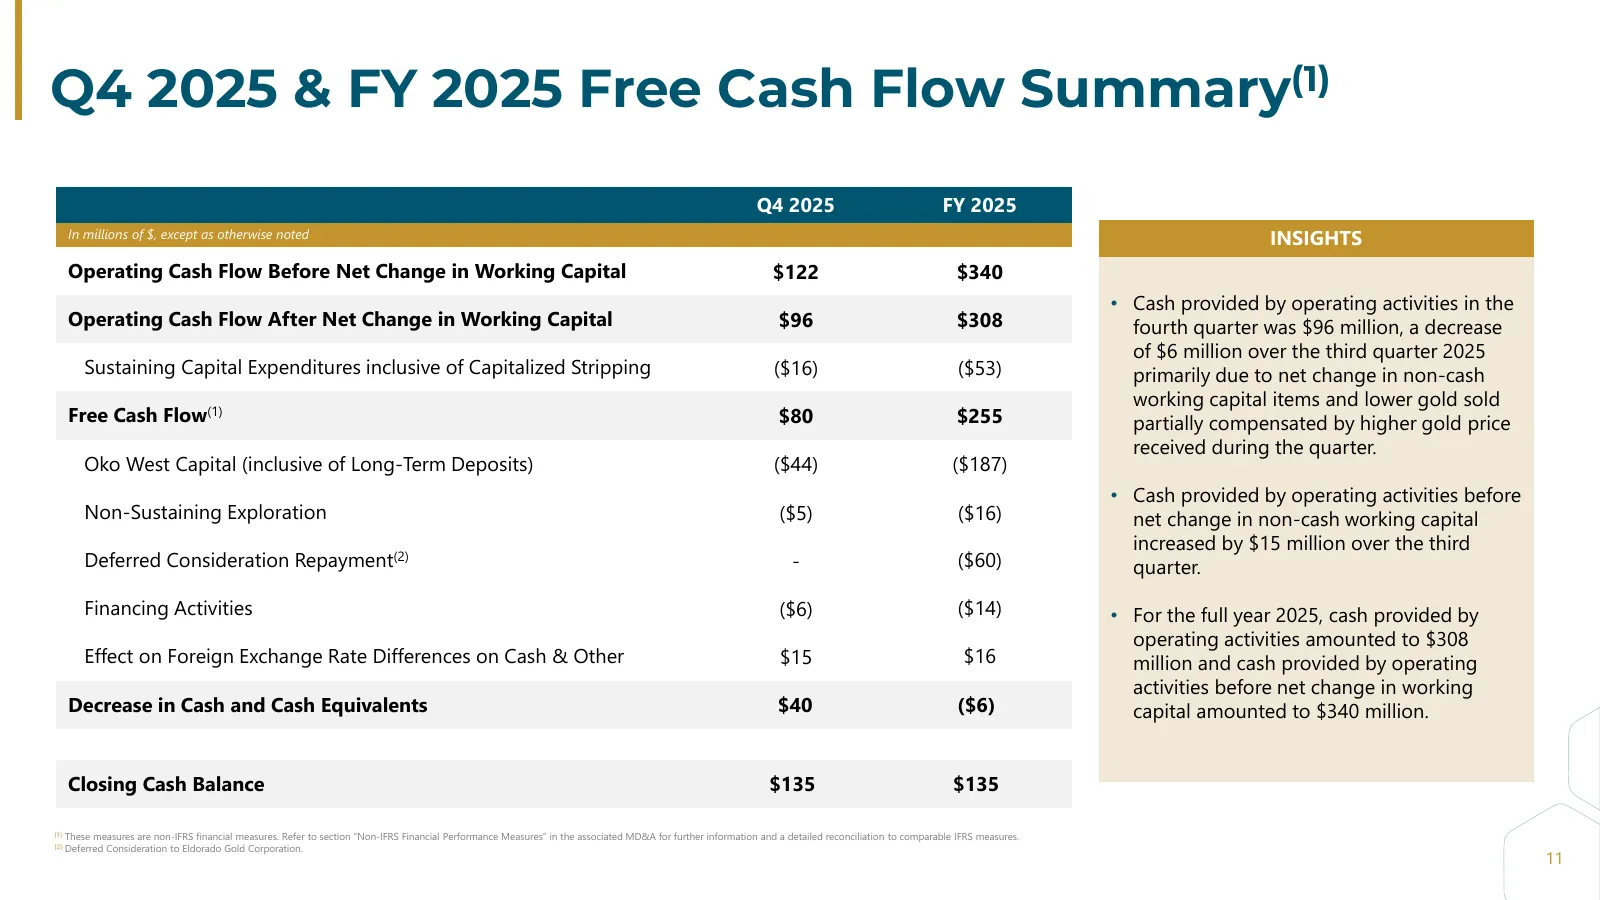
Q4 2025 & FY 2025 Free Cash Flow Summary(1) Q4 2025 FY 2025 In millions of $, except as otherwise noted INSIGHTS Operating Cash Flow Before Net Change in Working Capital $122 $340 • Cash provided by operating activities in the Operating Cash Flow After Net Change in Working Capital $96 $308 fourth q
Slide 12: Q4 2025 & FY 2025 Capital Expenditure Breakdown
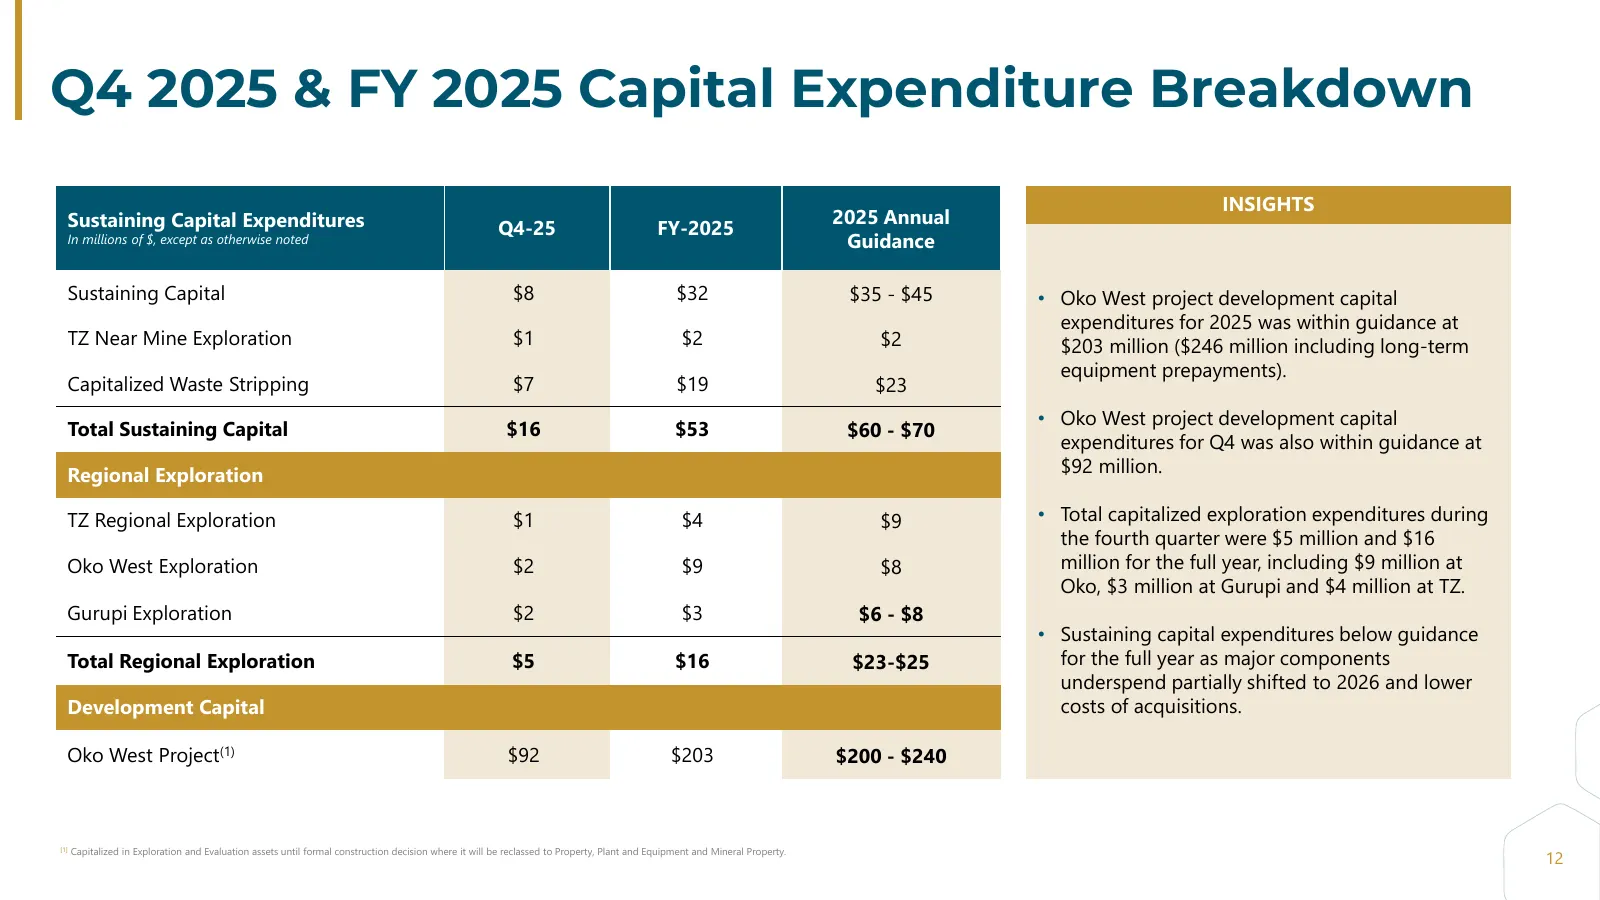
Q4 2025 & FY 2025 Capital Expenditure Breakdown INSIGHTS Sustaining Capital Expenditures 2025 Annual Q4-25 FY-2025 In millions of $, except as otherwise noted Guidance Sustaining Capital $8 $32 $35 - $45 • Oko West project development capital expenditures for 2025 was within guidance at TZ Near Mine
Slide 13: 2026 & 2027 Operational Guidance
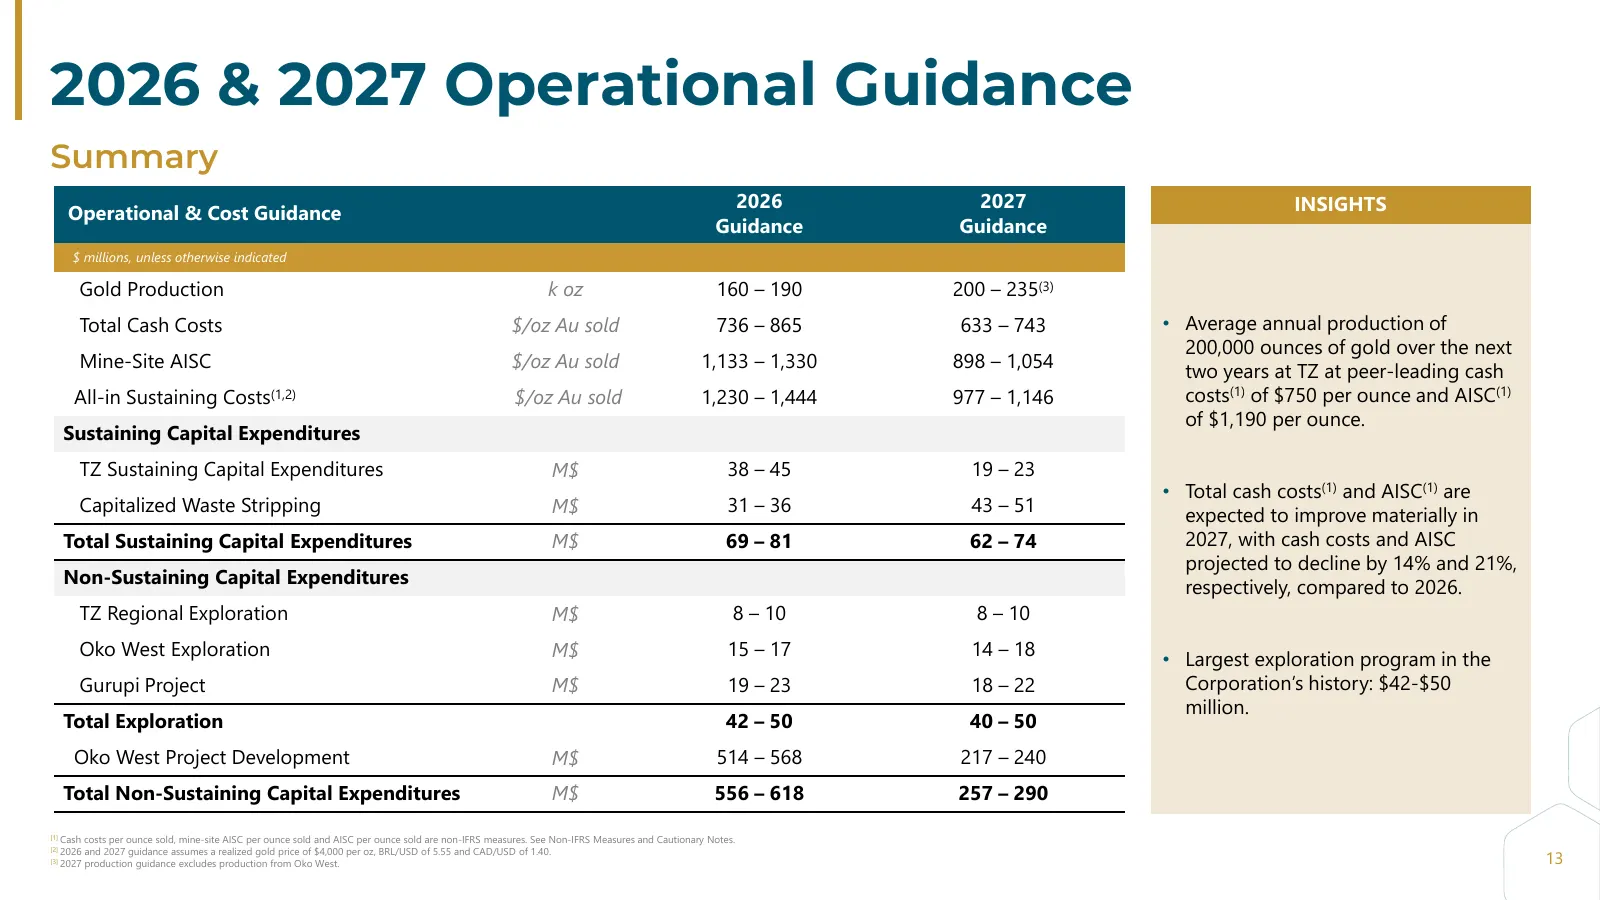
2026 & 2027 Operational Guidance Summary 2026 2027 INSIGHTS Operational & Cost Guidance Guidance Guidance $ millions, unless otherwise indicated Gold Production k oz 160 – 190 200 – 235(3) Total Cash Costs $/oz Au sold 736 – 865 633 – 743 • Average annual production of 200,000 ounces of gold over th
Slide 14: Growth Projects Update
Growth Projects Update
Slide 15: Oko West – Project Update
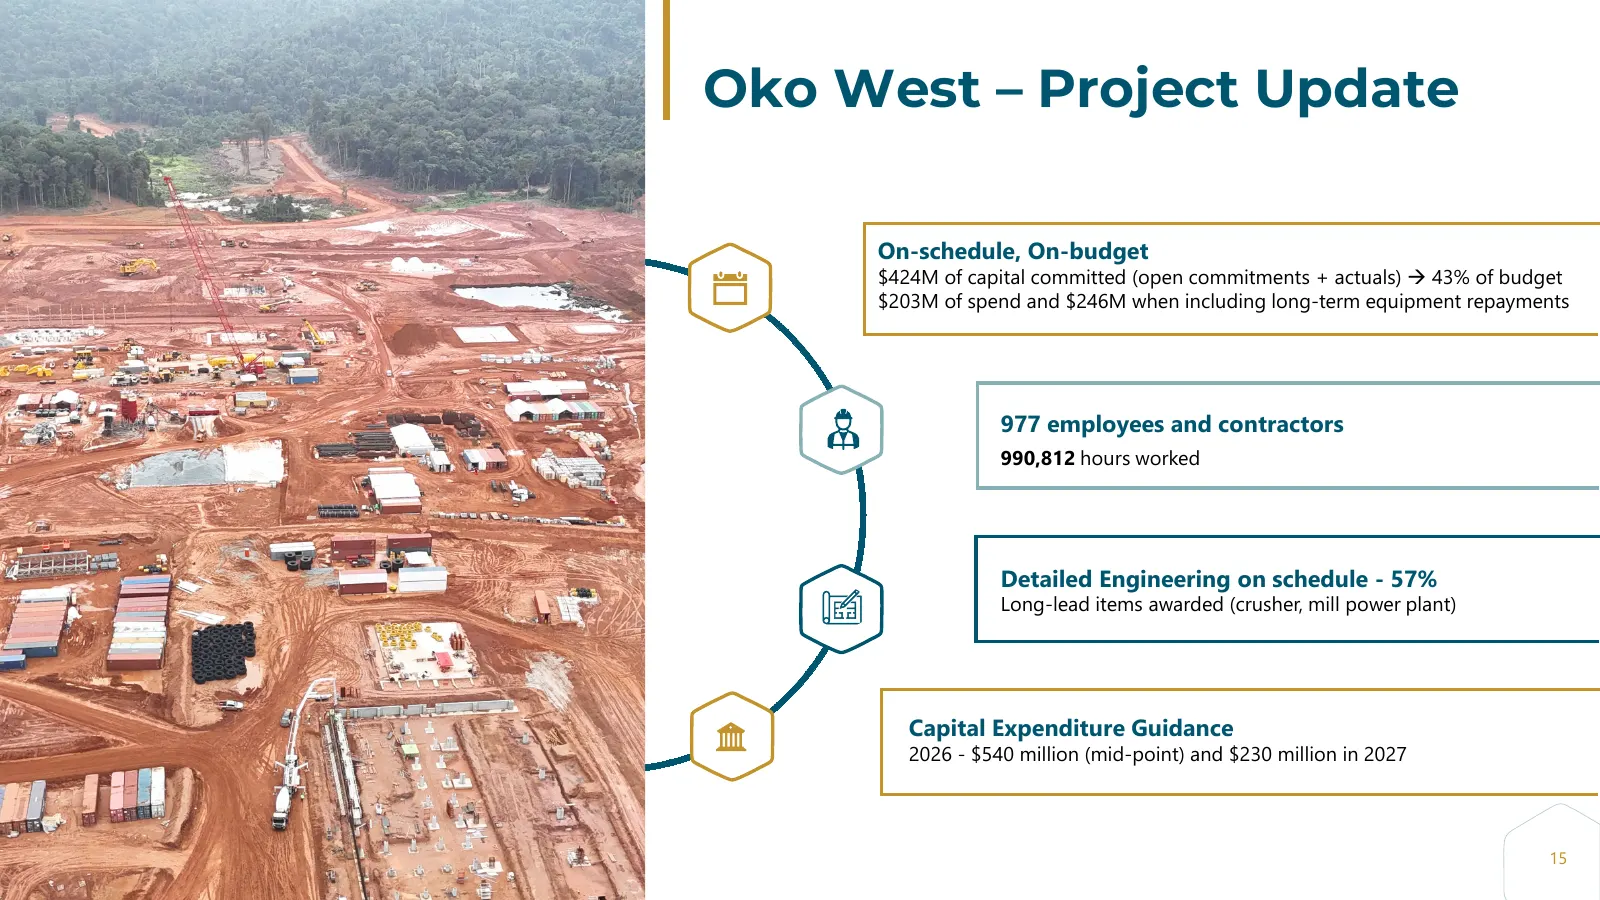
Oko West – Project Update On-schedule, On-budget $424M of capital committed (open commitments + actuals) 43% of budget $203M of spend and $246M when including long-term equipment repayments 977 employees and contractors 990,812 hours worked Detailed Engineering on schedule - 57% Long-lead items aw
Slide 16: Accelerated Timeline to Production
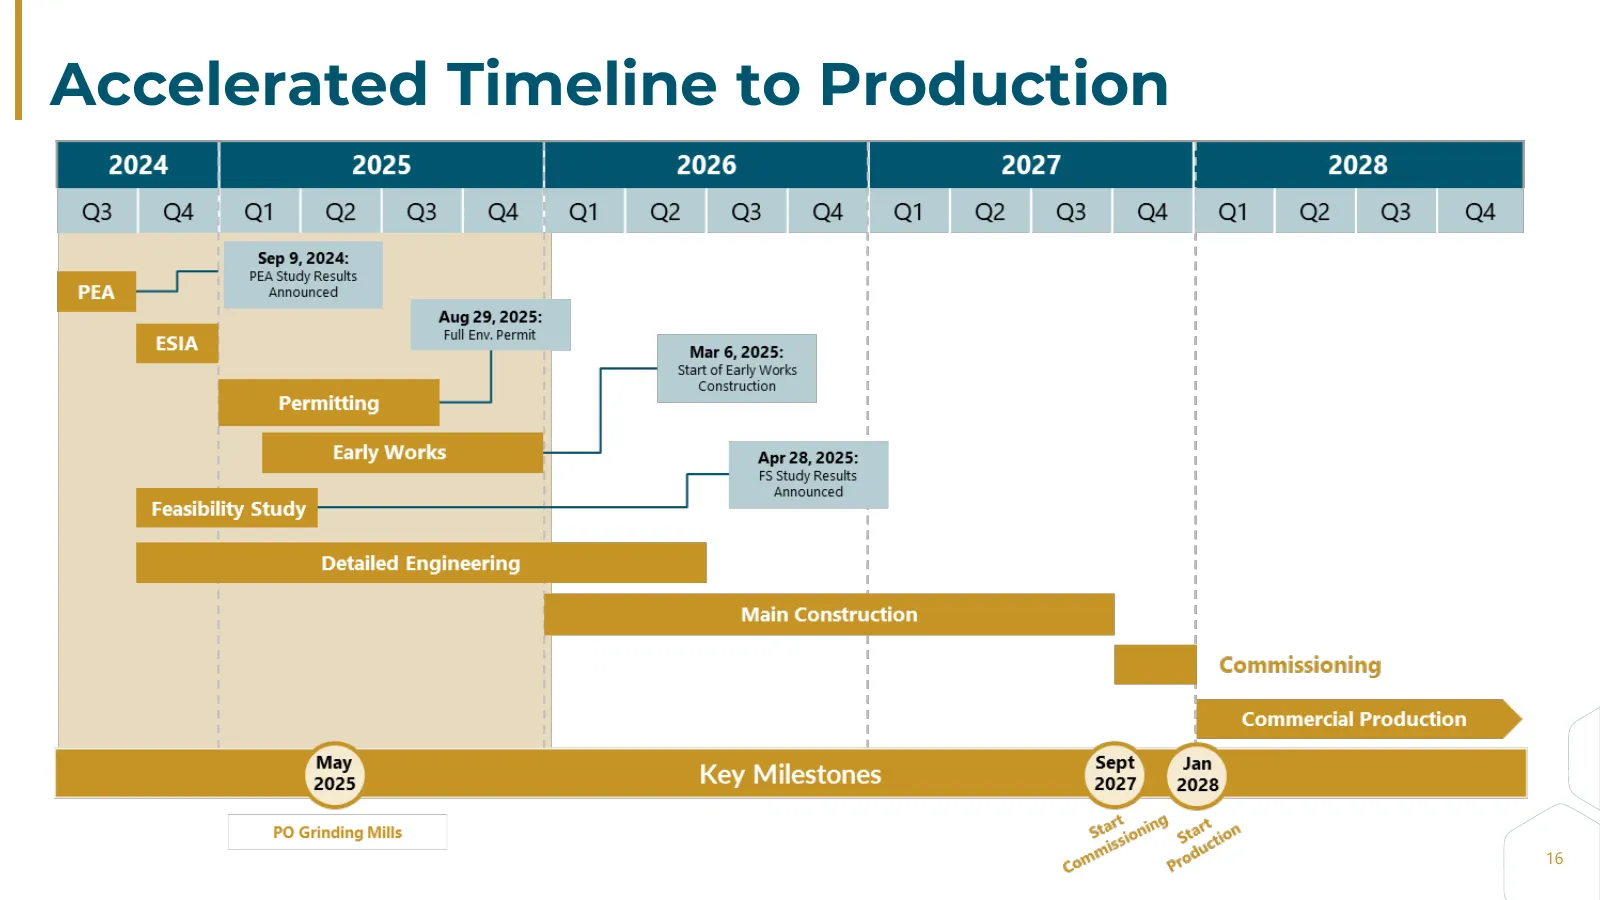
Accelerated Timeline to Production 16
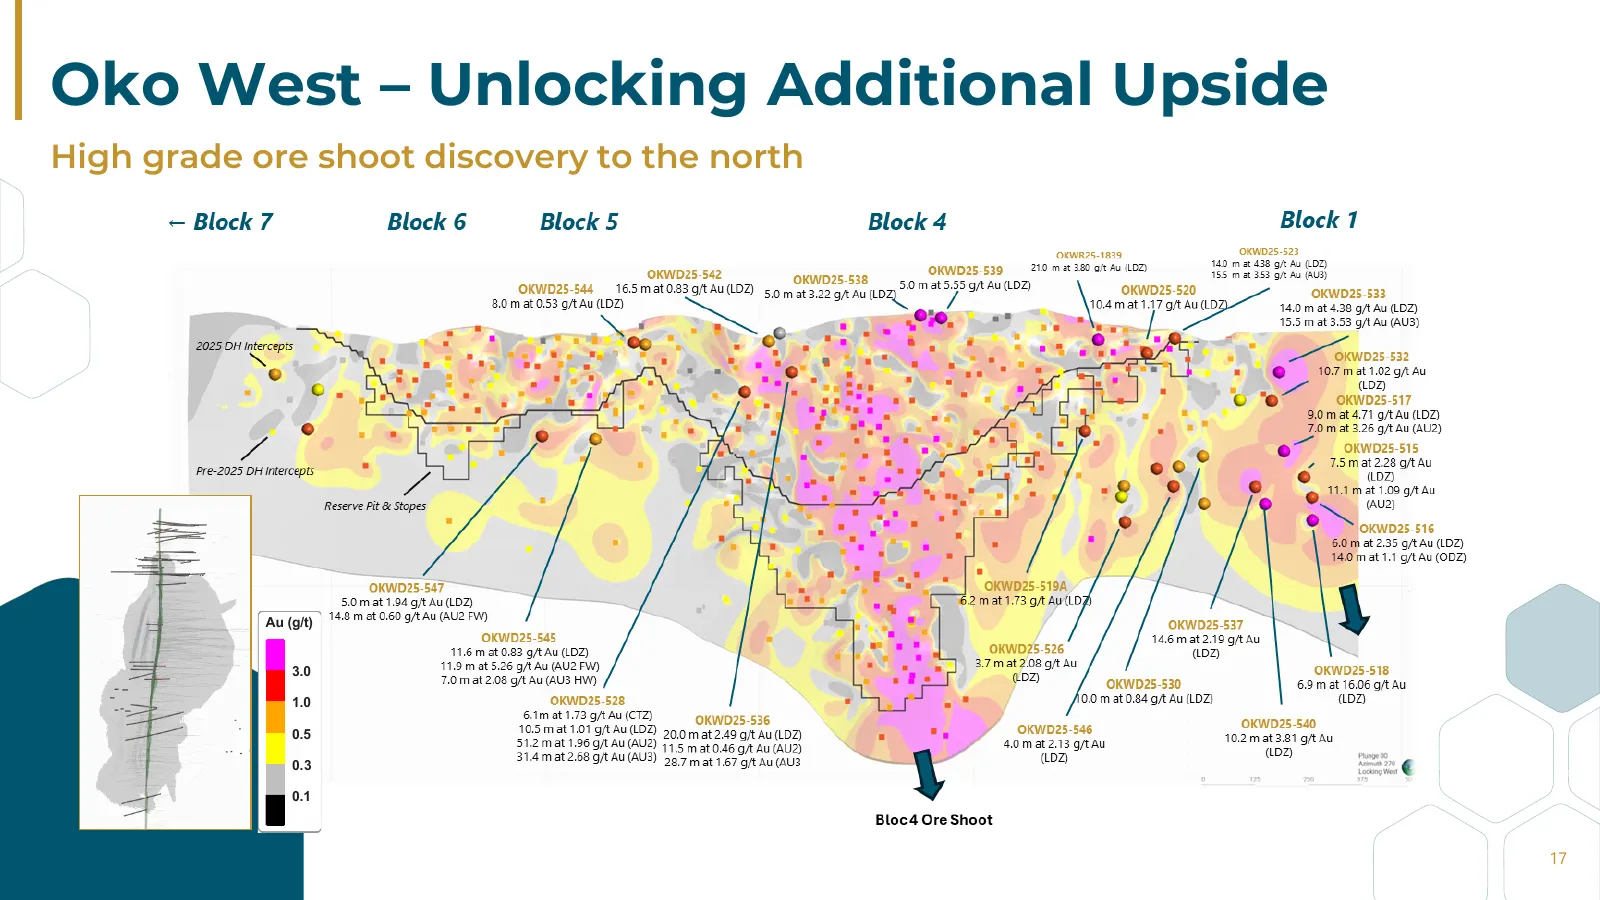
Slide 17: Oko West – Unlocking Additional Upside
Oko West – Unlocking Additional Upside High grade ore shoot discovery to the north Au (g/t) 3.0 1.0 0.5 0.3 0.1 17
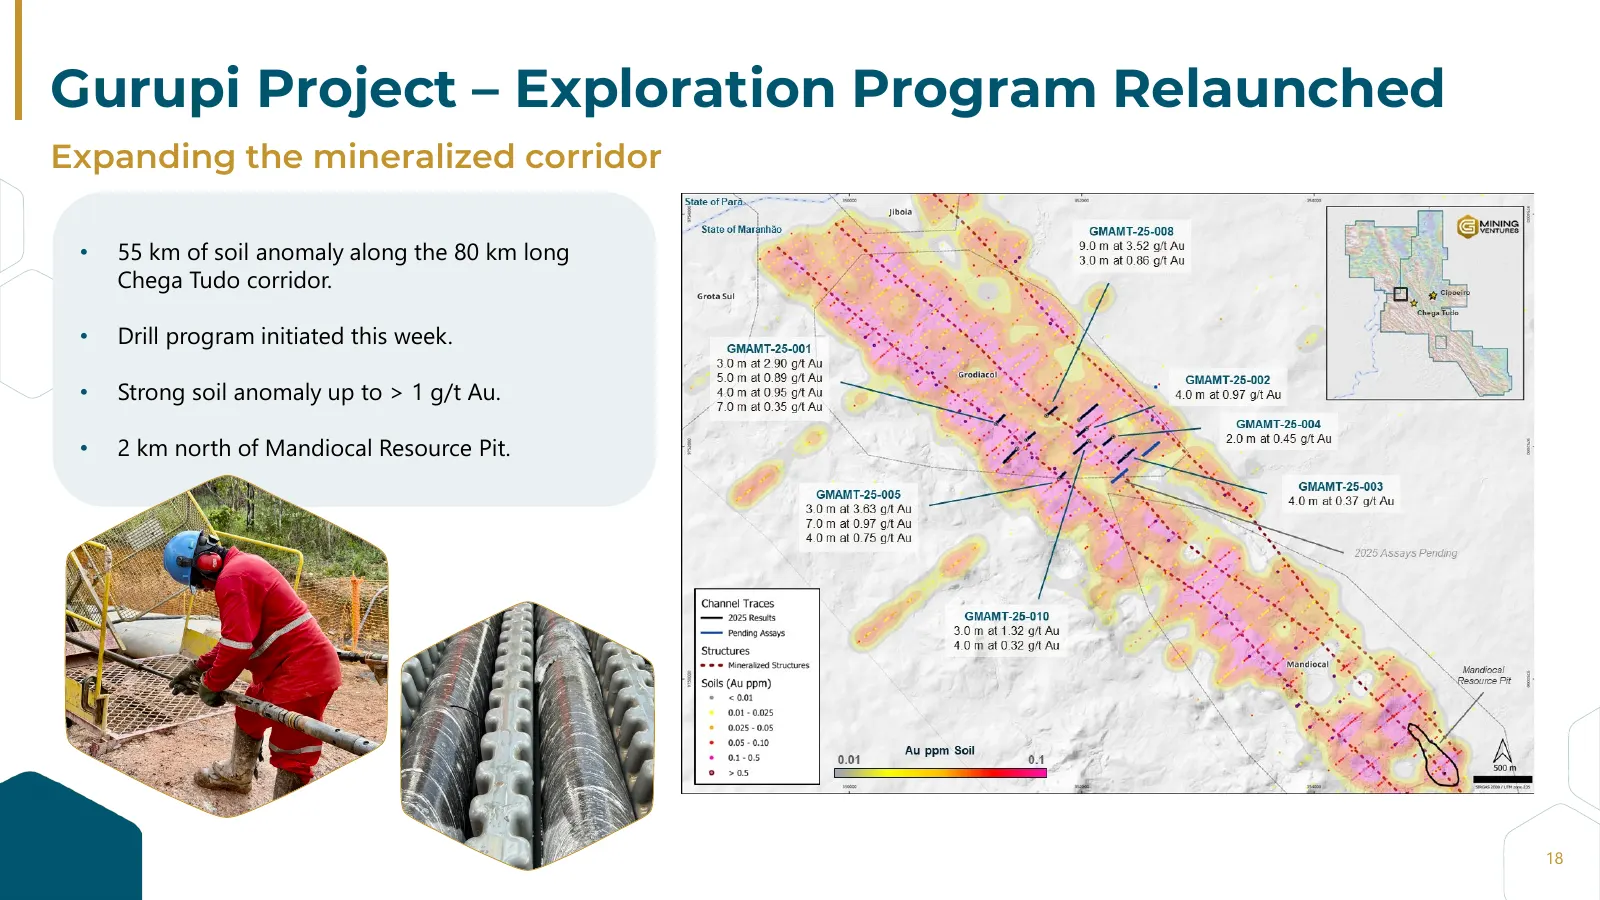
Slide 18: Gurupi Project – Exploration Program Relaunched
Gurupi Project – Exploration Program Relaunched Expanding the mineralized corridor • 55 km of soil anomaly along the 80 km long Chega Tudo corridor. • Drill program initiated this week. • Strong soil anomaly up to > 1 g/t Au. • 2 km north of Mandiocal Resource Pit. 18
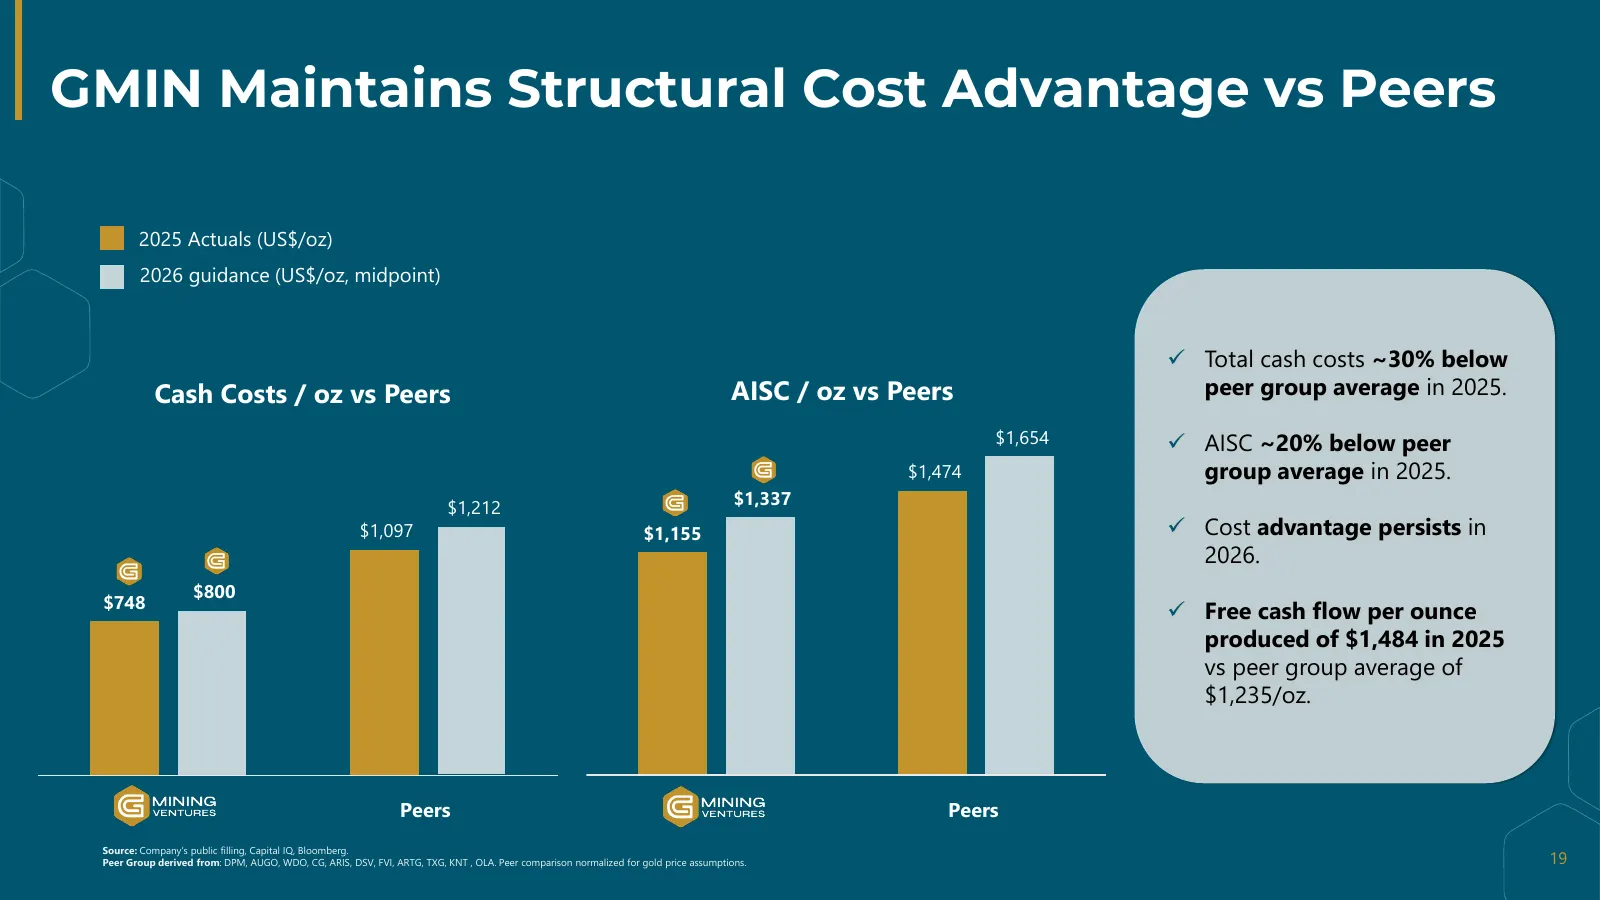
Slide 19: GMIN Maintains Structural Cost Advantage vs Peers
GMIN Maintains Structural Cost Advantage vs Peers 2025 Actuals (US$/oz) 2026 guidance (US$/oz, midpoint) Total cash costs ~30% below Cash Costs / oz vs Peers AISC / oz vs Peers peer group average in 2025. $1,654 AISC ~20% below peer $1,474 group average in 2025. $1,212 $1,337 $1,097 $1,155 Cos
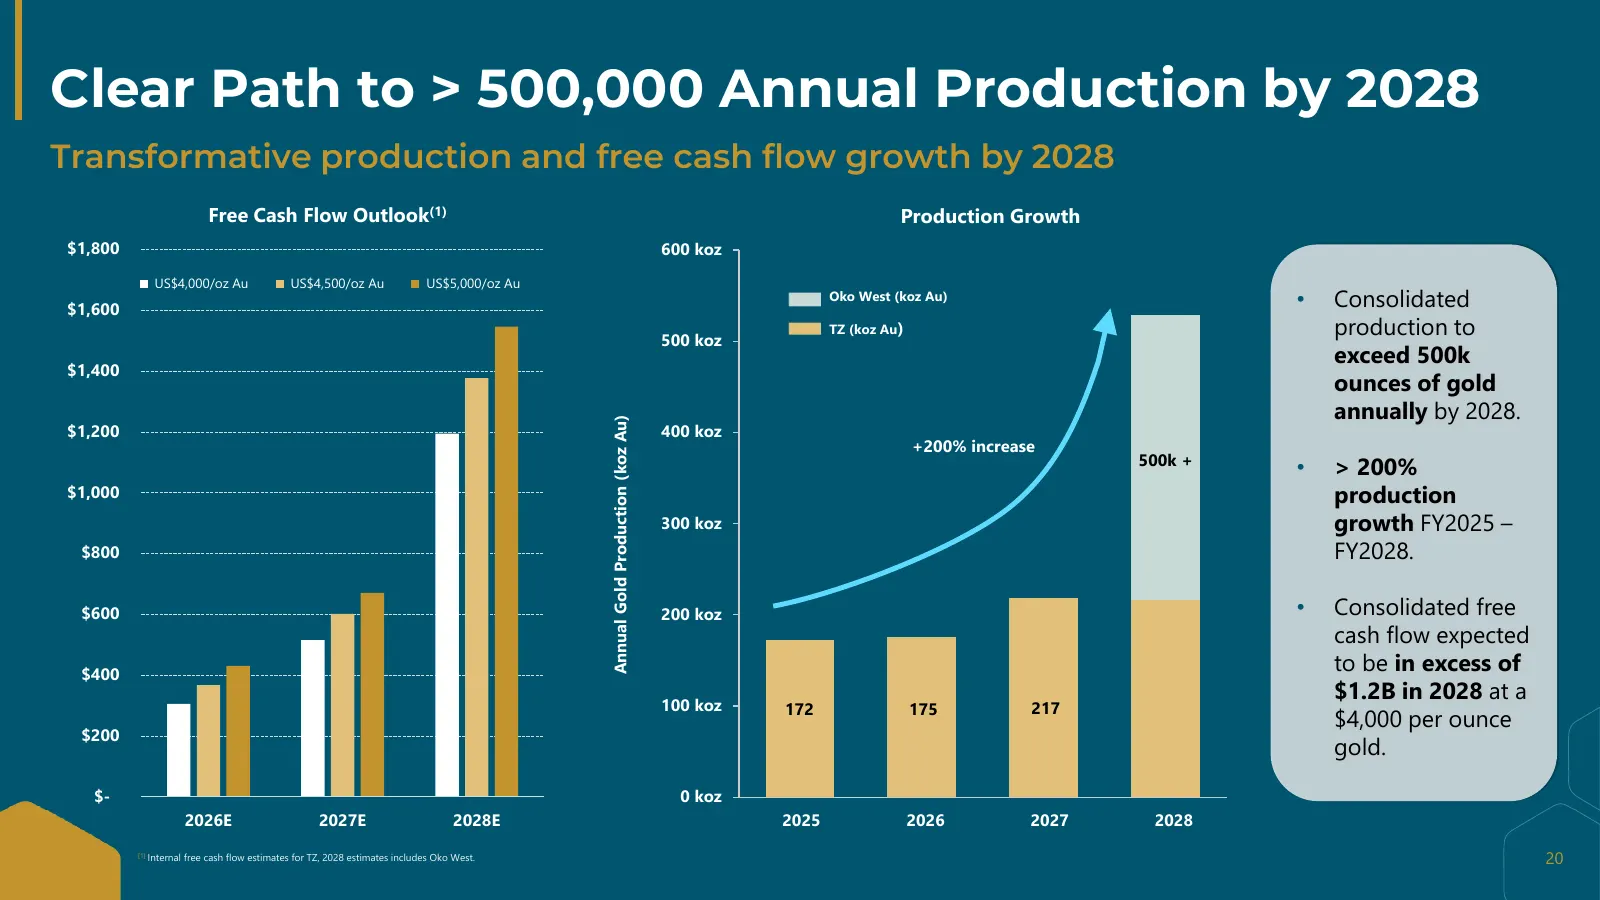
Slide 20: Clear Path to > 500,000 Annual Production by 2028
Clear Path to > 500,000 Annual Production by 2028 Transformative production and free cash flow growth by 2028 Free Cash Flow Outlook(1) Production Growth $1,800 600 koz US$4,000/oz Au US$4,500/oz Au US$5,000/oz Au $1,600 Oko West (koz Au) • Consolidated 500 koz TZ (koz Au) production to exceed 500k
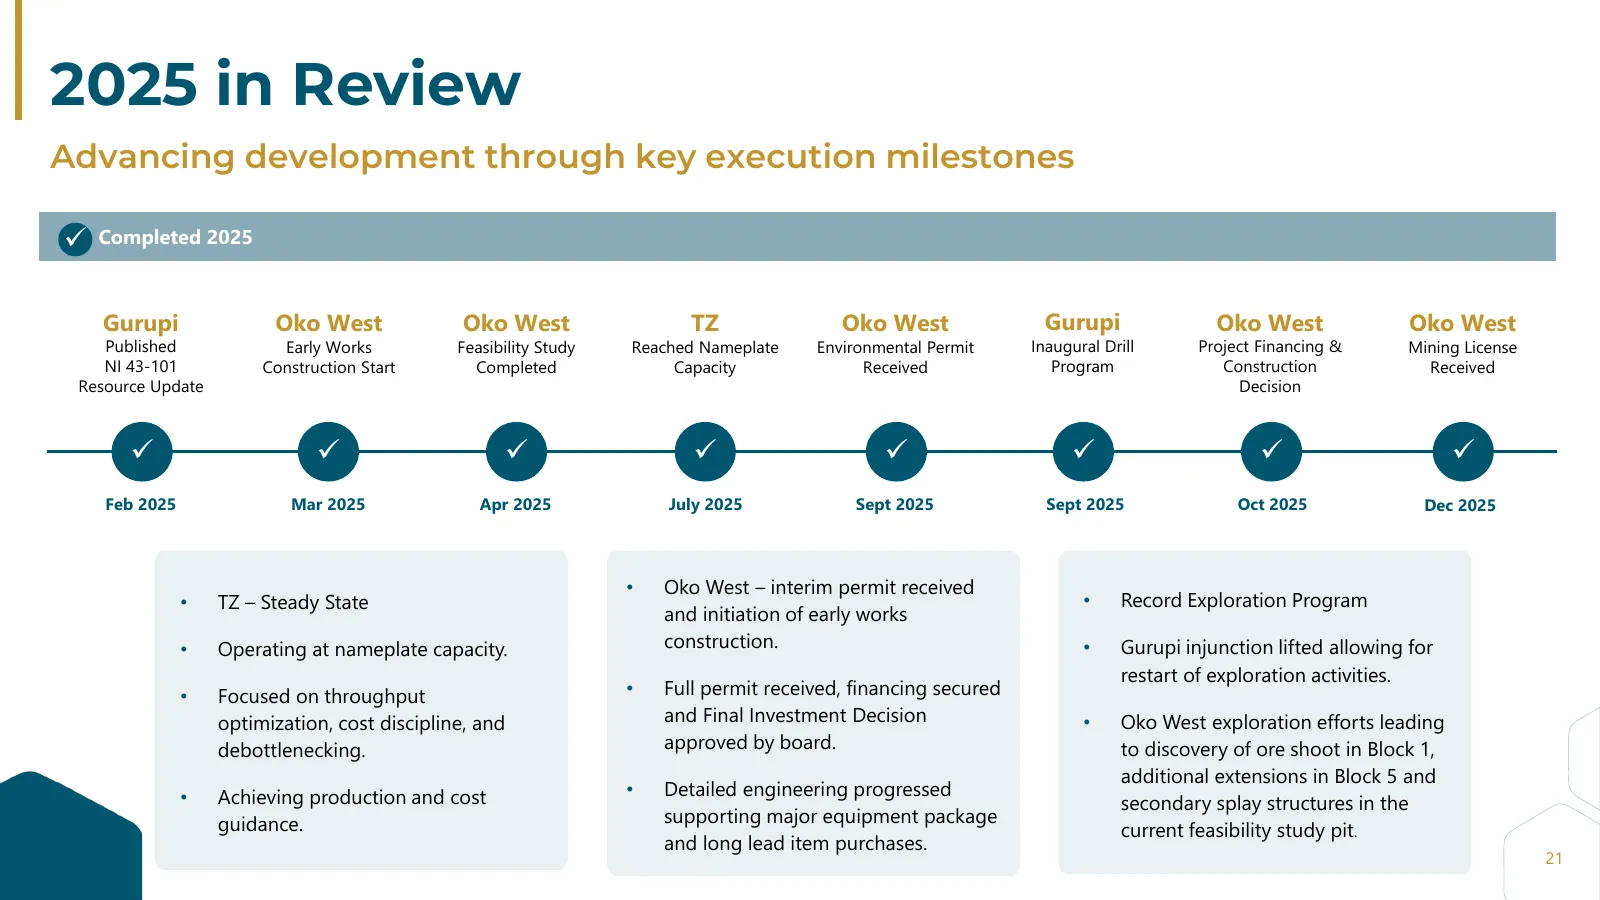
Slide 21: 2025 in Review
2025 in Review Advancing development through key execution milestones Completed 2025 Gurupi Oko West Oko West TZ Oko West Gurupi Oko West Oko West Published Early Works Feasibility Study Reached Nameplate Environmental Permit Inaugural Drill Project Financing & Mining License NI 43-101 Constructio
Slide 22: 2026 Priorities & Outlook
2026 Priorities & Outlook
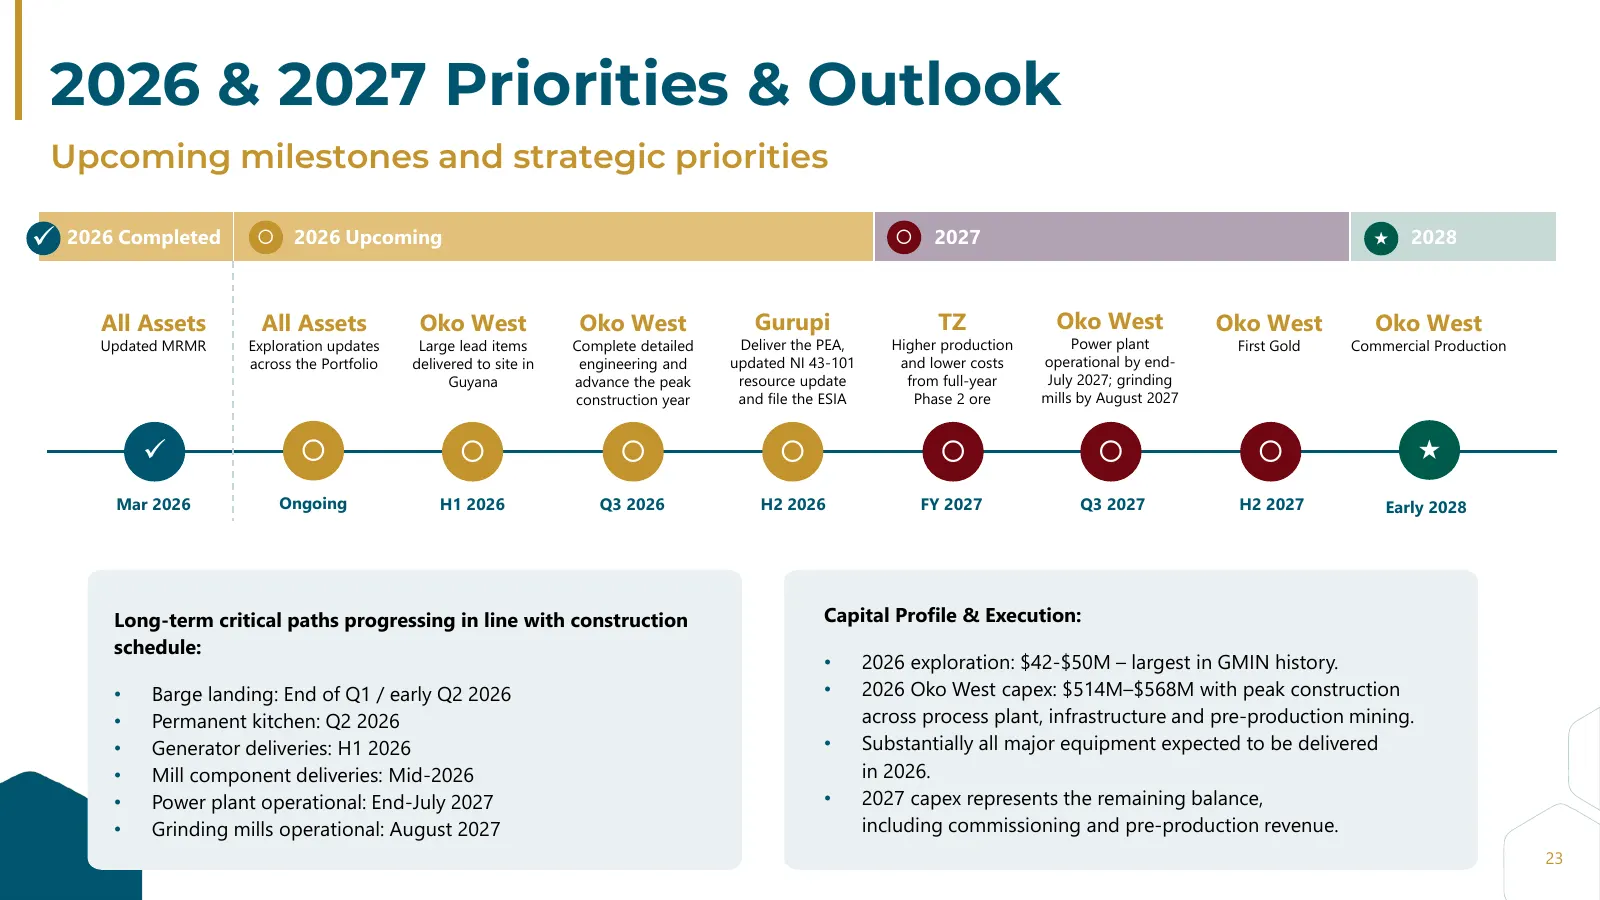
Slide 23: 2026 & 2027 Priorities & Outlook
2026 & 2027 Priorities & Outlook Upcoming milestones and strategic priorities 2026 Completed 2026 Upcoming 2027 2028 All Assets All Assets Oko West Oko West Gurupi TZ Oko West Oko West Oko West Updated MRMR Exploration updates Large lead items Complete detailed Deliver the PEA, Higher produc
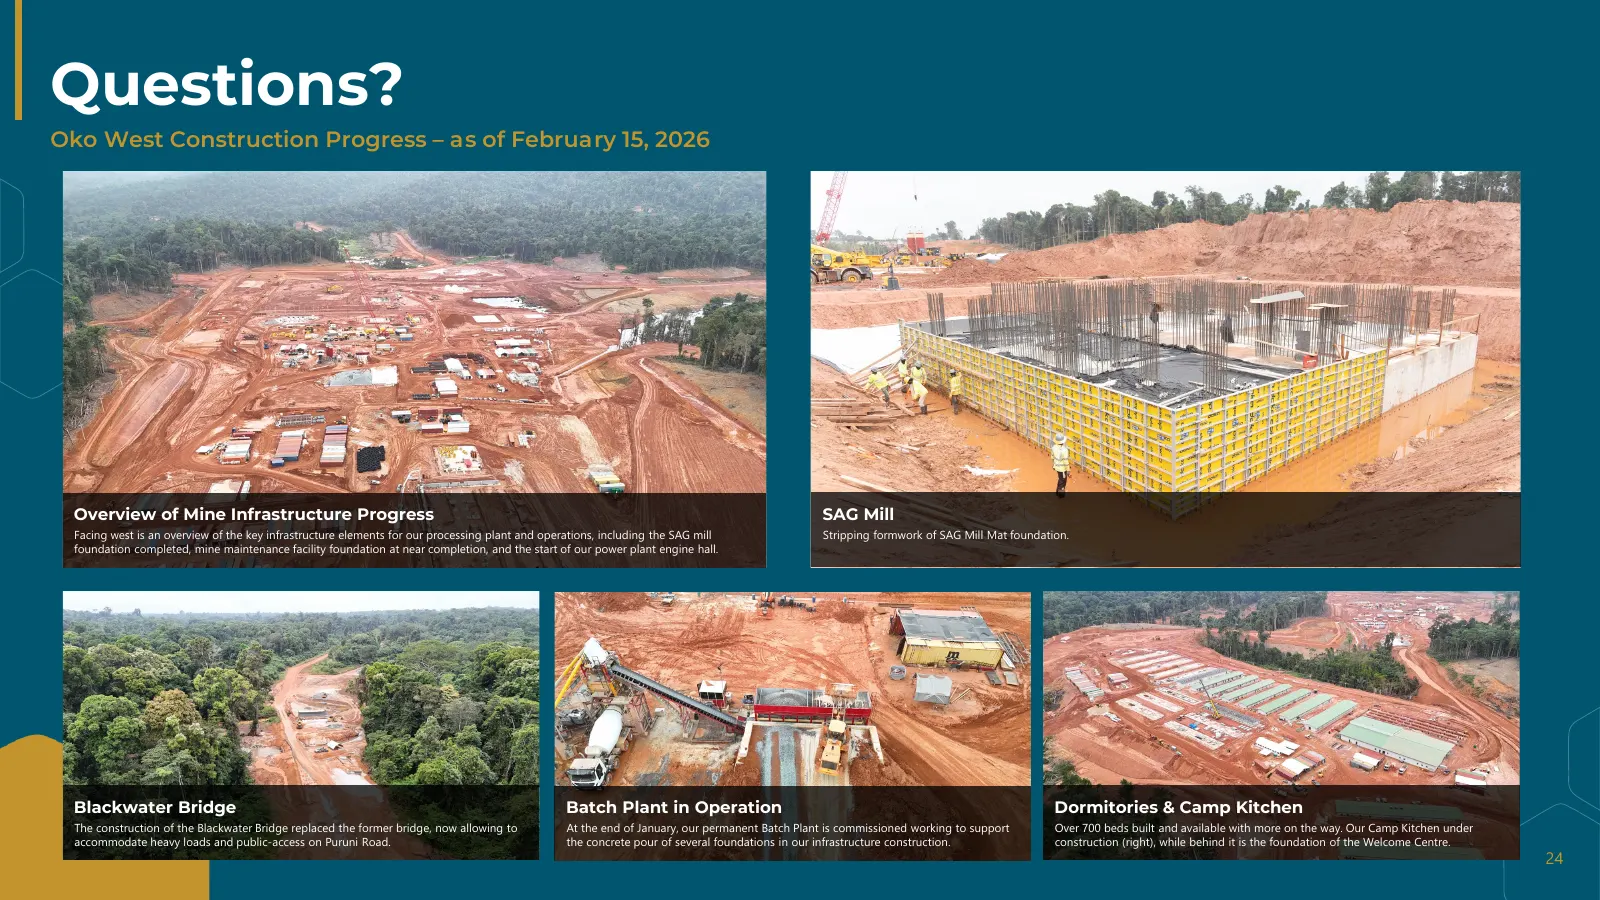
Slide 24: Questions? Oko West Construction Progress
Questions? Oko West Construction Progress – as of February 15, 2026 Overview of Mine Infrastructure Progress SAG Mill Facing west is an overview of the key infrastructure elements for our processing plant and operations, including the SAG mill Stripping formwork of SAG Mill Mat foundation. foundatio
Slide 25: Thank you for joining us today!
TSX: GMIN | OTCOQX: GMINF GMIN.GOLD Thank you for joining us today! INVESTOR RELATIONS Jean-François Lemonde Vice President, Investor Relations Phone: 514.299.4926 Email: jflemonde@gmin.gold
Slide 26: Appendix – Additional Information
Appendix – Additional Information 26
Slide 27: Q4 25 AISC to All-In-Cost Reconciliation
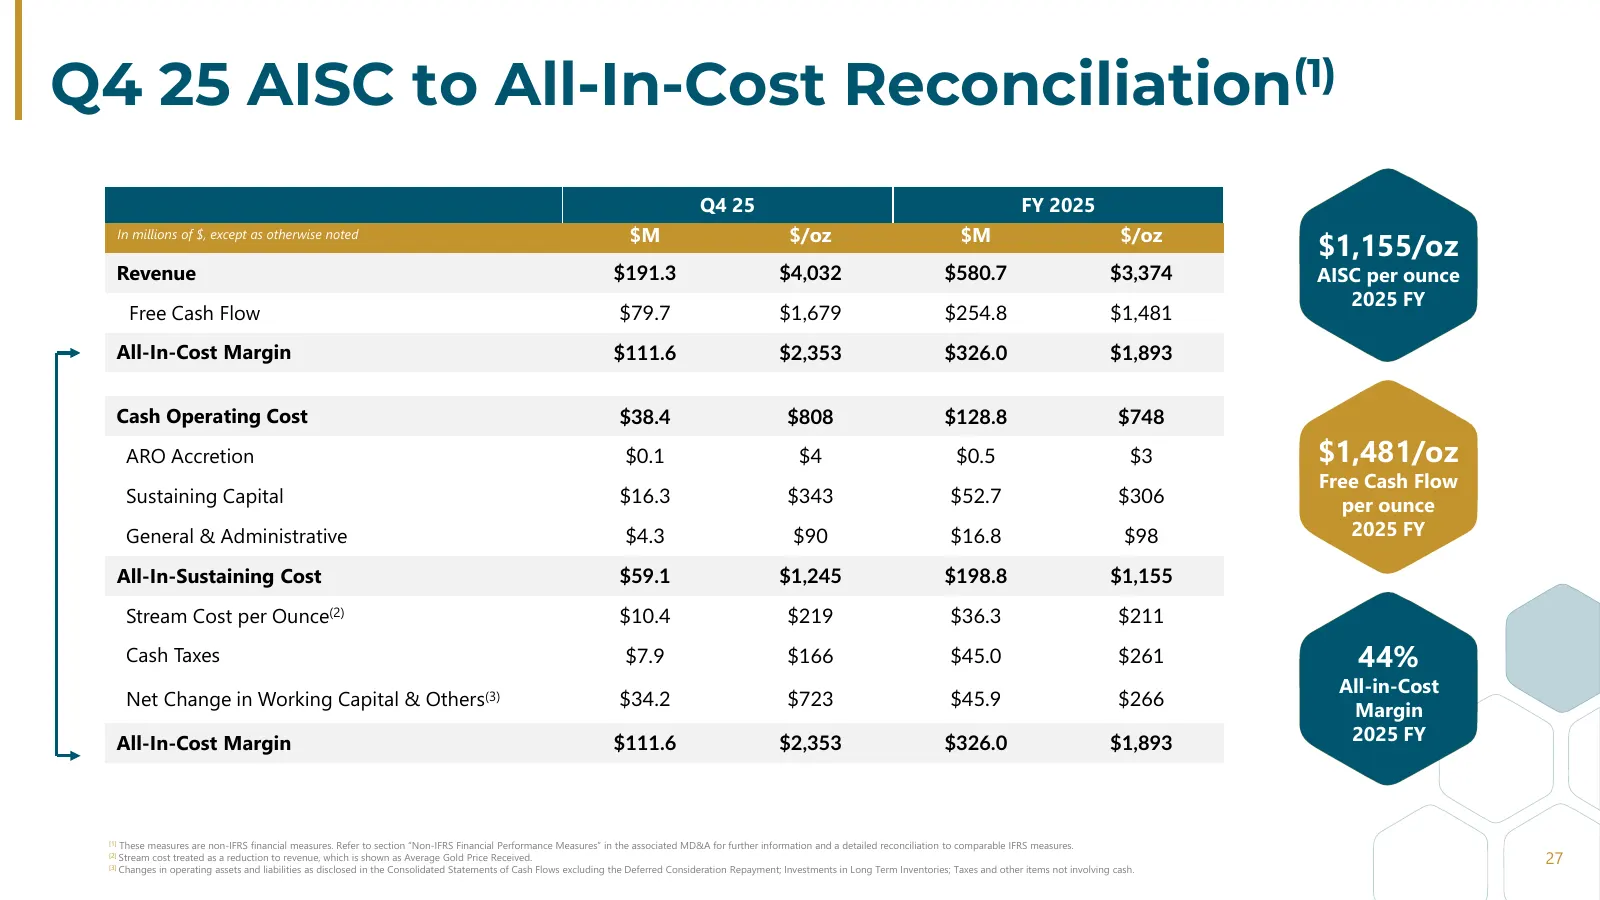
Q4 25 AISC to All-In-Cost Reconciliation(1) Q4 25 FY 2025 $M $/oz $M $/oz $1,155/oz In millions of $, except as otherwise noted Revenue $191.3 $4,032 $580.7 $3,374 AISC per ounce 2025 FY Free Cash Flow $79.7 $1,679 $254.8 $1,481 All-In-Cost Margin $111.6 $2,353 $326.0 $1,893 Cash Operating Cost $38.
Slide 28: Q4 25 AISC to Cost of Sales Reconciliation
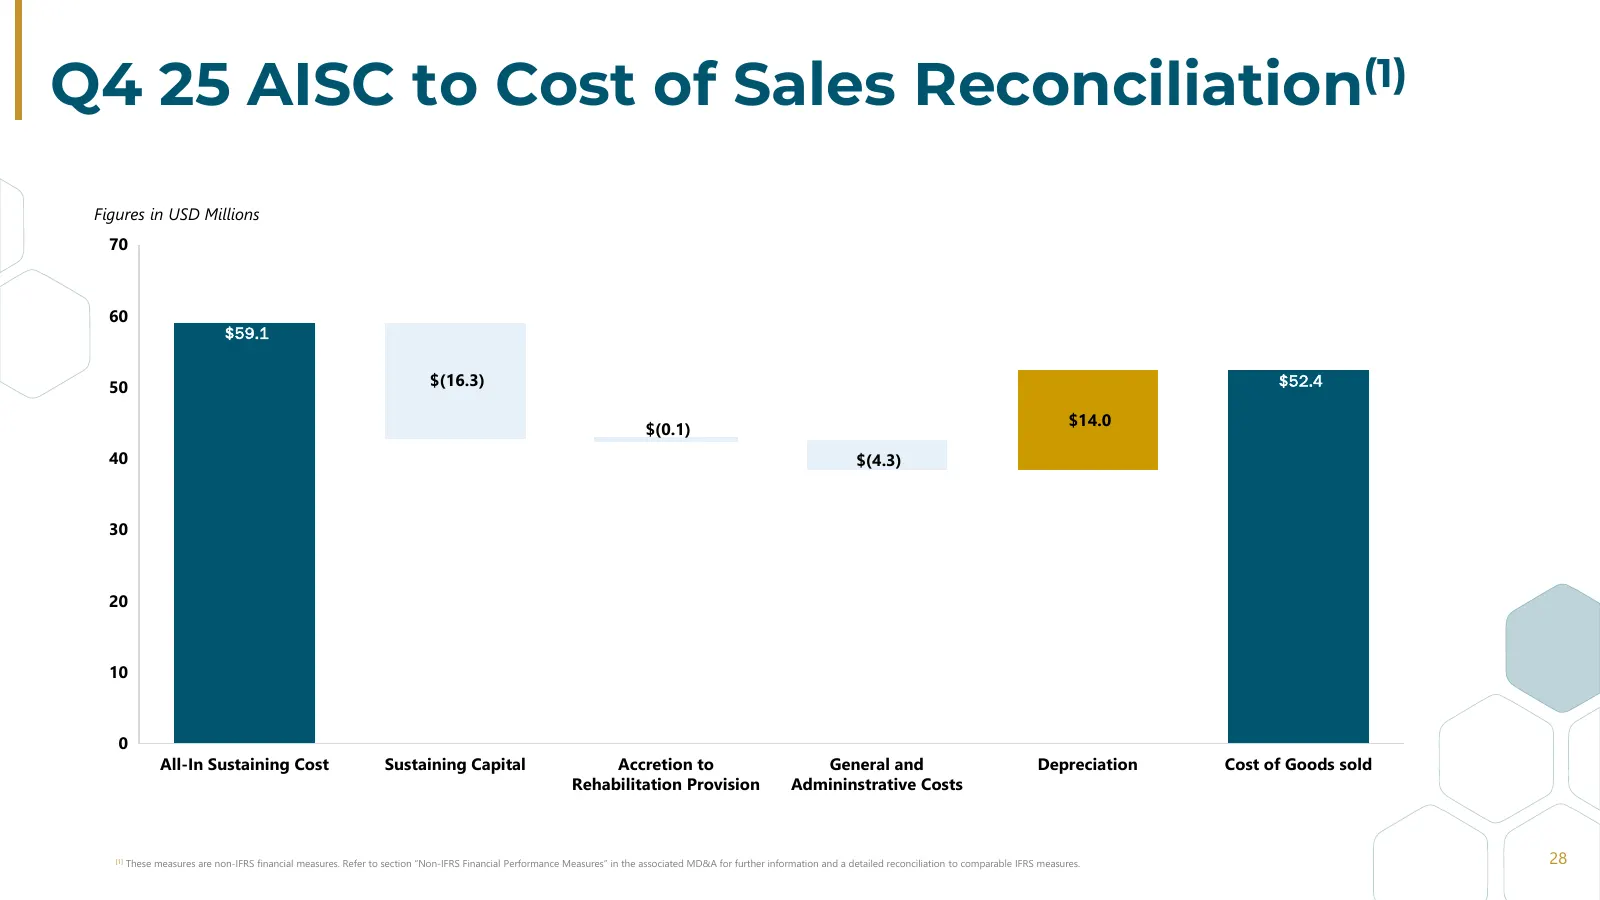
Q4 25 AISC to Cost of Sales Reconciliation(1) Figures in USD Millions 70 60 $59.1 50 $(16.3) $52.4 $14.0 $(0.1) 40 $(4.3) 30 20 10 0 All-In Sustaining Cost Sustaining Capital Accretion to General and Depreciation Cost of Goods sold Rehabilitation Provision Admininstrative Costs [1] These measures ar
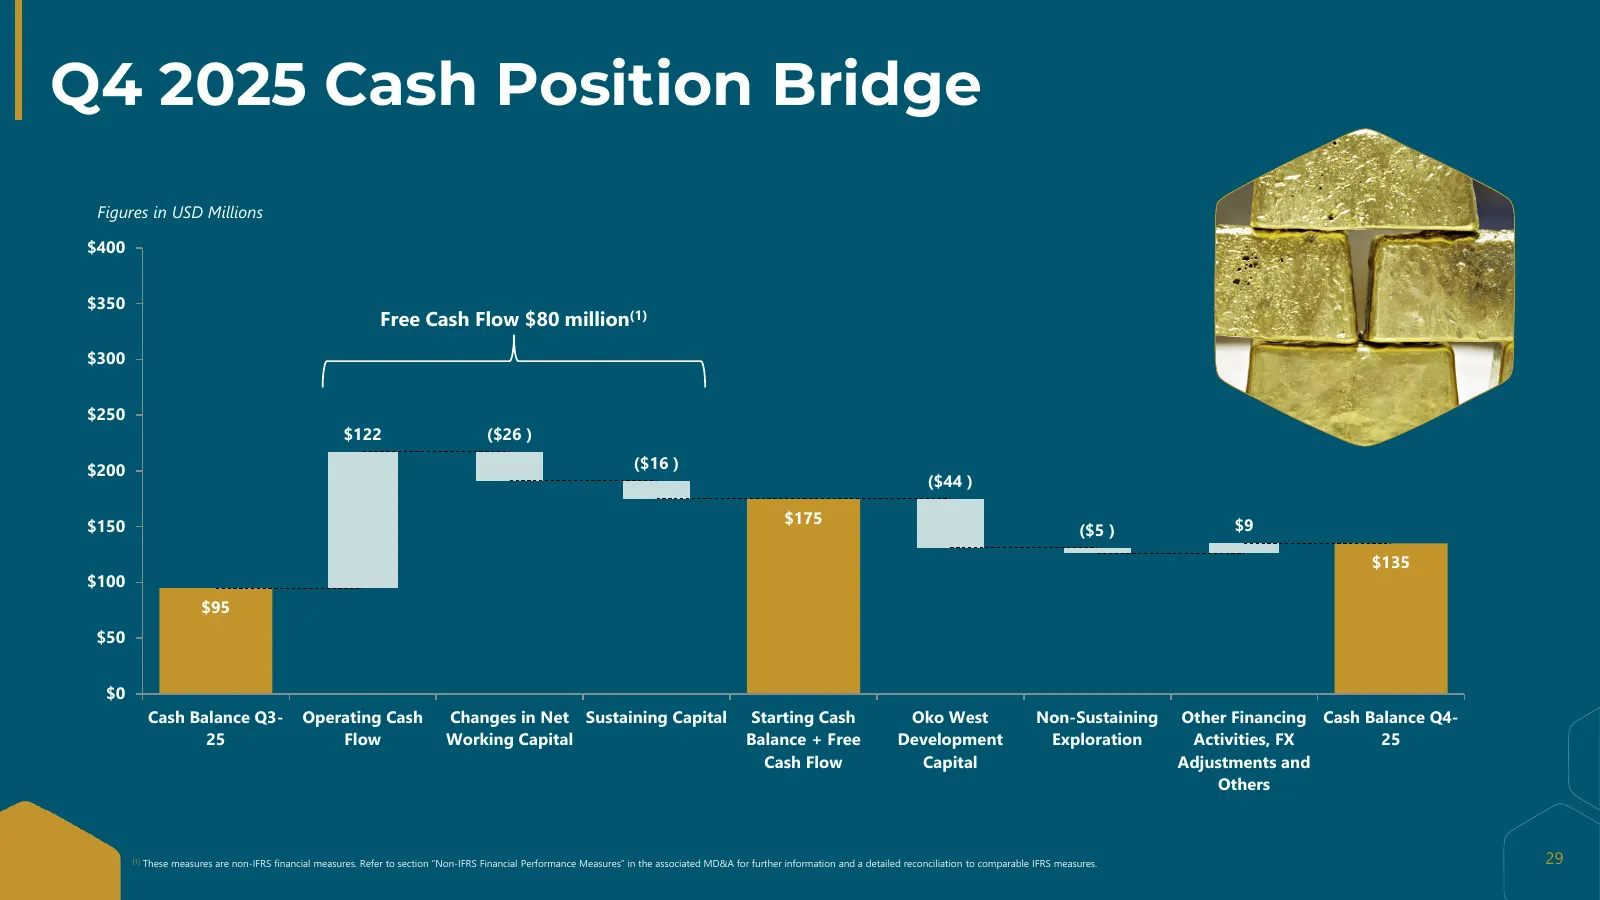
Slide 29: Q4 2025 Cash Position Bridge
Q4 2025 Cash Position Bridge Figures in USD Millions $400 $350 Free Cash Flow $80 million(1) $300 $250 $122 ($26 ) $200 ($16 ) ($44 ) $150 $175 $9 ($5 ) $135 $100 $95 $50 $0 Cash Balance Q3- Operating Cash Changes in Net Sustaining Capital Starting Cash Oko West Non-Sustaining Other Financing Cash B
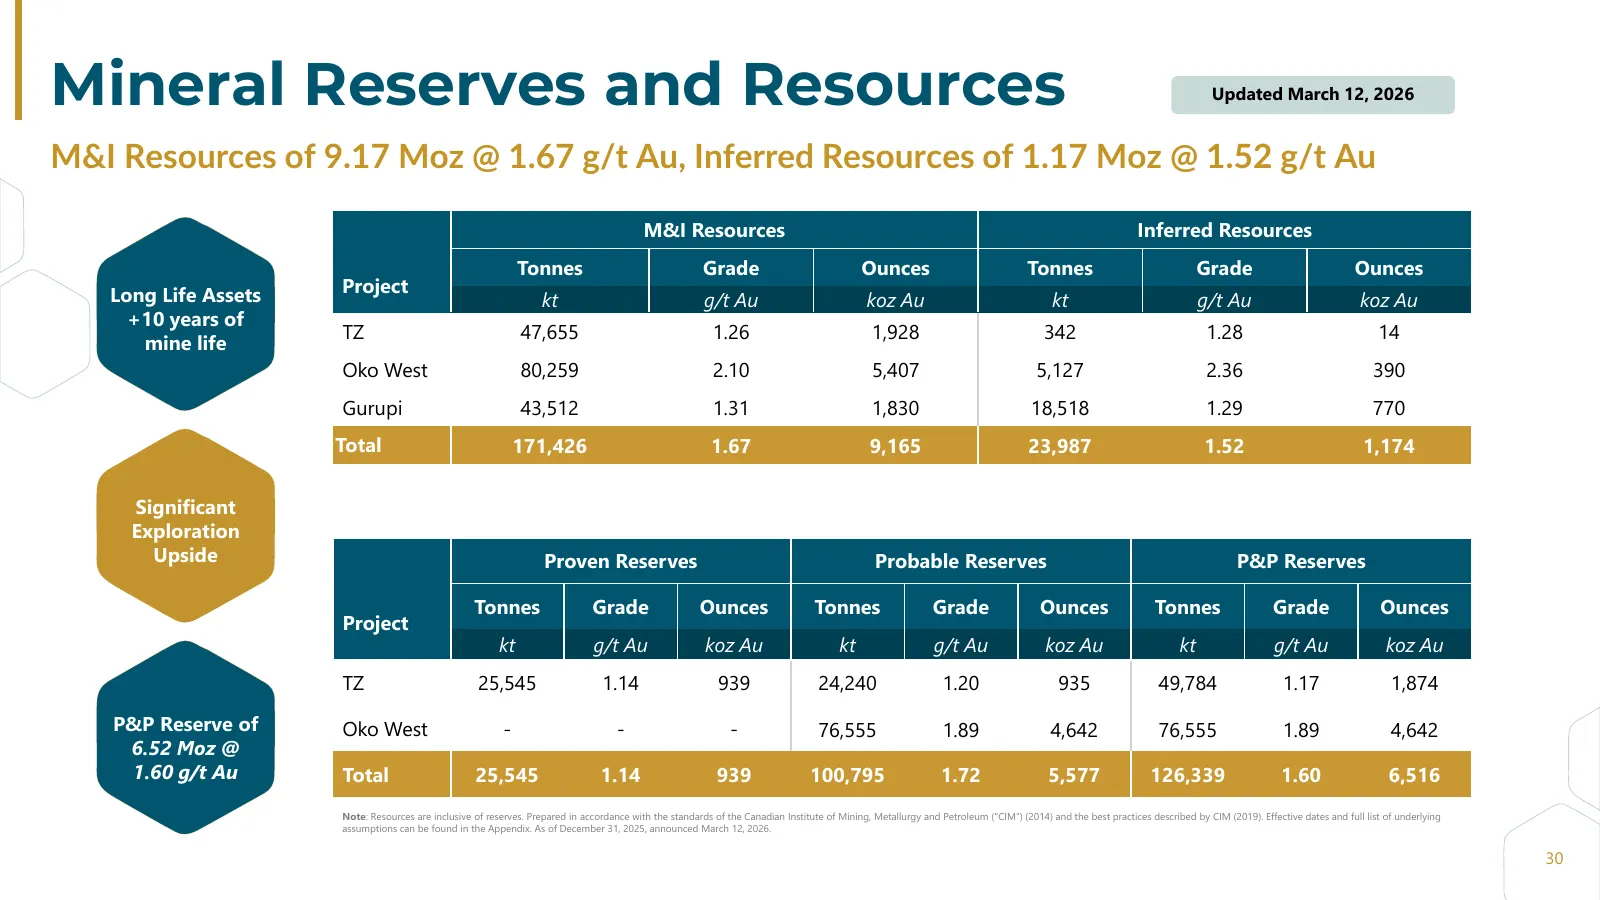
Slide 30: Mineral Reserves and Resources
Mineral Reserves and Resources Updated March 12, 2026 M&I Resources of 9.17 Moz @ 1.67 g/t Au, Inferred Resources of 1.17 Moz @ 1.52 g/t Au M&I Resources Inferred Resources Tonnes Grade Ounces Tonnes Grade Ounces Long Life Assets Project kt g/t Au koz Au kt g/t Au koz Au +10 years of TZ 47,655 1.26
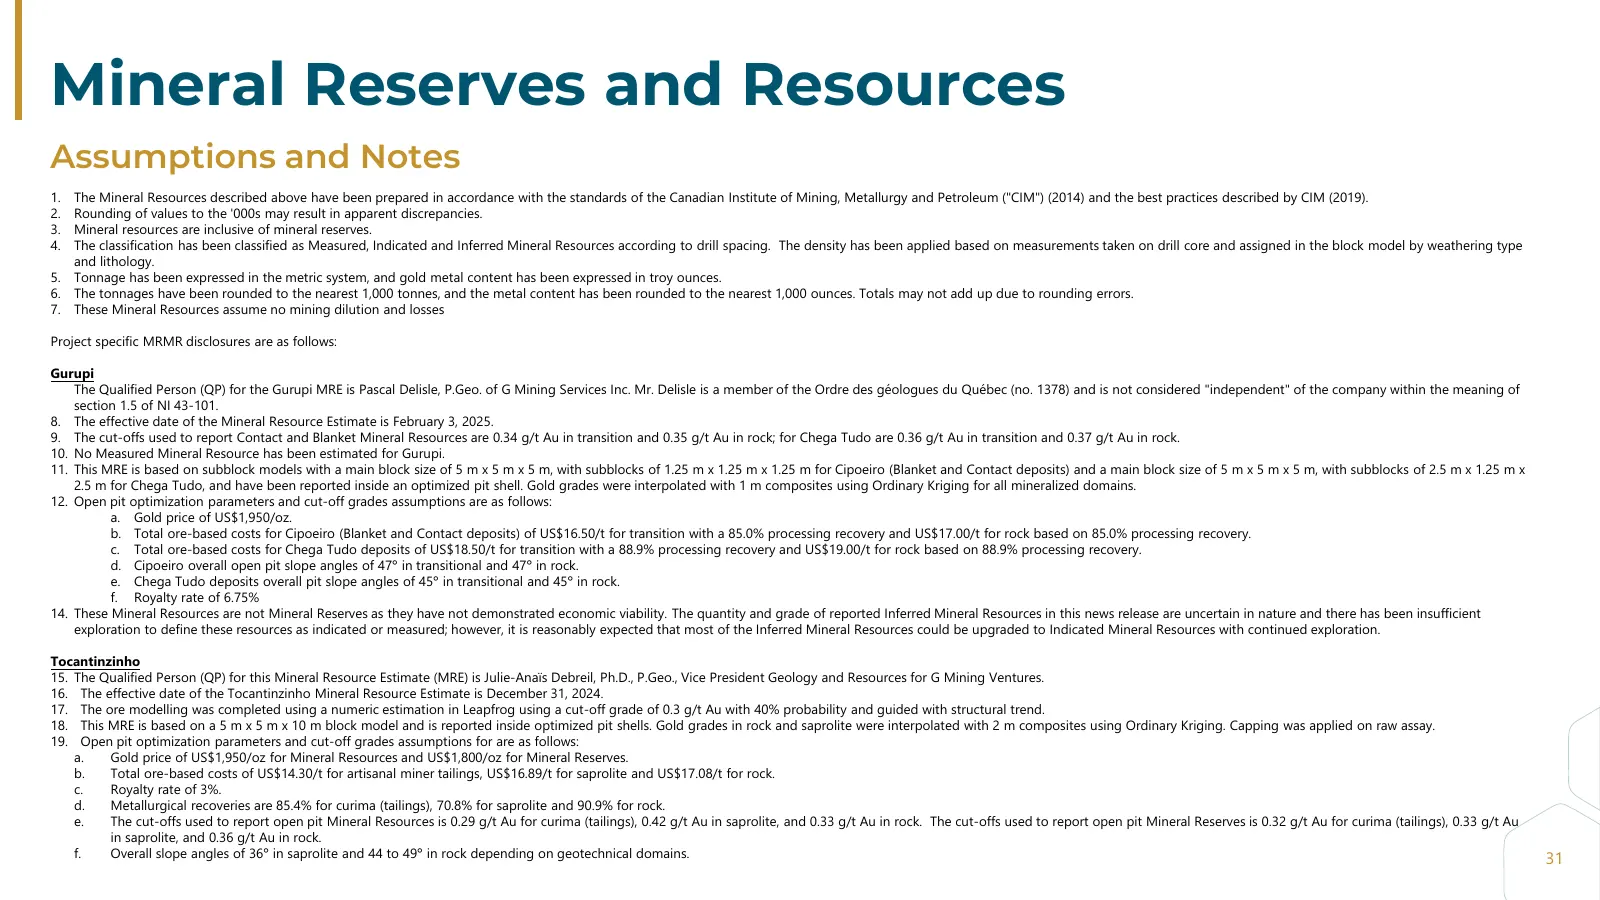
Slide 31: Mineral Reserves and Resources – Assumptions and Notes
Mineral Reserves and Resources Assumptions and Notes 1. The Mineral Resources described above have been prepared in accordance with the standards of the Canadian Institute of Mining, Metallurgy and Petroleum ("CIM") (2014) and the best practices described by CIM (2019). 2. Rounding of values to the
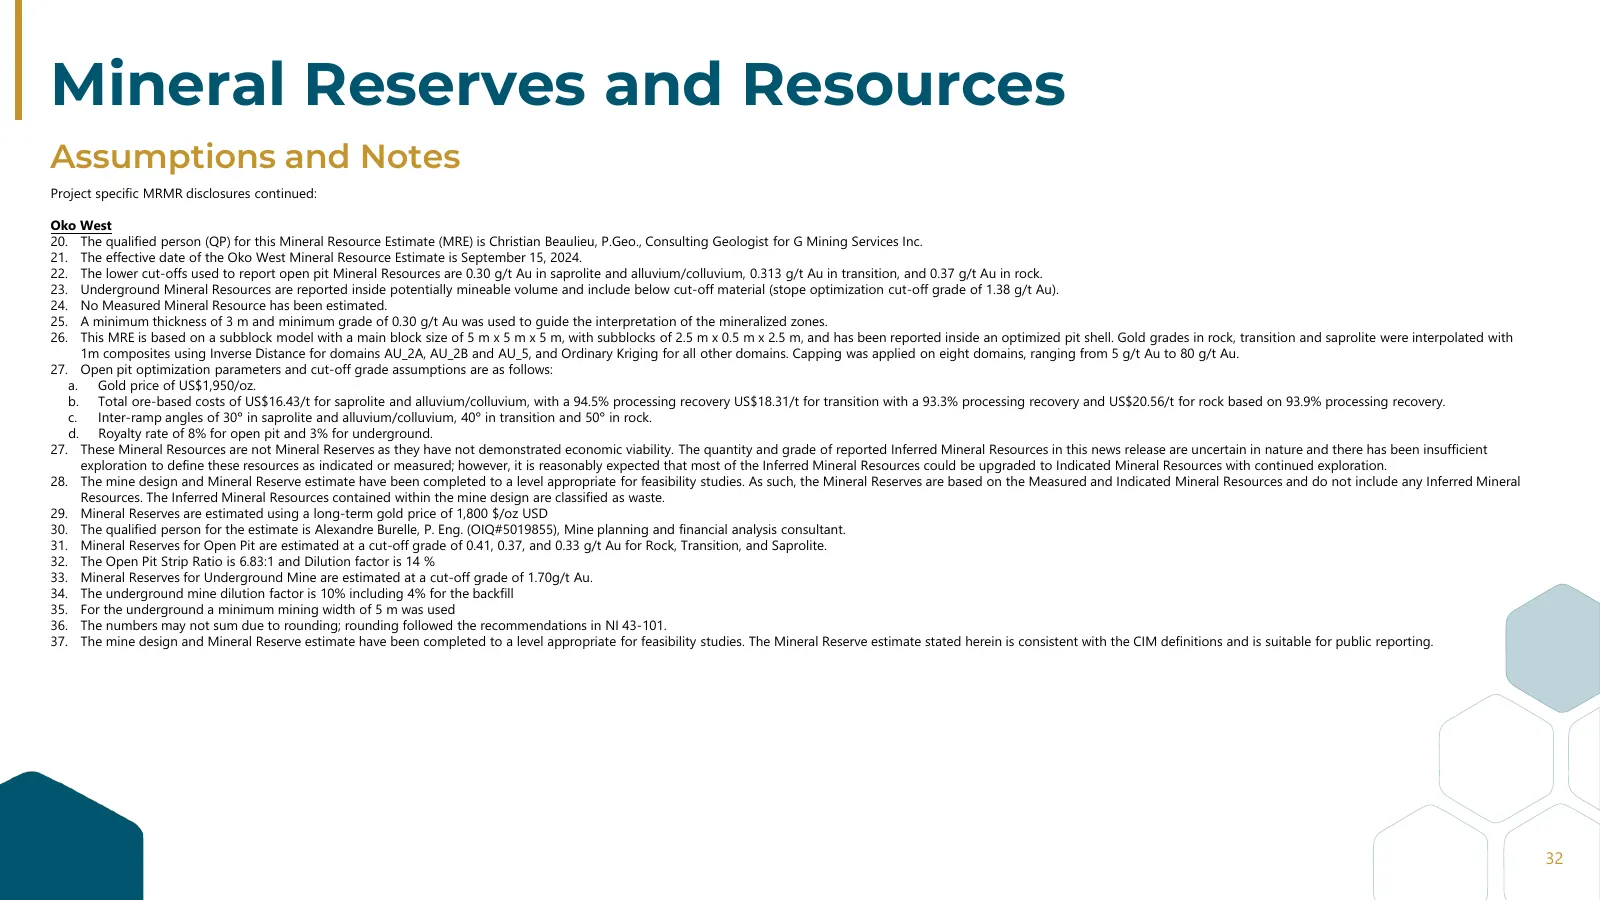
Slide 32: Mineral Reserves and Resources – Assumptions and Notes
Mineral Reserves and Resources Assumptions and Notes Project specific MRMR disclosures continued: Oko West 20. The qualified person (QP) for this Mineral Resource Estimate (MRE) is Christian Beaulieu, P.Geo., Consulting Geologist for G Mining Services Inc. 21. The effective date of the Oko West Mine
Source: company website
More decks from G Mining Ventures Corp
 Q3 2026 Earnings Presentation25 slides · Nov 13, 2026
 Q2 2026 Earnings Presentation27 slides · Aug 13, 2026
 Q1 2026 Earnings Presentation27 slides · May 14, 2026
 Q3 2025 Earnings Presentation36 slides · Nov 13, 2025
 Q2 2025 Earnings Presentation31 slides · Aug 14, 2025
 Q1 2025 Earnings Presentation34 slides · May 15, 2025