EPIC Suisse Ltd. · SIX:EPIC
EPIC Suisse — H1 2022 Earnings Presentation
33 slides from EPIC Suisse's earnings presentation, September 2022
Slide 1: Half-year results 2022
Slide 2: Disclaimer
Disclaimer This publication contains specific forward-looking statements, e.g. statements including terms like "believe", "assume", "expect", "forecast", "project", "may", "could", "might", "will" or similar expressions. Such forward-looking statements are subject to known and unknown risks, uncerta

Slide 3: Agenda
Half-year results 2022 Agenda * Market overview ¢ EPIC at aglance * Highlights * Key figures * Developments * Outlook DKA EPIC SUISSE
Slide 4: Switzerland macroeconomic outlook
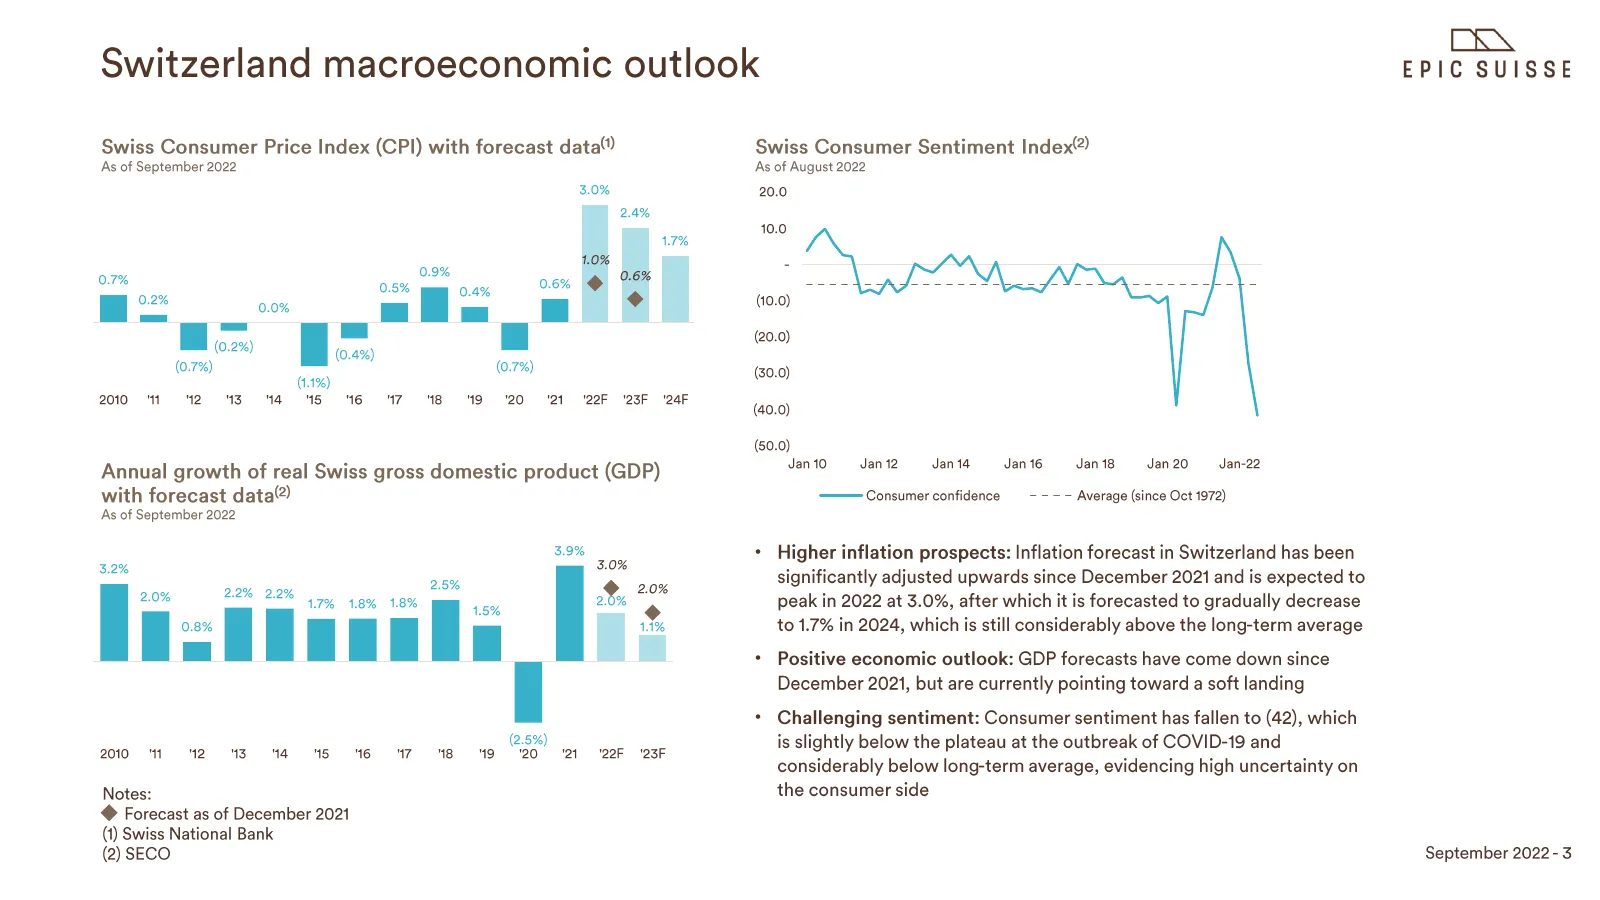
Switzerland macroeconomic outlook Swiss Consumer Price Index (CPI) with forecast data As of September 2022 3.0% 2010 121314 M5 MGB M9202 2F '23F '24F Annual growth of real Swiss gross domestic product (GDP) with forecast data?) As of September 2022 3.9% 3.2% 3.0% 2.5% 2.0% 22% 2.2: FUT Titi me (2.5%

Slide 5: Agenda: EPIC at a glance
Half-year results 2022 Agenda ¢ Market overview * EPIC at a glance * Highlights * Key figures * Developments * Outlook DKA EPIC SUISSE
Slide 6: EPIC's 1.5 billion CHF portfolio by June 2022
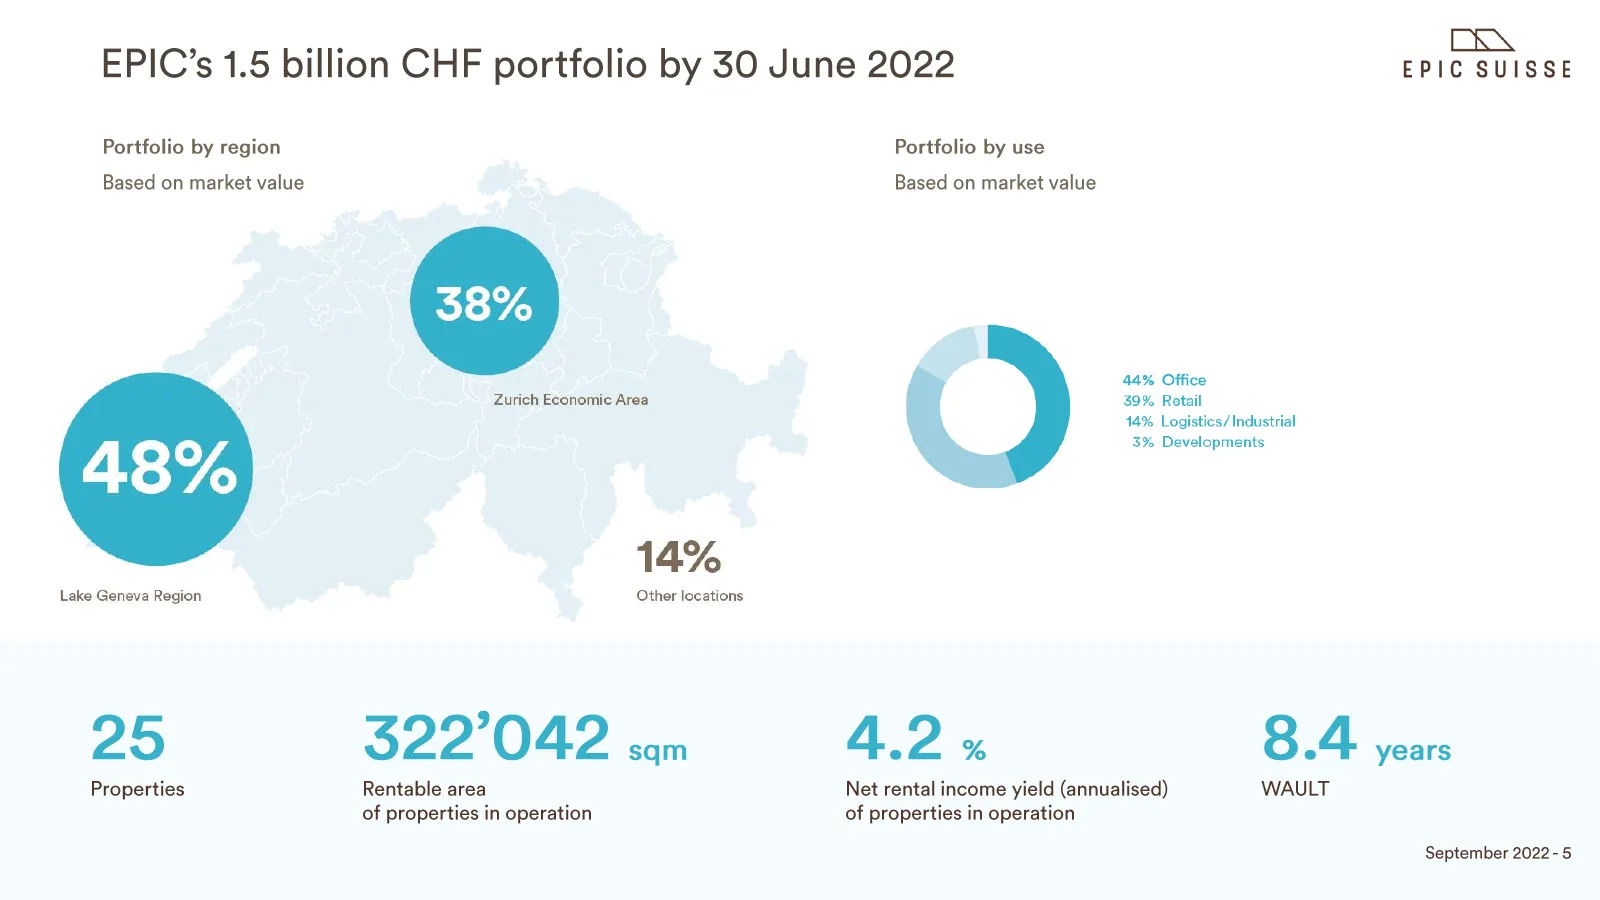
me EPIC’s 1.5 billion CHF portfolio by 30 June 2022 EPIC SUISSE Portfolio by region Based on market value 38% Zurich Economic Area 14% Lake Geneva Region Other locations 25 3227042 cam Properties Rentable area of properties in operation Portfolio by use Based on market value 44% Office 39% Retail 14

Slide 7: Agenda: Highlights
Half-year results 2022 Agenda ¢ Market overview ¢ EPIC at aglance * Highlights * Key figures * Developments * Outlook DKA EPIC SUISSE
Slide 8: Highlights of H1 2022
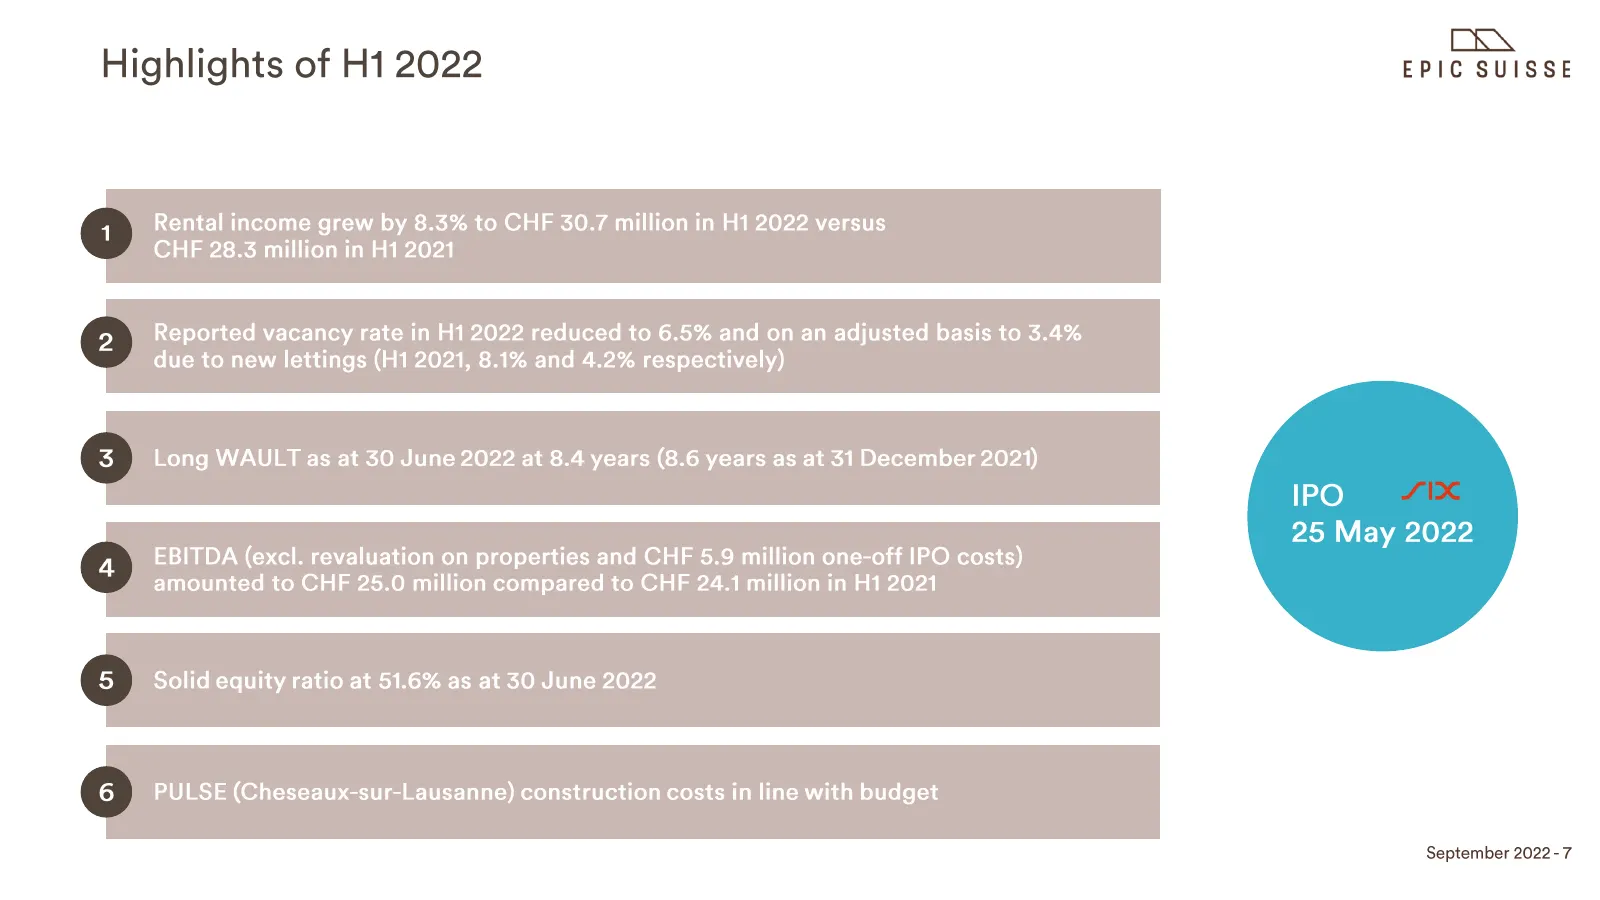
Highlights of H1 2022 BRN EPIC SUISSE IPO} 25 May 2022 September 2022-7
Slide 9: Agenda: Key figures
Half-year results 2022 Agenda ¢ Market overview ¢ EPIC at aglance * Highlights * Key figures * Developments * Outlook DKA EPIC SUISSE
Slide 10: Portfolio key figures
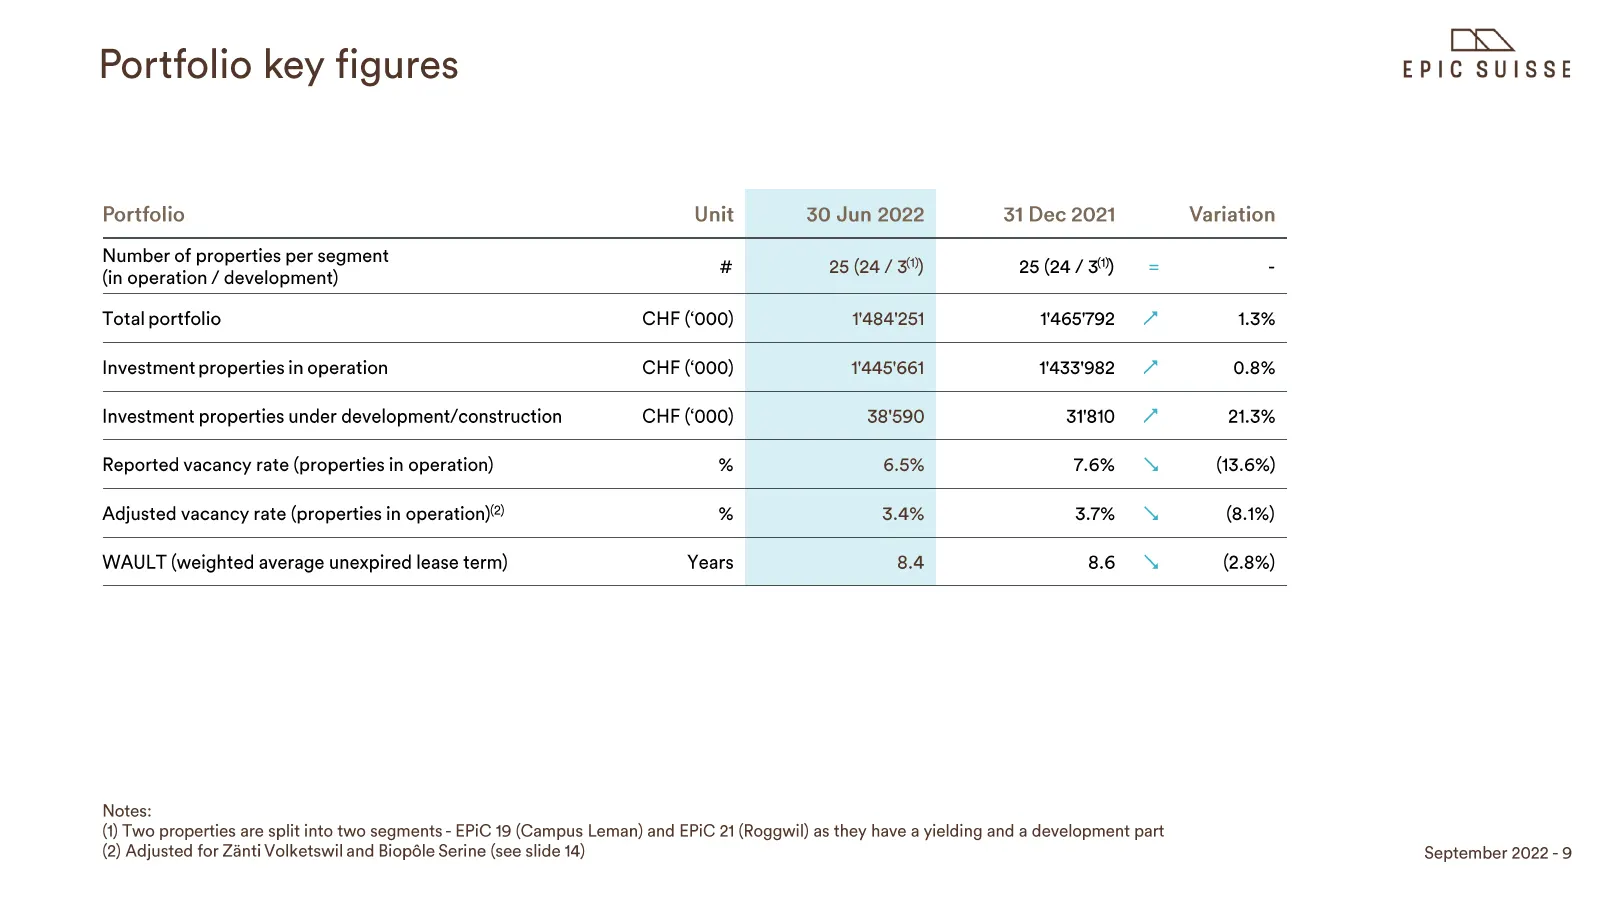
Portfolio key figures Portfolio Unit 30 Jun 2022 31 Dec 2021 Variation inf perigee + Be) we Total portfolio CHF (‘000) 1484'251 1465792 7 1.3% Investment properties in operation CHF (‘000) 1'445'661 1433'982, 7 0.8% Investment properties under development/construction CHF (‘000) 38'590 31810 7 21.3%
Slide 11: Balanced portfolio
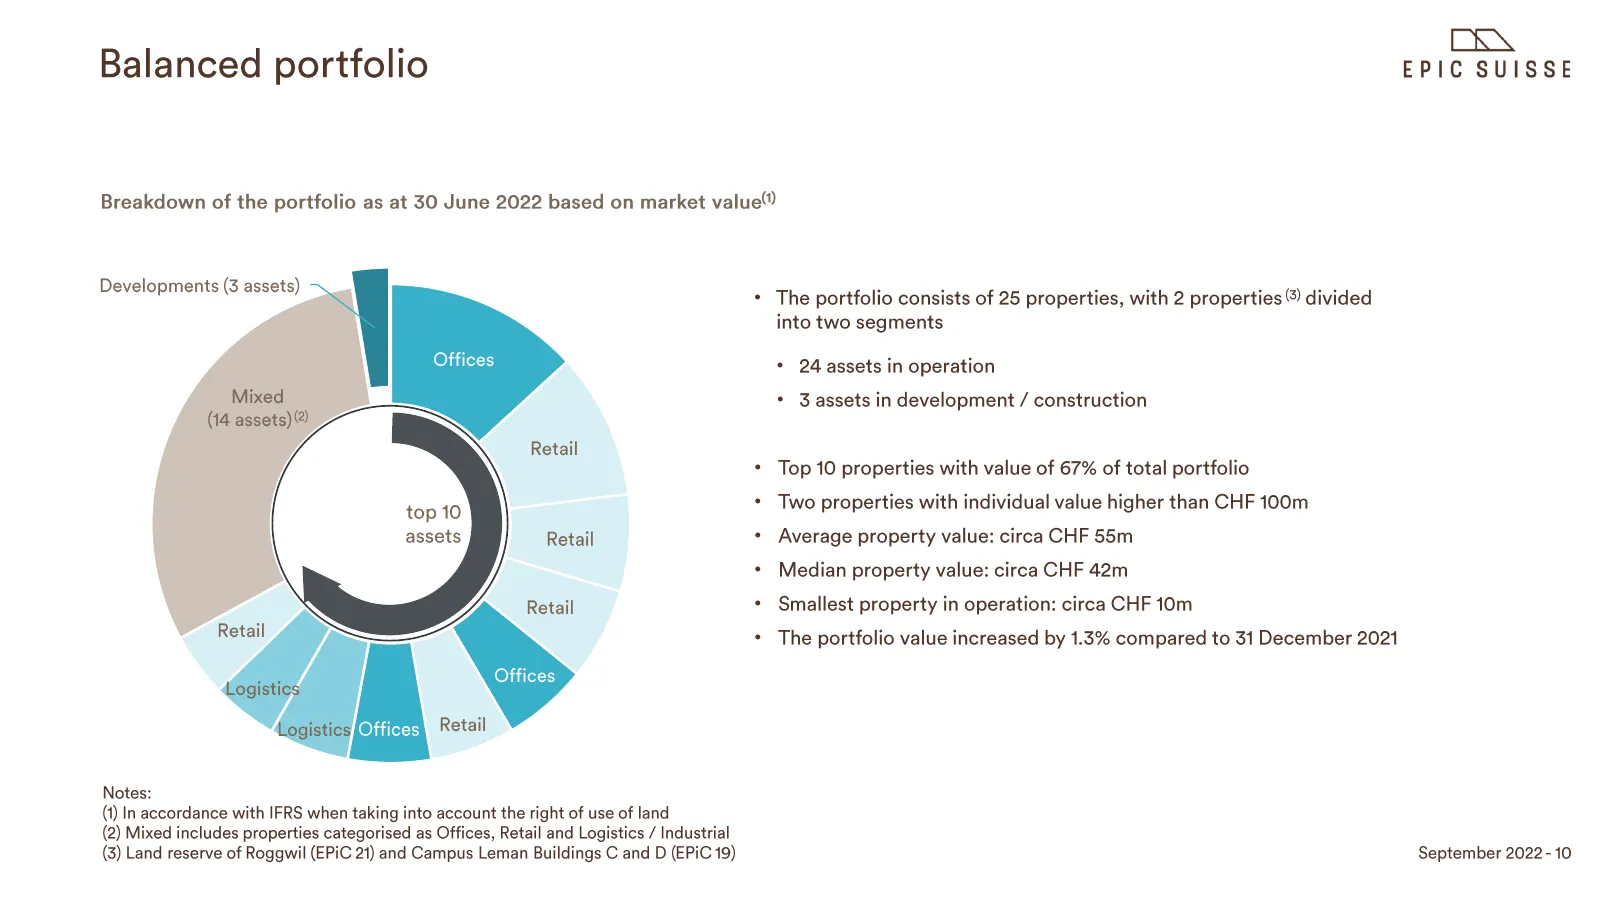
Balanced portfolio Breakdown of the portfolio as at 30 June 2022 based on market value” Developments (3 assets) Retail top 10 assets Retail Notes: (1) In accordance with IFRS when taking into account the right of use of land (2) Mixed includes properties categorised as Offices, Retail and Logistics
Slide 12: Net revaluation gain of CHF 5.3 million in H1 2022
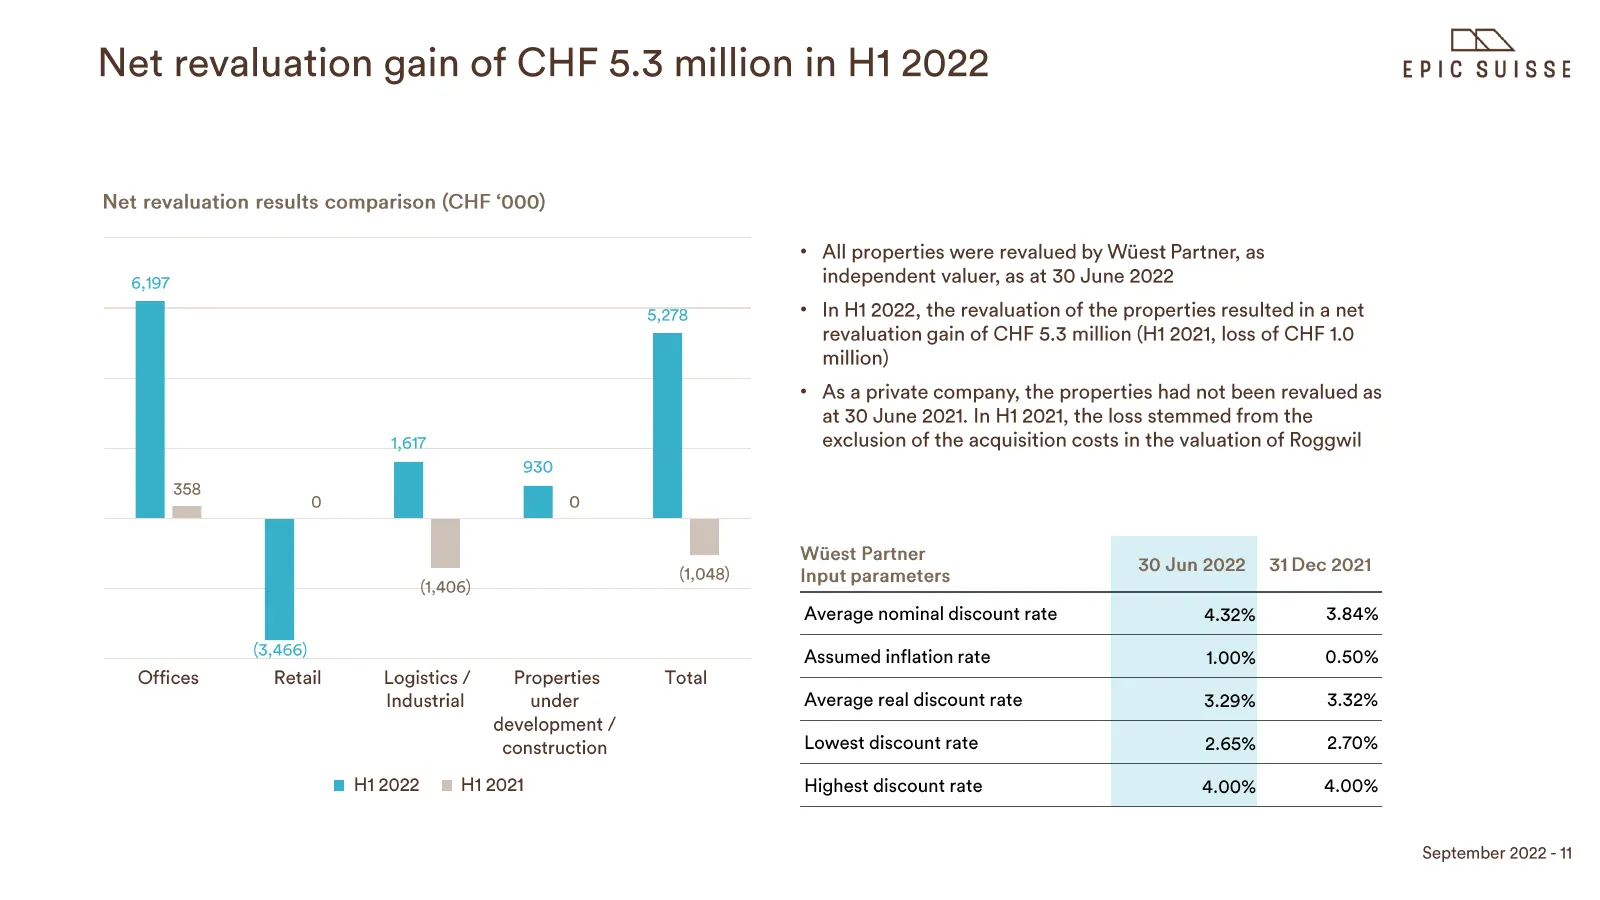
Net revaluation gain of CHF 5.3 million in H1 2022 Net revaluation results comparison (CHF ‘000) 6,197 358 Offices 1,617 930 ° | | (1,406) (3,466) Retail Logistics / Properties Industrial under development / construction m H12022 H1 2021 5,278 (1,048) Total BRN + All properties were revalued by Wies
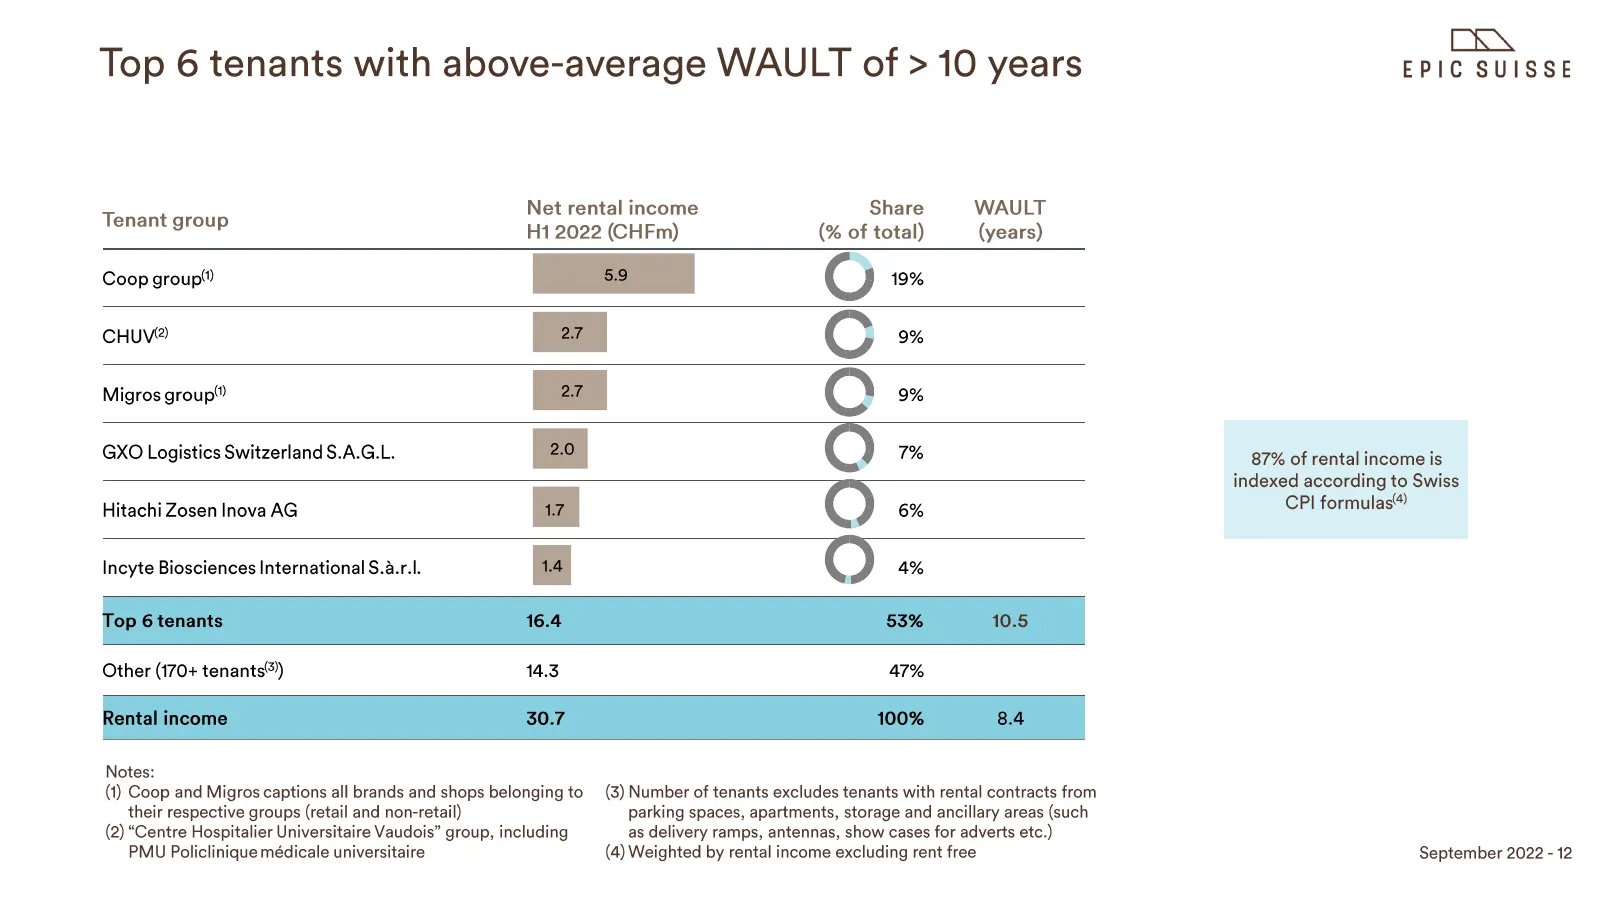
Slide 13: Top tenants with above-average WAULT
Top 6 tenants with above-average WAULT of > 10 years Net rental income Share Tenant group H1 2022 (CHFm) (% of total) WAULT (years) Coop group" 19% CHUV® 9% Migros group" GXO Logistics Switzerland S.A.G.L. Hitachi Zosen Inova AG Incyte Biosciences International S.a.r.I. 4% ay a00000 Other (170+ tena
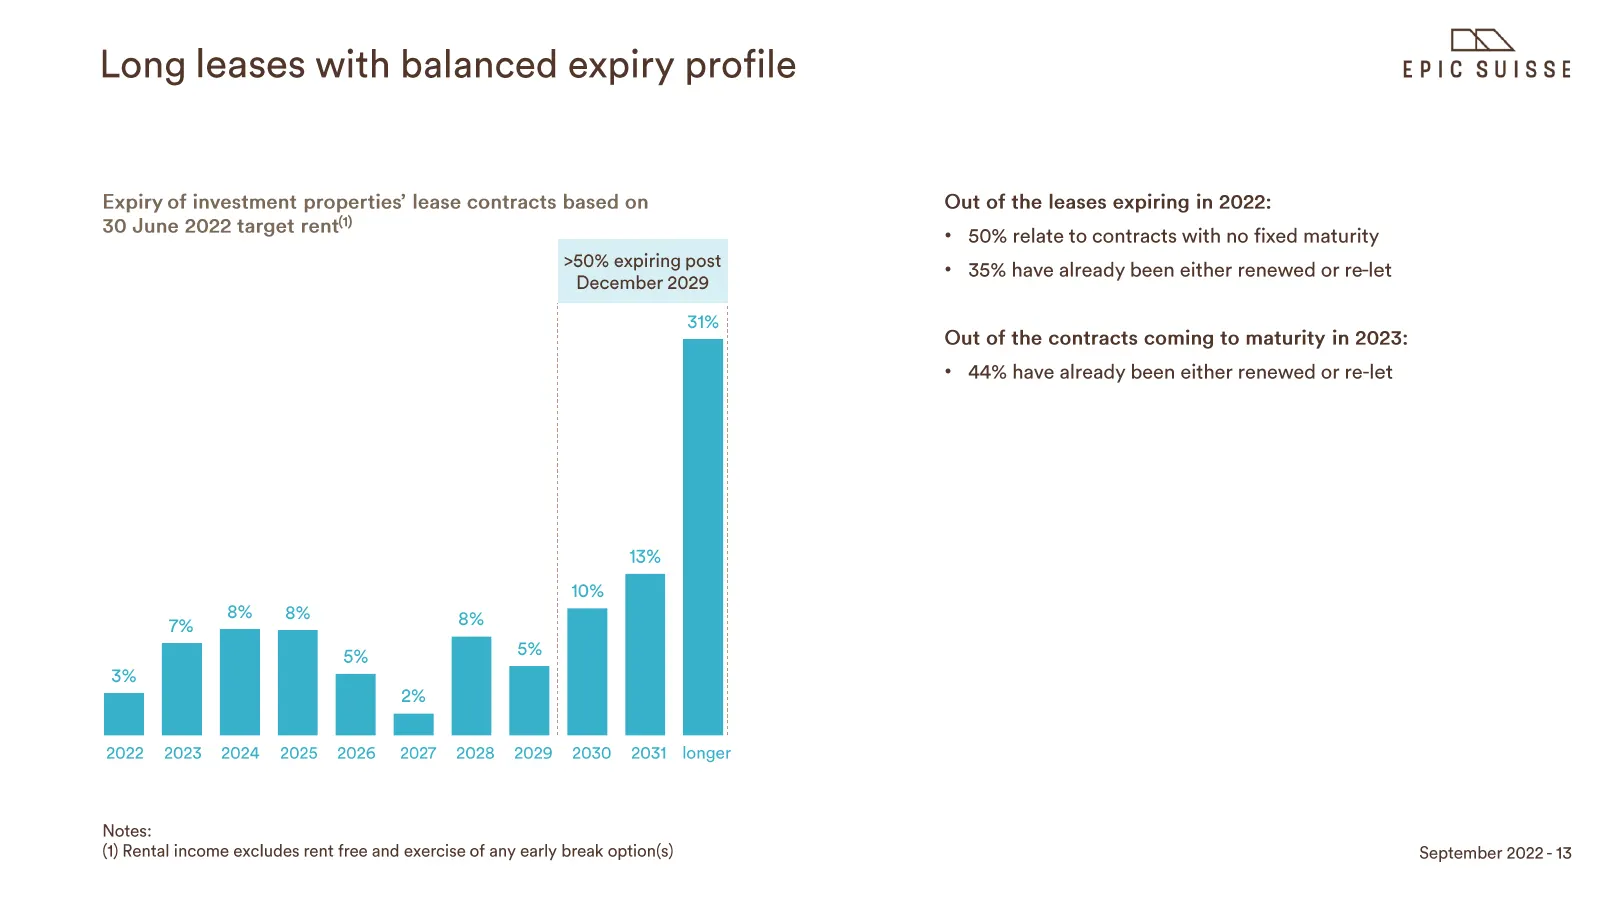
Slide 14: Long leases with balanced expiry profile
Long leases with balanced expiry profile Expiry of investment properties’ lease contracts based on 30 June 2022 target rent >50% expiring post December 2029 31% | 13% 7% 8% 10% 8% 8% 5% 5% 3% | i. | = : 2022 2023 2024 2025 2026 2027 2028 2029 2030 2031 longer Notes: (1) Rental income excludes rent f
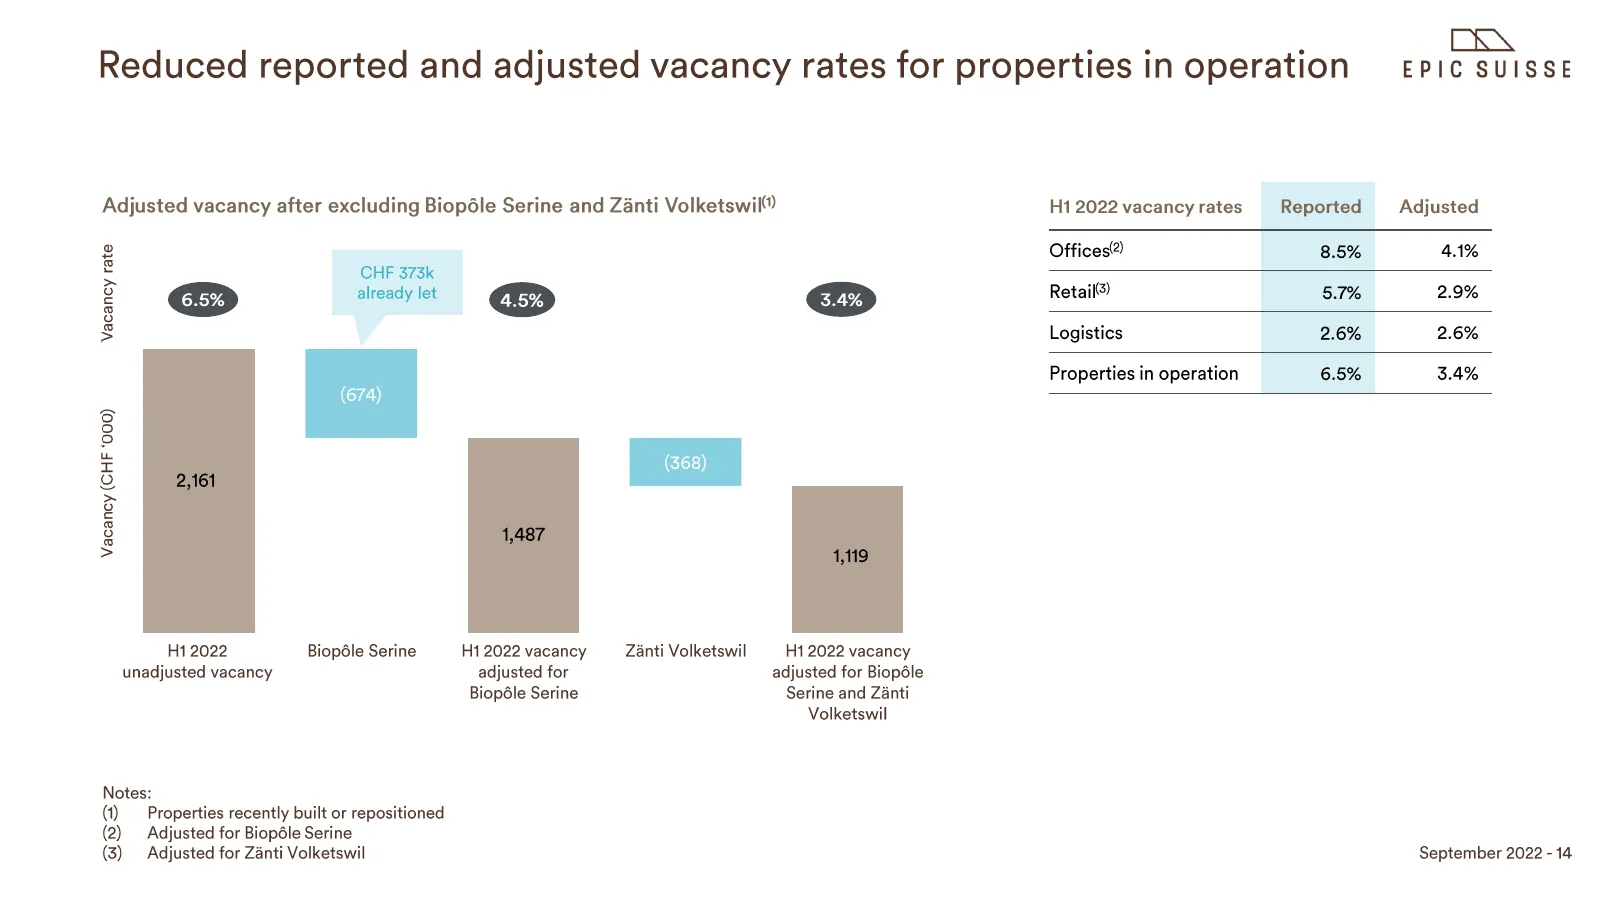
Slide 15: Reduced reported and adjusted vacancy rates
Reduced reported and adjusted vacancy rates for properties in operation Epic suisse Adjusted vacancy after excluding Biopdle Serine and Zanti Volketswil H12022vacancyrates Reported Adjusted g Offices®) 8.5% 41% > CHF 373k 8 &} already let 4.5%) &> Retail®) 5.7% 2.9% § 8 s Logistics 2.6% 2.6% Propert
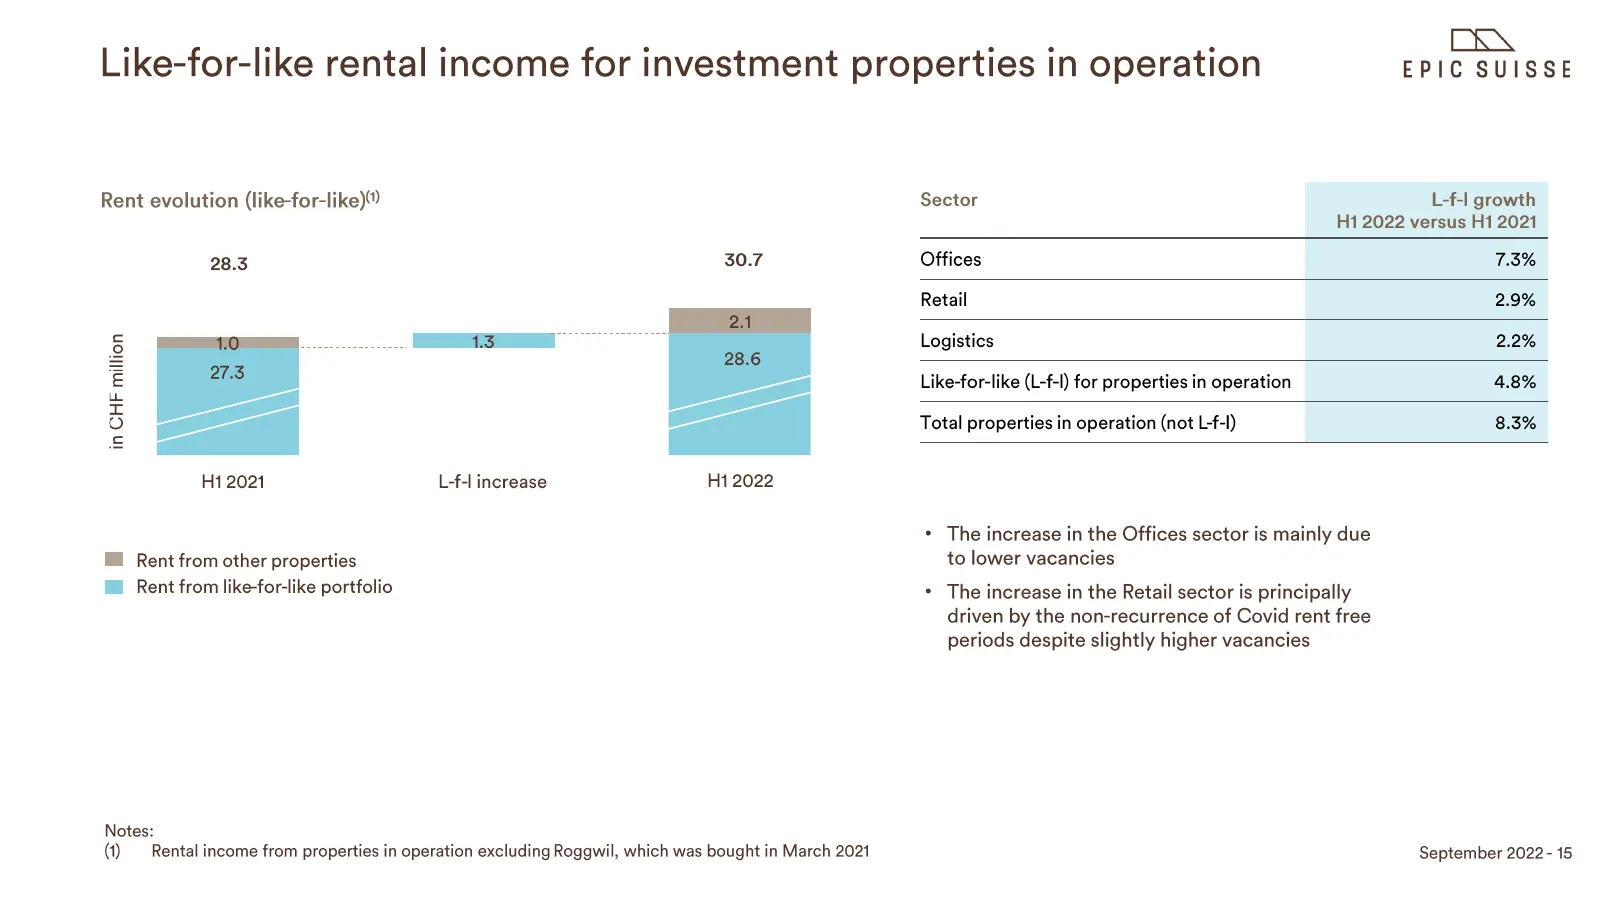
Slide 16: Like-for-like rental income for investment properties in operation
BRN Like-for-like rental income for investment properties in operation EPIC SUISSE Rent evolution (like-for-like) Sector L-f-1 growth H1 2022 versus H1 2021 28.3 30.7 Offices 7.3% Retail 2.9% 6 — Logistics 2.2% E Like-for-like (L-f-I) for properties in operation 4.8% 3 —— =| Total properties in oper
Slide 17: Balance sheet key figures
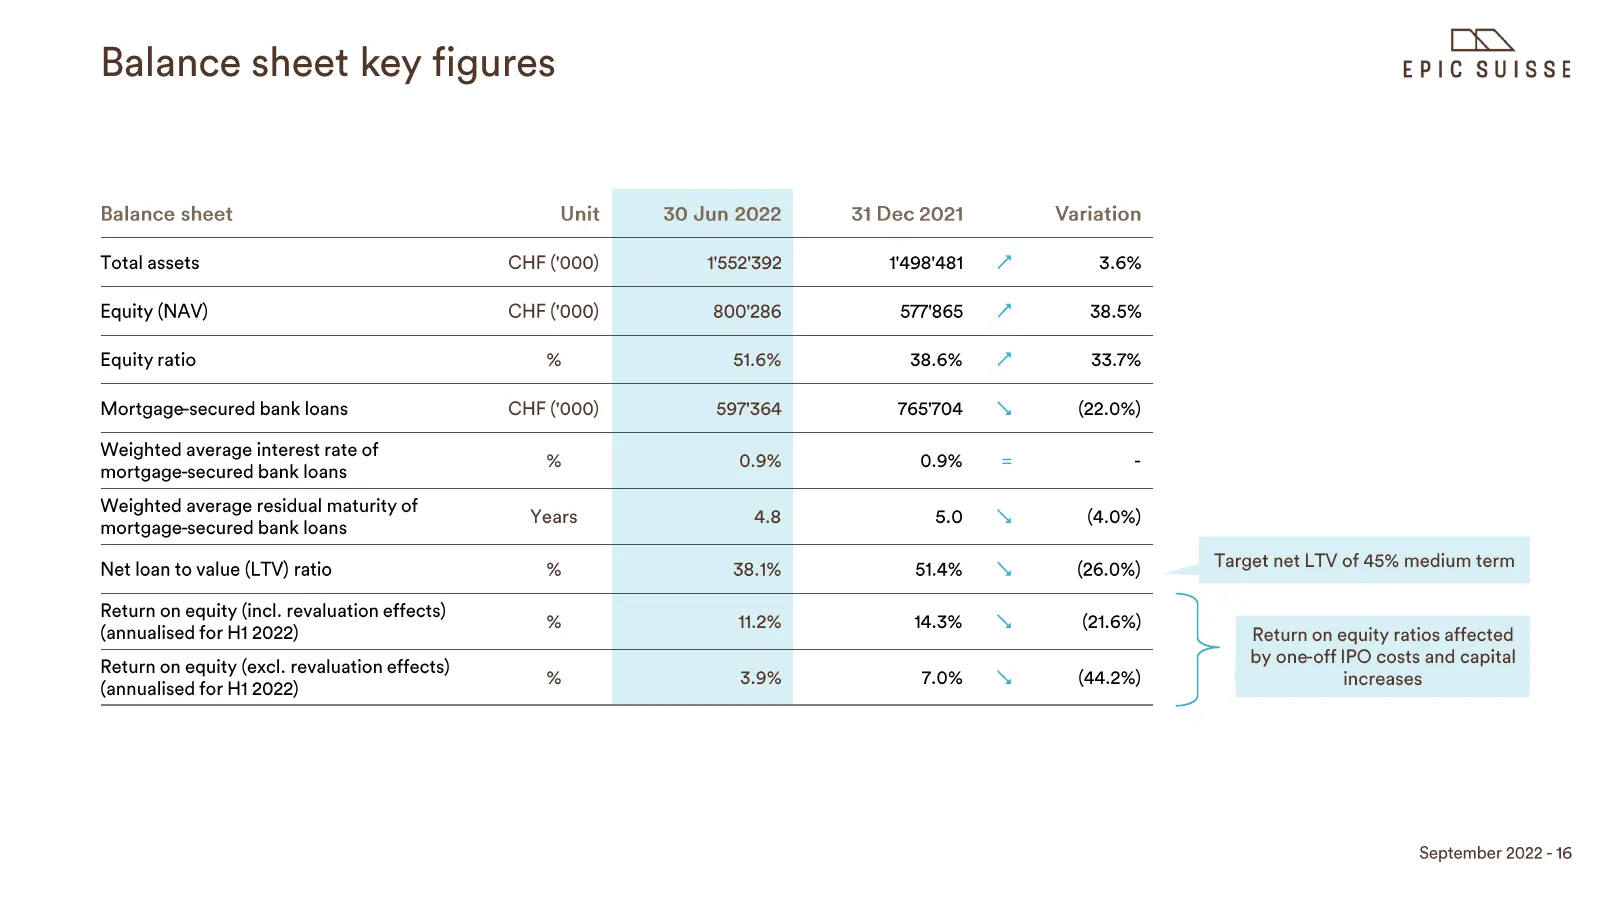
Balance sheet key figures Balance sheet Unit 30 Jun 2022 31 Dec 2021 Variation Total assets CHF ('000) 1'552'392 1'498'481 3.6% Equity (NAV) CHF ('000) 800'286 577'865 38.5% Equity ratio % 51.6% 38.6% 33.7% Mortgage-secured bank loans CHF ('000) 597'364 765'704 (22.0%) Woe ras pte ; 0s 0s : wea vera
Slide 18: NAV per share at CHF 77.47 by end of June 2022
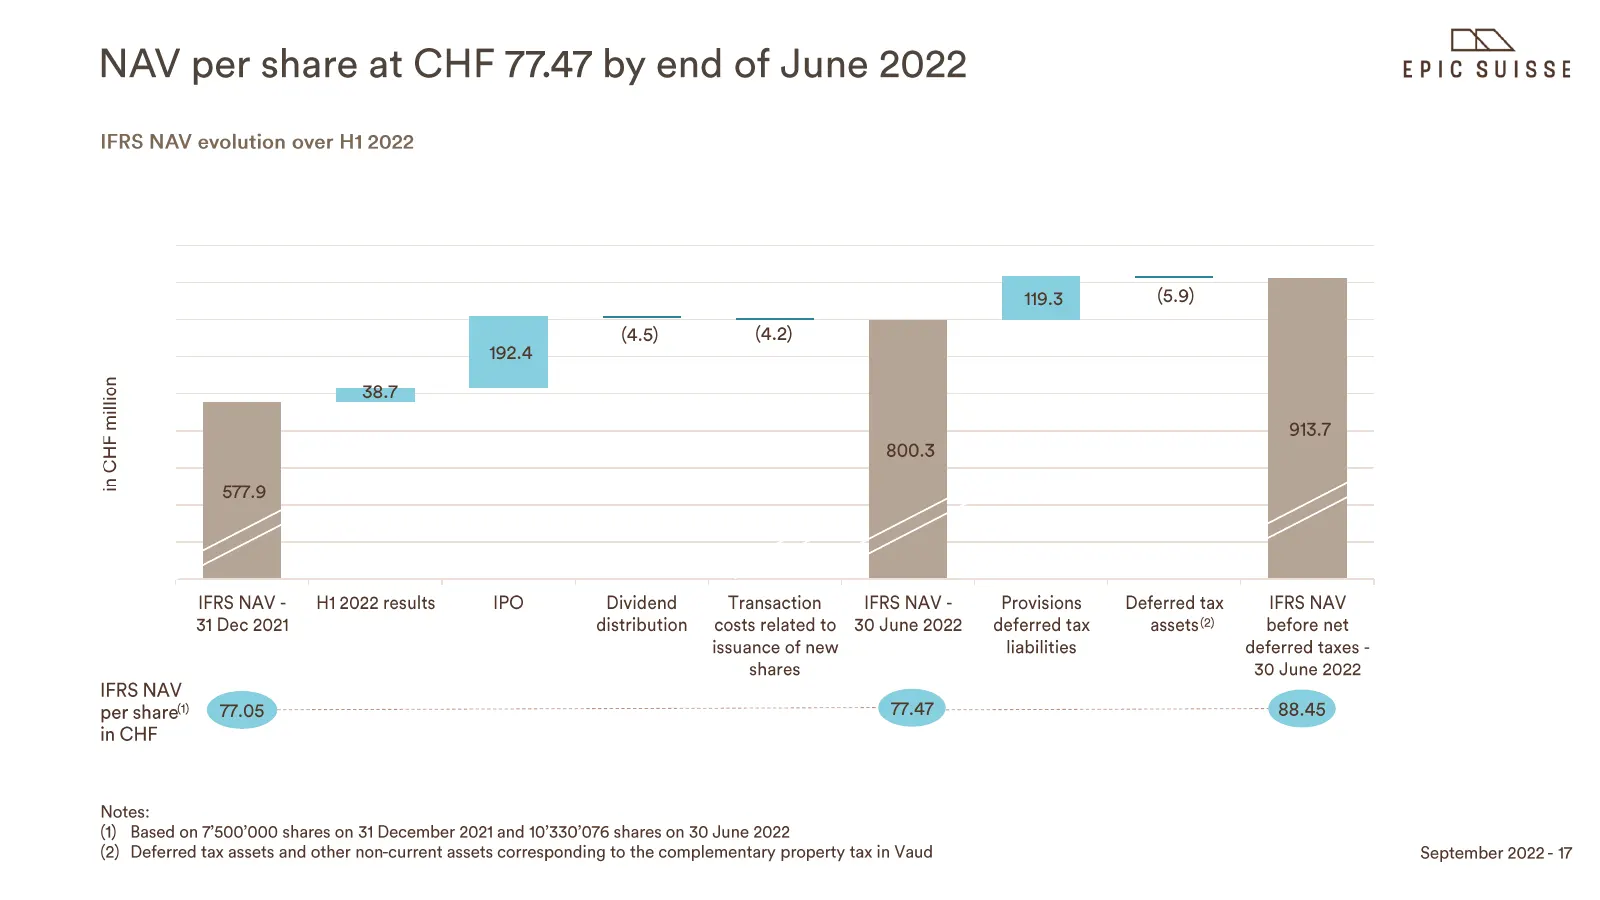
NAV per share at CHF 77.47 by end of June 2022 EpIG Suisst IFRS NAV evolution over H1 2022 = (4.5) (4.2) 38.70 in CHF million IFRS NAV- —-H12022 results IPO Dividend Transaction IFRS NAV - Provisions Deferred tax IFRS NAV 31 Dec 2021 distribution costs related to 30 June 2022 deferred tax assets) be
Slide 19: Spread maturity bank debt profile
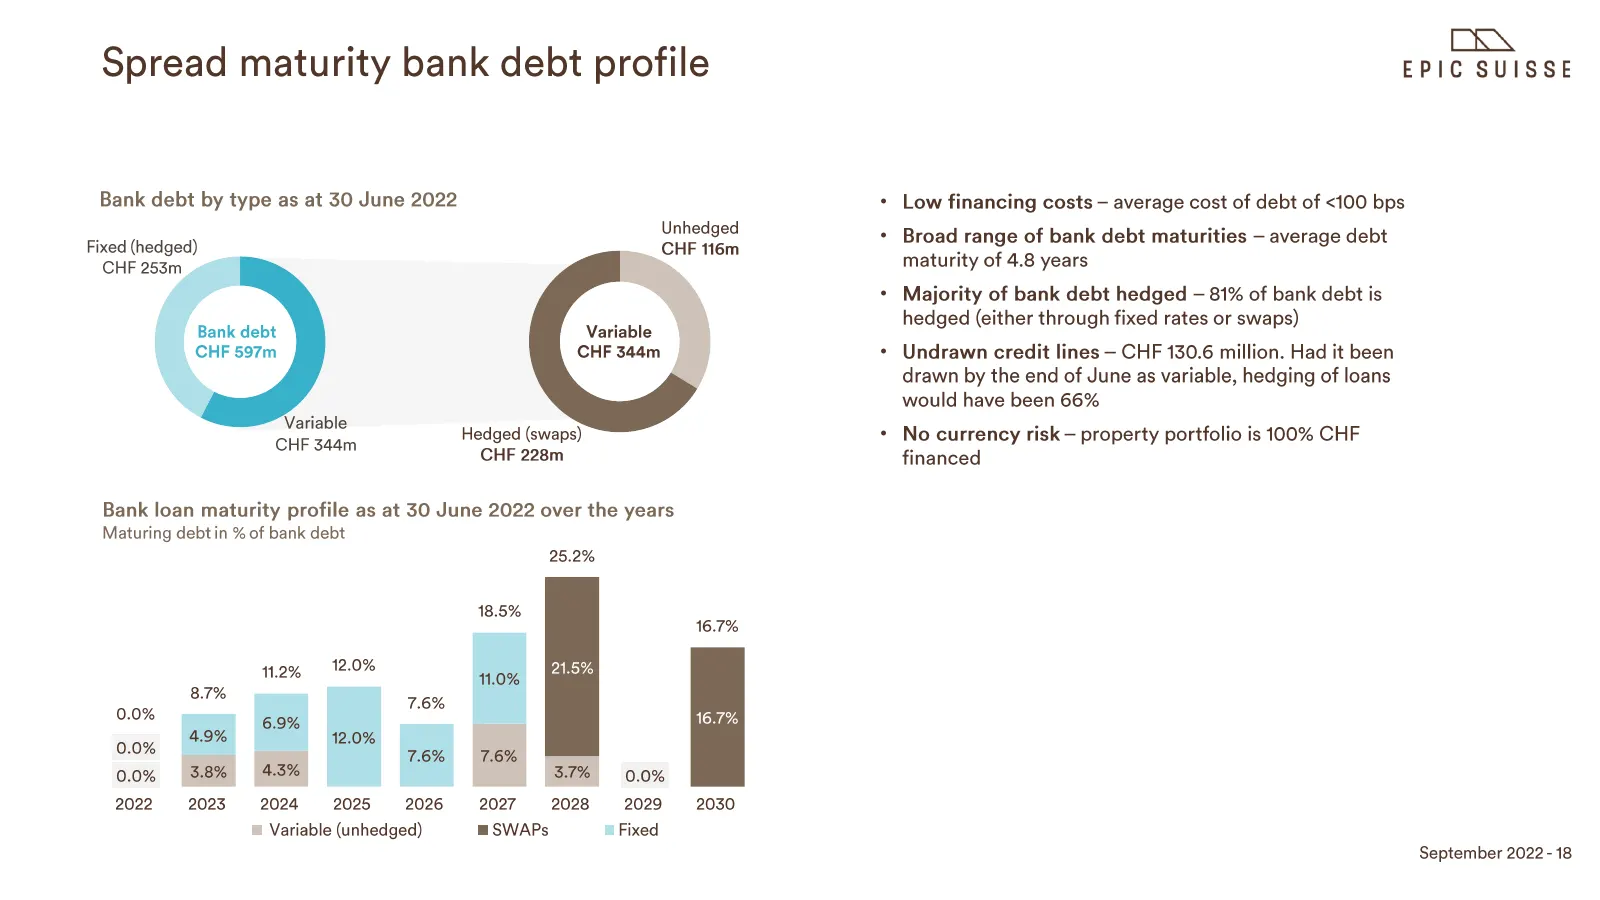
Spread maturity bank debt profile Bank debt by type as at 30 June 2022 Unhedged Fixed (hedged) CHF 116m CHF 253m Bank debt CHF 597m Variable CHF 344m Hedged (swaps) CHF 228m Bank loan maturity profile as at 30 June 2022 over the years Maturing debtin % of bank debt 25.2% 16.7% 11.2% 120% “ 21.5% 8.7
Slide 20: Profit or loss key figures
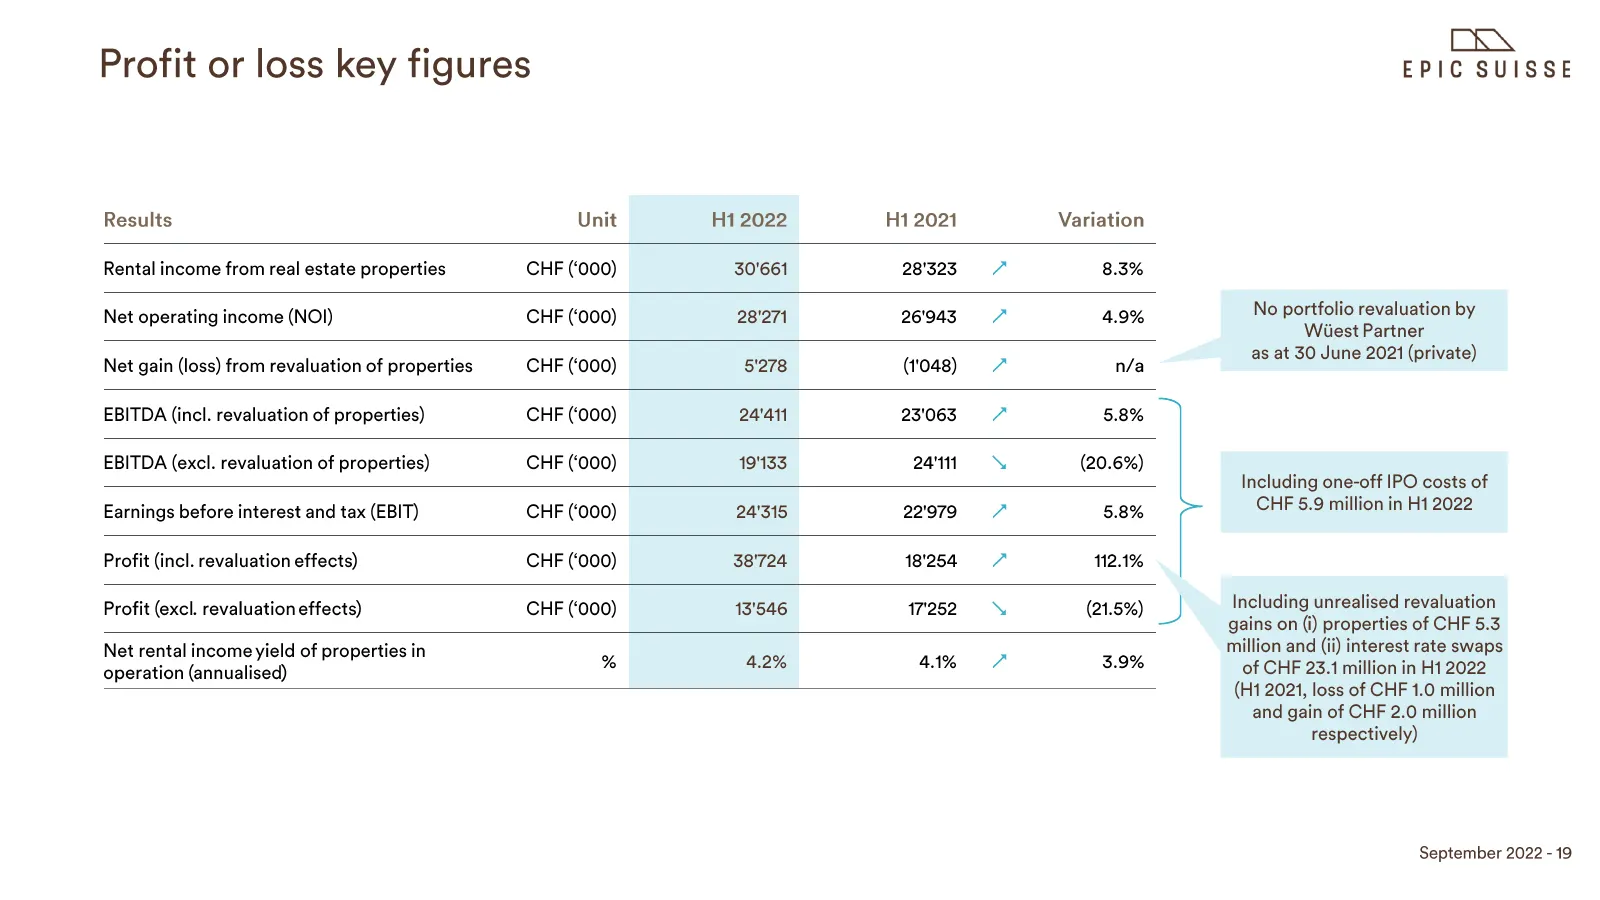
Profit or loss key figures Results Unit H1 2022 H1 2021 Variation Rental income from real estate properties CHF (‘000) 30'661 28'323 8.3% Net operating income (NOI) CHF (‘000) 28'271 26'943 4.9% Net gain (loss) from revaluation of properties CHF (‘000) 5'278 (11048) n/a EBITDA (incl. revaluation of
Slide 21: H1 2022 net rental income to EBITDA (before revaluations)
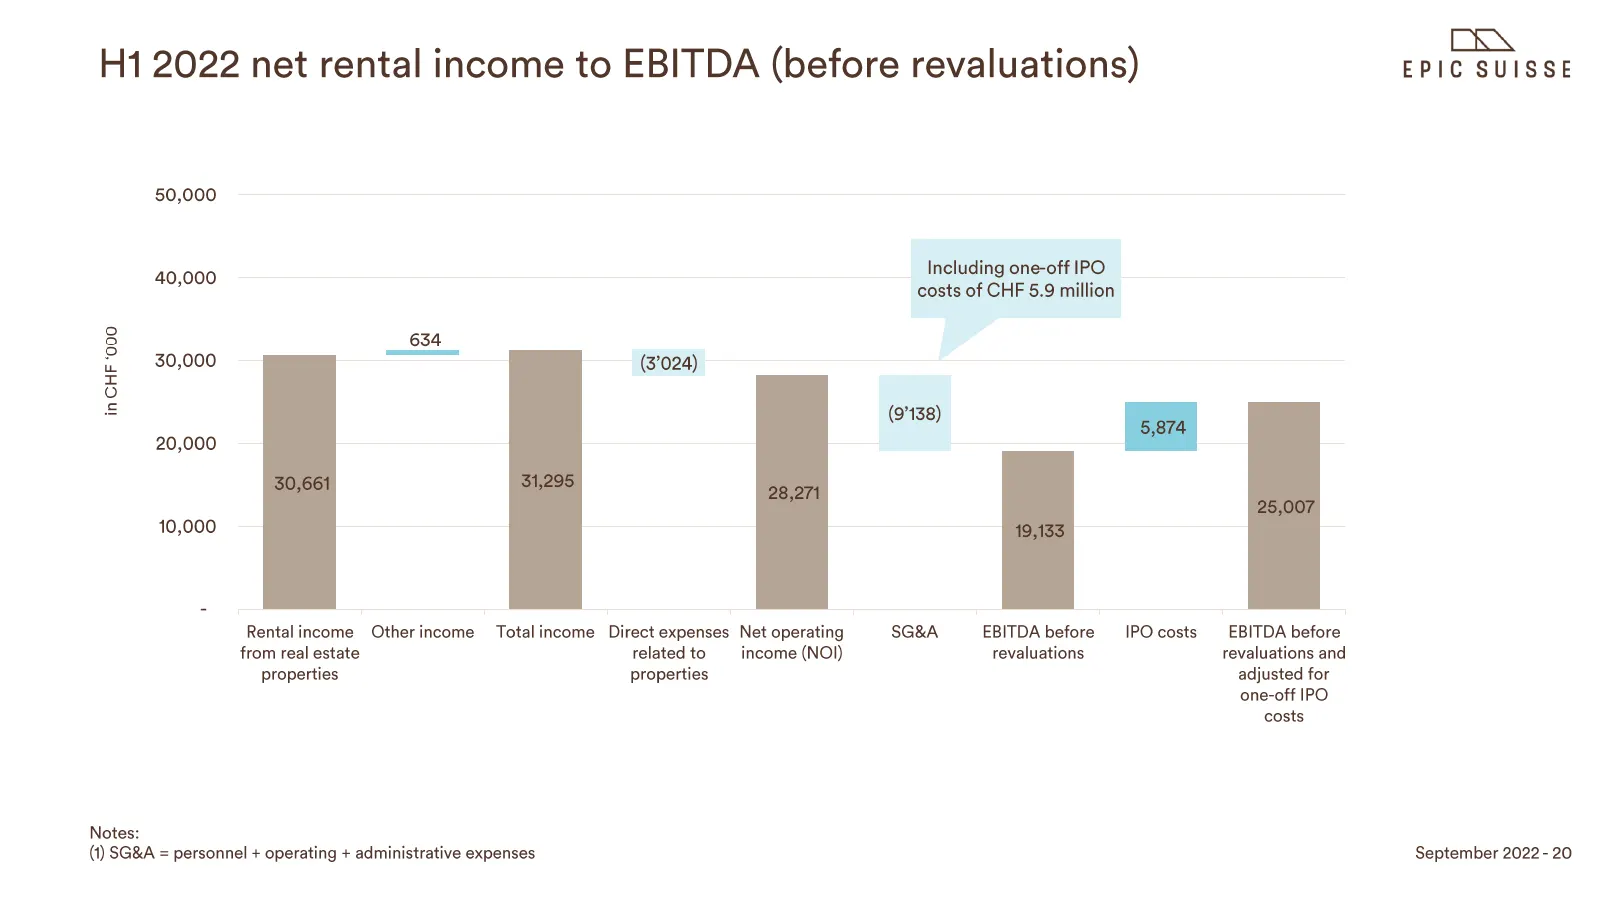
me H1 2022 net rental income to EBITDA (before revaluations) EPIC SUISSE 50,000 Including one-off IPO 40,000 costs of CHF 5.9 million 8 634 2 30,000 = (#024) 3 20,000 10,000 Rental income Otherincome Total income Direct expenses Net operating SG&A — EBITDAbefore IPO costs EBITDA before from real est
Slide 22: Rental income, NOI and EBITDA (excl. revaluations & IPO costs)
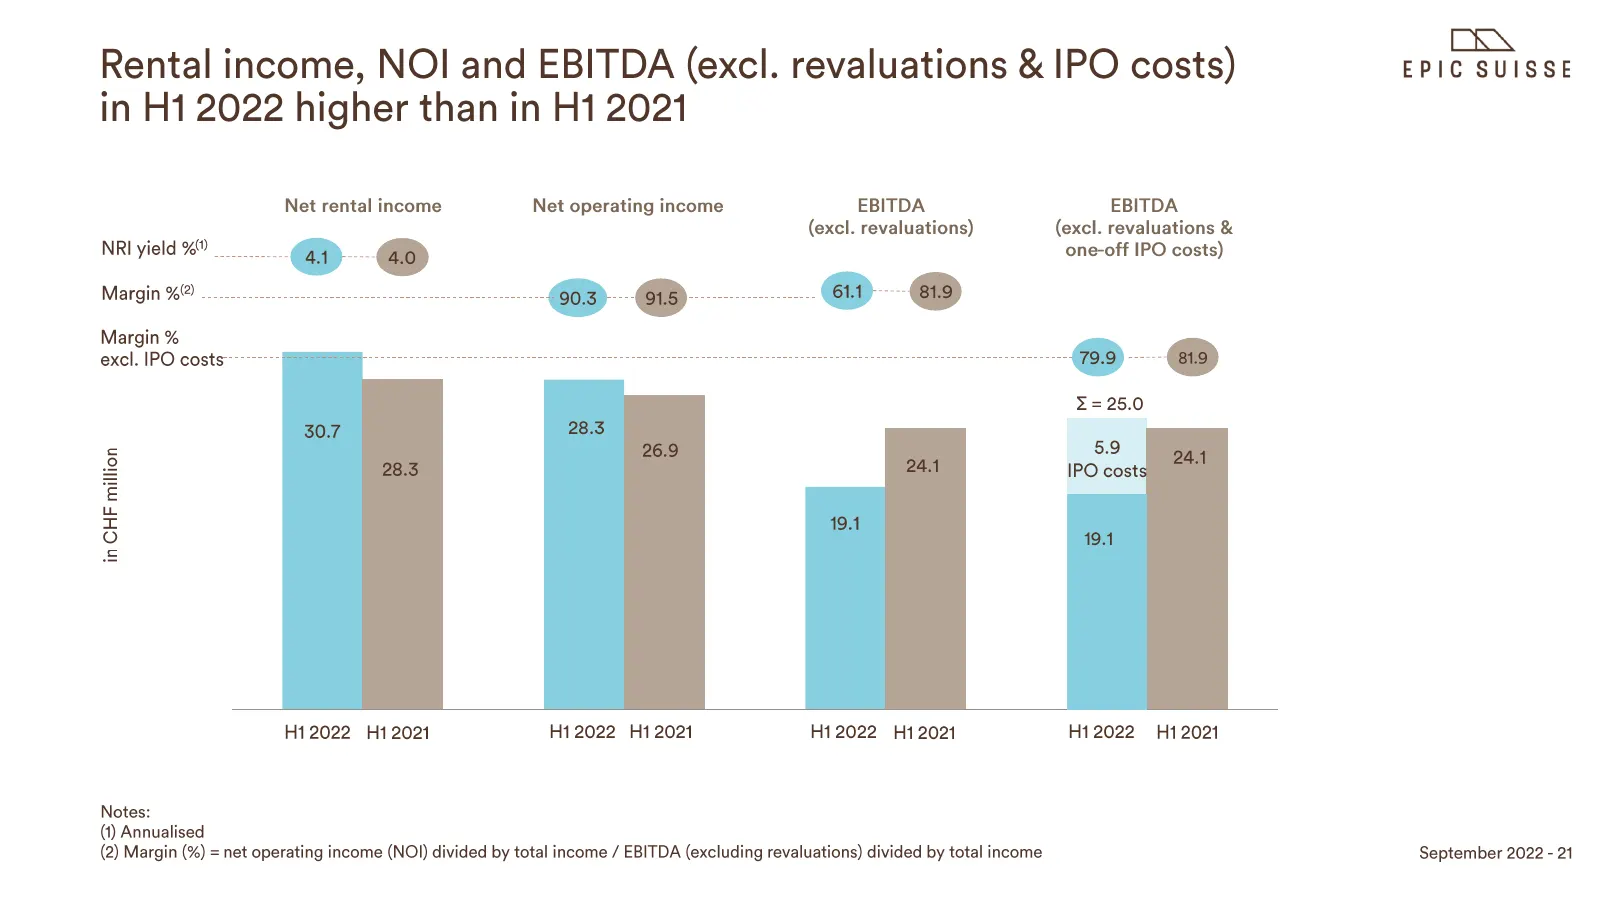
Rental income, NOI and EBITDA (excl. revaluations & IPO costs) PIG Suisse in H1 2022 higher than in H1 2021 Net rental income Net operating income EBITDA EBITDA (excl. revaluations) (excl. revaluations & NRI yield % ———-@ (Go) one-off IPO costs) Margin %@ -....... a 4 “ou (ag Margin % excl. IPO cost
Slide 23: Information per share key figures
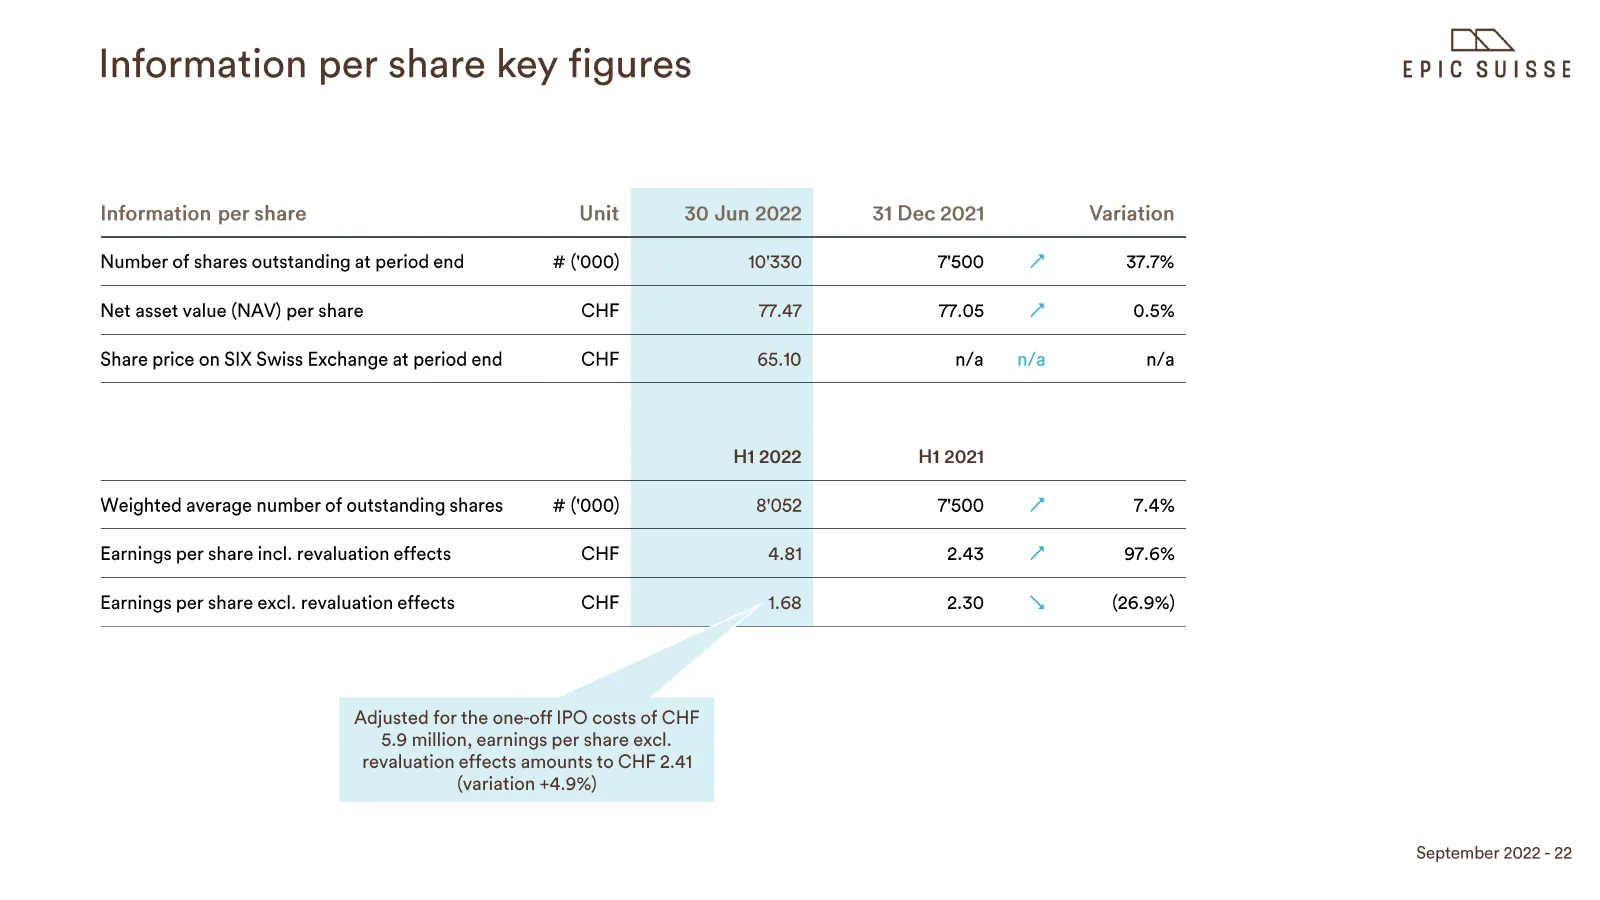
Information per share key figures Information per share Unit 30 Jun 2022 31 Dec 2021 Variation Number of shares outstanding at period end # ('000) 10'330 7'500 7 37.7% Net asset value (NAV) per share CHF 77.47 77.05 7 0.5% Share price on SIX Swiss Exchange at period end CHF 65.10 n/a n/a n/a H1 2022
Slide 24: Agenda: Developments
Half-year results 2022 Agenda + Market overview ¢ EPIC at aglance * Highlights * Key figures * Developments * Outlook DKA EPIC SUISSE
Slide 25: Progress on ongoing development projects
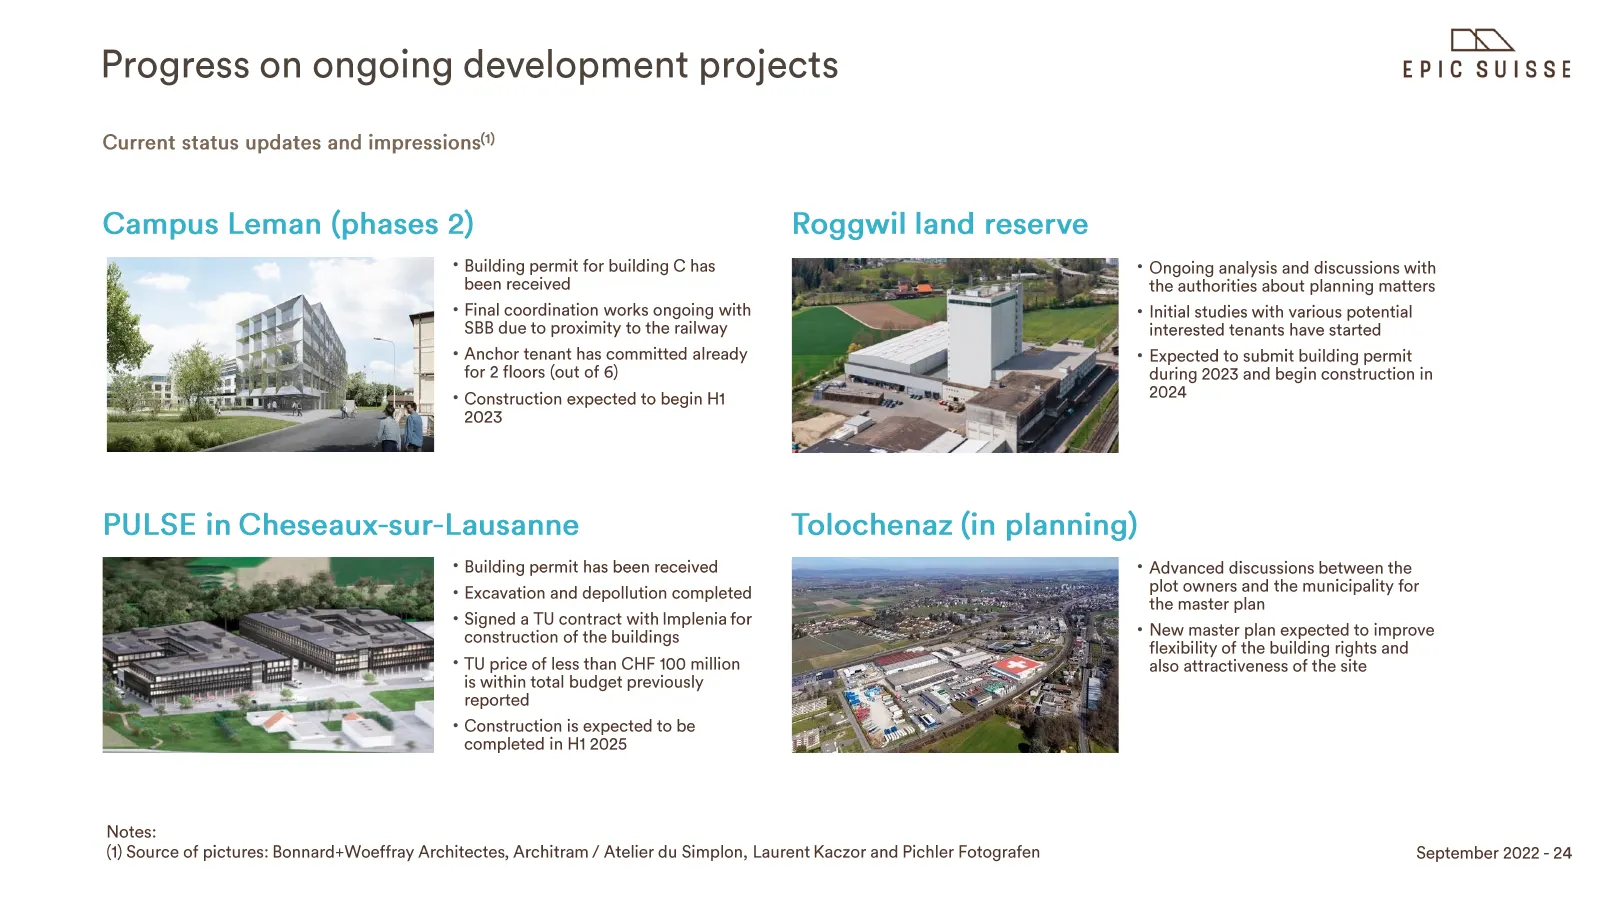
. . IRN Progress on ongoing development projects EPIC SUISSE Current status updates and impressions Campus Leman (phases 2) Roggwil land reserve * Building permit for building C has been received + Final coordination works ongoing with SBB due to proximity to the railway + Anchor tenant has committe

Slide 26: Agenda: Outlook
Half-year results 2022 Agenda ¢ Market overview ¢ EPIC at aglance * Highlights * Key figures * Developments * Outlook DKA EPIC SUISSE
Slide 27: Outlook for 2022
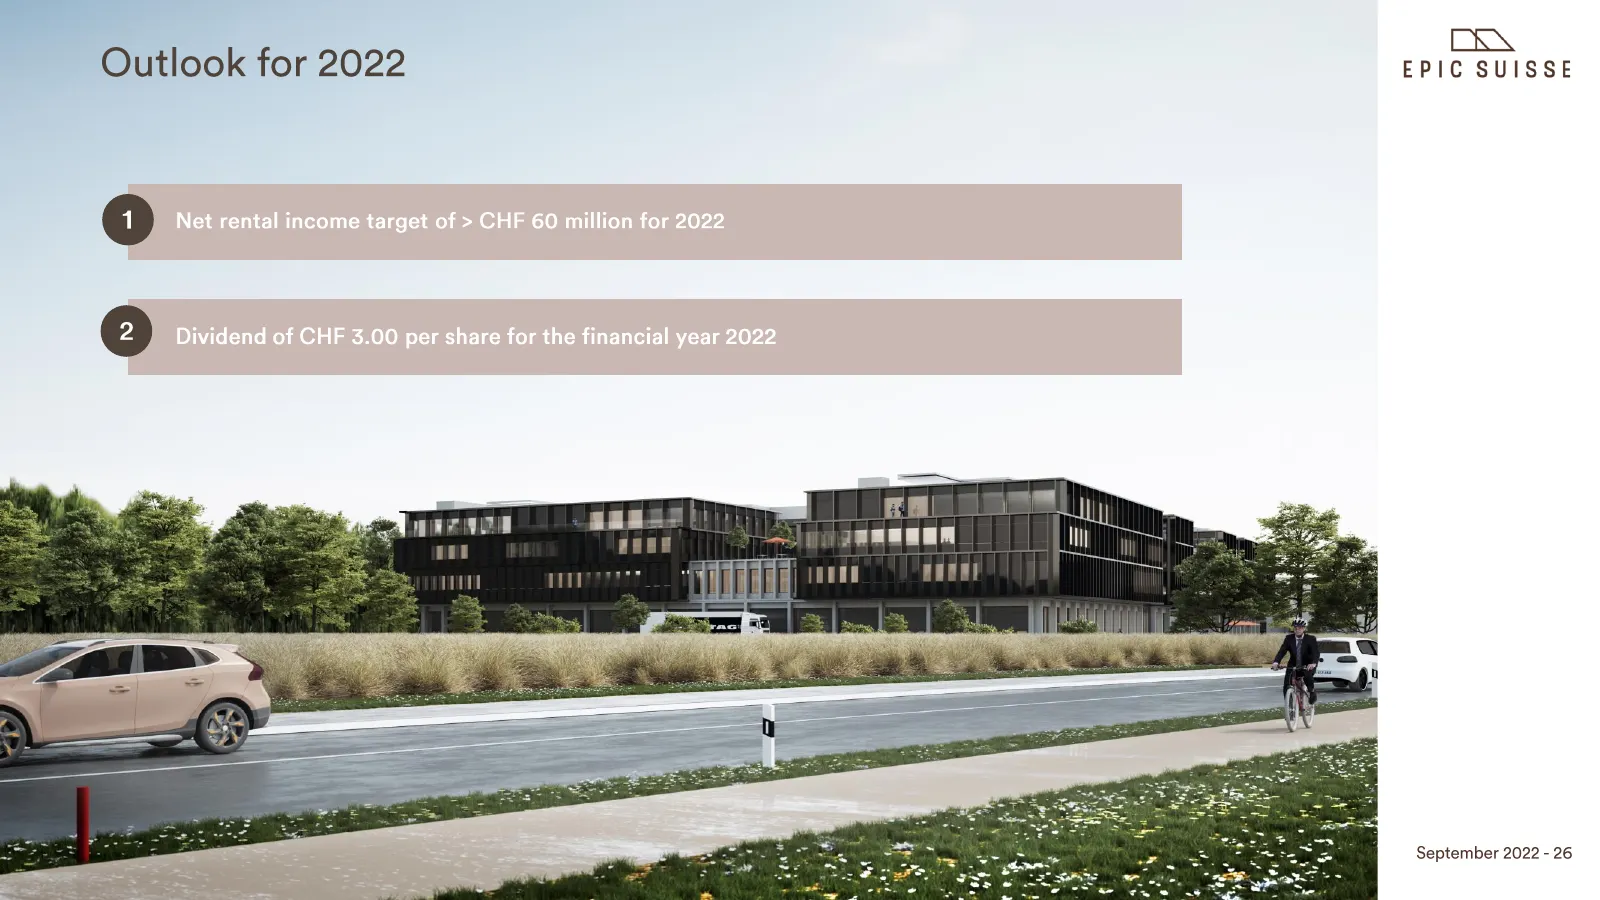
Outlook for 2022 EPID SUISSE September 2022 - 26

Slide 28: Appendix
DKA EPIC SUISSE Appendix
Slide 29: EPIC share price compared with SXI Real Estate & SPI indexes
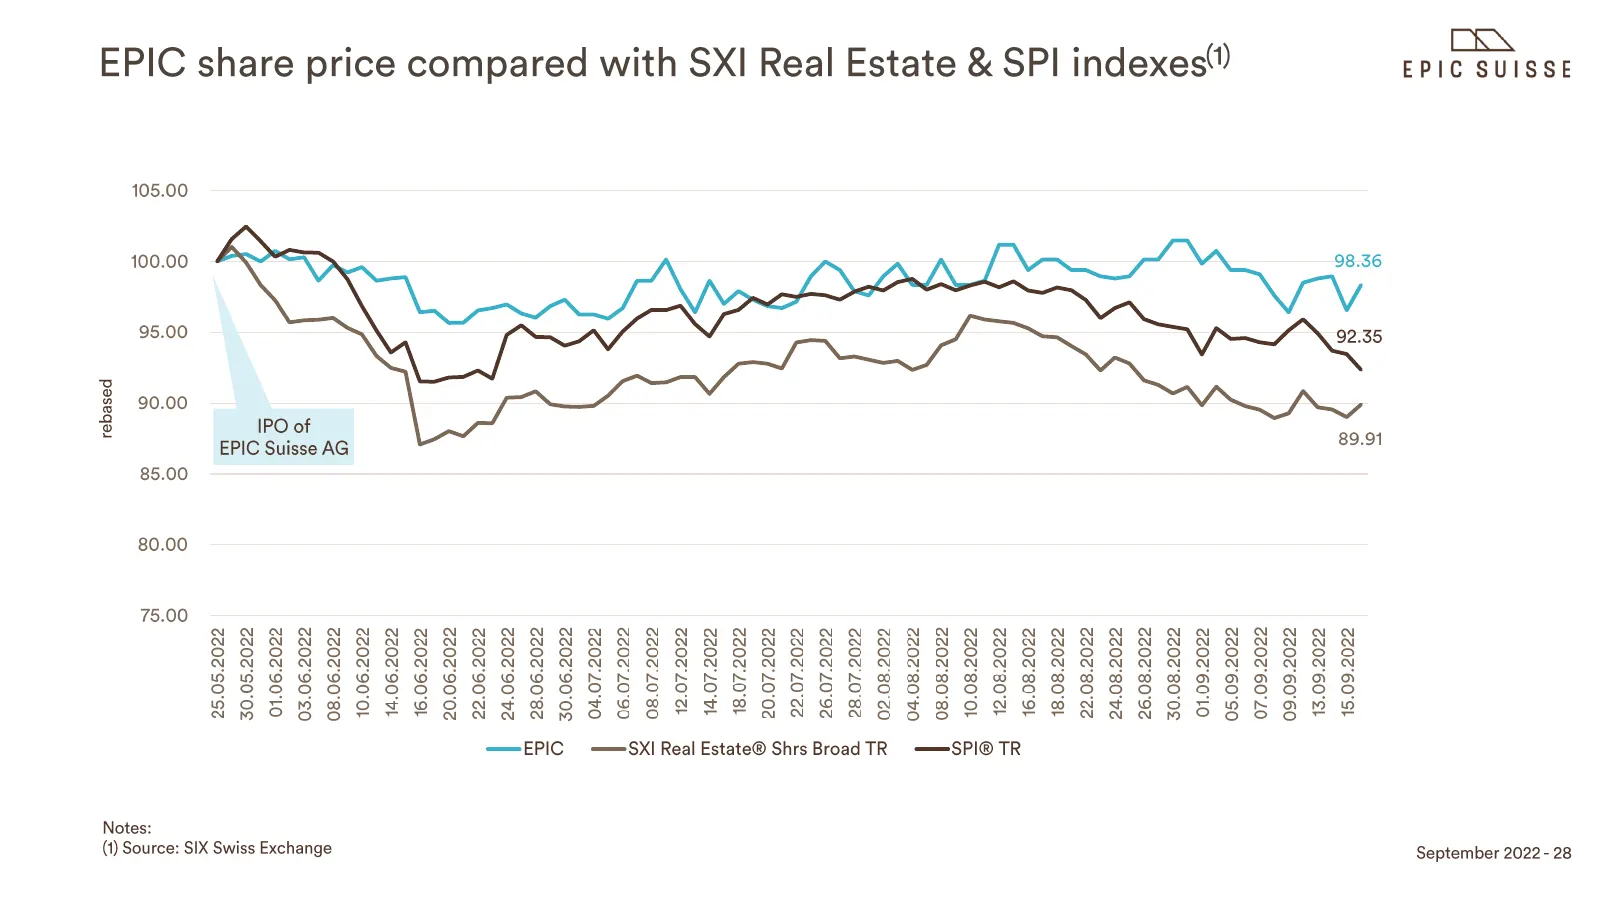
BRN EPIC SUISSE © ” oO a 92.35 89.91 %202°60'St @202°60'St @202'60'60 %202'°60°L0 %202'60°SO %202°60°10 @202'80°0F %202'80'9% 2202'80've %202'80°%e %202'80'8t %202'80'9 %202'80't %202°80'01 %@202°80°80, %@z02'80'b0 @202' 80°20 206 408% @20%'L0°9% @Z00'L0°%S %202°20'02 2z02'20'8L 2202°20'v @Z0e° LOC
Slide 30: Glossary of Alternative Performance Measures
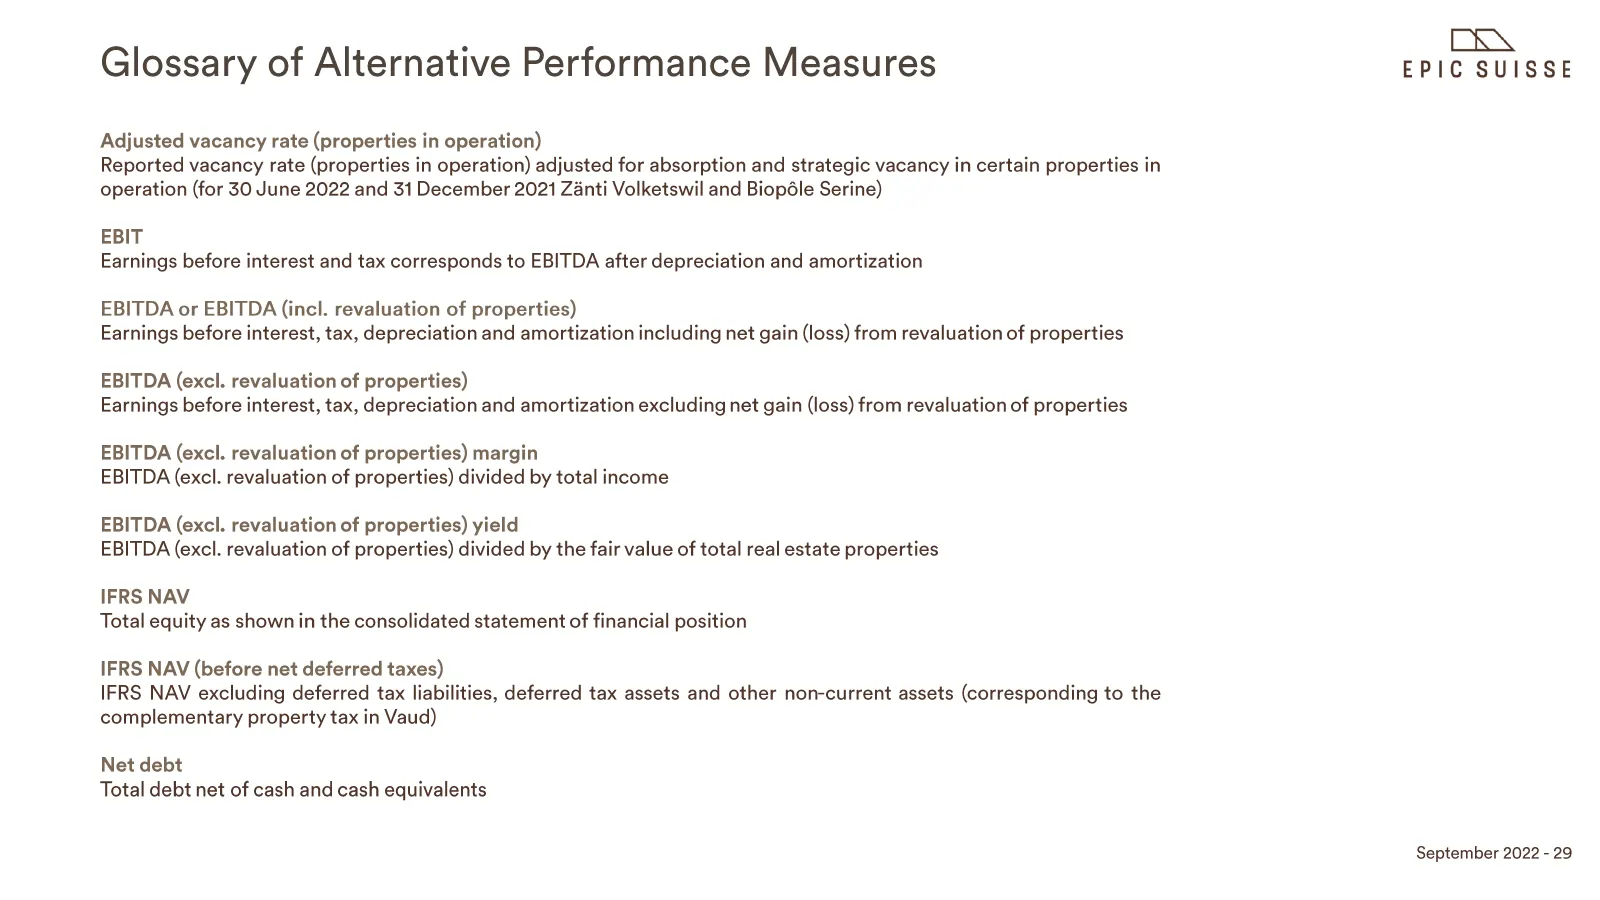
Glossary of Alternative Performance Measures Adjusted vacancy rate (properties in operation) Reported vacancy rate (properties in operation) adjusted for absorption and strategic vacancy in certain properties in operation (for 30 June 2022 and 31 December 2021 Z&nti Volketswil and Biopéle Serine) EB
Slide 31: Glossary of Alternative Performance Measures
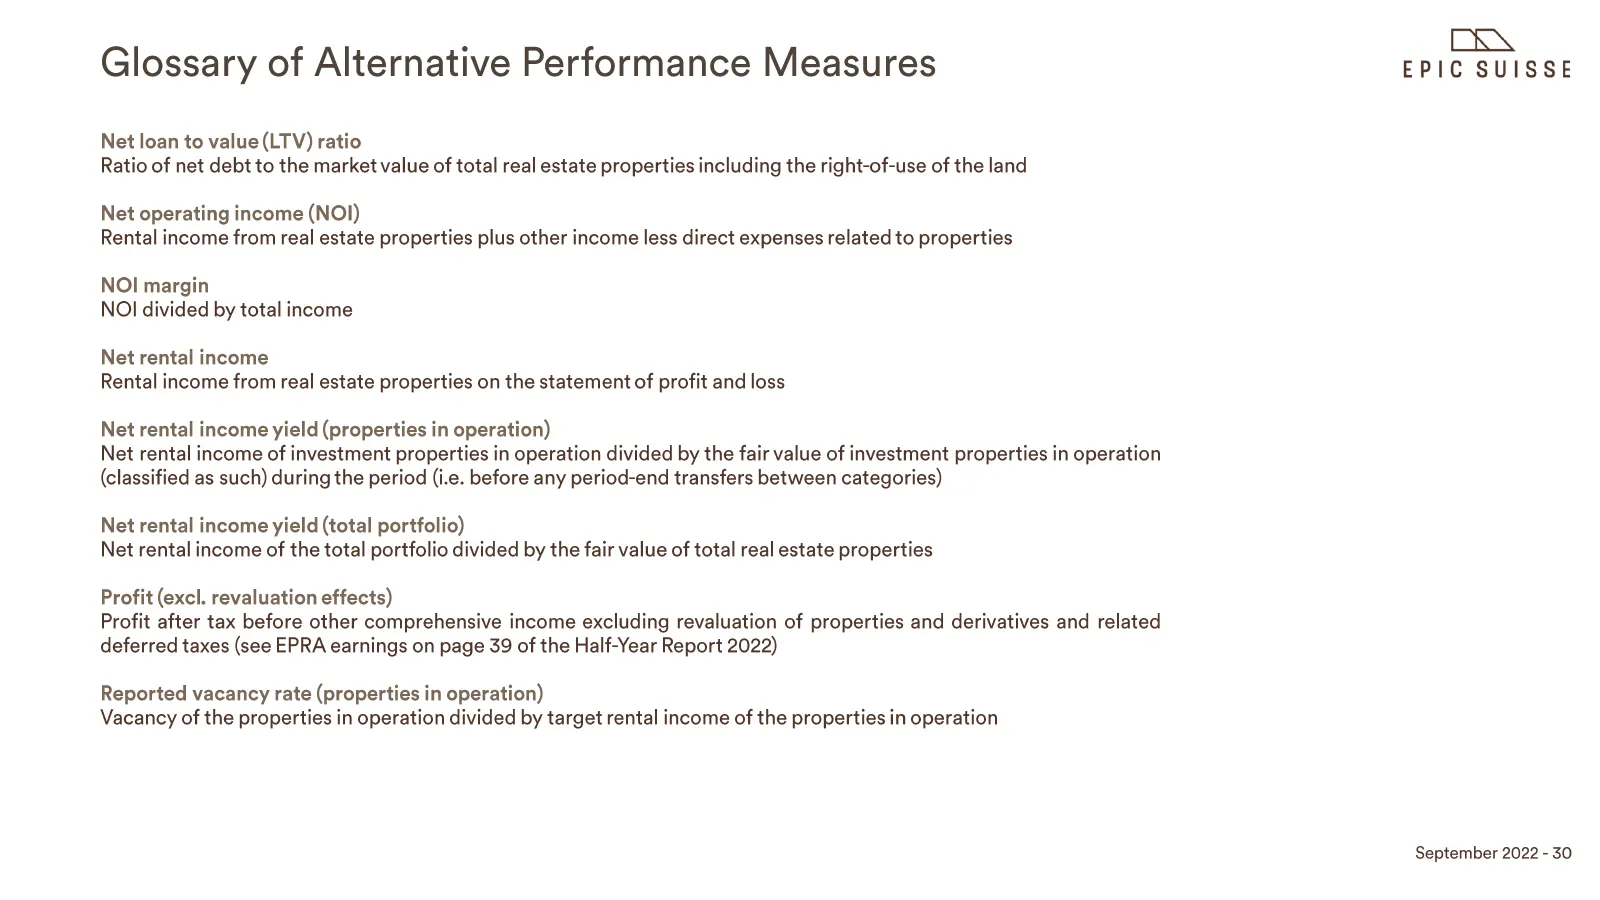
Glossary of Alternative Performance Measures Net loan to value(LTV) ratio Ratio of net debt to the market value of total real estate properties including the right-of-use of the land Net operating income (NOI) Rental income from real estate properties plus other income less direct expenses related t
Slide 32: Glossary of Alternative Performance Measures
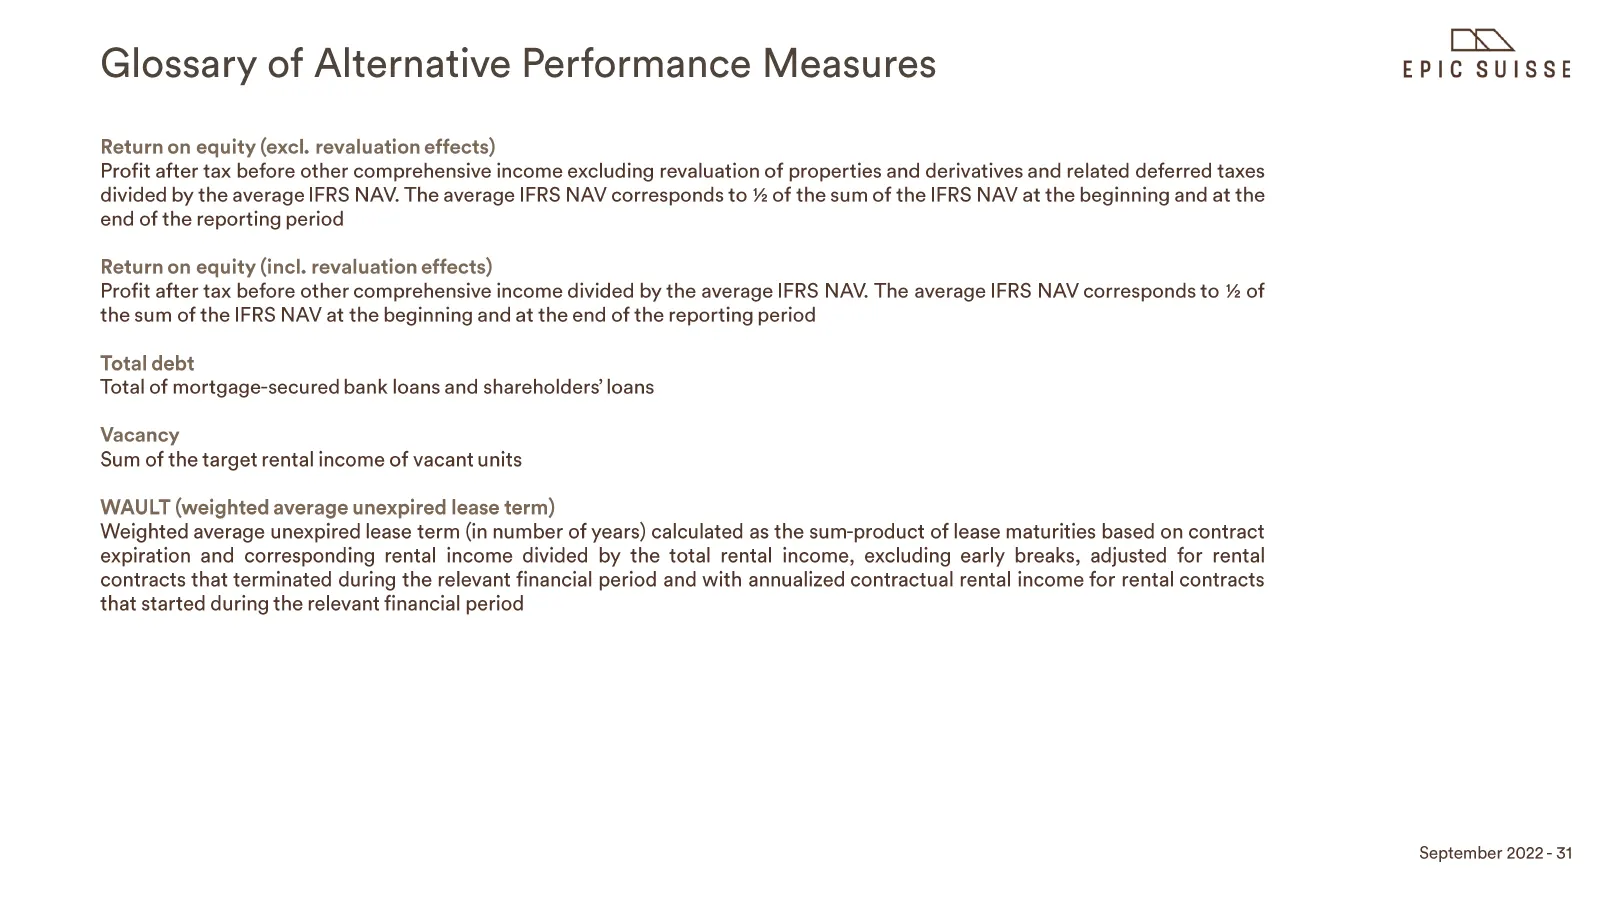
Glossary of Alternative Performance Measures Return on equity (excl. revaluation effects) Profit after tax before other comprehensive income excluding revaluation of properties and derivatives and related deferred taxes divided by the average IFRS NAV. The average IFRS NAV corresponds to % of the su

Slide 33: EPIC Suisse AG
EPIC Suisse AG Raum fiir Erfolg. Seefeldstrasse 5a 8008 Zirich +41 44 388 8100 investors@epic.ch
Source: Internet Archive copy of ir.epic.ch