Emclaire Financial — IPO Roadshow (November 2009)
30 slides from Emclaire Financial's IPO roadshow presentation, Nov 5, 2009
Slide 1: Follow-on Offering of Common Shares, 1,250,000 Shares
November 2009 Ticker: EMCF www.emclairefinancial.com Follow-on Offering of Common Shares 1,250,000 Shares Emclaire Financial Corp. Filed pursuant to Rule 433 Registration Statement No. 333-161955 November 5, 2009 (To the Preliminary Prospectus dated November 3, 2009)
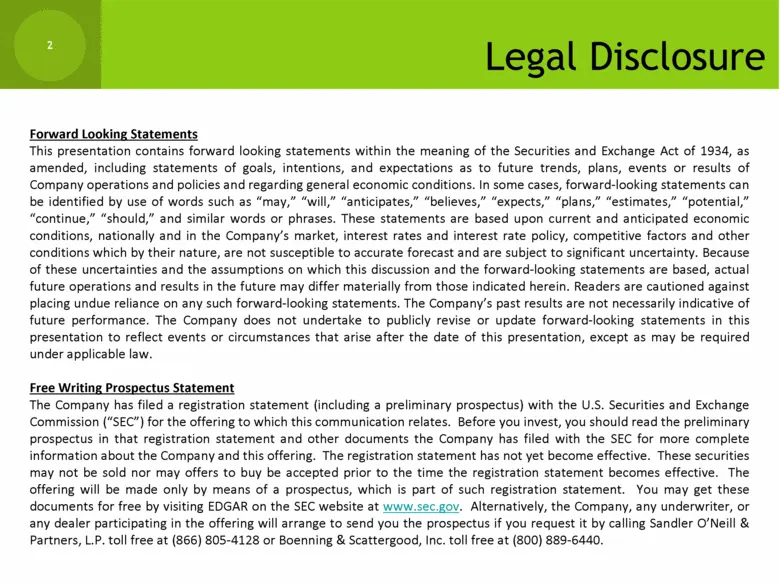
Slide 2: Legal Disclosure
Legal Disclosure Forward Looking Statements This presentation contains forward looking statements within the meaning of the Securities and Exchange Act of 1934, as amended, including statements of goals, intentions, and expectations as to future trends, plans, events or results of Company operations
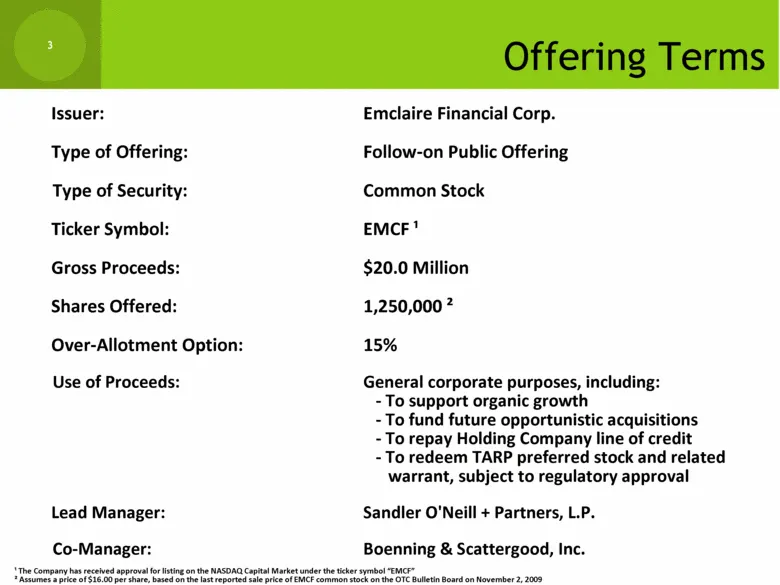
Slide 3: Offering Terms
Issuer: Emclaire Financial Corp. Type of Offering: Follow-on Public Offering Type of Security: Common Stock Ticker Symbol: EMCF ¹ Gross Proceeds: $20.0 Million Shares Offered: 1,250,000 ² Over-Allotment Option: 15% Use of Proceeds: General corporate purposes, including: - To support organic growth -

Slide 4: Experienced Senior Management Team
Experienced Senior Management Team William C. Marsh - Chairman, President, and CEO Has served in his current capacity since January 2009 Prior to this, served as President and CEO of the Bank since June 2007 Began career with EMCF in 2001 as Senior Vice President, Chief Financial Officer and Treasur
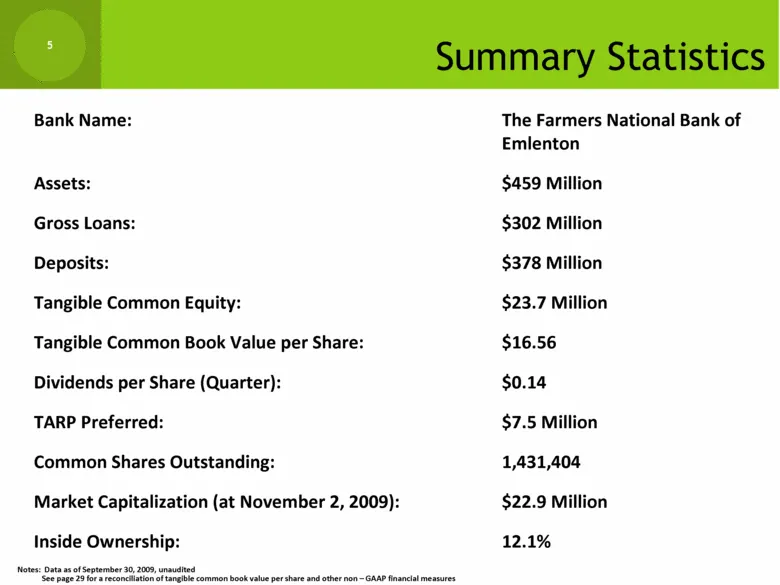
Slide 5: Summary Statistics
Summary Statistics Bank Name: The Farmers National Bank of Emlenton Assets: $459 Million Gross Loans: $302 Million Deposits: $378 Million Tangible Common Equity: $23.7 Million Tangible Common Book Value per Share: $16.56 Dividends per Share (Quarter): $0.14 TARP Preferred: $7.5 Million Common Shares
Slide 6: Locations
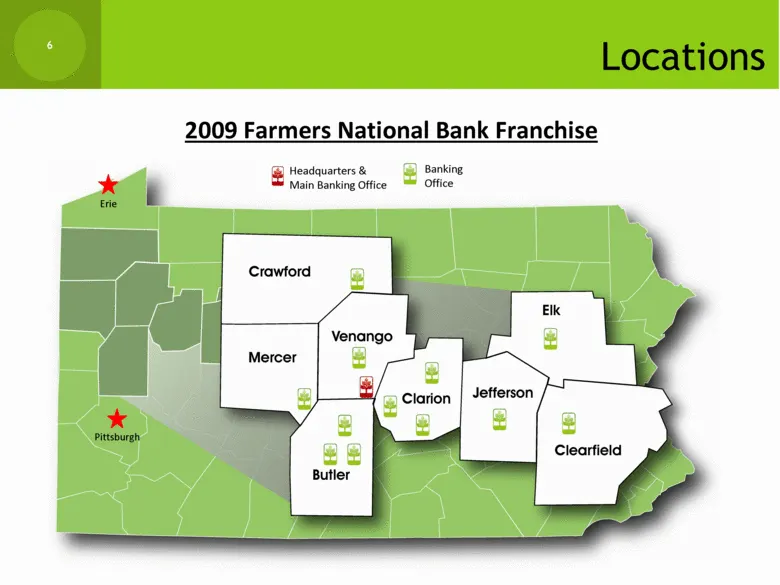
Locations 2009 Farmers National Bank Franchise Headquarters & Main Banking Office Banking Office Erie Pittsburgh
Slide 7: History of Growth
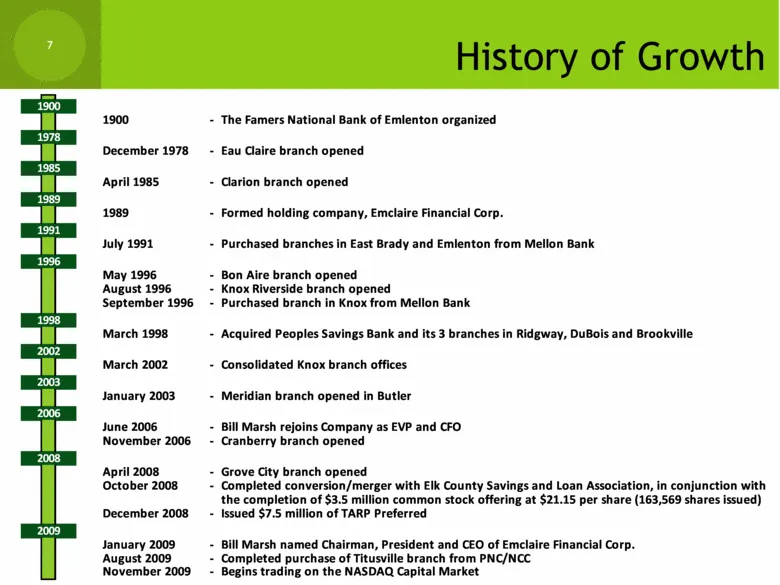
History of Growth 1900 - The Famers National Bank of Emlenton organized December 1978 - Eau Claire branch opened April 1985 - Clarion branch opened 1989 - Formed holding company, Emclaire Financial Corp. July 1991 - Purchased branches in East Brady and Emlenton from Mellon Bank May 1996 - Bon Aire b
Slide 8: Why Invest in EMCF?
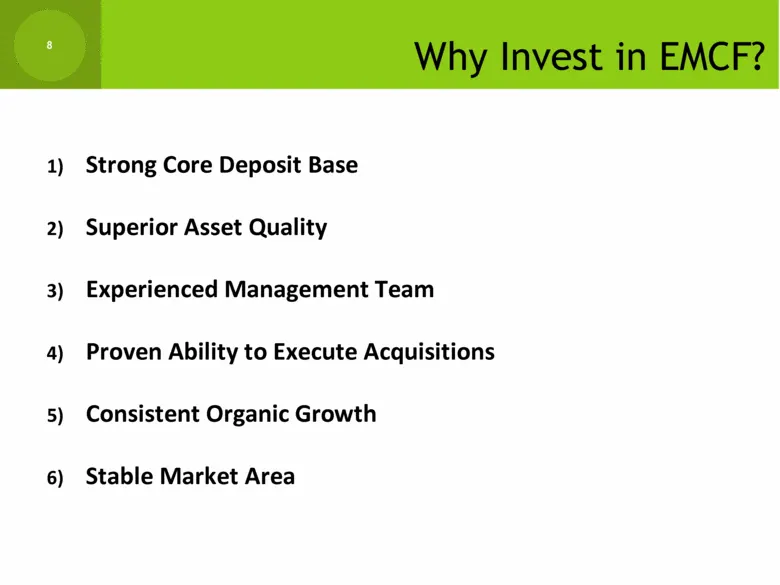
Why Invest in EMCF? Strong Core Deposit Base Superior Asset Quality Experienced Management Team Proven Ability to Execute Acquisitions Consistent Organic Growth Stable Market Area
Slide 9: Key Financial Attributes
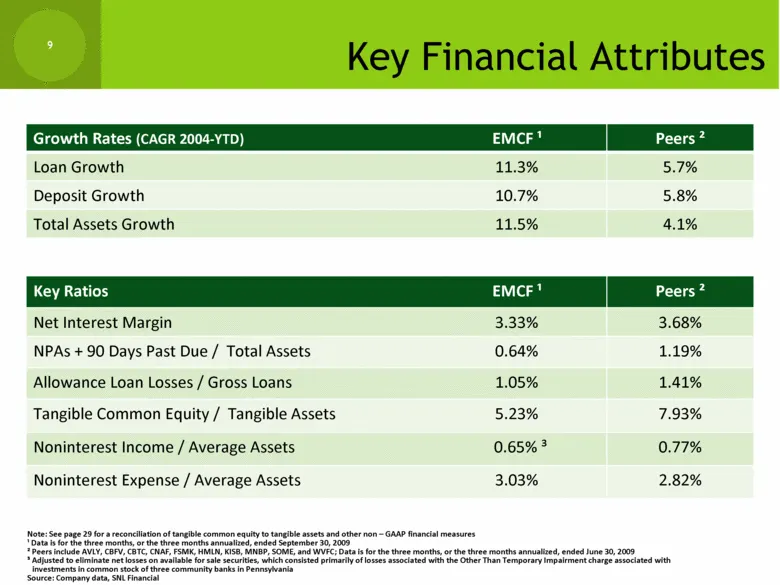
Key Financial Attributes 0.77% 0.65% ³ Noninterest Income / Average Assets 5.8% 10.7% Deposit Growth 7.93% 5.23% Tangible Common Equity / Tangible Assets 1.19% 0.64% NPAs + 90 Days Past Due / Total Assets Growth Rates (CAGR 2004-YTD) EMCF ¹ Peers ² Loan Growth 11.3% 5.7% Total Assets Growth 11.5% 4.
Slide 10: Balance Sheet Growth
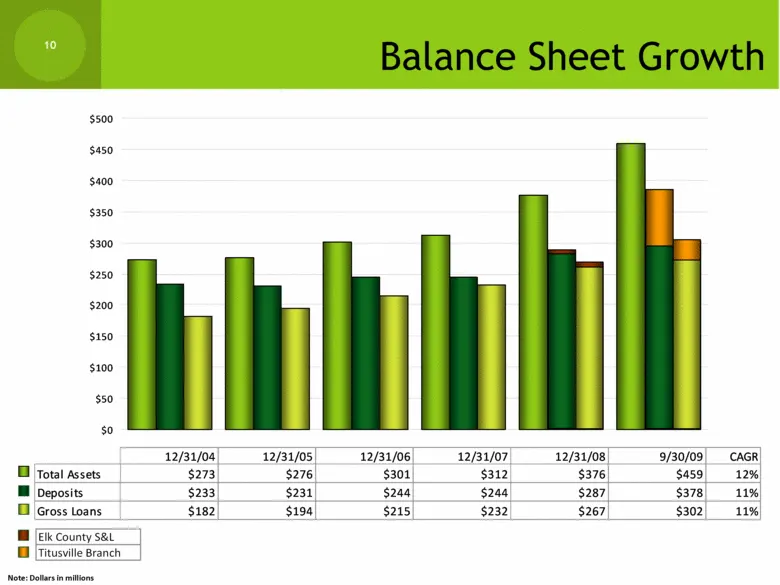
Balance Sheet Growth Note: Dollars in millions 12/31/04 12/31/05 12/31/06 12/31/07 12/31/08 9/30/09 CAGR Total Assets $273 $276 $301 $312 $376 $459 12% Deposits $233 $231 $244 $244 $287 $378 11% Gross Loans $182 $194 $215 $232 $267 $302 11% $0 $50 $100 $150 $200 $250 $300 $350 $400 $450 $500 Elk Cou
Slide 11: Loan Composition
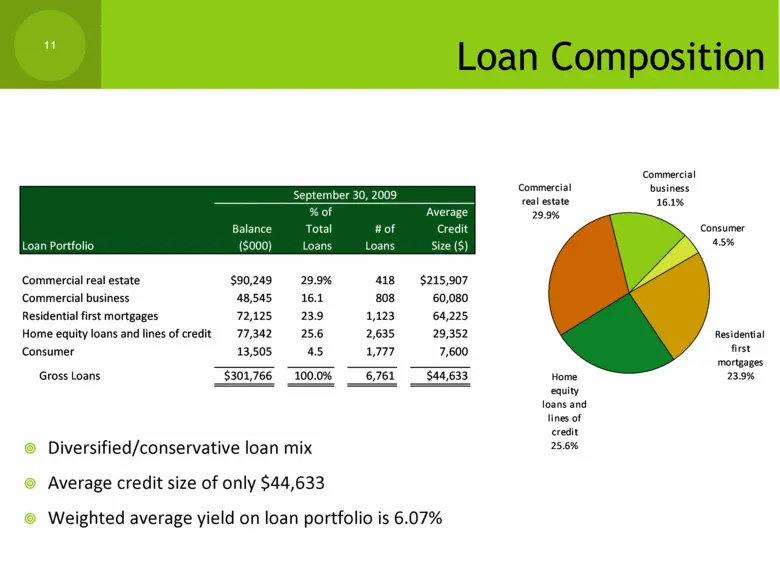
Loan Composition Diversified/conservative loan mix Average credit size of only $44,633 Weighted average yield on loan portfolio is 6.07% Commercial business 16.1% Consumer 4.5% Residential first mortgages 23.9% Home equity loans and lines of credit 25.6% Commercial real estate 29.9% % of Average Bal
Slide 12: Loan Growth
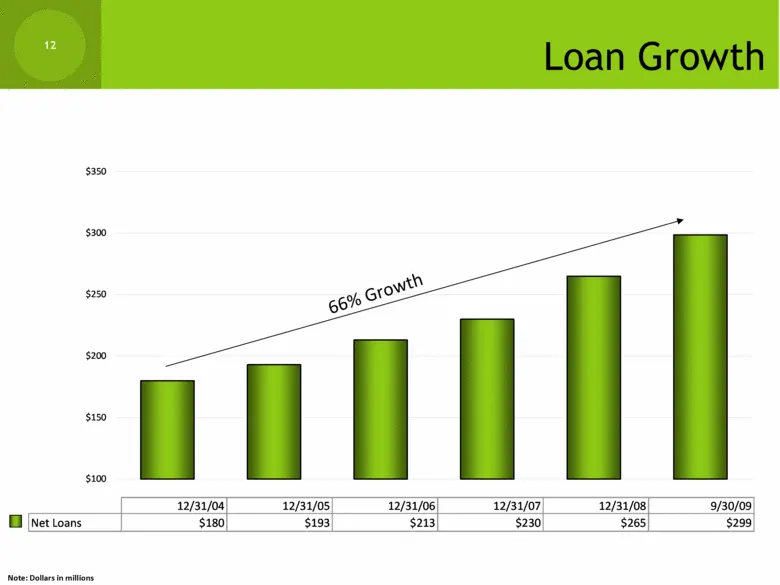
Loan Growth 66% Growth Note: Dollars in millions 12/31/04 12/31/05 12/31/06 12/31/07 12/31/08 9/30/09 Net Loans $180 $193 $213 $230 $265 $299 $100 $150 $200 $250 $300 $350
Slide 13: Credit Quality
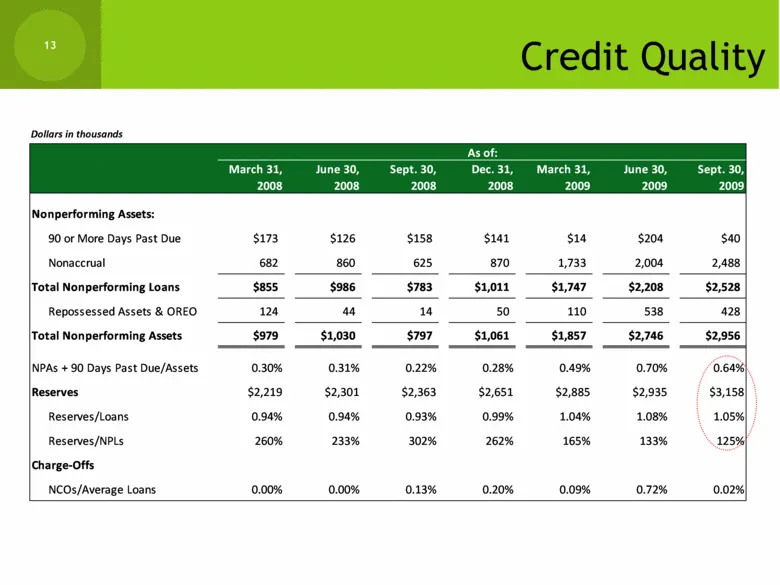
As of: March 31, June 30, Sept. 30, Dec. 31, March 31, June 30, Sept. 30, 2008 2008 2008 2008 2009 2009 2009 Nonperforming Assets: 90 or More Days Past Due $173 $126 $158 $141 $14 $204 $40 Nonaccrual 682 860 625 870 1,733 2,004 2,488 Total Nonperforming Loans $855 $986 $783 $1,011 $1,747 $2,208 $2,5
Slide 14: Asset Quality
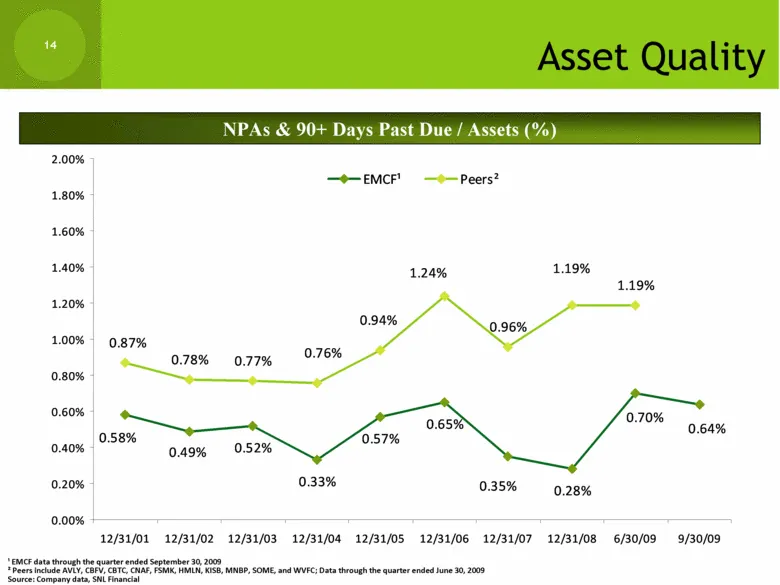
Asset Quality NPAs & 90+ Days Past Due / Assets (%) ¹ EMCF data through the quarter ended September 30, 2009 ² Peers include AVLY, CBFV, CBTC, CNAF, FSMK, HMLN, KISB, MNBP, SOME, and WVFC; Data through the quarter ended June 30, 2009 Source: Company data, SNL Financial
Slide 15: Deposit Composition
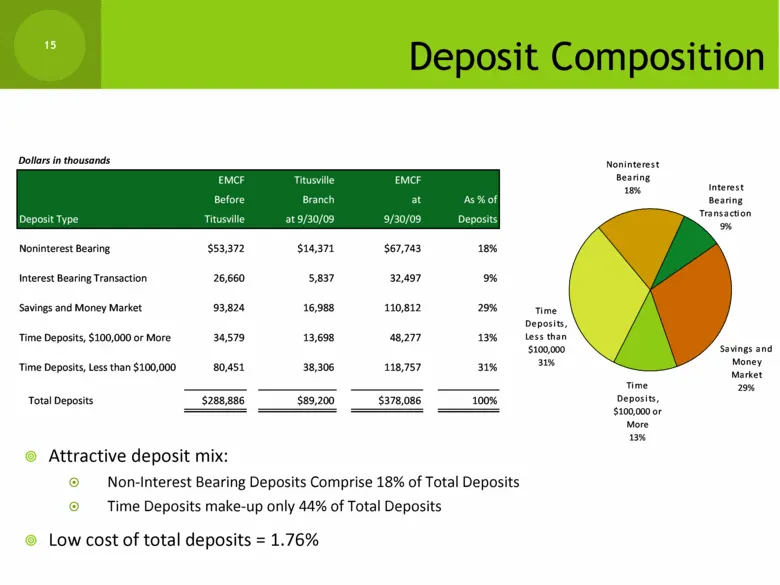
Deposit Composition Attractive deposit mix: Non-Interest Bearing Deposits Comprise 18% of Total Deposits Time Deposits make-up only 44% of Total Deposits Low cost of total deposits = 1.76% Dollars in thousands EMCF Titusville EMCF Before Branch at As % of Deposit Type Titusville at 9/30/09 9/30/09 D
Slide 16: Deposit Growth
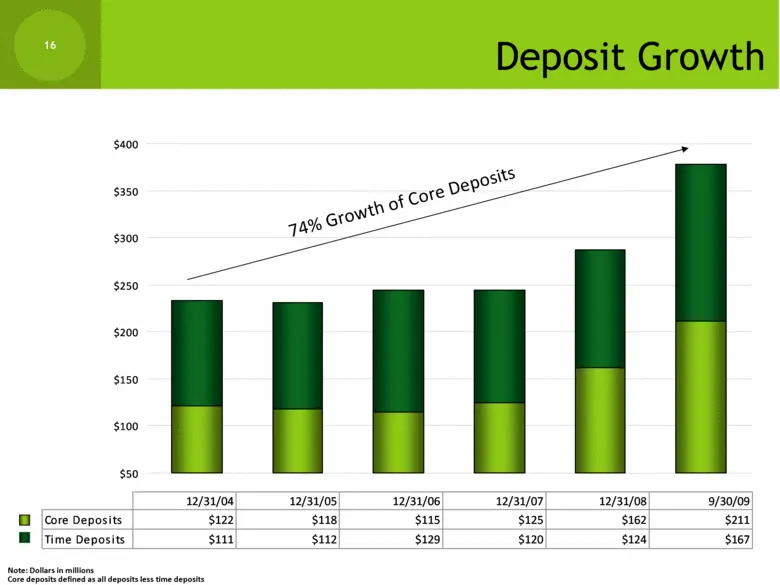
16 Deposit Growth Note: Dollars in millions Core deposits defined as all deposits less time deposits 12/31/04 12/31/05 12/31/06 12/31/07 12/31/08 9/30/09 Core Depos i ts $122 $118 $115 $125 $162 $211 Time Depos i ts $111 $112 $129 $120 $124 $167 $50 $100 $150 $200 $250 $300 $350 $400 74% Growth of C
Slide 17: Deposit Market Share
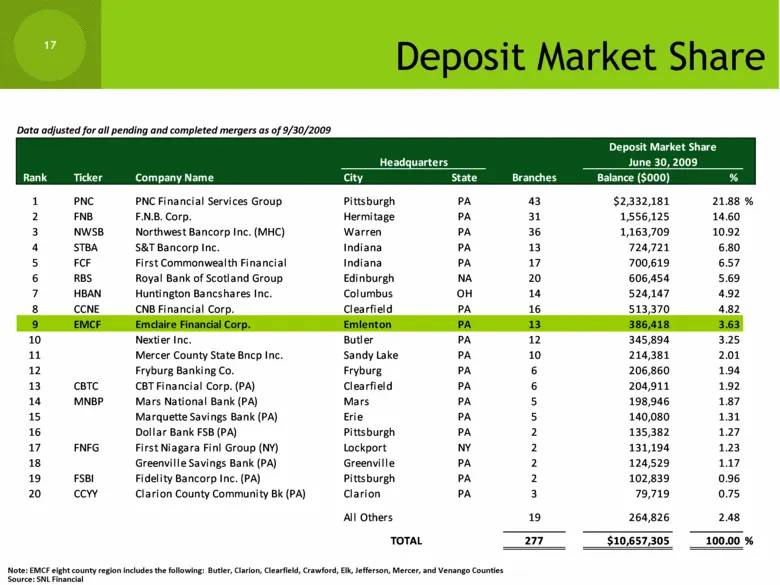
17 Deposit Market Share Note: EMCF eight county region includes the following: Butler, Clarion, Clearfield, Crawford, Elk, Jefferson, Mercer, and Venango Counties Source: SNL Financial Data adjusted for all pending and completed mergers as of 9/30/2009 Rank Ticker Company Name City State Branches Ba
Slide 18: Stable Demographics
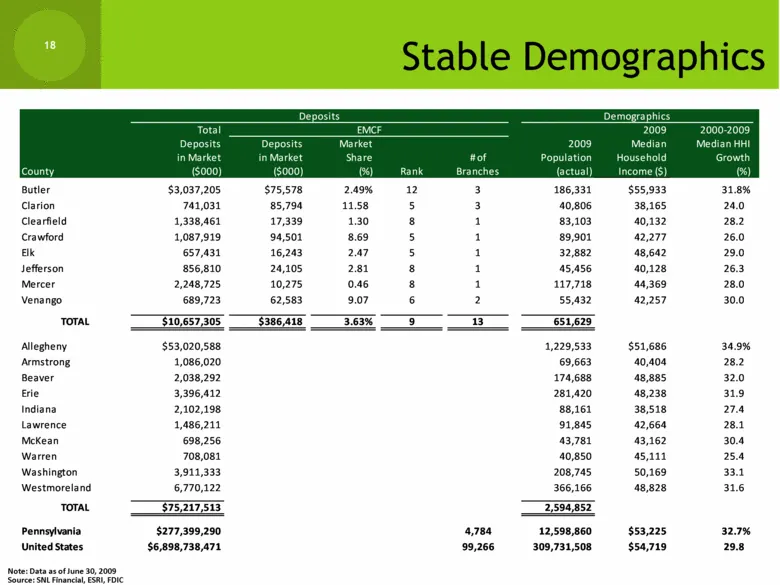
18 Stable Demographics Note: Data as of June 30, 2009 Source: SNL Financial, ESRI, FDIC Total 2009 2000-2009 Deposits Deposits Market 2009 Median Median HHI in Market in Market Share # of Population Household Growth County ($000) ($000) (%) Rank Branches (actual) Income ($) (%) Butler $3,037,205 $75
Slide 19: Proven Acquisition Capabilities
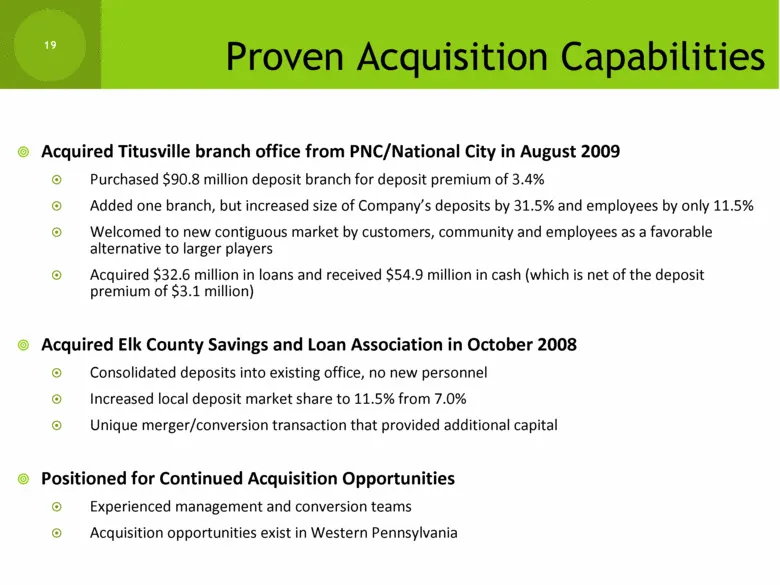
Proven Acquisition Capabilities Acquired Titusville branch office from PNC/National City in August 2009 Purchased $90.8 million deposit branch for deposit premium of 3.4% Added one branch, but increased size of Company’s deposits by 31.5% and employees by only 11.5% Welcomed to new contiguous market
Slide 20: Investment Securities Portfolio
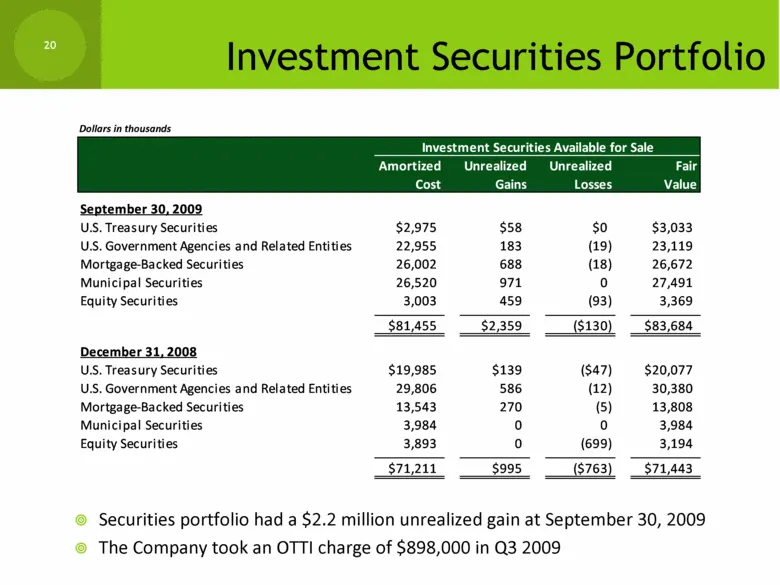
20 Investment Securities Portfolio Securities portfolio had a $2.2 million unrealized gain at September 30, 2009 The Company took an OTTI charge of $898,000 in Q3 2009 Dollars in thousands Amortized Unrealized Unrealized Fair Cost Gains Losses Value September 30, 2009 U.S. Treasury Securities $2,975
Slide 21: Equity Securities Portfolio
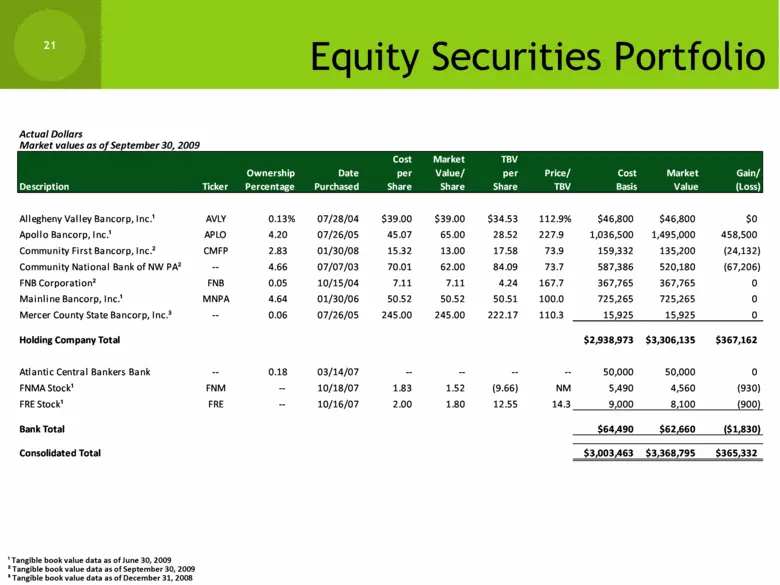
21 Equity Securities Portfolio ¹ Tangible book value data as of June 30, 2009 ² Tangible book value data as of September 30, 2009 ³ Tangible book value data as of December 31, 2008 Actual Dollars Market values as of September 30, 2009 Cost Market TBV Ownership Date per Value/ per Price/ Cost Market
Slide 22: Growth in Core Earnings
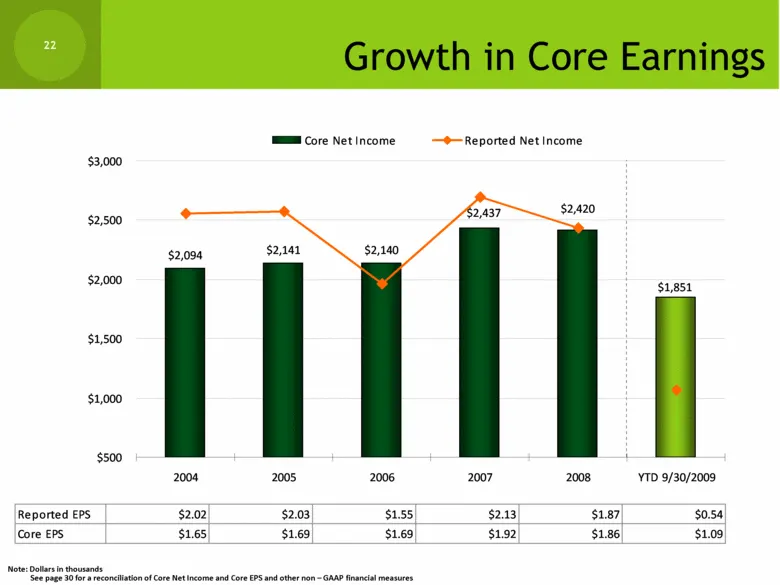
22 Growth in Core Earnings Note: Dollars in thousands See page 30 for a reconciliation of Core Net Income and Core EPS and other non – GAAP financial measures Reported EPS $2.02 $2.03 $1.55 $2.13 $1.87 $0.54 Core EPS $1.65 $1.69 $1.69 $1.92 $1.86 $1.09 $2,094 $2,141 $2,140 $1,851 $2,420 $2,437 $500
Slide 23: Pro Forma Capital Ratios
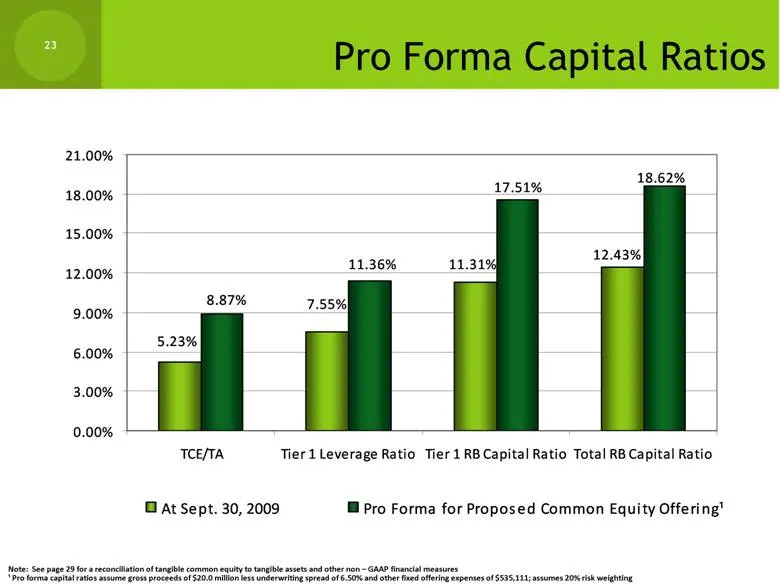
23 5.23% 7.55% 11.31% 12.43% 17.51% 8.87% 11.36% 18.62% 0.00% 3.00% 6.00% 9.00% 12.00% 15.00% 18.00% 21.00% TCE/TA Tier 1 Leverage Ratio Tier 1 RB Capital Ratio Total RB Capital Ratio At Sept. 30, 2009 Pro Forma for Proposed Common Equity Offering¹ Pro Forma Capital Ratios Note: See page 29 for a re
Slide 24: Looking Ahead
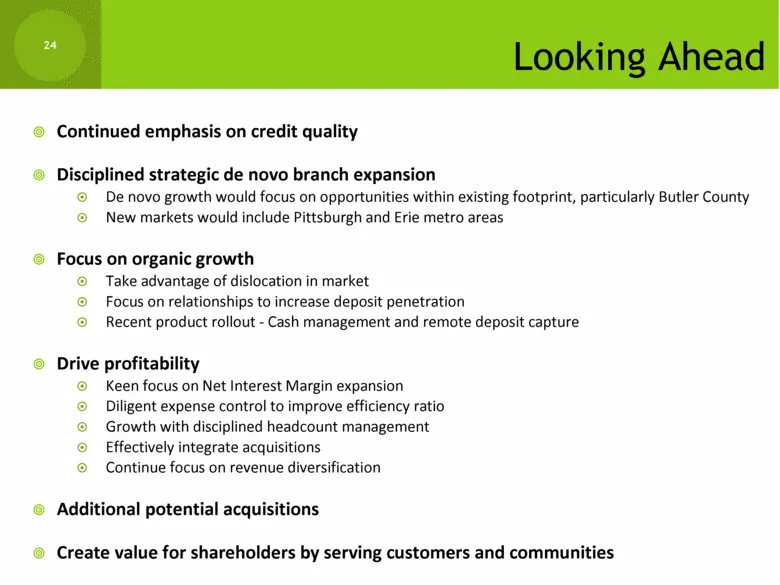
Looking Ahead Continued emphasis on credit quality Disciplined strategic de novo branch expansion De novo growth would focus on opportunities within existing footprint, particularly Butler County New markets would include Pittsburgh and Erie metro areas Focus on organic growth Take advantage of disl
Slide 25: Appendix
Appendix
Slide 26: Efficiency
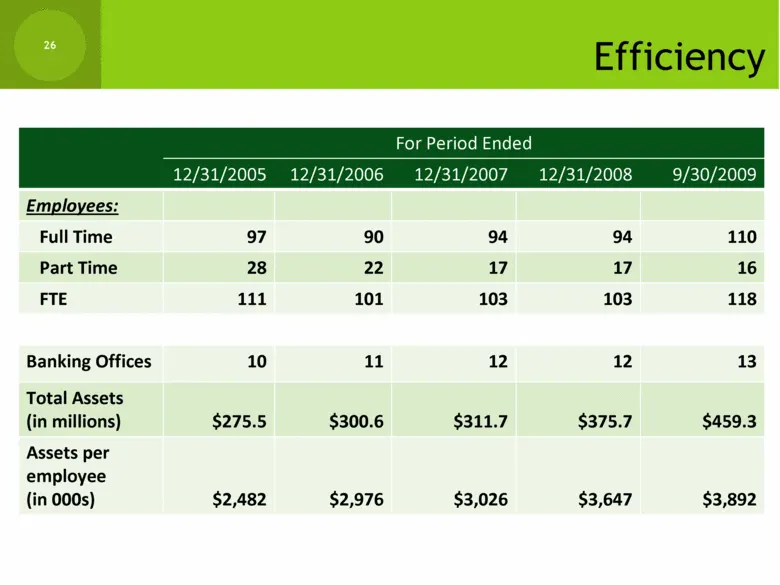
Efficiency For Period Ended 12/31/2005 12/31/2006 12/31/2007 12/31/2008 9/30/2009 Employees: Full Time 97 90 94 94 110 Part Time 28 22 17 17 16 FTE 111 101 103 103 118 Banking Offices 10 11 12 12 13 Total Assets (in millions) $275.5 $300.6 $311.7 $375.7 $459.3 Assets per employee (in 000s) $2,482 $2
Slide 27: Historical Balance Sheet
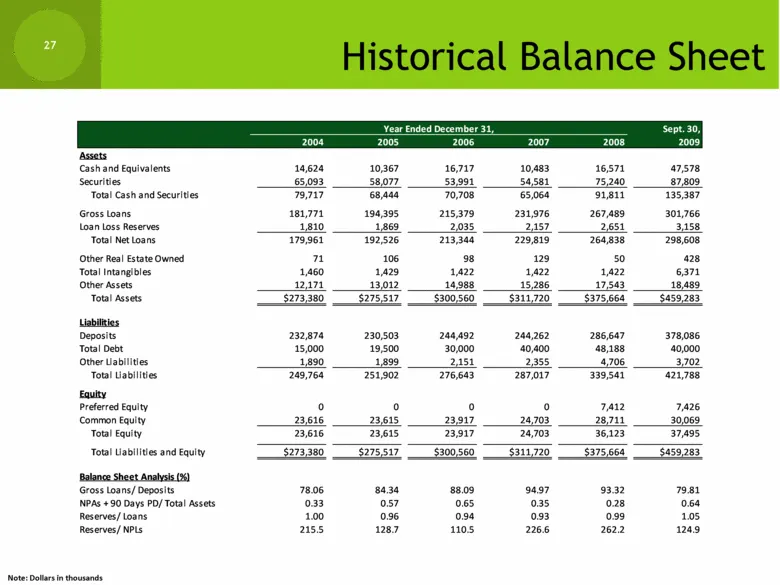
27 Historical Balance Sheet Sept. 30, 2004 2005 2006 2007 2008 2009 Assets Cash and Equivalents 14,624 10,367 16,717 10,483 16,571 47,578 Securities 65,093 58,077 53,991 54,581 75,240 87,809 Total Cash and Securities 79,717 68,444 70,708 65,064 91,811 135,387 Gross Loans 181,771 194,395 215,379 231,
Slide 28: Historical Income Statement
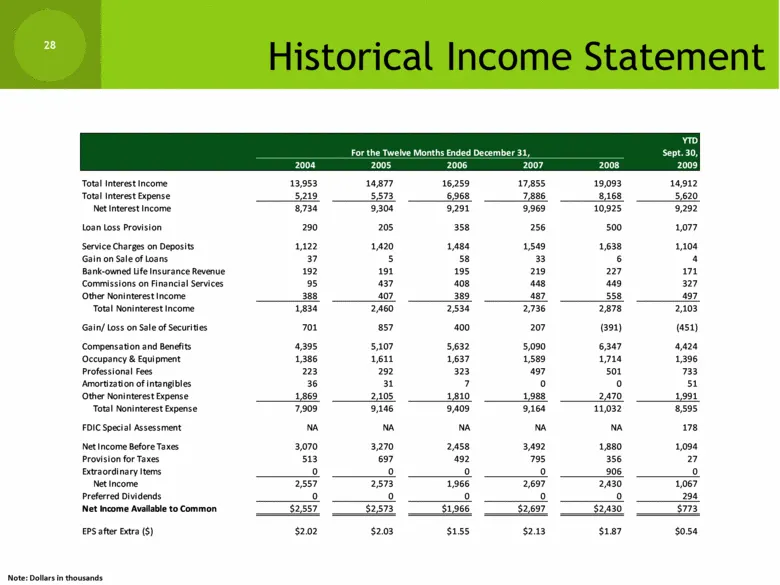
28 YTD Sept. 30, 2004 2005 2006 2007 2008 2009 Total Interest Income 13,953 14,877 16,259 17,855 19,093 14,912 Total Interest Expense 5,219 5,573 6,968 7,886 8,168 5,620 Net Interest Income 8,734 9,304 9,291 9,969 10,925 9,292 Loan Loss Provision 290 205 358 256 500 1,077 Service Charges on Deposits
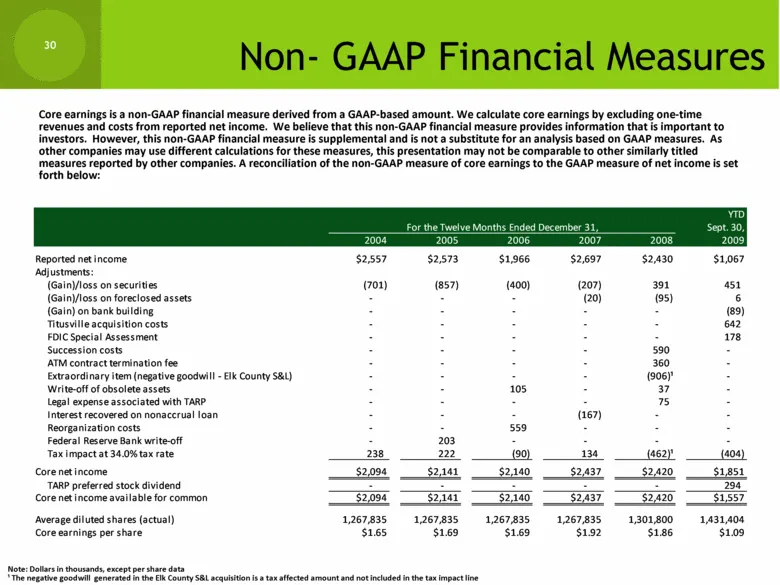
Slide 29: Non-GAAP Financial Measures
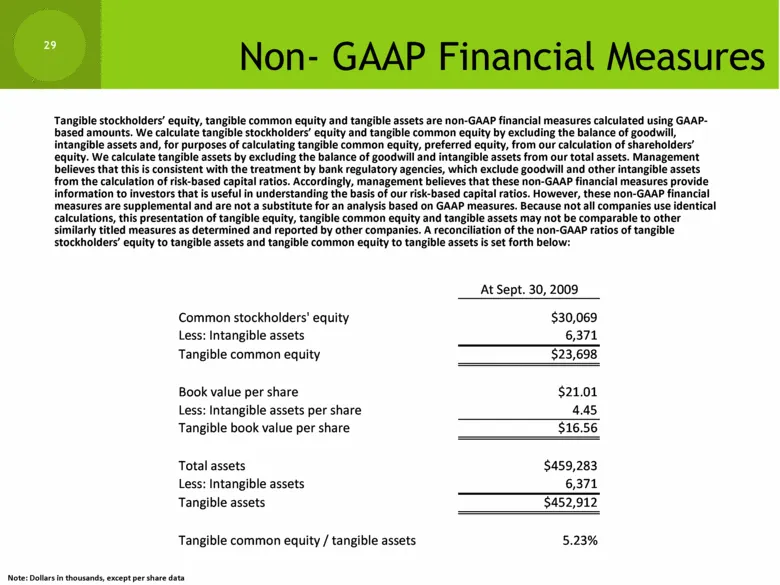
Non- GAAP Financial Measures Tangible stockholders’ equity, tangible common equity and tangible assets are non-GAAP financial measures calculated using GAAP-based amounts. We calculate tangible stockholders’ equity and tangible common equity by excluding the balance of goodwill, intangible assets an
Slide 30: Non-GAAP Financial Measures
30 Non- GAAP Financial Measures YTD Sept. 30, 2004 2005 2006 2007 2008 2009 Reported net income $2,557 $2,573 $1,966 $2,697 $2,430 $1,067 Adjustments: (Gain)/loss on securities (701) (857) (400) (207) 391 451 (Gain)/loss on foreclosed assets - - - (20) (95) 6 (Gain) on bank building - - - - - (89) T
Source: SEC EDGAR · FWP filed Nov 5, 2009
More decks from Emclaire Financial Corp
 Merger or Acquisition (March 2022)13 slides · Mar 24, 2022
 Shareholder Meeting (April 2021)36 slides · Apr 21, 2021
 Shareholder Meeting (April 2020)32 slides · Apr 22, 2020
 Raymond James Emerging Bank Symposium (September 2019)23 slides · Sep 4, 2019
 Shareholder Meeting (April 2019)32 slides · Apr 24, 2019
 Shareholder Meeting (April 2018)28 slides · Apr 25, 2018