Chittenden — Investor Presentation (November 2006)
37 slides from Chittenden's investor presentation, Nov 15, 2006

Slide 1: Investor Presentation as of September 30, 2006
Exhibit 99.1 As of September 30, 2006
Slide 2: Who We Are
Who We Are • Multi-bank holding company with significant operating autonomy at the individual banks • Banking assets of $6.5 billion at September 30, 2006 • Listed on the NYSE (CHZ), market capitalization as of September 30, 2006 was $1.3 billion • 122 full service banking offices and 153 ATM locati
Slide 3: A Tradition of Success
A Tradition of Success Recognized competency in an attractive business mix Deep relationships with worthwhile customers Conservative underwriting standards and disciplined lending Efficient generator of low cost stable deposits Proven leadership focus to achieve superior financial results Well-estab
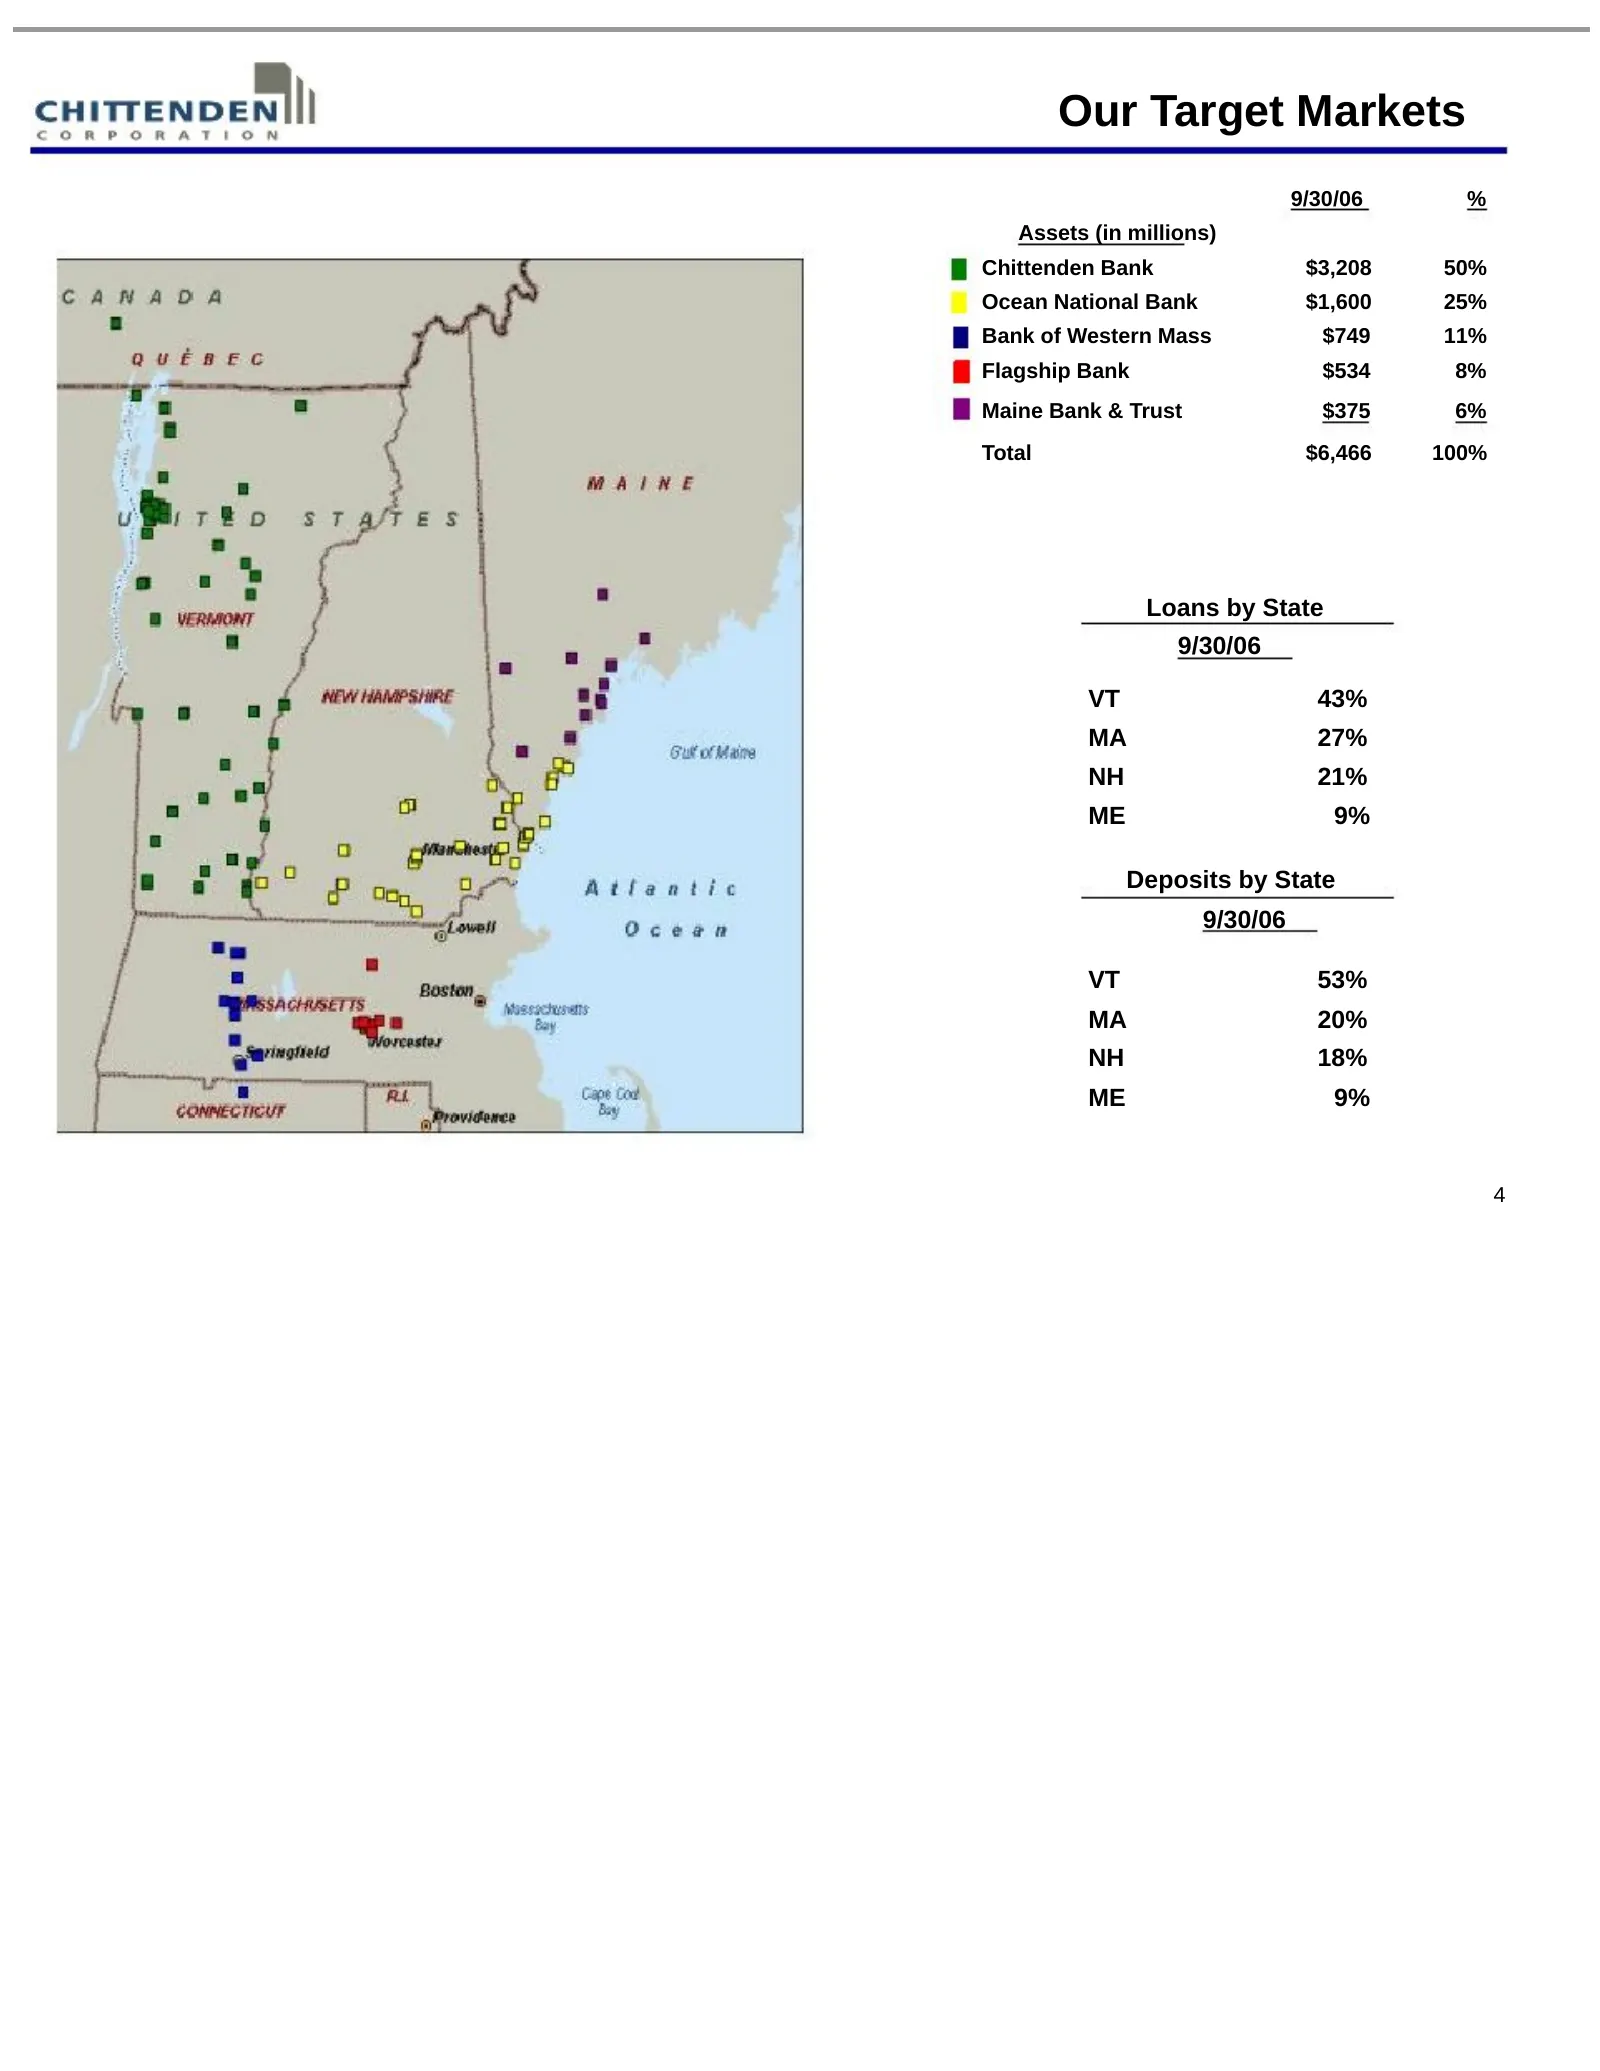
Slide 4: Our Target Markets
Our Target Markets 9/30/06 % Assets (in millions) Chittenden Bank $3,208 50% Ocean National Bank $1,600 25% Bank of Western Mass $749 11% Flagship Bank $534 8% Maine Bank & Trust $375 6% Total $6,466 100% Loans by State 9/30/06 VT 43% MA 27% NH 21% ME 9% Deposits by State 9/30/06 VT 53% MA 20% NH 18
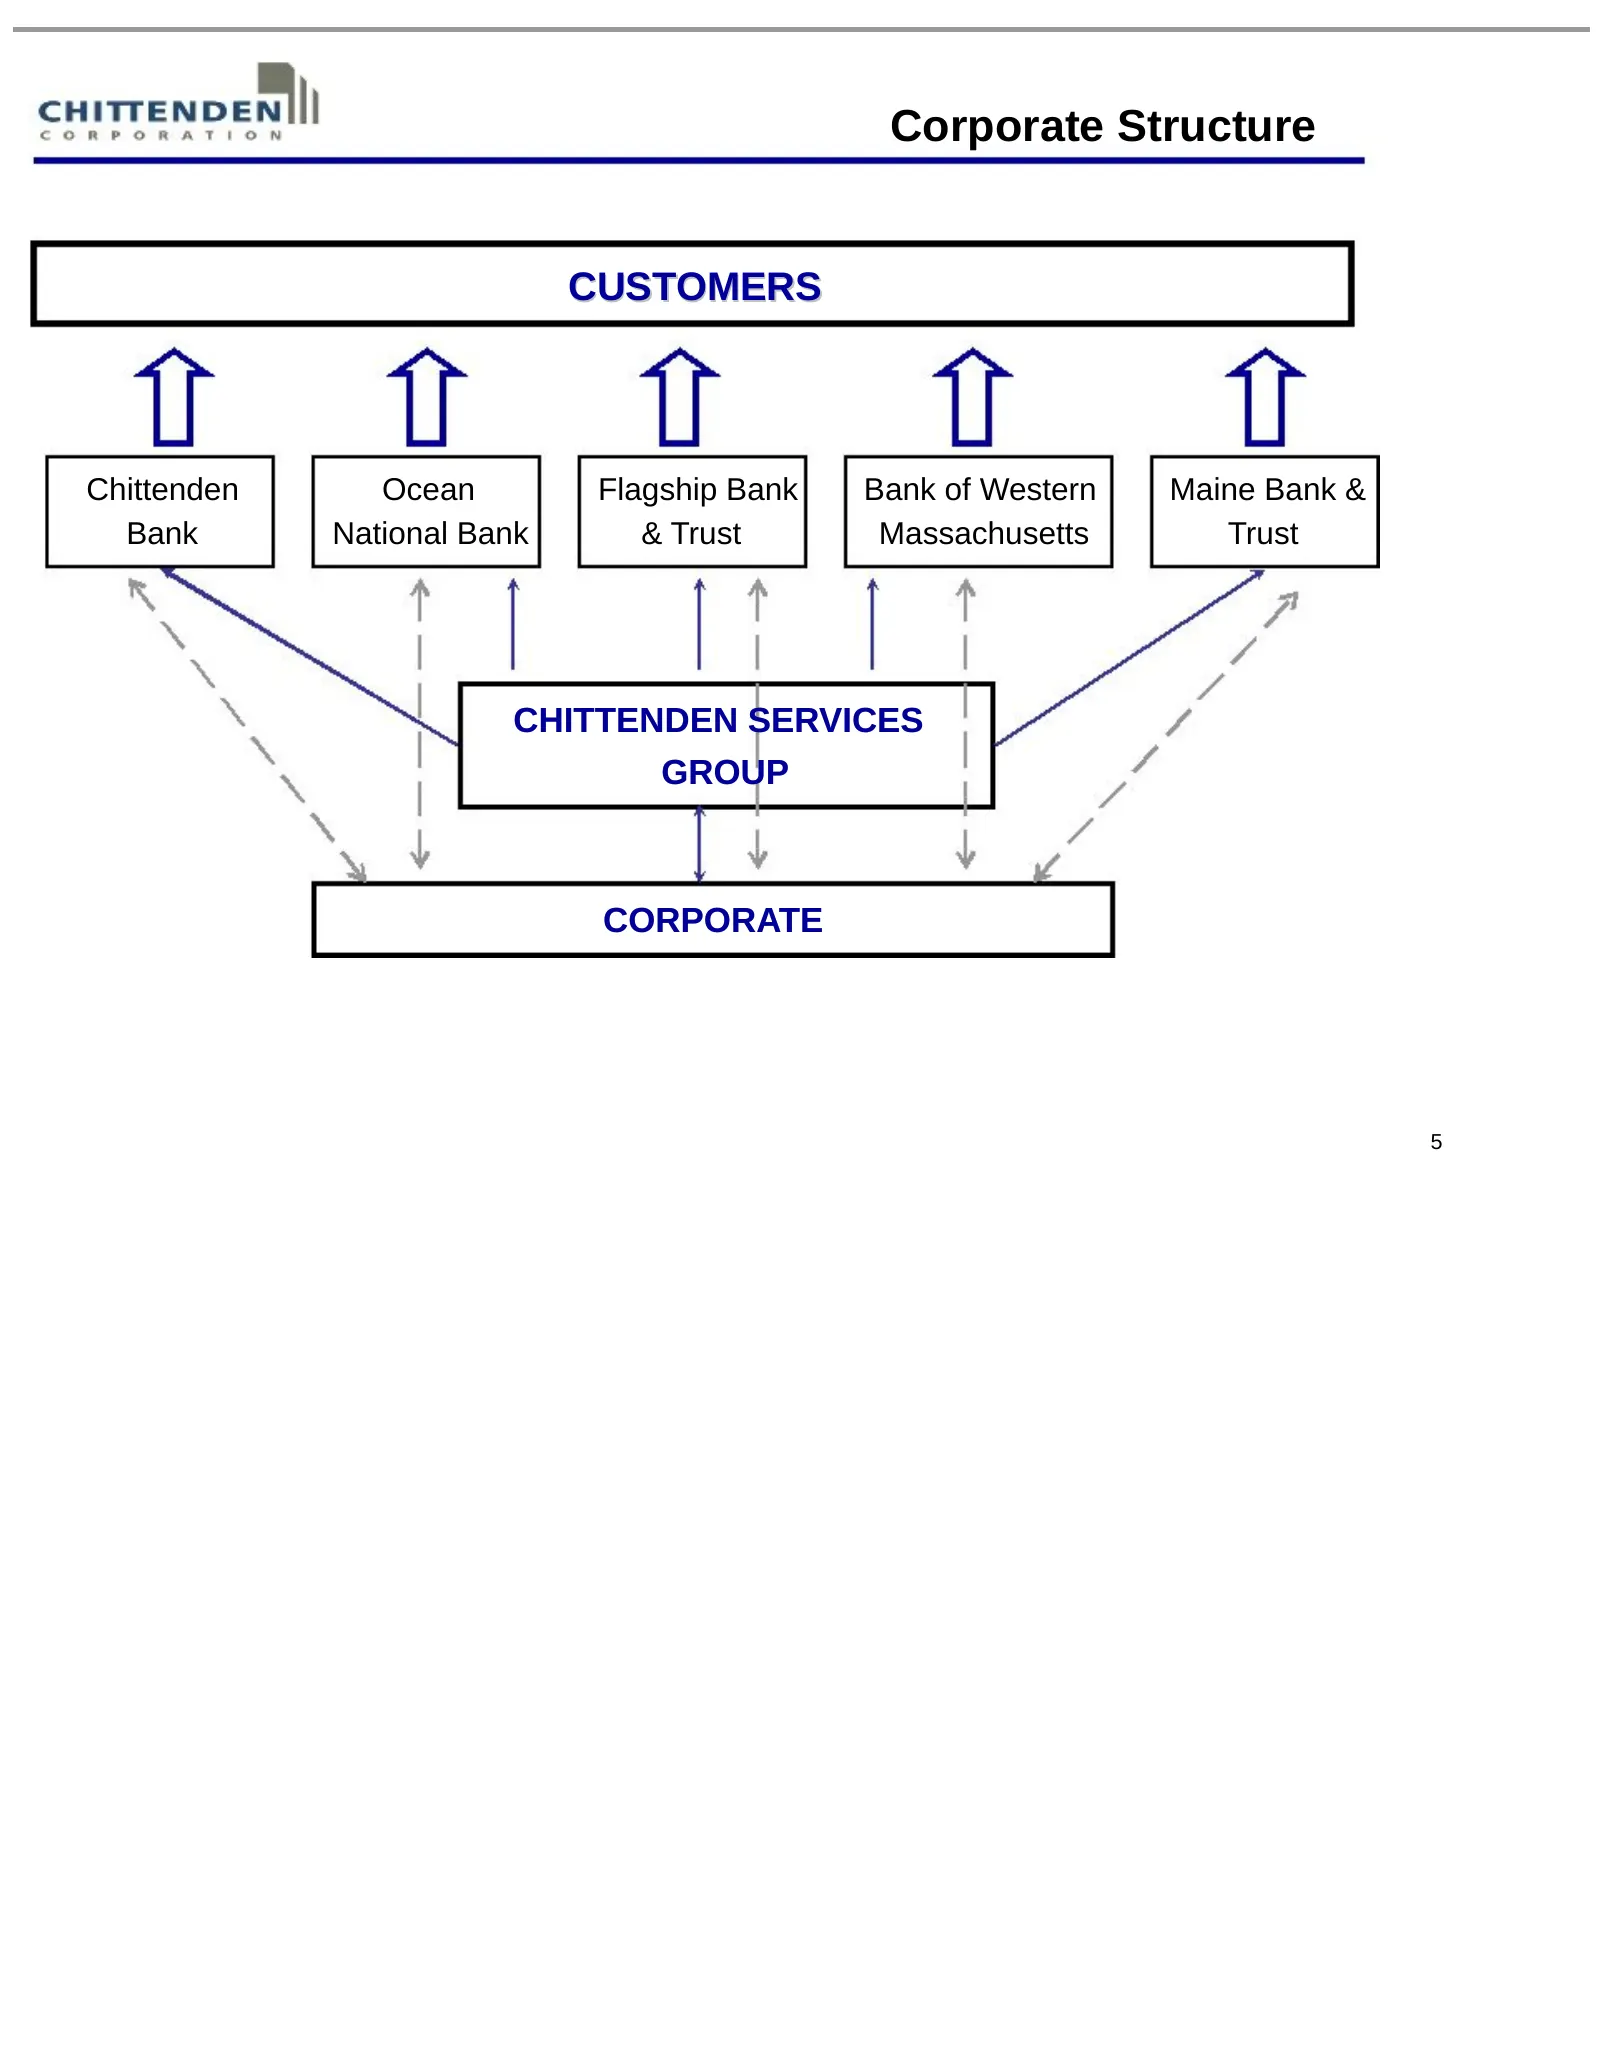
Slide 5: Corporate Structure
Corporate Structure CUSTOMERS Chittenden Ocean Flagship Bank Bank of Western Maine Bank & Bank National Bank & Trust Massachusetts Trust CHITTENDEN SERVICES GROUP CORPORATE 5
Slide 6: Our Target Markets: Vermont Market
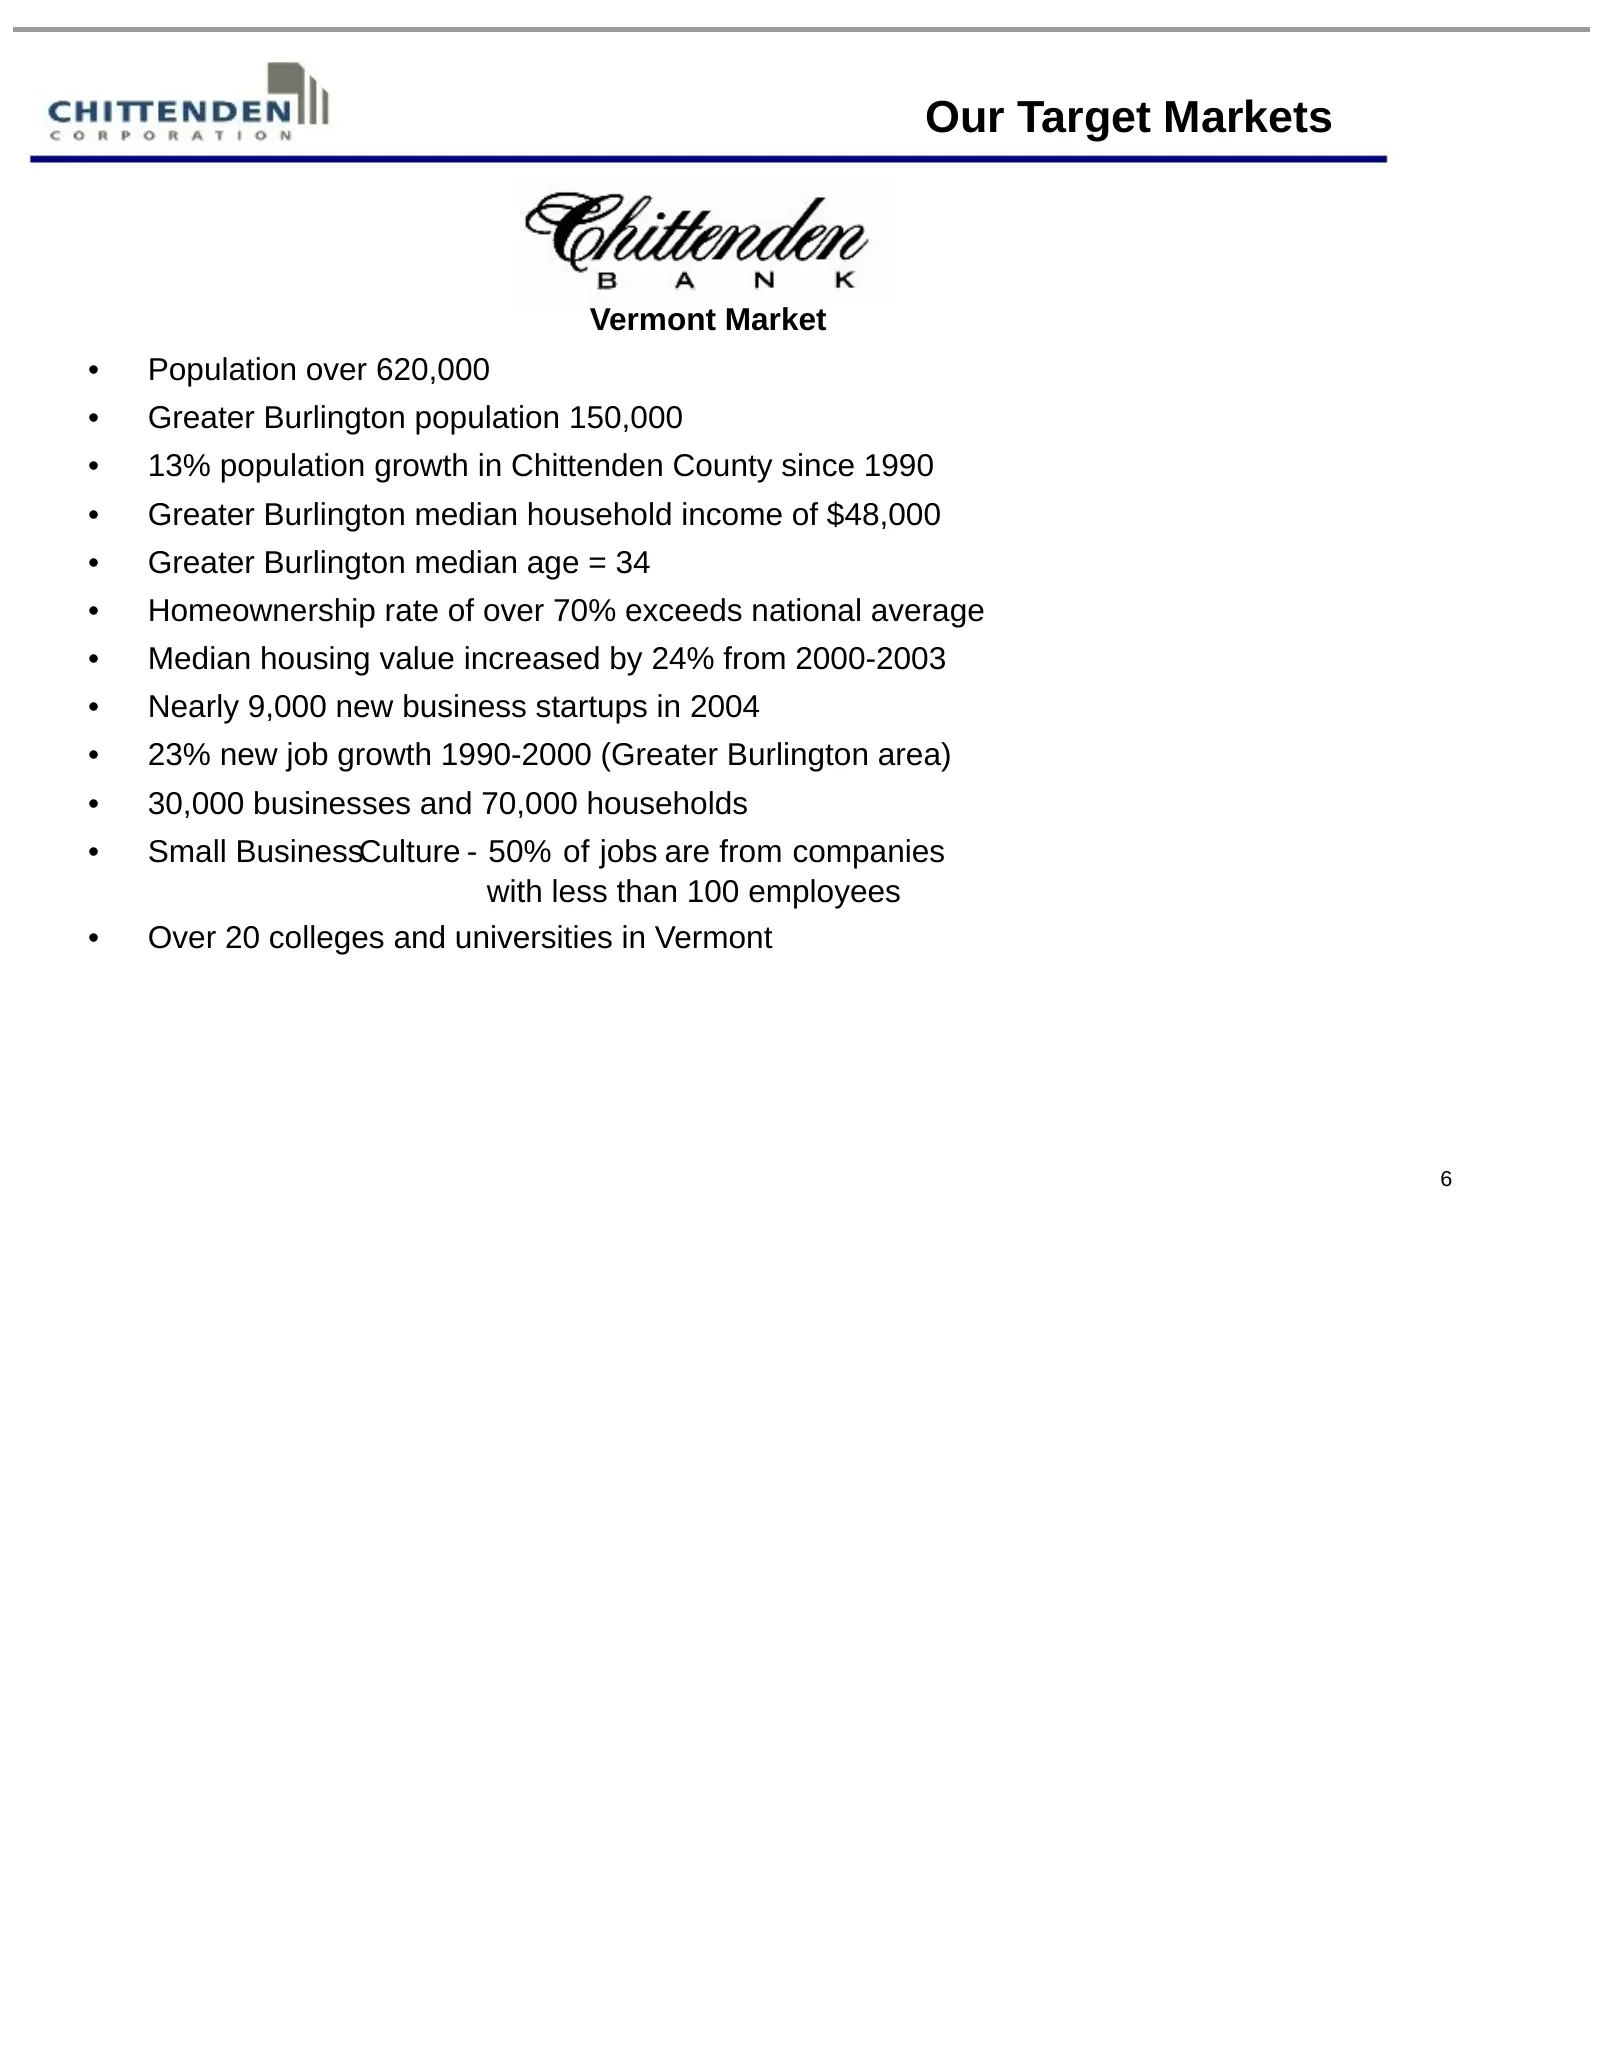
Our Target Markets Vermont Market • Population over 620,000 • Greater Burlington population 150,000 • 13% population growth in Chittenden County since 1990 • Greater Burlington median household income of $48,000 • Greater Burlington median age = 34 • Homeownership rate of over 70% exceeds national a
Slide 7: Our Target Markets: Springfield and Worcester
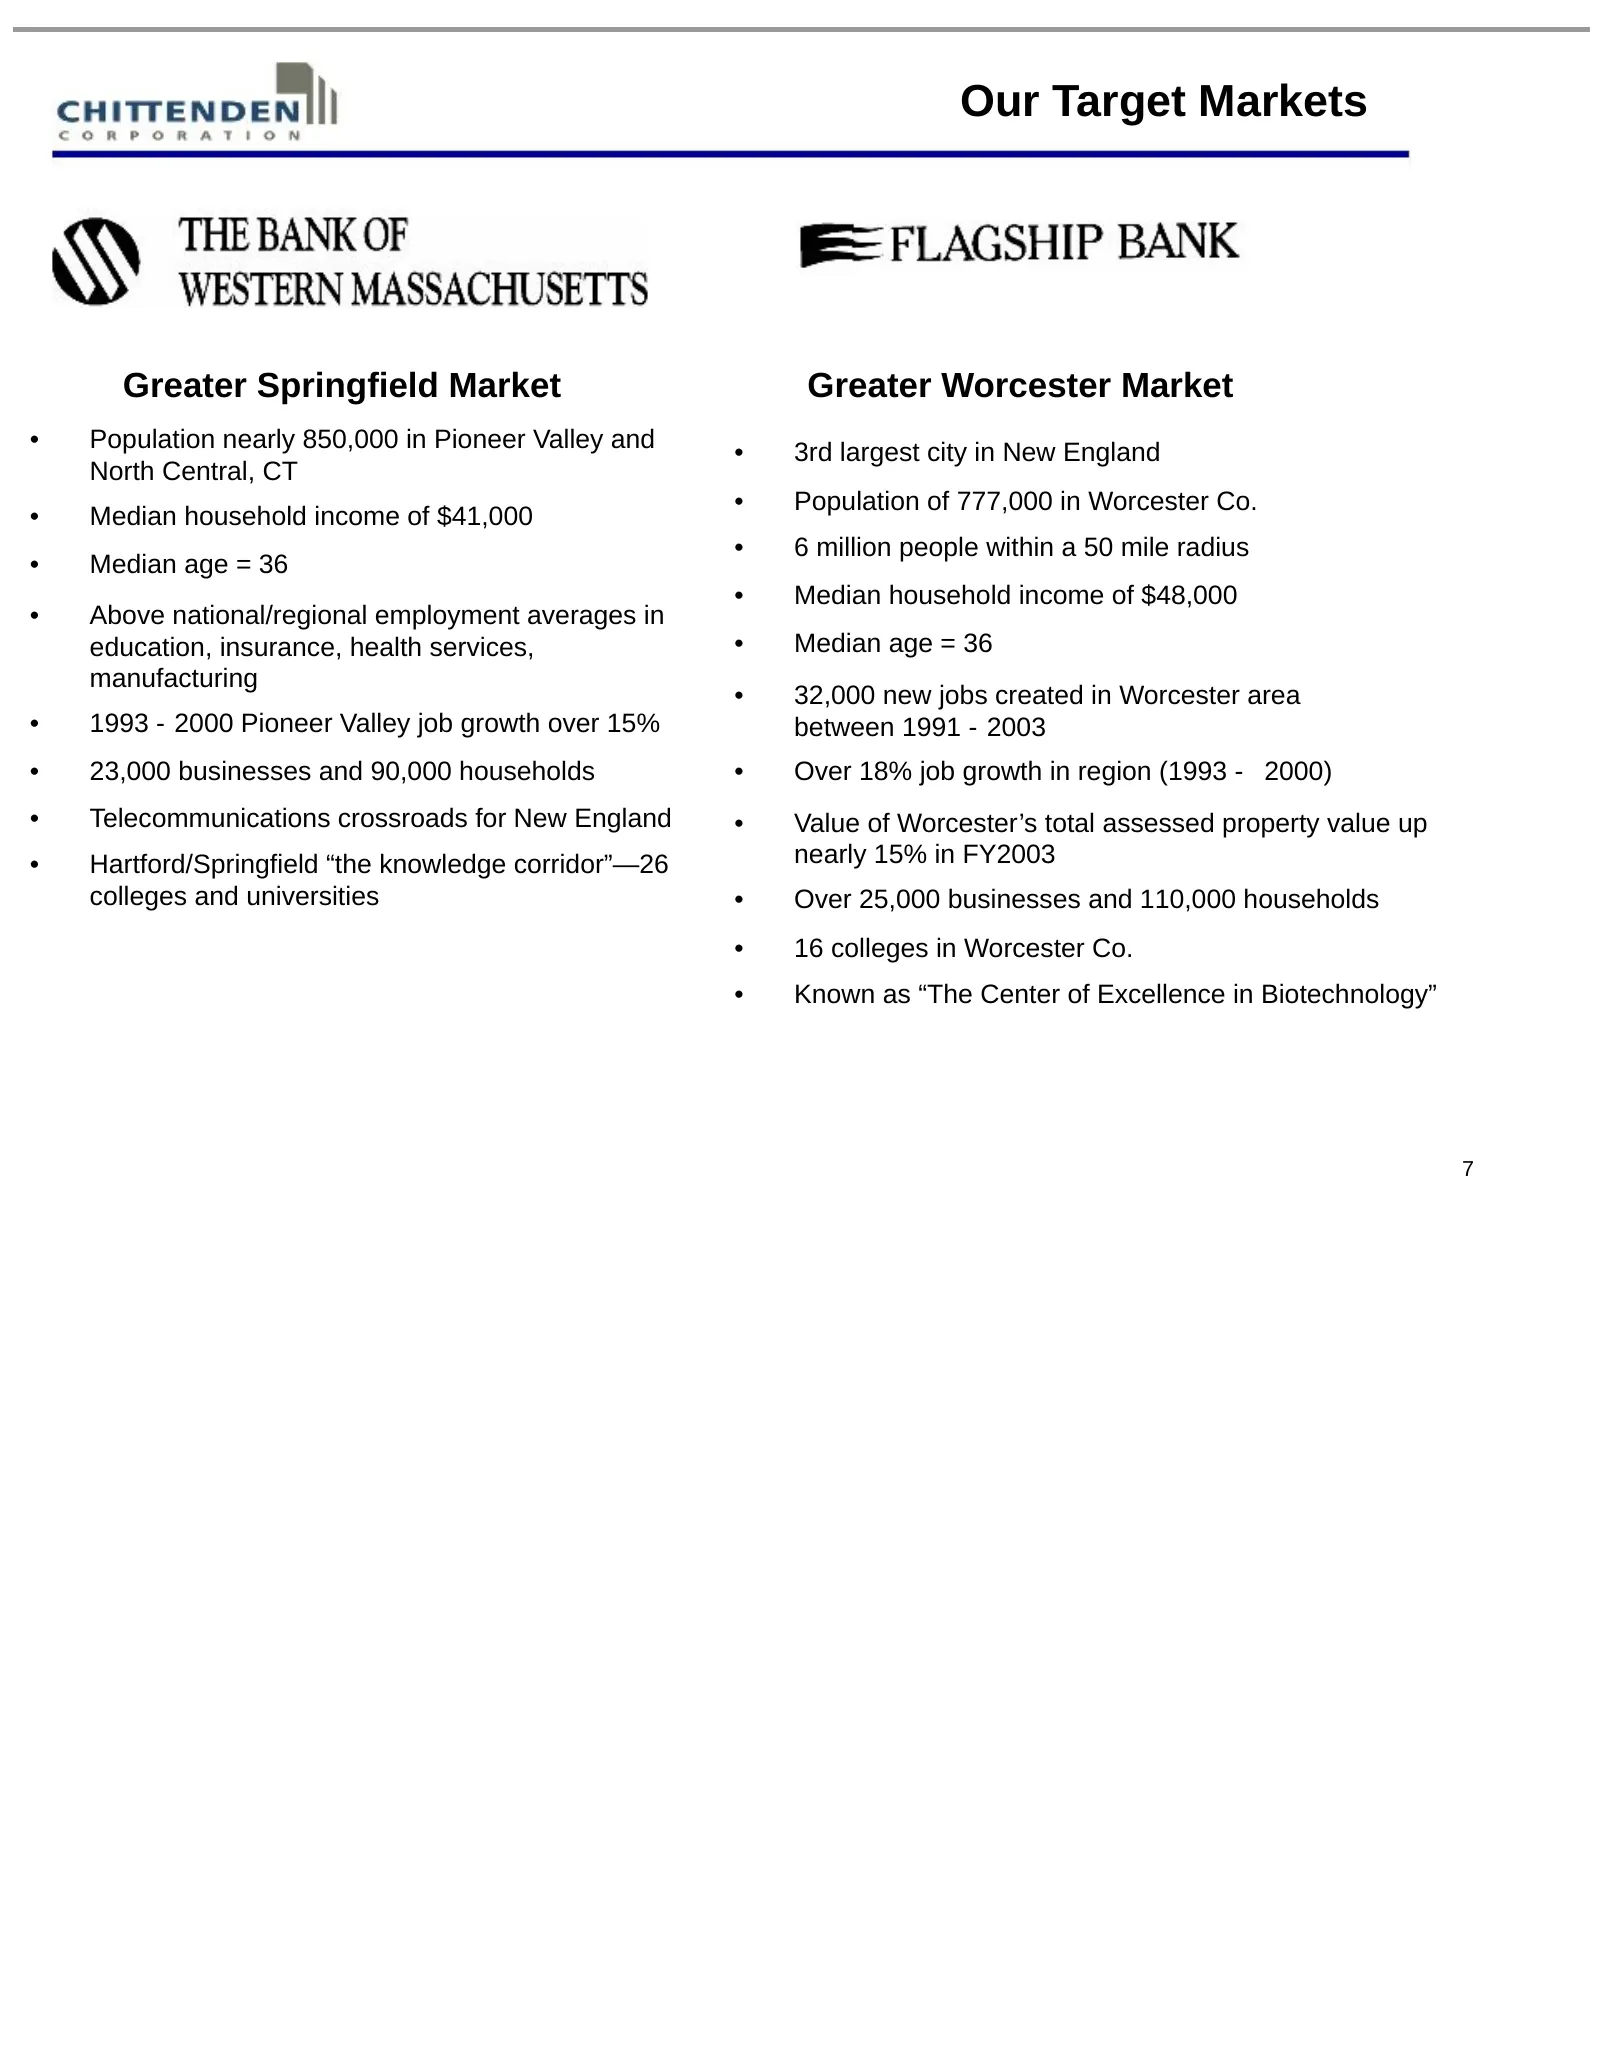
Our Target Markets Greater Springfield Market Greater Worcester Market • Population nearly 850,000 in Pioneer Valley and • 3rd largest city in New England North Central, CT • Population of 777,000 in Worcester Co. • Median household income of $41,000 • 6 million people within a 50 mile radius • Medi
Slide 8: Our Target Markets: Southern NH and Portland
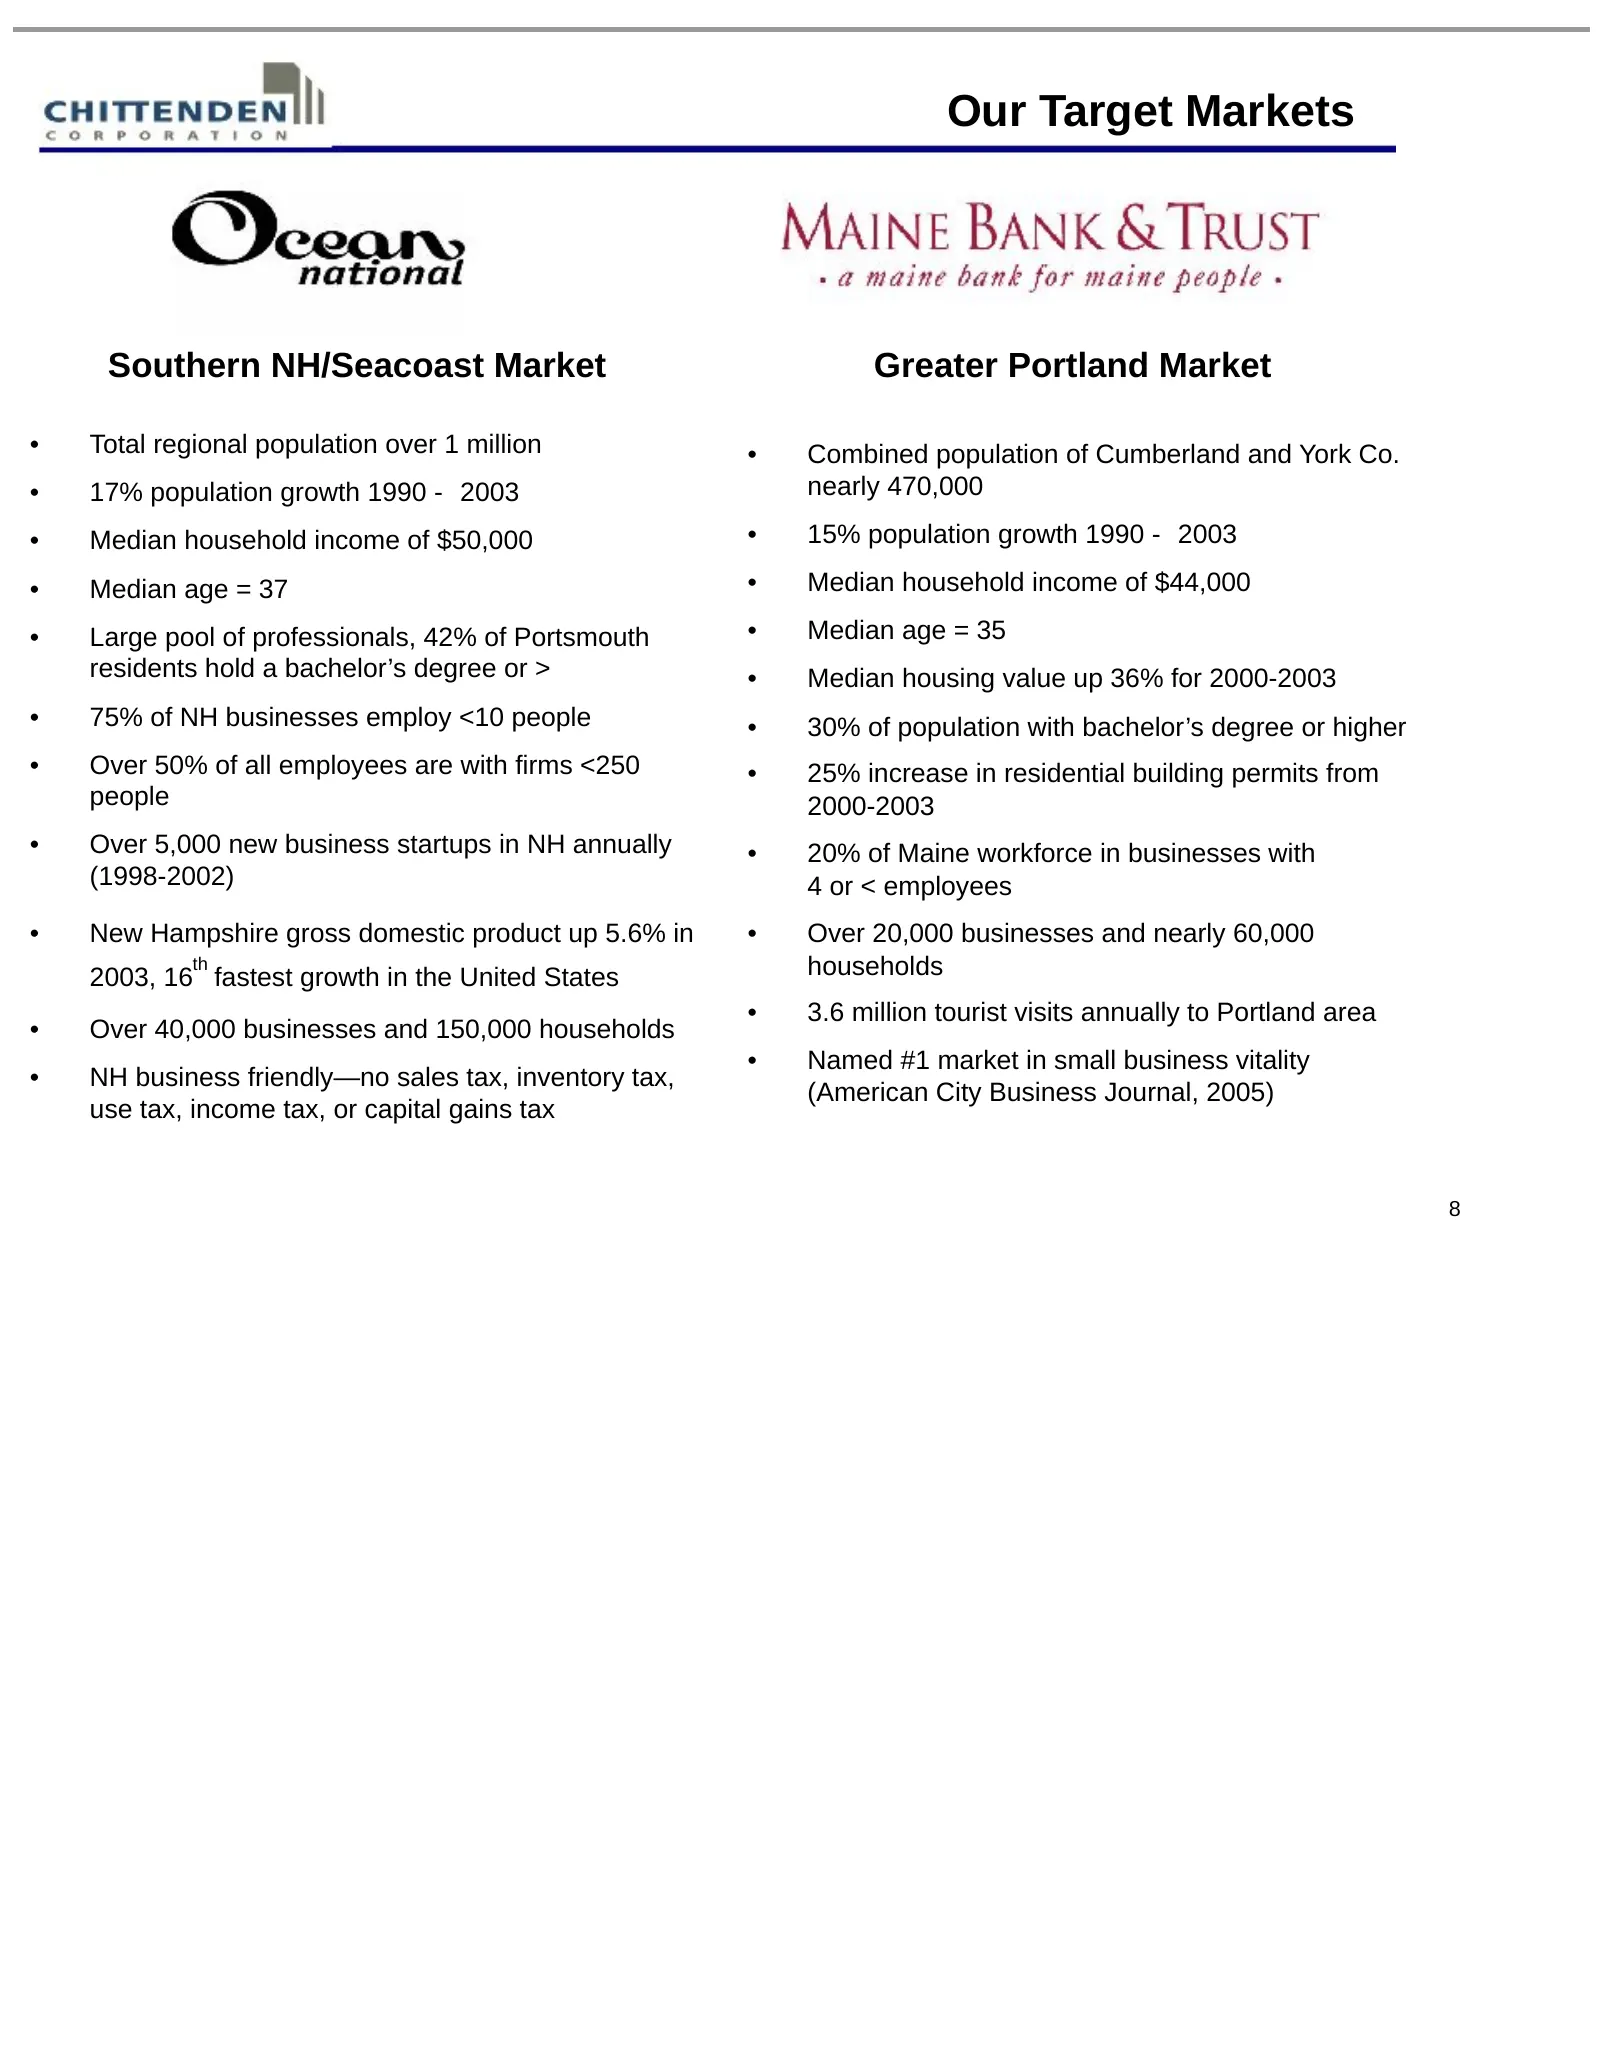
Our Target Markets Southern NH/Seacoast Market Greater Portland Market • Total regional population over 1 million • Combined population of Cumberland and York Co. • 17% population growth 1990 - 2003 nearly 470,000 • Median household income of $50,000 • 15% population growth 1990 - 2003 • Median age
Slide 9: Our Target Customers
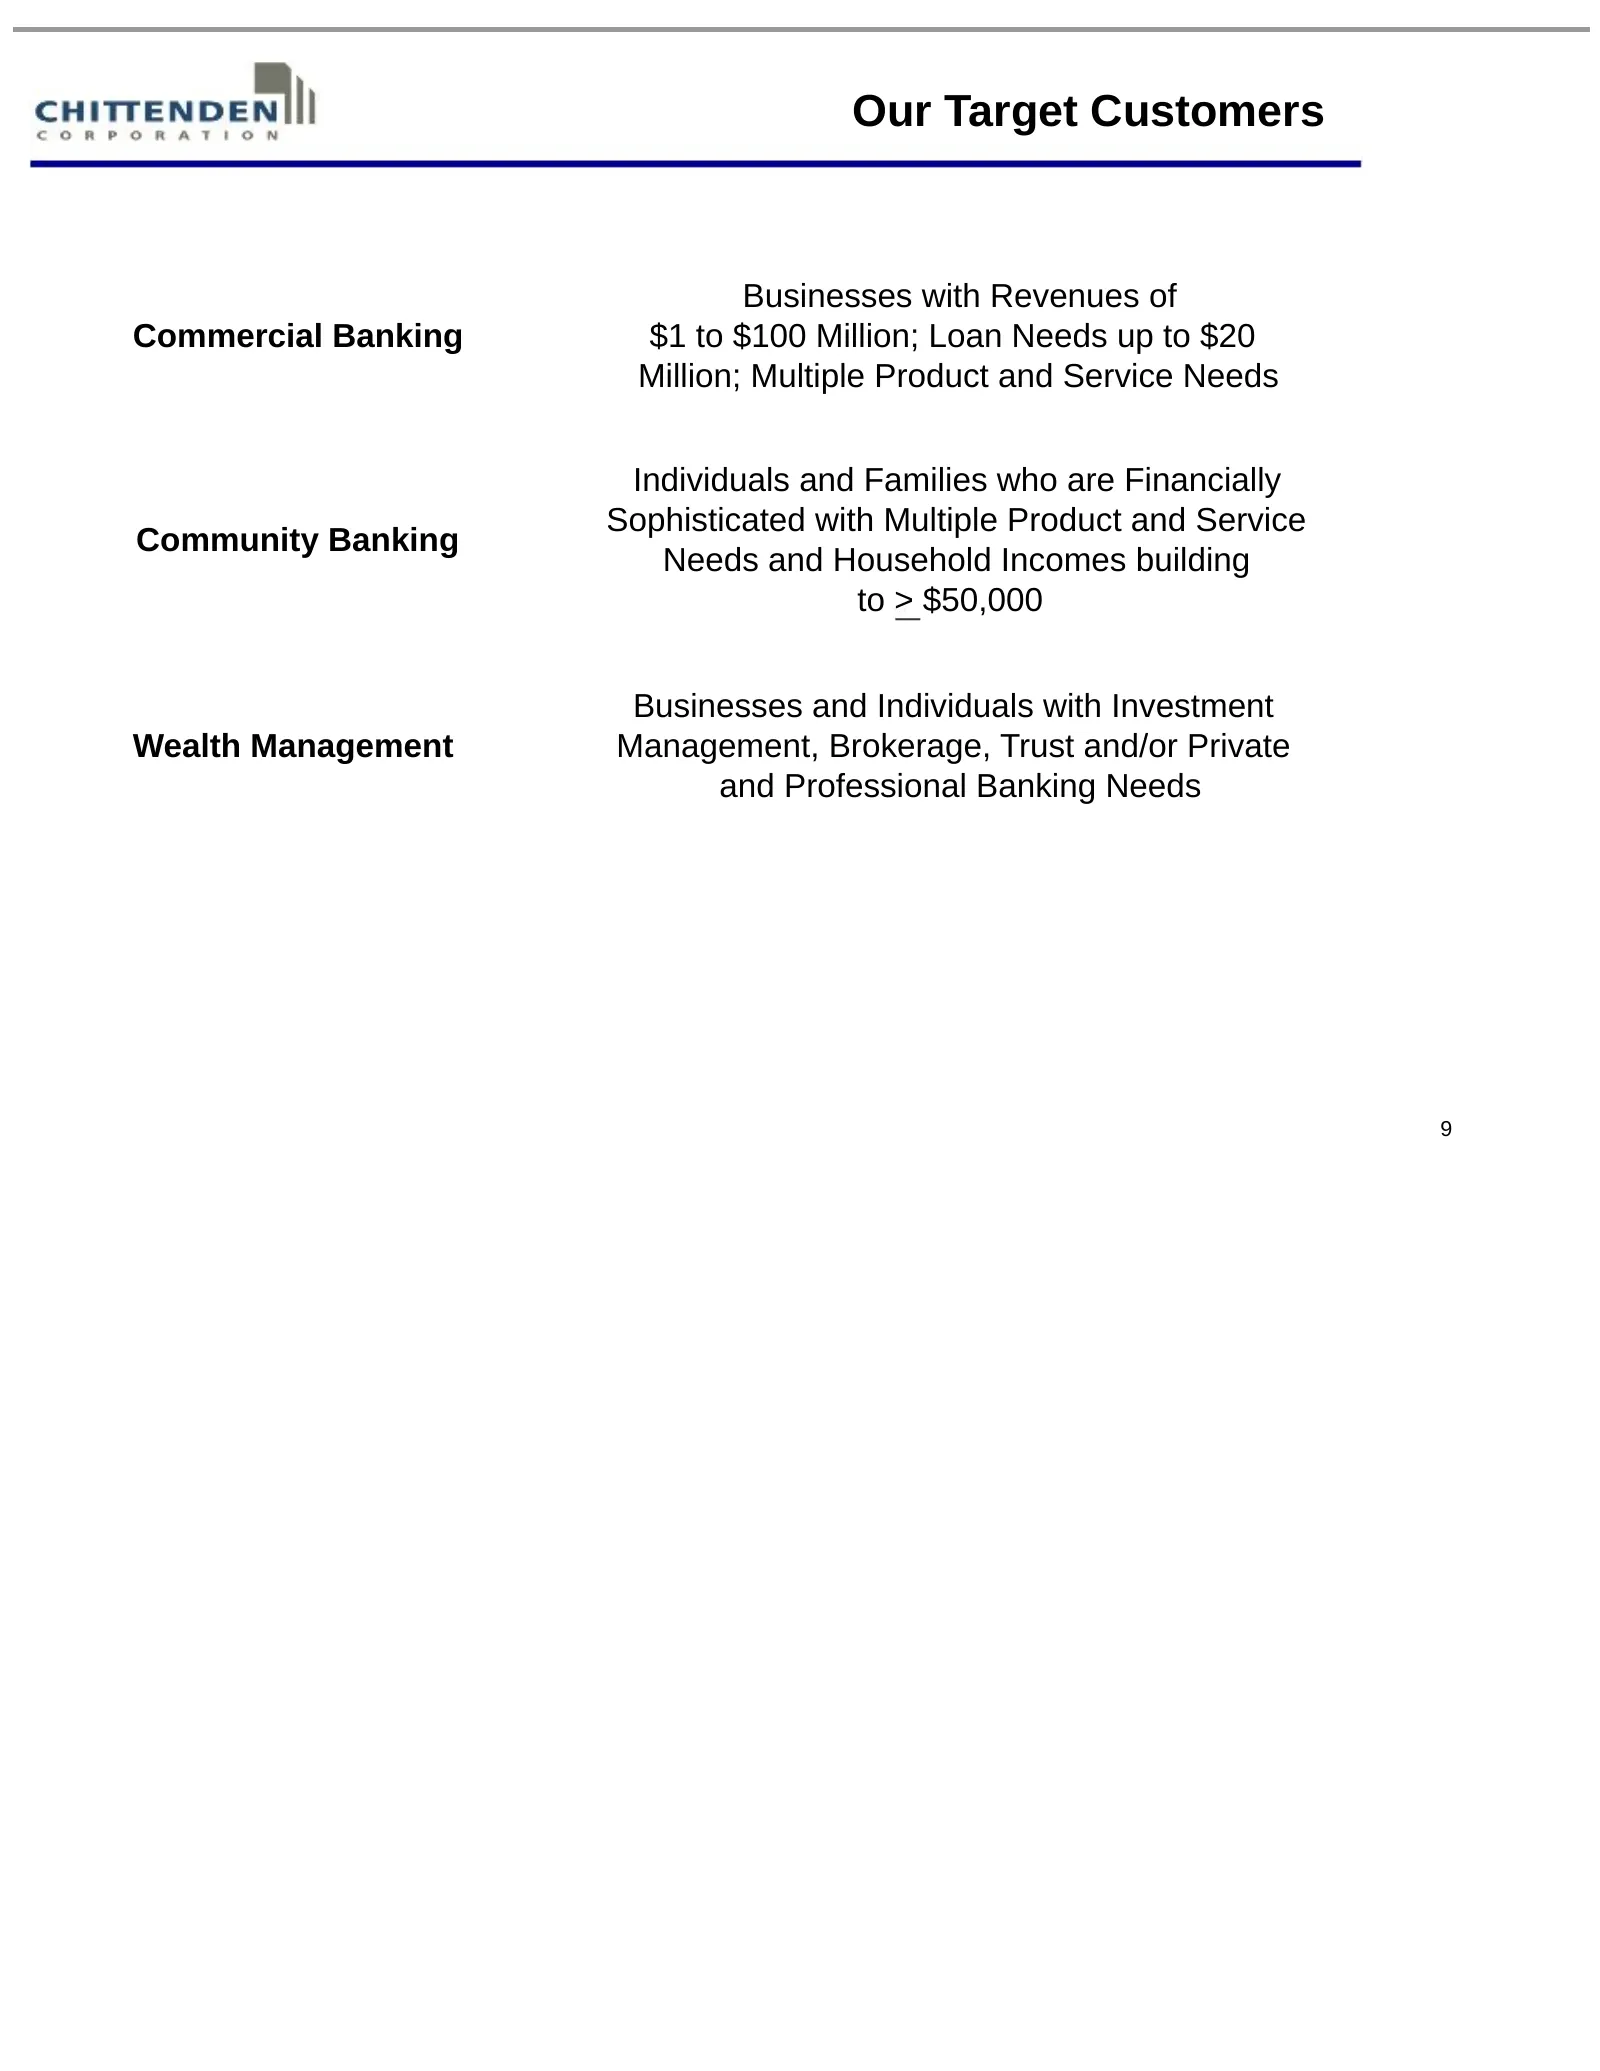
Our Target Customers Businesses with Revenues of Commercial Banking $1 to $100 Million; Loan Needs up to $20 Million; Multiple Product and Service Needs Individuals and Families who are Financially Sophisticated with Multiple Product and Service Community Banking Needs and Household Incomes building
Slide 10: Commercial & Community Banking
Commercial & Community Banking 10
Slide 11: A Diversified Loan Portfolio
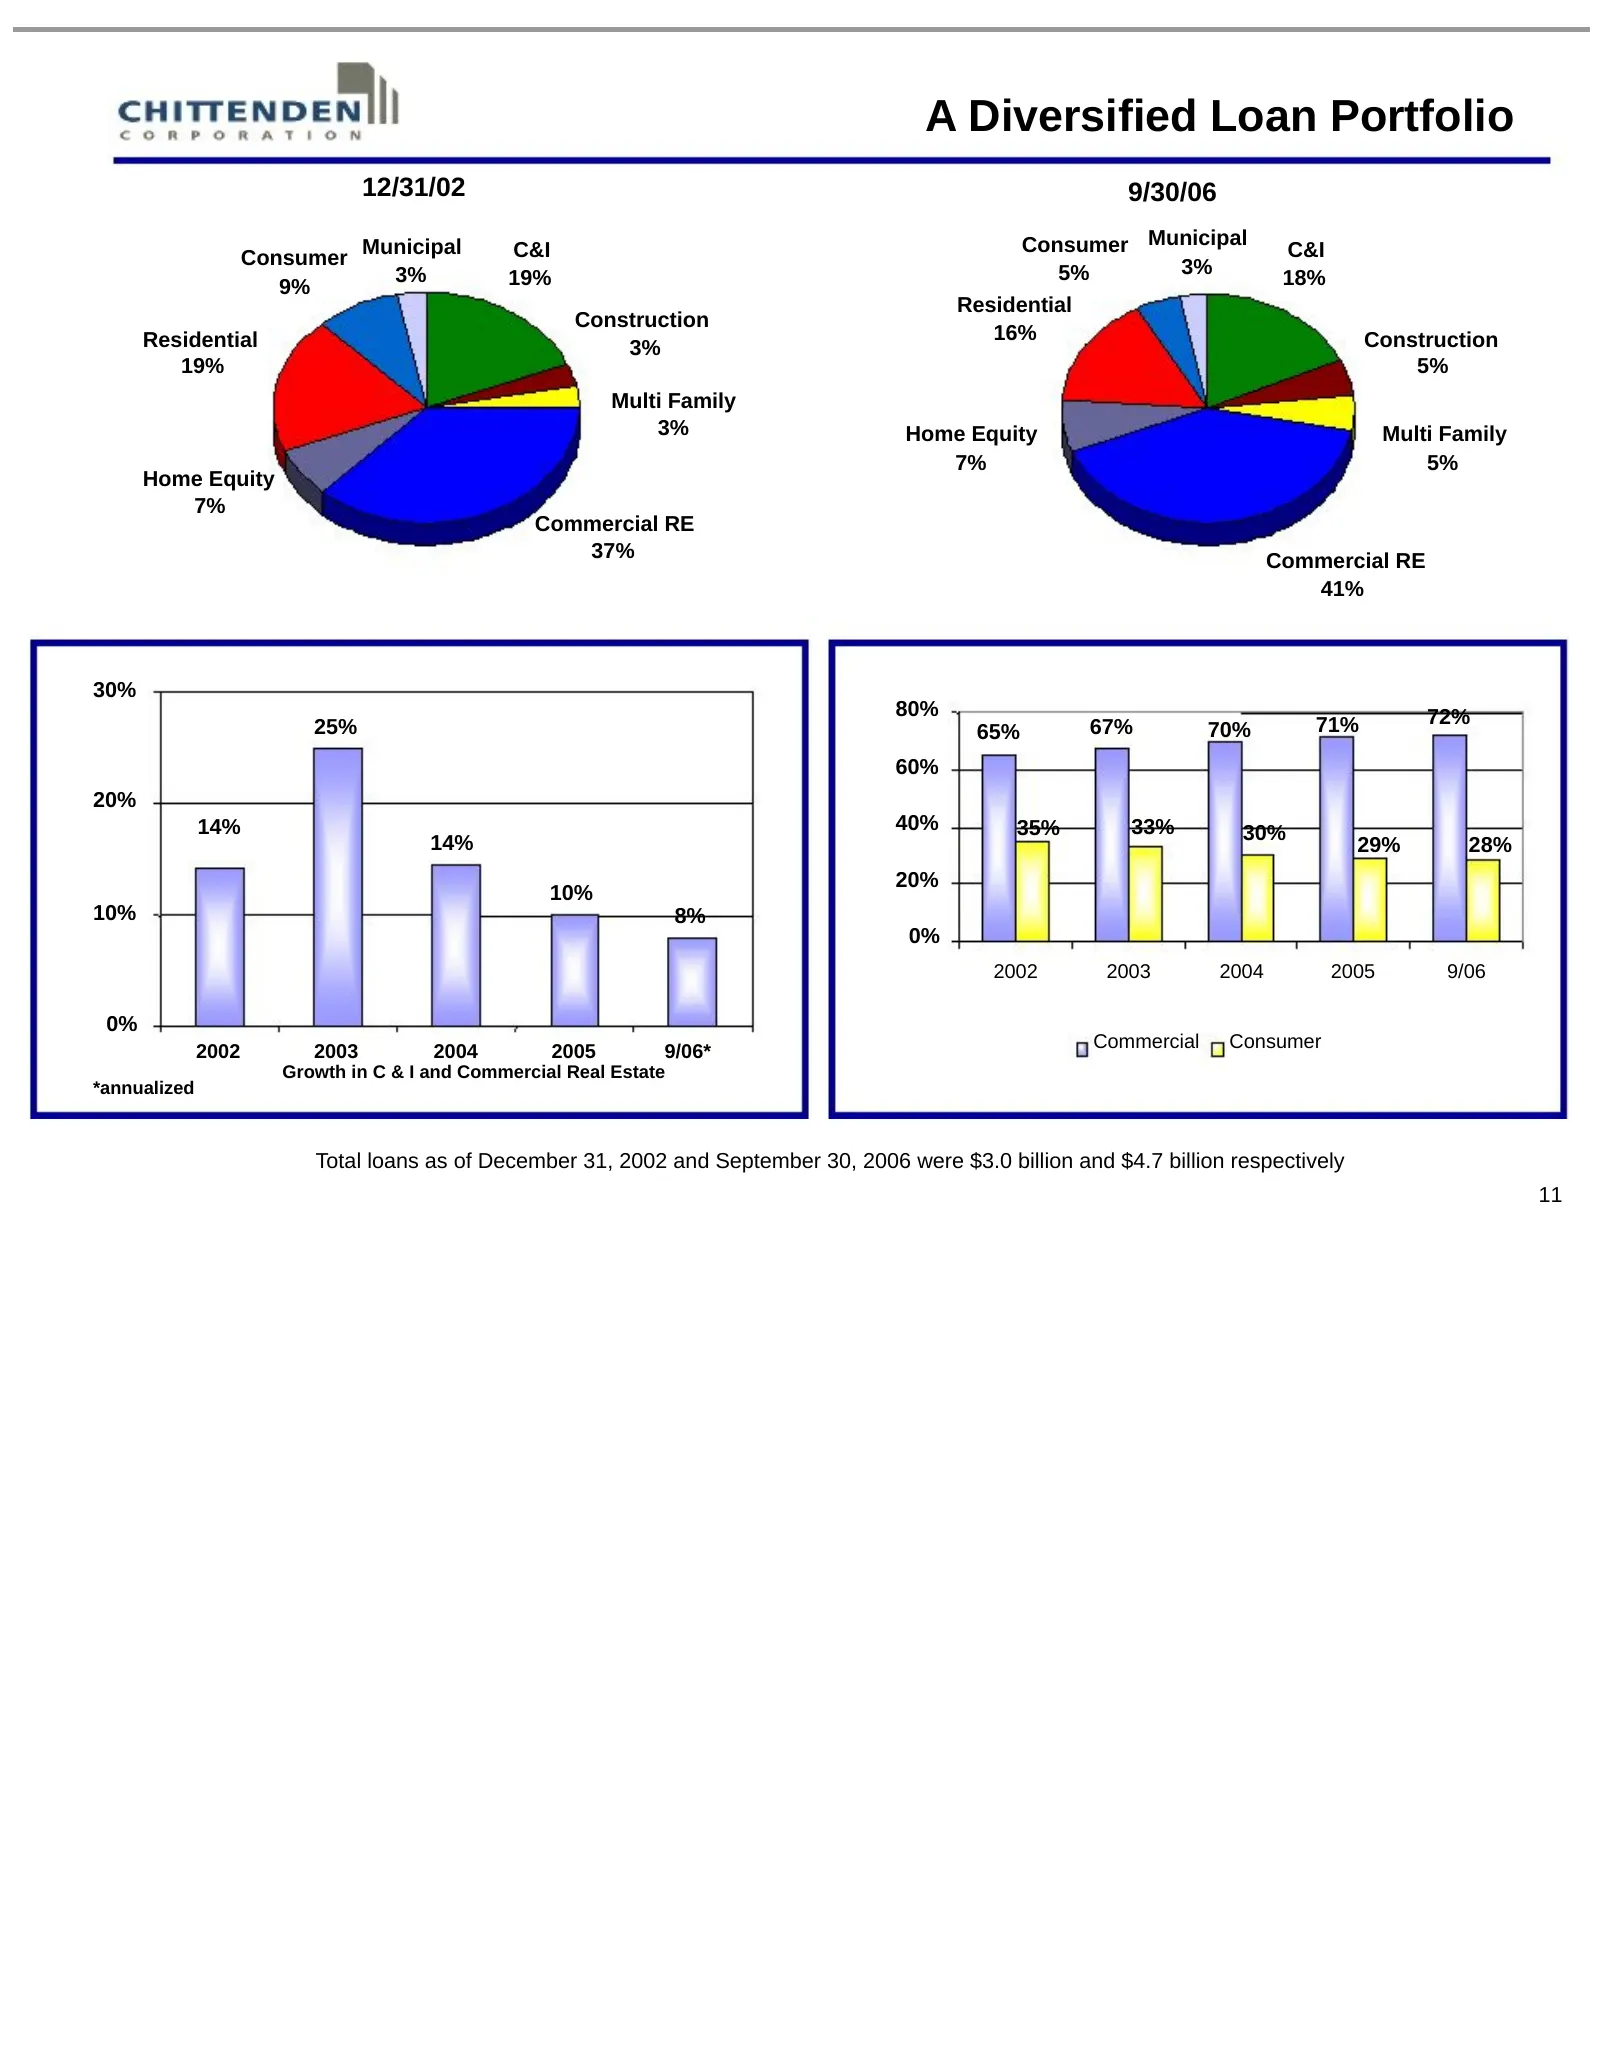
A Diversified Loan Portfolio 12/31/02 9/30/06 Municipal C&I Consumer Municipal C&I Consumer 3% 3% 19% 5% 18% 9% Residential Construction Residential 16% Construction 3% 19% 5% Multi Family 3% Home Equity Multi Family 7% 5% Home Equity 7% Commercial RE 37% Commercial RE 41% 30% 80% 72% 25% 65% 67% 70
Slide 12: Commercial Loan Diversification by Industry
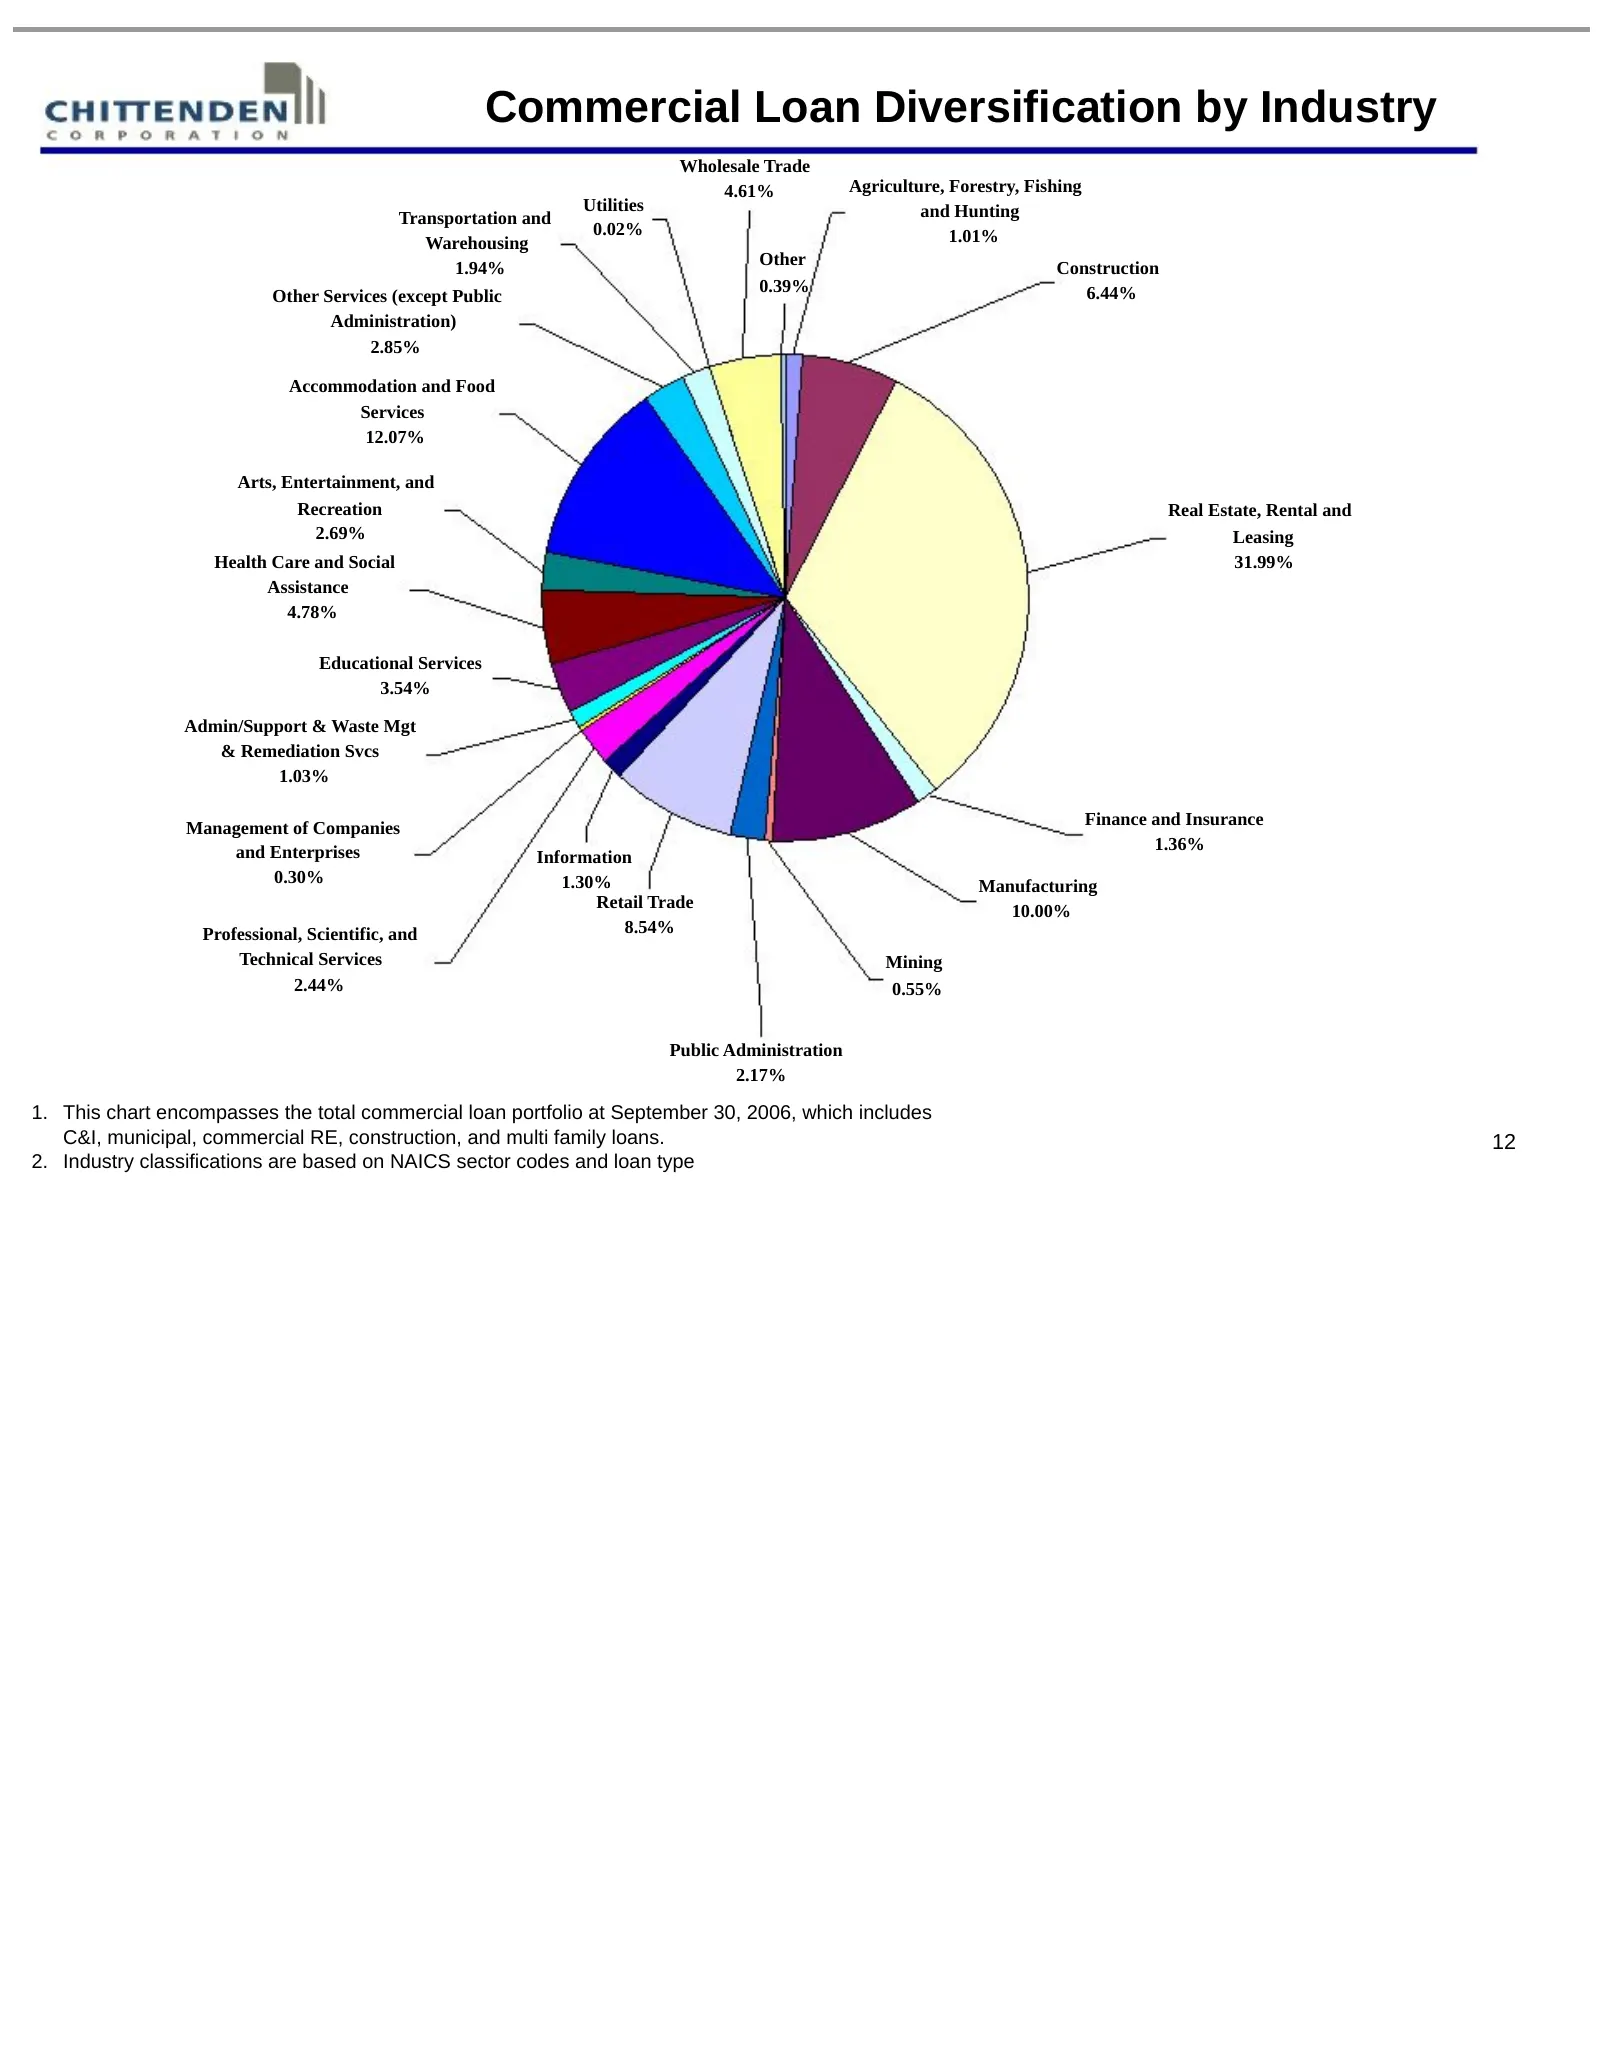
Commercial Loan Diversification by Industry Wholesale Trade 4.61% Agriculture, Forestry, Fishing Utilities and Hunting Transportation and 0.02% 1.01% Warehousing 1.94% Other Construction 0.39% 6.44% Other Services (except Public Administration) 2.85% Accommodation and Food Services 12.07% Arts, Ente
Slide 13: Real Estate, Rental and Leasing
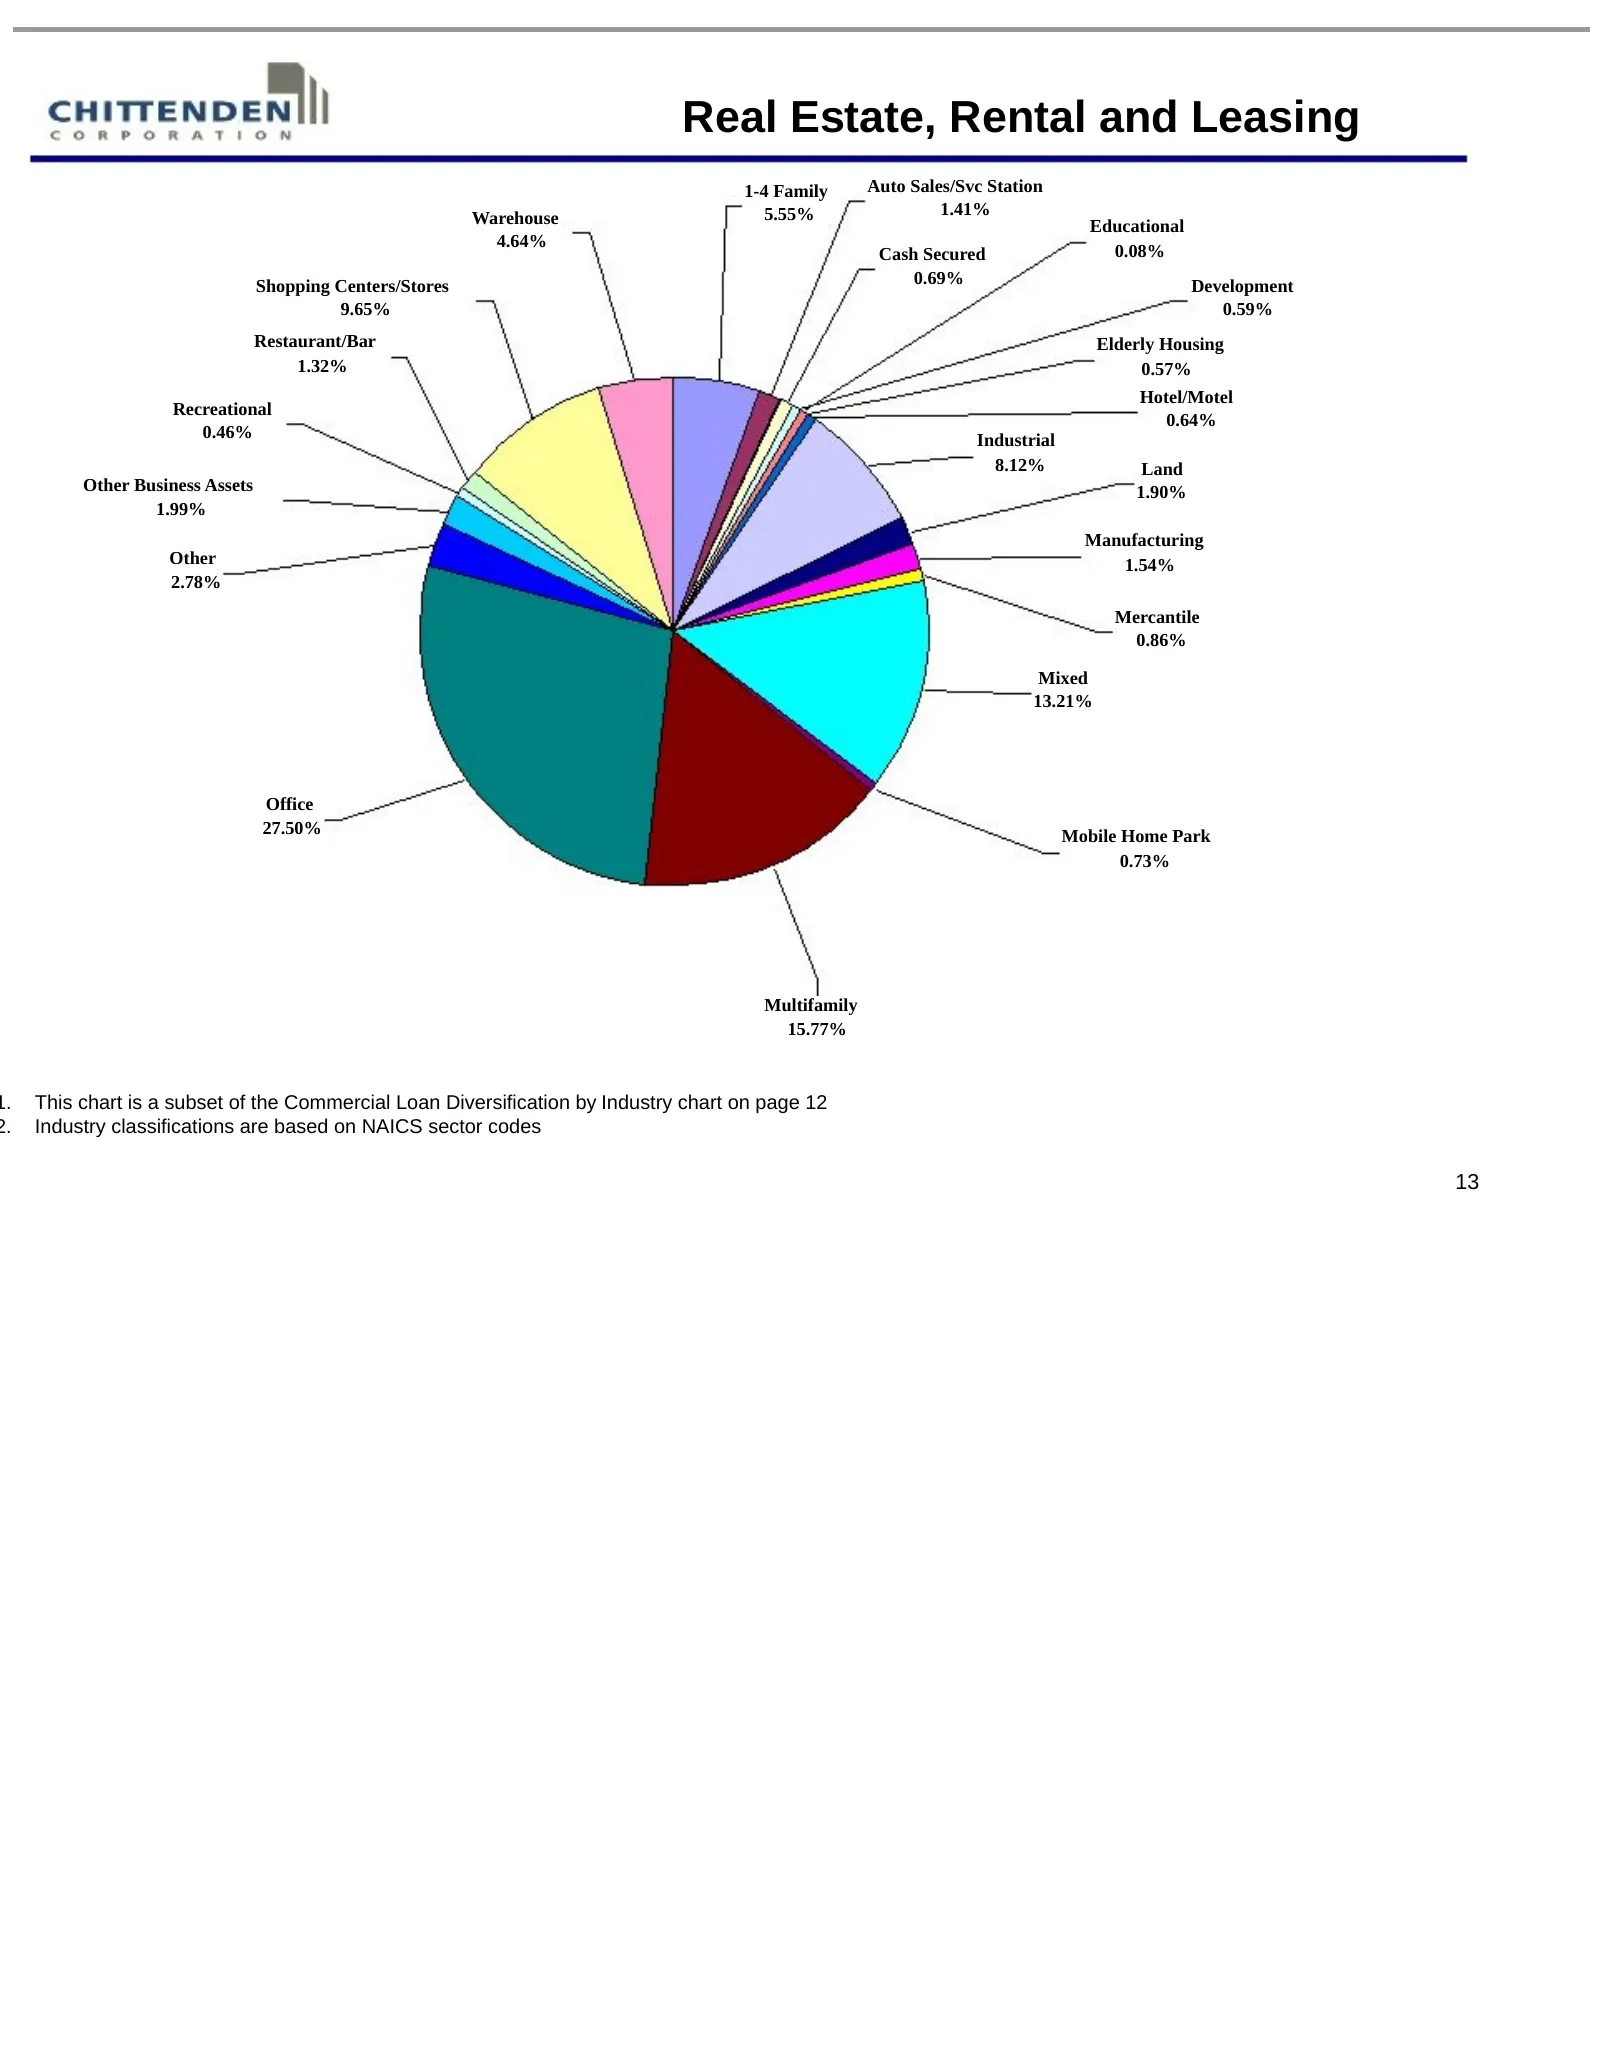
Real Estate, Rental and Leasing 1-4 Family Auto Sales/Svc Station Warehouse 5.55% 1.41% Educational 4.64% Cash Secured 0.08% Shopping Centers/Stores 0.69% Development 9.65% 0.59% Restaurant/Bar Elderly Housing 1.32% 0.57% Hotel/Motel Recreational 0.64% 0.46% Industrial 8.12% Land Other Business Asse
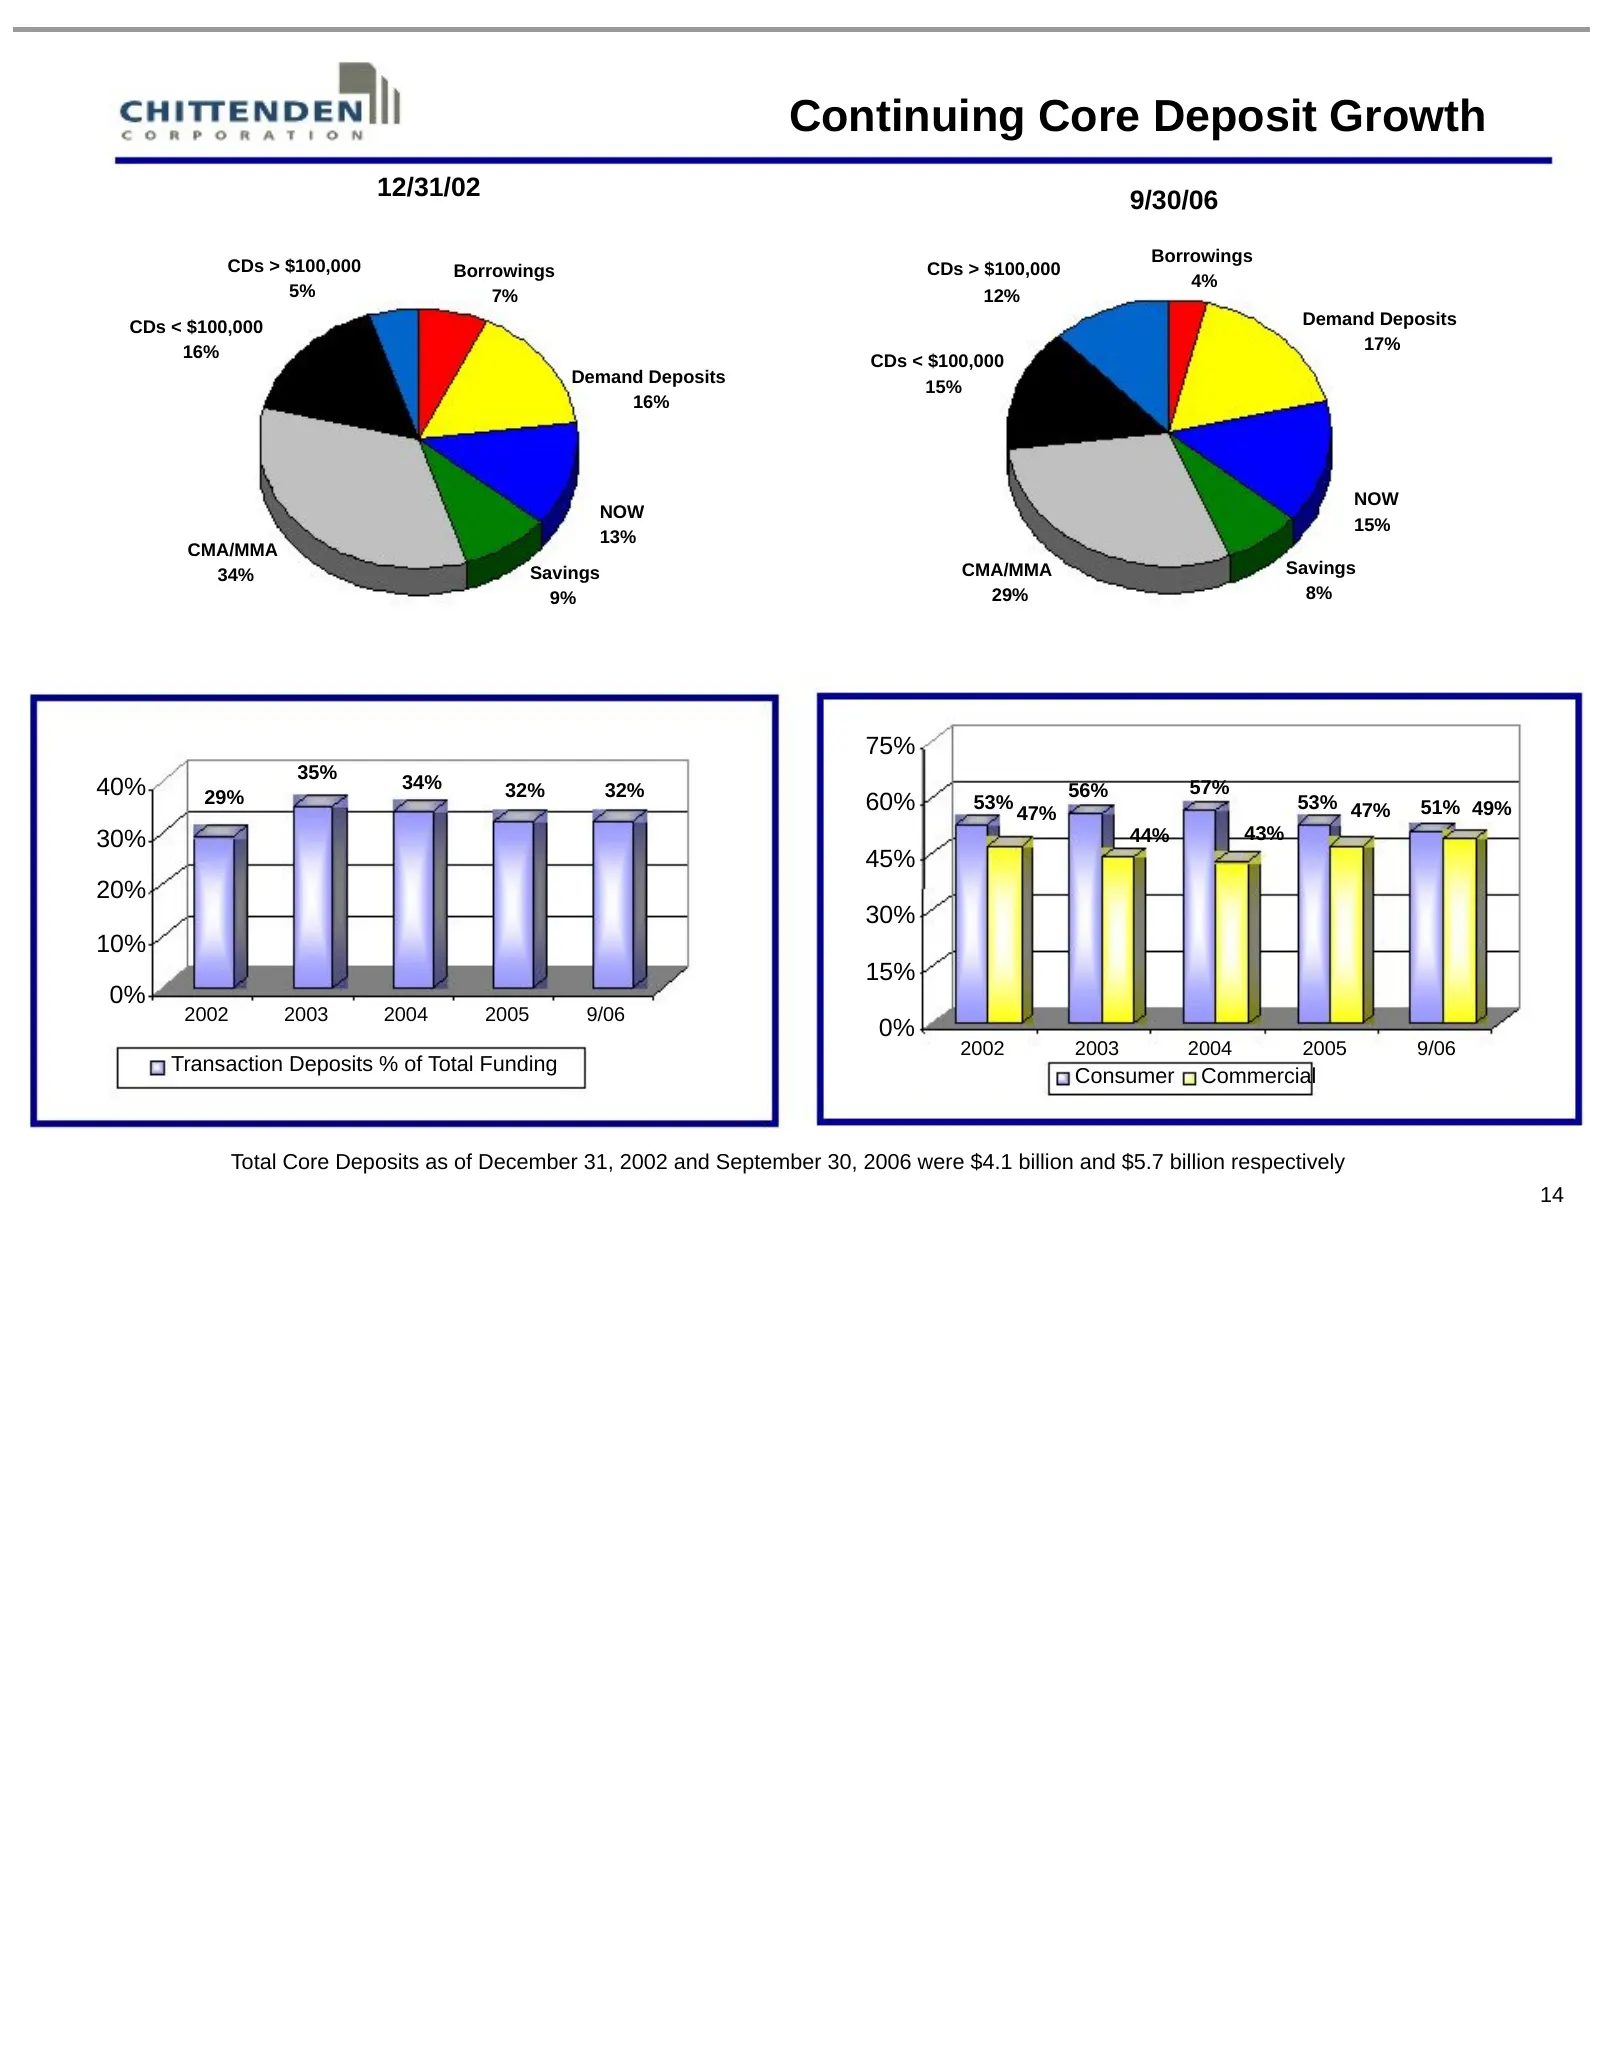
Slide 14: Continuing Core Deposit Growth
Continuing Core Deposit Growth 12/31/02 9/30/06 Borrowings CDs > $100,000 Borrowings CDs > $100,000 4% 5% 7% 12% CDs < $100,000 Demand Deposits 16% 17% CDs < $100,000 Demand Deposits 15% 16% NOW NOW 15% 13% CMA/MMA 34% Savings CMA/MMA Savings 9% 29% 8% 75% 35% 40% 34% 32% 32% 56% 57% 29% 60% 53% 53%
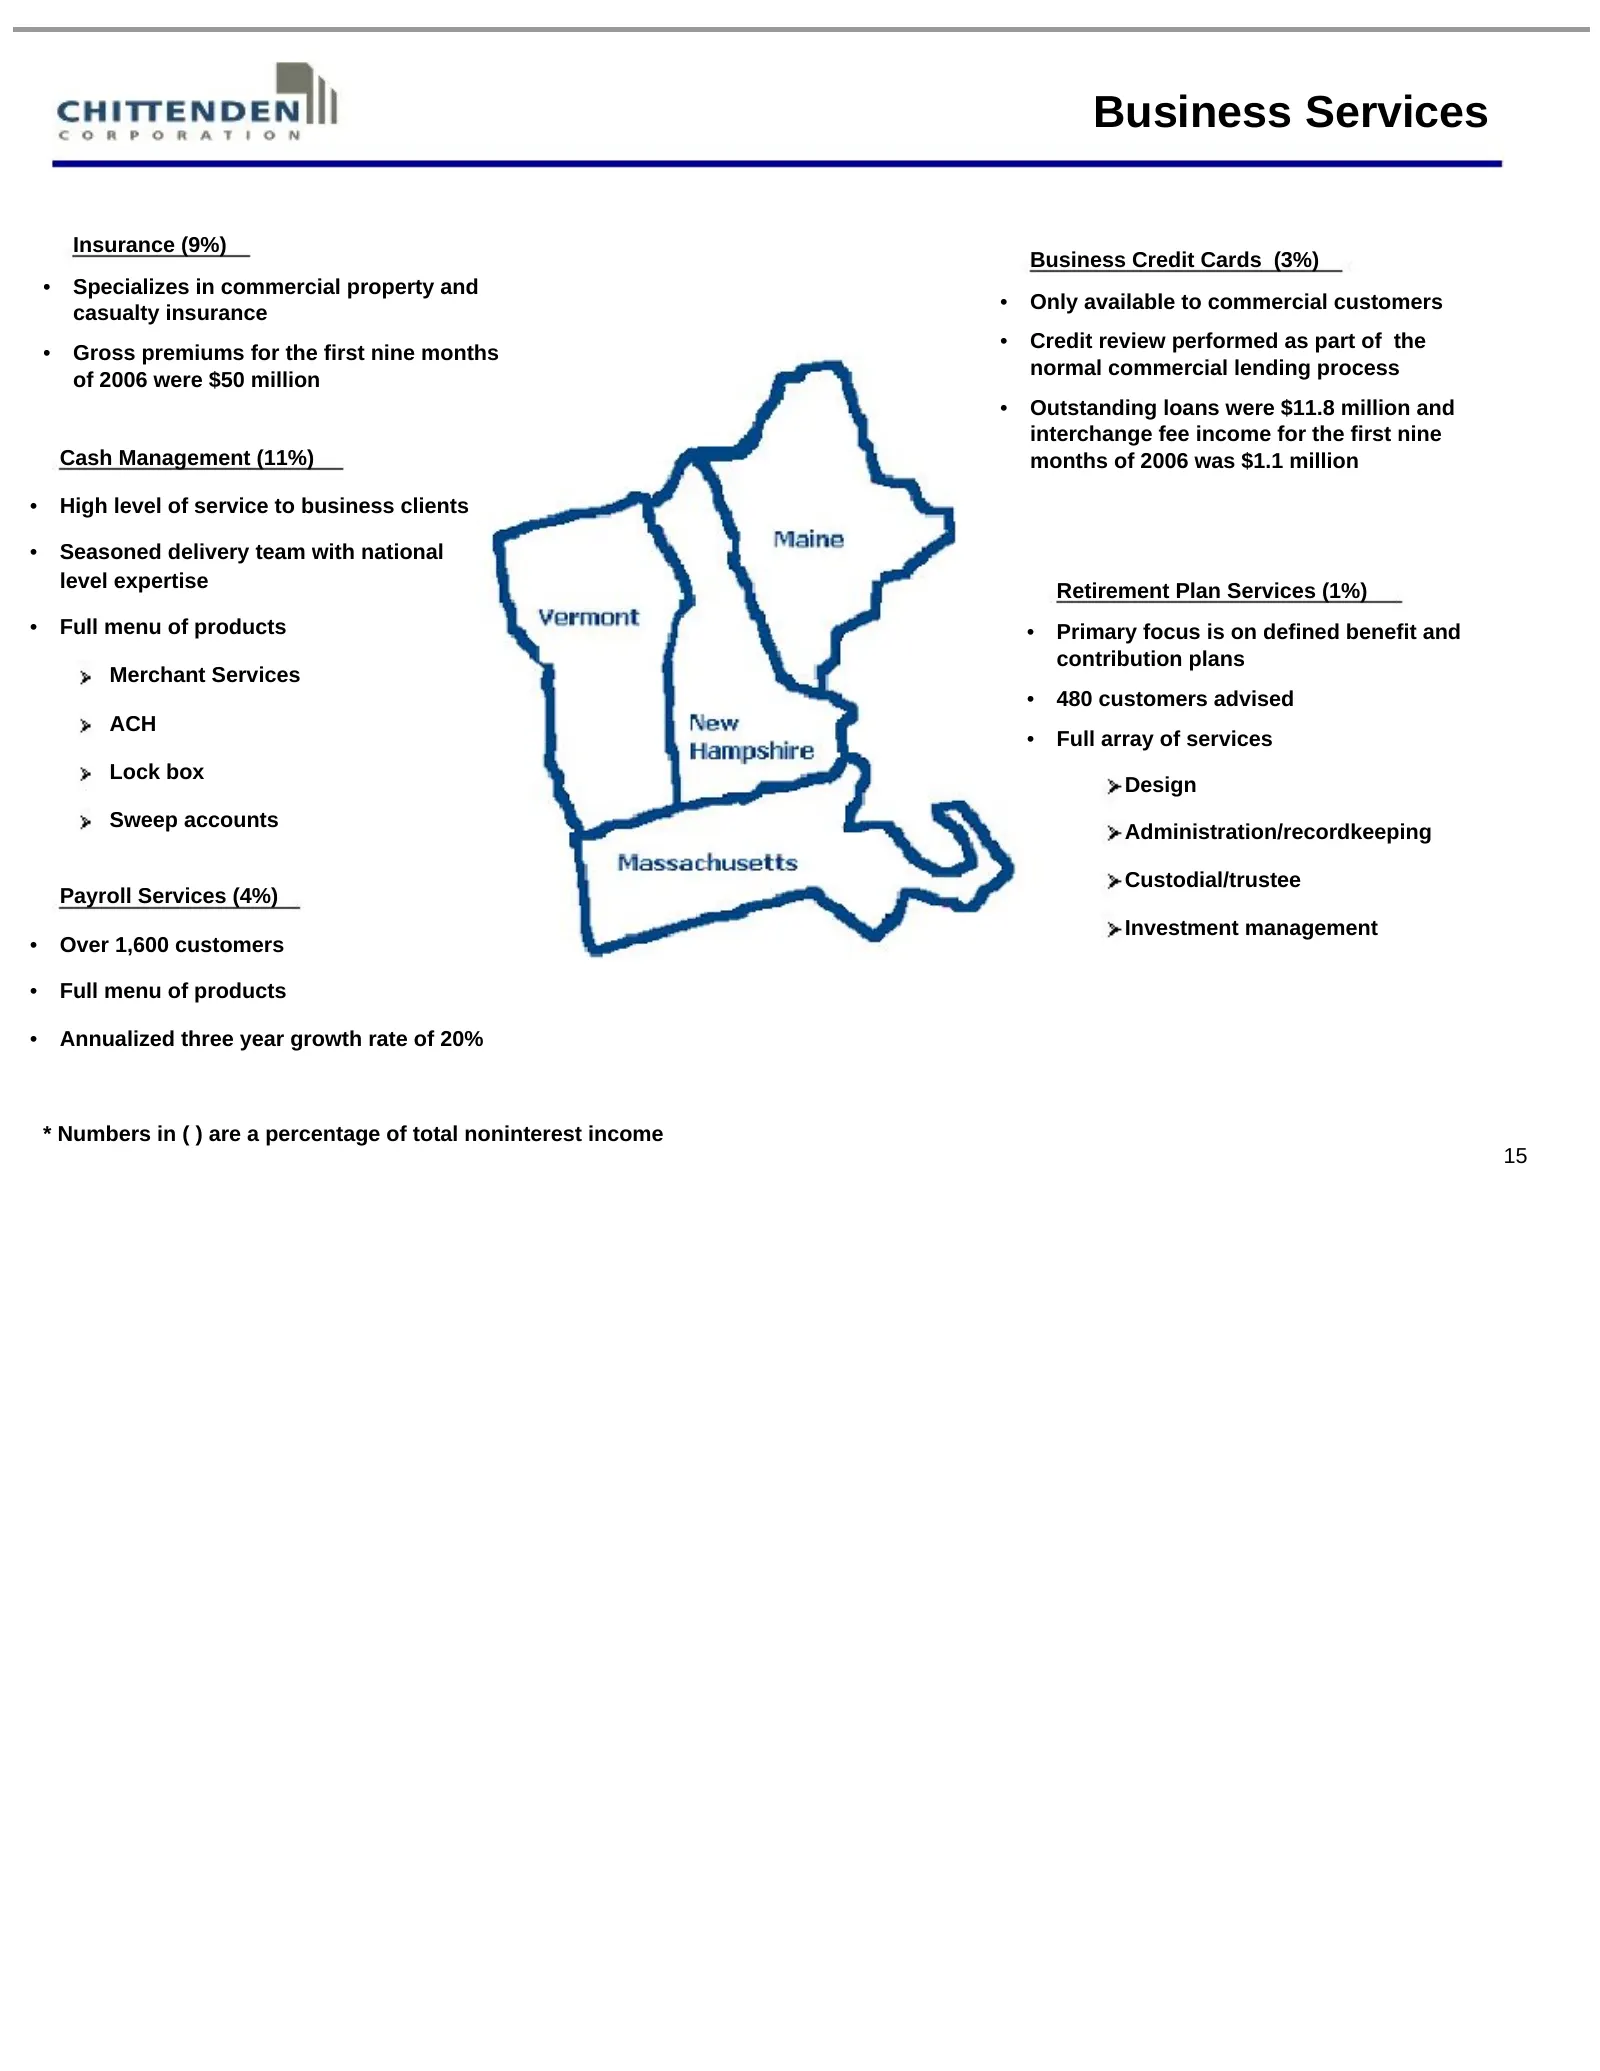
Slide 15: Business Services
Business Services Insurance (9%) Business Credit Cards (3%) • Specializes in commercial property and • Only available to commercial customers casualty insurance • Credit review performed as part of the • Gross premiums for the first nine months normal commercial lending process of 2006 were $50 mill
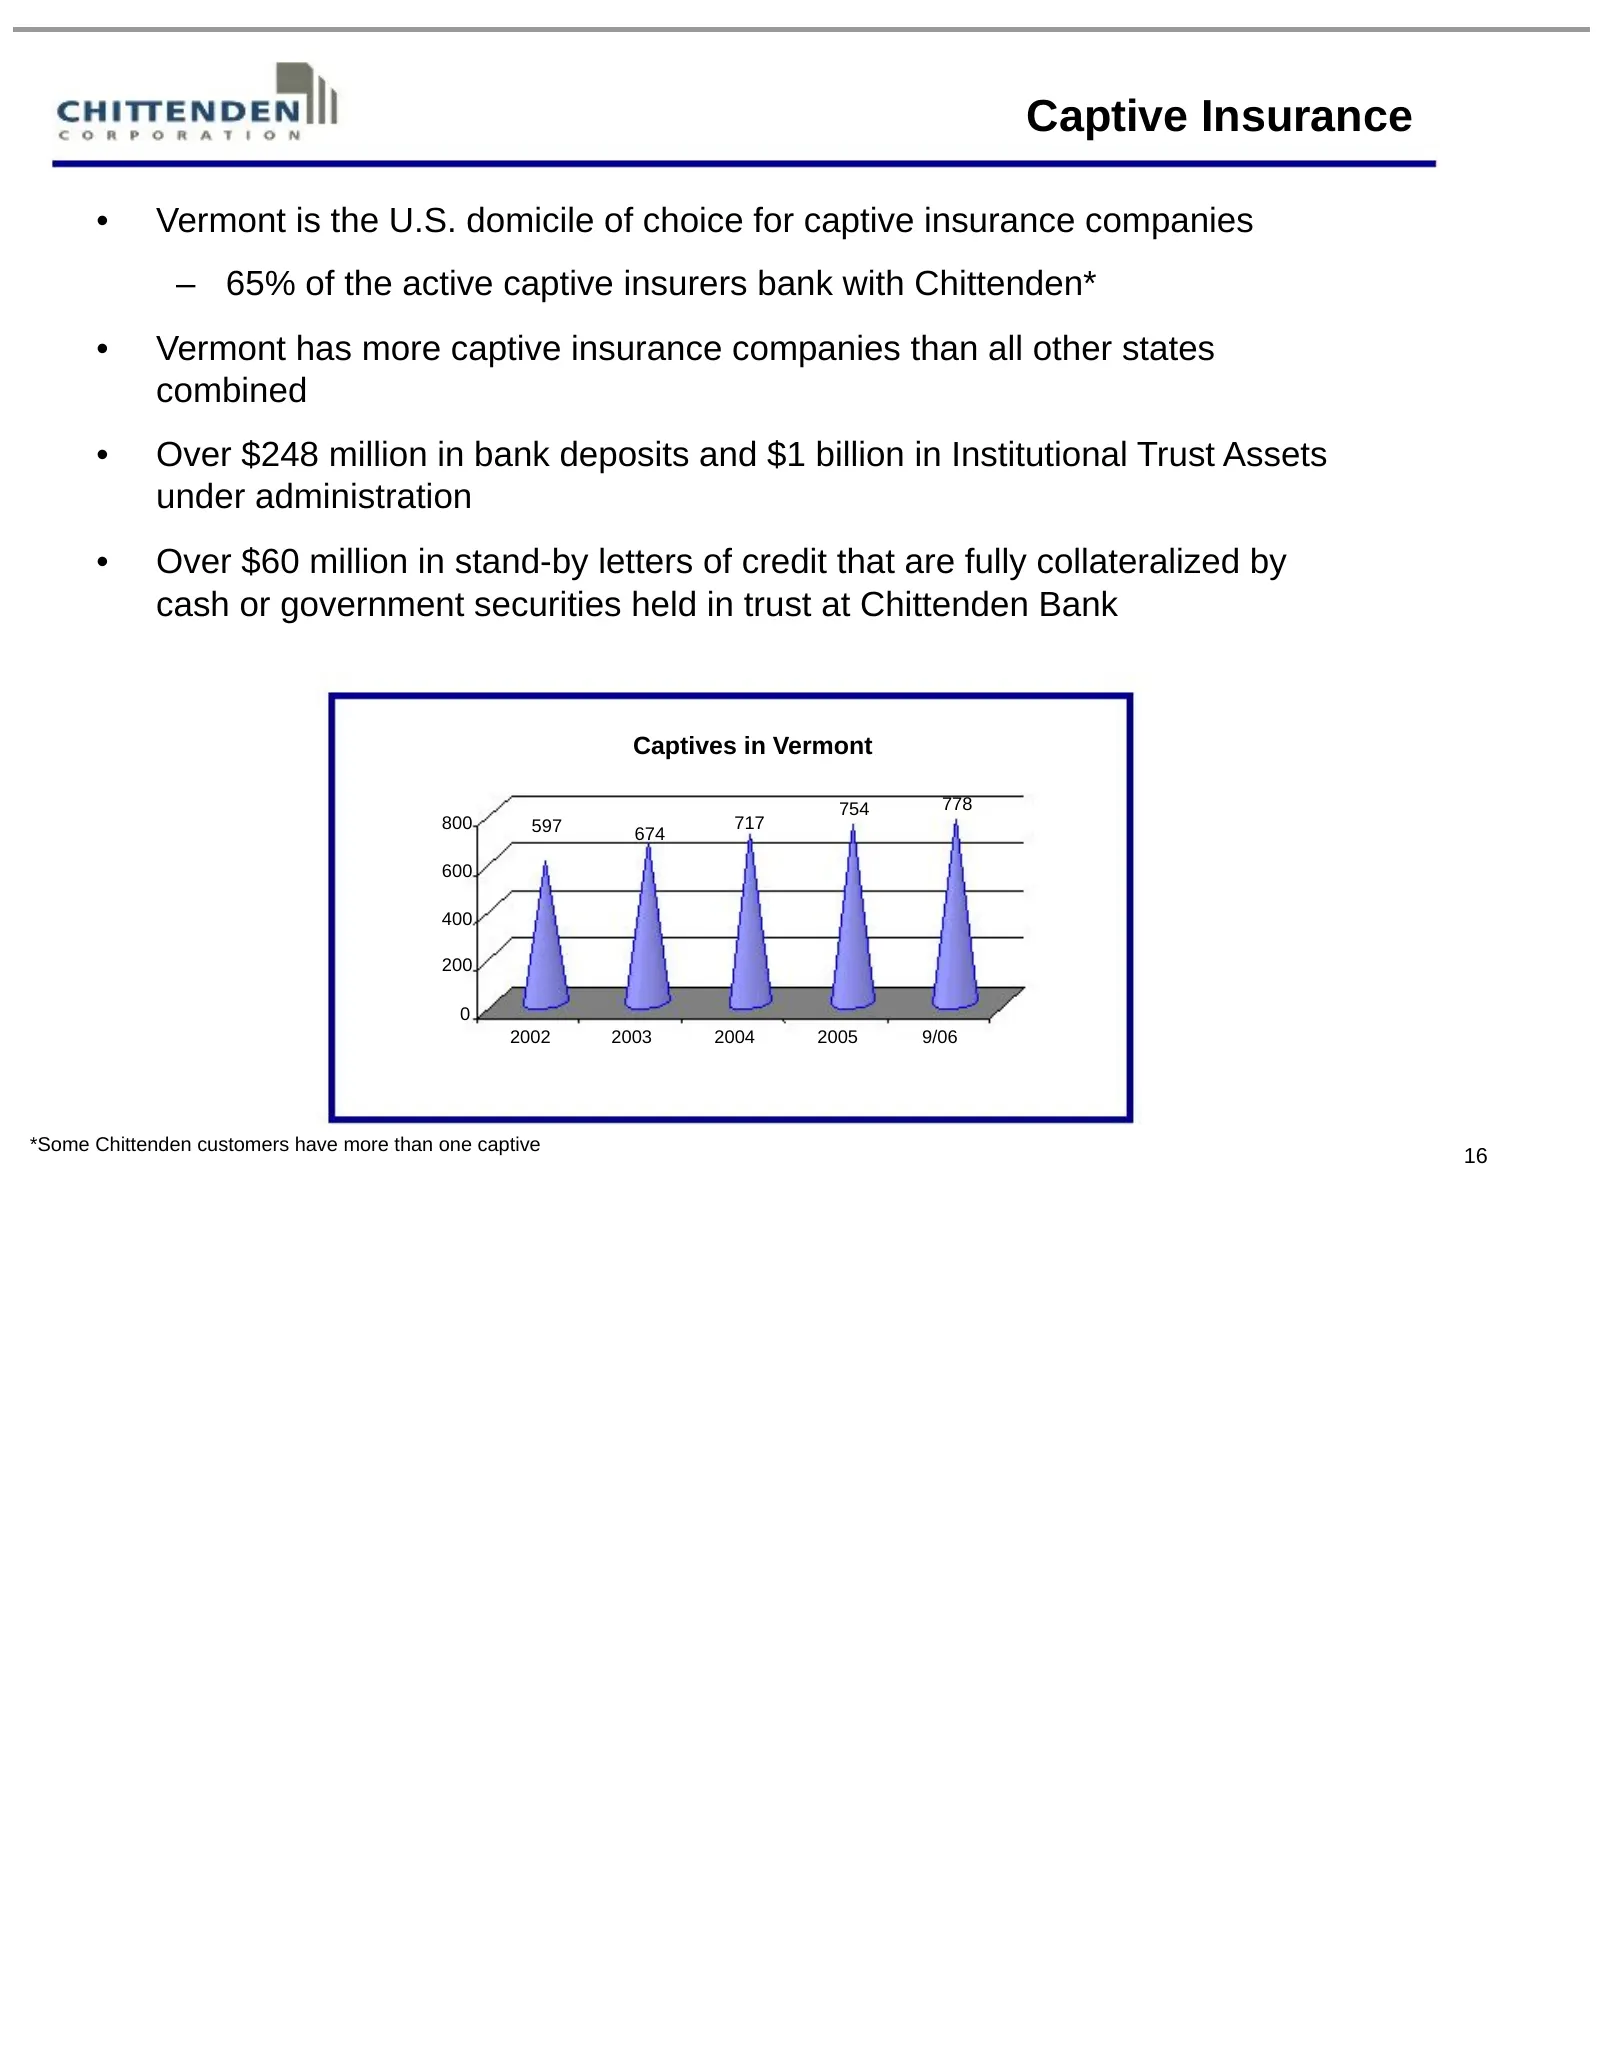
Slide 16: Captive Insurance
Captive Insurance • Vermont is the U.S. domicile of choice for captive insurance companies – 65% of the active captive insurers bank with Chittenden* • Vermont has more captive insurance companies than all other states combined • Over $248 million in bank deposits and $1 billion in Institutional Tru
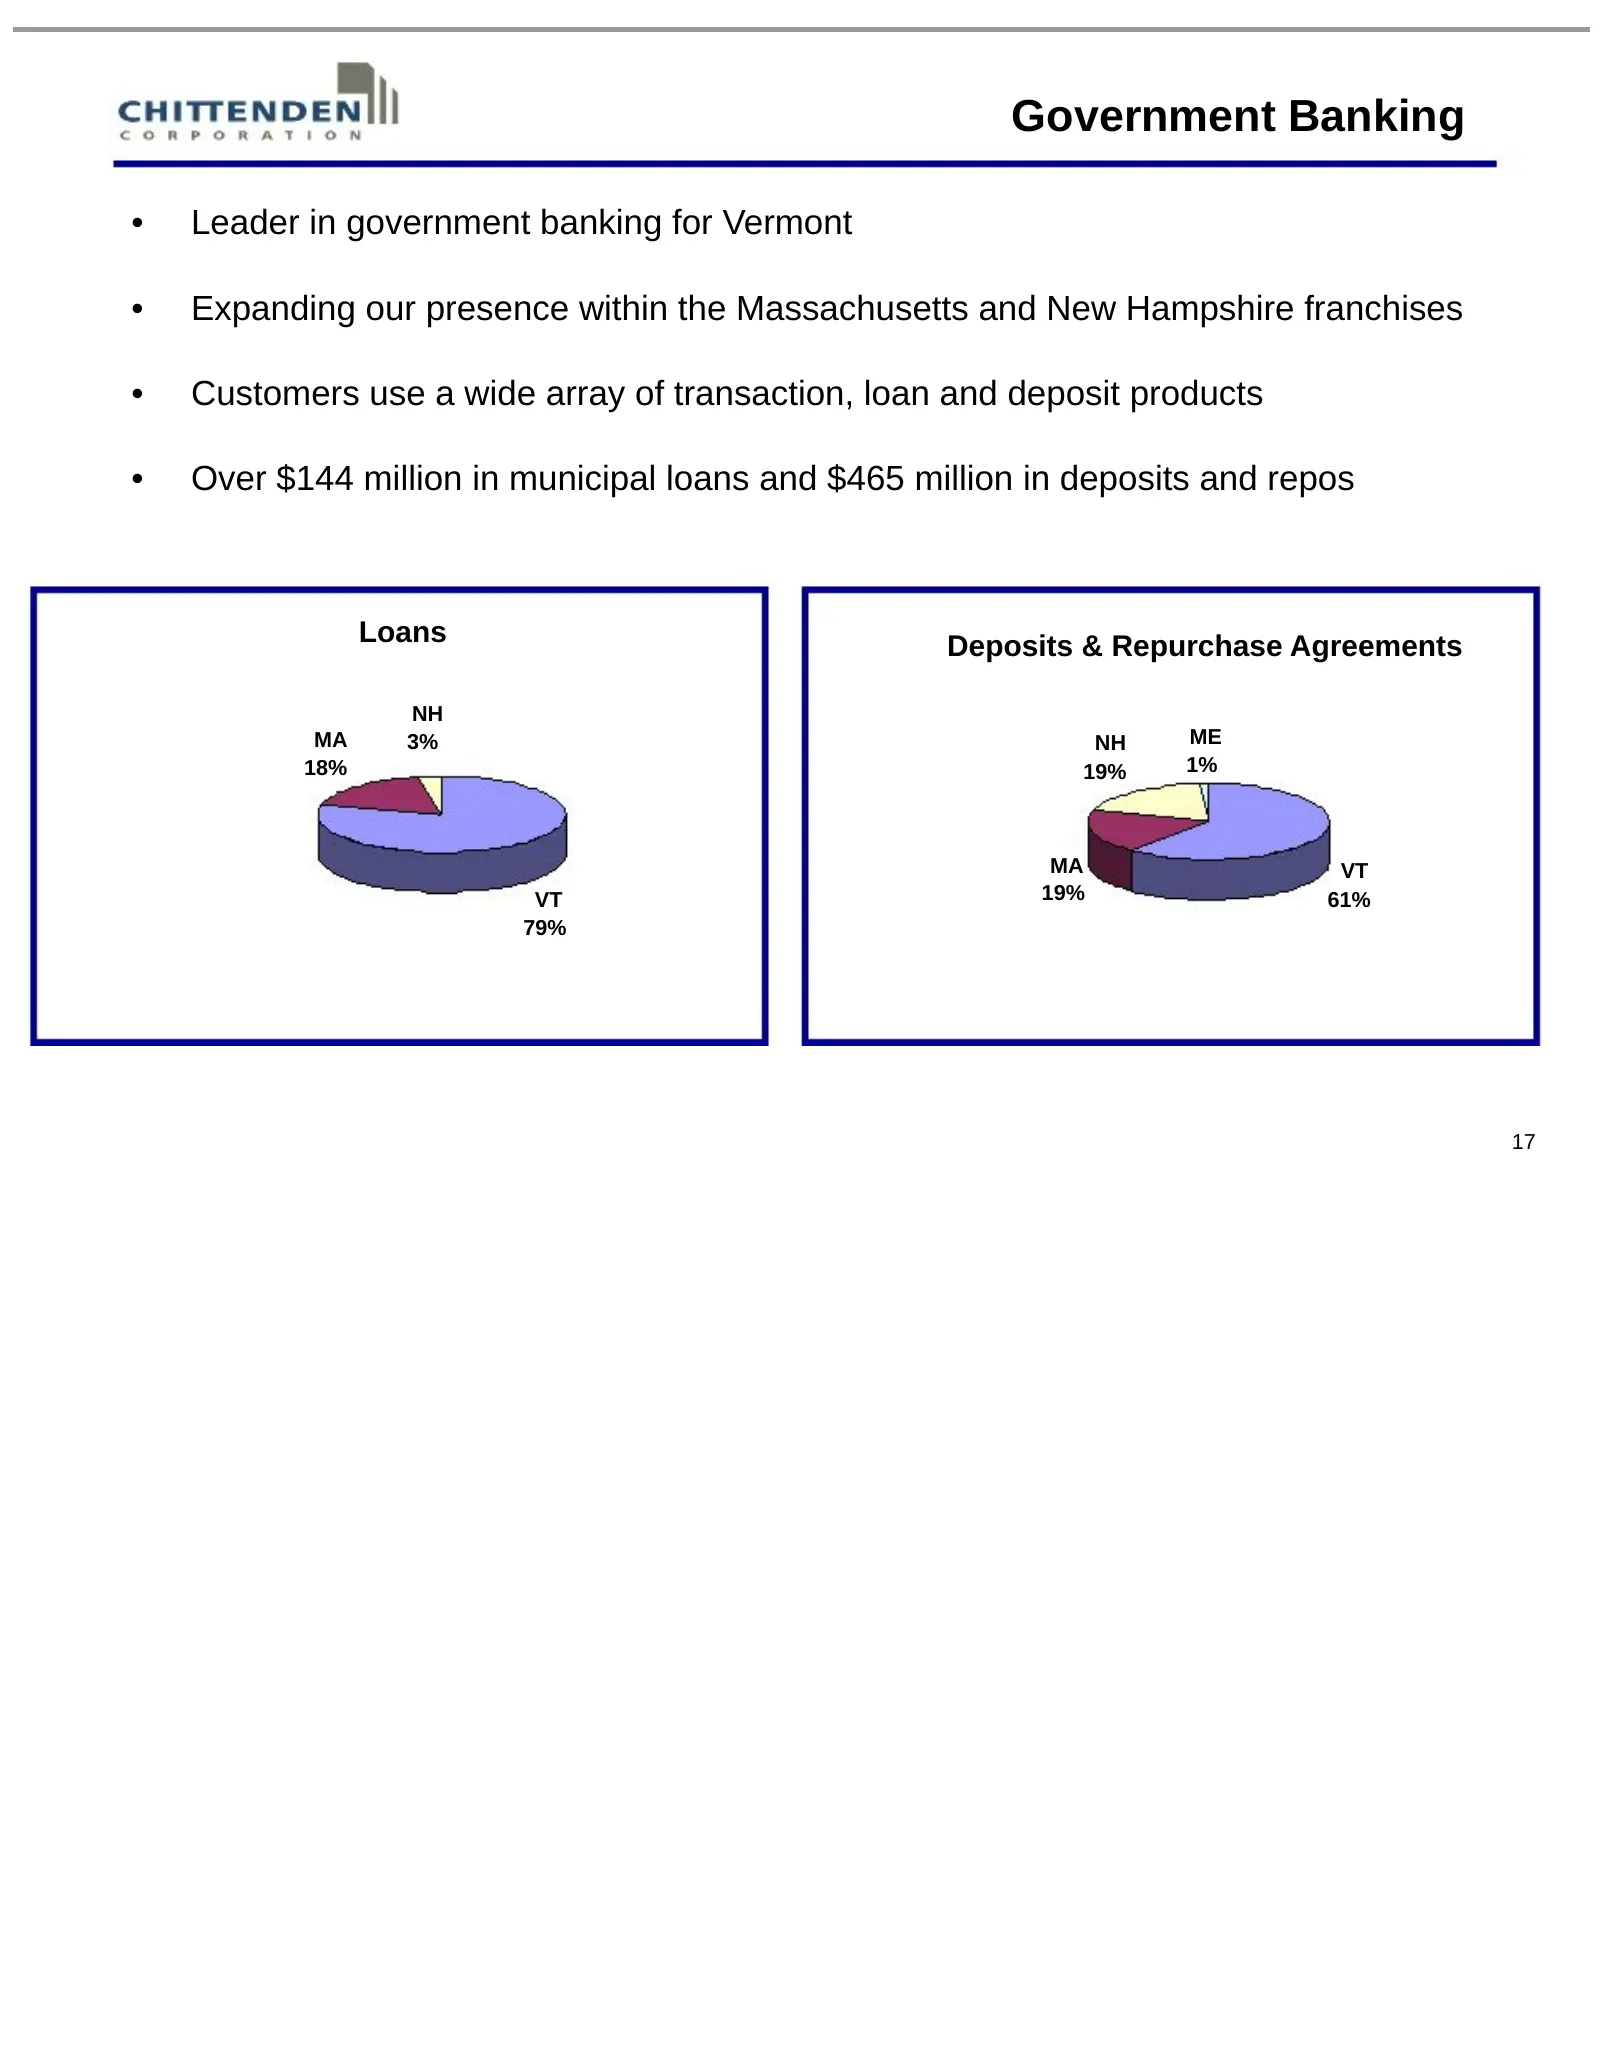
Slide 17: Government Banking
Government Banking • Leader in government banking for Vermont • Expanding our presence within the Massachusetts and New Hampshire franchises • Customers use a wide array of transaction, loan and deposit products • Over $144 million in municipal loans and $465 million in deposits and repos Loans Depo
Slide 18: Mortgage Banking
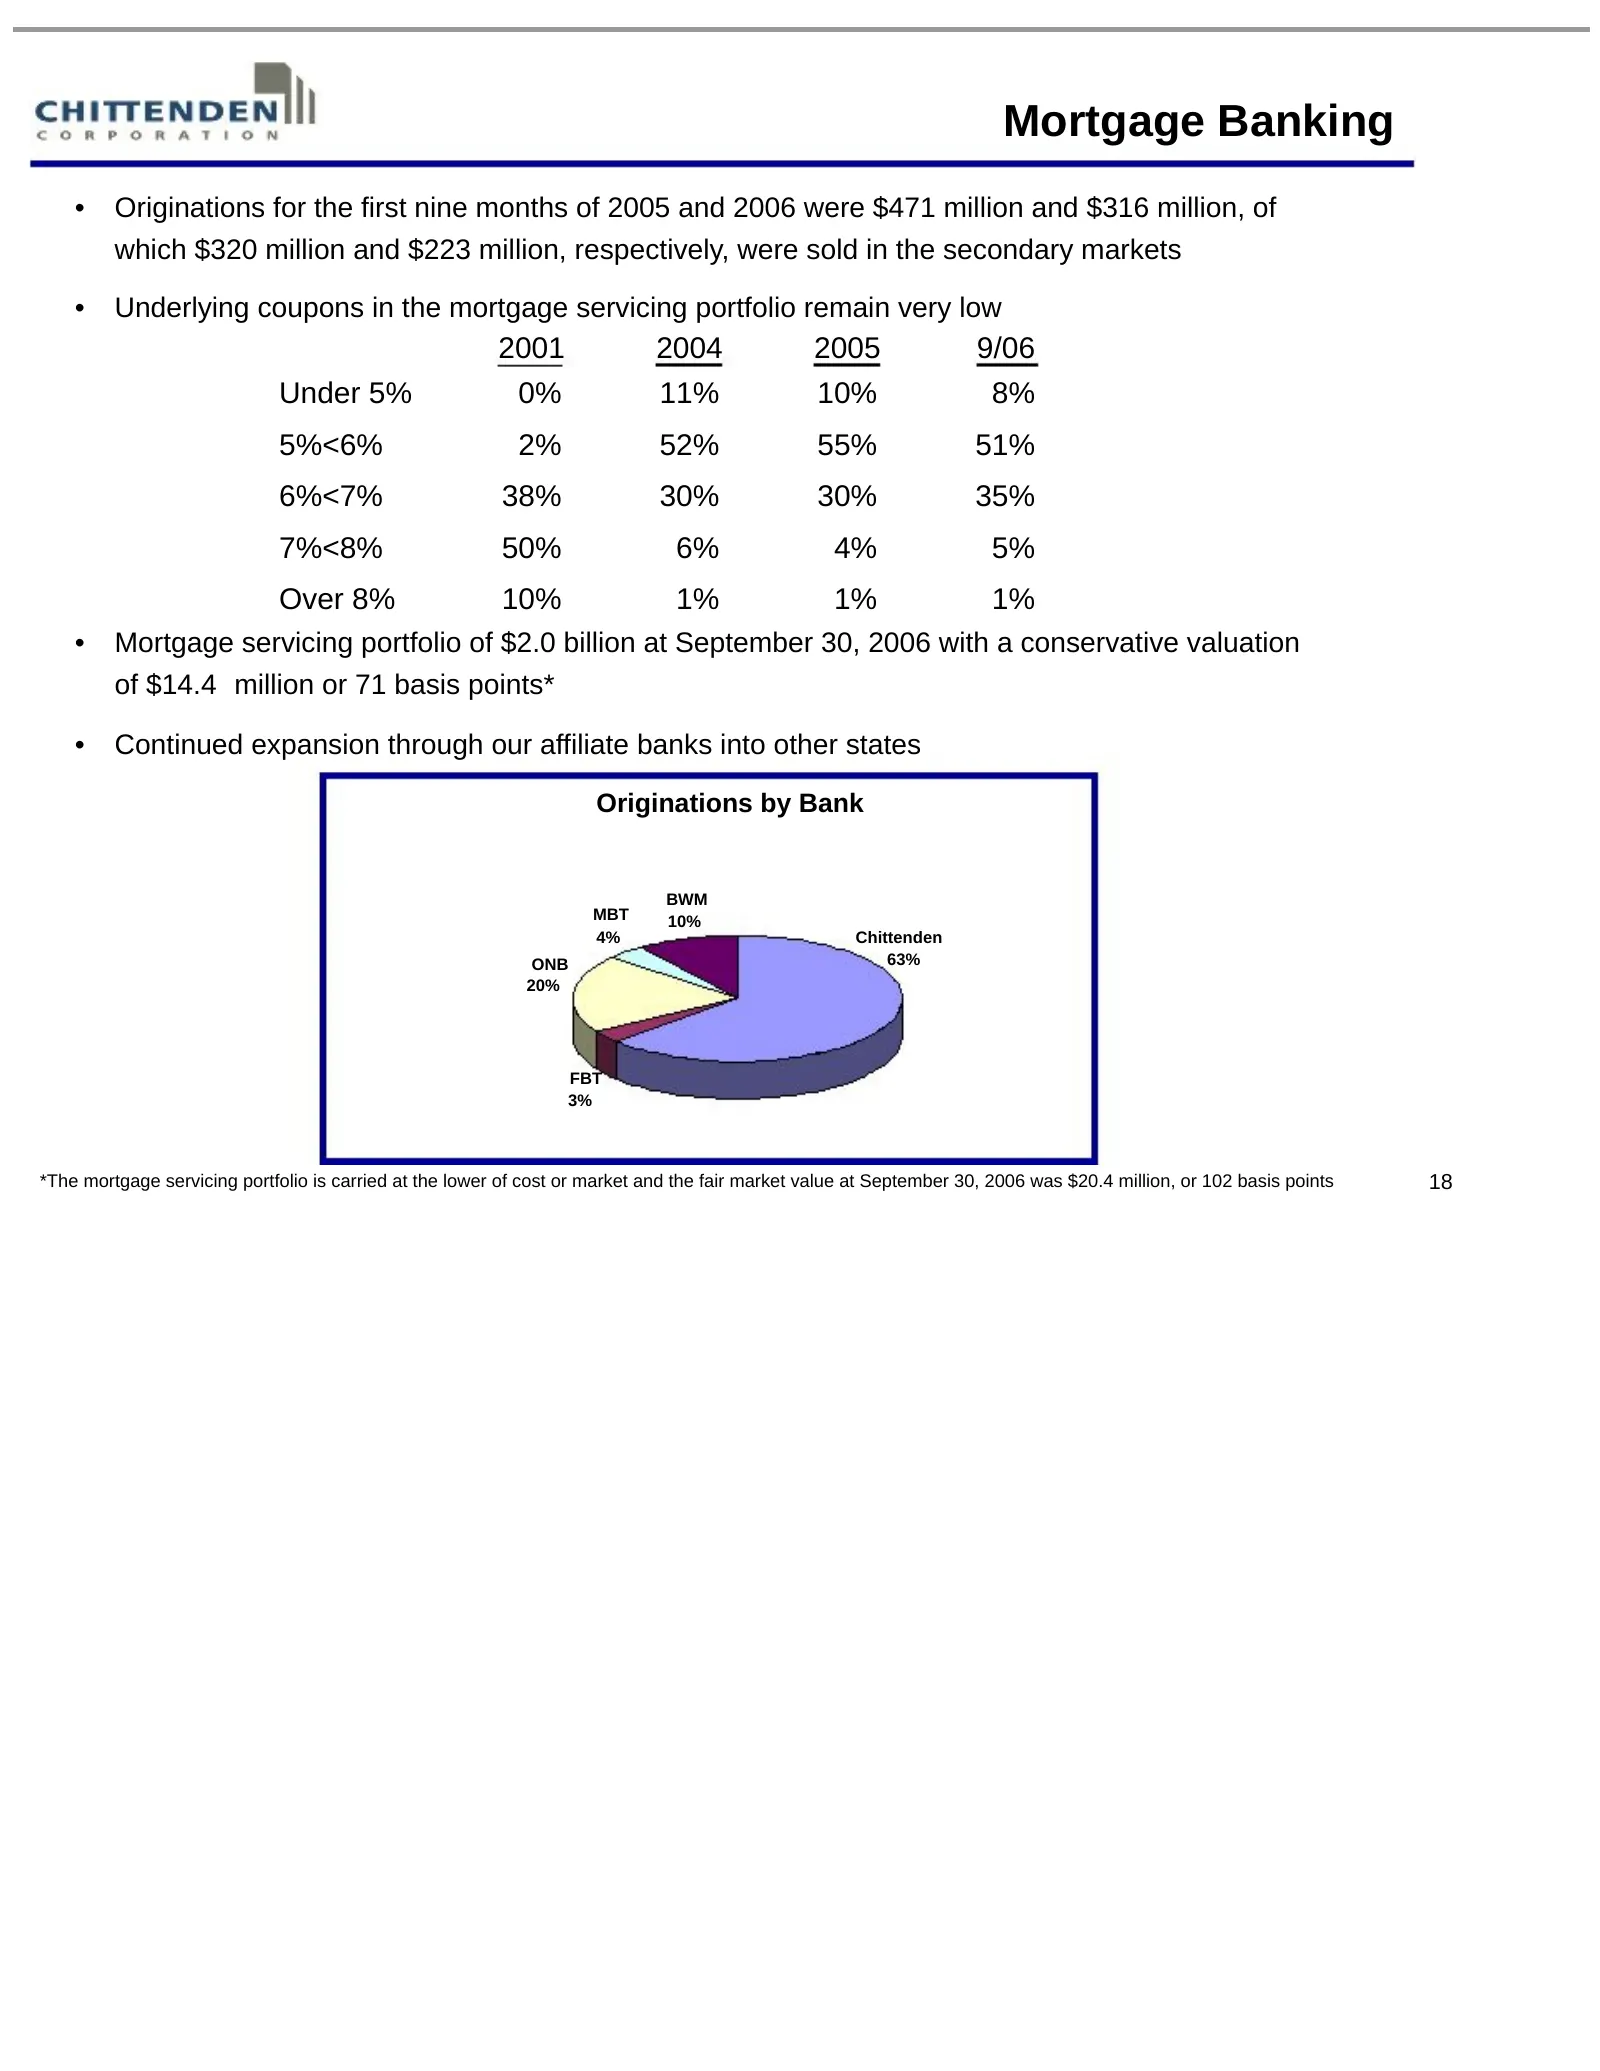
Mortgage Banking • Originations for the first nine months of 2005 and 2006 were $471 million and $316 million, of which $320 million and $223 million, respectively, were sold in the secondary markets • Underlying coupons in the mortgage servicing portfolio remain very low 2001 2004 2005 9/06 Under 5
Slide 19: Wealth Management
Wealth Management 19
Slide 20: Asset Management Services
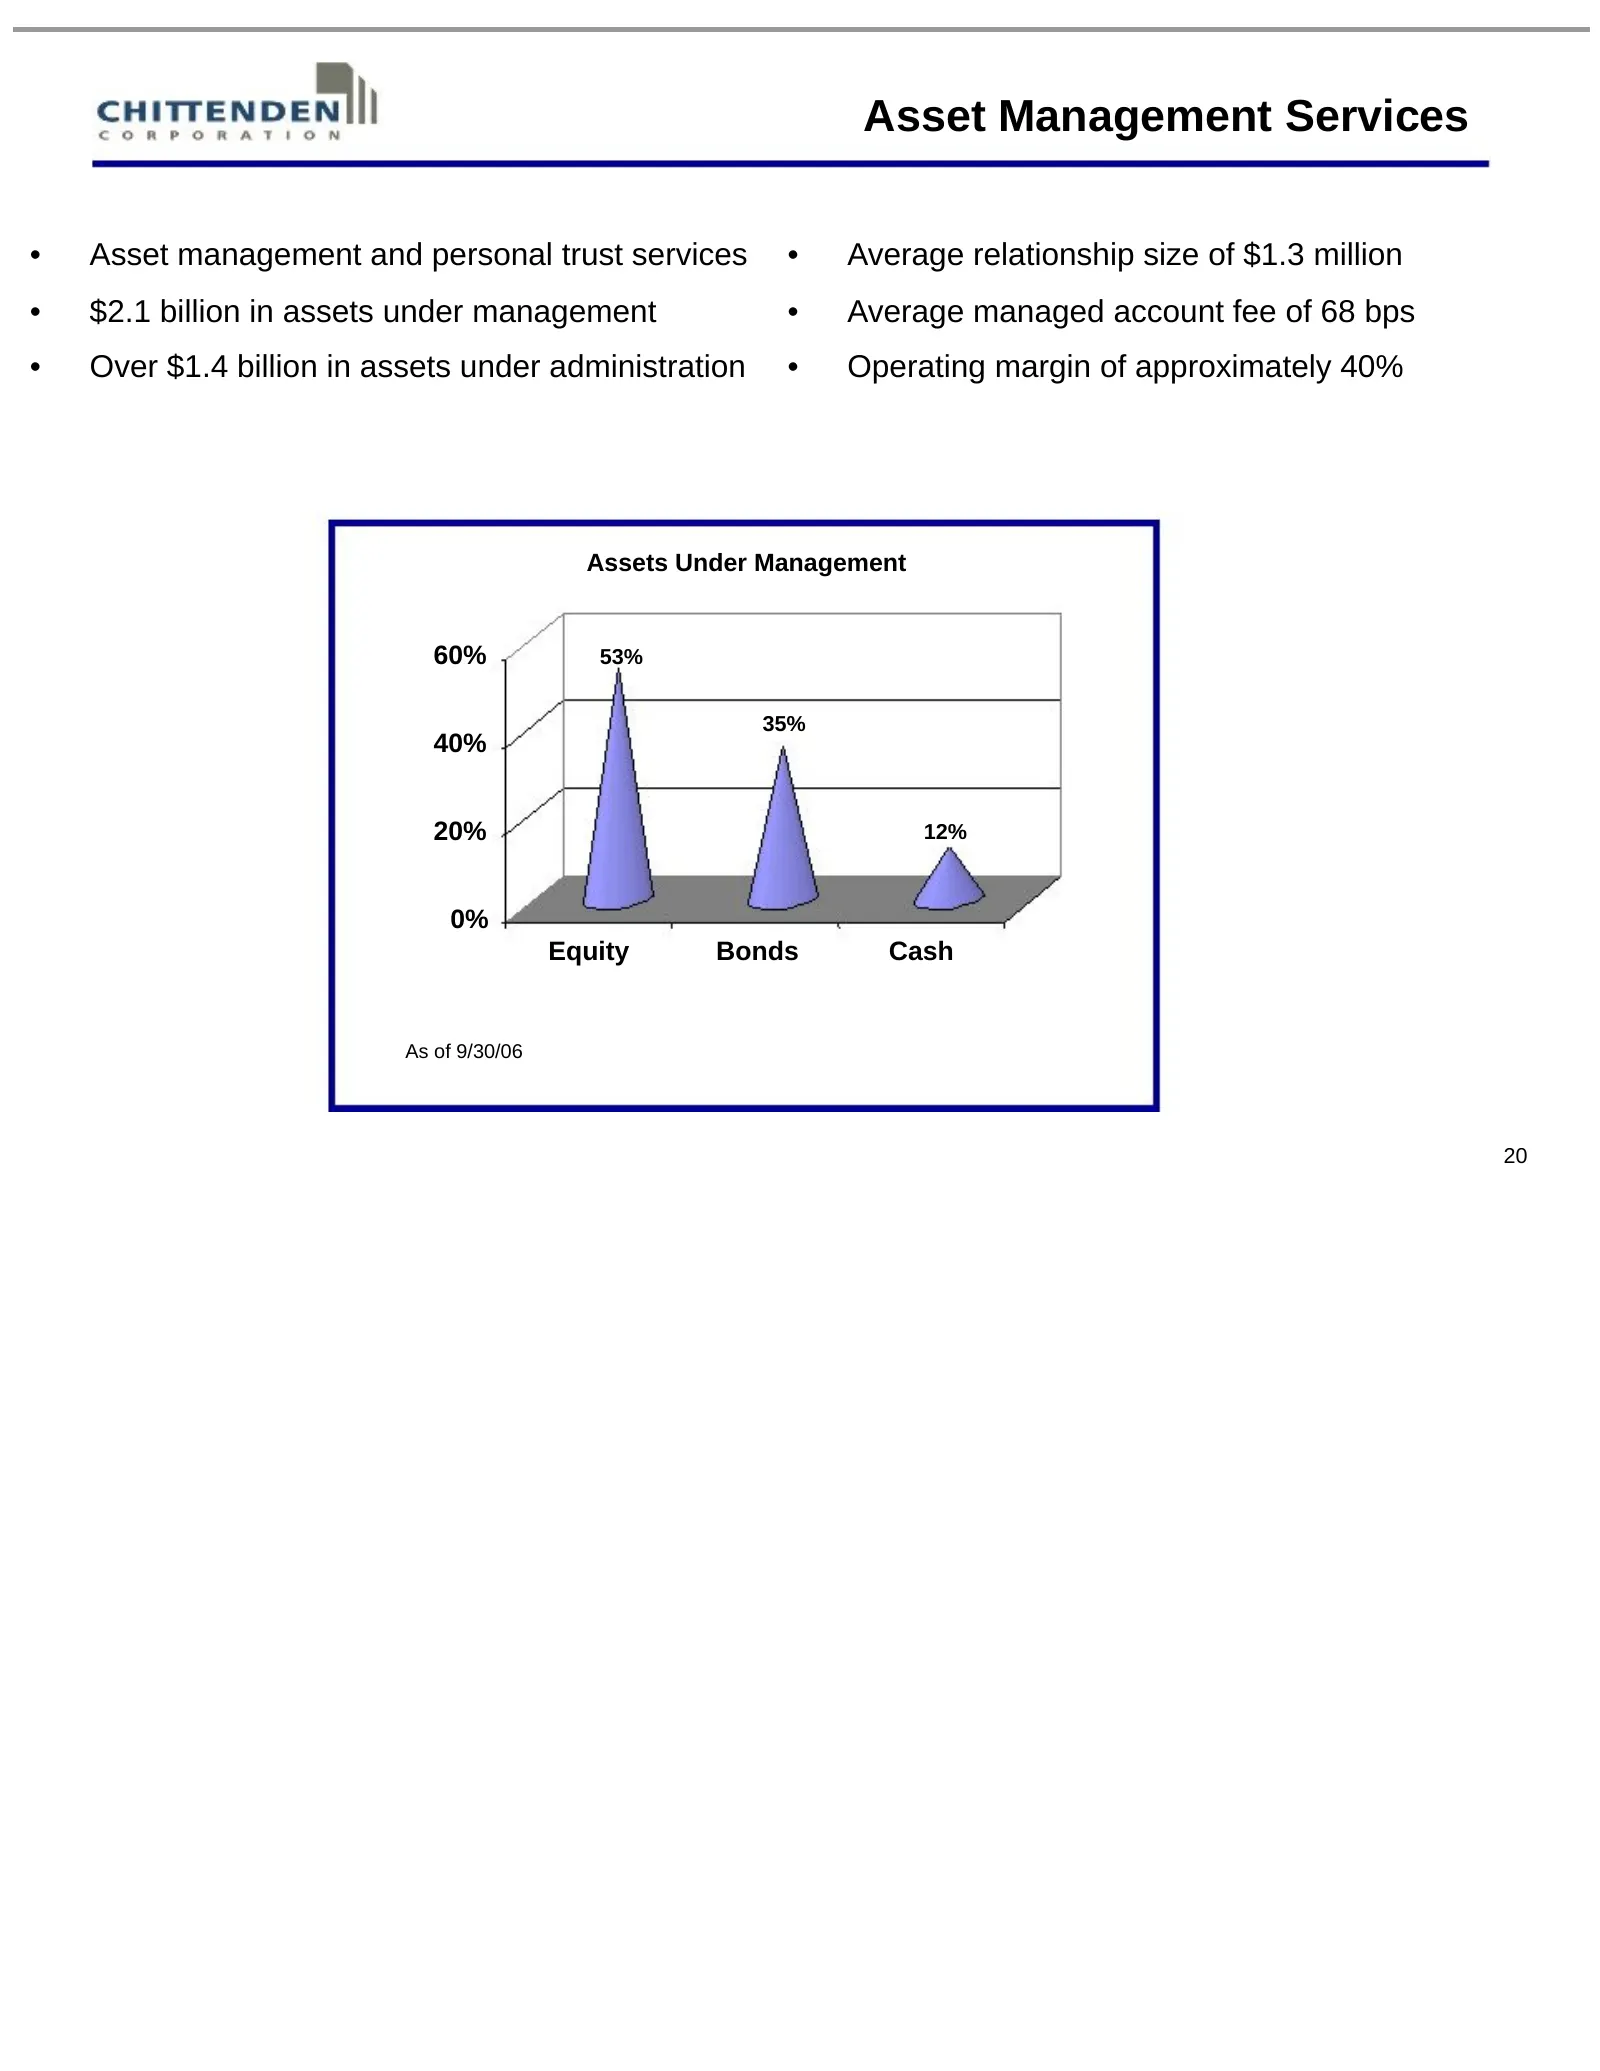
Asset Management Services • Asset management and personal trust services • Average relationship size of $1.3 million • $2.1 billion in assets under management • Average managed account fee of 68 bps • Over $1.4 billion in assets under administration • Operating margin of approximately 40% Assets Und
Slide 21: Wealth Management
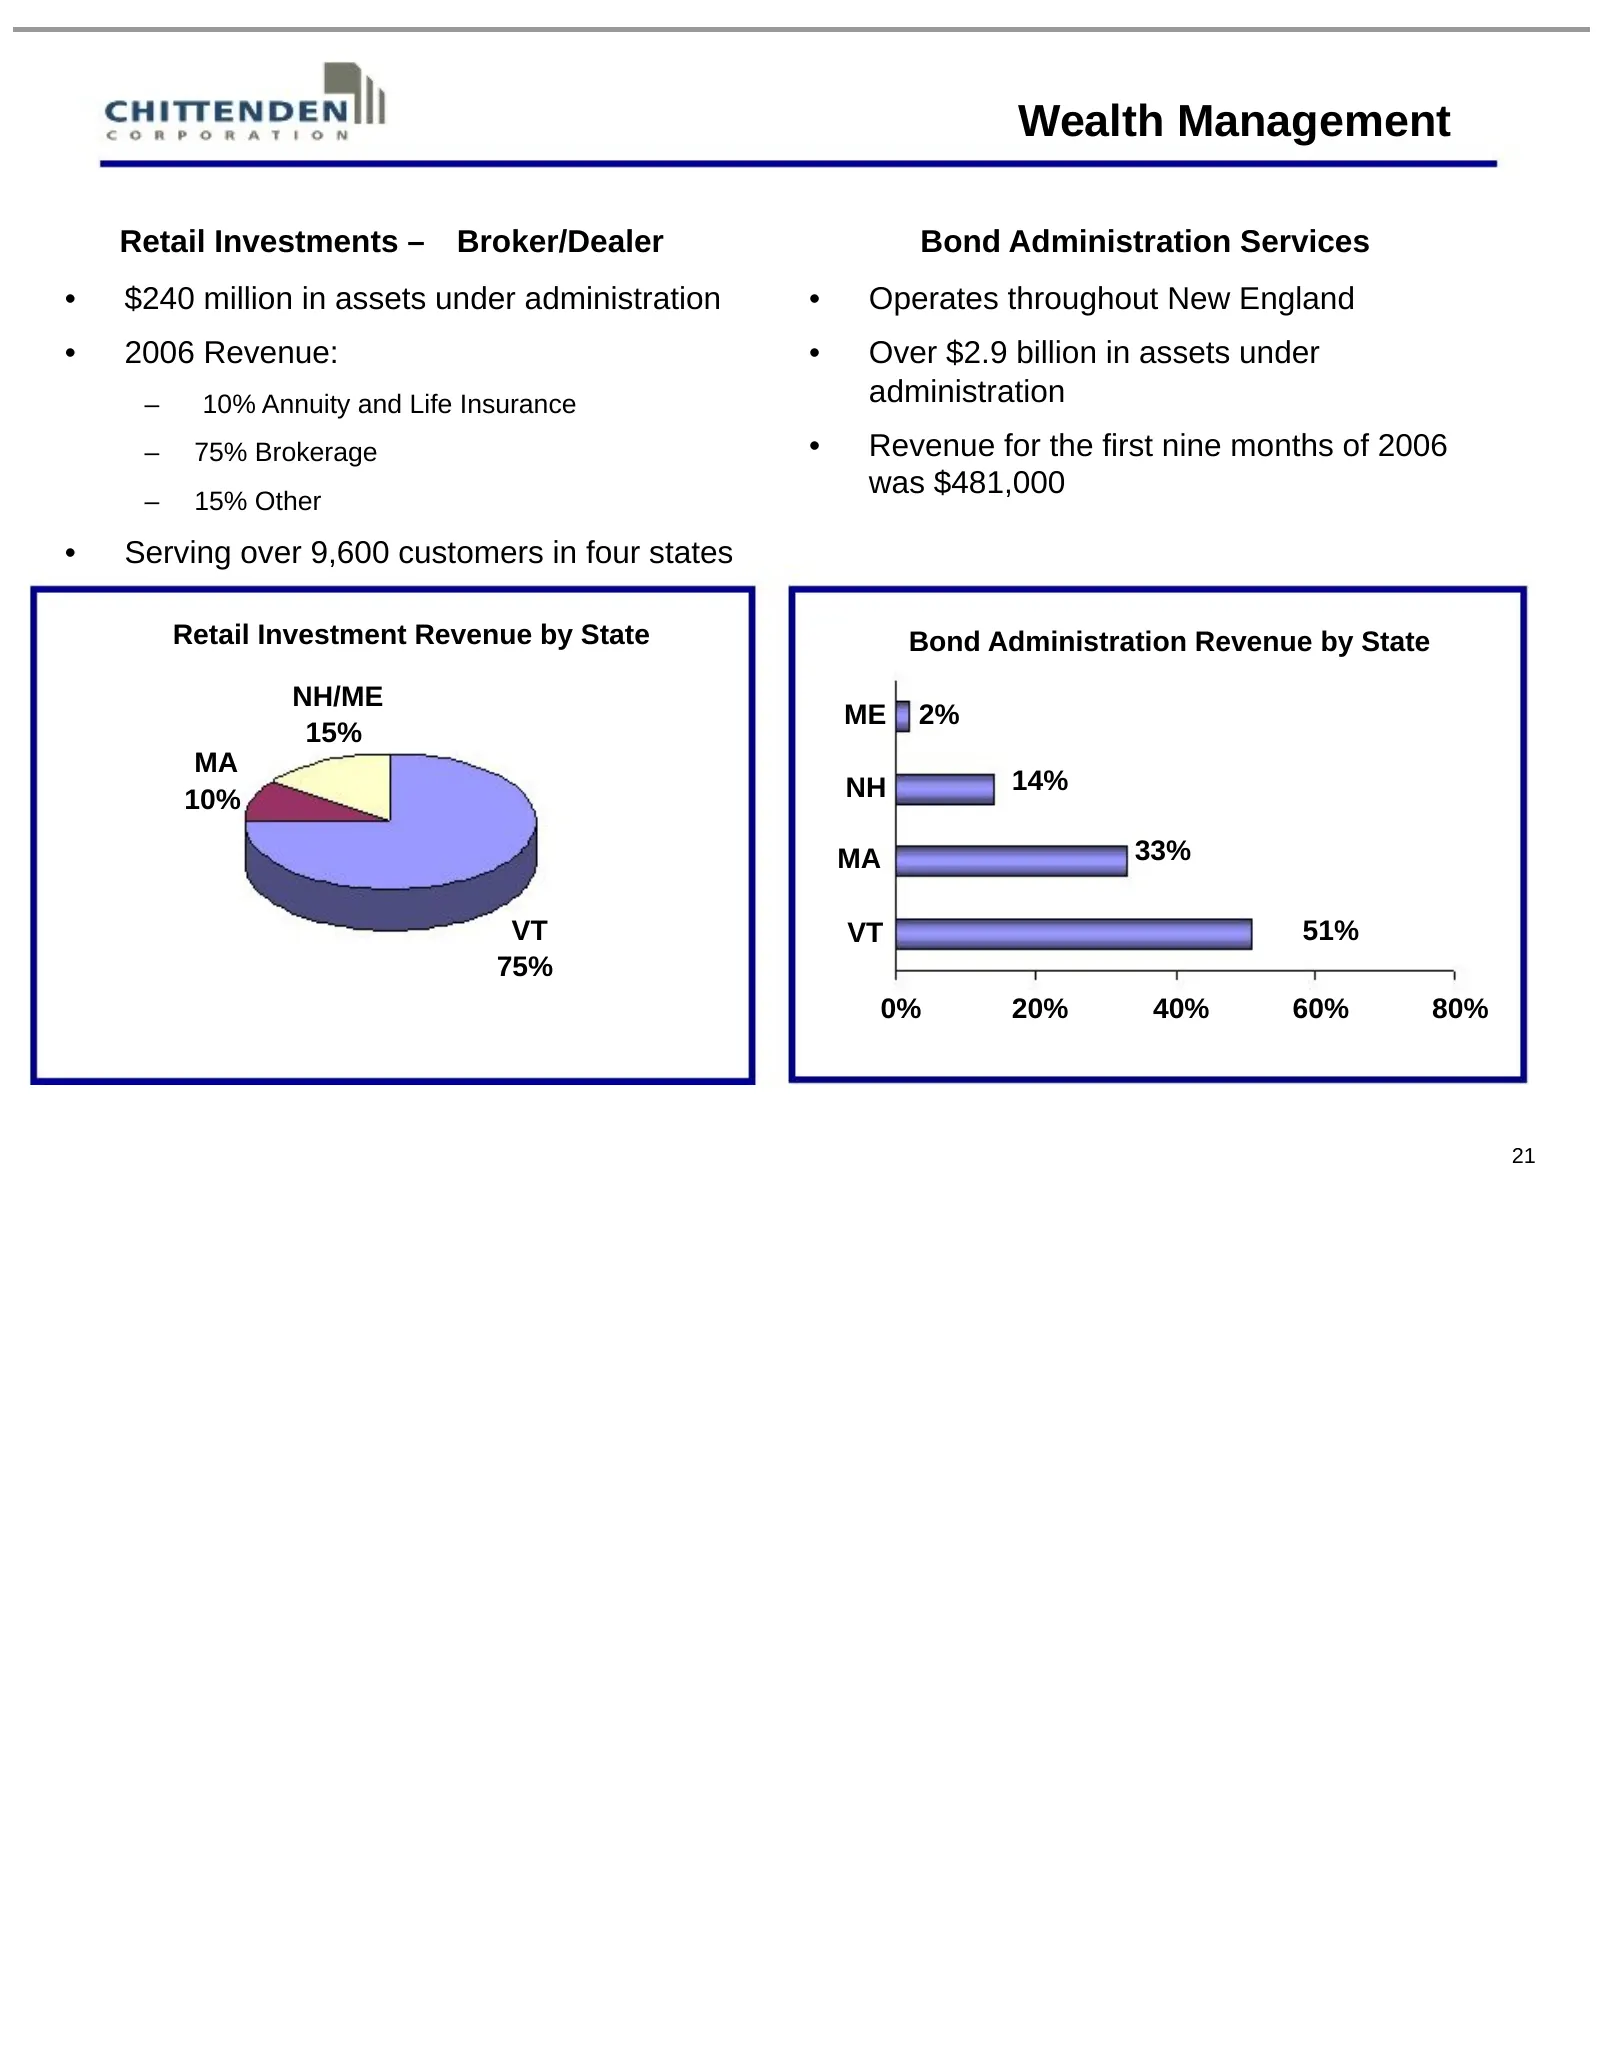
Wealth Management Retail Investments – Broker/Dealer Bond Administration Services • $240 million in assets under administration • Operates throughout New England • 2006 Revenue: • Over $2.9 billion in assets under – 10% Annuity and Life Insurance administration – 75% Brokerage • Revenue for the firs
Slide 22: Financial Performance
Financial Performance 22
Slide 23: Consistent Superior Financial Performance
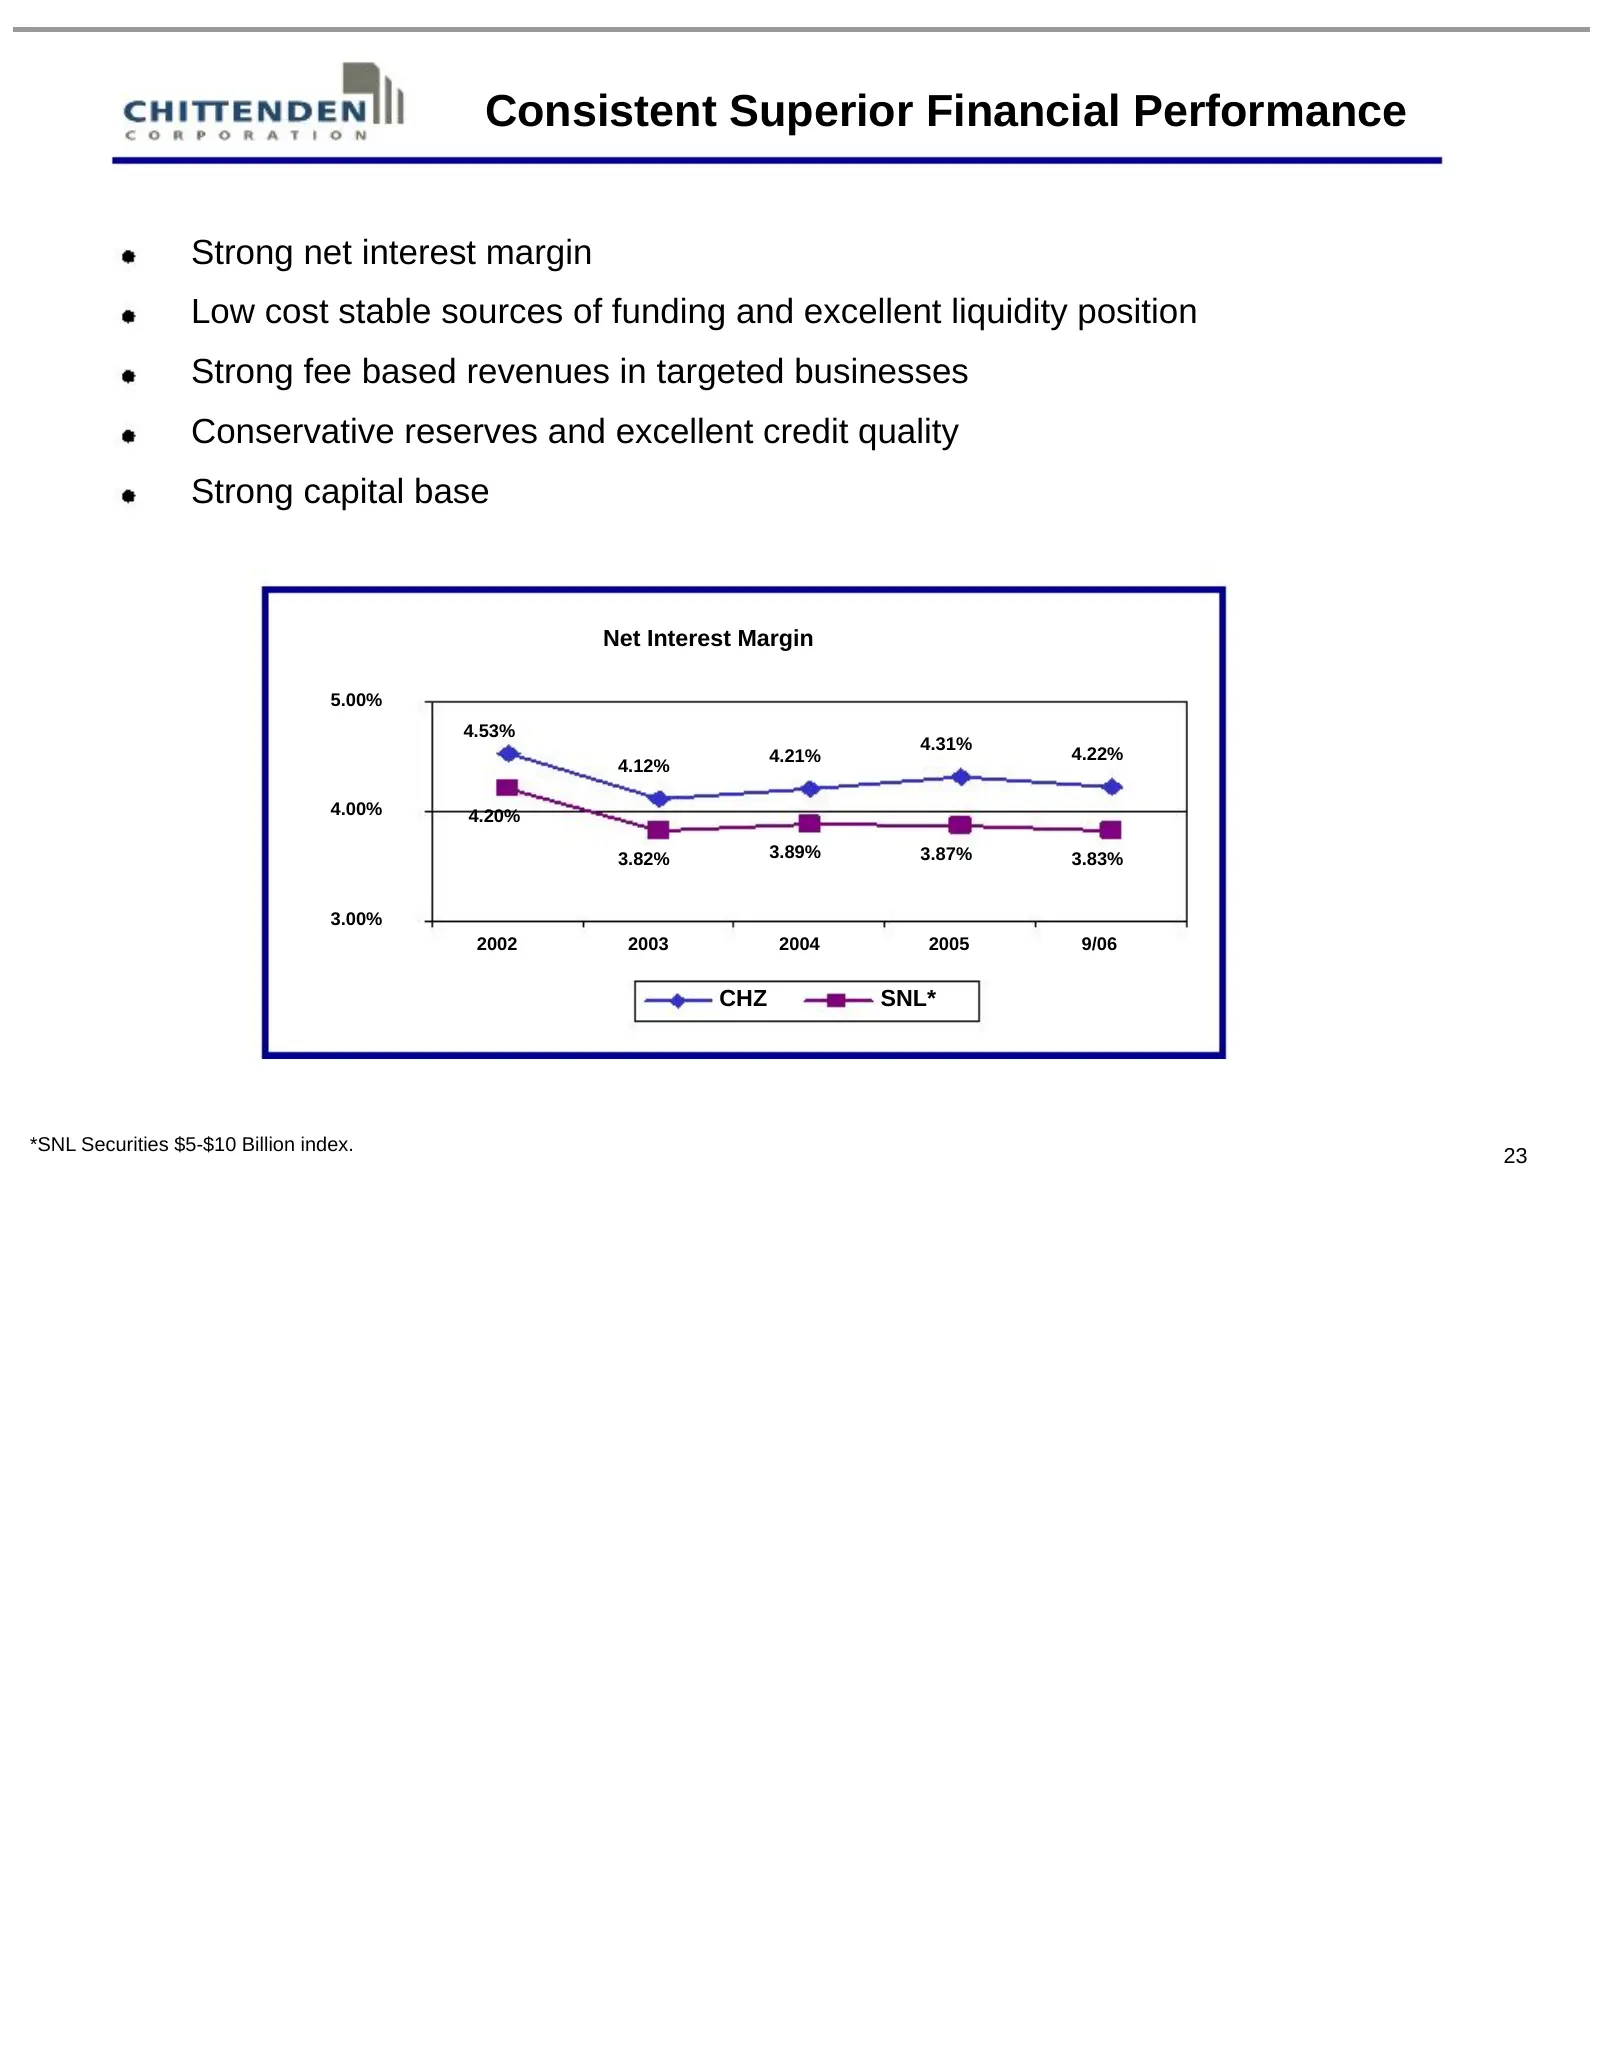
Consistent Superior Financial Performance Strong net interest margin Low cost stable sources of funding and excellent liquidity position Strong fee based revenues in targeted businesses Conservative reserves and excellent credit quality Strong capital base Net Interest Margin 5.00% 4.53% 4.31% 4.21%
Slide 24: Yields and Cost of Funds vs SNL Index
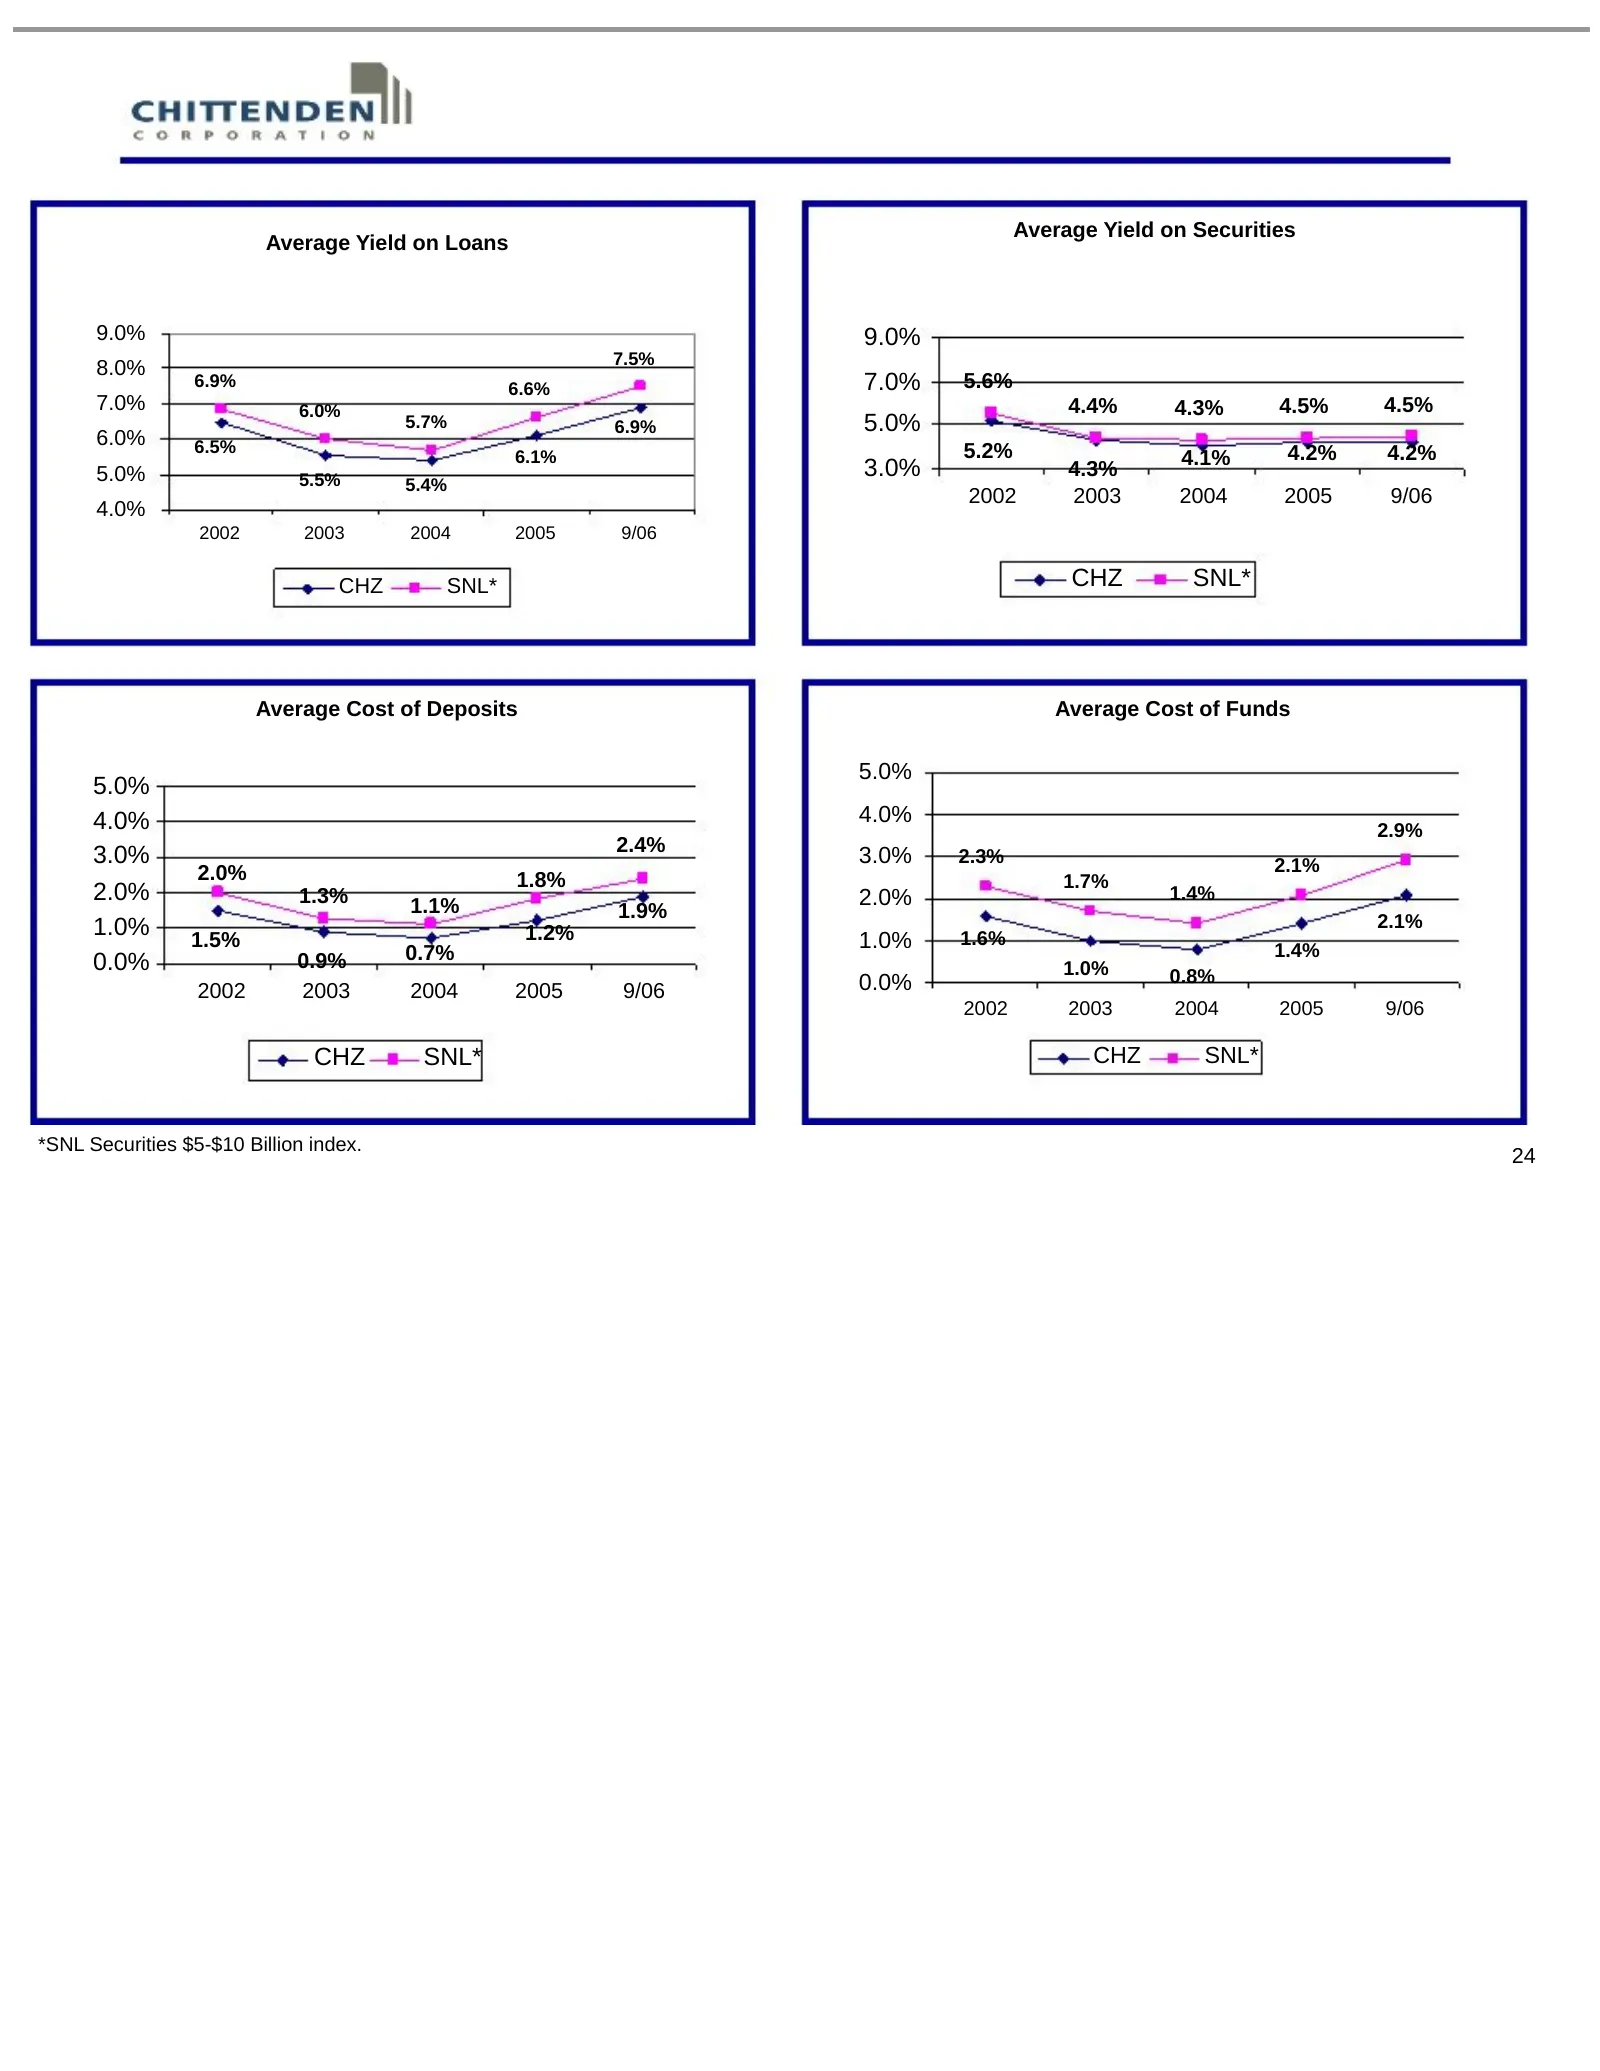
Average Yield on Securities Average Yield on Loans 9.0% 9.0% 7.5% 8.0% 6.9% 6.6% 7.0% 5.6% 7.0% 6.0% 4.4% 4.3% 4.5% 4.5% 5.7% 6.9% 5.0% 6.0% 6.5% 6.1% 5.2% 4.1% 4.2% 4.2% 5.0% 5.5% 3.0% 4.3% 5.4% 2002 2003 2004 2005 9/06 4.0% 2002 2003 2004 2005 9/06 CHZ SNL* CHZ SNL* Average Cost of Deposits Averag
Slide 25: Noninterest Income
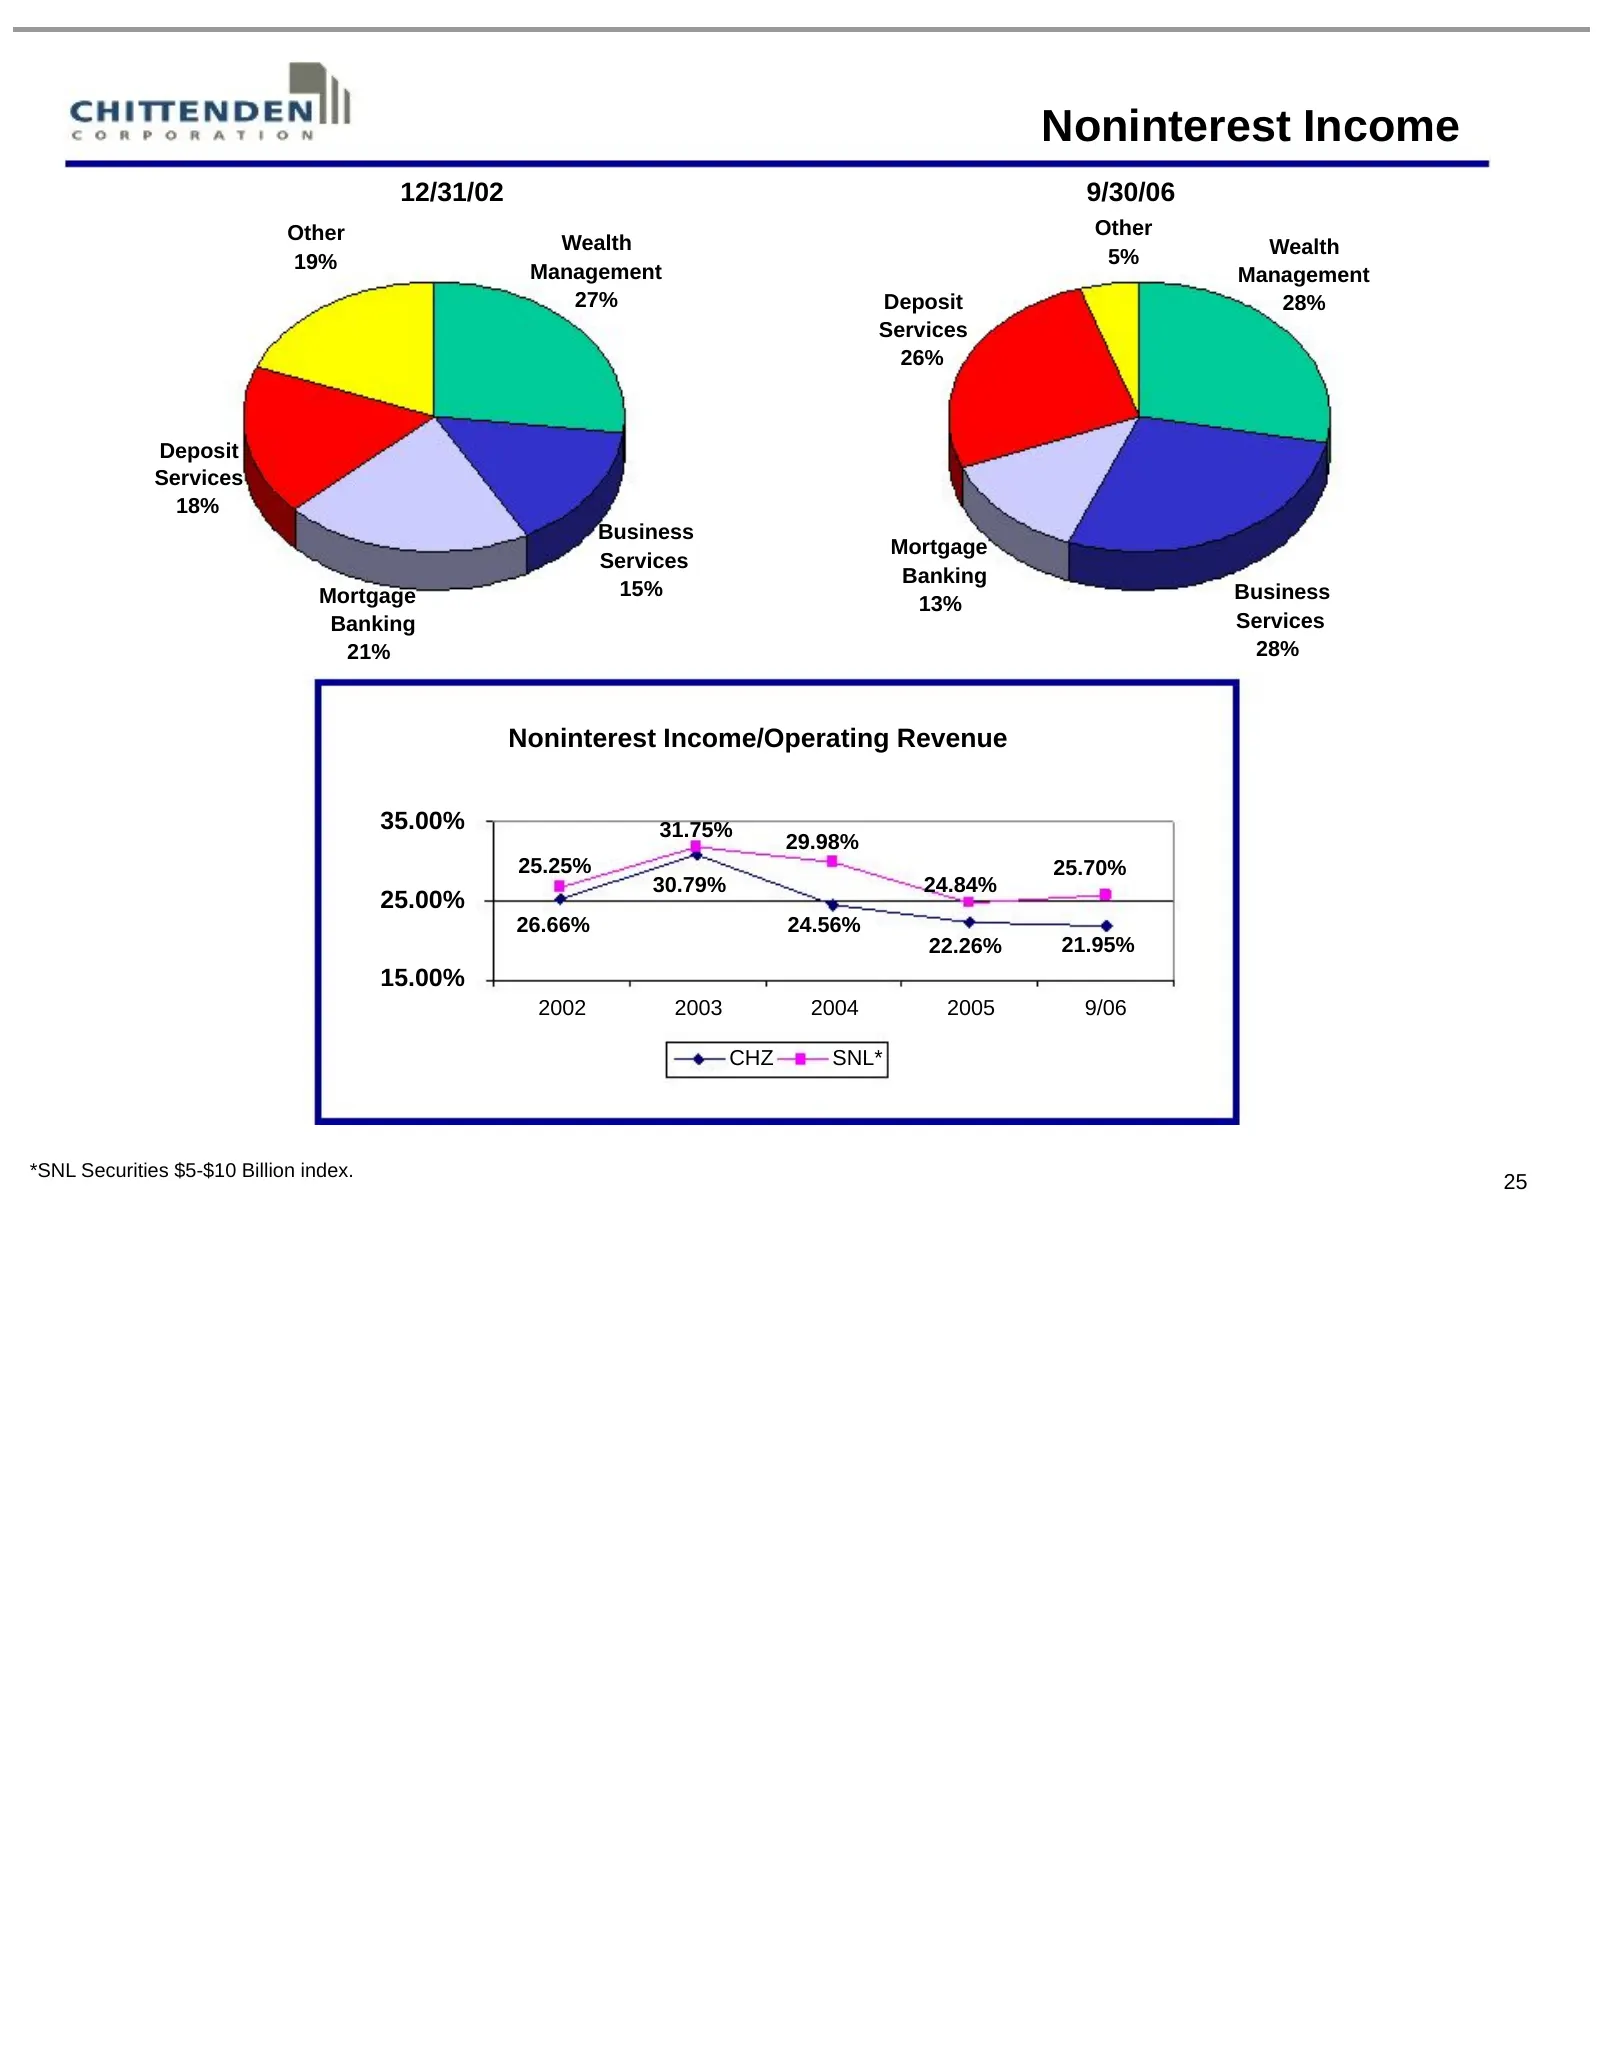
Noninterest Income 12/31/02 9/30/06 Other Other Wealth Wealth 19% 5% Management Management 27% Deposit 28% Services 26% Deposit Services 18% Business Mortgage Services Banking Mortgage 15% Business 13% Banking Services 21% 28% Noninterest Income/Operating Revenue 35.00% 31.75% 29.98% 25.25% 25.70% 3
Slide 26: Noninterest Expense
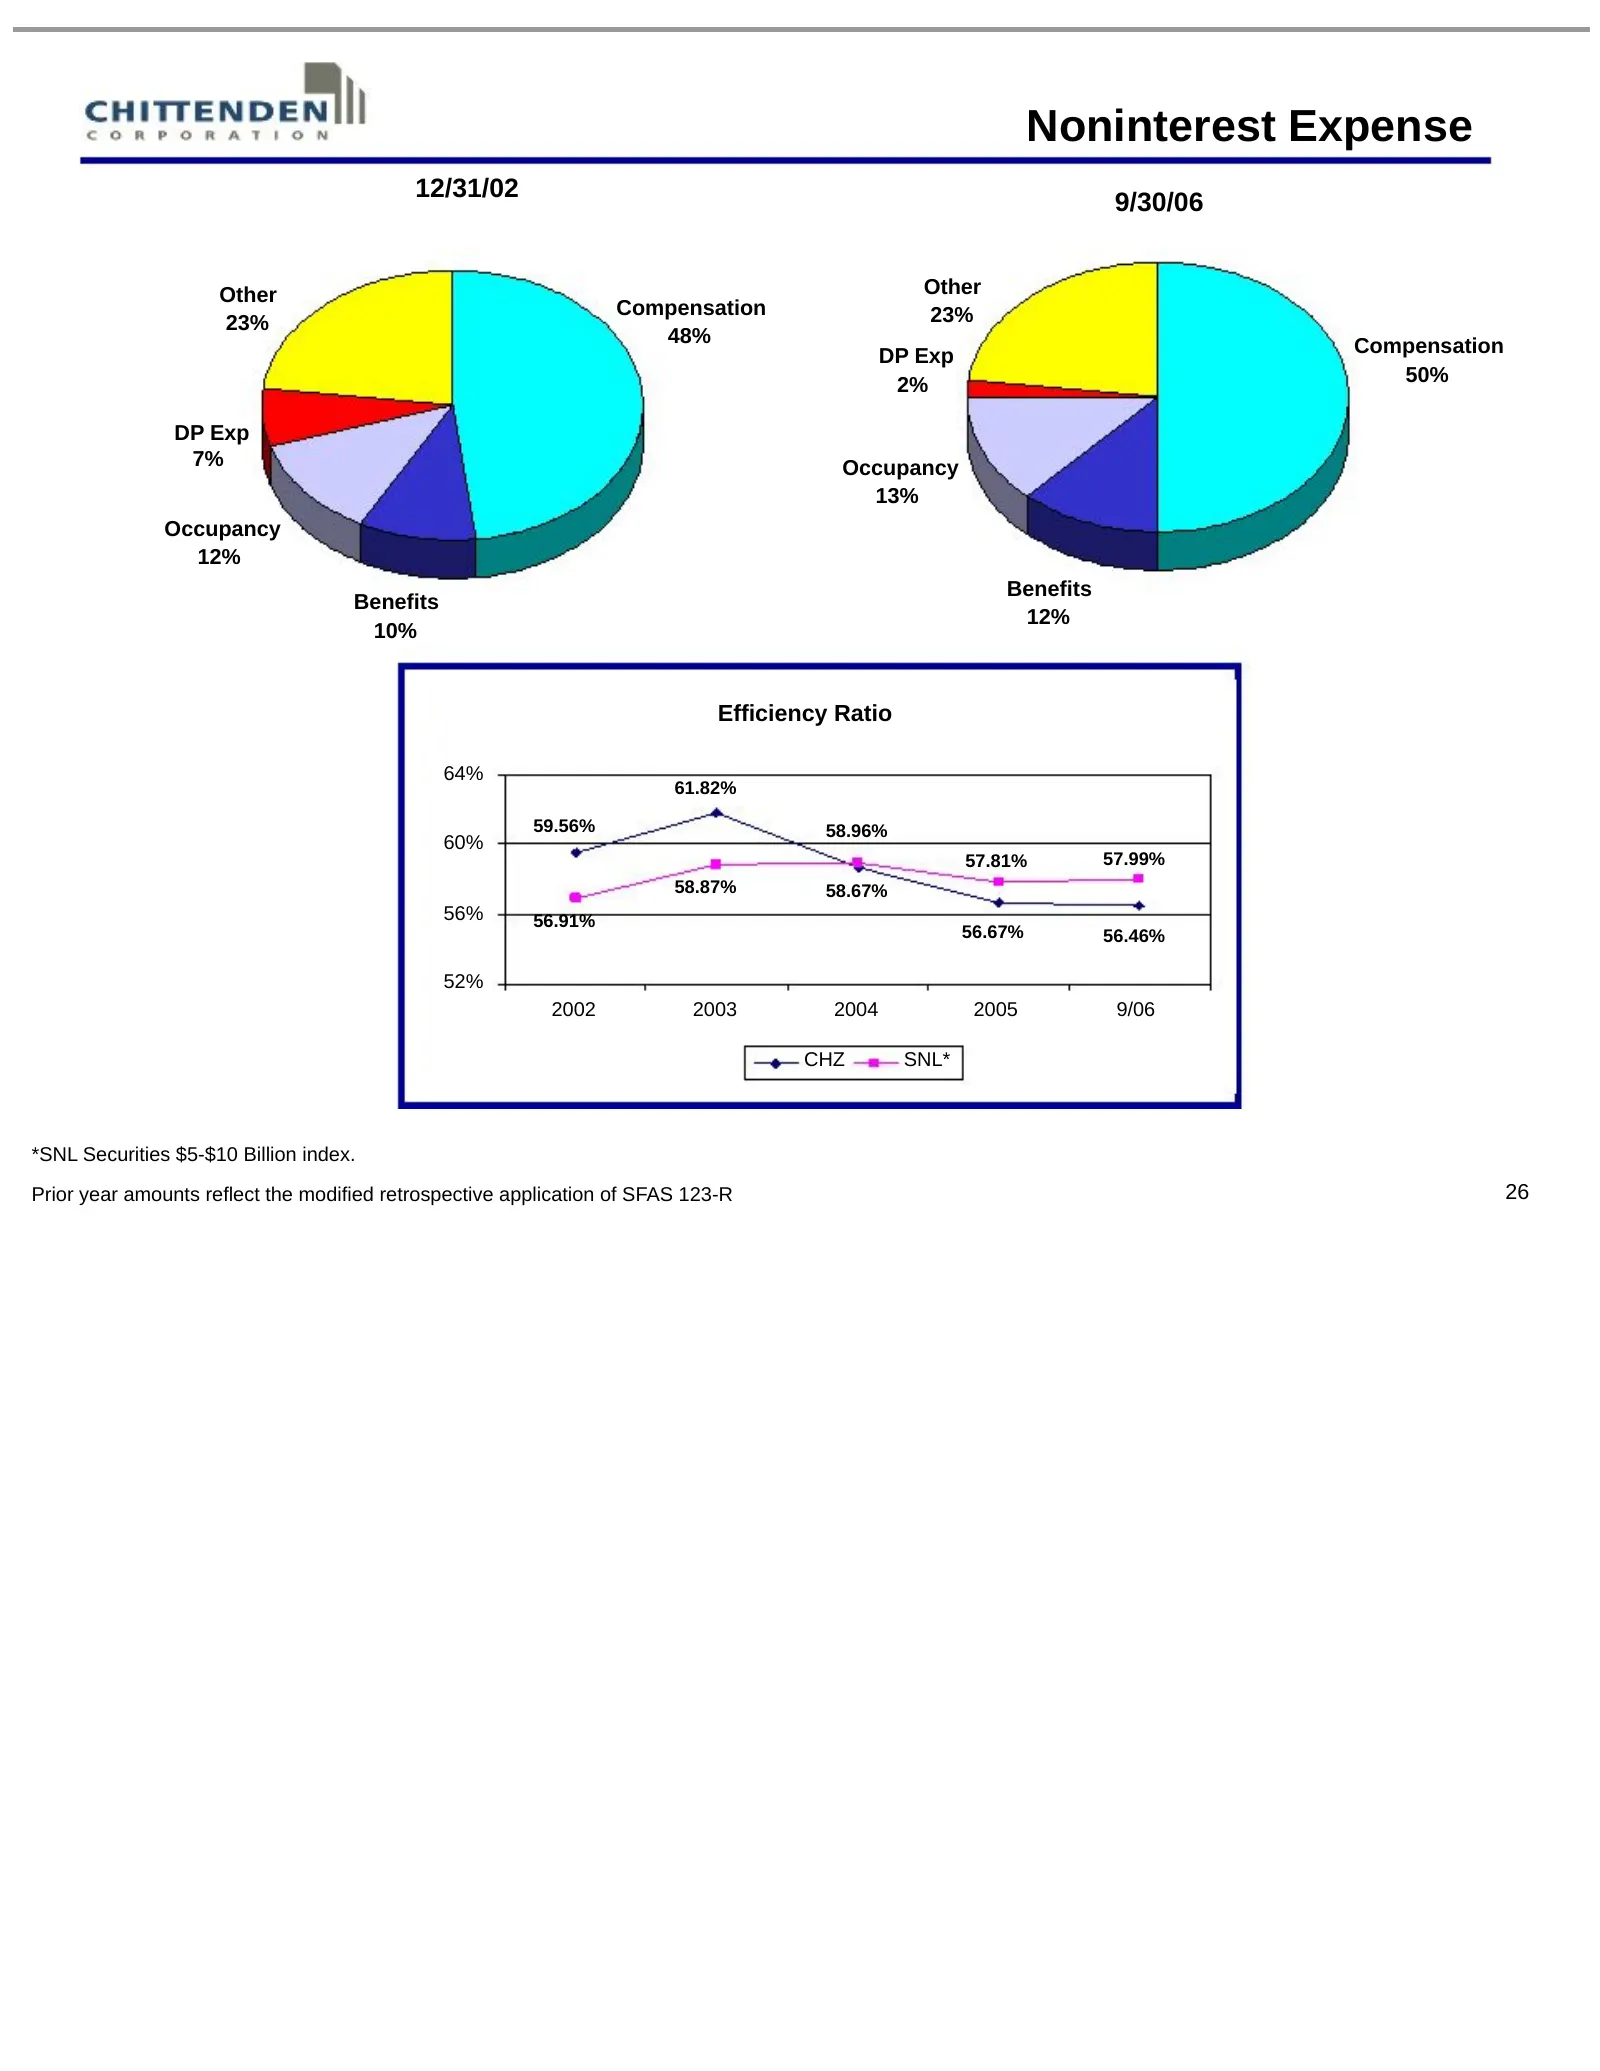
Noninterest Expense 12/31/02 9/30/06 Other Other Compensation 23% 23% 48% Compensation DP Exp 2% 50% DP Exp 7% Occupancy 13% Occupancy 12% Benefits Benefits 12% 10% Efficiency Ratio 64% 61.82% 59.56% 58.96% 60% 57.81% 57.99% 58.87% 58.67% 56% 56.91% 56.67% 56.46% 52% 2002 2003 2004 2005 9/06 CHZ SNL
Slide 27: Financial Summary
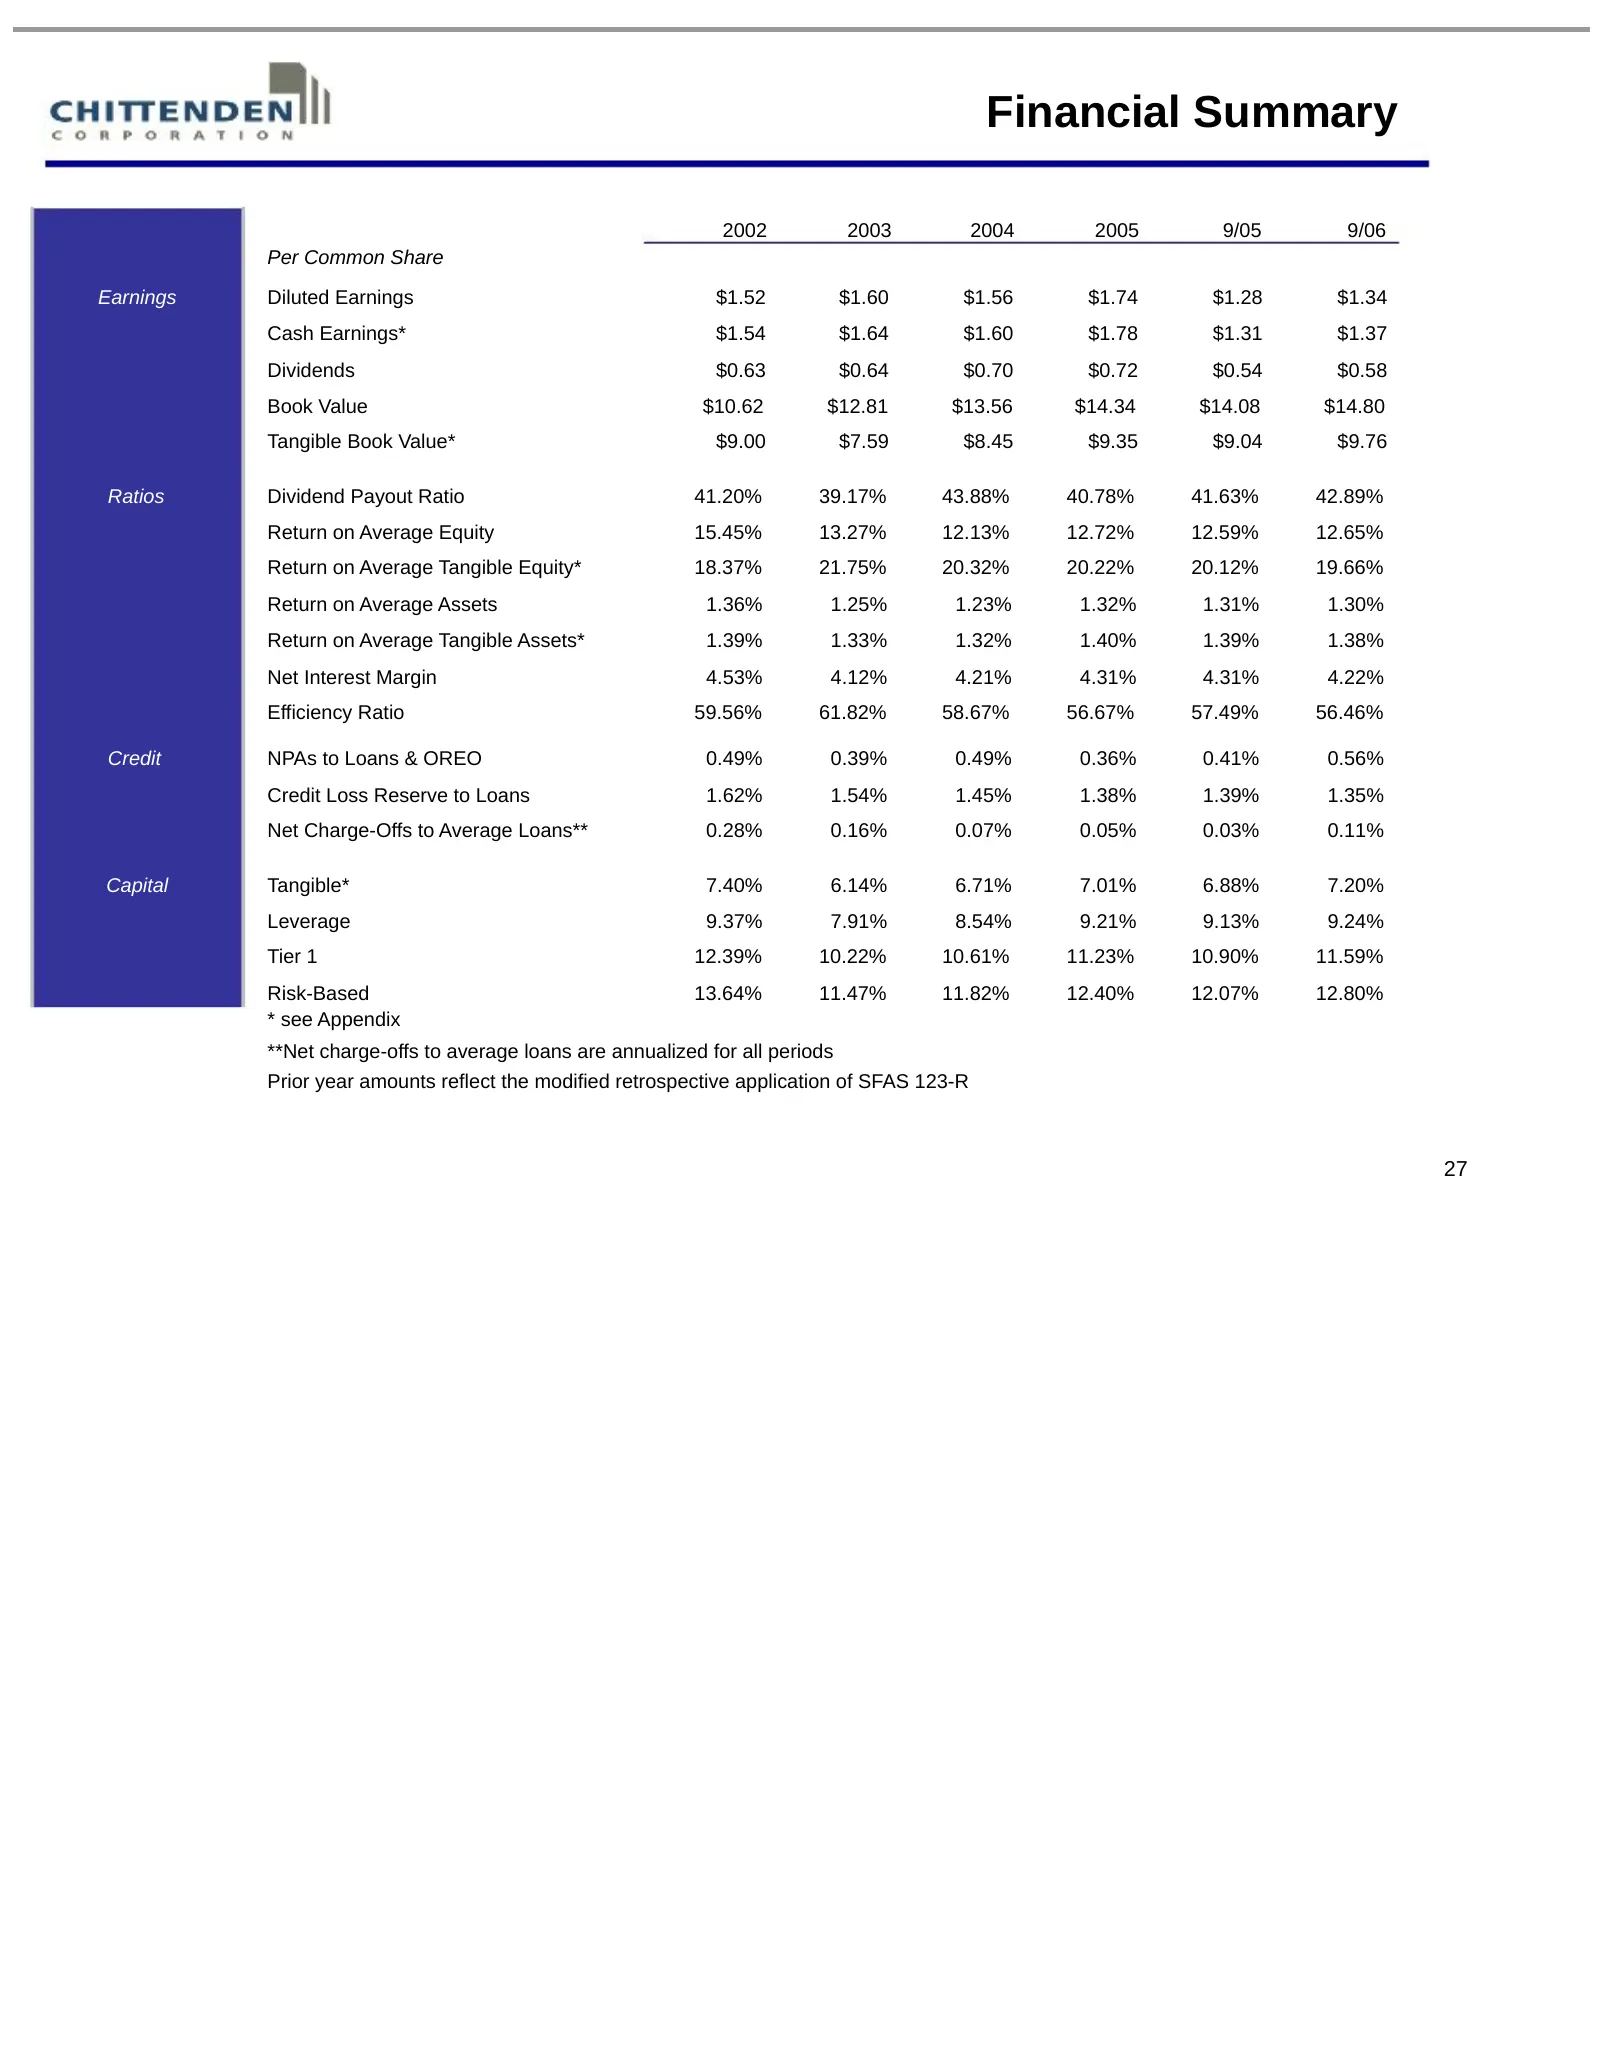
Financial Summary 2002 2003 2004 2005 9/05 9/06 Per Common Share Earnings Diluted Earnings $1.52 $1.60 $1.56 $1.74 $1.28 $1.34 Cash Earnings* $1.54 $1.64 $1.60 $1.78 $1.31 $1.37 Dividends $0.63 $0.64 $0.70 $0.72 $0.54 $0.58 Book Value $10.62 $12.81 $13.56 $14.34 $14.08 $14.80 Tangible Book Value* $9
Slide 28: Risk Management
Risk Management 28
Slide 29: Credit Quality
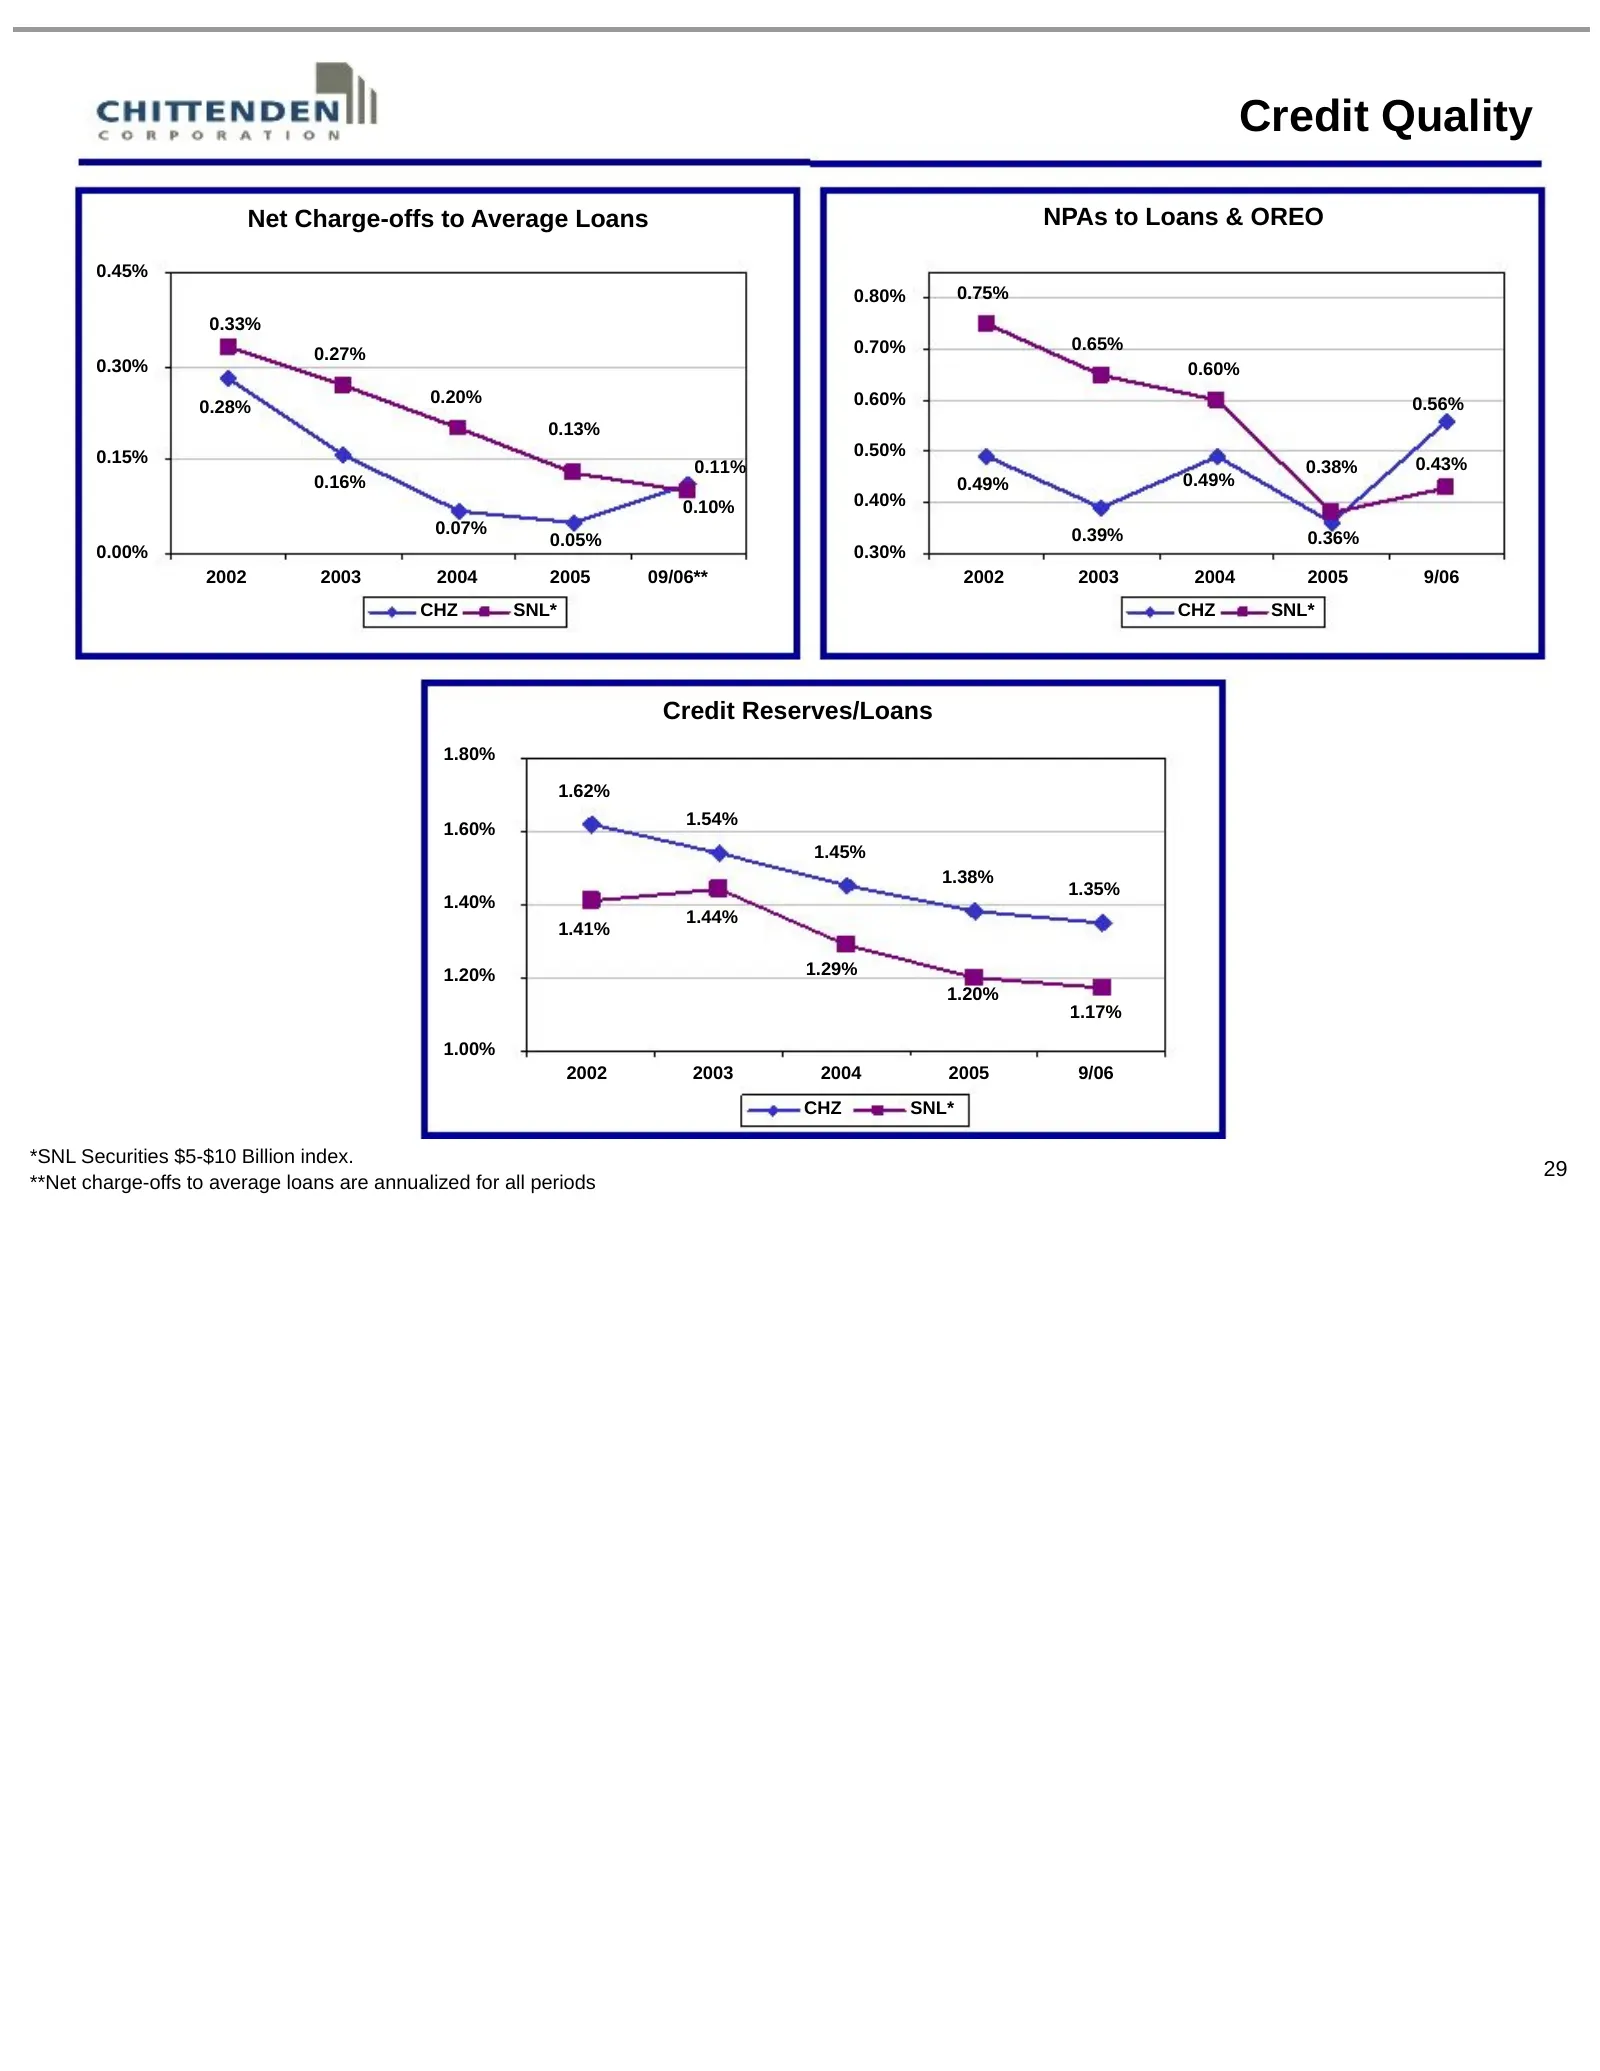
Credit Quality Net Charge-offs to Average Loans NPAs to Loans & OREO 0.45% 0.80% 0.75% 0.33% 0.70% 0.65% 0.27% 0.30% 0.60% 0.20% 0.60% 0.56% 0.28% 0.13% 0.15% 0.50% 0.11% 0.38% 0.43% 0.16% 0.49% 0.49% 0.10% 0.40% 0.07% 0.39% 0.05% 0.36% 0.00% 0.30% 2002 2003 2004 2005 09/06** 2002 2003 2004 2005 9/0
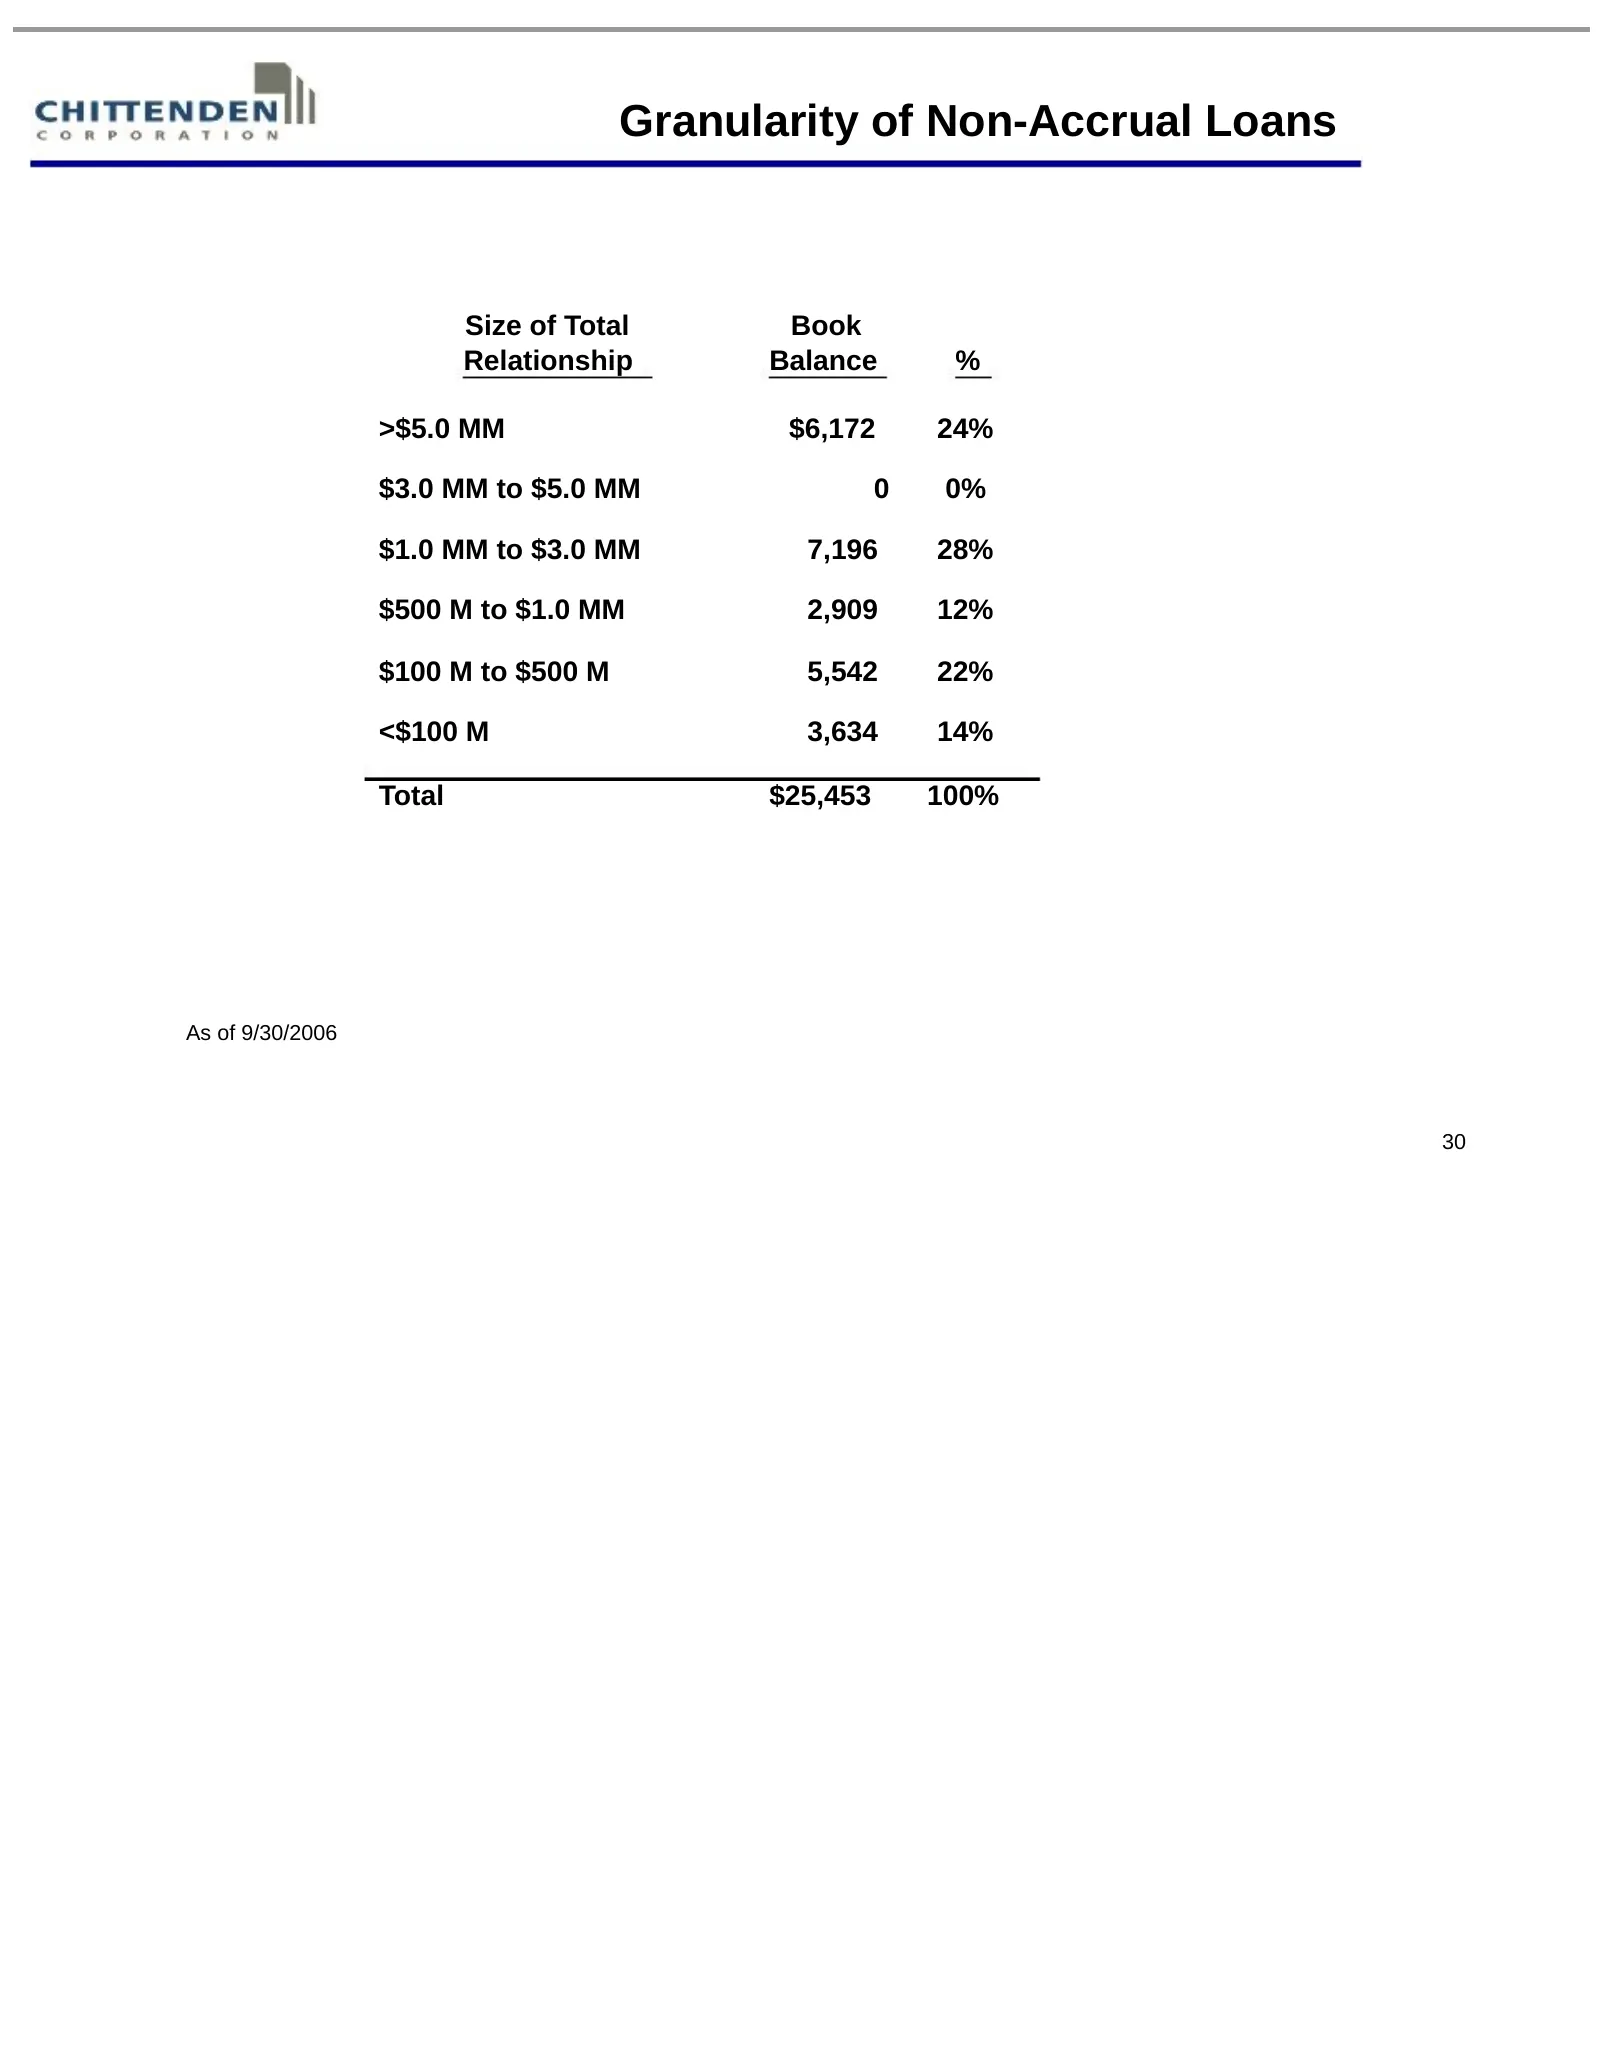
Slide 30: Granularity of Non-Accrual Loans
Granularity of Non-Accrual Loans Size of Total Book Relationship Balance % >$5.0 MM $6,172 24% $3.0 MM to $5.0 MM 0 0% $1.0 MM to $3.0 MM 7,196 28% $500 M to $1.0 MM 2,909 12% $100 M to $500 M 5,542 22% <$100 M 3,634 14% Total $25,453 100% As of 9/30/2006 30
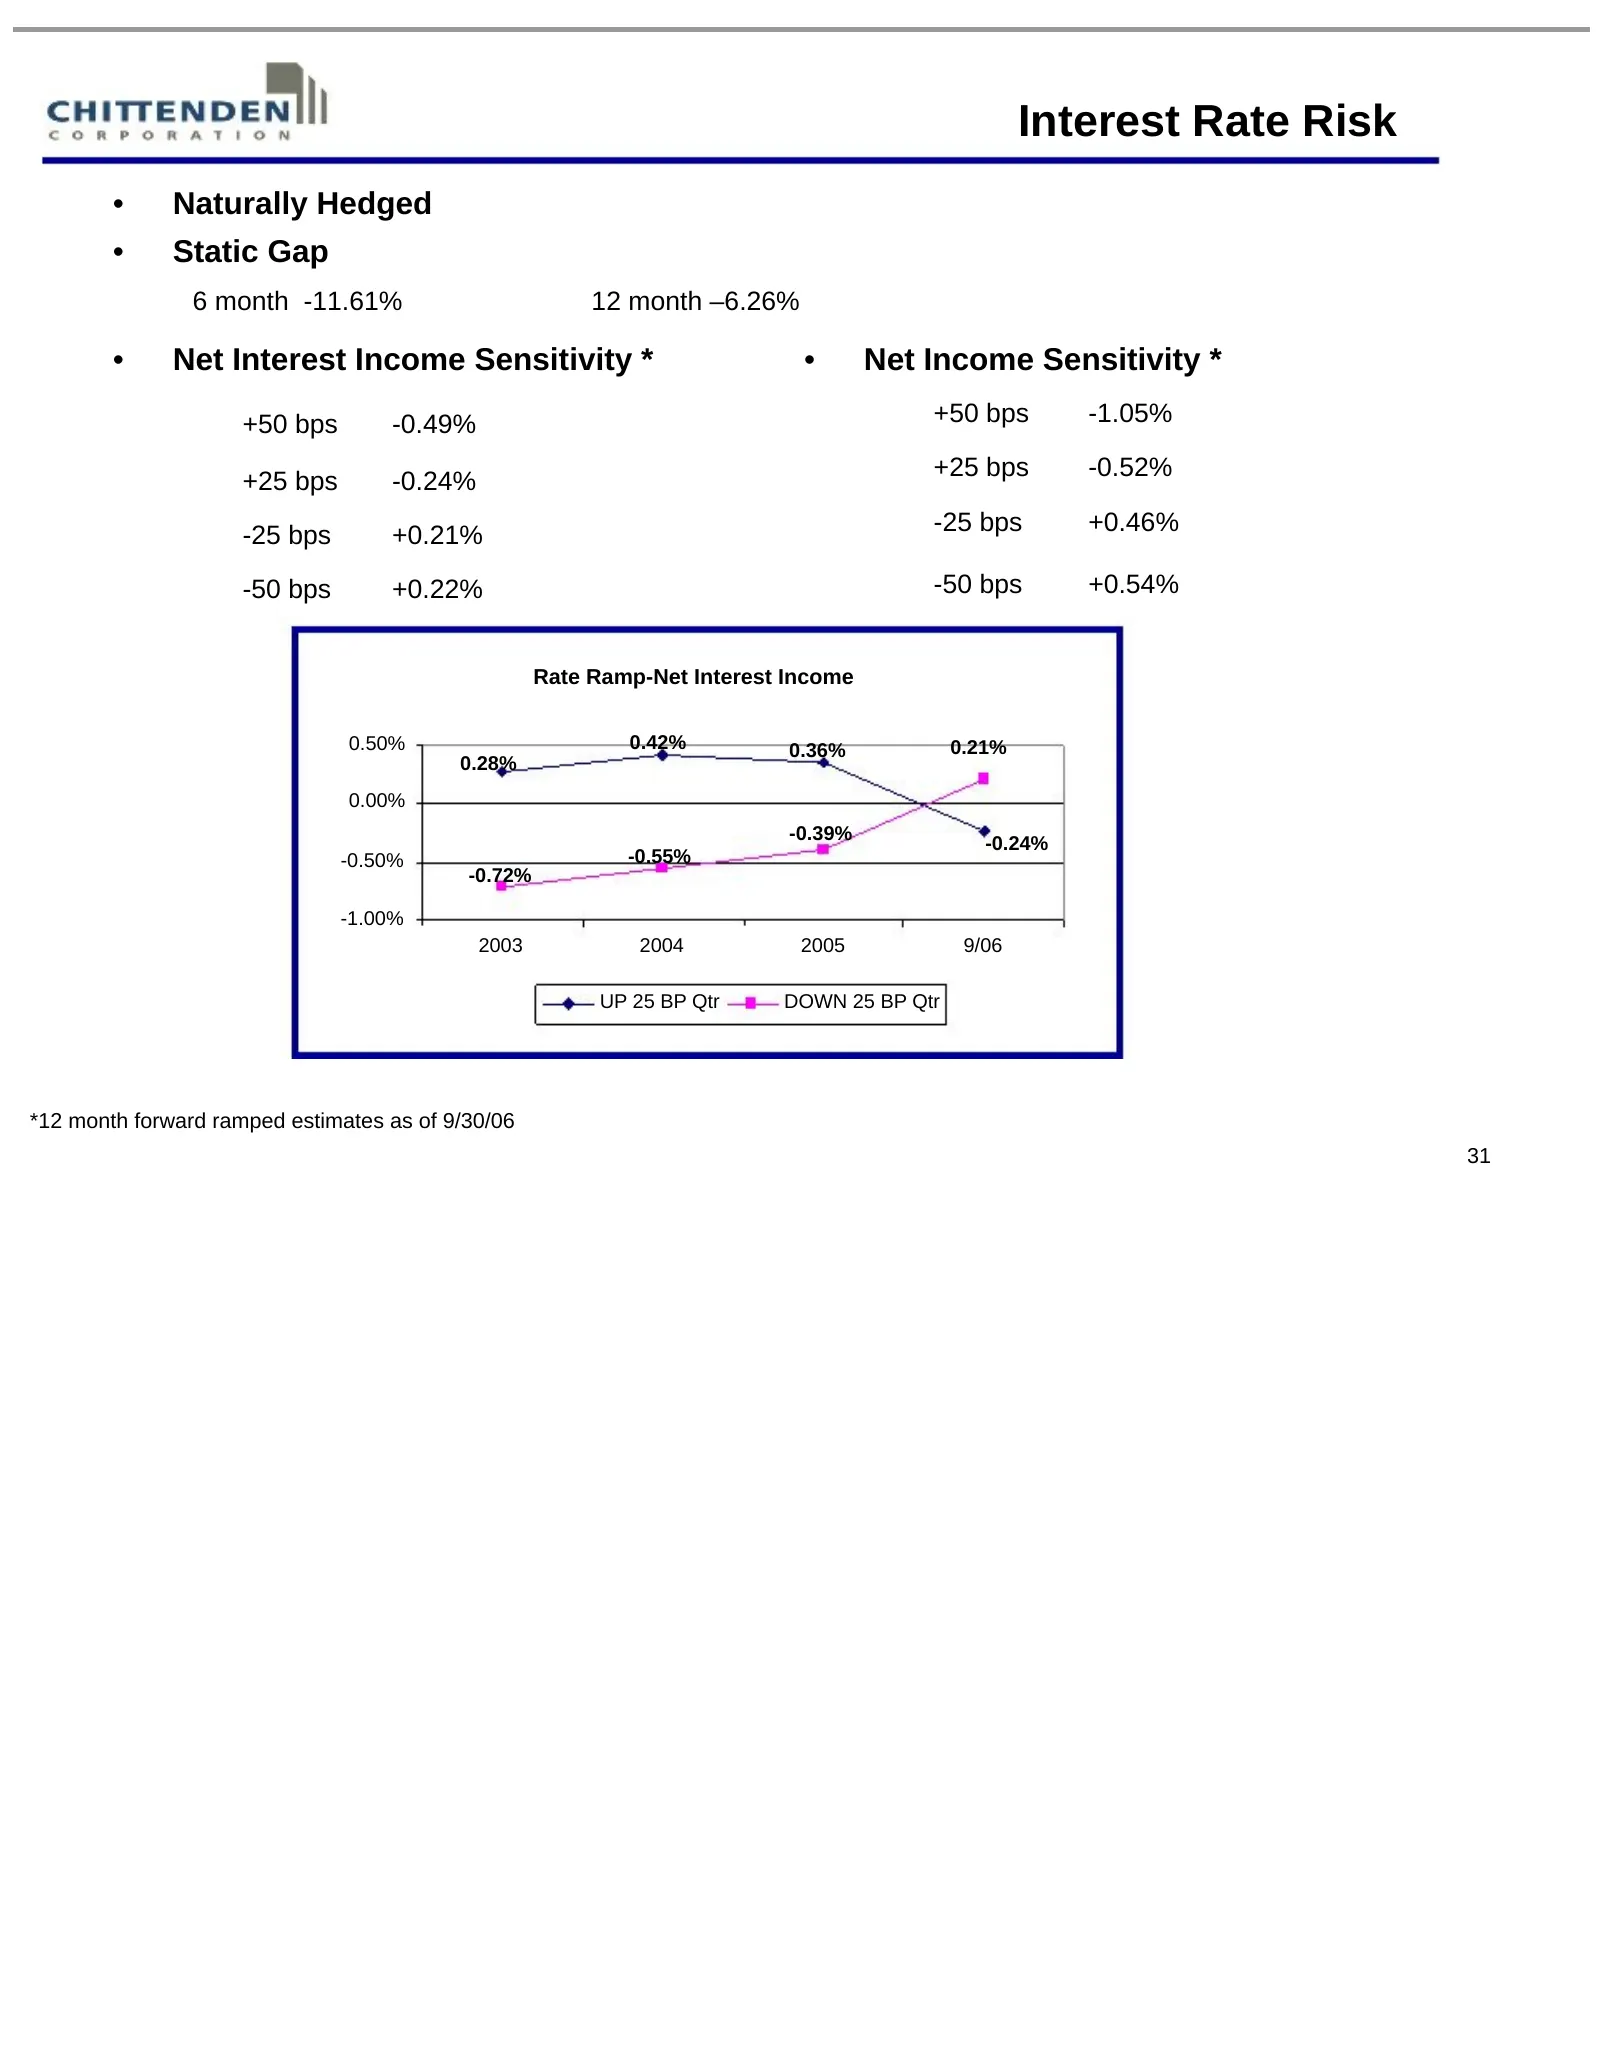
Slide 31: Interest Rate Risk
Interest Rate Risk • Naturally Hedged • Static Gap 6 month -11.61% 12 month –6.26% • Net Interest Income Sensitivity * • Net Income Sensitivity * +50 bps -0.49% +50 bps -1.05% +25 bps -0.52% +25 bps -0.24% -25 bps +0.46% -25 bps +0.21% -50 bps +0.22% -50 bps +0.54% Rate Ramp-Net Interest Income 0.50
Slide 32: In Summary
In Summary 32
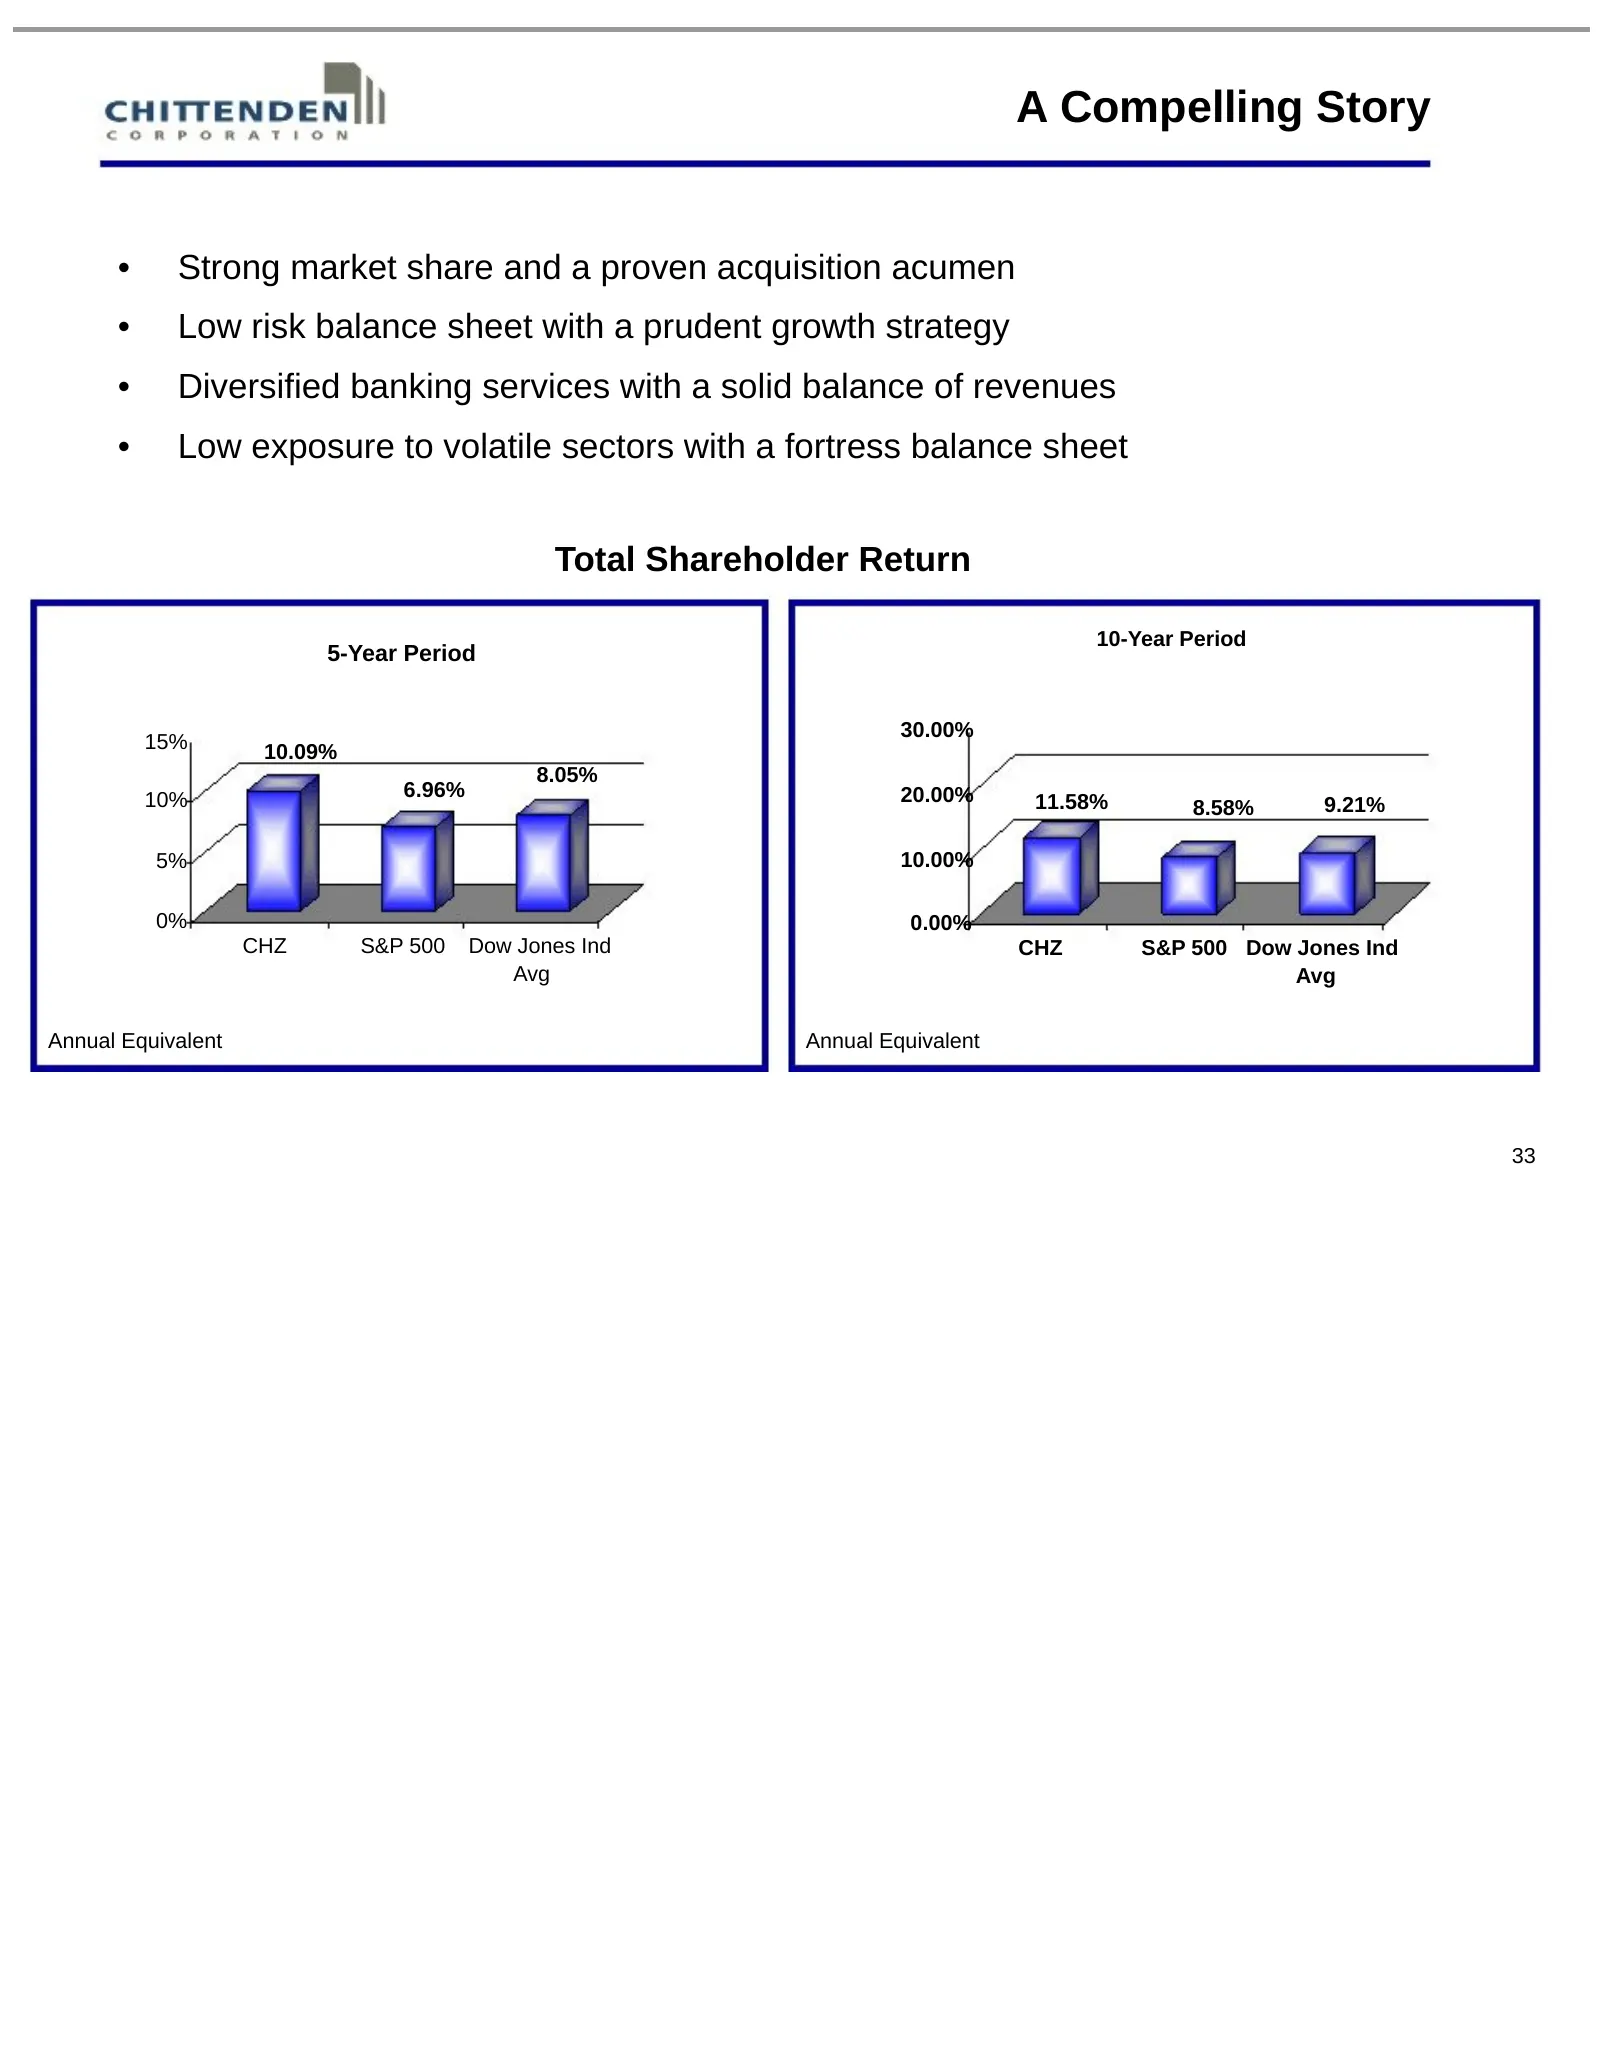
Slide 33: A Compelling Story
A Compelling Story • Strong market share and a proven acquisition acumen • Low risk balance sheet with a prudent growth strategy • Diversified banking services with a solid balance of revenues • Low exposure to volatile sectors with a fortress balance sheet Total Shareholder Return 10-Year Period 5-
Slide 34: Visit our website; forward-looking statements
Visit our website for a wide range of products, latest financial reports and many other interactive services: www.chittendencorp.com This presentation contains “forward-looking statements” which may describe future plans and strategic initiatives. These forward- looking statements are based on curre
Slide 35: Appendix
Appendix 35
Slide 36: Reconciliation of non-GAAP measurements to GAAP
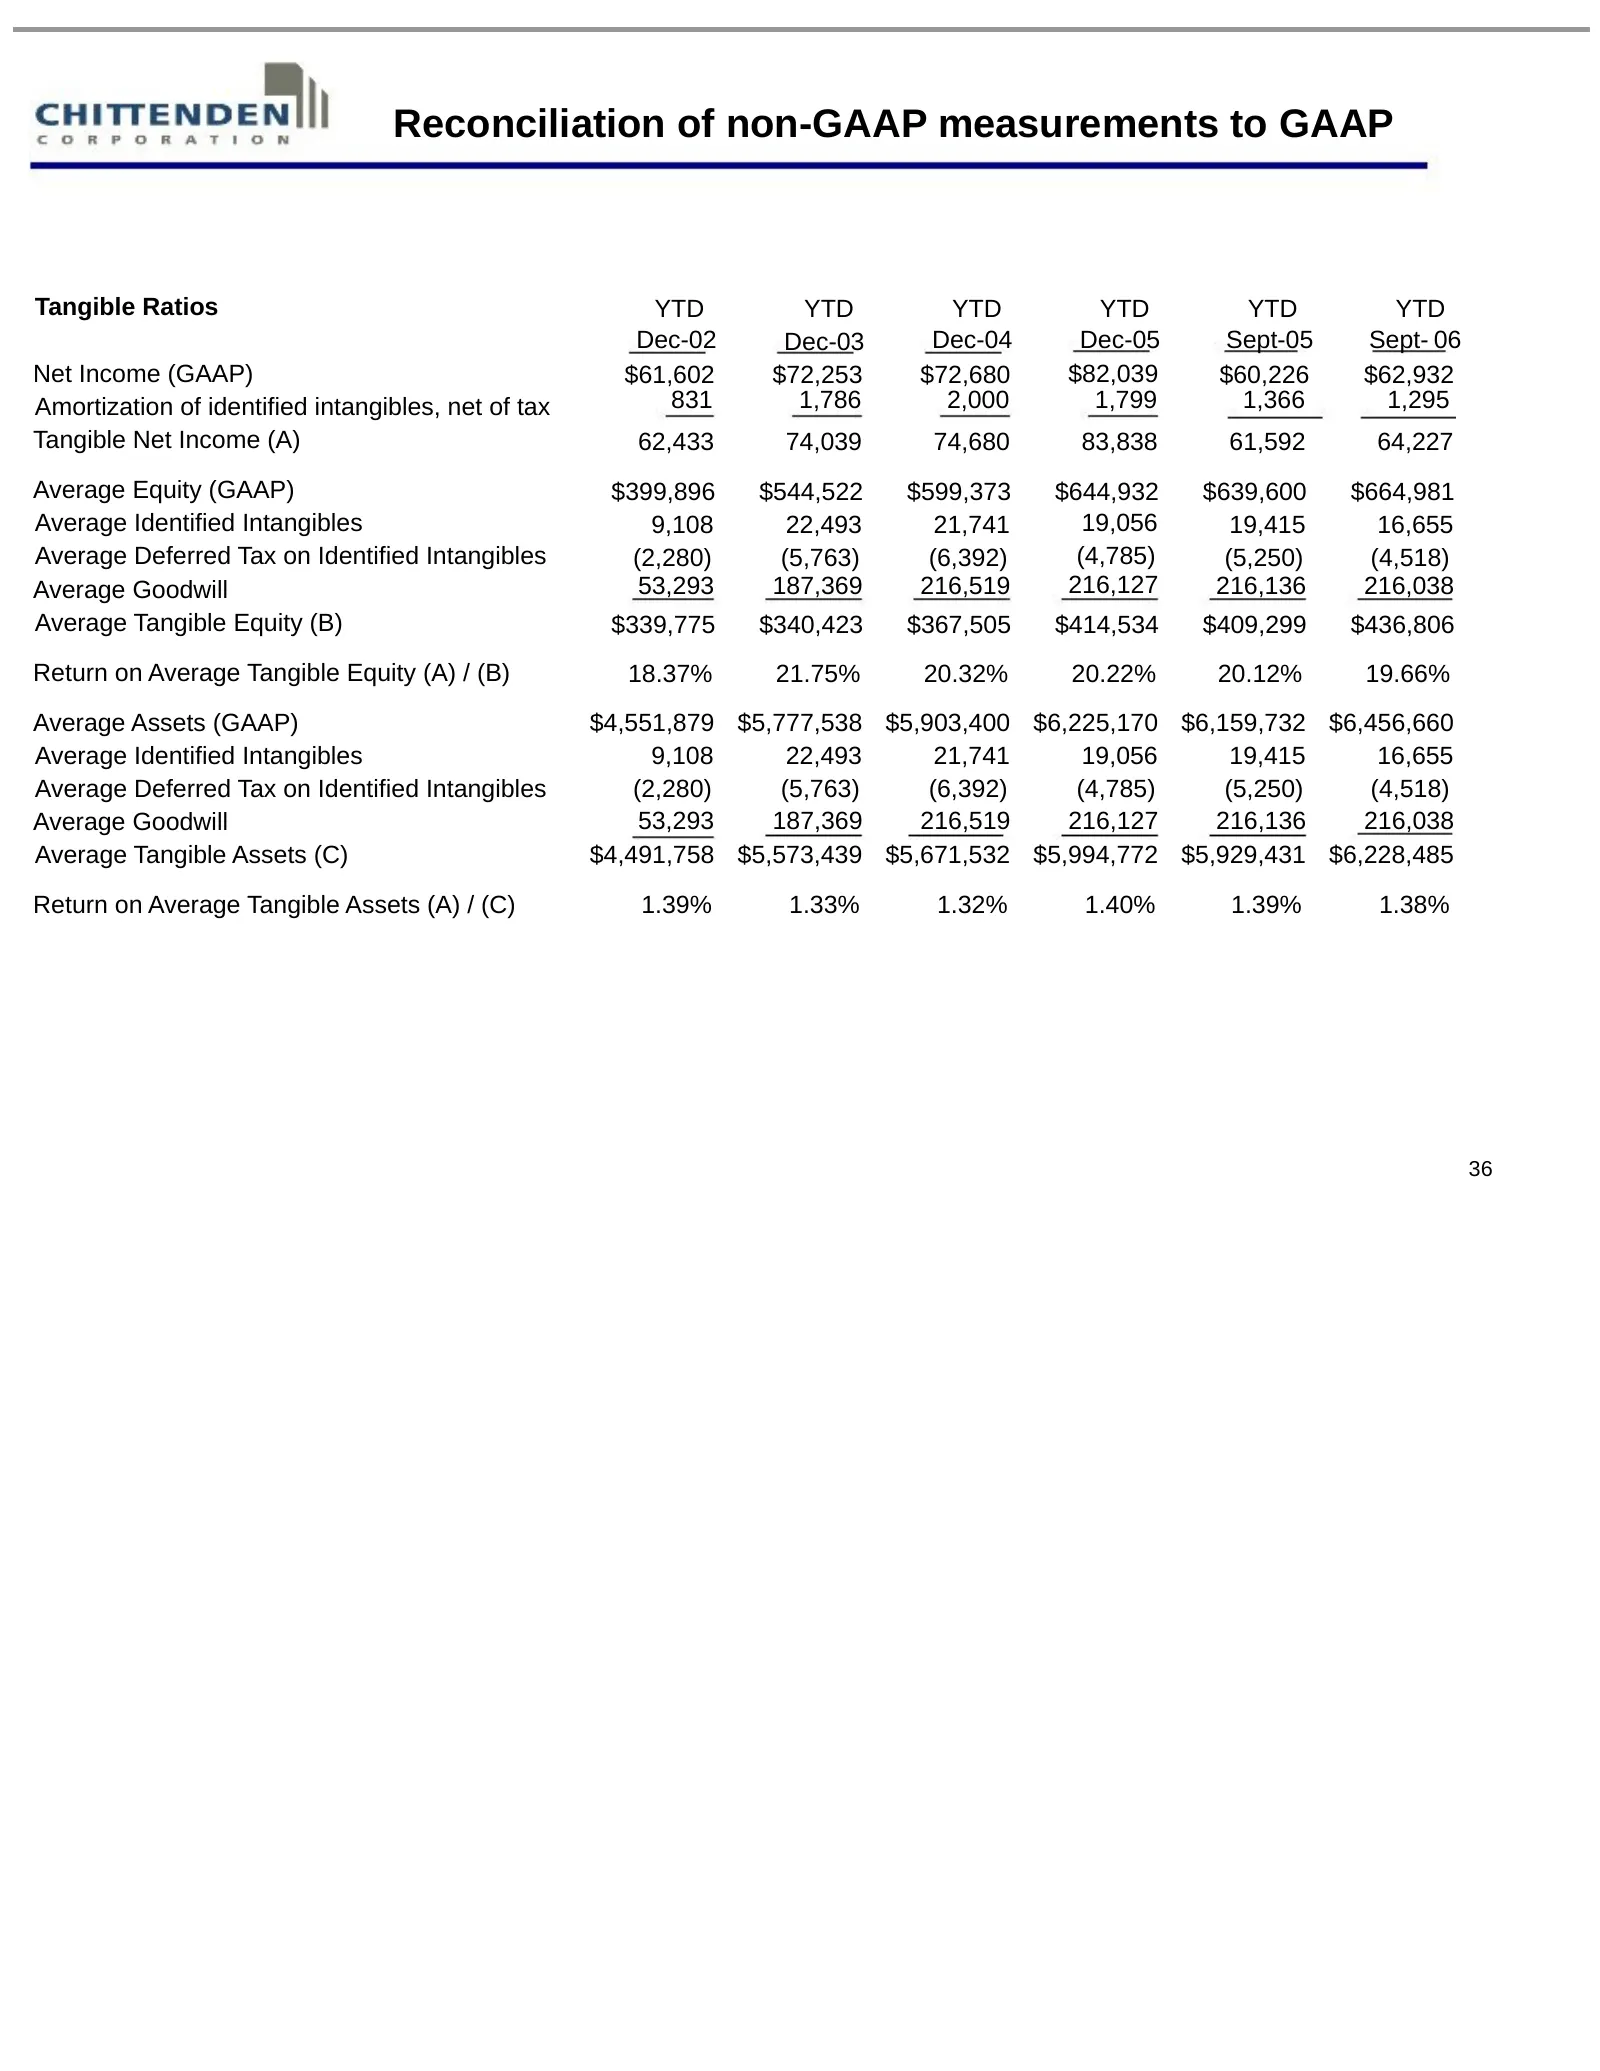
Reconciliation of non-GAAP measurements to GAAP Tangible Ratios YTD YTD YTD YTD YTD YTD Dec-02 Dec-03 Dec-04 Dec-05 Sept-05 Sept- 06 Net Income (GAAP) $61,602 $72,253 $72,680 $82,039 $60,226 $62,932 Amortization of identified intangibles, net of tax 831 1,786 2,000 1,799 1,366 1,295 Tangible Net Inc
Slide 37: Reconciliation of non-GAAP measurements to GAAP
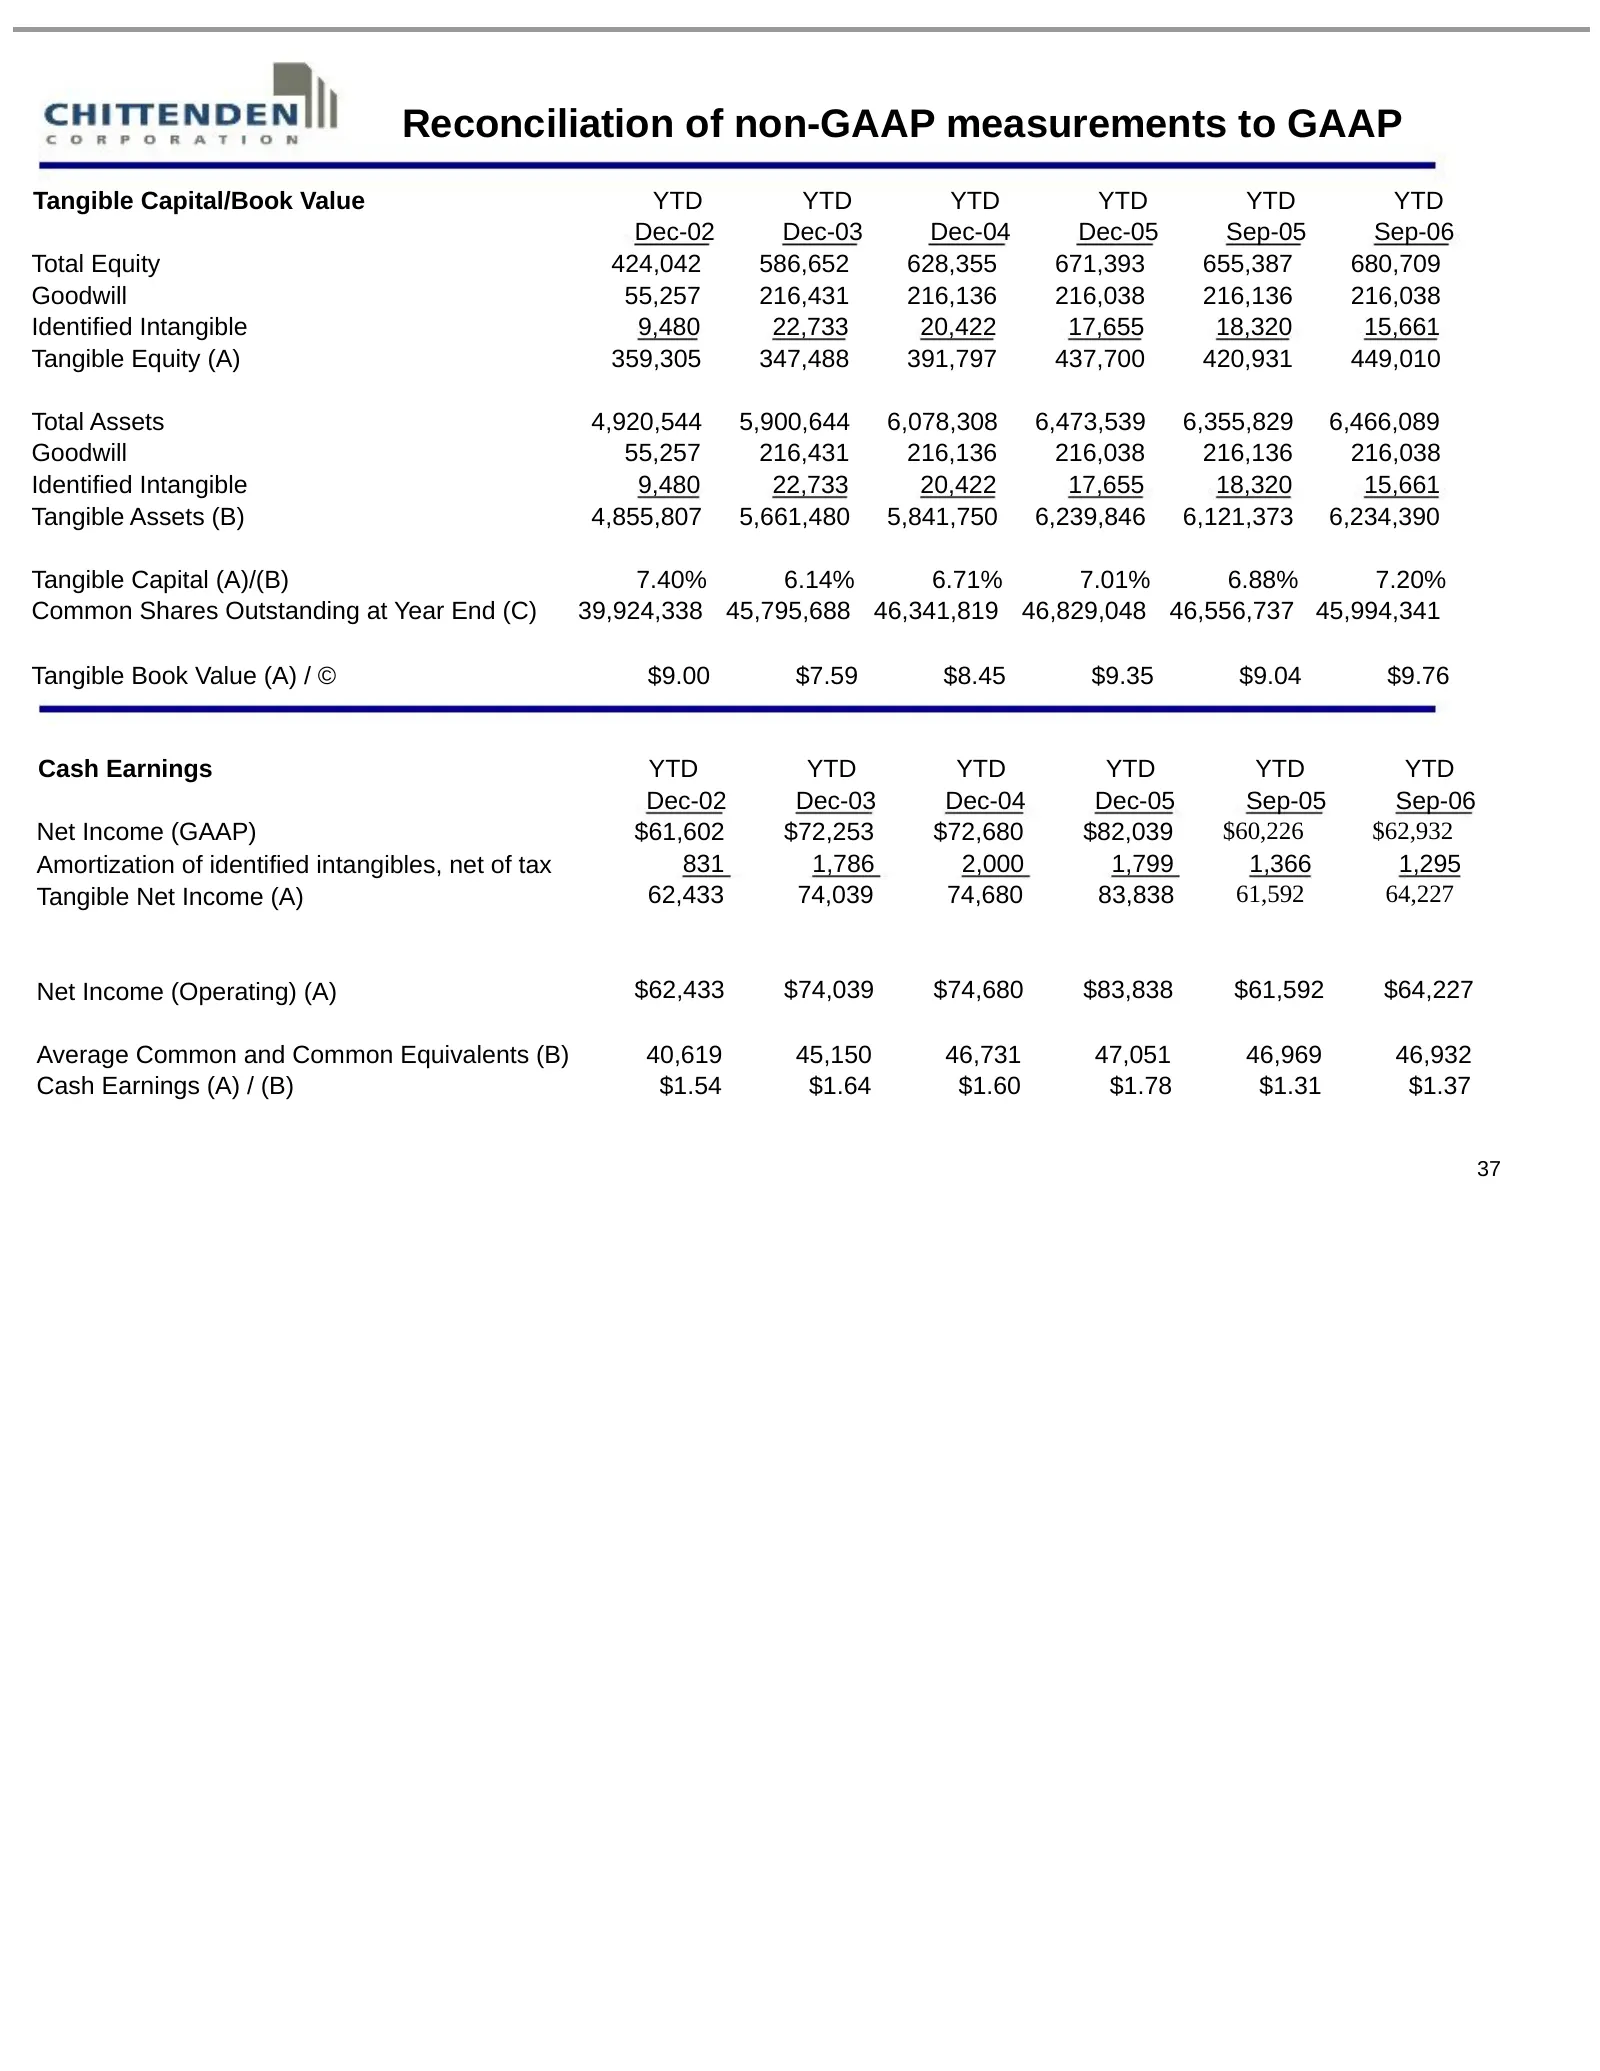
Reconciliation of non-GAAP measurements to GAAP Tangible Capital/Book Value YTD YTD YTD YTD YTD YTD Dec-02 Dec-03 Dec-04 Dec-05 Sep-05 Sep-06 Total Equity 424,042 586,652 628,355 671,393 655,387 680,709 Goodwill 55,257 216,431 216,136 216,038 216,136 216,038 Identified Intangible 9,480 22,733 20,422
Source: SEC EDGAR · 8-K filed Nov 15, 2006
More decks from Chittenden Corp
 Investor Presentation (September 2007)38 slides · Sep 7, 2007
 Merger or Acquisition (June 2007)27 slides · Jun 27, 2007
 Chittenden — Merger or Acquisition (June 2007)25 slides · Jun 27, 2007
 Merger or Acquisition (June 2007)9 slides · Jun 5, 2007
 Investor Presentation (May 2007)36 slides · May 14, 2007
 Investor Presentation (February 2007)37 slides · Feb 16, 2007