OP Bancorp · NASDAQ:OPBK
OP Bancorp — Q3 2024 Earnings Presentation
21 slides from OP Bancorp's earnings presentation, Oct 24, 2024
Slide 1: 2024 Third Quarter Earnings Presentation
2024 Third Quarter Earnings Presentation October 24, 2024
Slide 2: Forward-looking statements
Certain matters set forth herein constitute “forward-looking statements” within the meaning of Section 21E of the Securities Exchange Act of 1934, as amended, including forward- looking statements relating to the Company’s current business plans and expectations regarding future operating results. T
Slide 3: 3Q-2024 Highlights vs 2Q-2024
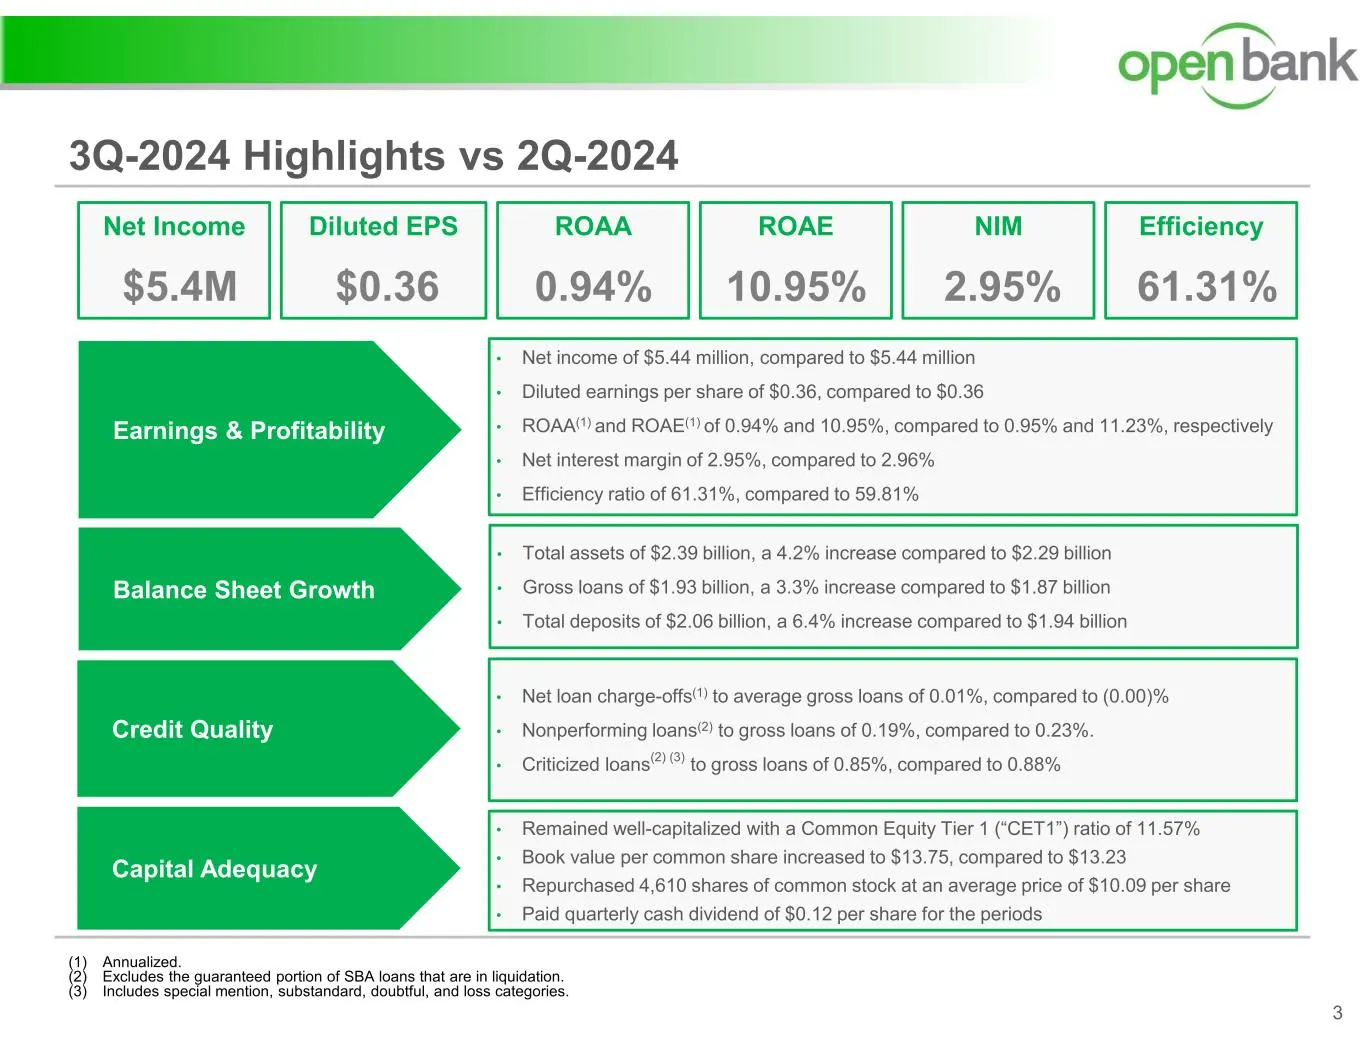
3Q-2024 Highlights vs 2Q-2024 3 (1) Annualized. (2) Excludes the guaranteed portion of SBA loans that are in liquidation. (3) Includes special mention, substandard, doubtful, and loss categories. Net Income $5.4M Earnings & Profitability Balance Sheet Growth Credit Quality Capital Adequacy • Net inc
Slide 4: Balance Sheet Trend
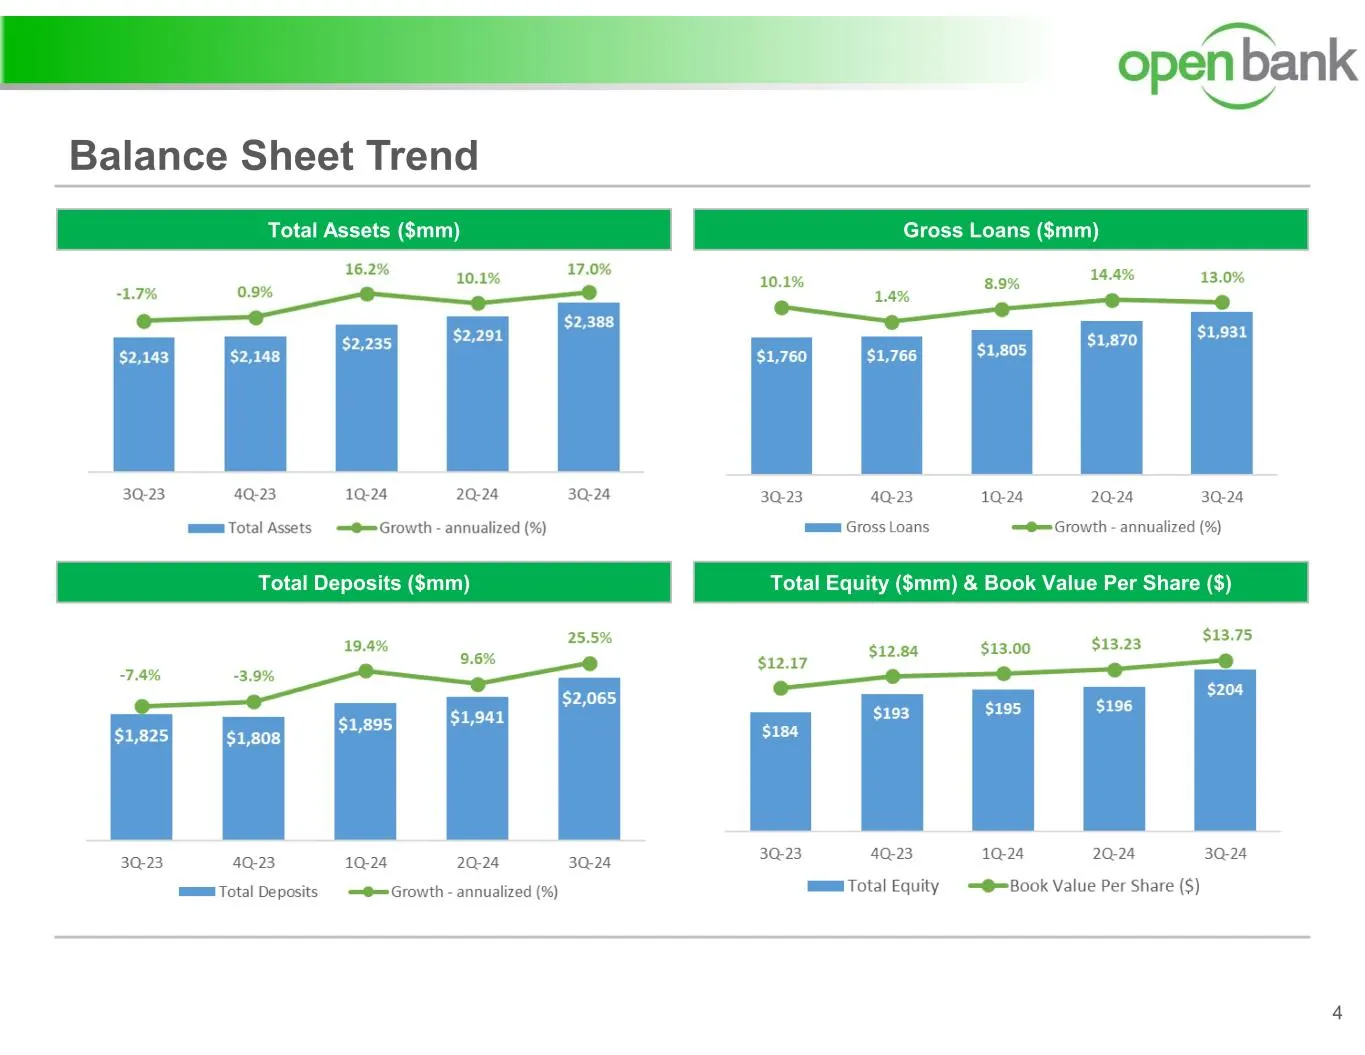
Balance Sheet Trend 4 Gross Loans ($mm)Total Assets ($mm) Total Equity ($mm) & Book Value Per Share ($)Total Deposits ($mm)
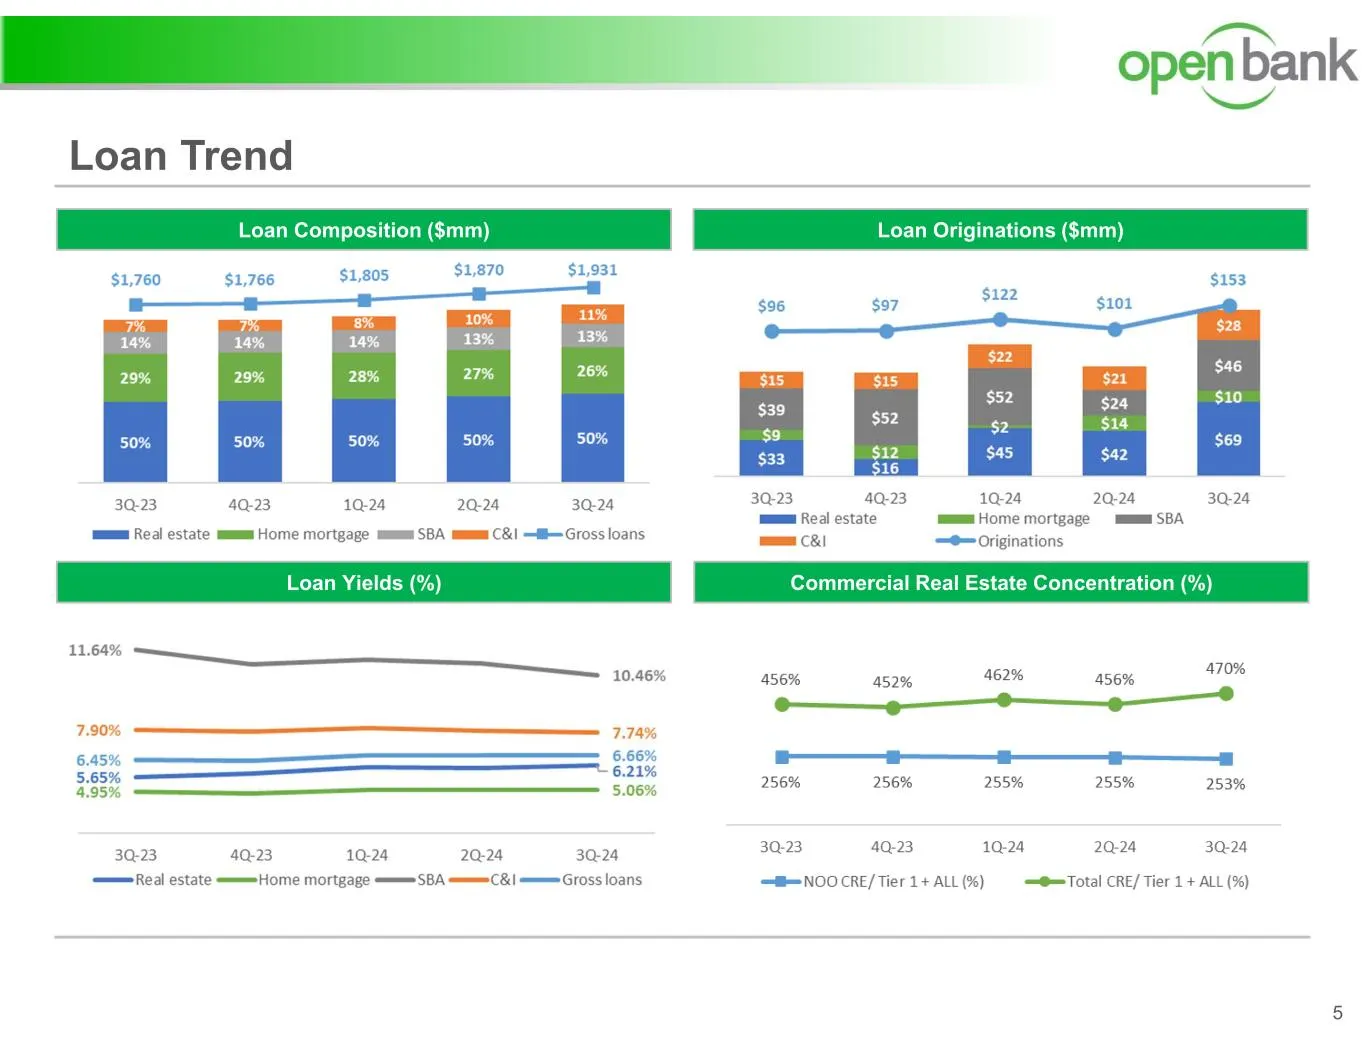
Slide 5: Loan Trend
Loan Trend 5 Loan Originations ($mm)Loan Composition ($mm) Loan Yields (%) Commercial Real Estate Concentration (%)
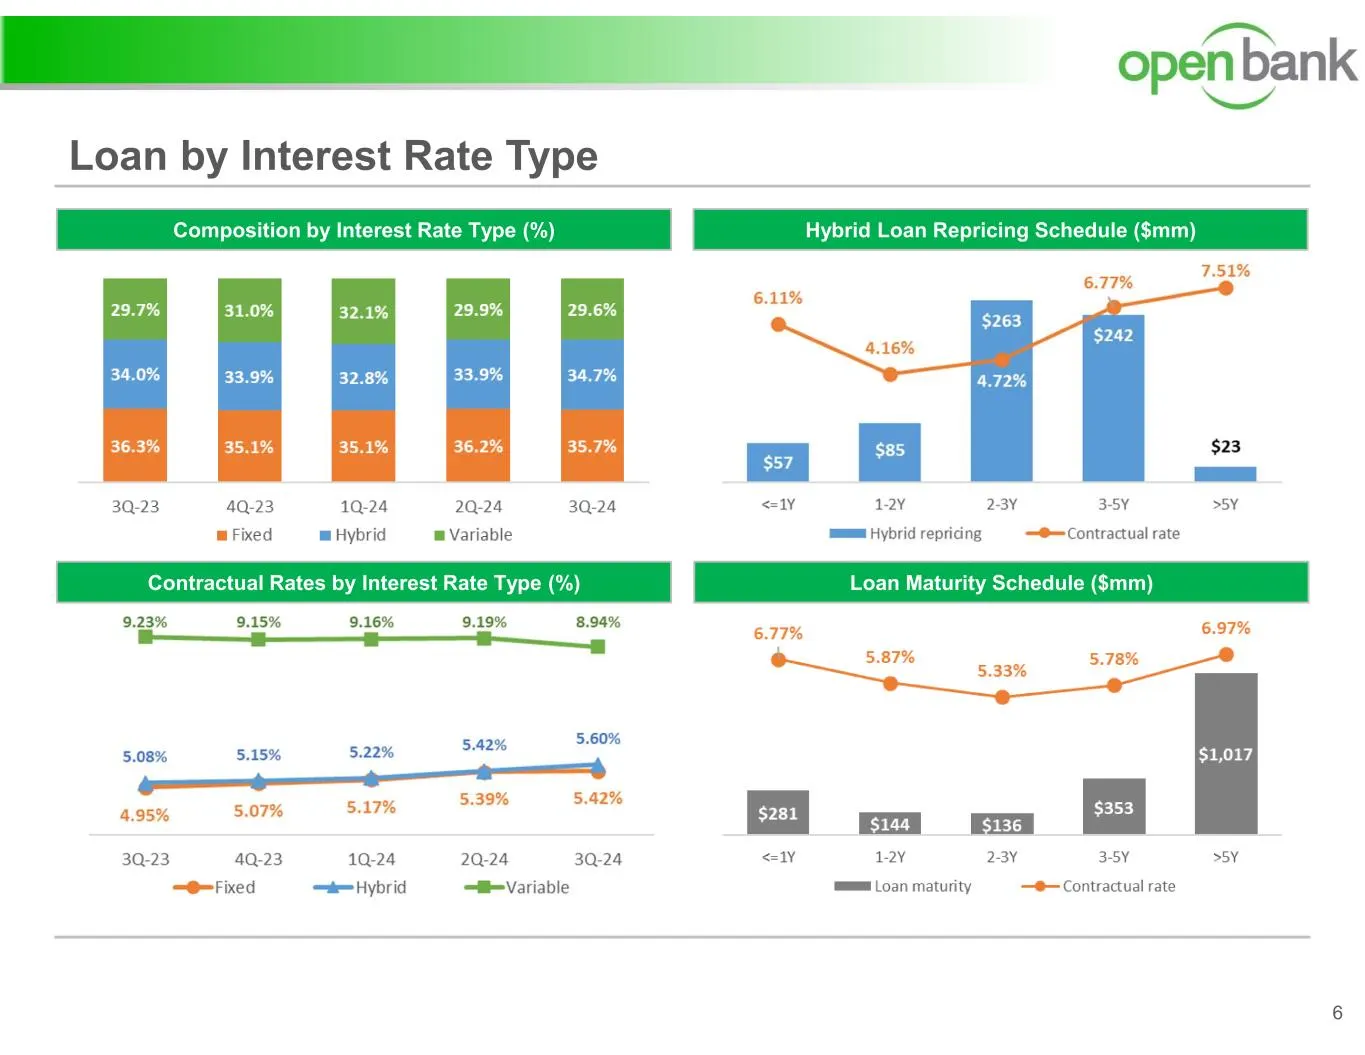
Slide 6: Loan by Interest Rate Type
Loan by Interest Rate Type 6 Hybrid Loan Repricing Schedule ($mm)Composition by Interest Rate Type (%) Contractual Rates by Interest Rate Type (%) Loan Maturity Schedule ($mm)
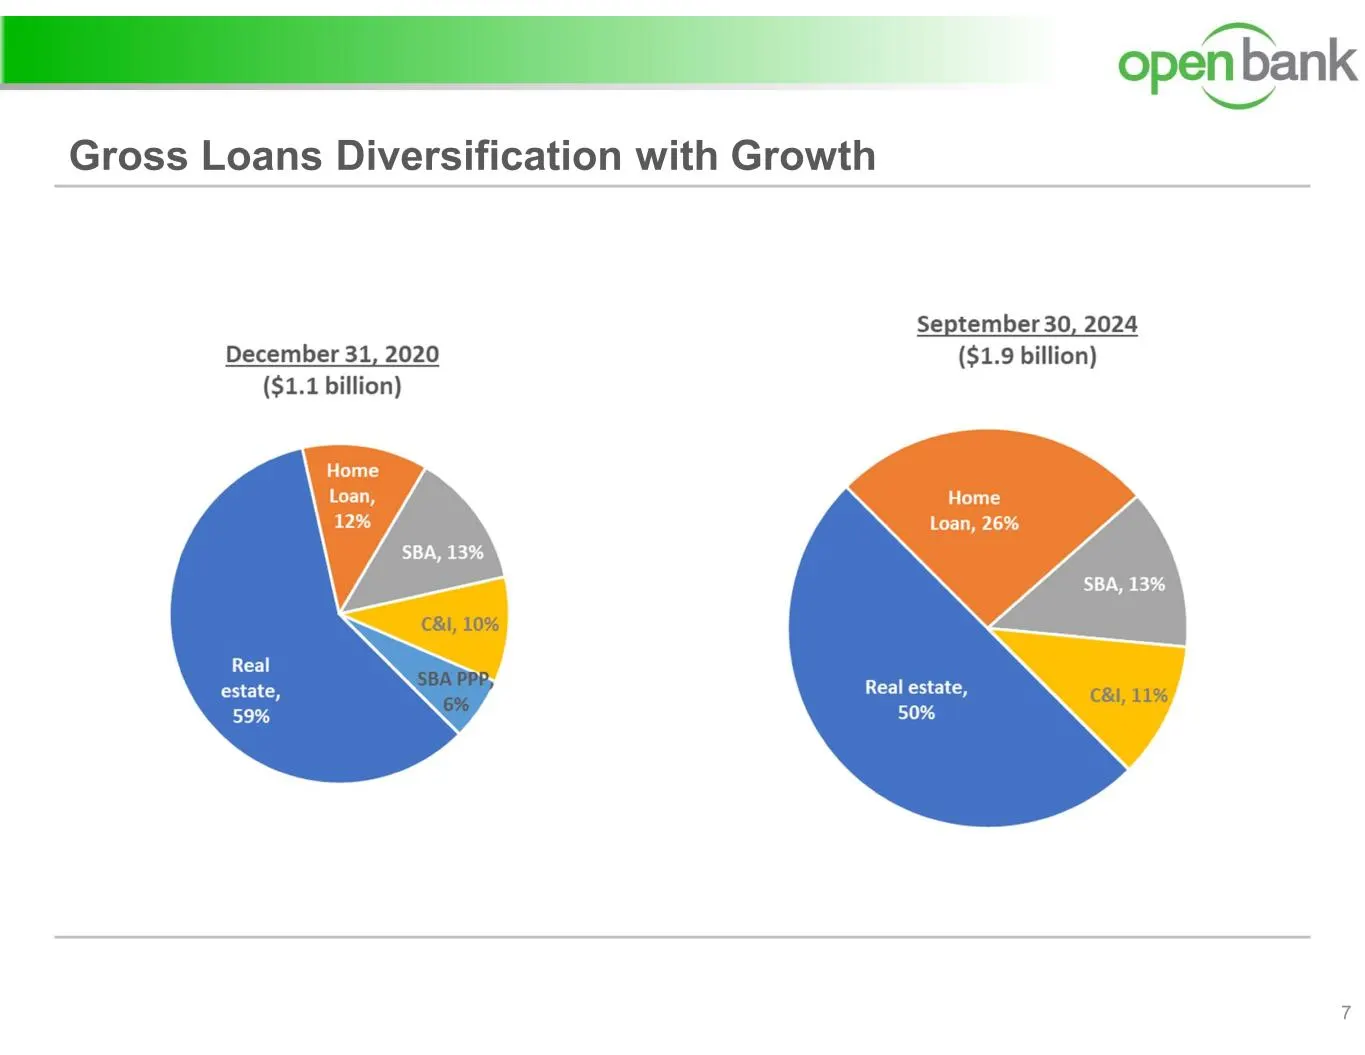
Slide 7: Gross Loans Diversification with Growth
Gross Loans Diversification with Growth 7
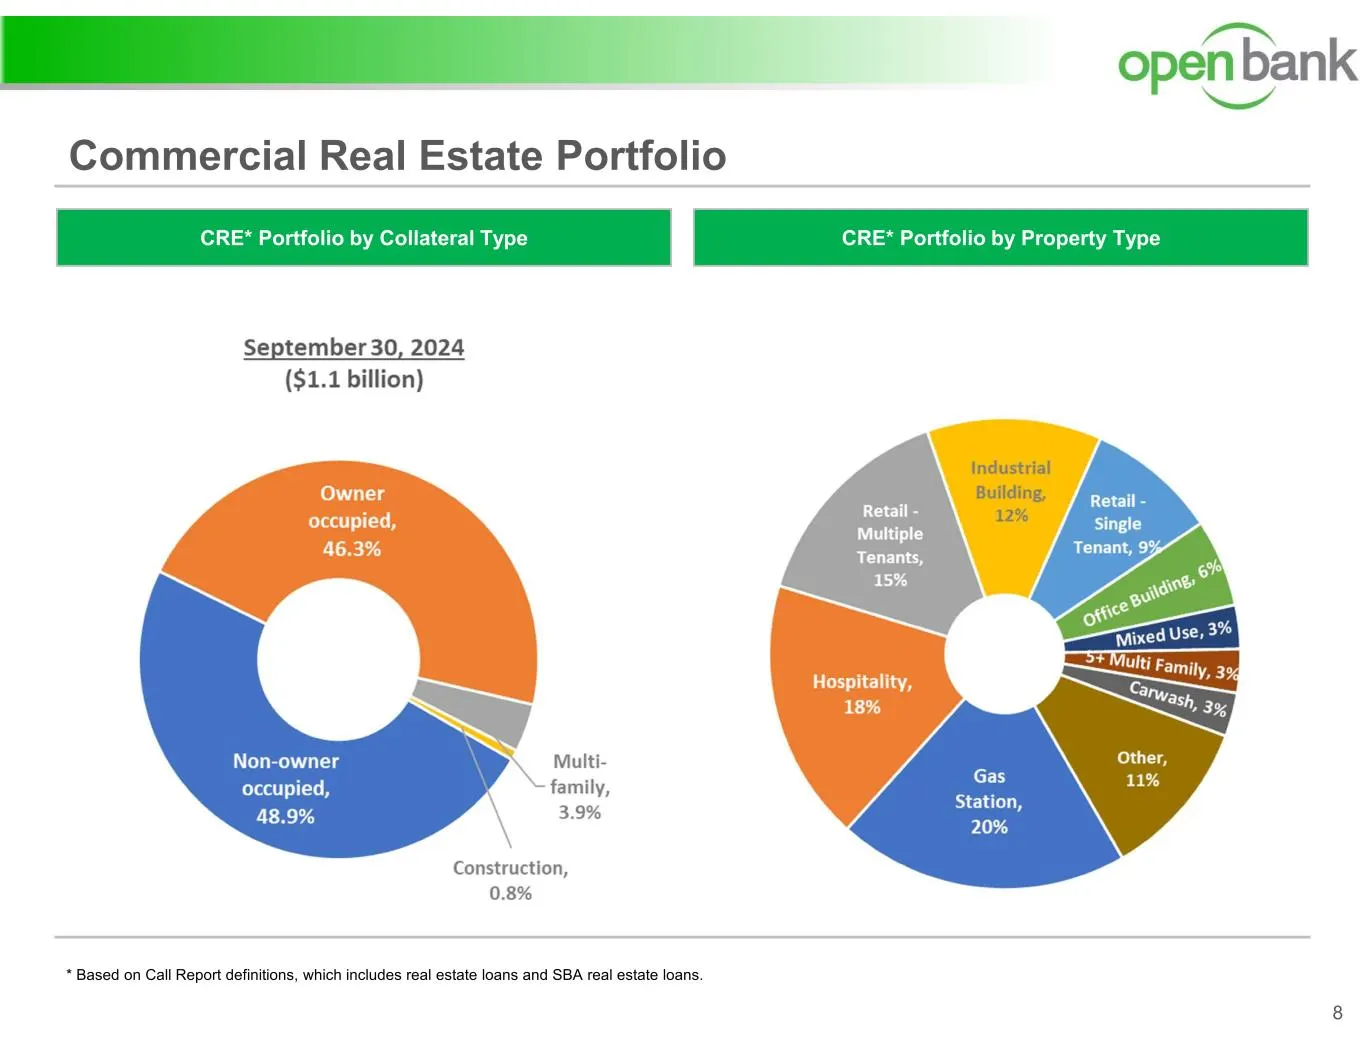
Slide 8: Commercial Real Estate Portfolio
* Based on Call Report definitions, which includes real estate loans and SBA real estate loans. Commercial Real Estate Portfolio 8 CRE* Portfolio by Property TypeCRE* Portfolio by Collateral Type
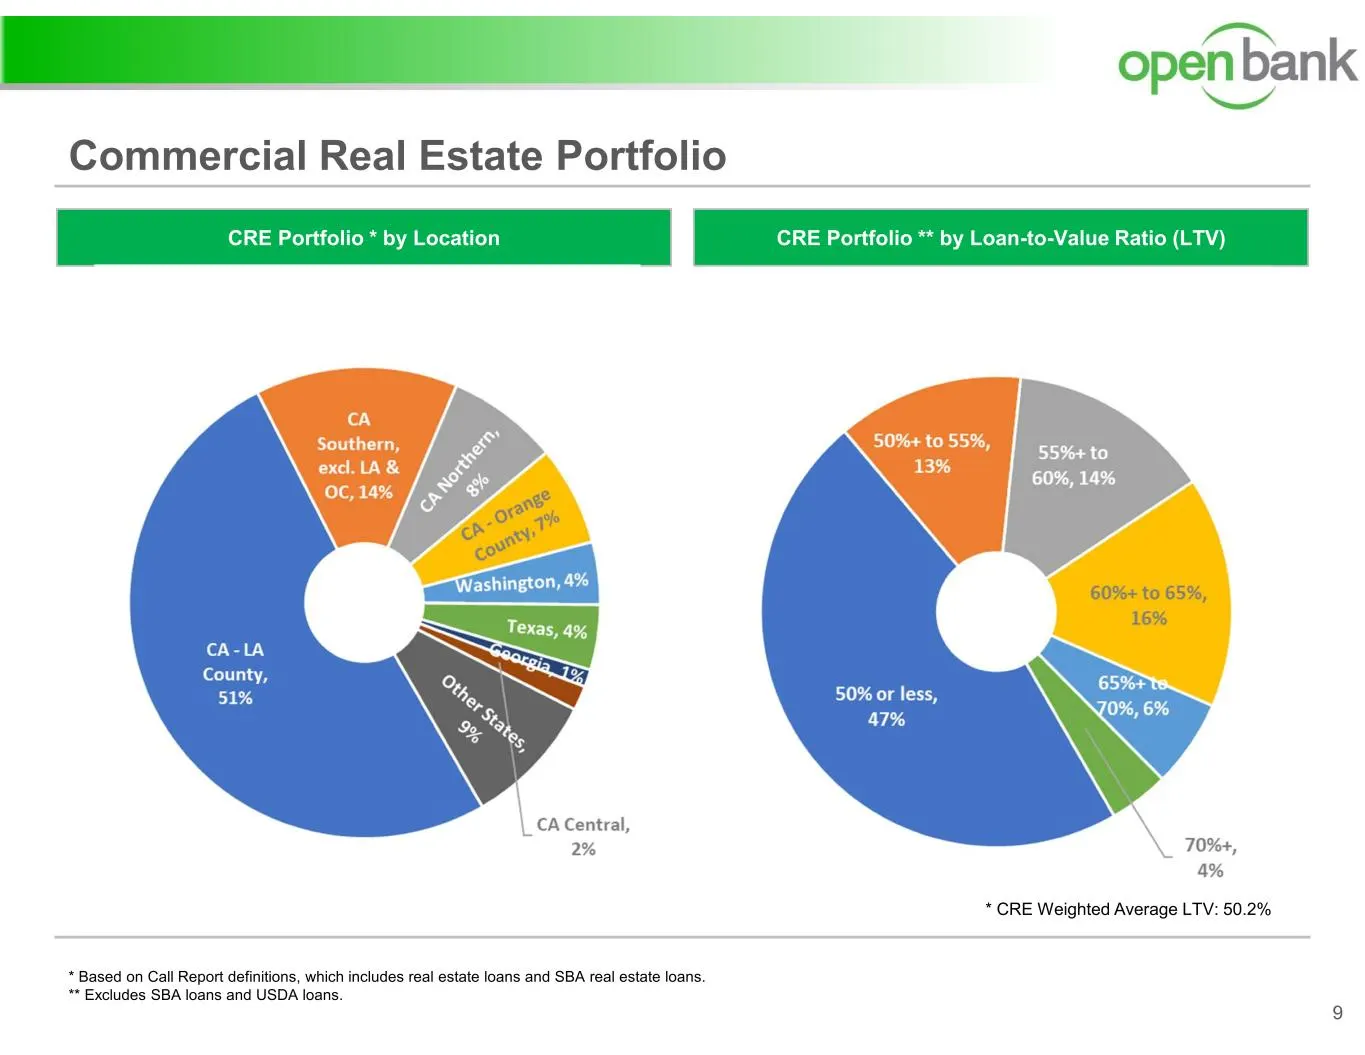
Slide 9: Commercial Real Estate Portfolio by LTV and Location
* Based on Call Report definitions, which includes real estate loans and SBA real estate loans. ** Excludes SBA loans and USDA loans. Commercial Real Estate Portfolio 9 CRE Portfolio ** by Loan-to-Value Ratio (LTV)CRE Portfolio * by Location * CRE Weighted Average LTV: 50.2%
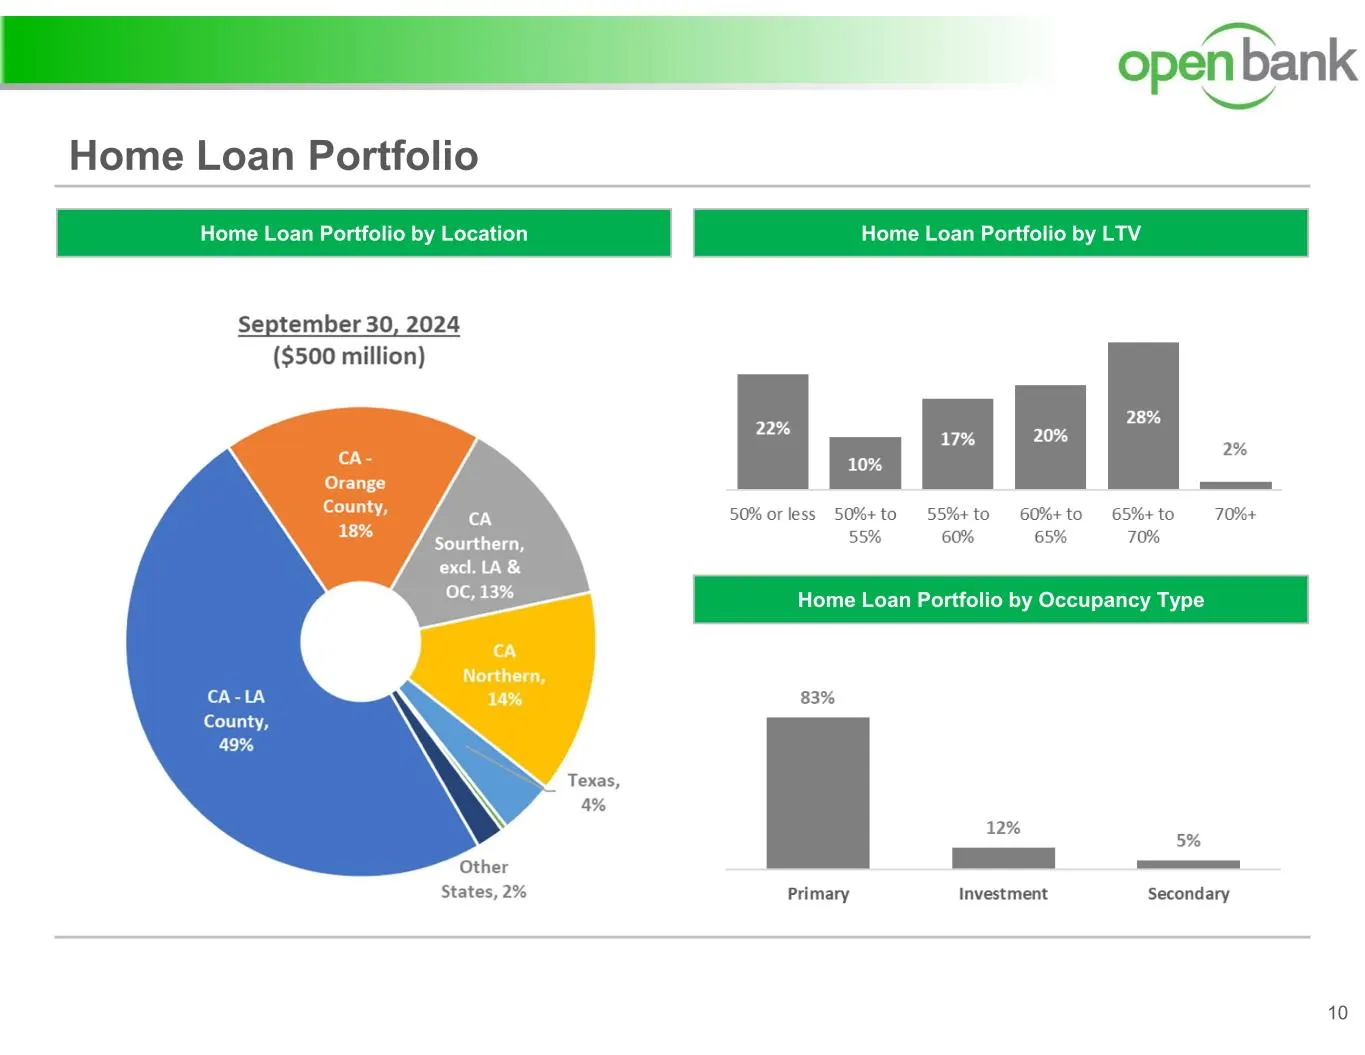
Slide 10: Home Loan Portfolio
Home Loan Portfolio 10 Home Loan Portfolio by LTVHome Loan Portfolio by Location Home Loan Portfolio by Occupancy Type
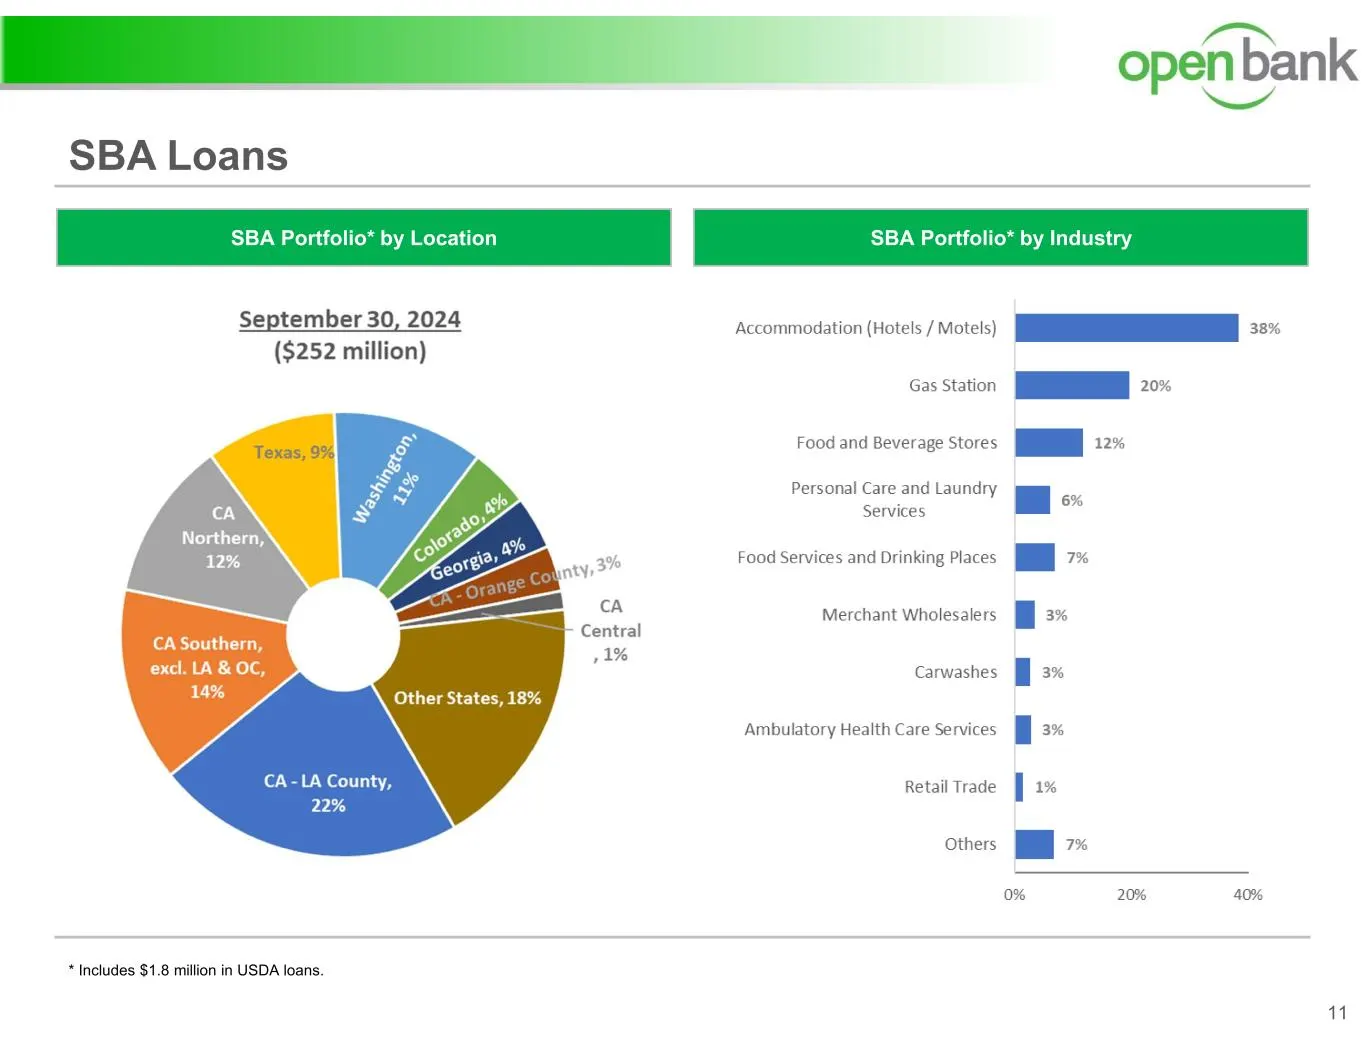
Slide 11: SBA Loans
* Includes $1.8 million in USDA loans. SBA Loans 11 SBA Portfolio* by IndustrySBA Portfolio* by Location
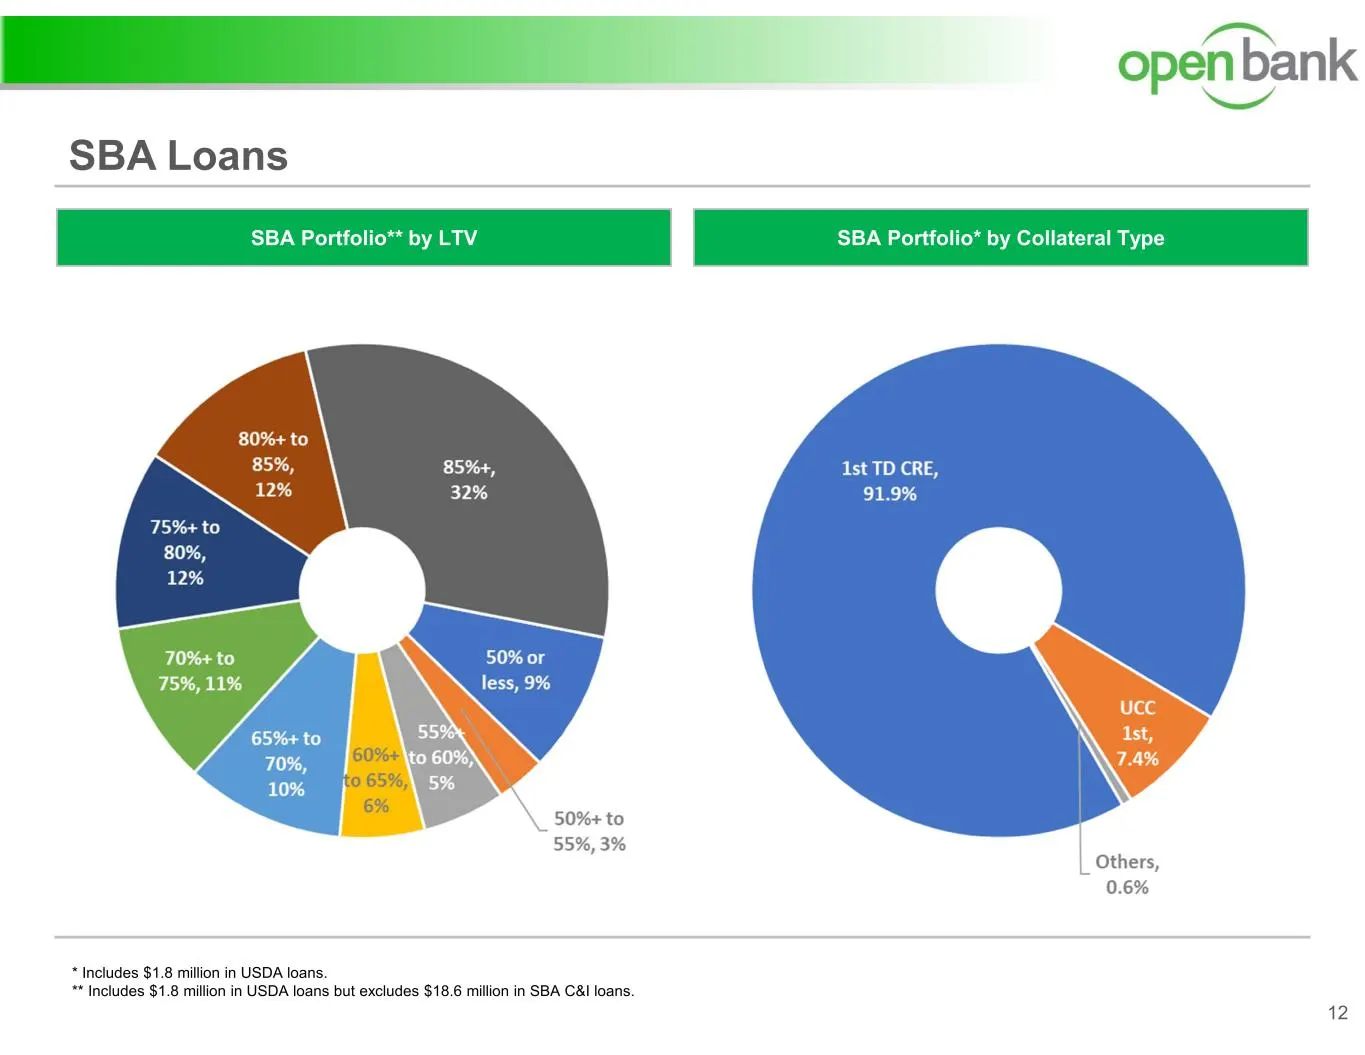
Slide 12: SBA Loans by Collateral Type and LTV
* Includes $1.8 million in USDA loans. ** Includes $1.8 million in USDA loans but excludes $18.6 million in SBA C&I loans. SBA Loans 12 SBA Portfolio* by Collateral TypeSBA Portfolio** by LTV
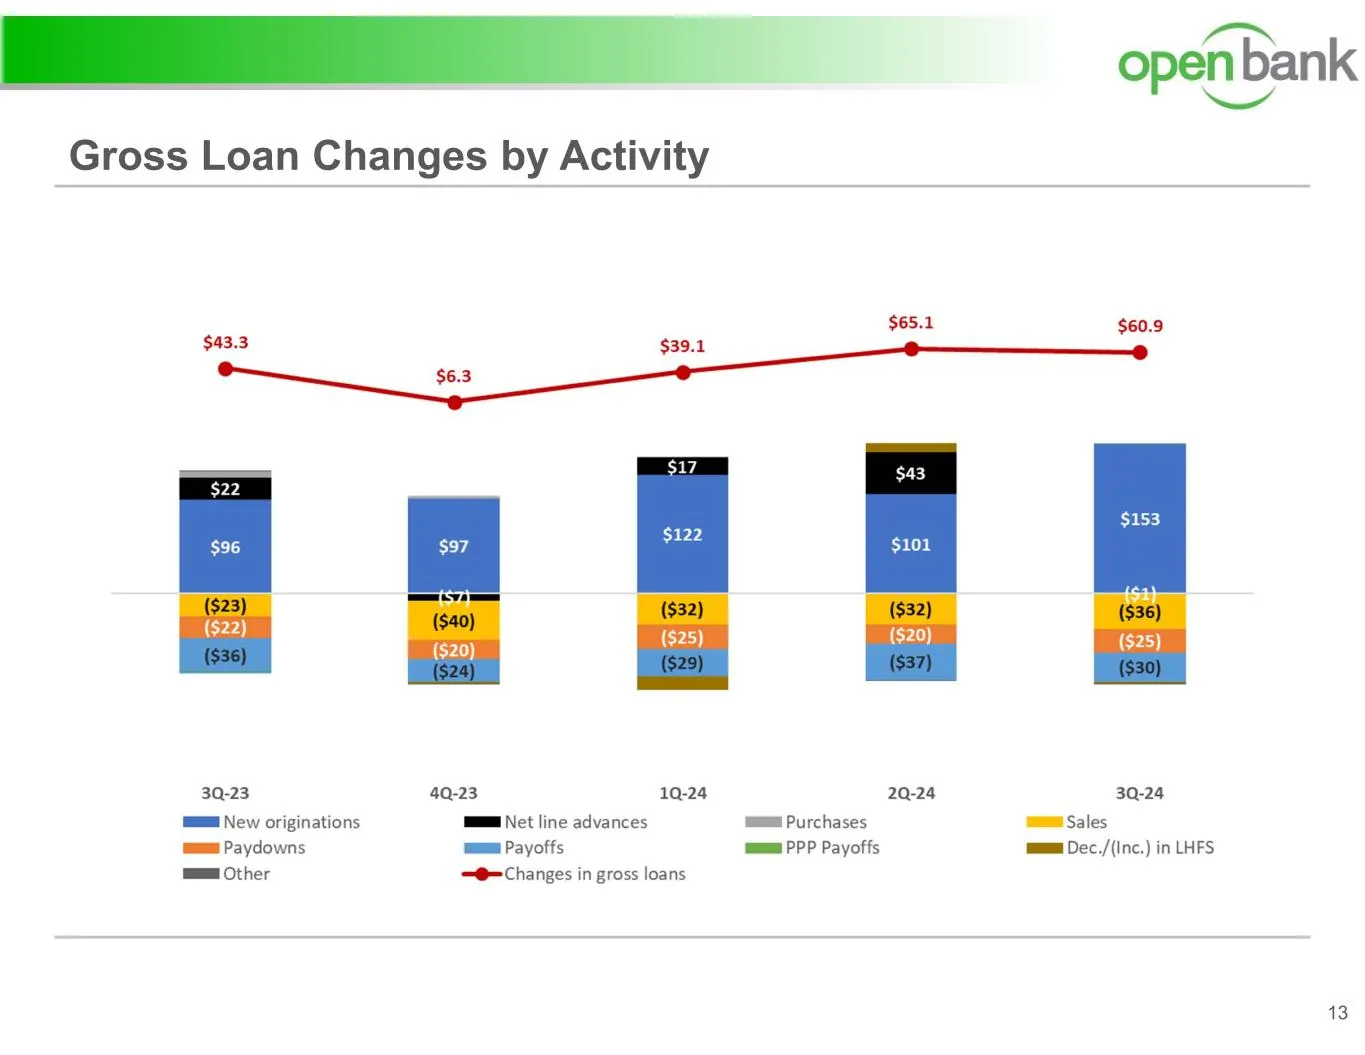
Slide 13: Gross Loan Changes by Activity
Gross Loan Changes by Activity 13
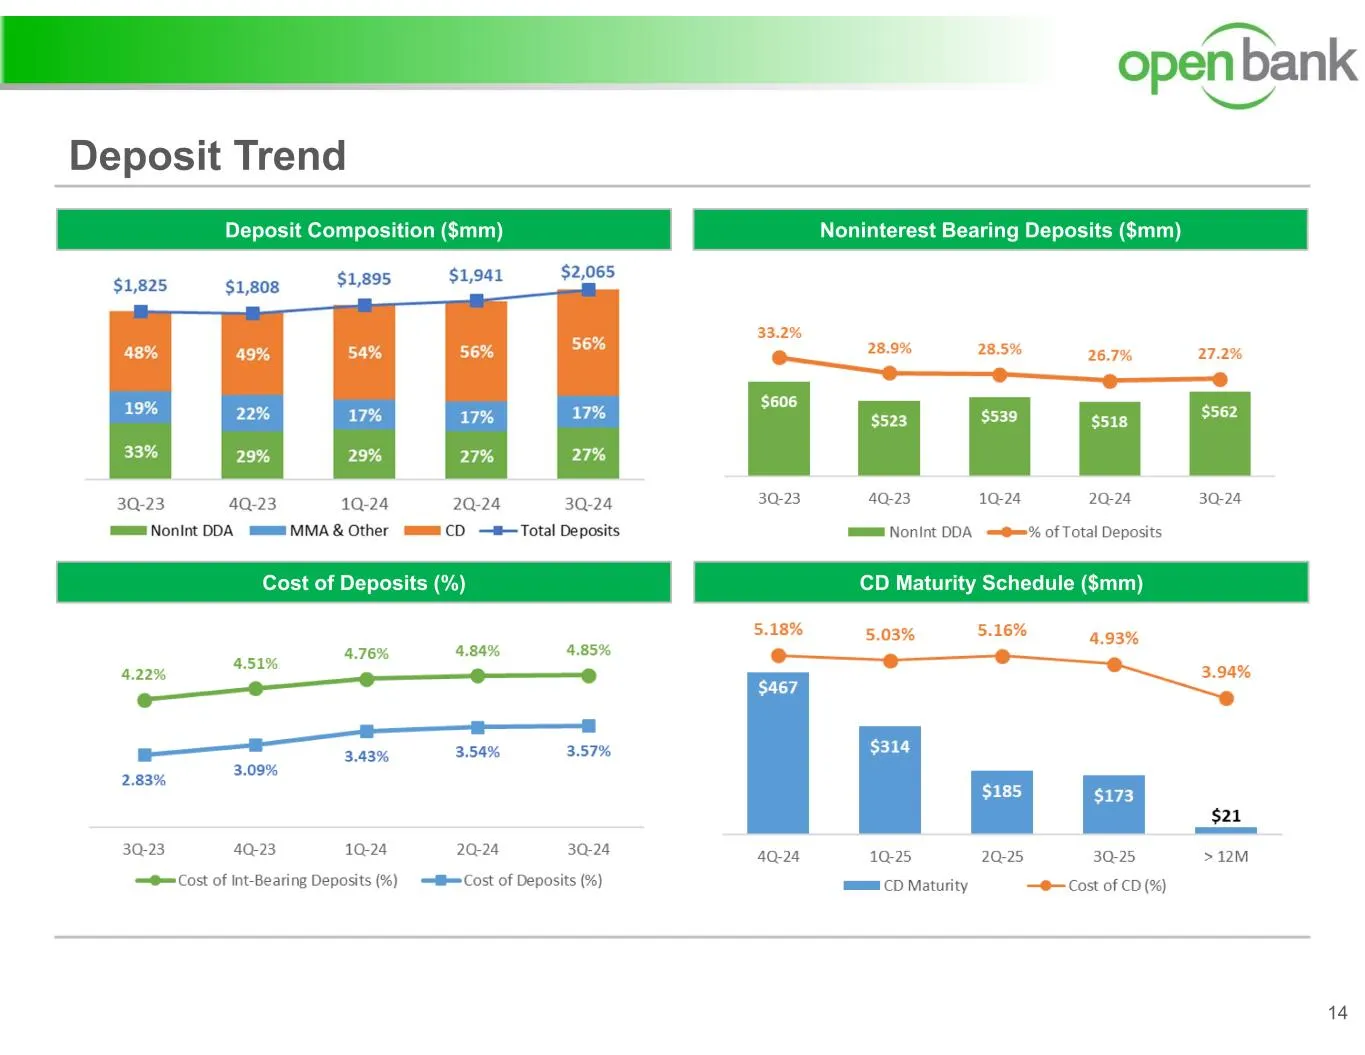
Slide 14: Deposit Trend
Deposit Trend 14 Noninterest Bearing Deposits ($mm)Deposit Composition ($mm) Cost of Deposits (%) CD Maturity Schedule ($mm)
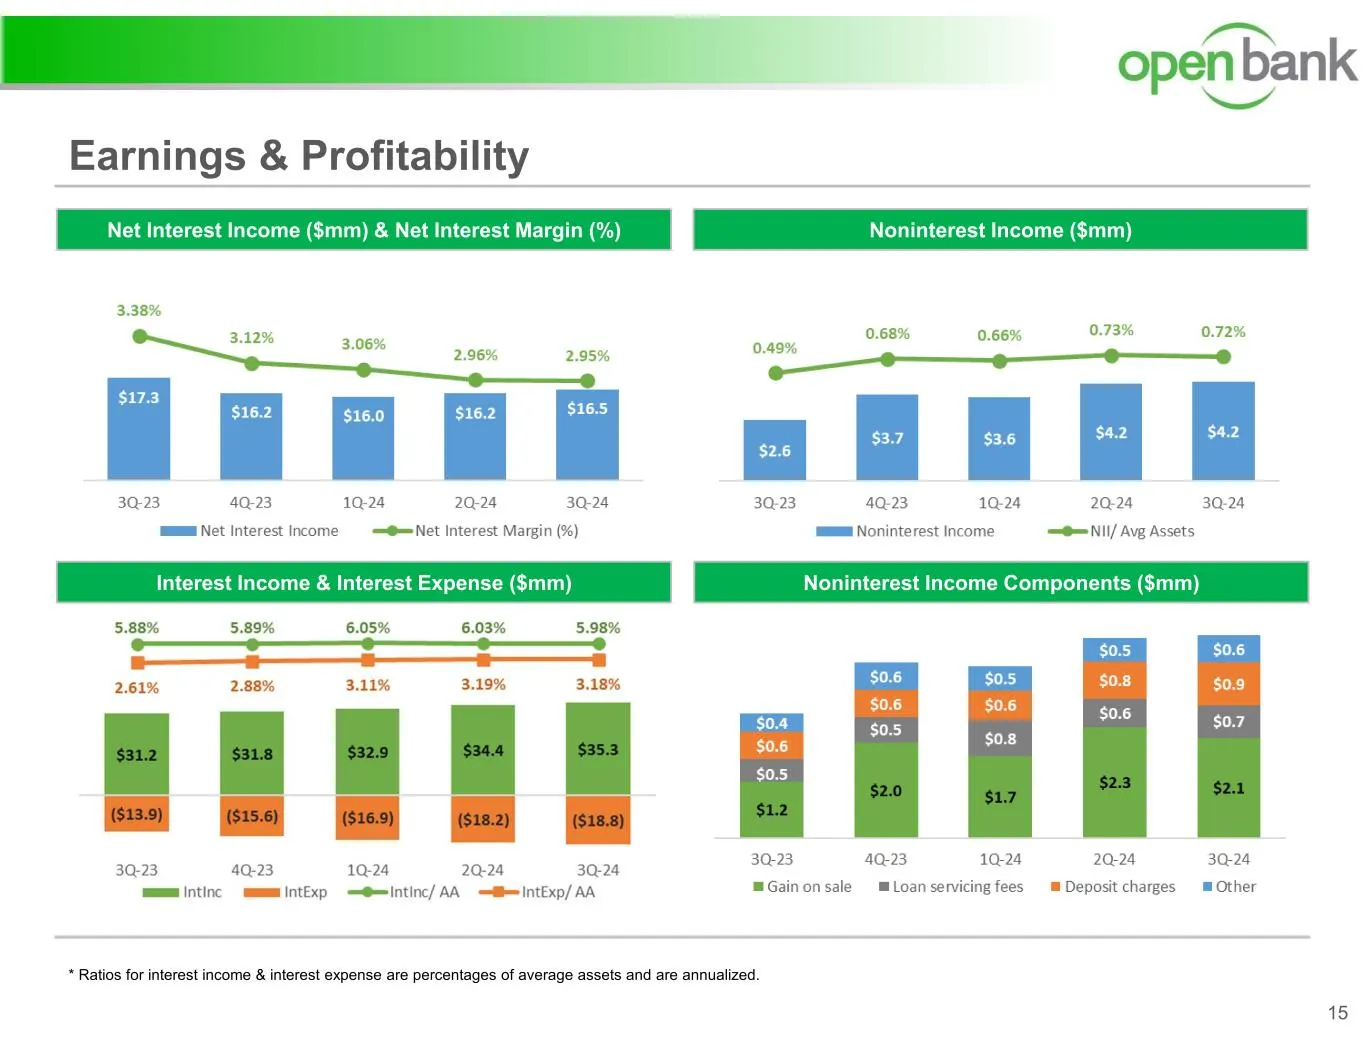
Slide 15: Earnings & Profitability: Net Interest Income and Noninterest Income
Earnings & Profitability 15 Noninterest Income ($mm)Net Interest Income ($mm) & Net Interest Margin (%) Interest Income & Interest Expense ($mm) Noninterest Income Components ($mm) * Ratios for interest income & interest expense are percentages of average assets and are annualized.
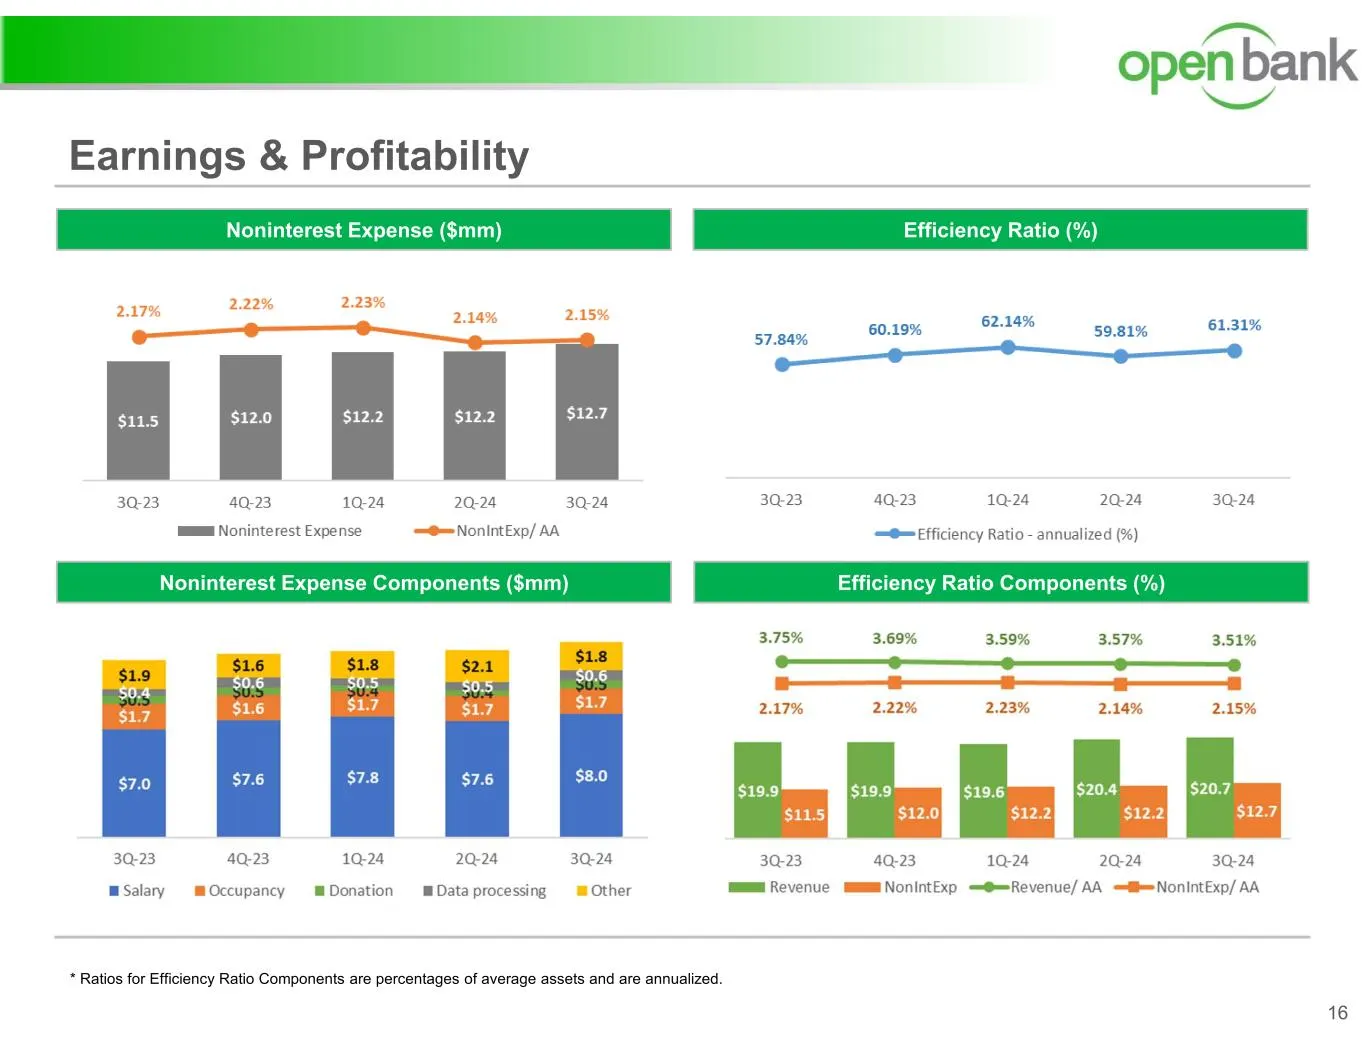
Slide 16: Earnings & Profitability: Efficiency Ratio and Noninterest Expense
Earnings & Profitability 16 Efficiency Ratio (%)Noninterest Expense ($mm) Noninterest Expense Components ($mm) Efficiency Ratio Components (%) * Ratios for Efficiency Ratio Components are percentages of average assets and are annualized.
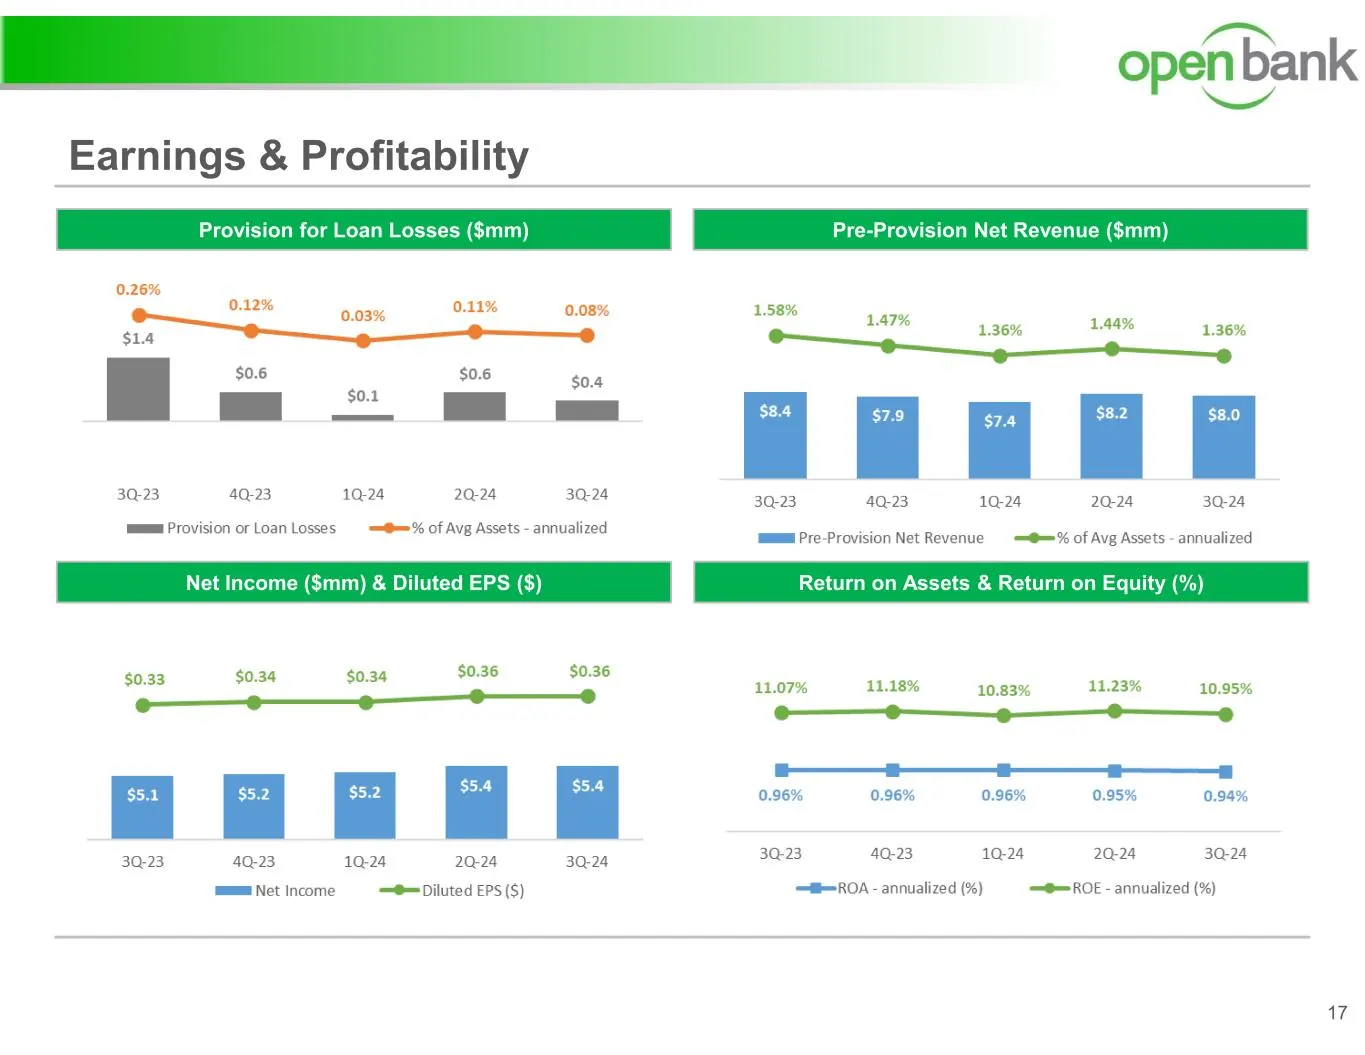
Slide 17: Earnings & Profitability: PPNR, Provision, Net Income
Earnings & Profitability 17 Pre-Provision Net Revenue ($mm)Provision for Loan Losses ($mm) Net Income ($mm) & Diluted EPS ($) Return on Assets & Return on Equity (%)
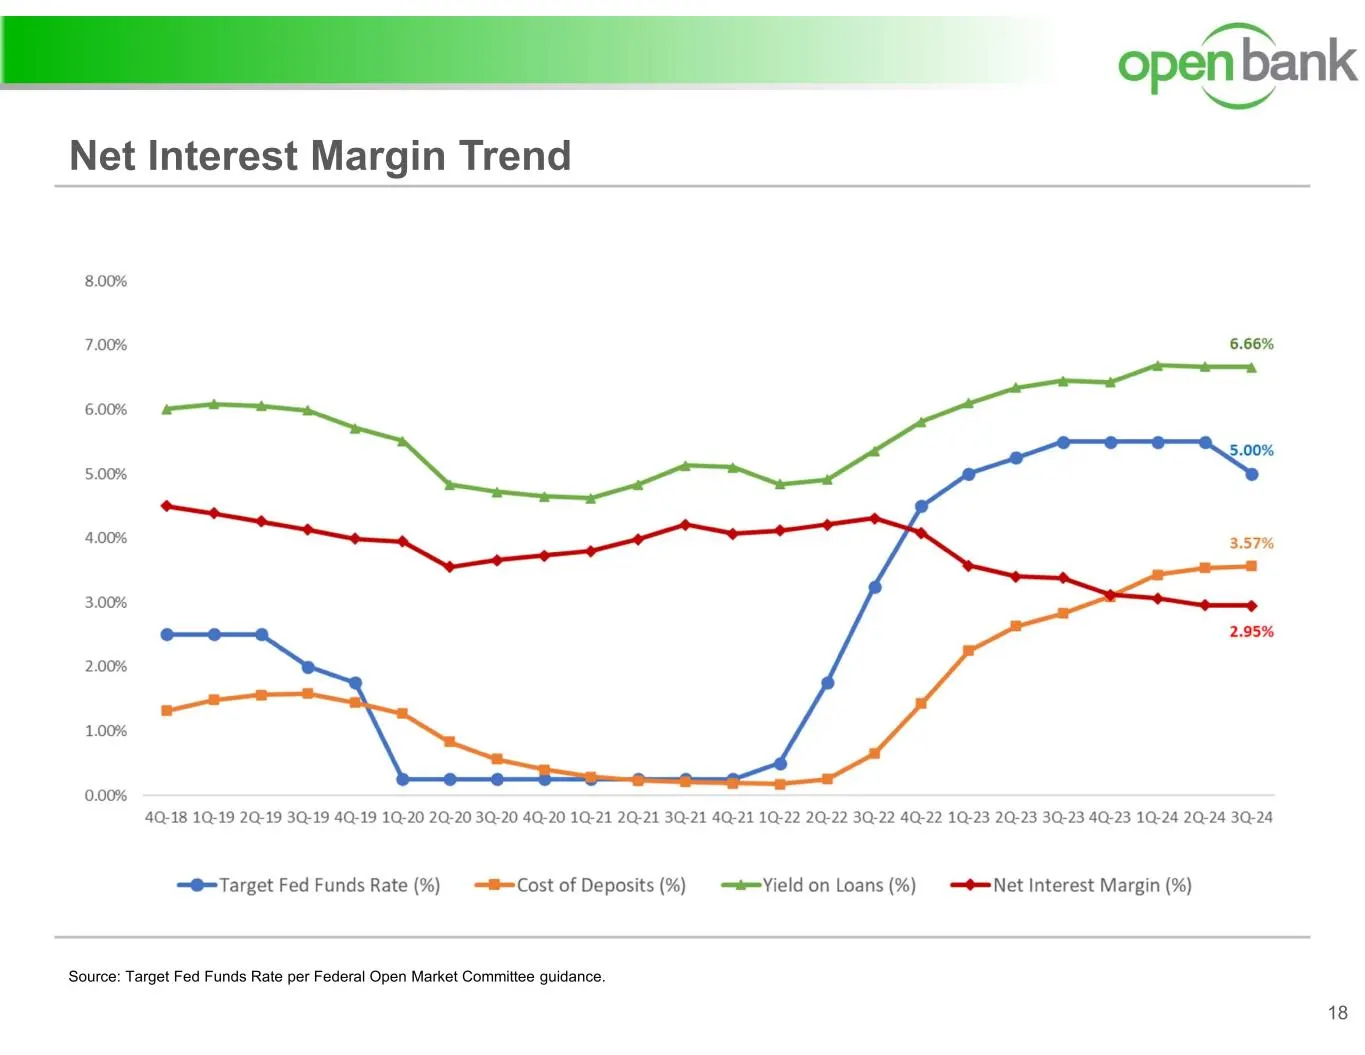
Slide 18: Net Interest Margin Trend
Source: Target Fed Funds Rate per Federal Open Market Committee guidance. Net Interest Margin Trend 18
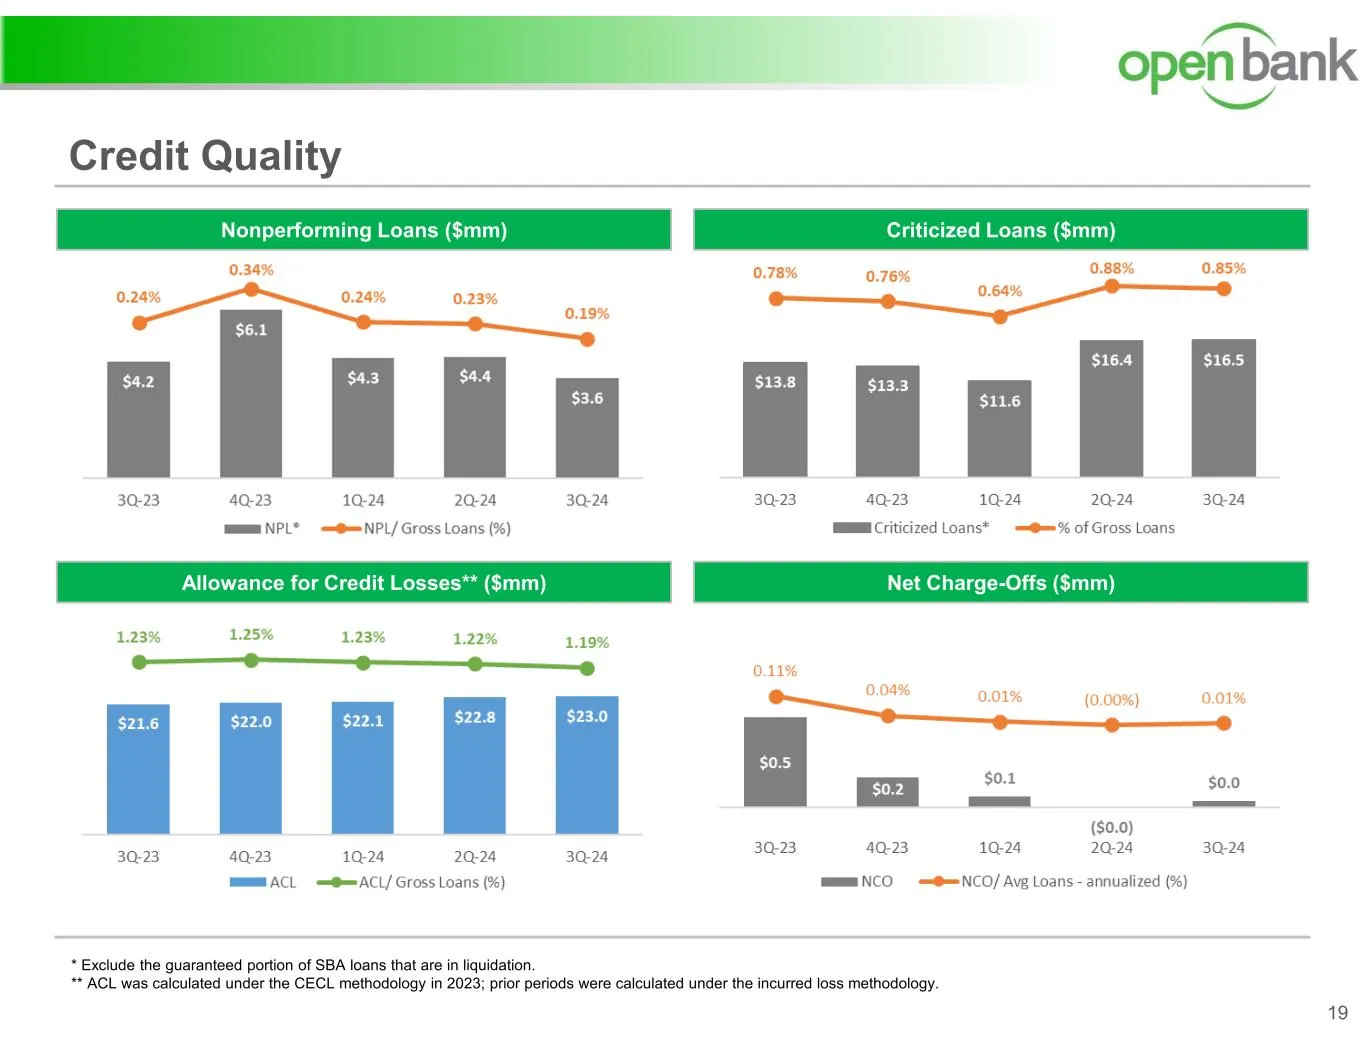
Slide 19: Credit Quality
Credit Quality 19 Criticized Loans ($mm)Nonperforming Loans ($mm) Net Charge-Offs ($mm)Allowance for Credit Losses** ($mm) * Exclude the guaranteed portion of SBA loans that are in liquidation. ** ACL was calculated under the CECL methodology in 2023; prior periods were calculated under the incurred
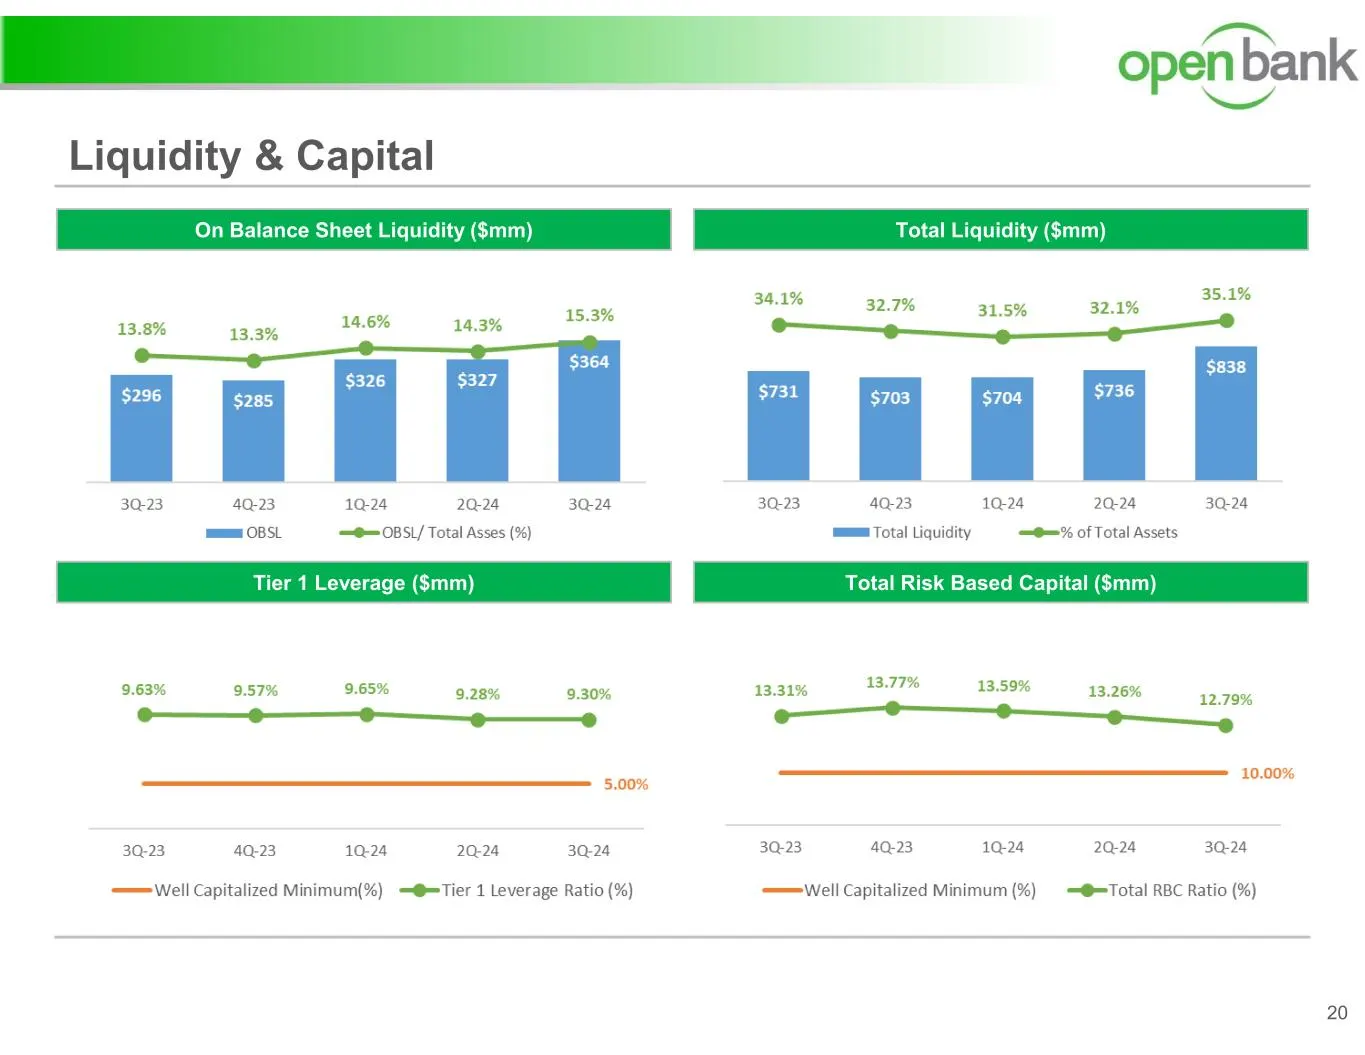
Slide 20: Liquidity & Capital
Liquidity & Capital 20 Total Liquidity ($mm)On Balance Sheet Liquidity ($mm) Tier 1 Leverage ($mm) Total Risk Based Capital ($mm)
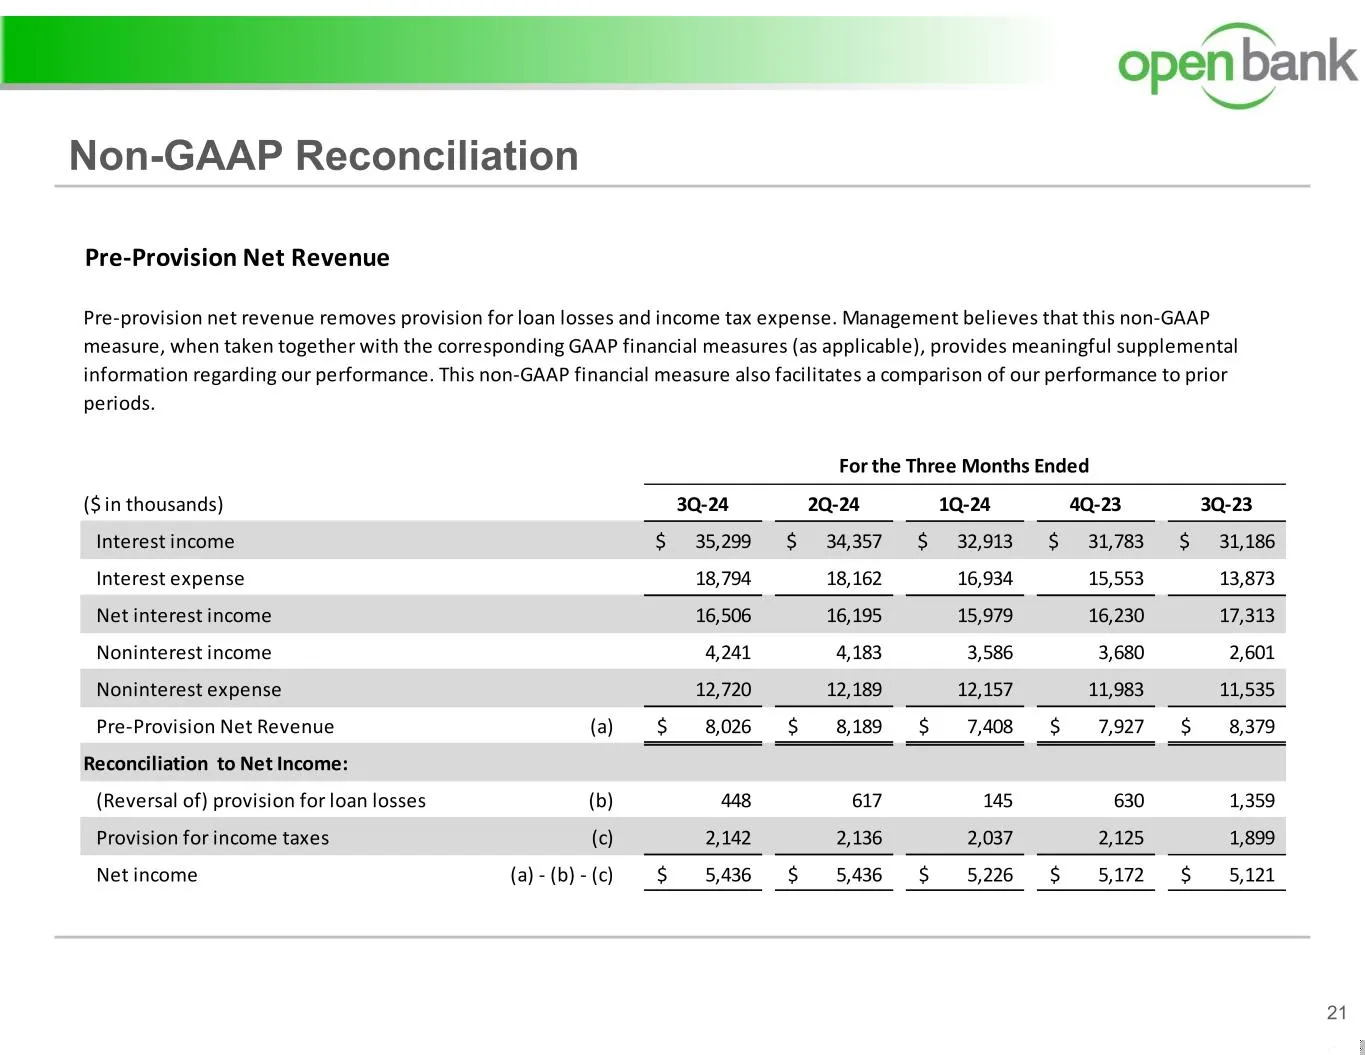
Slide 21: Non-GAAP Reconciliation Pre-Provision Net Revenue
Non-GAAP Reconciliation 21 Pre-Provision Net Revenue ($ in thousands) 3Q-24 2Q-24 1Q-24 4Q-23 3Q-23 Interest income 35,299$ 34,357$ 32,913$ 31,783$ 31,186$ Interest expense 18,794 18,162 16,934 15,553 13,873 Net interest income 16,506 16,195 15,979 16,230 17,313 Noninterest income 4,241 4,183 3,586
Source: SEC EDGAR · 8-K filed Oct 24, 2024
More decks from OP Bancorp
 Q3 2026 Earnings Presentation23 slides · Oct 22, 2026
 Q2 2026 Earnings Presentation19 slides · Jul 23, 2026
 Q1 2026 Earnings Presentation19 slides · Apr 23, 2026
 Q4 2025 Earnings Presentation19 slides · Jan 22, 2026
 Q3 2025 Earnings Presentation19 slides · Oct 23, 2025
 Q2 2025 Earnings Presentation19 slides · Jul 24, 2025