Curo — Stephens Fall Investment Conference 2018
36 slides from Curo's conference presentation, Nov 7, 2018

Slide 1: October 2018 :: Stephens Fall Investment Conference
October 2018 :: Stephens Fall Investment Conference
Slide 2: Disclaimer
Disclaimer IMPORTANT: You must read the following information before continuing to the rest of the presentation. This presentation has been prepared by CURO Group Holdings Corp. and its subsidiaries (collectively, “we,” “us” or the “Company”) and is being provided to you for informational purposes o
Slide 3: Total senior leadership team has over a century of collective industry experience
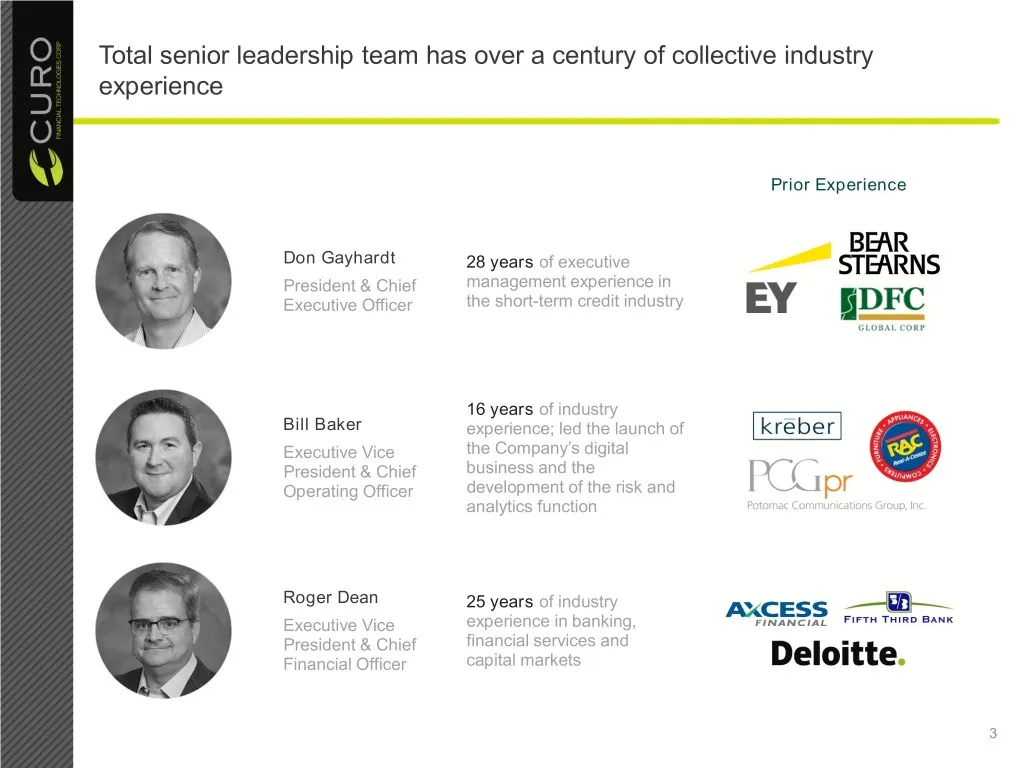
Total senior leadership team has over a century of collective industry experience Prior Experience Don Gayhardt 28 years of executive President & Chief management experience in Executive Officer the short-term credit industry 16 years of industry Bill Baker experience; led the launch of Executive Vi
Slide 4: Recent Developments
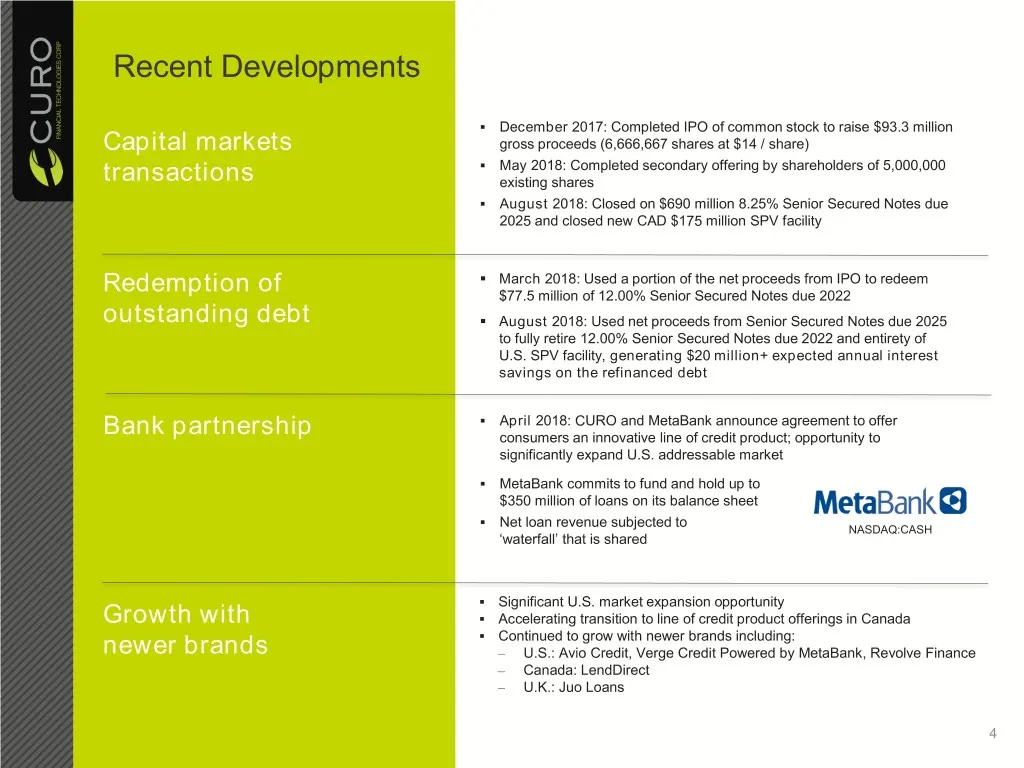
Recent Developments . December 2017: Completed IPO of common stock to raise $93.3 million Capital markets gross proceeds (6,666,667 shares at $14 / share) . May 2018: Completed secondary offering by shareholders of 5,000,000 transactions existing shares . August 2018: Closed on $690 million 8.25% Se
Slide 5: CURO At a Glance
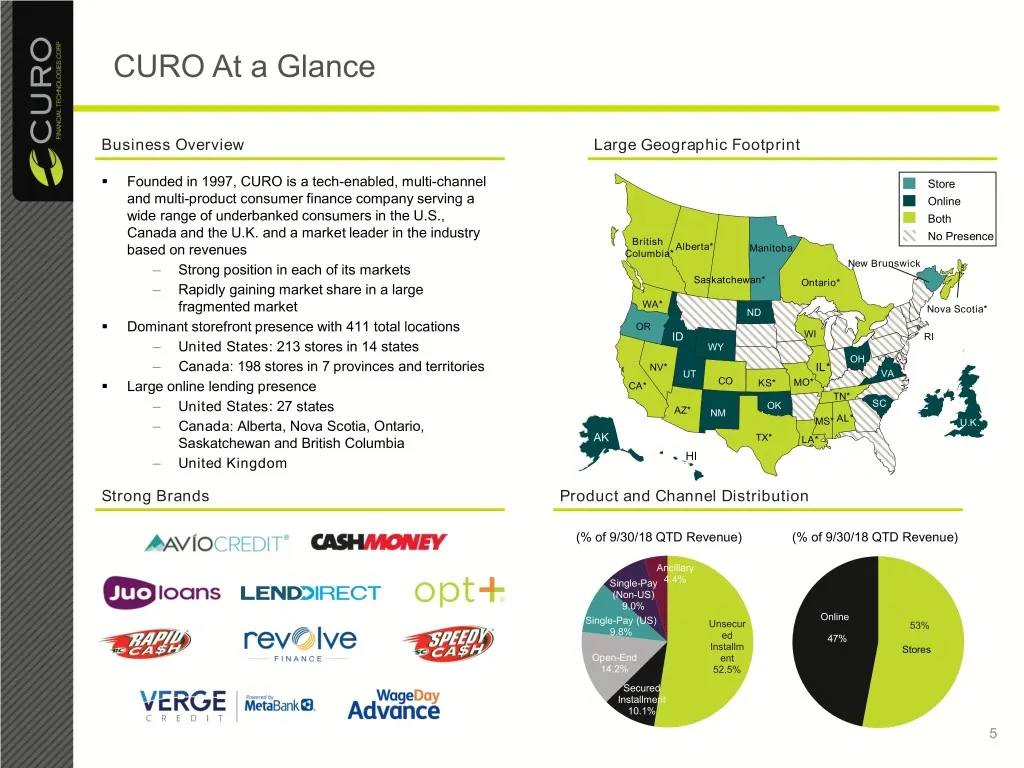
CURO At a Glance Business Overview Large Geographic Footprint . Founded in 1997, CURO is a tech-enabled, multi-channel Store and multi-product consumer finance company serving a Online wide range of underbanked consumers in the U.S., Both Canada and the U.K. and a market leader in the industry Briti
Slide 6: Key Investment Highlights
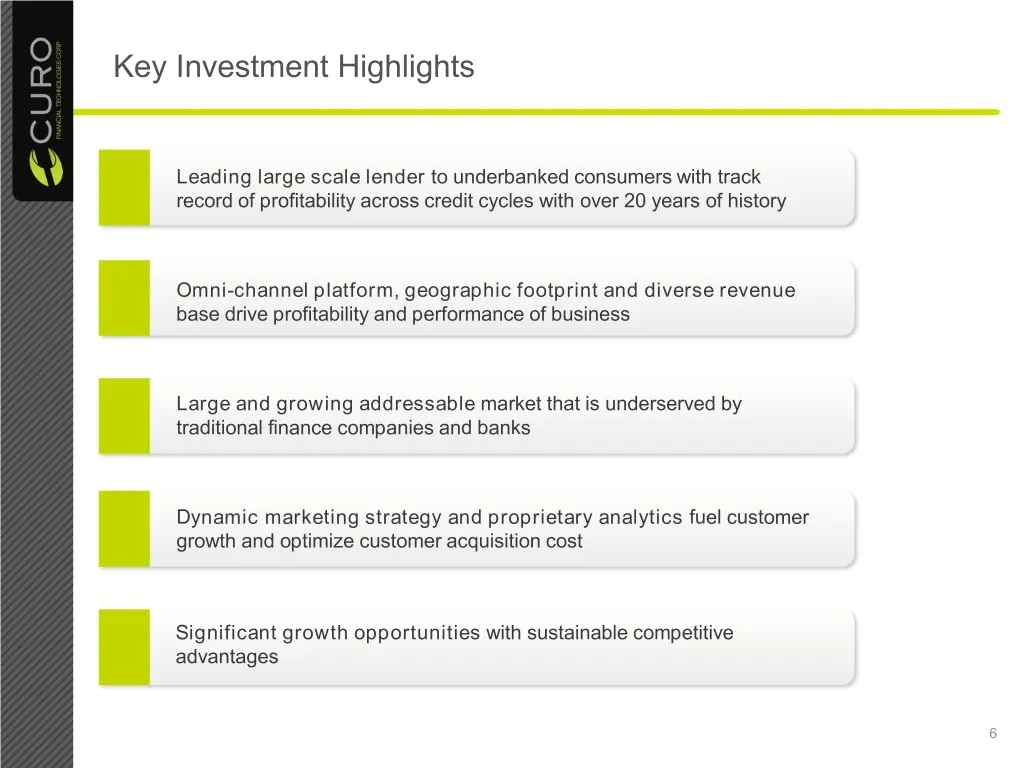
Key Investment Highlights Leading large scale lender to underbanked consumers with track record of profitability across credit cycles with over 20 years of history Omni-channel platform, geographic footprint and diverse revenue base drive profitability and performance of business Large and growing a
Slide 7: Leading Large Scale Lender To Underbanked Consumers With Track Record Of Profitability
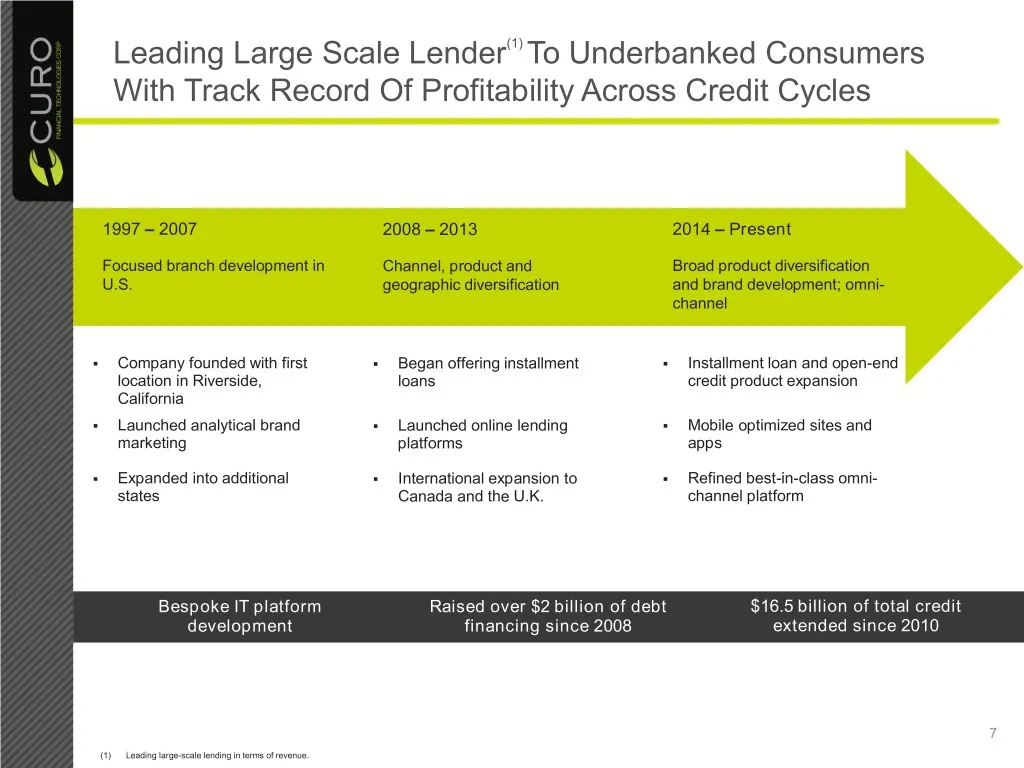
Leading Large Scale Lender(1) To Underbanked Consumers With Track Record Of Profitability Across Credit Cycles 1997 – 2007 2008 – 2013 2014 – Present Focused branch development in Channel, product and Broad product diversification U.S. geographic diversification and brand development; omni- channel
Slide 8: Omni-Channel Platform Supports "Call, Click or Come-In"
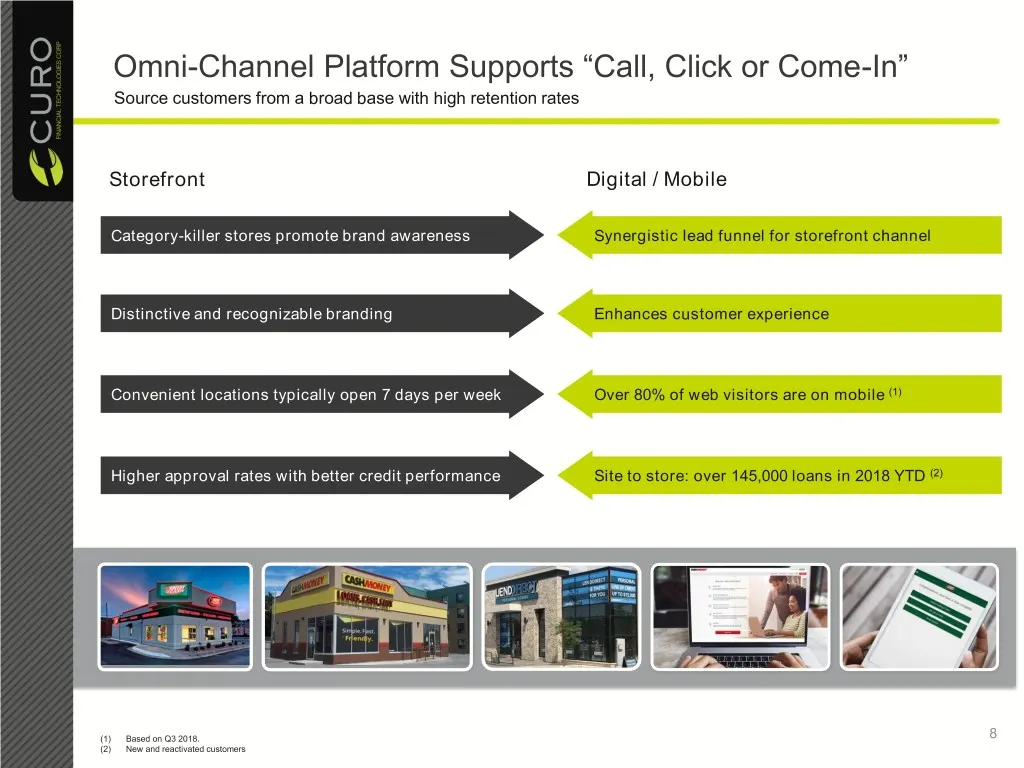
Omni-Channel Platform Supports “Call, Click or Come-In” Source customers from a broad base with high retention rates Storefront Digital / Mobile Category-killer stores promote brand awareness Synergistic lead funnel for storefront channel Distinctive and recognizable branding Enhances customer exper
Slide 9: Comprehensive Product Offerings And Diversified Revenue
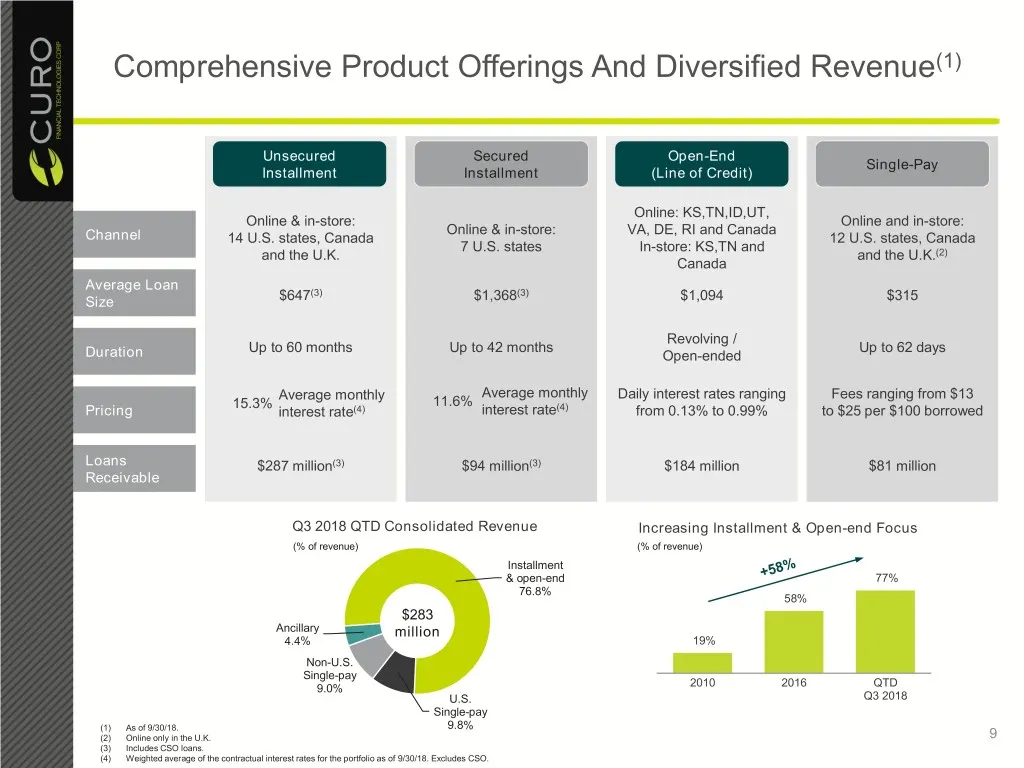
Comprehensive Product Offerings And Diversified Revenue(1) Unsecured Secured Open-End Single-Pay Installment Installment (Line of Credit) Online: KS,TN,ID,UT, Online & in-store: Online and in-store: Online & in-store: VA, DE, RI and Canada Channel 14 U.S. states, Canada 12 U.S. states, Canada 7 U.S.
Slide 10: Large Addressable Market Is Underserved
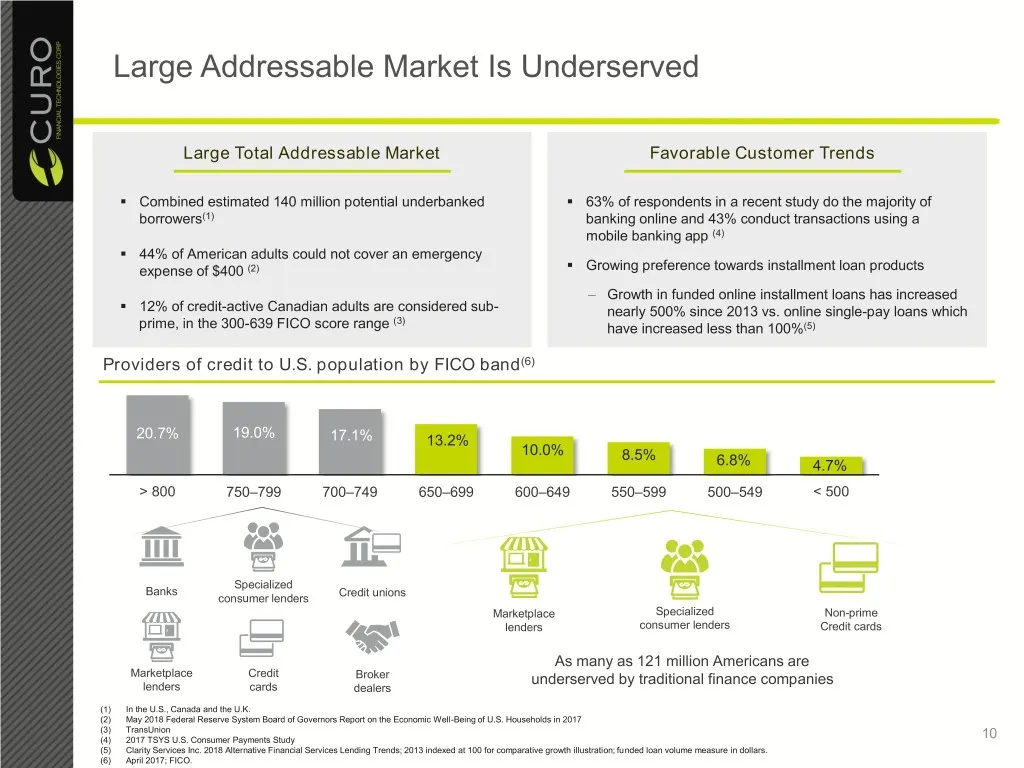
Large Addressable Market Is Underserved Large Total Addressable Market Favorable Customer Trends . Combined estimated 140 million potential underbanked . 63% of respondents in a recent study do the majority of borrowers(1) banking online and 43% conduct transactions using a mobile banking app (4) .
Slide 11: Market Trends Favoring CURO
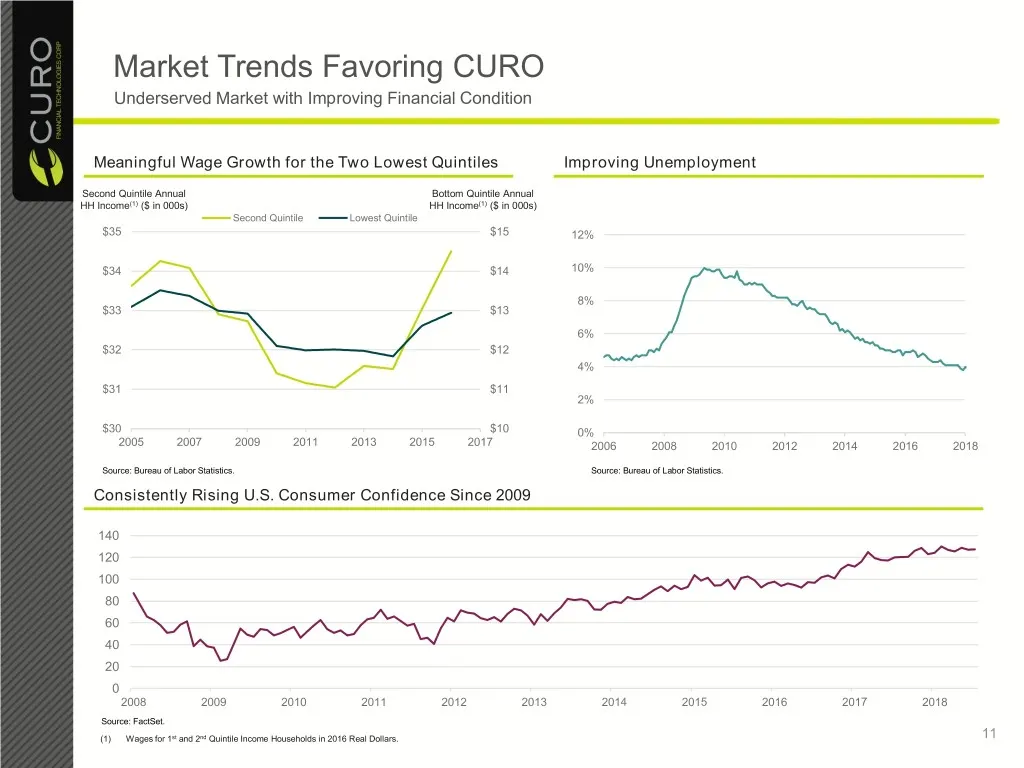
Market Trends Favoring CURO Underserved Market with Improving Financial Condition Meaningful Wage Growth for the Two Lowest Quintiles Improving Unemployment Second Quintile Annual Bottom Quintile Annual HH Income(1) ($ in 000s) HH Income(1) ($ in 000s) Second Quintile Lowest Quintile $35 $15 12% $34
Slide 12: Market Trends Favoring CURO (Cont.)
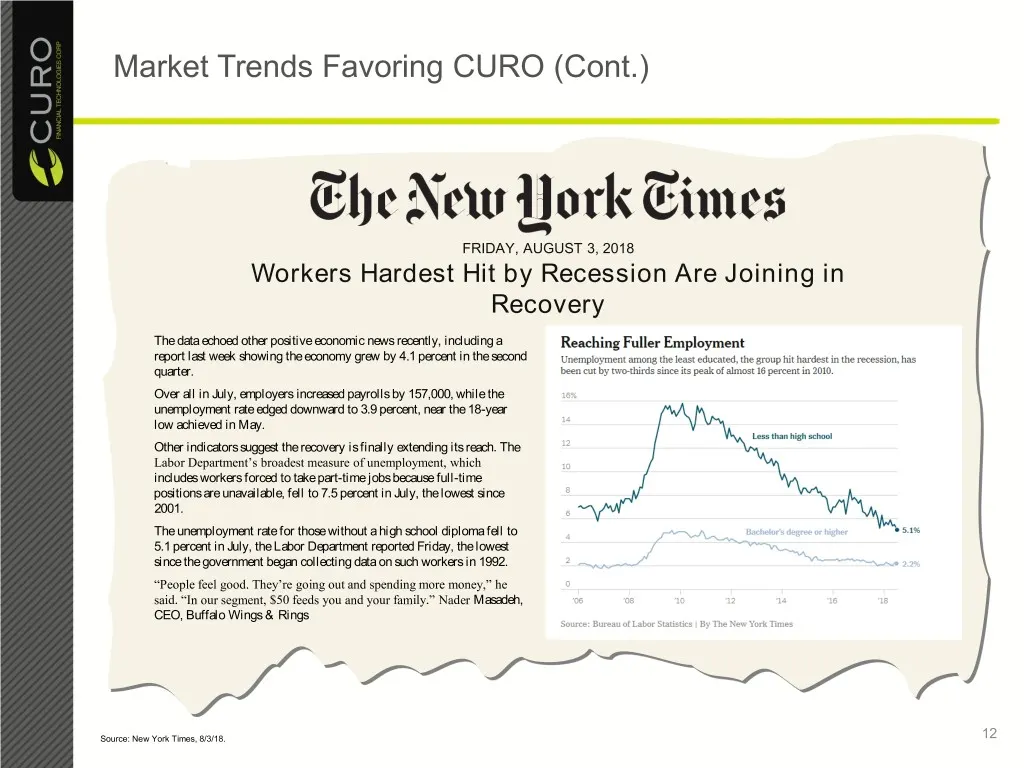
Market Trends Favoring CURO (Cont.) FRIDAY, AUGUST 3, 2018 Workers Hardest Hit by Recession Are Joining in Recovery The data echoed other positive economic news recently, including a report last week showing the economy grew by 4.1 percent in the second quarter. Over all in July, employers increased
Slide 13: Multi-faceted Marketing Strategy And Deep Data Analysis
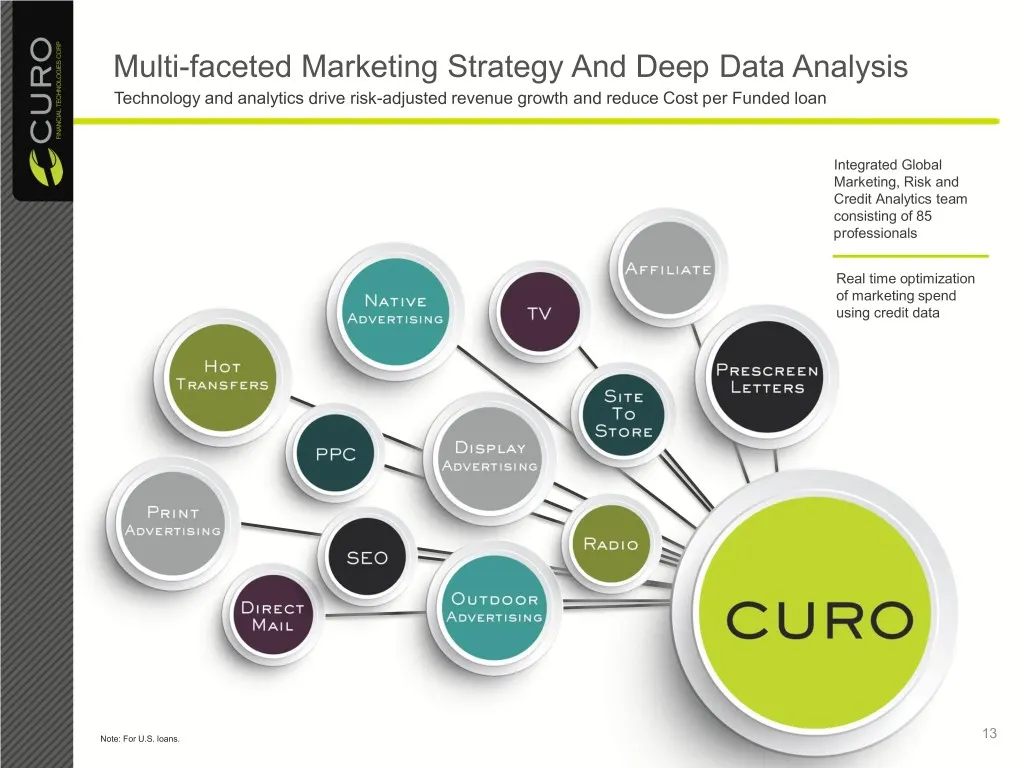
Multi-faceted Marketing Strategy And Deep Data Analysis Technology and analytics drive risk-adjusted revenue growth and reduce Cost per Funded loan Integrated Global Marketing, Risk and Credit Analytics team consisting of 85 professionals Real time optimization of marketing spend using credit data N
Slide 14: Centralized Analytics And IT Platform
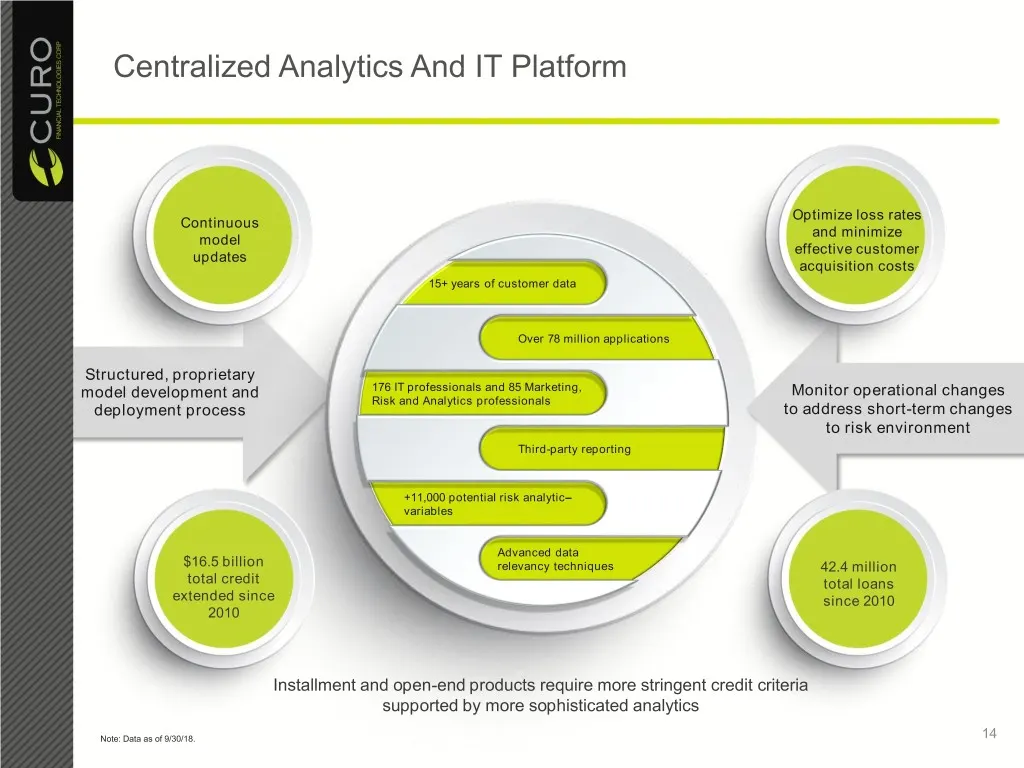
Centralized Analytics And IT Platform Optimize loss rates Continuous and minimize model effective customer updates acquisition costs 15+ years of customer data Over 78 million applications Structured, proprietary model development and 176 IT professionals and 85 Marketing, Monitor operational change
Slide 15: Multiple Opportunities For Continued Significant Growth
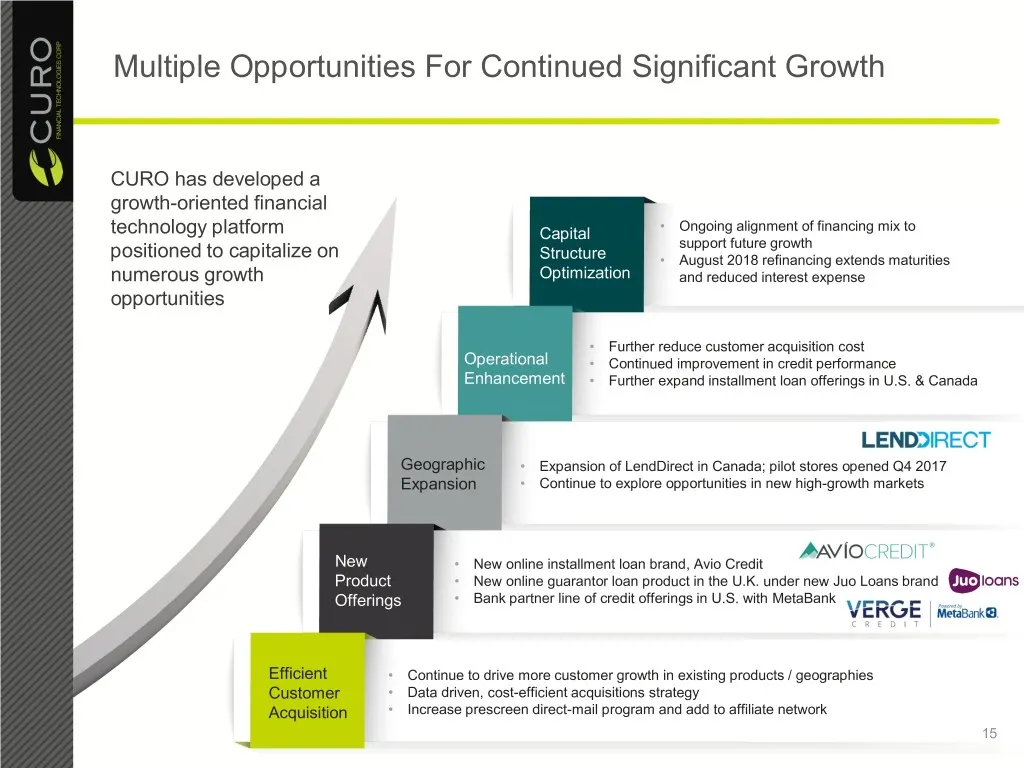
Multiple Opportunities For Continued Significant Growth CURO has developed a growth-oriented financial technology platform Capital • Ongoing alignment of financing mix to support future growth positioned to capitalize on Structure • August 2018 refinancing extends maturities numerous growth Optimiza
Slide 16: Canada Open-end Overview
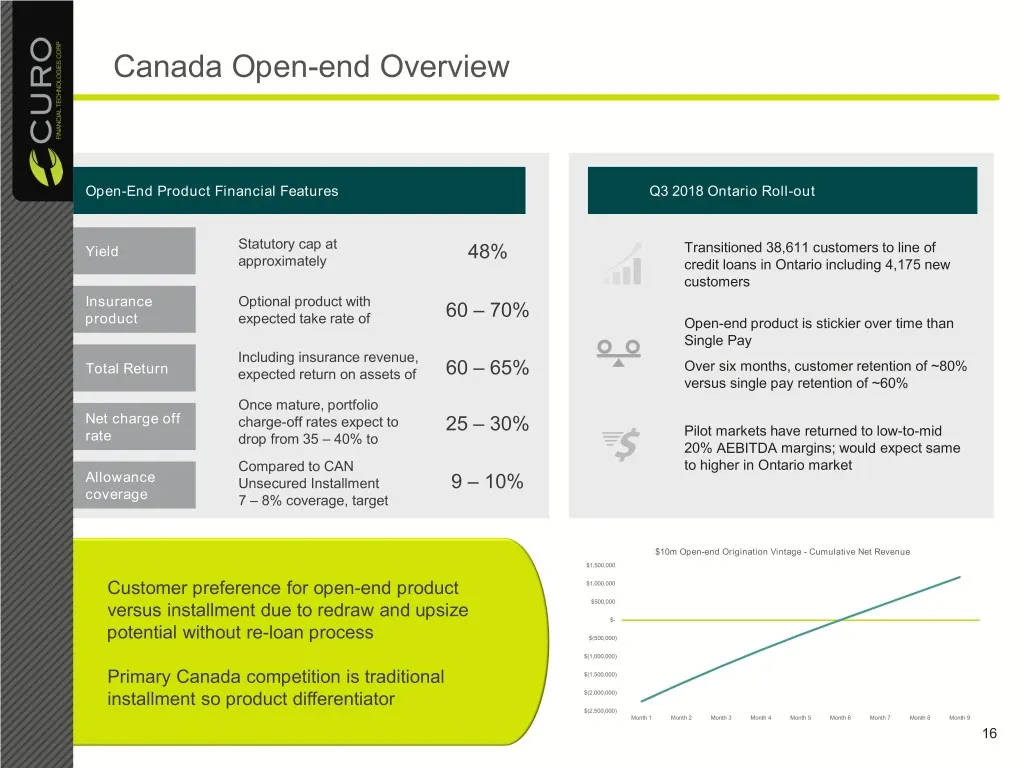
Canada Open-end Overview Open-End Product Financial Features Q3 2018 Ontario Roll-out Statutory cap at Yield 48% Transitioned 38,611 customers to line of approximately credit loans in Ontario including 4,175 new customers Insurance Optional product with 60 – 70% product expected take rate of Open-en
Slide 17: Transition To Multi-Pay Loans In Canada Beginning In 2016
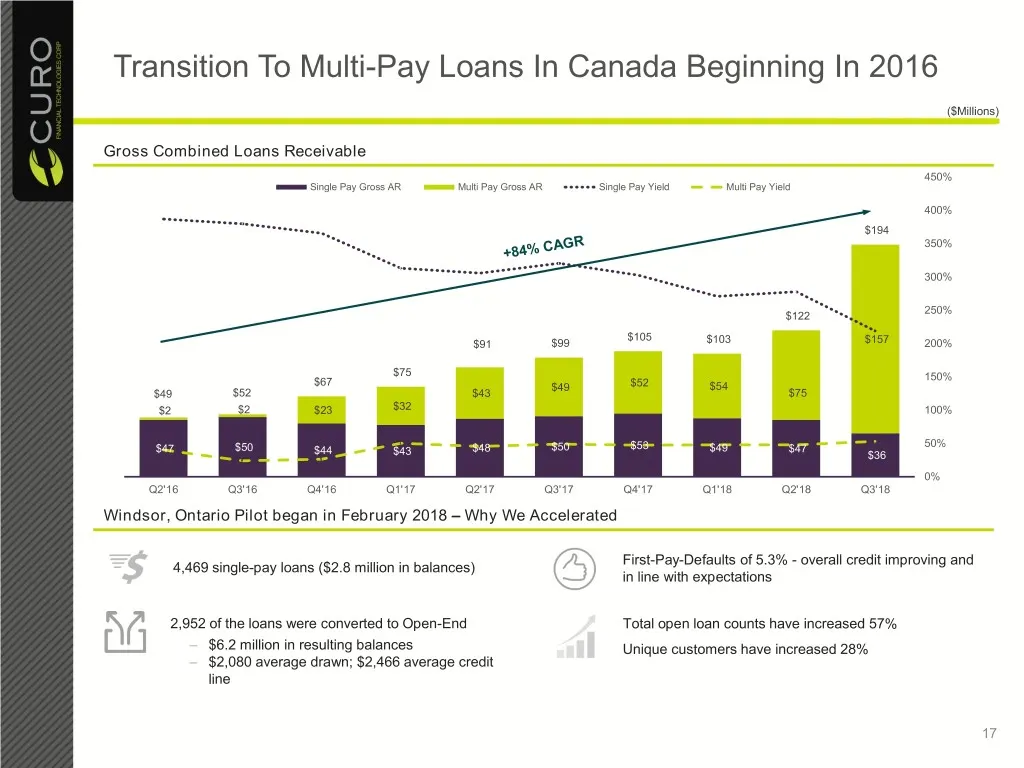
Transition To Multi-Pay Loans In Canada Beginning In 2016 ($Millions) Gross Combined Loans Receivable 450% Single Pay Gross AR Multi Pay Gross AR Single Pay Yield Multi Pay Yield 400% $194 350% 300% 250% $122 $105 $91 $99 $103 $157 200% $75 150% $67 $49 $52 $54 $49 $52 $43 $75 $2 $2 $23 $32 100% $47

Slide 18: Financial Summary
Financial Summary 18
Slide 19: Financial Results At A Glance
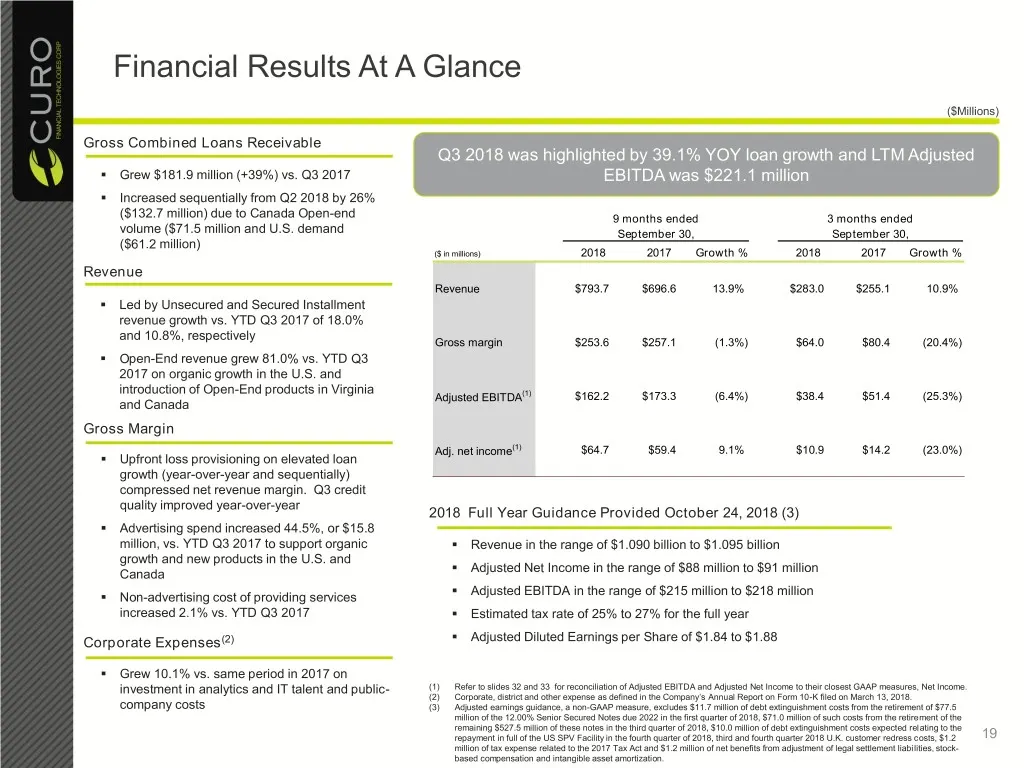
Financial Results At A Glance ($Millions) Gross Combined Loans Receivable Q3 2018 was highlighted by 39.1% YOY loan growth and LTM Adjusted . Grew $181.9 million (+39%) vs. Q3 2017 EBITDA was $221.1 million . Increased sequentially from Q2 2018 by 26% ($132.7 million) due to Canada Open-end 9 months
Slide 20: Historical Financial Summary
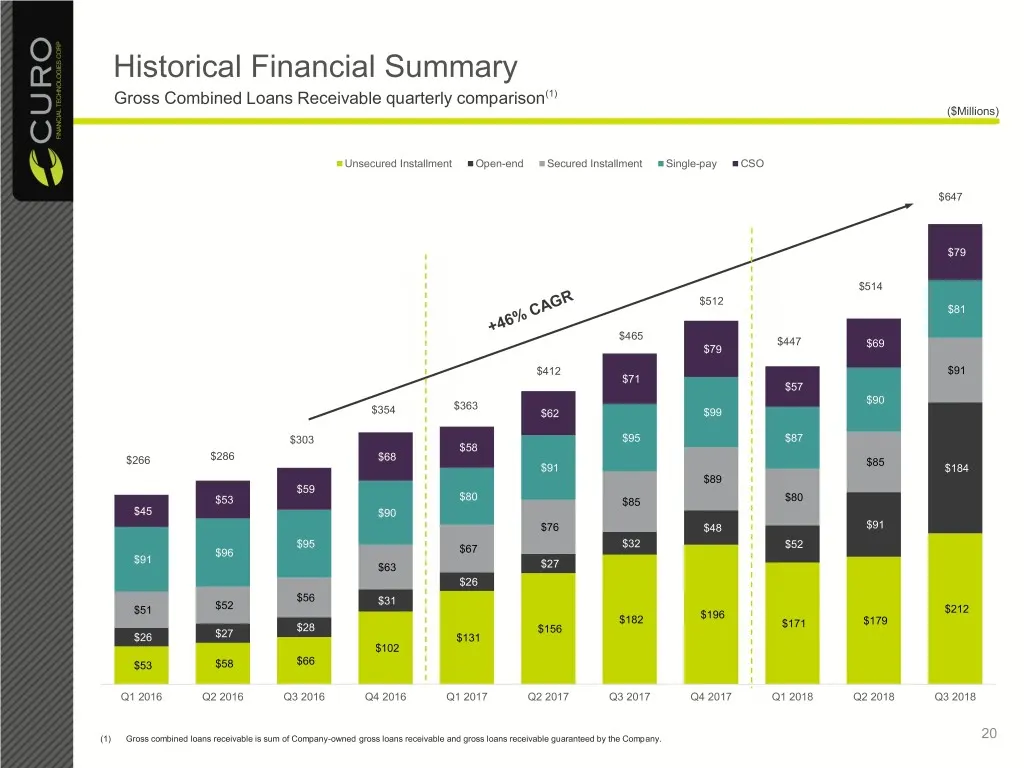
Historical Financial Summary Gross Combined Loans Receivable quarterly comparison(1) ($Millions) Unsecured Installment Open-end Secured Installment Single-pay CSO $647 $79 $514 $512 $81 $465 $447 $69 $79 $412 $91 $71 $57 $90 $363 $354 $62 $99 $303 $95 $87 $58 $286 $266 $68 $85 $91 $184 $89 $59 $53 $
Slide 21: Net Charge-off Rates Improvement
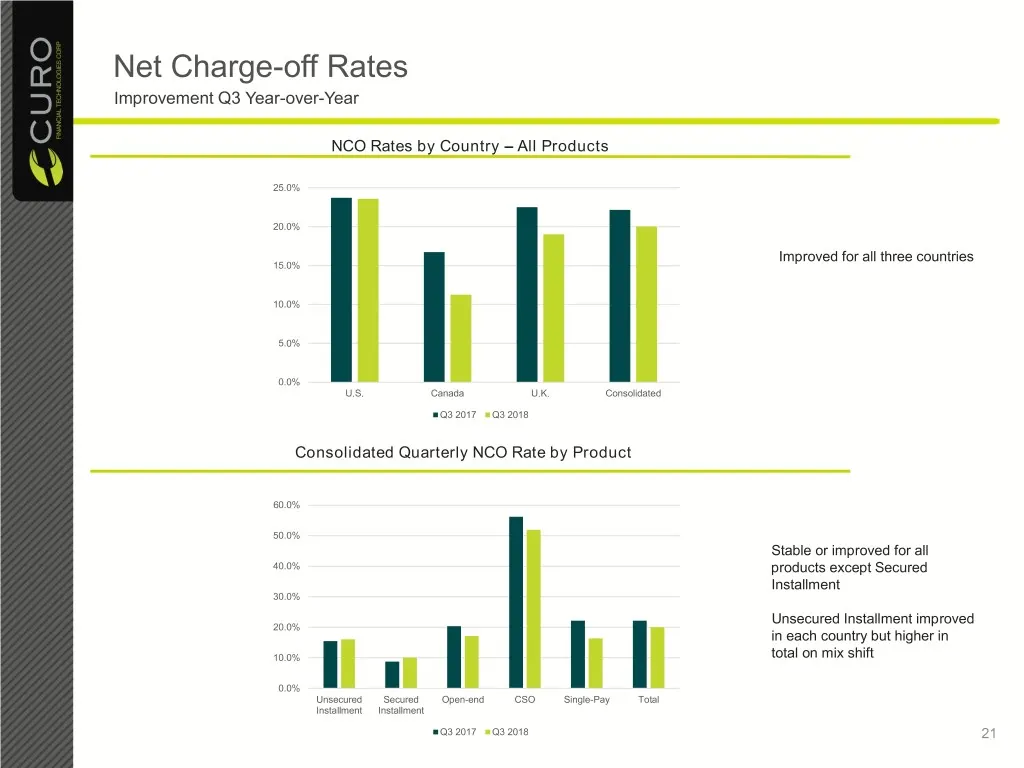
Net Charge-off Rates Improvement Q3 Year-over-Year NCO Rates by Country – All Products 25.0% 20.0% Improved for all three countries 15.0% 10.0% 5.0% 0.0% U.S. Canada U.K. Consolidated Q3 2017 Q3 2018 Consolidated Quarterly NCO Rate by Product 60.0% 50.0% Stable or improved for all 40.0% products exc
Slide 22: Consolidated Summary Balance Sheet
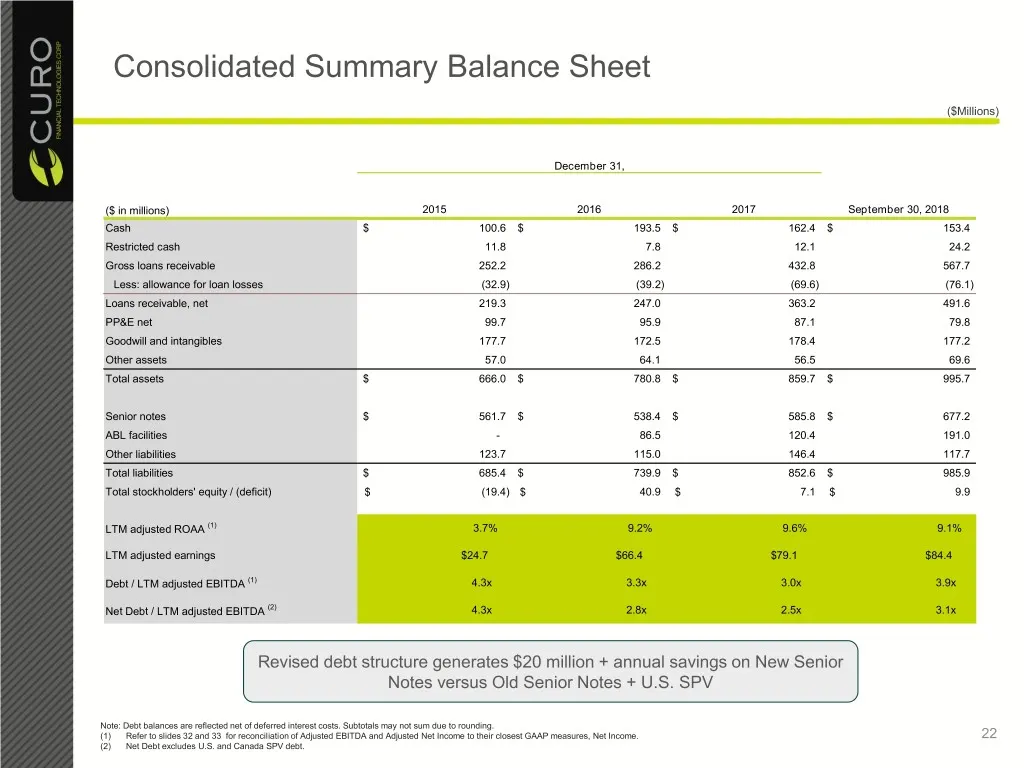
Consolidated Summary Balance Sheet ($Millions) December 31, ($ in millions) 2015 2016 2017 September 30, 2018 Cash $ 100.6 $ 193.5 $ 162.4 $ 153.4 Restricted cash 11.8 7.8 12.1 24.2 Gross loans receivable 252.2 286.2 432.8 567.7 Less: allowance for loan losses (32.9) (39.2) (69.6) (76.1) Loans recei
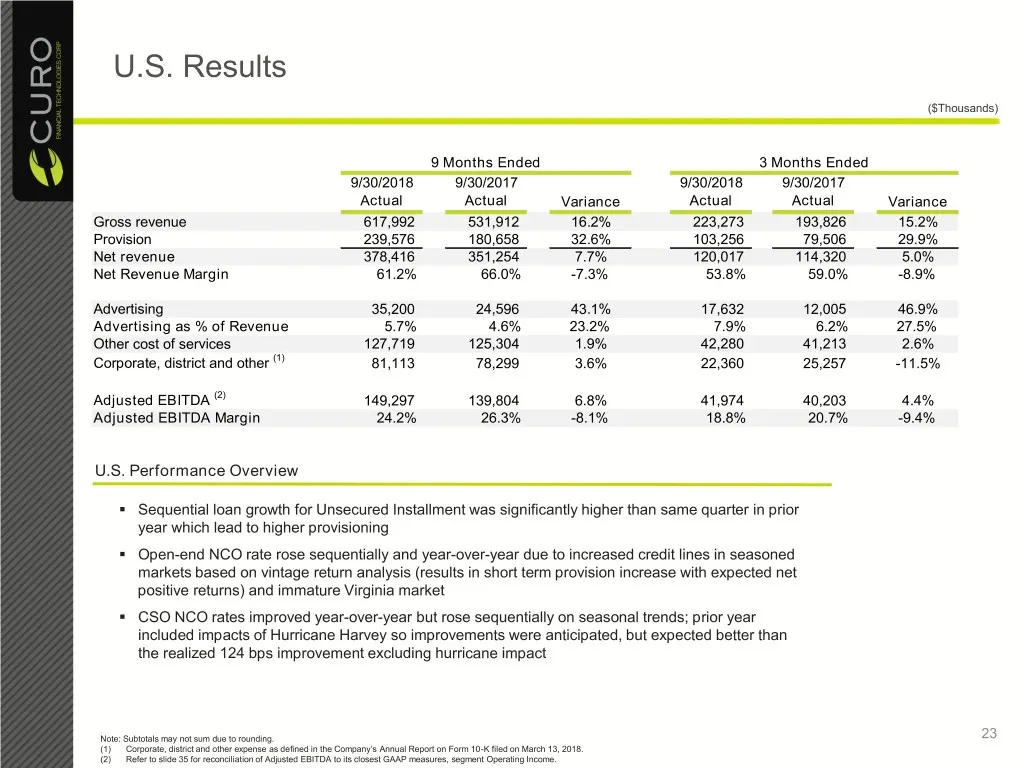
Slide 23: U.S. Results
U.S. Results ($Thousands) 9 Months Ended 3 Months Ended 9/30/2018 9/30/2017 9/30/2018 9/30/2017 Actual Actual Variance Actual Actual Variance Gross revenue 617,992 531,912 16.2% 223,273 193,826 15.2% Provision 239,576 180,658 32.6% 103,256 79,506 29.9% Net revenue 378,416 351,254 7.7% 120,017 114,32
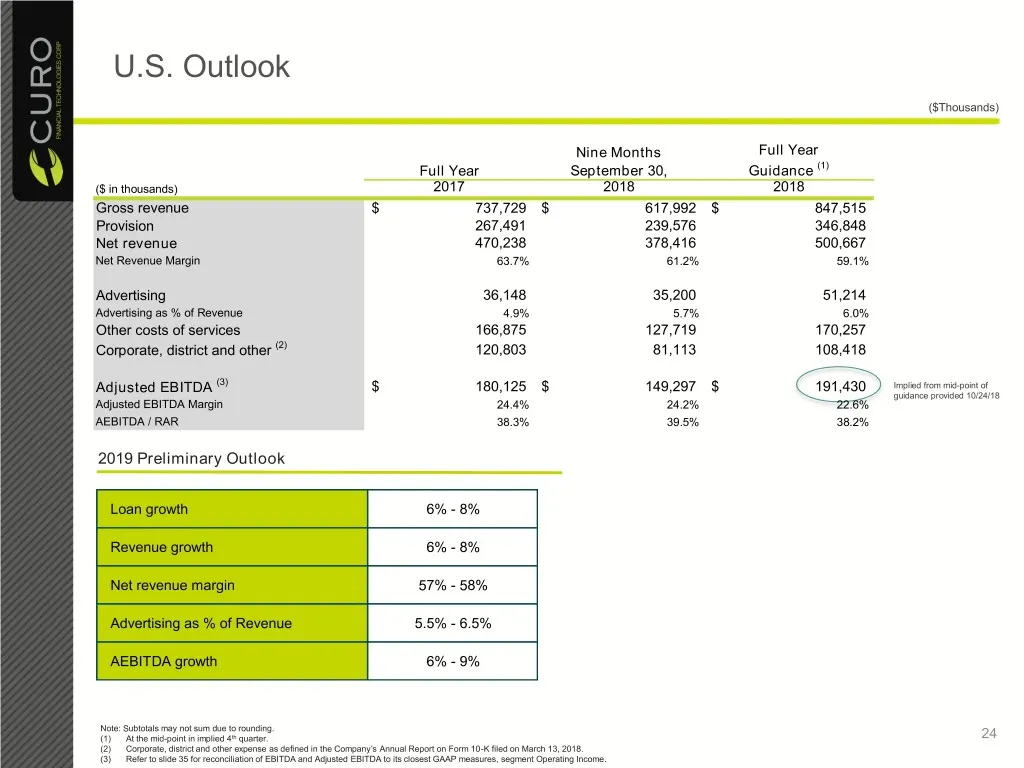
Slide 24: U.S. Outlook
U.S. Outlook ($Thousands) Nine Months Full Year Full Year September 30, Guidance (1) ($ in thousands) 2017 2018 2018 Gross revenue $ 737,729 $ 617,992 $ 847,515 Provision 267,491 239,576 346,848 Net revenue 470,238 378,416 500,667 Net Revenue Margin 63.7% 61.2% 59.1% Advertising 36,148 35,200 51,214
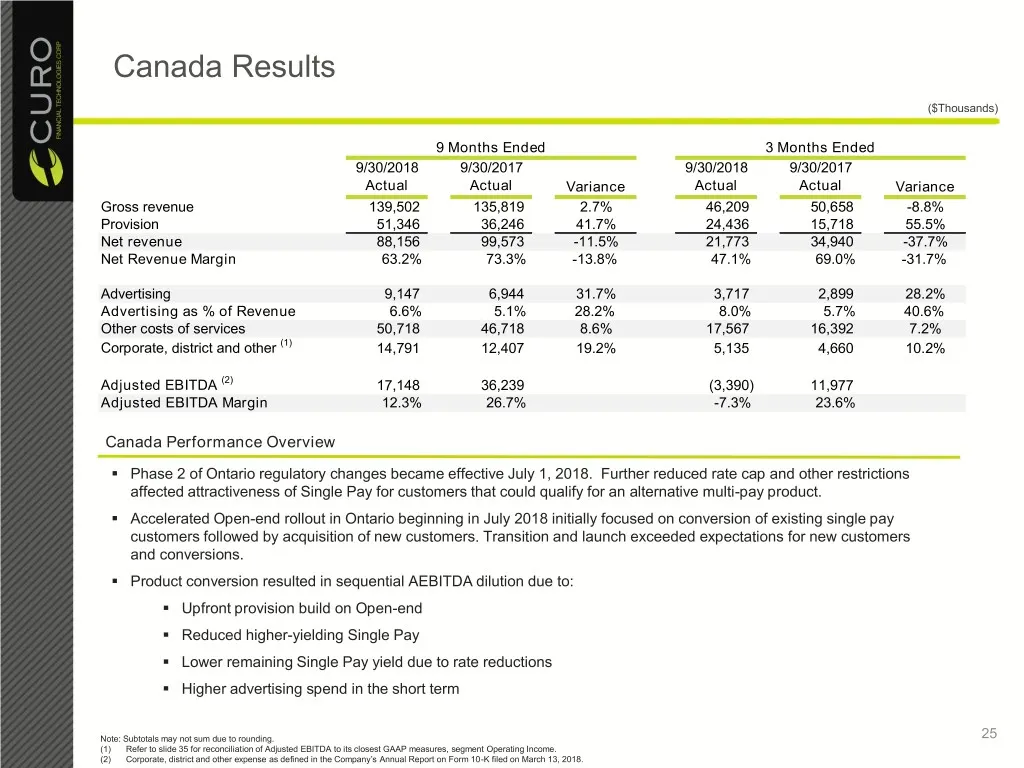
Slide 25: Canada Results
Canada Results ($Thousands) 9 Months Ended 3 Months Ended 9/30/2018 9/30/2017 9/30/2018 9/30/2017 Actual Actual Variance Actual Actual Variance Gross revenue 139,502 135,819 2.7% 46,209 50,658 -8.8% Provision 51,346 36,246 41.7% 24,436 15,718 55.5% Net revenue 88,156 99,573 -11.5% 21,773 34,940 -37.
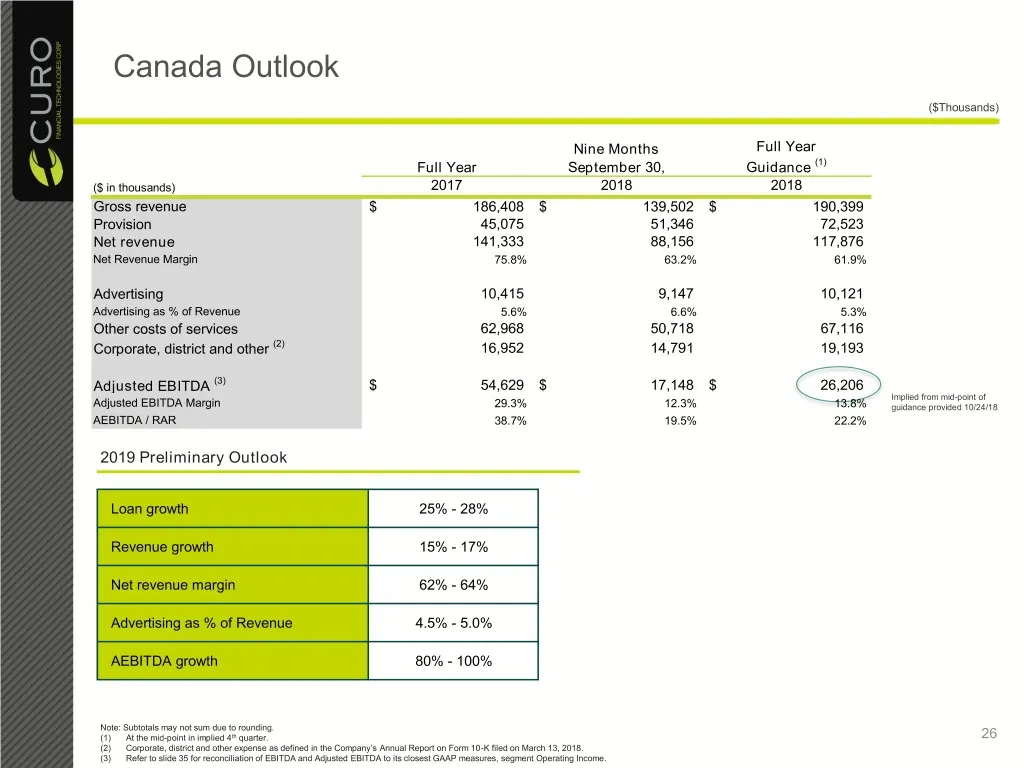
Slide 26: Canada Outlook
Canada Outlook ($Thousands) Nine Months Full Year Full Year September 30, Guidance (1) ($ in thousands) 2017 2018 2018 Gross revenue $ 186,408 $ 139,502 $ 190,399 Provision 45,075 51,346 72,523 Net revenue 141,333 88,156 117,876 Net Revenue Margin 75.8% 63.2% 61.9% Advertising 10,415 9,147 10,121 Ad
Slide 27: U.K. Results
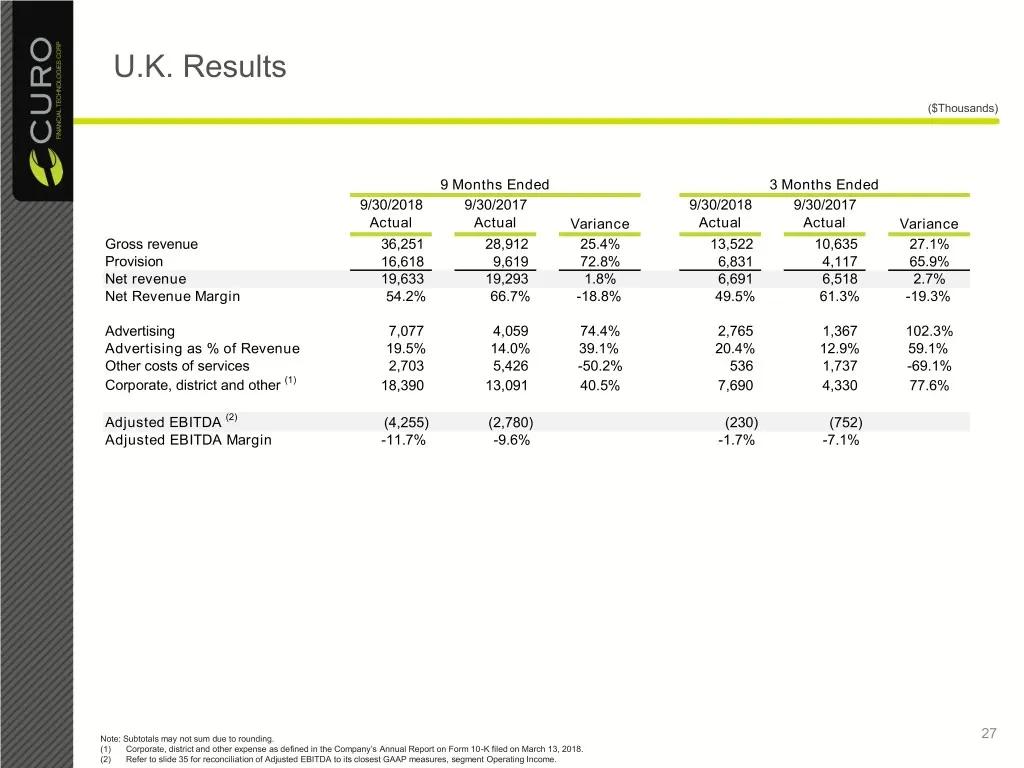
U.K. Results ($Thousands) 9 Months Ended 3 Months Ended 9/30/2018 9/30/2017 9/30/2018 9/30/2017 Actual Actual Variance Actual Actual Variance Gross revenue 36,251 28,912 25.4% 13,522 10,635 27.1% Provision 16,618 9,619 72.8% 6,831 4,117 65.9% Net revenue 19,633 19,293 1.8% 6,691 6,518 2.7% Net Reven
Slide 28: Interest And Tax Outlook
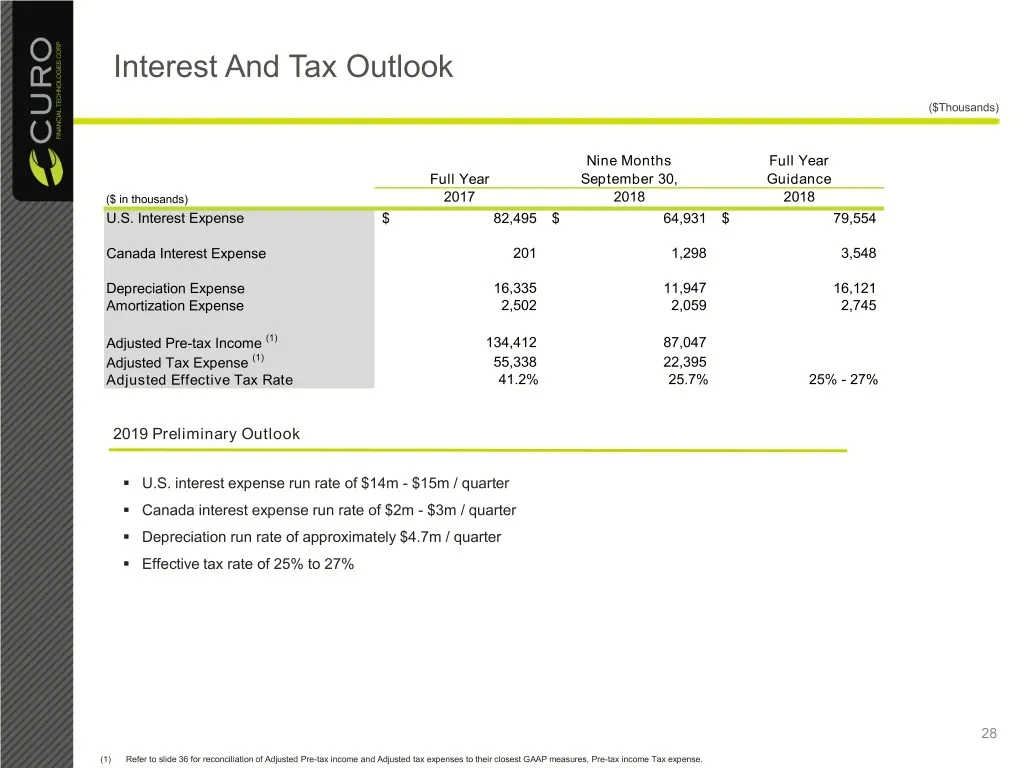
Interest And Tax Outlook ($Thousands) Nine Months Full Year Full Year September 30, Guidance ($ in thousands) 2017 2018 2018 U.S. Interest Expense $ 82,495 $ 64,931 $ 79,554 Canada Interest Expense 201 1,298 3,548 Depreciation Expense 16,335 11,947 16,121 Amortization Expense 2,502 2,059 2,745 Adjus
Slide 29: Key Investment Highlights
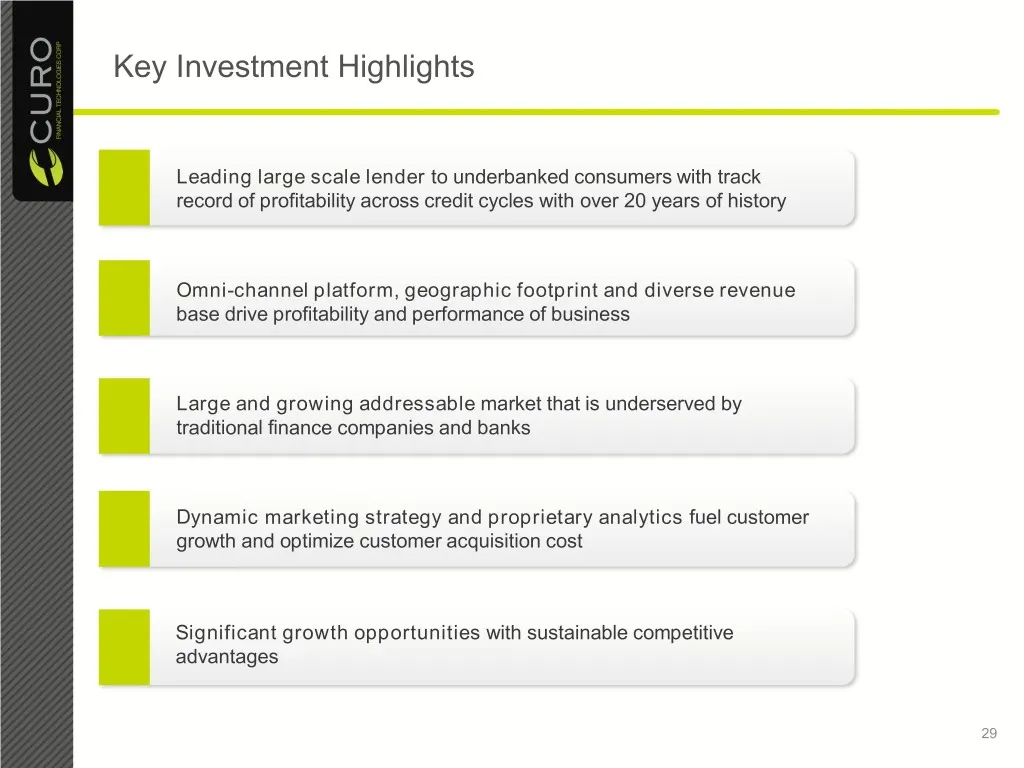
Key Investment Highlights Leading large scale lender to underbanked consumers with track record of profitability across credit cycles with over 20 years of history Omni-channel platform, geographic footprint and diverse revenue base drive profitability and performance of business Large and growing a

Slide 30: Appendix
Appendix 30
Slide 31: Historical Consolidated Adjusted Return On Average Assets
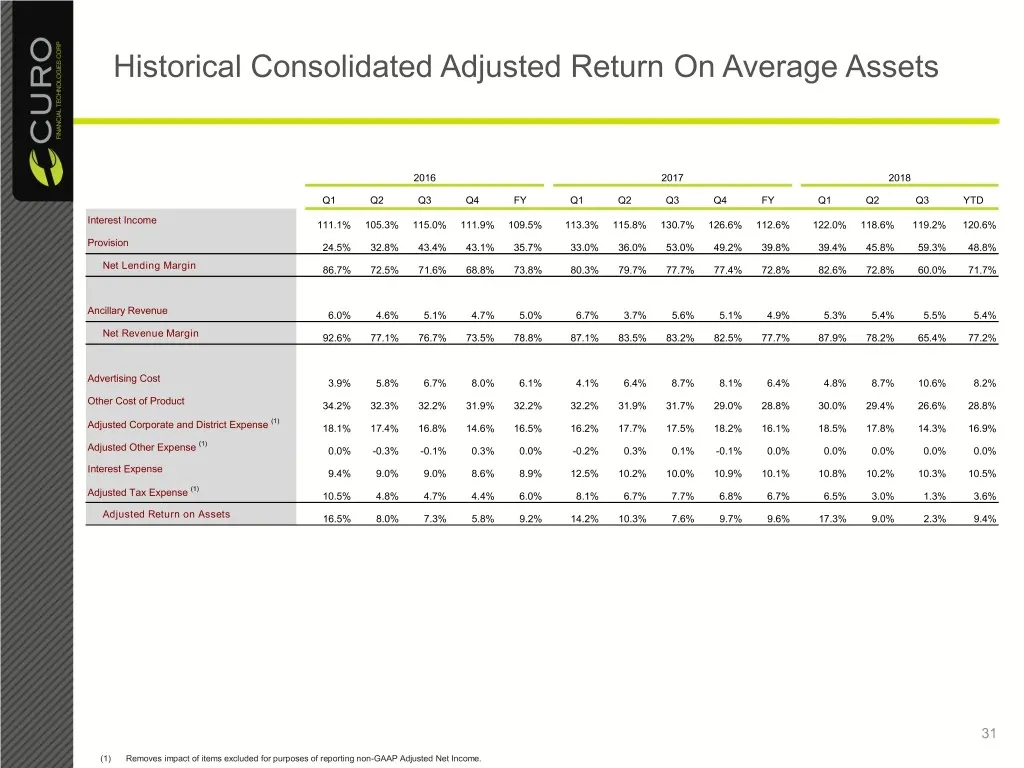
Historical Consolidated Adjusted Return On Average Assets 2016 2017 2018 Q1 Q2 Q3 Q4 FY Q1 Q2 Q3 Q4 FY Q1 Q2 Q3 YTD Interest Income 111.1% 105.3% 115.0% 111.9% 109.5% 113.3% 115.8% 130.7% 126.6% 112.6% 122.0% 118.6% 119.2% 120.6% Provision 24.5% 32.8% 43.4% 43.1% 35.7% 33.0% 36.0% 53.0% 49.2% 39.8%
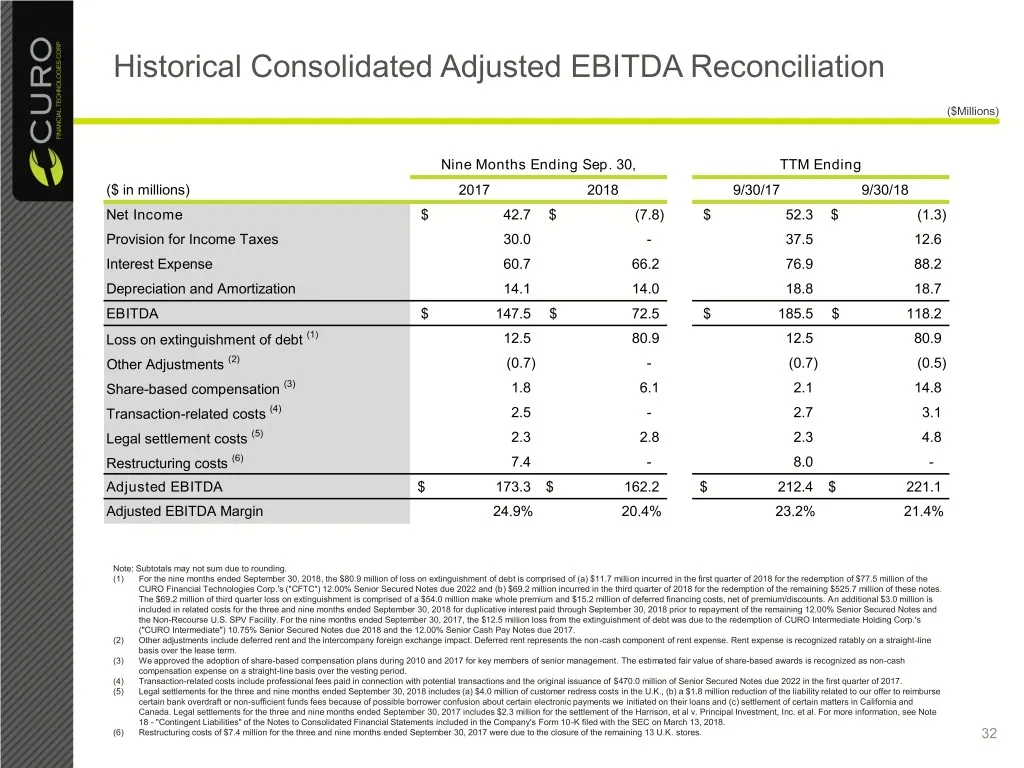
Slide 32: Historical Consolidated Adjusted EBITDA Reconciliation
Historical Consolidated Adjusted EBITDA Reconciliation ($Millions) Nine Months Ending Sep. 30, TTM Ending ($ in millions) 2017 2018 9/30/17 9/30/18 Net Income $ 42.7 $ (7.8) $ 52.3 $ (1.3) Provision for Income Taxes 30.0 - 37.5 12.6 Interest Expense 60.7 66.2 76.9 88.2 Depreciation and Amortization
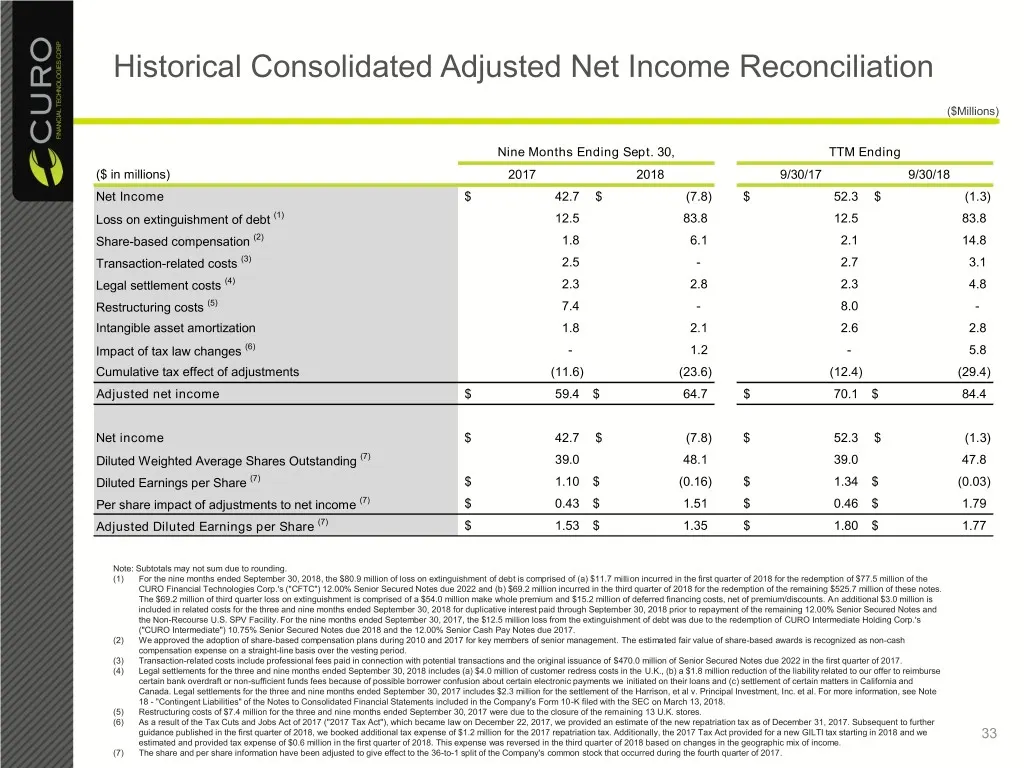
Slide 33: Historical Consolidated Adjusted Net Income Reconciliation
Historical Consolidated Adjusted Net Income Reconciliation ($Millions) Nine Months Ending Sept. 30, TTM Ending ($ in millions) 2017 2018 9/30/17 9/30/18 Net Income $ 42.7 $ (7.8) $ 52.3 $ (1.3) Loss on extinguishment of debt (1) 12.5 83.8 12.5 83.8 Share-based compensation (2) 1.8 6.1 2.1 14.8 Trans
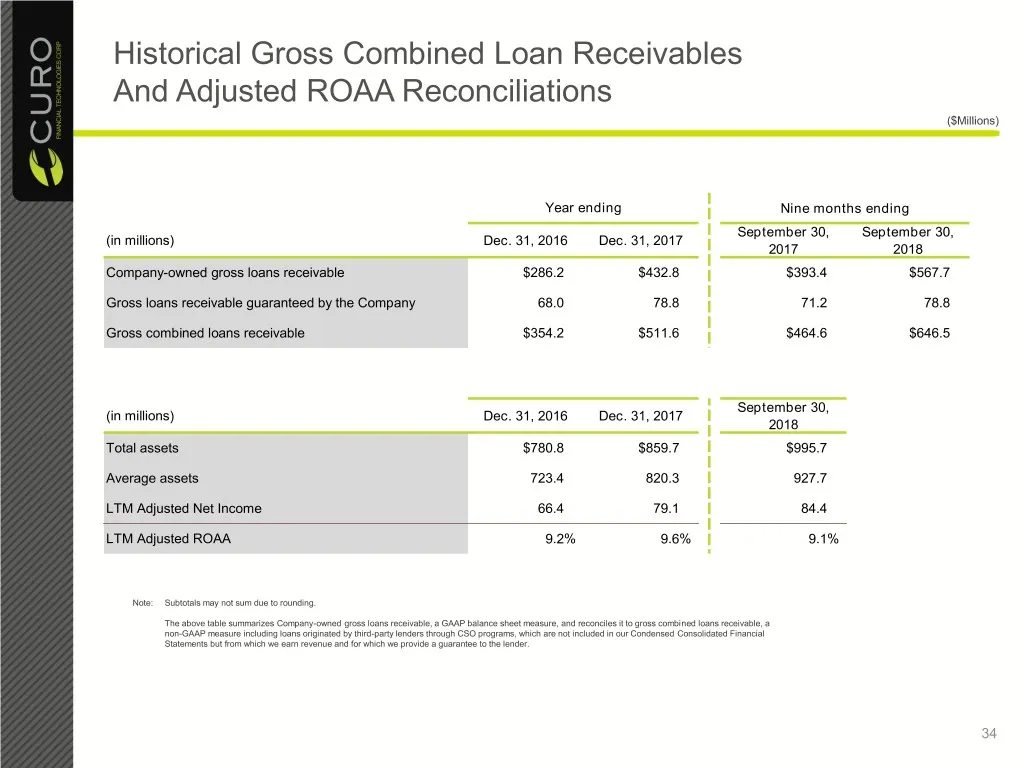
Slide 34: Historical Gross Combined Loan Receivables And Adjusted ROAA Reconciliations
Historical Gross Combined Loan Receivables And Adjusted ROAA Reconciliations ($Millions) Year ending Nine months ending September 30, September 30, (in millions) Dec. 31, 2016 Dec. 31, 2017 2017 2018 Company-owned gross loans receivable $286.2 $432.8 $393.4 $567.7 Gross loans receivable guaranteed b
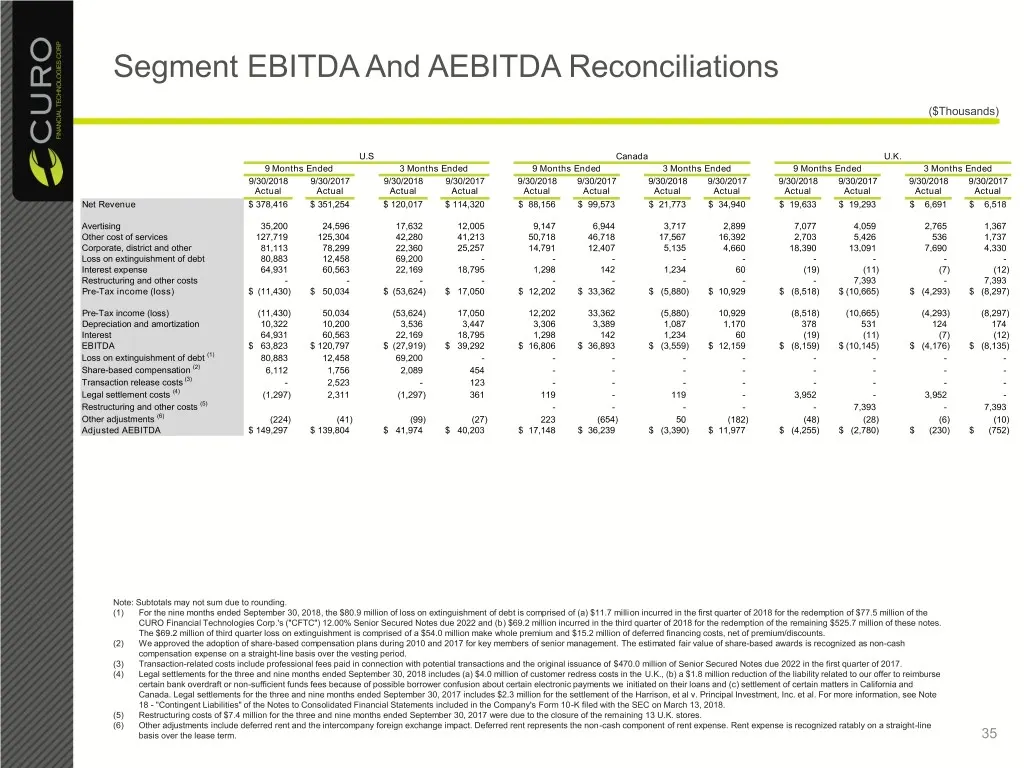
Slide 35: Segment EBITDA And AEBITDA Reconciliations
Segment EBITDA And AEBITDA Reconciliations ($Thousands) U.S Canada U.K. 9 Months Ended 3 Months Ended 9 Months Ended 3 Months Ended 9 Months Ended 3 Months Ended 9/30/2018 9/30/2017 9/30/2018 9/30/2017 9/30/2018 9/30/2017 9/30/2018 9/30/2017 9/30/2018 9/30/2017 9/30/2018 9/30/2017 Actual Actual Actu
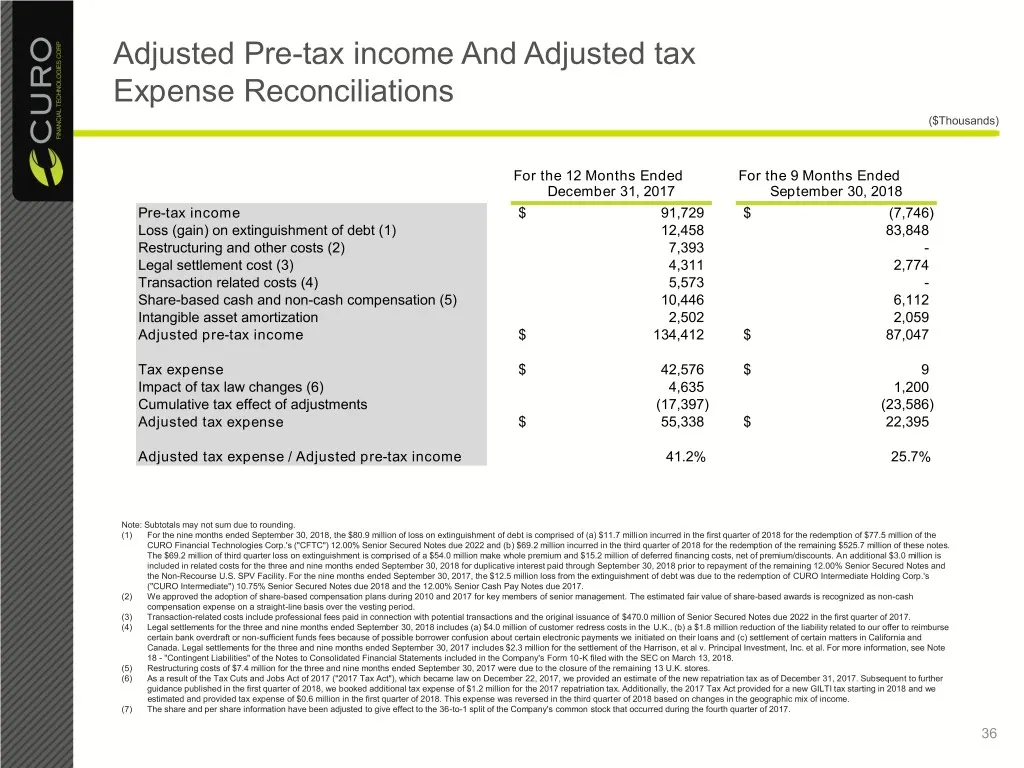
Slide 36: Adjusted Pre-tax income And Adjusted tax Expense Reconciliations
Adjusted Pre-tax income And Adjusted tax Expense Reconciliations ($Thousands) For the 12 Months Ended For the 9 Months Ended December 31, 2017 September 30, 2018 Pre-tax income $ 91,729 $ (7,746) Loss (gain) on extinguishment of debt (1) 12,458 83,848 Restructuring and other costs (2) 7,393 - Legal
Source: SEC EDGAR · 8-K filed Nov 7, 2018
More decks from Curo Group Holdings Corp
 Q4 2023 Earnings Presentation21 slides · Feb 12, 2024
 Investor Presentation (November 2023)15 slides · Nov 13, 2023
 Q3 2023 Earnings Presentation20 slides · Nov 2, 2023
 Debt Investor Presentation (October 2023)21 slides · Oct 23, 2023
 Investor Presentation (September 2023)15 slides · Sep 25, 2023
 Q2 2023 Earnings Presentation21 slides · Aug 3, 2023