Santander Consumer USA Holdings Inc
Santander Consumer USA — Q1 2015 Earnings Presentation
27 slides from Santander Consumer USA's earnings presentation, Apr 28, 2015
Slide 1: Santander Consumer USA Holdings Inc. 1Q15 Company Update
Santander Consumer USA Holdings Inc. 1Q15 Company Update
Slide 2: Important Information: Forward-Looking Statements
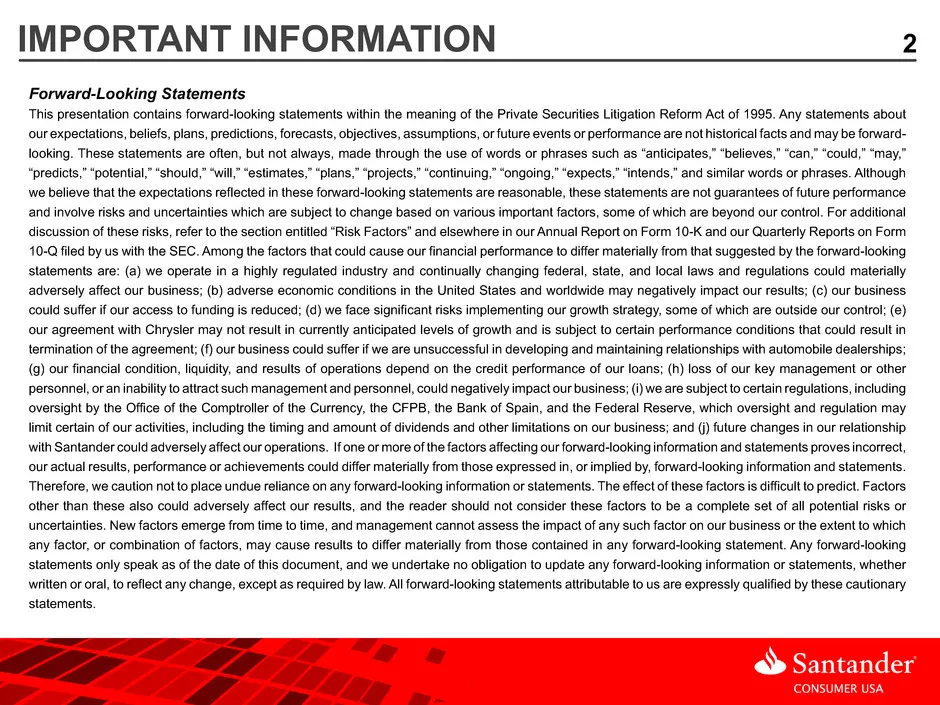
2IMPORTANT INFORMATION Forward-Looking Statements This presentation contains forward-looking statements within the meaning of the Private Securities Litigation Reform Act of 1995. Any statements about our expectations, beliefs, plans, predictions, forecasts, objectives, assumptions, or future events
Slide 3: Agenda
3AGENDA Highlights Strategy and Business Results Appendix: Financial and Supplemental Information
Slide 4: 1Q15: Highlights
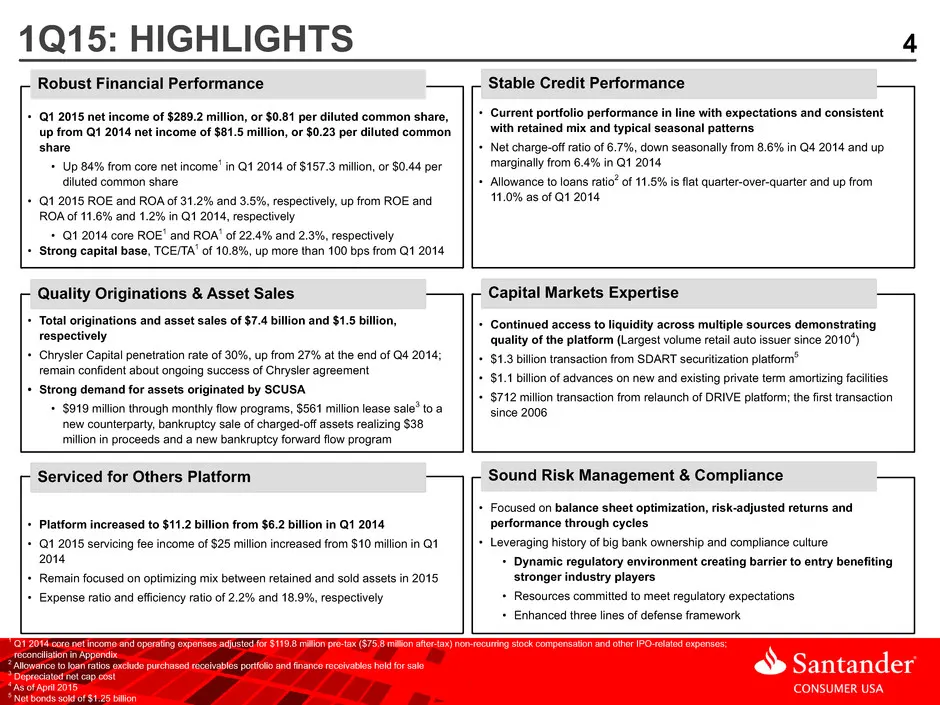
41Q15: HIGHLIGHTS • Q1 2015 net income of $289.2 million, or $0.81 per diluted common share, up from Q1 2014 net income of $81.5 million, or $0.23 per diluted common share • Up 84% from core net income1 in Q1 2014 of $157.3 million, or $0.44 per diluted common share • Q1 2015 ROE and ROA of 31.2% an
Slide 5: 1Q15: Key Metrics and Ratios
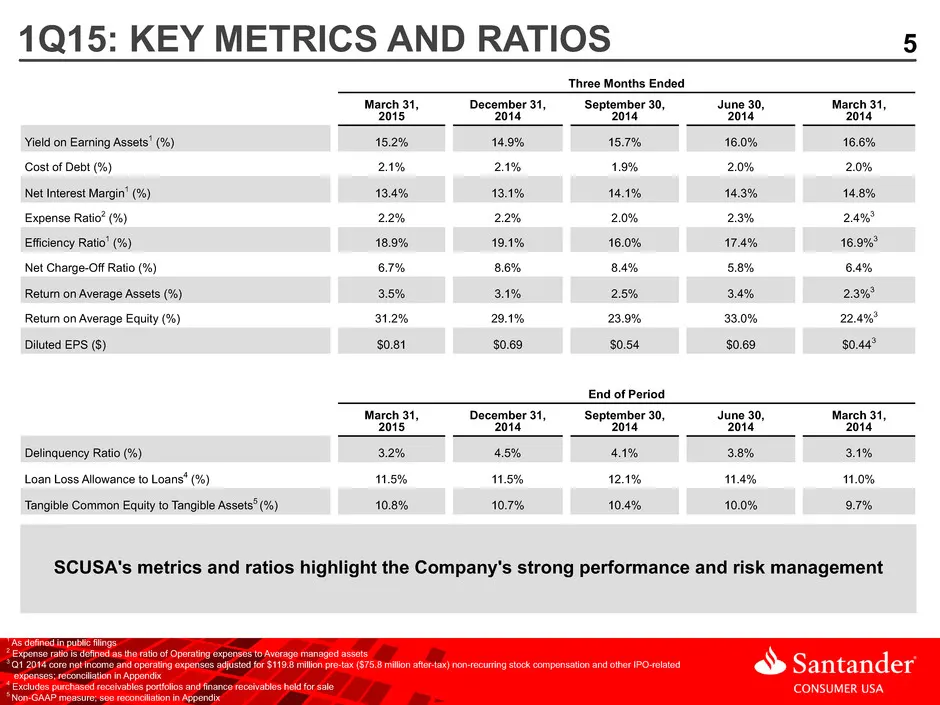
51Q15: KEY METRICS AND RATIOS 1 As defined in public filings 2 Expense ratio is defined as the ratio of Operating expenses to Average managed assets 3 Q1 2014 core net income and operating expenses adjusted for $119.8 million pre-tax ($75.8 million after-tax) non-recurring stock compensation and oth
Slide 6: Agenda
6AGENDA Highlights Strategy and Business Results Appendix: Financial and Supplemental Information
Slide 7: SCUSA Overview
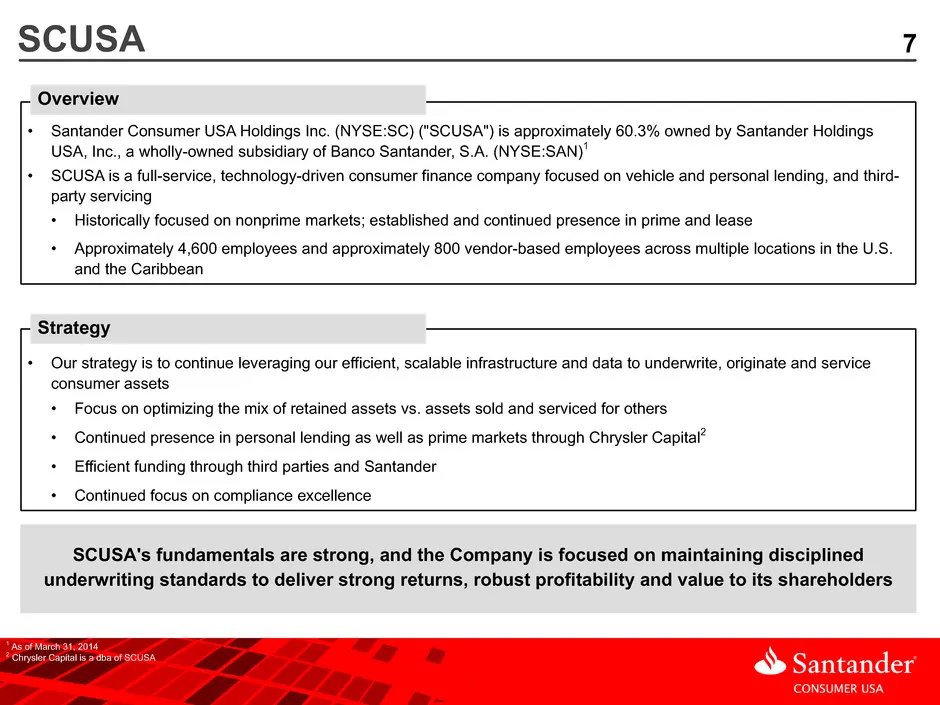
7SCUSA SCUSA's fundamentals are strong, and the Company is focused on maintaining disciplined underwriting standards to deliver strong returns, robust profitability and value to its shareholders 1 As of March 31, 2014 2 Chrysler Capital is a dba of SCUSA • Santander Consumer USA Holdings Inc. (NYSE:
Slide 8: SCUSA Today
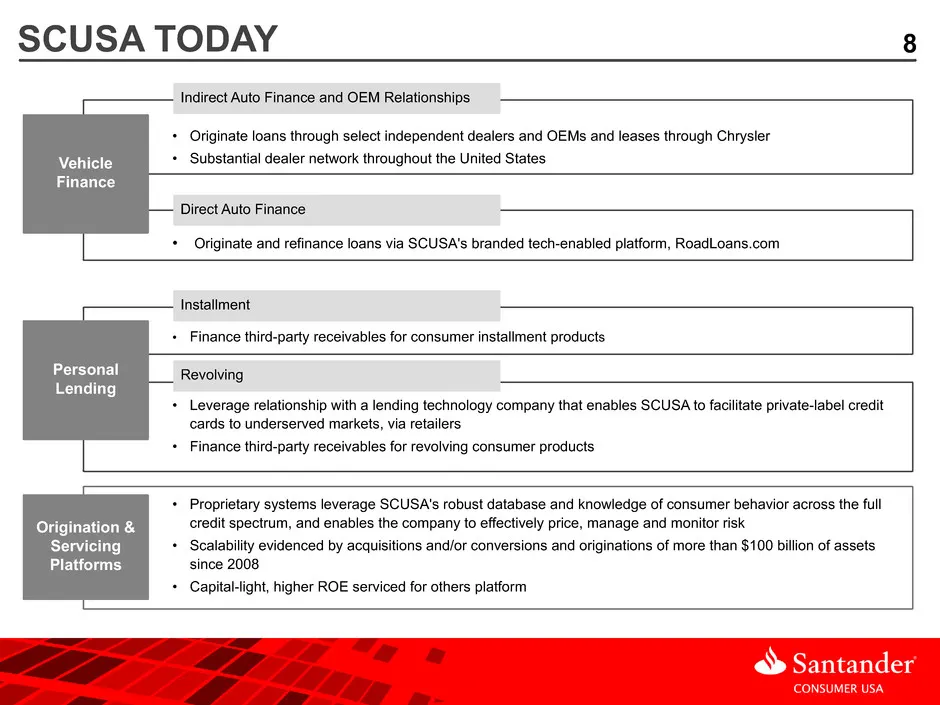
8SCUSA TODAY • Originate loans through select independent dealers and OEMs and leases through Chrysler • Substantial dealer network throughout the United States • Originate and refinance loans via SCUSA's branded tech-enabled platform, RoadLoans.com Vehicle Finance Direct Auto Finance Indirect Auto
Slide 9: Chrysler Capital
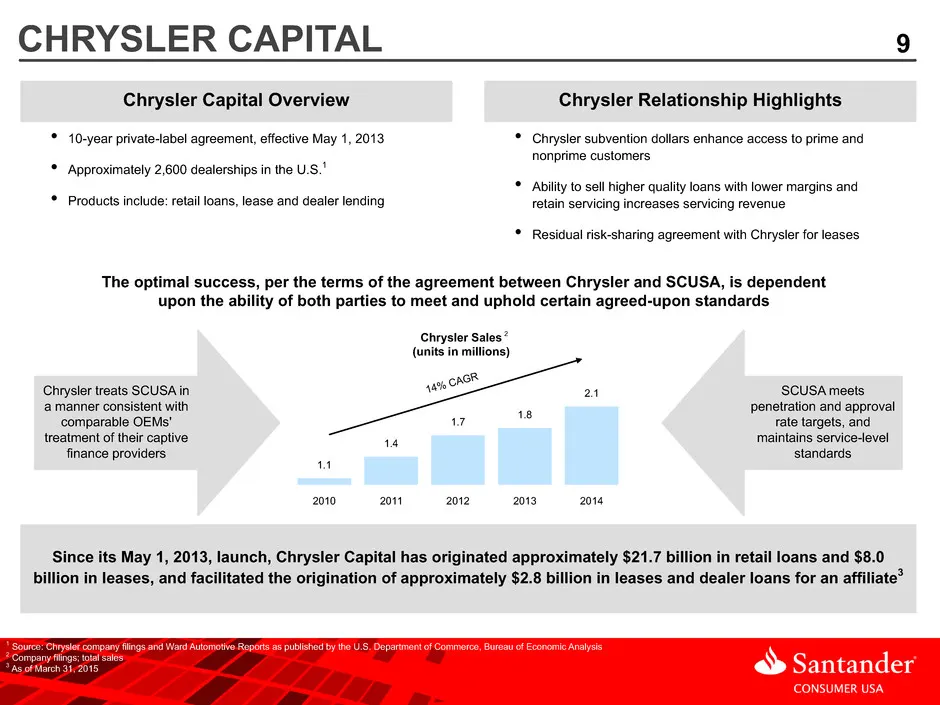
9CHRYSLER CAPITAL Chrysler Capital Overview Chrysler Relationship Highlights • 10-year private-label agreement, effective May 1, 2013 • Approximately 2,600 dealerships in the U.S.1 • Products include: retail loans, lease and dealer lending • Chrysler subvention dollars enhance access to prime and no
Slide 10: Personal Lending
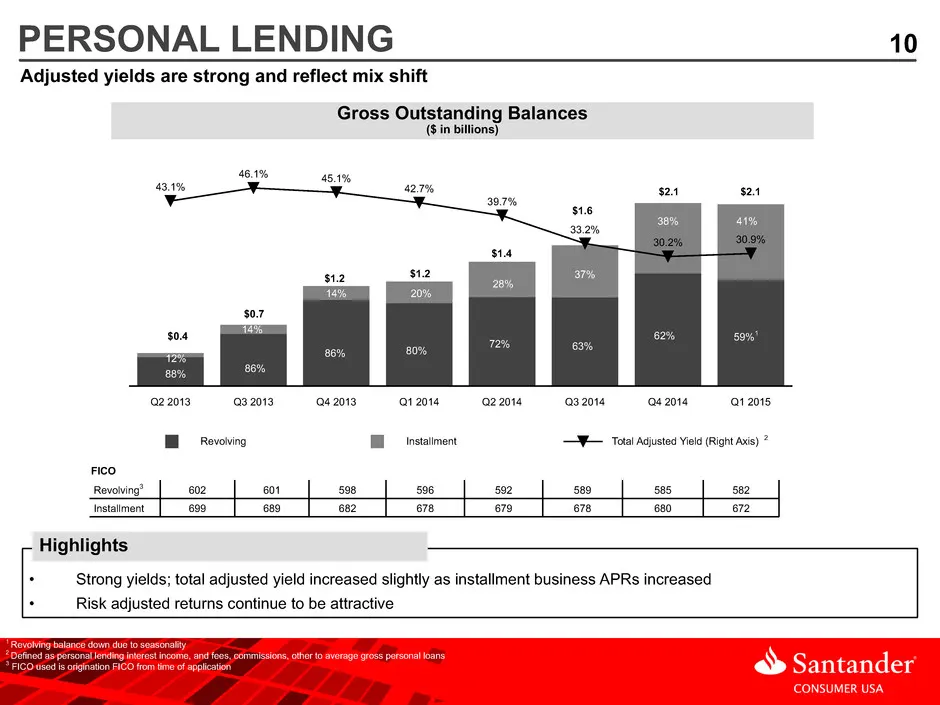
10 Gross Outstanding Balances ($ in billions) PERSONAL LENDING Revolving Installment Total Adjusted Yield (Right Axis) Q2 2013 Q3 2013 Q4 2013 Q1 2014 Q2 2014 Q3 2014 Q4 2014 Q1 2015 43.1% 46.1% 45.1% 42.7% 39.7% 33.2% 30.2% 30.9% 88% 38% 37% 28% 20%14% 14% 12% 86% 86% 80% 72% 63% 62% 59%1 41% 1 Rev
Slide 11: Key Compliance Program Elements
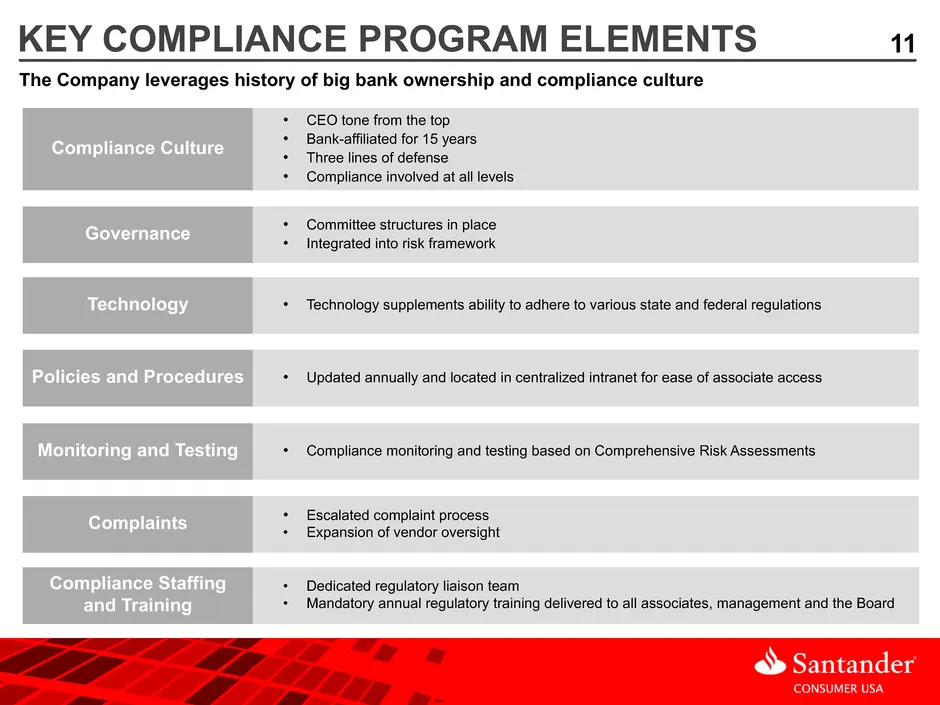
11KEY COMPLIANCE PROGRAM ELEMENTS The Company leverages history of big bank ownership and compliance culture Compliance Culture Governance Technology Compliance Staffing and Training Complaints Monitoring and Testing Policies and Procedures • CEO tone from the top • Bank-affiliated for 15 years • Th
Slide 12: Agenda
12AGENDA Highlights Strategy and Business Results Appendix: Financial and Supplemental Information
Slide 13: Origination Trends
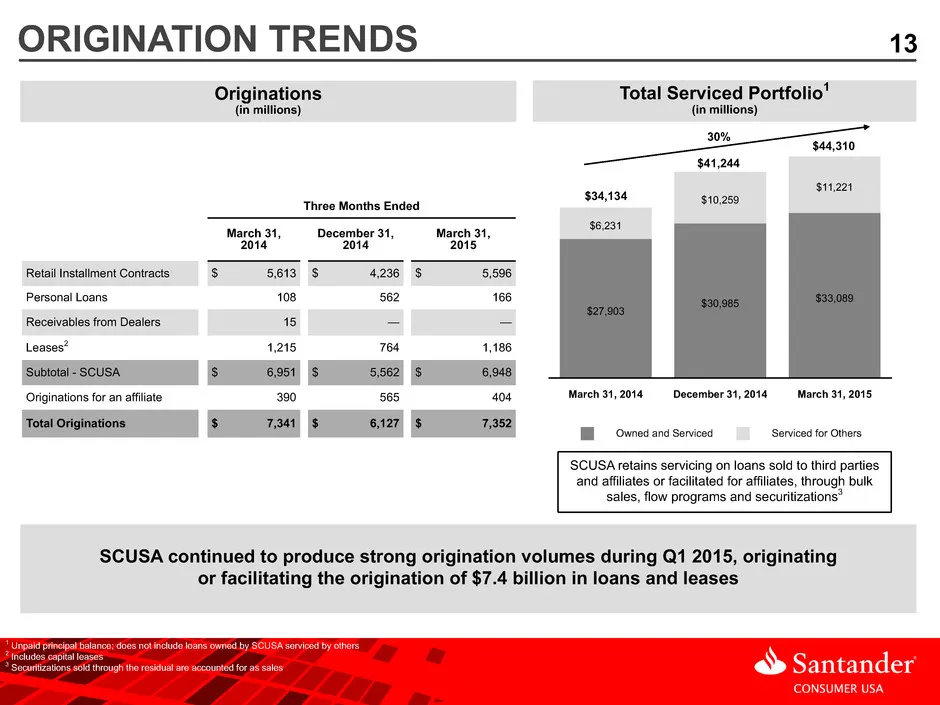
13ORIGINATION TRENDS 1 Unpaid principal balance; does not include loans owned by SCUSA serviced by others 2 Includes capital leases 3 Securitizations sold through the residual are accounted for as sales SCUSA retains servicing on loans sold to third parties and affiliates or facilitated for affiliat
Slide 14: Expenses and Income
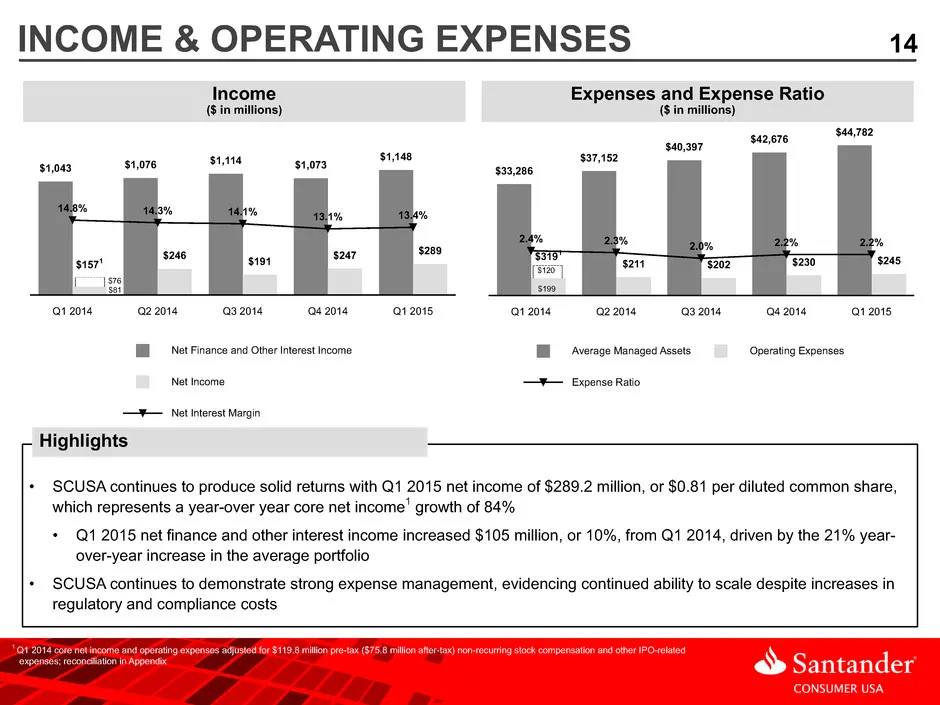
14 Expenses and Expense Ratio ($ in millions) $211 $202 $230 $245 Average Managed Assets Operating Expenses Expense Ratio Q1 2014 Q2 2014 Q3 2014 Q4 2014 Q1 2015 $33,286 $37,152 $40,397 $42,676 $44,782 2.4% 2.3% 2.0% 2.2% 2.2% Income ($ in millions) • SCUSA continues to produce solid returns with Q1
Slide 15: Credit: Provision Expense, Net Charge-offs and Delinquency Trends
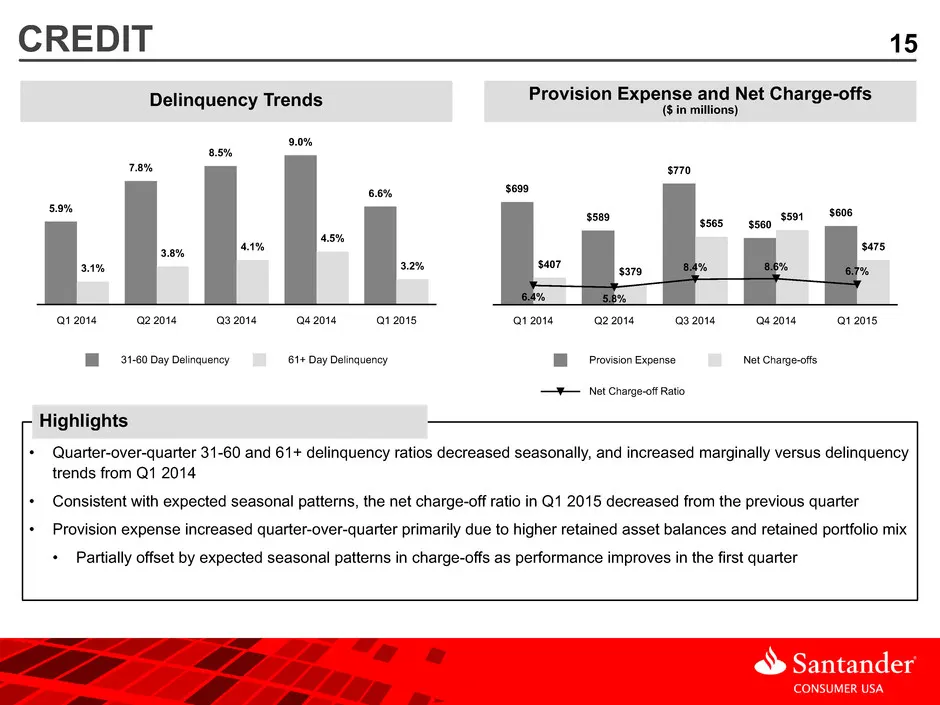
15 Provision Expense and Net Charge-offs ($ in millions)Delinquency Trends 31-60 Day Delinquency 61+ Day Delinquency Q1 2014 Q2 2014 Q3 2014 Q4 2014 Q1 2015 5.9% 7.8% 8.5% 9.0% 6.6% 3.1% 3.8% 4.1% 4.5% 3.2% Provision Expense Net Charge-offs Net Charge-off Ratio Q1 2014 Q2 2014 Q3 2014 Q4 2014 Q1 201
Slide 16: Funding and Liquidity: Diverse Funding Sources
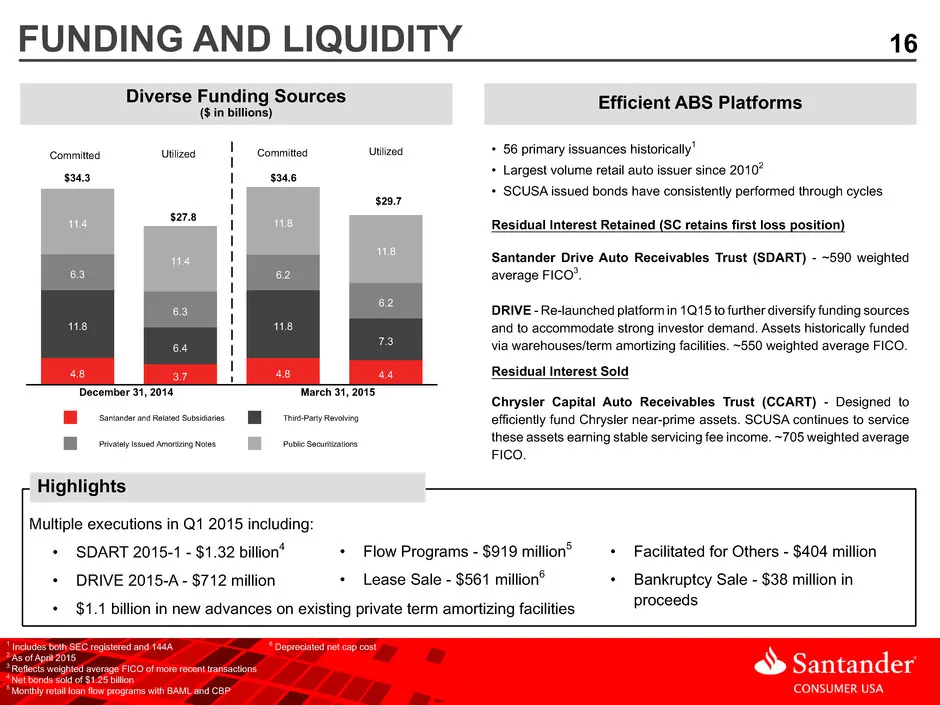
16 Diverse Funding Sources ($ in billions) Santander and Related Subsidiaries Third-Party Revolving Privately Issued Amortizing Notes Public Securitizations 4.8 3.7 4.8 4.4 11.8 6.4 11.8 7.3 6.3 6.3 6.2 6.2 11.4 11.4 11.8 34.6 11.8 29.7 Santander Drive Auto Receivables Trust (SDART) - ~590 weighted
Slide 17: Agenda
17AGENDA Highlights Strategy and Business Results Appendix: Financial and Supplemental Information
Slide 18: Loan Loss Allowance - Q1 2015
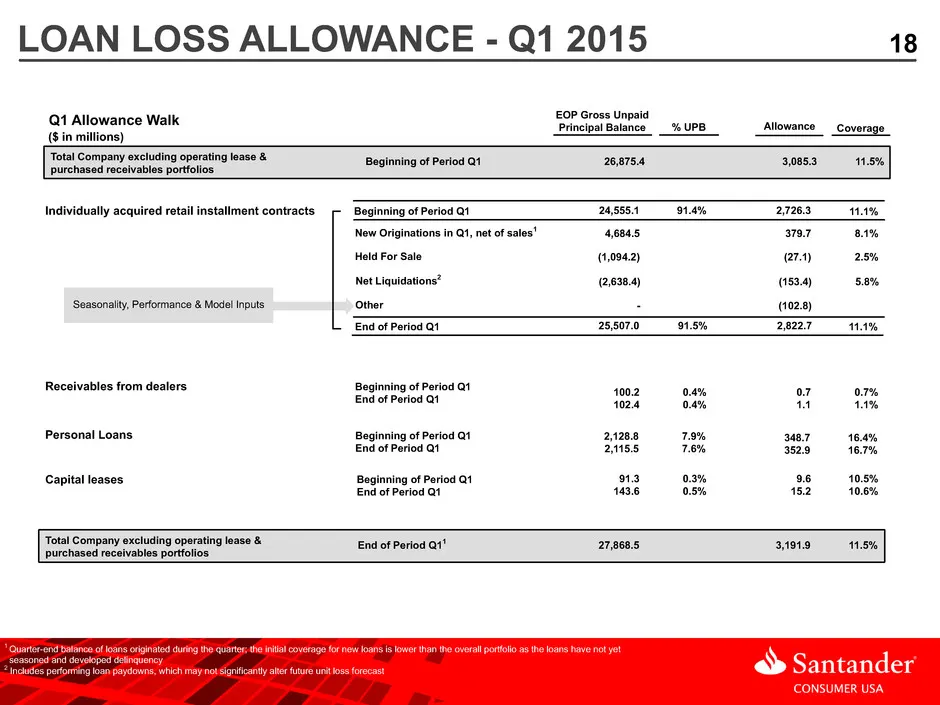
18LOAN LOSS ALLOWANCE - Q1 2015 Q1 Allowance Walk Total Company excluding operating lease & purchased receivables portfolios Beginning of Period Q1 CoverageAllowance% UPB EOP Gross Unpaid Principal Balance 26,875.4 3,085.3 11.5% Total Company excluding operating lease & purchased receivables portfol
Slide 19: Company Organization
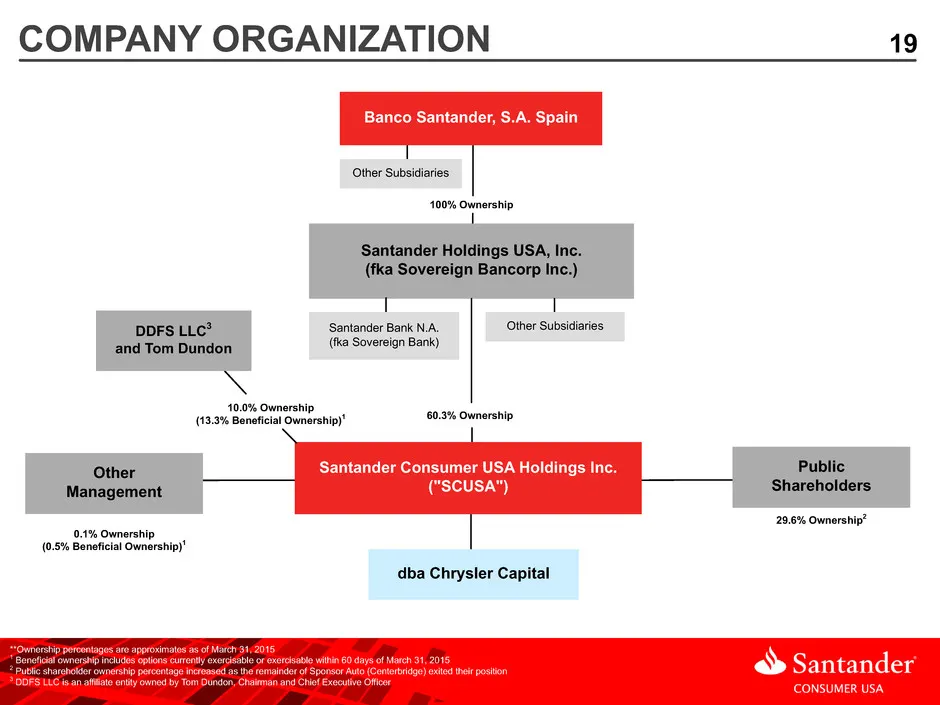
19COMPANY ORGANIZATION Other Subsidiaries 100% Ownership Santander Holdings USA, Inc. (fka Sovereign Bancorp Inc.) 60.3% Ownership Santander Consumer USA Holdings Inc. ("SCUSA") Santander Bank N.A. (fka Sovereign Bank) Other Subsidiaries dba Chrysler Capital 10.0% Ownership (13.3% Beneficial Ownersh
Slide 20: Economic Indicators
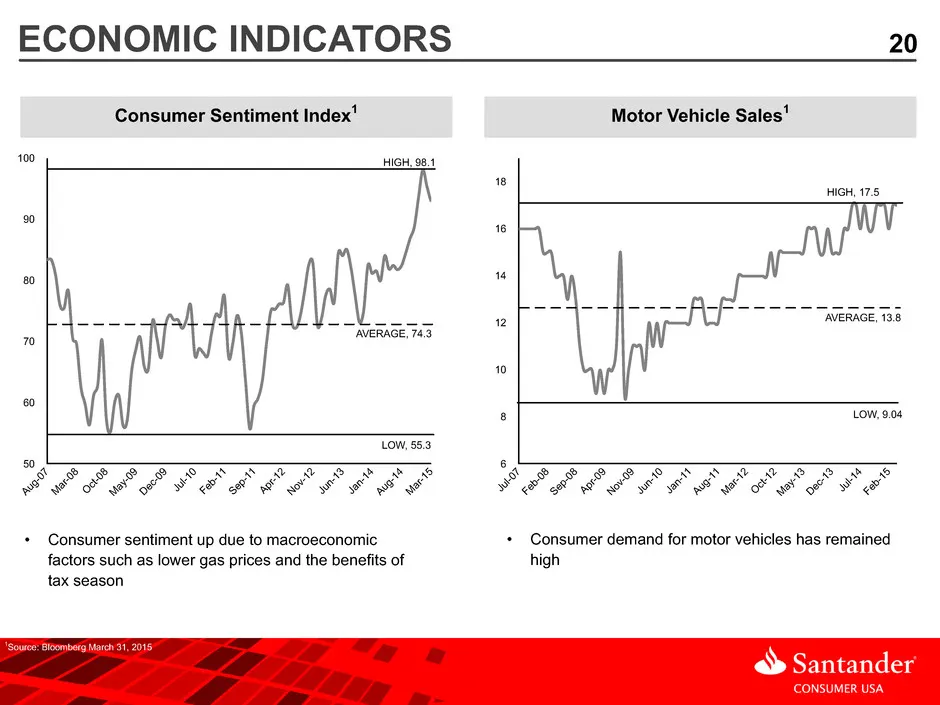
20ECONOMIC INDICATORS (units in millions) Consumer Sentiment Index1 Motor Vehicle Sales1 100 90 80 70 60 50 Au g-0 7 Ma r-0 8 Oc t-0 8 Ma y-0 9 De c-0 9 Ju l-1 0 Fe b-1 1 Se p-1 1 Ap r-1 2 No v-1 2 Ju n-1 3 Ja n-1 4 Au g-1 4 Ma r-1 5 HIGH, 98.1 LOW, 55.3 18 16 14 12 10 8 6 Ju l-0 7 Fe b-0 8 Se p-0 8
Slide 21: Consumer Finance Environment
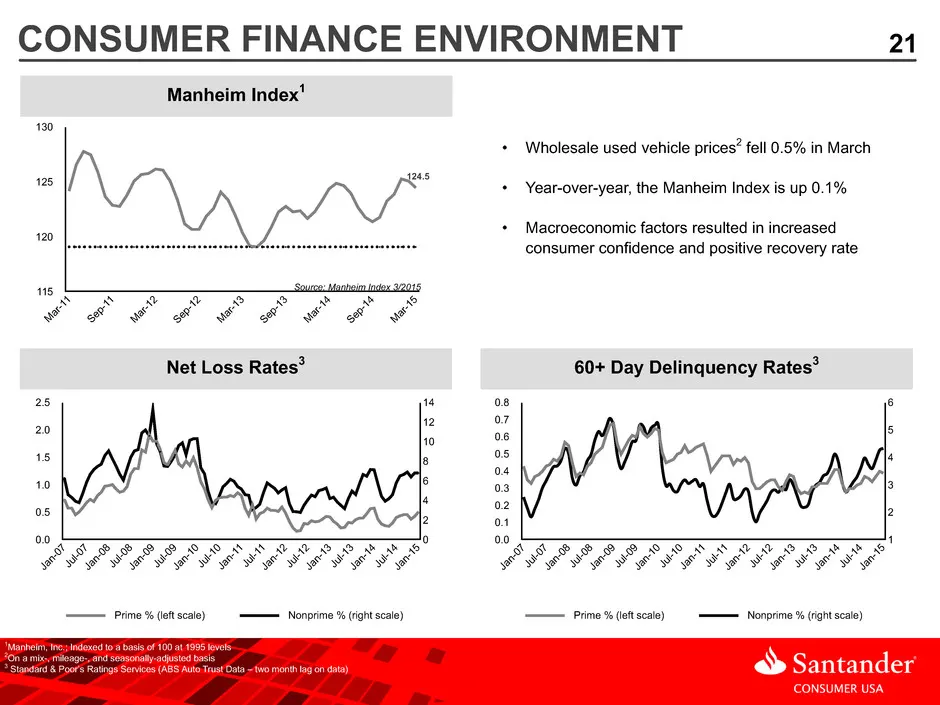
21CONSUMER FINANCE ENVIRONMENT (units in millions) Manheim Index1 60+ Day Delinquency Rates3 1Manheim, Inc.; Indexed to a basis of 100 at 1995 levels 2On a mix-, mileage-, and seasonally-adjusted basis 3 Standard & Poor’s Ratings Services (ABS Auto Trust Data – two month lag on data) • Wholesale use
Slide 22: Credit Profiles
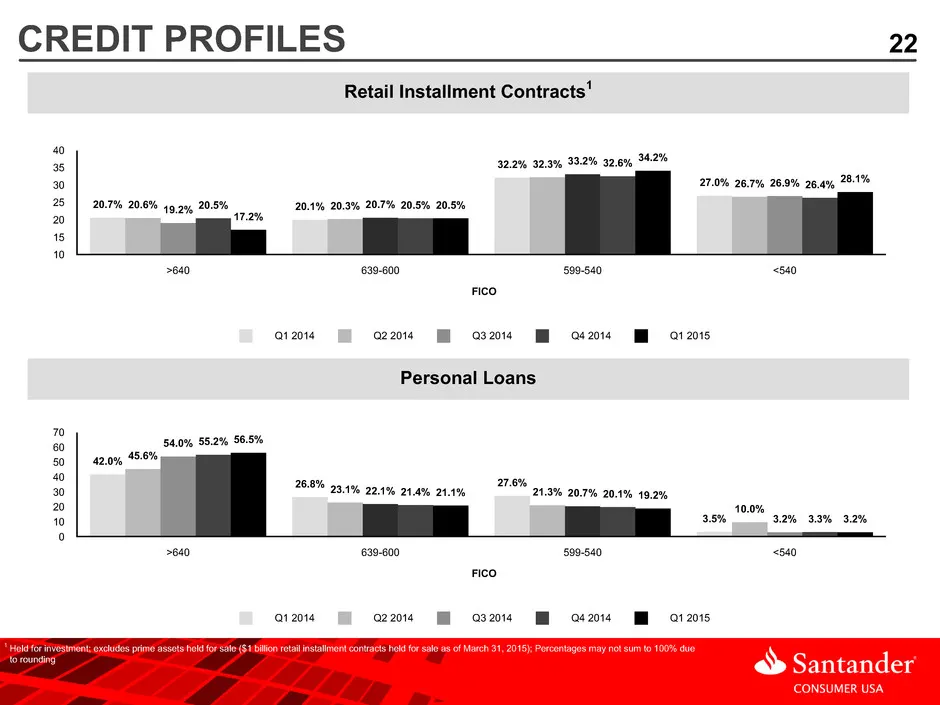
22CREDIT PROFILES 1 Held for investment; excludes prime assets held for sale ($1 billion retail installment contracts held for sale as of March 31, 2015); Percentages may not sum to 100% due to rounding Retail Installment Contracts1 Personal Loans Q1 2014 Q2 2014 Q3 2014 Q4 2014 Q1 2015 40 35 30 25
Slide 23: Consolidated Balance Sheet
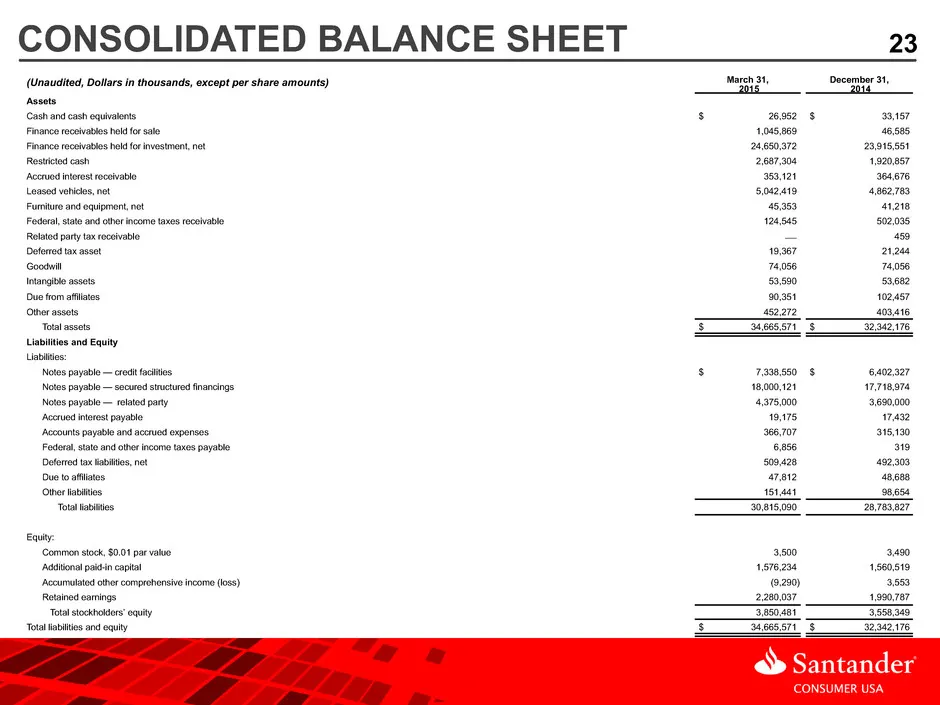
23CONSOLIDATED BALANCE SHEET (Unaudited, Dollars in thousands, except per share amounts) March 31, 2015 December 31, 2014 Assets Cash and cash equivalents $ 26,952 $ 33,157 Finance receivables held for sale 1,045,869 46,585 Finance receivables held for investment, net 24,650,372 23,915,551 Restricte
Slide 24: Consolidated Income Statement
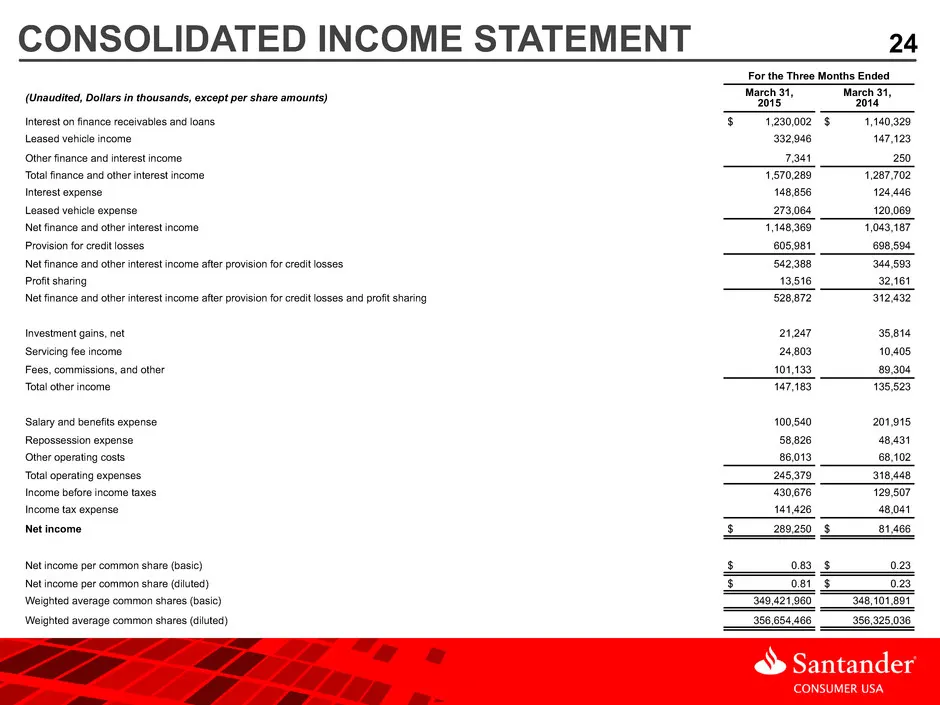
24CONSOLIDATED INCOME STATEMENT For the Three Months Ended (Unaudited, Dollars in thousands, except per share amounts) March 31,2015 March 31, 2014 Interest on finance receivables and loans $ 1,230,002 $ 1,140,329 Leased vehicle income 332,946 147,123 Other finance and interest income 7,341 250 Tota
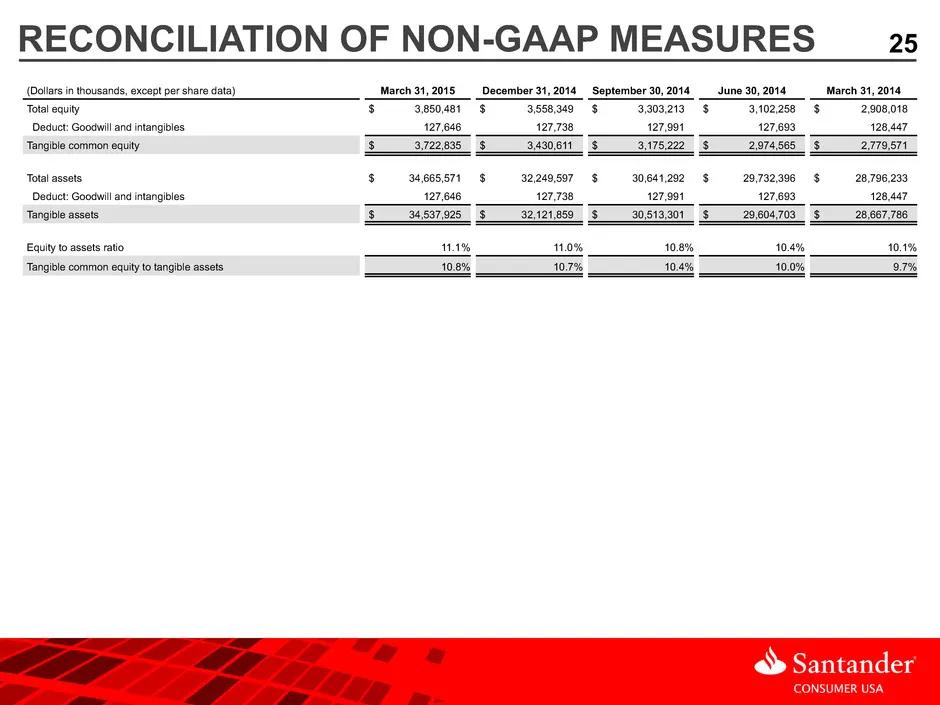
Slide 25: Reconciliation of Non-GAAP Measures
25RECONCILIATION OF NON-GAAP MEASURES (Dollars in thousands, except per share data) March 31, 2015 December 31, 2014 September 30, 2014 June 30, 2014 March 31, 2014 Total equity $ 3,850,481 $ 3,558,349 $ 3,303,213 $ 3,102,258 $ 2,908,018 Deduct: Goodwill and intangibles 127,646 127,738 127,991 127,6
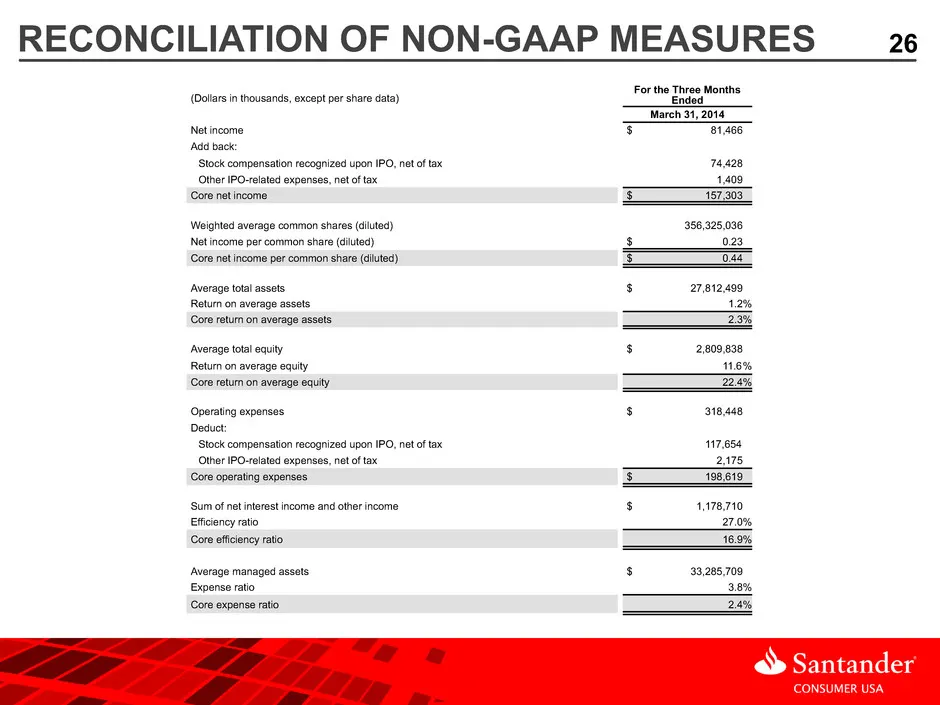
Slide 26: Reconciliation of Non-GAAP Measures (Q1 2014)
26 (Dollars in thousands, except per share data) For the Three Months Ended March 31, 2014 Net income $ 81,466 Add back: Stock compensation recognized upon IPO, net of tax 74,428 Other IPO-related expenses, net of tax 1,409 Core net income $ 157,303 Weighted average common shares (diluted) 356,325,0
Slide 27: Santander Consumer USA
> Santander CONSUMER USA
Source: SEC EDGAR · 8-K filed Apr 28, 2015
More decks from Santander Consumer USA Holdings Inc
 Q3 2021 Earnings Presentation24 slides · Oct 27, 2021
 Q2 2021 Earnings Presentation24 slides · Jul 28, 2021
 Q1 2021 Earnings Presentation24 slides · Apr 28, 2021
 FY2020 Earnings Presentation28 slides · Feb 3, 2021
 Q3 2020 Earnings Presentation25 slides · Oct 28, 2020
 Q2 2020 Earnings Presentation26 slides · Jul 29, 2020