Santander Consumer USA Holdings Inc
Santander Consumer USA — Q2 2020 Earnings Presentation
26 slides from Santander Consumer USA's earnings presentation, Jul 29, 2020
Slide 1: Second Quarter 2020
Exhibit 99.2 Second Quarter 2020 July 29, 2020
Slide 2: Forward-Looking Statements
Forward-Looking Statements statements in this press release and/or our financial performance to differ IMPORTANT materially from that suggested by the forward-looking statements are (a) the adverse impact of COVID-19 on our business, financial condition, liquidity and results of operations; (b) cont
Slide 3: SC's COVID-19 Relief Efforts
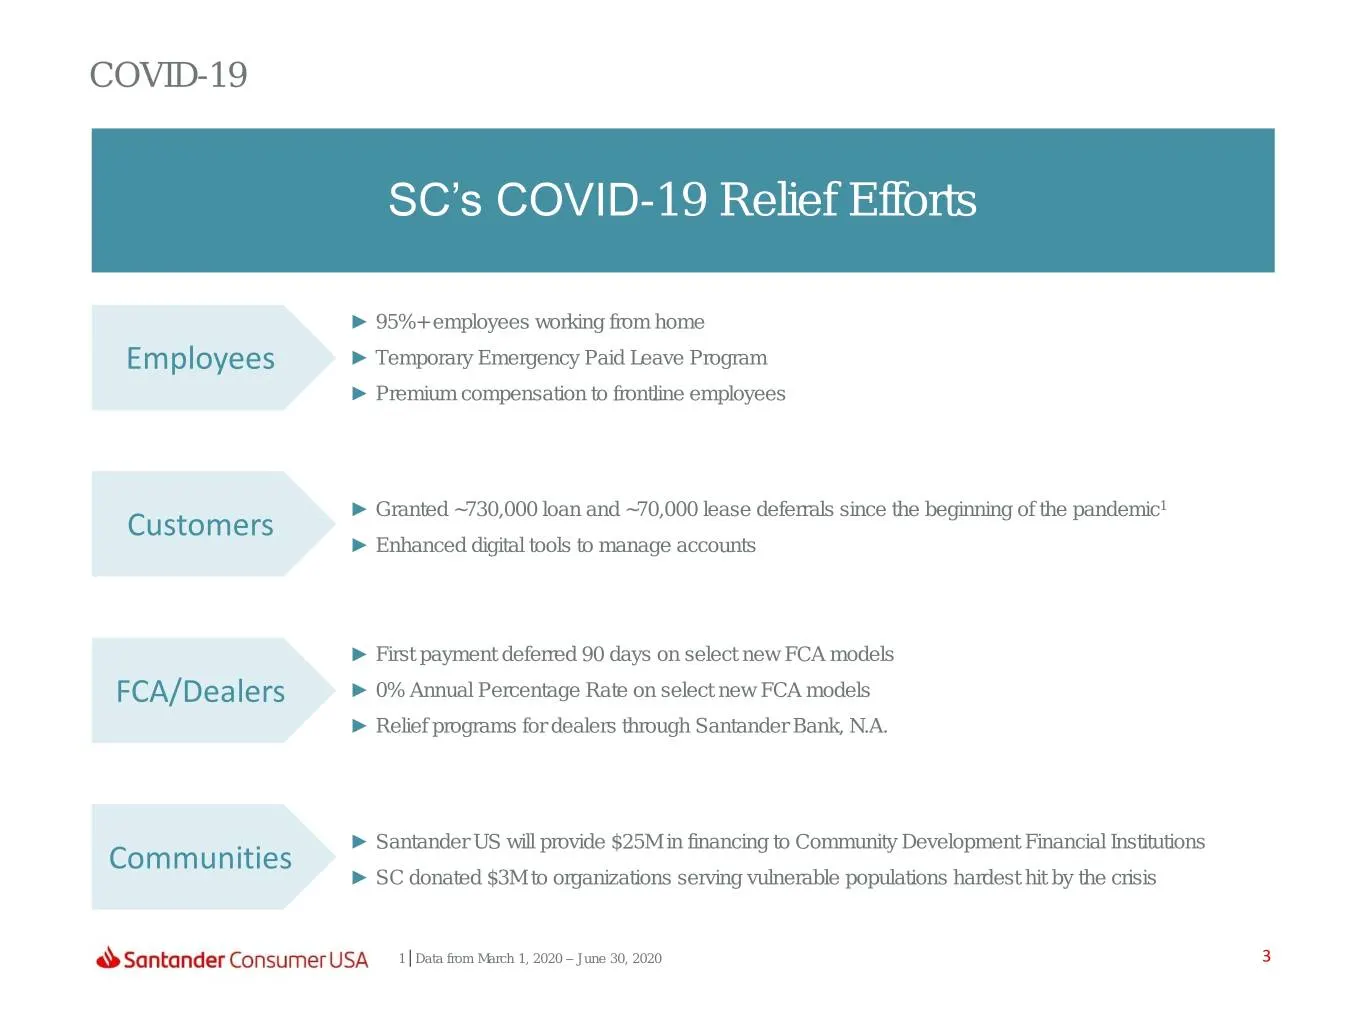
COVID-19 SC’s COVID-19 Relief Efforts ► 95%+ employees working from home Employees ► Temporary Emergency Paid Leave Program ► Premium compensation to frontline employees 1 Customers ► Granted ~730,000 loan and ~70,000 lease deferrals since the beginning of the pandemic ► Enhanced digital tools to ma
Slide 4: Earnings Highlights
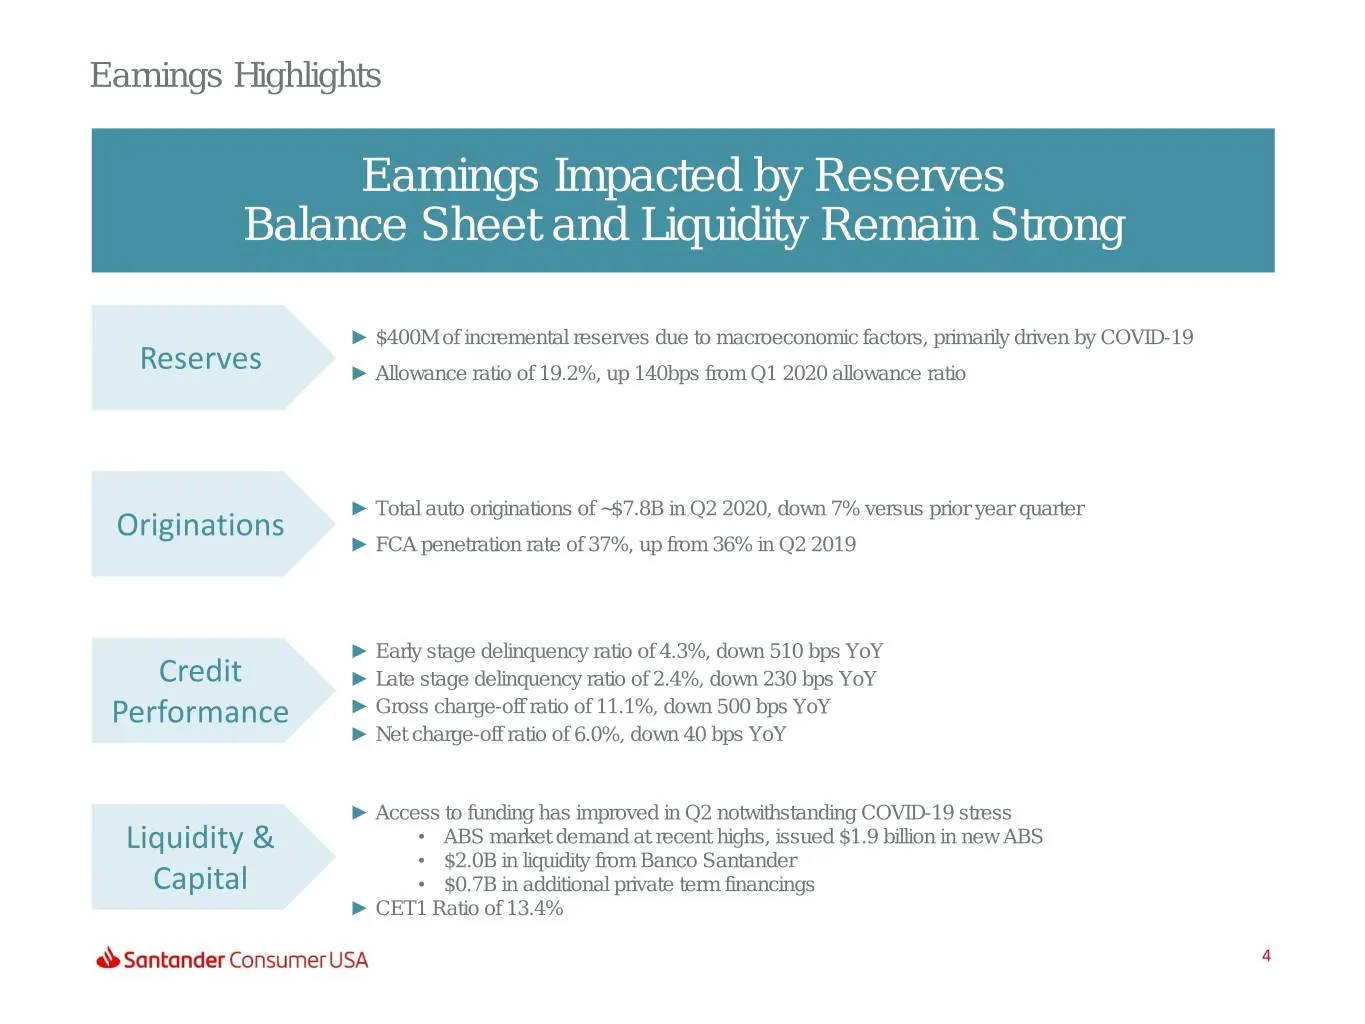
Earnings Highlights Earnings Impacted by Reserves Balance Sheet and Liquidity Remain Strong ► $400M of incremental reserves due to macroeconomic factors, primarily driven by COVID-19 Reserves ► Allowance ratio of 19.2%, up 140bps from Q1 2020 allowance ratio ► Total auto originations of ~$7.8B in Q2
Slide 5: Economic Indicators
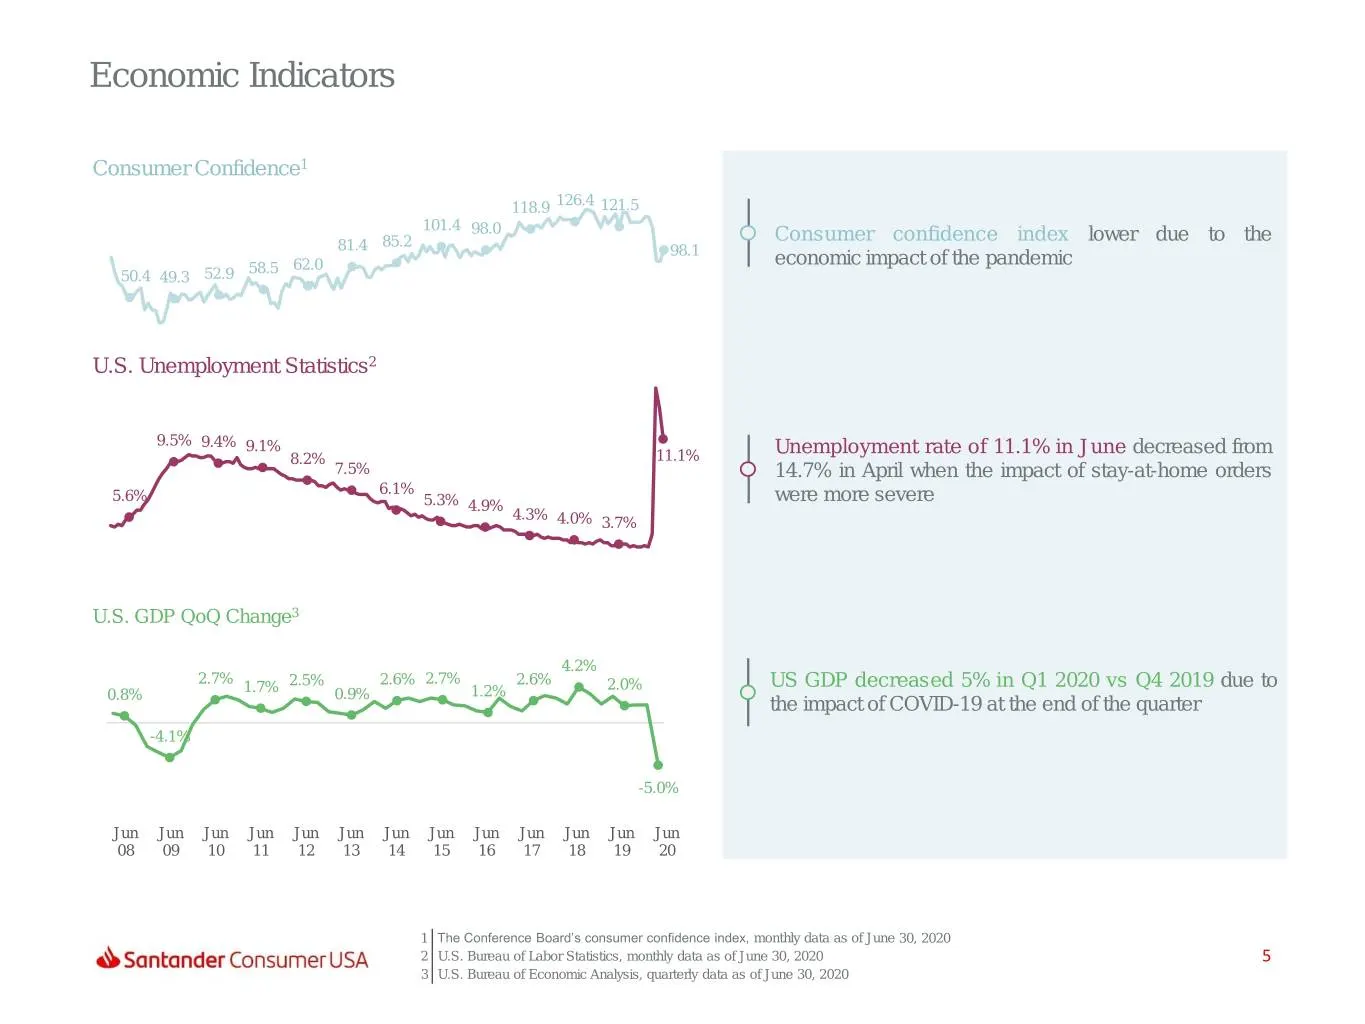
Economic Indicators Consumer Confidence1 118.9 126.4 121.5 101.4 98.0 Consumer confidence index lower due to the 81.4 85.2 98.1 economic impact of the pandemic 58.5 62.0 50.4 49.3 52.9 U.S. Unemployment Statistics2 9.5% 9.4% 9.1% Unemployment rate of 11.1% in June decreased from 8.2% 11.1% 7.5% 14.7
Slide 6: Auto Industry Overview
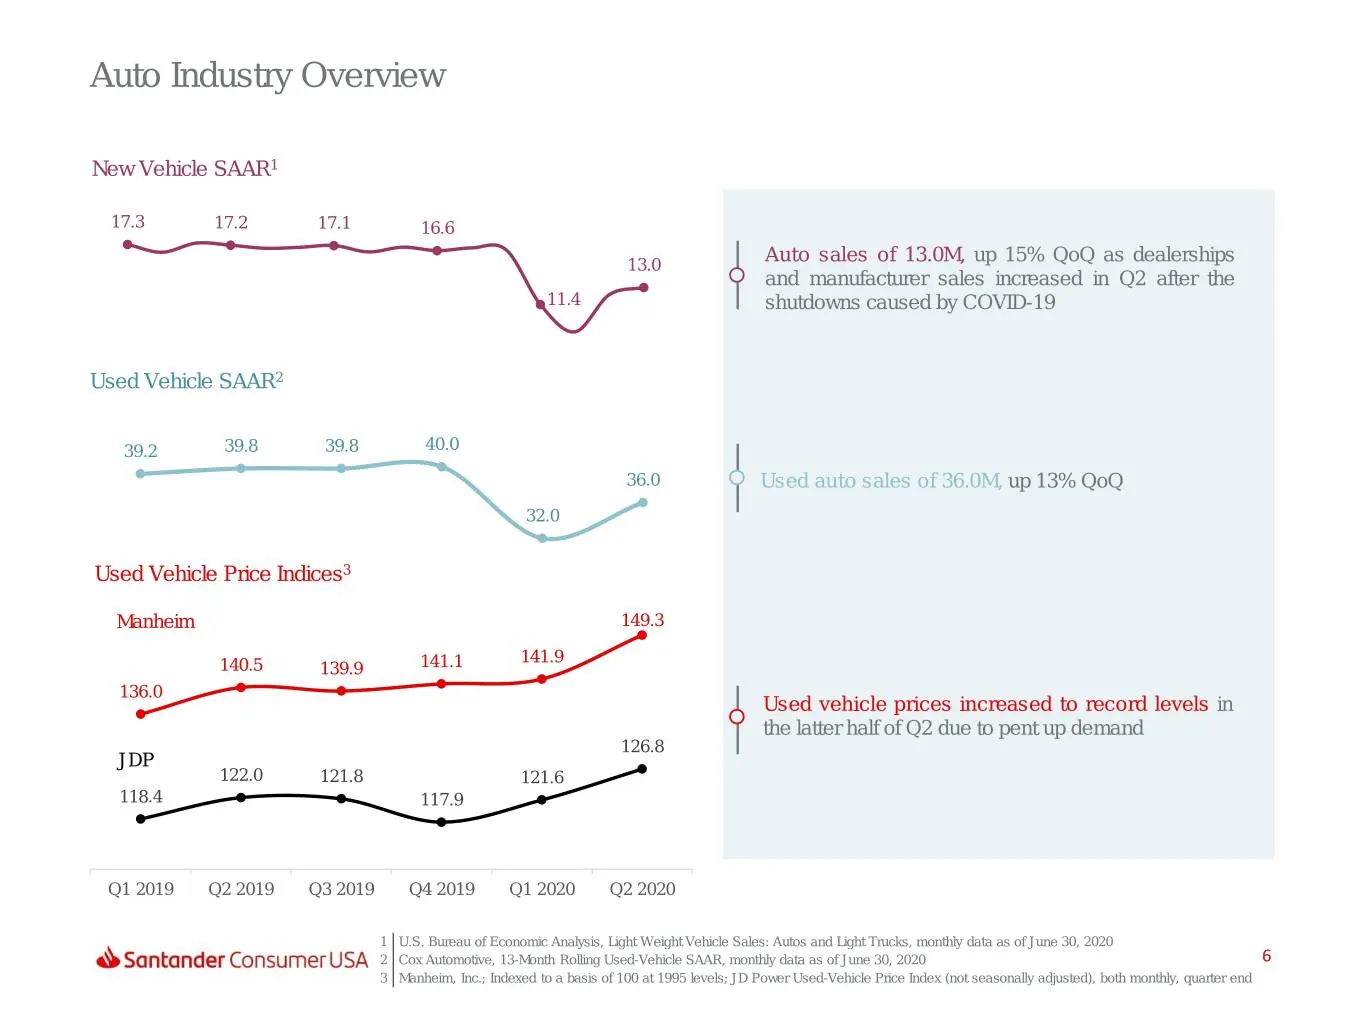
Auto Industry Overview New Vehicle SAAR1 17.3 17.2 17.1 16.6 Auto sales of 13.0M, up 15% QoQ as dealerships 13.0 and manufacturer sales increased in Q2 after the 11.4 shutdowns caused by COVID-19 Used Vehicle SAAR2 39.2 39.8 39.8 40.0 36.0 Used auto sales of 36.0M, up 13% QoQ 32.0 Used Vehicle Price
Slide 7: Quarterly Originations
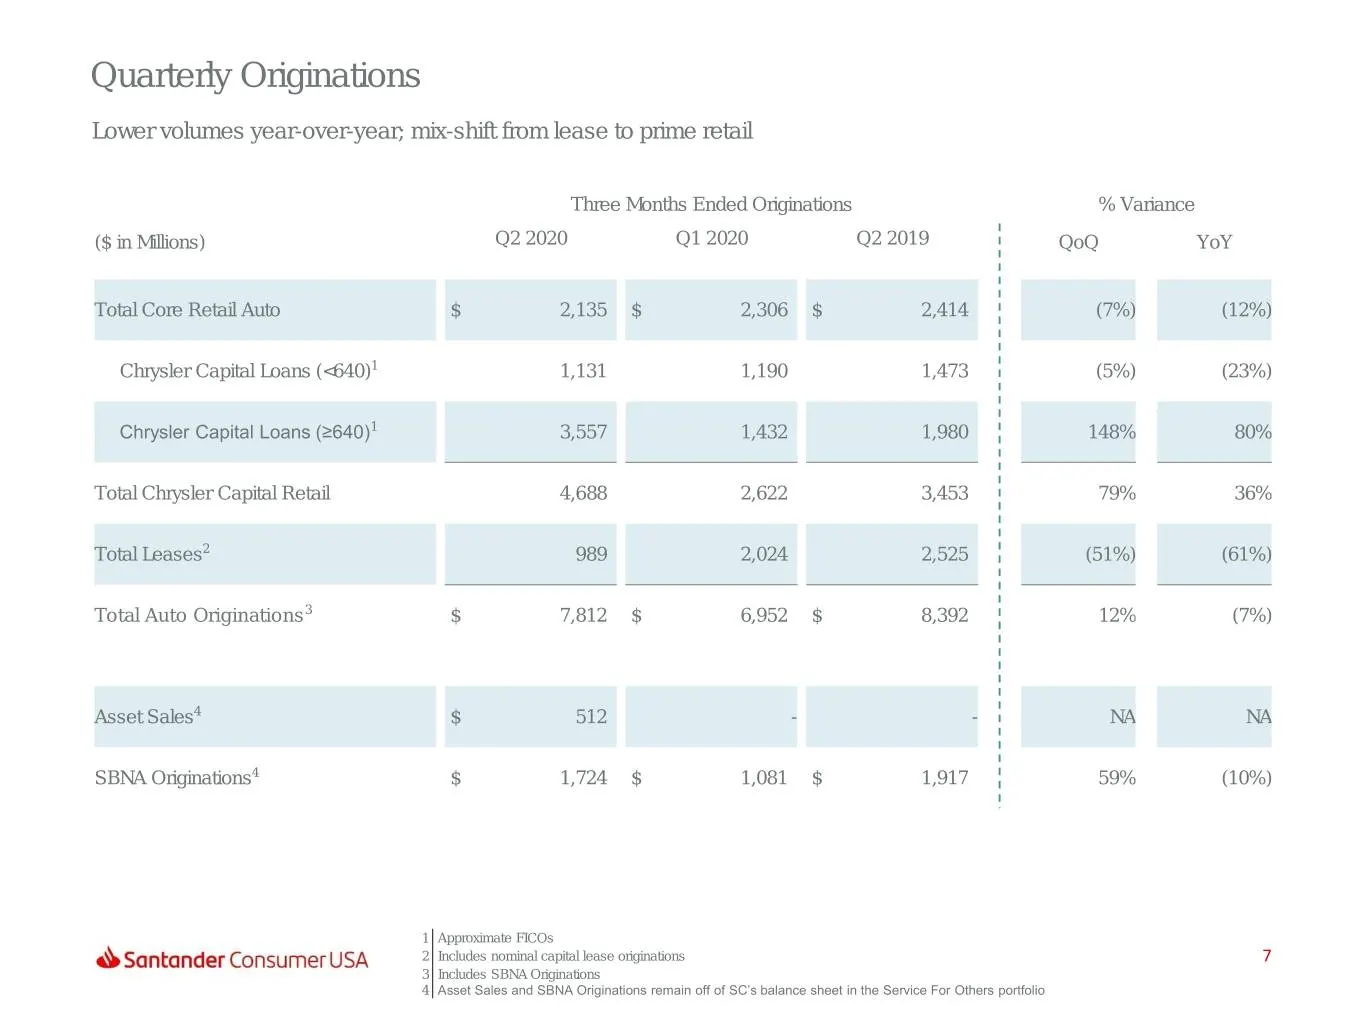
Quarterly Originations Lower volumes year-over-year; mix-shift from lease to prime retail Three Months Ended Originations % Variance ($ in Millions) Q2 2020 Q1 2020 Q2 2019 QoQ YoY Total Core Retail Auto $ 2,135 $ 2,306 $ 2,414 (7%) (12%) Chrysler Capital Loans (<640)1 1,131 1,190 1,473 (5%) (23%) C
Slide 8: Year-to-Date Monthly Originations
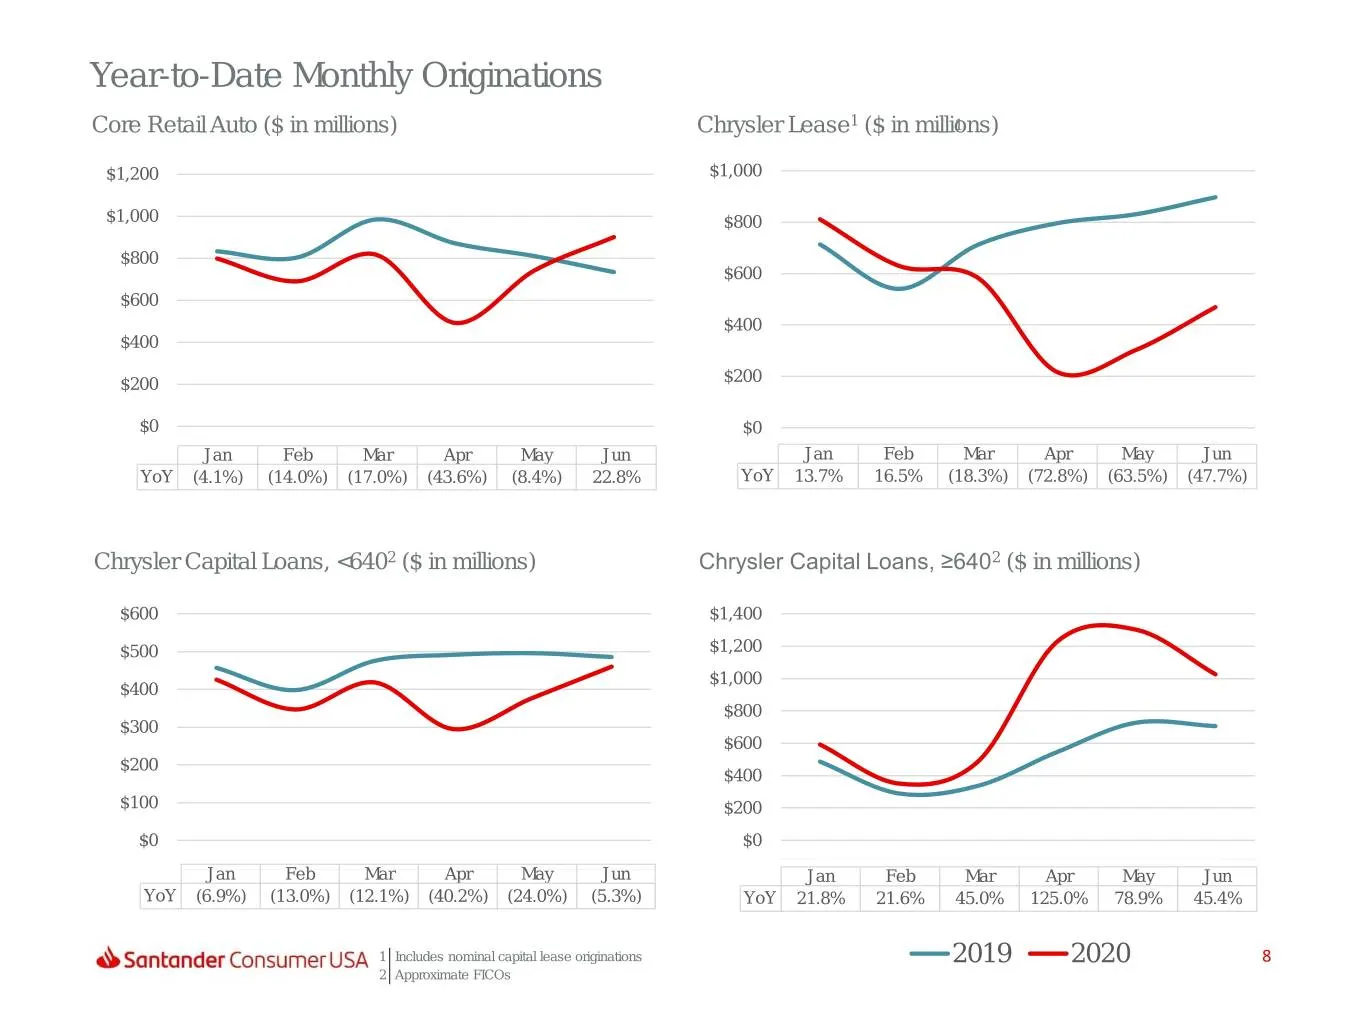
Year-to-Date Monthly Originations Core Retail Auto ($ in millions) Chrysler Lease1 ($ in millions)1 60.0% $1,200 60.0% $1,000 55.0% $1,000 55.0% $800 $800 50.0% 50.0% $600 $600 45.0% 45.0% $400 $400 40.0% 40.0% $200 $200 35.0% 35.0% $0 30.0% $0 30.0% Jan Feb Mar Apr May Jun Jan Feb Mar Apr May Jun Y
Slide 9: Fiat Chrysler (FCA) Relationship
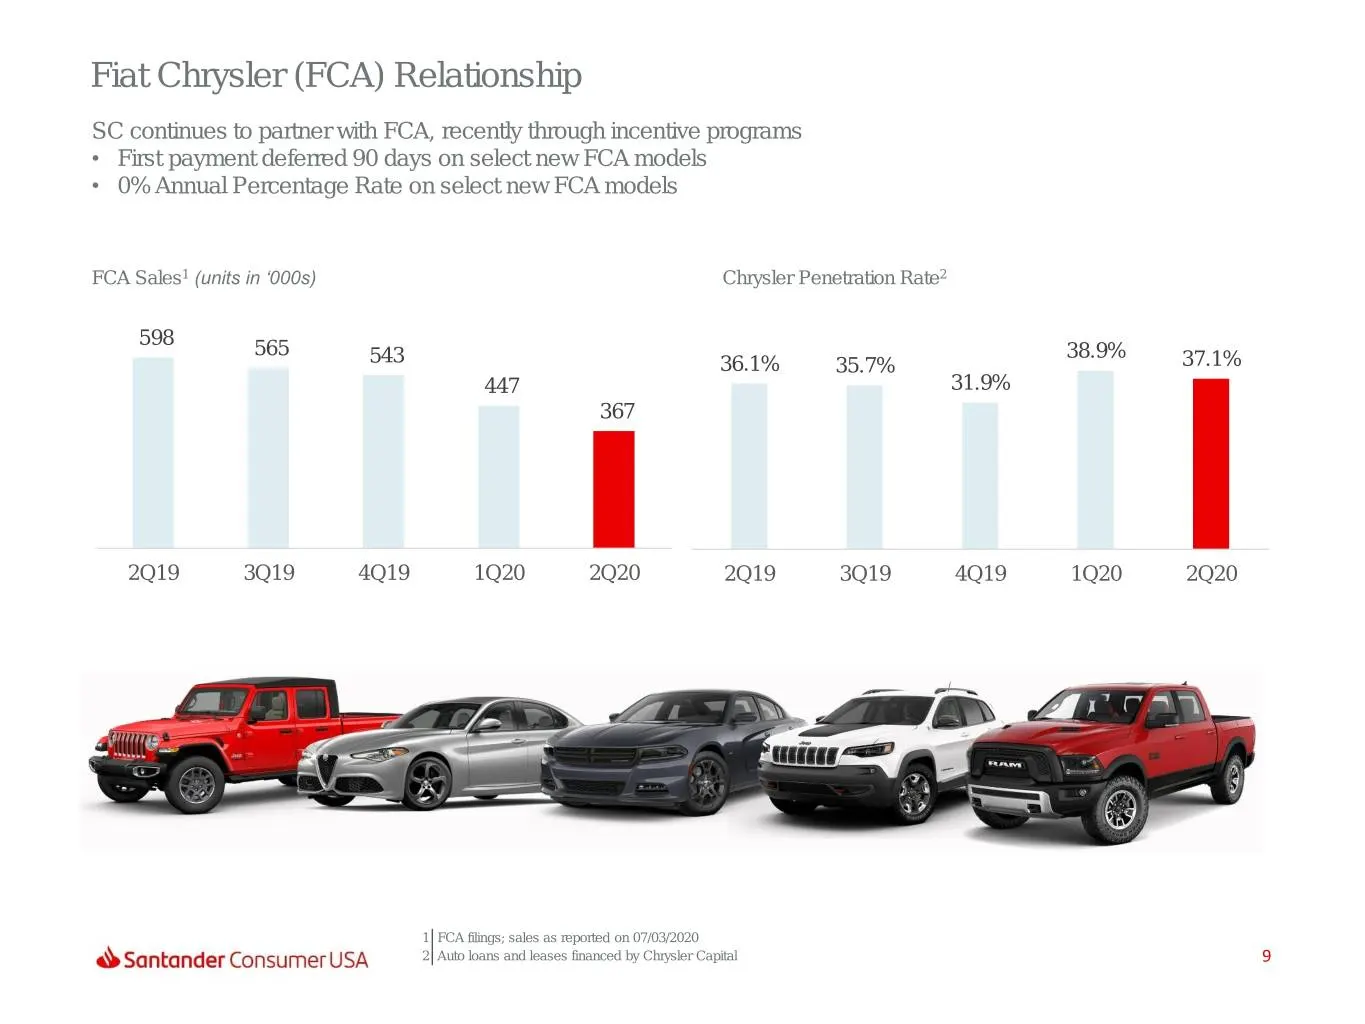
Fiat Chrysler (FCA) Relationship SC continues to partner with FCA, recently through incentive programs • First payment deferred 90 days on select new FCA models • 0% Annual Percentage Rate on select new FCA models FCA Sales1 (units in ‘000s) Chrysler Penetration Rate2 598 565 38.9% 543 36.1% 35.7% 3
Slide 10: Serviced for Others (SFO) Platform
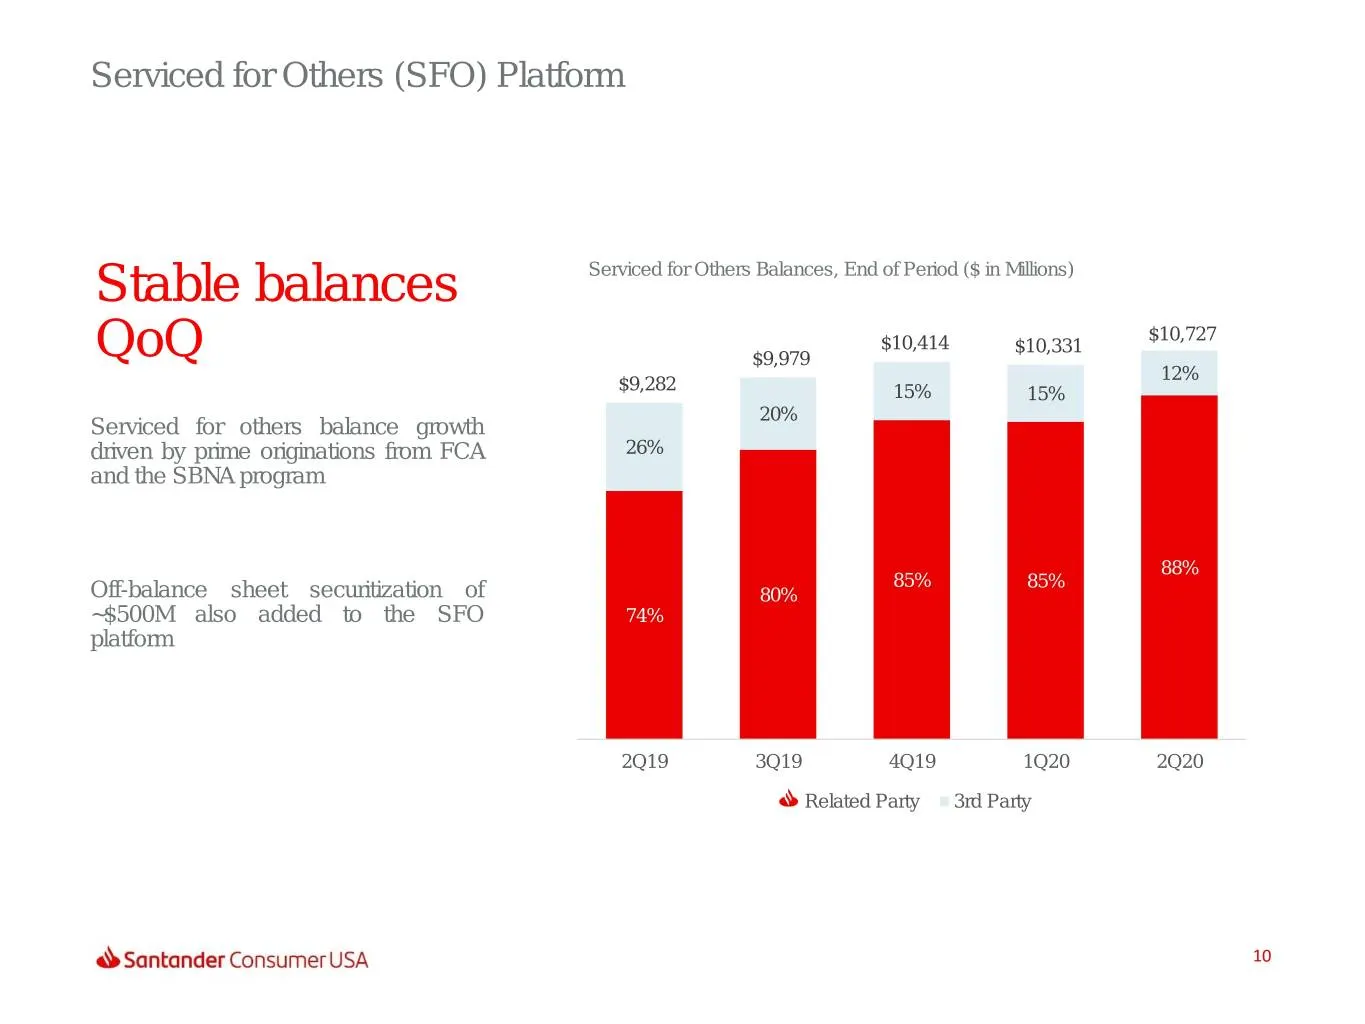
Serviced for Others (SFO) Platform Stable balances Serviced for Others Balances, End of Period ($ in Millions) $10,727 $10,414 $10,331 QoQ $9,979 12% $9,282 15% 15% 20% Serviced for others balance growth driven by prime originations from FCA 26% and the SBNA program 88% 85% 85% Off-balance sheet sec
Slide 11: Diversified Funding and Liquidity
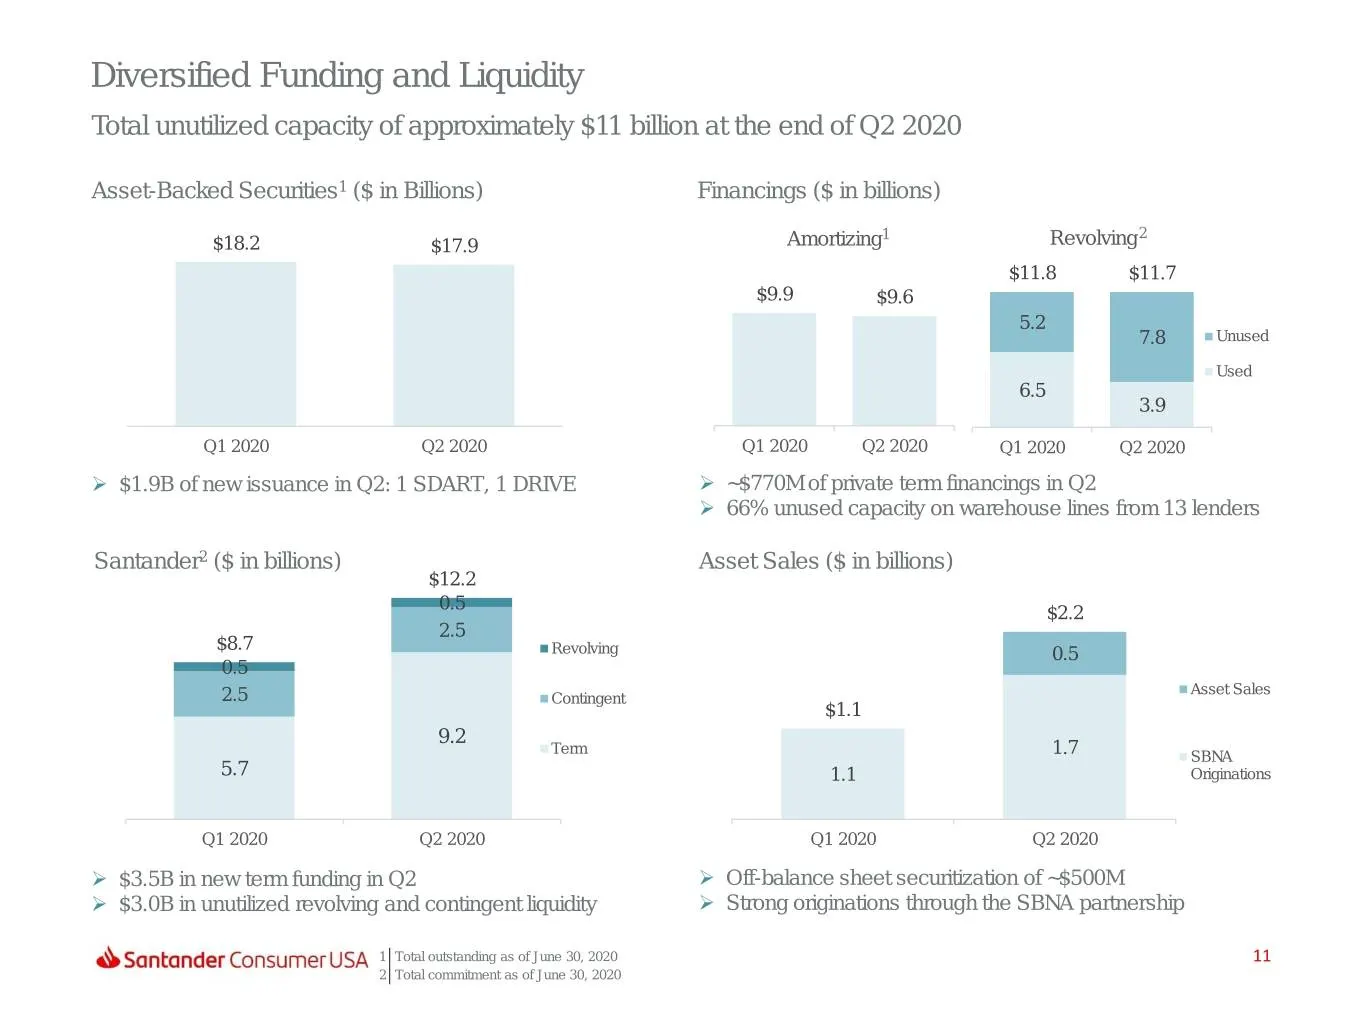
Diversified Funding and Liquidity Total unutilized capacity of approximately $11 billion at the end of Q2 2020 Asset-Backed Securities1 ($ in Billions) Financings ($ in billions) 1 2 $18.2 $17.9 Amortizing Revolving $11.8 $11.7 $9.9 $9.6 5.2 7.8 Unused Used 6.5 3.9 Q1 2020 Q2 2020 Q1 2020 Q2 2020 Q1
Slide 12: Q2 2020 Financial Results
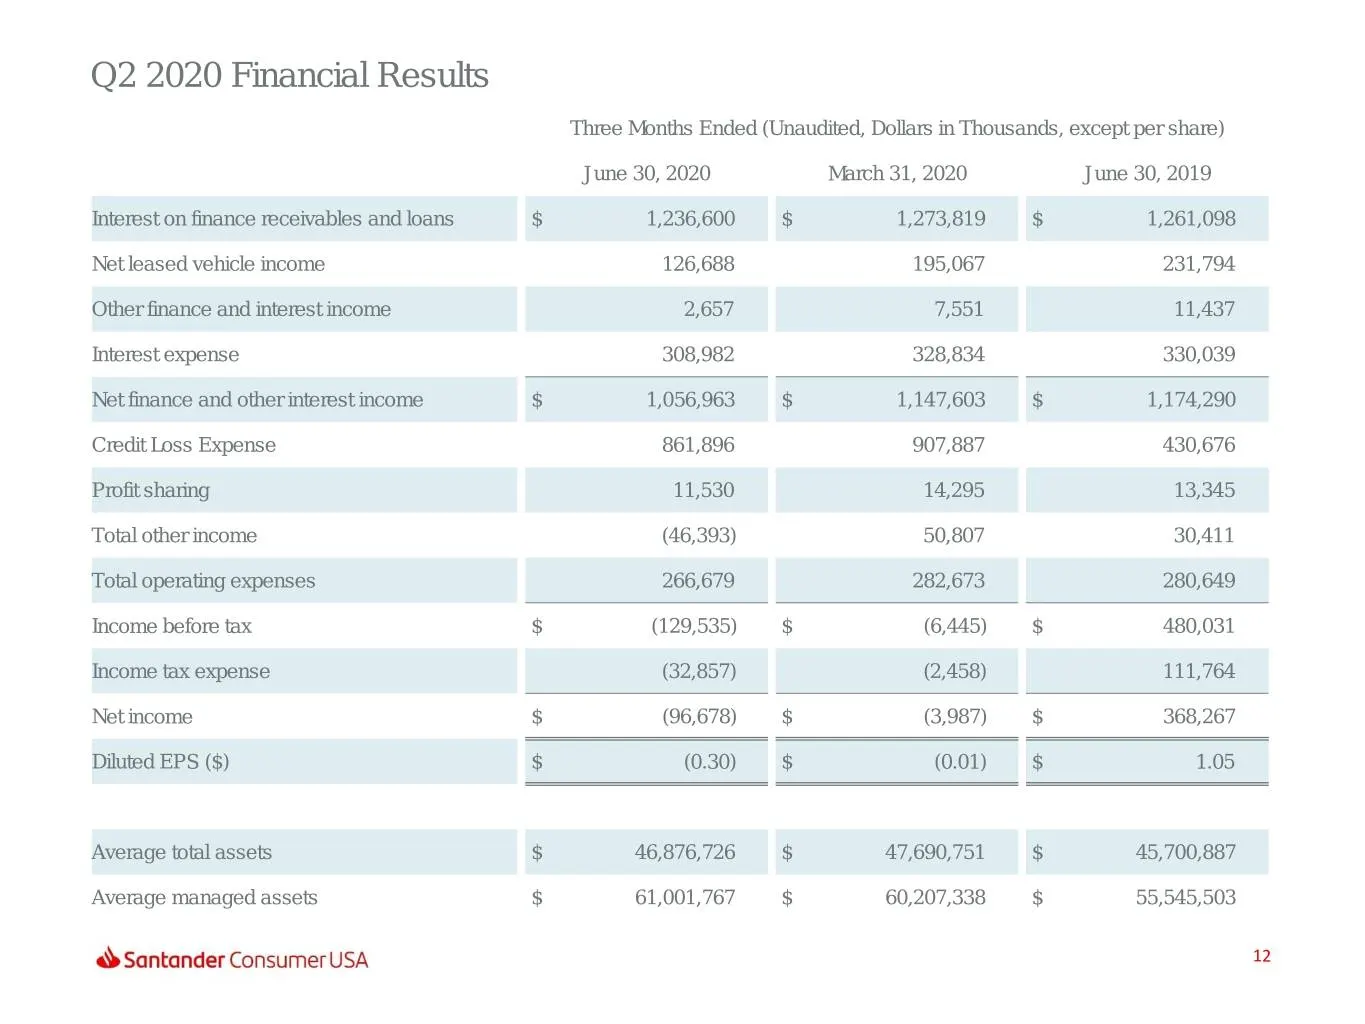
Q2 2020 Financial Results Three Months Ended (Unaudited, Dollars in Thousands, except per share) June 30, 2020 March 31, 2020 June 30, 2019 Interest on finance receivables and loans $ 1,236,600 $ 1,273,819 $ 1,261,098 Net leased vehicle income 126,688 195,067 231,794 Other finance and interest incom
Slide 13: Customer Relief Loan Deferrals
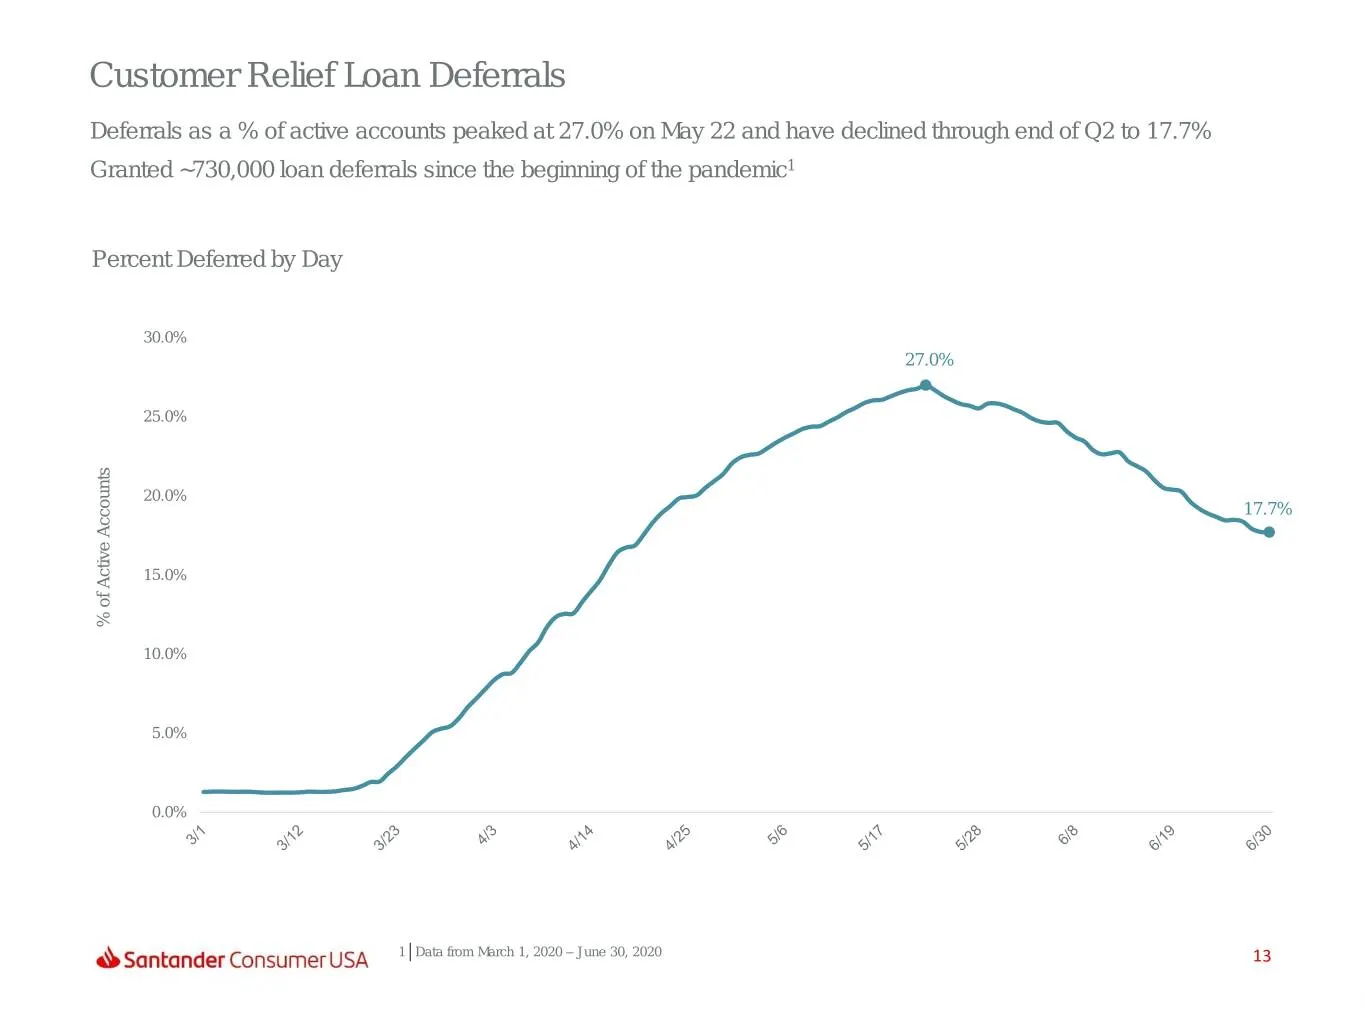
Customer Relief Loan Deferrals Deferrals as a % of active accounts peaked at 27.0% on May 22 and have declined through end of Q2 to 17.7% Granted ~730,000 loan deferrals since the beginning of the pandemic1 Percent Deferred by Day 30.0% 27.0% 25.0% 20.0% 17.7% 15.0% % of Active Accountsof Active % 1
Slide 14: Delinquency & Loss (Quarterly)
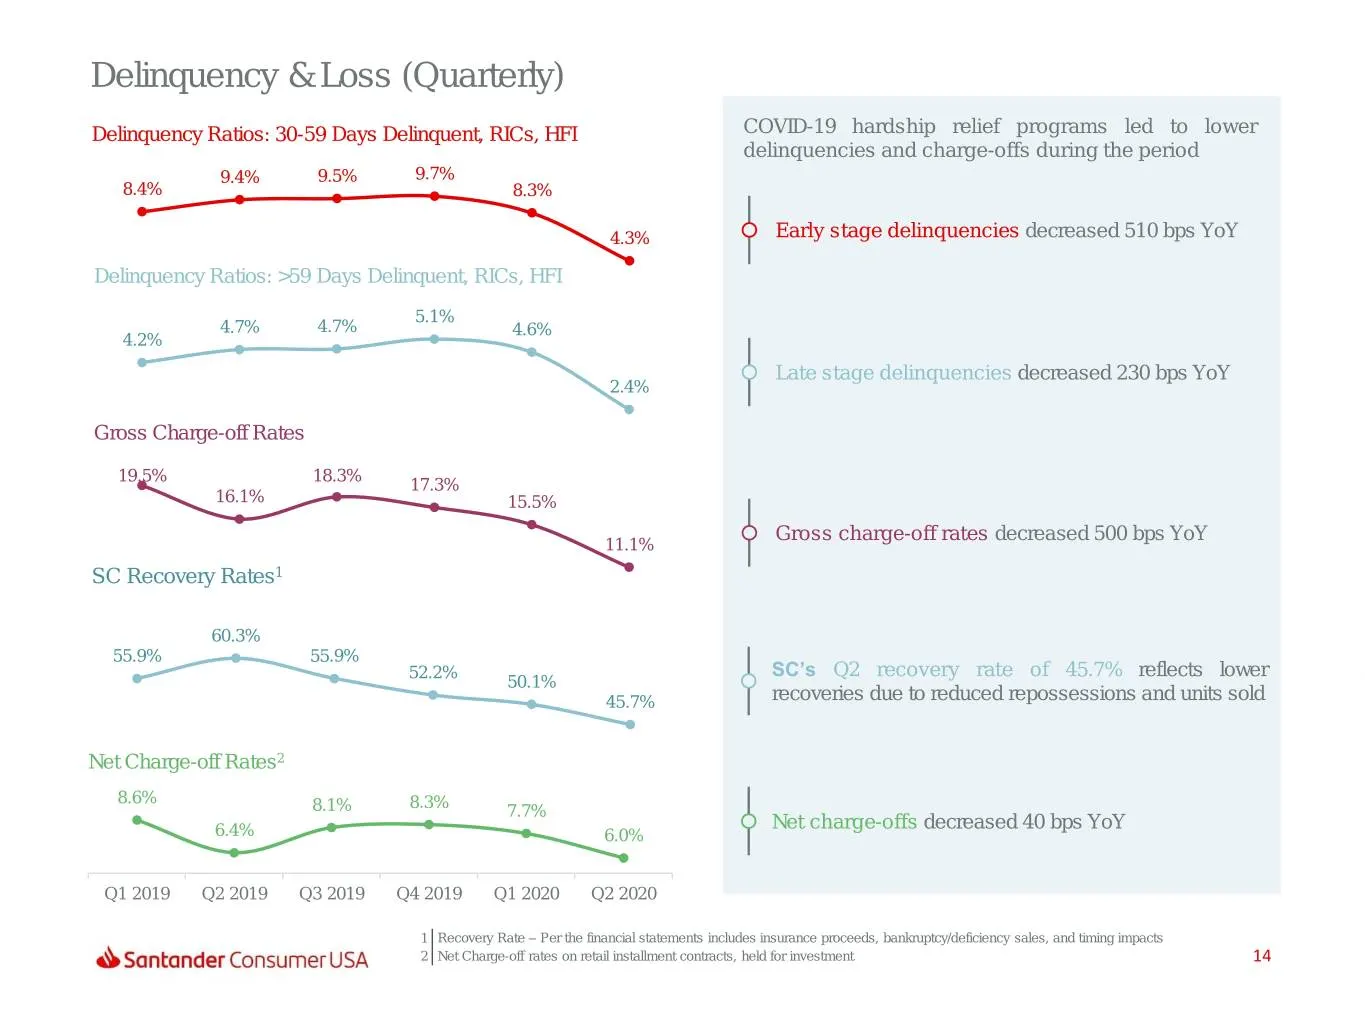
Delinquency & Loss (Quarterly) Delinquency Ratios: 30-59 Days Delinquent, RICs, HFI COVID-19 hardship relief programs led to lower delinquencies and charge-offs during the period 9.4% 9.5% 9.7% 8.4% 8.3% 4.3% Early stage delinquencies decreased 510 bps YoY Delinquency Ratios: >59 Days Delinquent, RI
Slide 15: Loss and Recovery Ratios (Annualized)
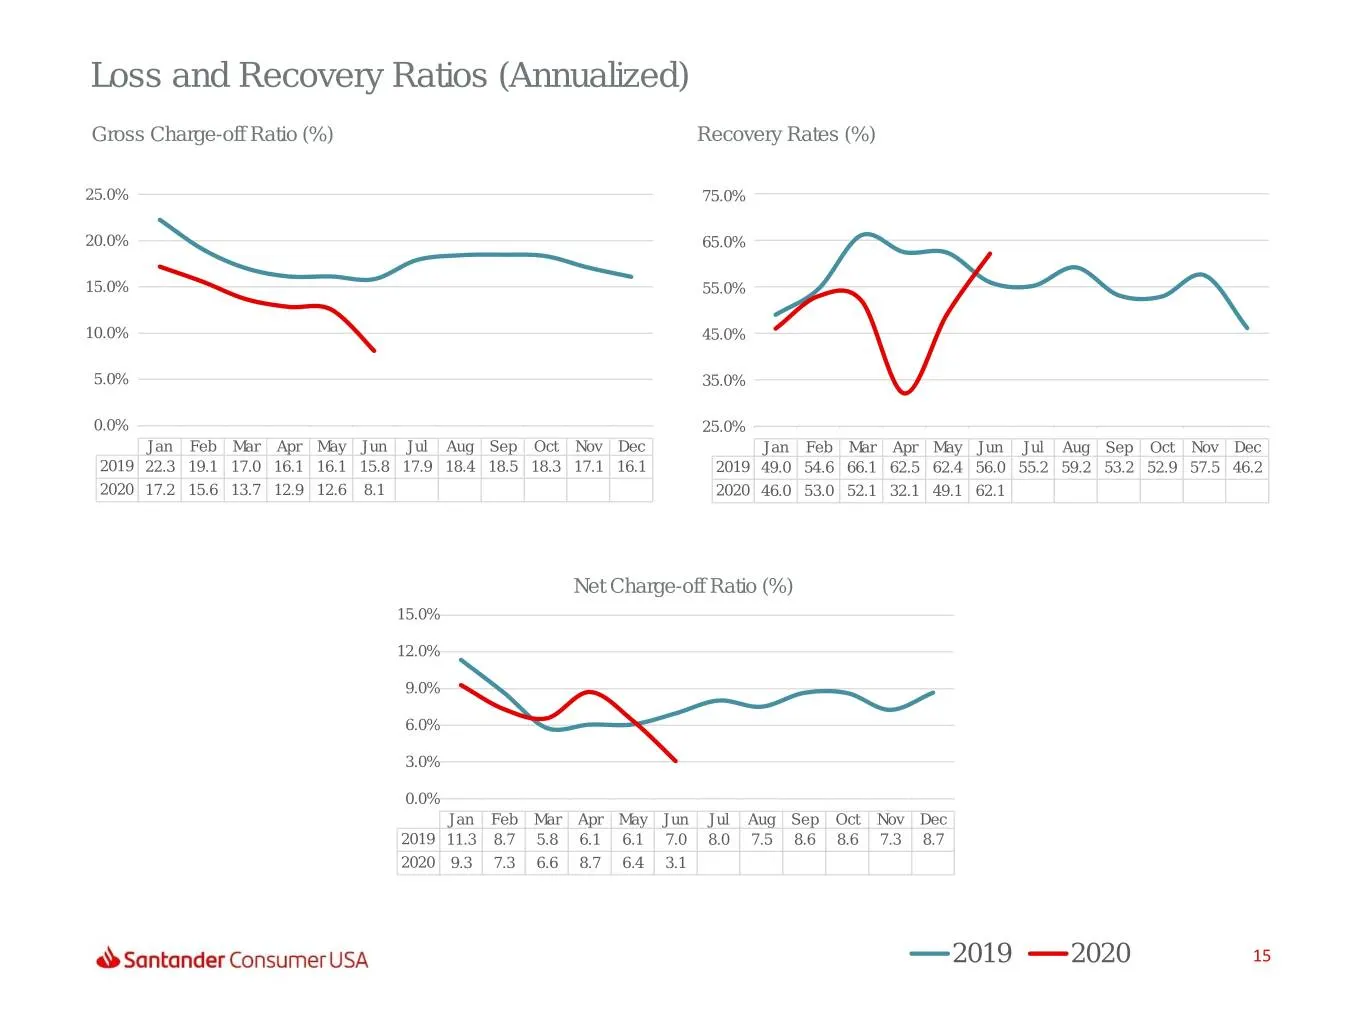
Loss and Recovery Ratios (Annualized) Gross Charge-off Ratio (%) Recovery Rates (%) 25.0% 75.0% 20.0% 65.0% 15.0% 55.0% 10.0% 45.0% 5.0% 35.0% 0.0% Jan Feb Mar Apr May Jun Jul Aug Sep Oct Nov Dec 25.0% Jan Feb Mar Apr May Jun Jul Aug Sep Oct Nov Dec Jan Feb Mar Apr May Jun Jul Aug Sep Oct Nov Dec Ja
Slide 16: Loss Detail
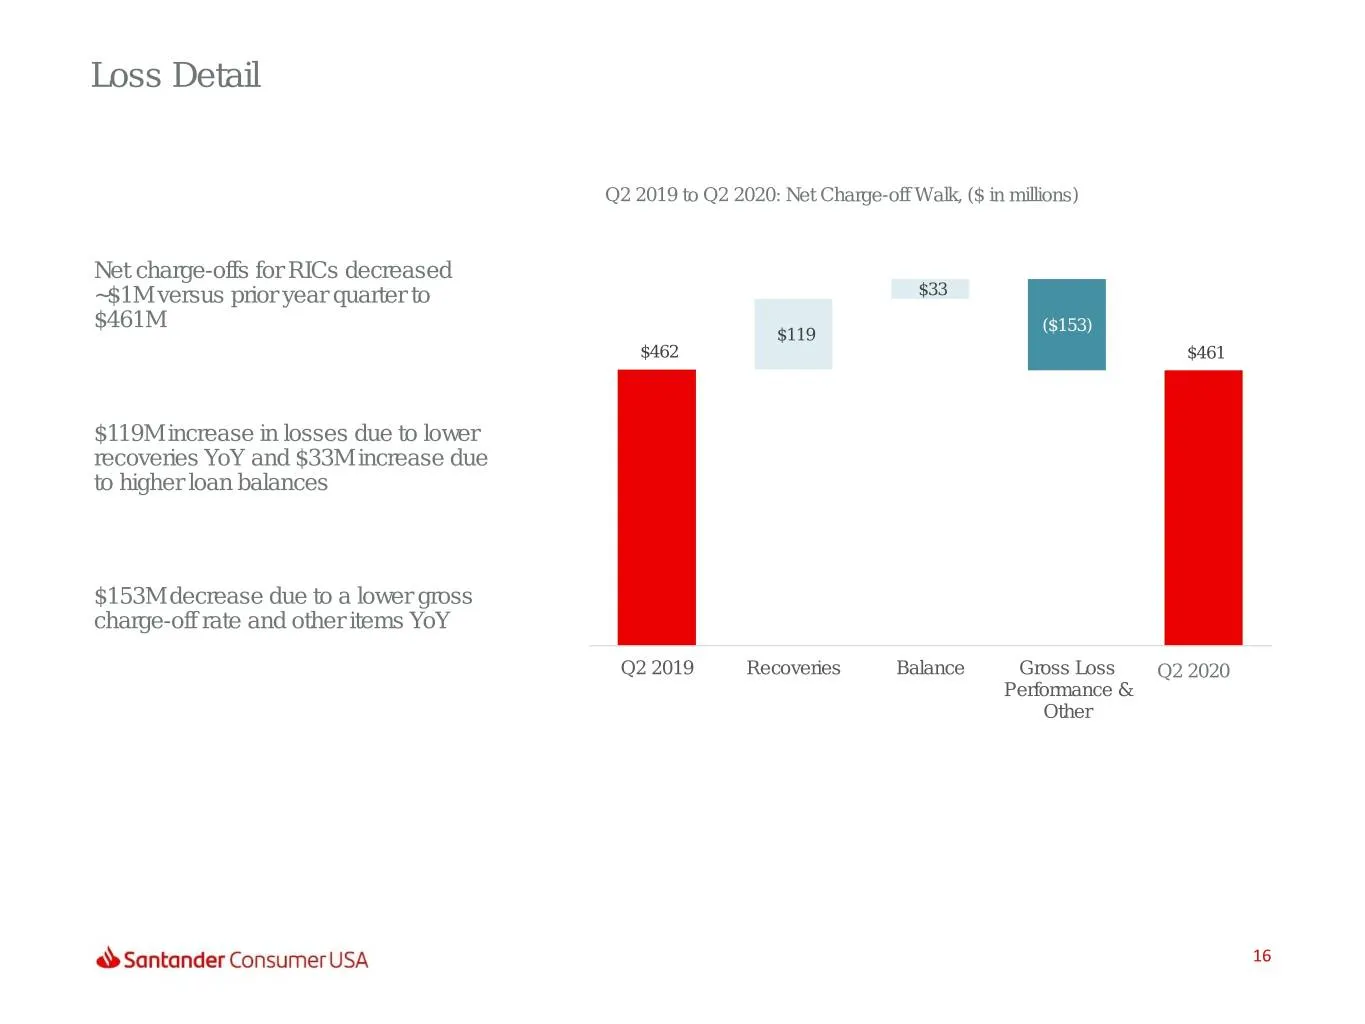
Loss Detail Q2 2019 to Q2 2020: Net Charge-off Walk, ($ in millions) Net charge-offs for RICs decreased ~$1M versus prior year quarter to $33 $461M ($153) $119 $462 $461 $119M increase in losses due to lower recoveries YoY and $33M increase due to higher loan balances $153M decrease due to a lower g
Slide 17: Reserves
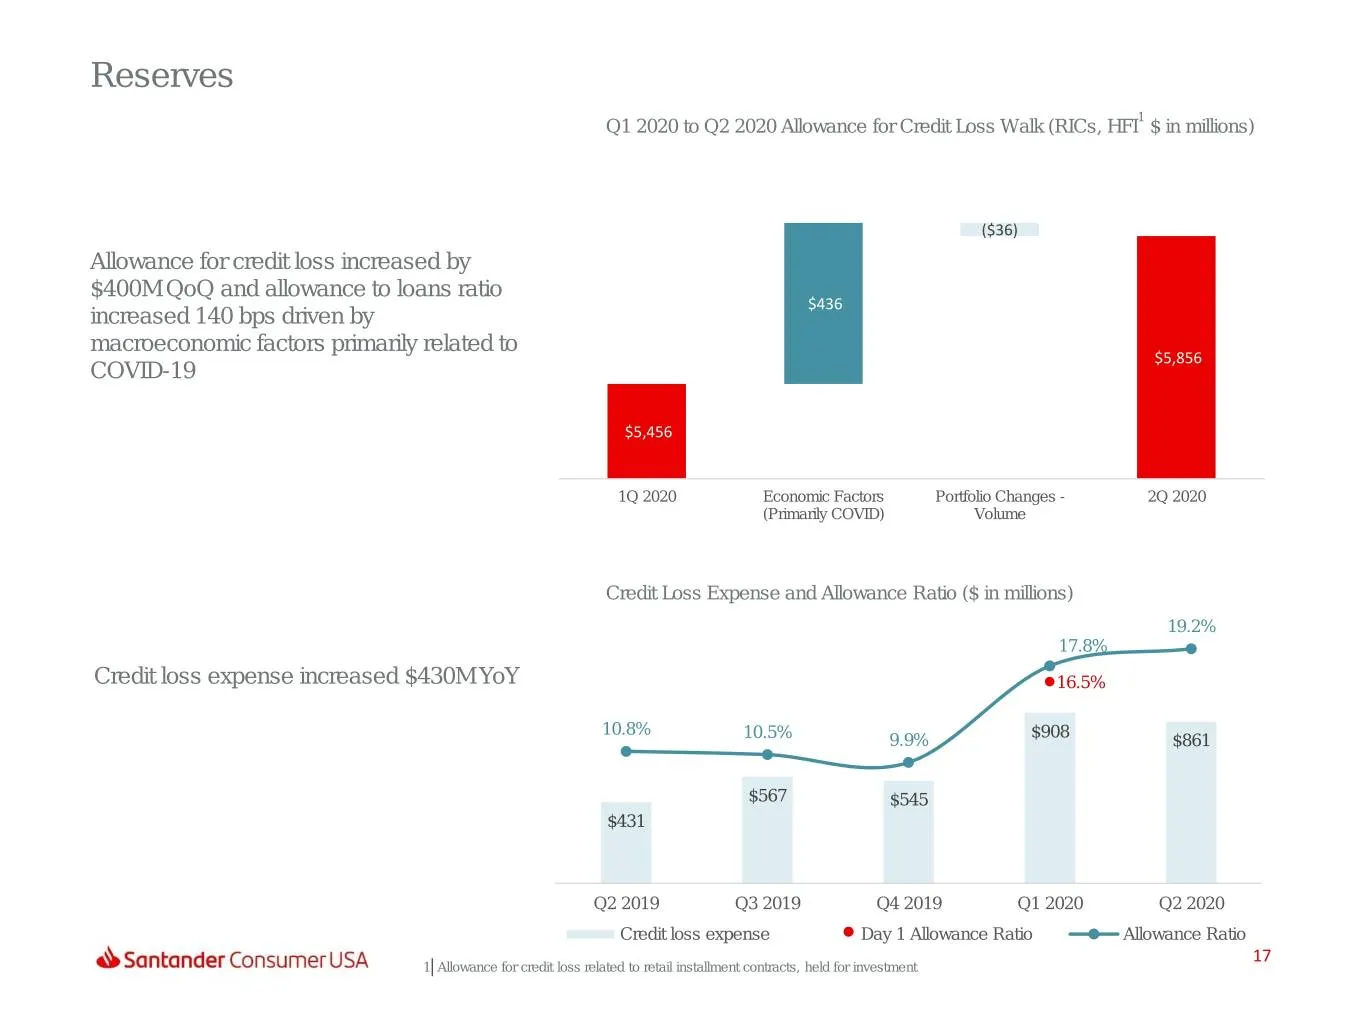
Reserves 1 Q1 2020 to Q2 2020 Allowance for Credit Loss Walk (RICs, HFI $ in millions) ($36) Allowance for credit loss increased by $400M QoQ and allowance to loans ratio $436 increased 140 bps driven by macroeconomic factors primarily related to $5,856 $5,856 COVID-19 $5,456 $5,456 1Q 2020 Economic
Slide 18: Allowance for Credit Loss
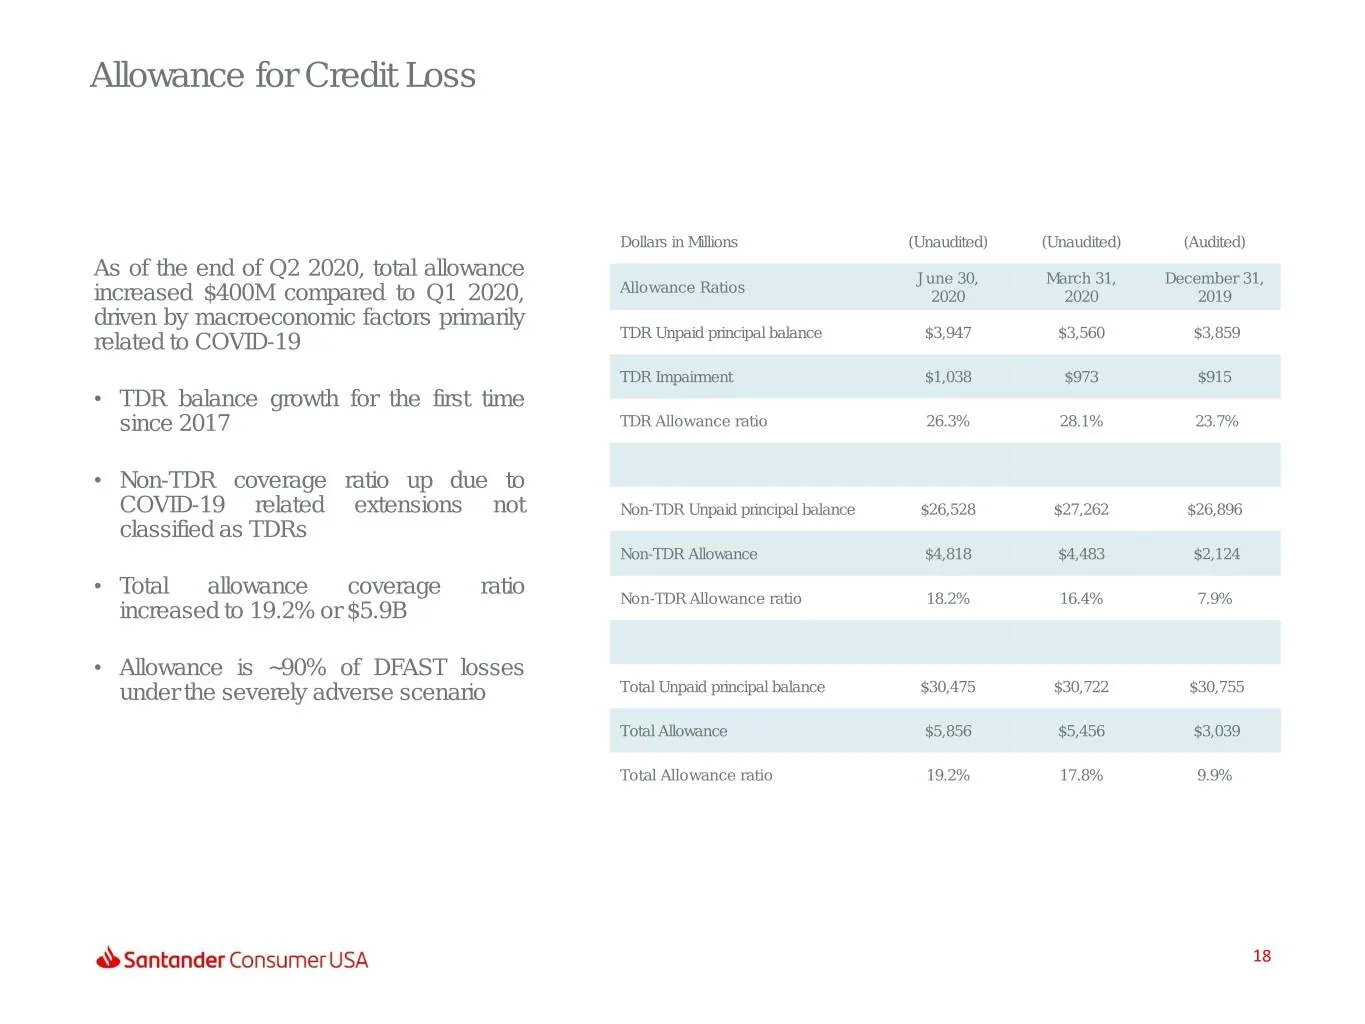
Allowance for Credit Loss Dollars in Millions (Unaudited) (Unaudited) (Audited) As of the end of Q2 2020, total allowance June 30, March 31, December 31, Allowance Ratios increased $400M compared to Q1 2020, 2020 2020 2019 driven by macroeconomic factors primarily related to COVID-19 TDR Unpaid prin
Slide 19: Expense Management
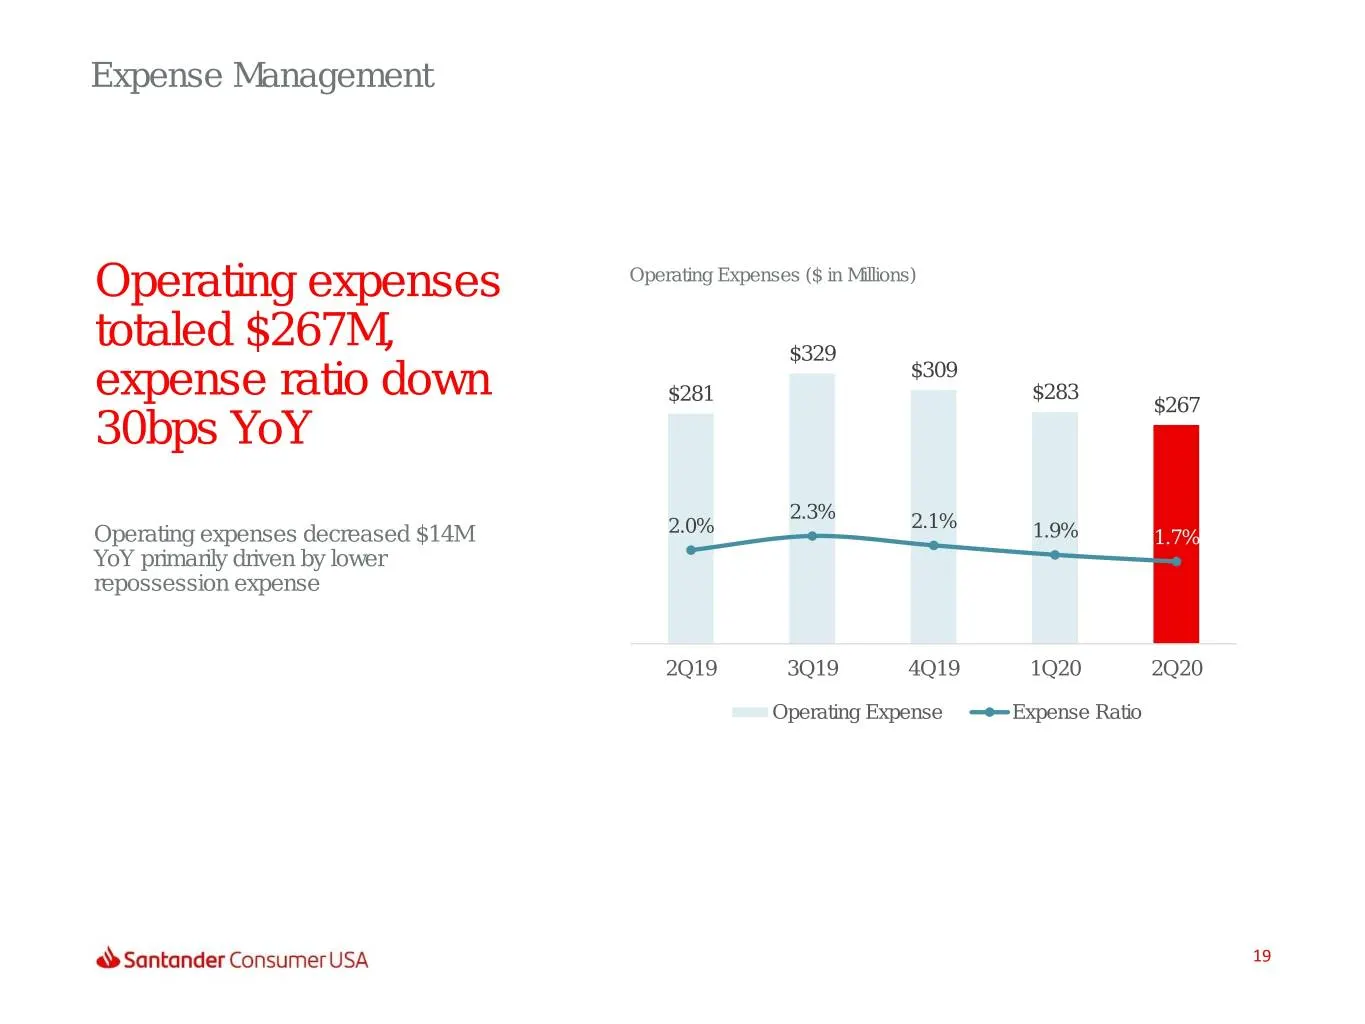
Expense Management Operating expenses Operating Expenses ($ in Millions) totaled $267M, $400 7.0% $350 $329 $309 6.0% expense ratio down $300 $281 $283 $267 5.0% 30bps YoY $250 4.0% $200 2.3% 3.0% $150 2.0% 2.1% Operating expenses decreased $14M 1.9% 1.7% 2.0% YoY primarily driven by lower $100 repo
Slide 20: CET1 Ratio
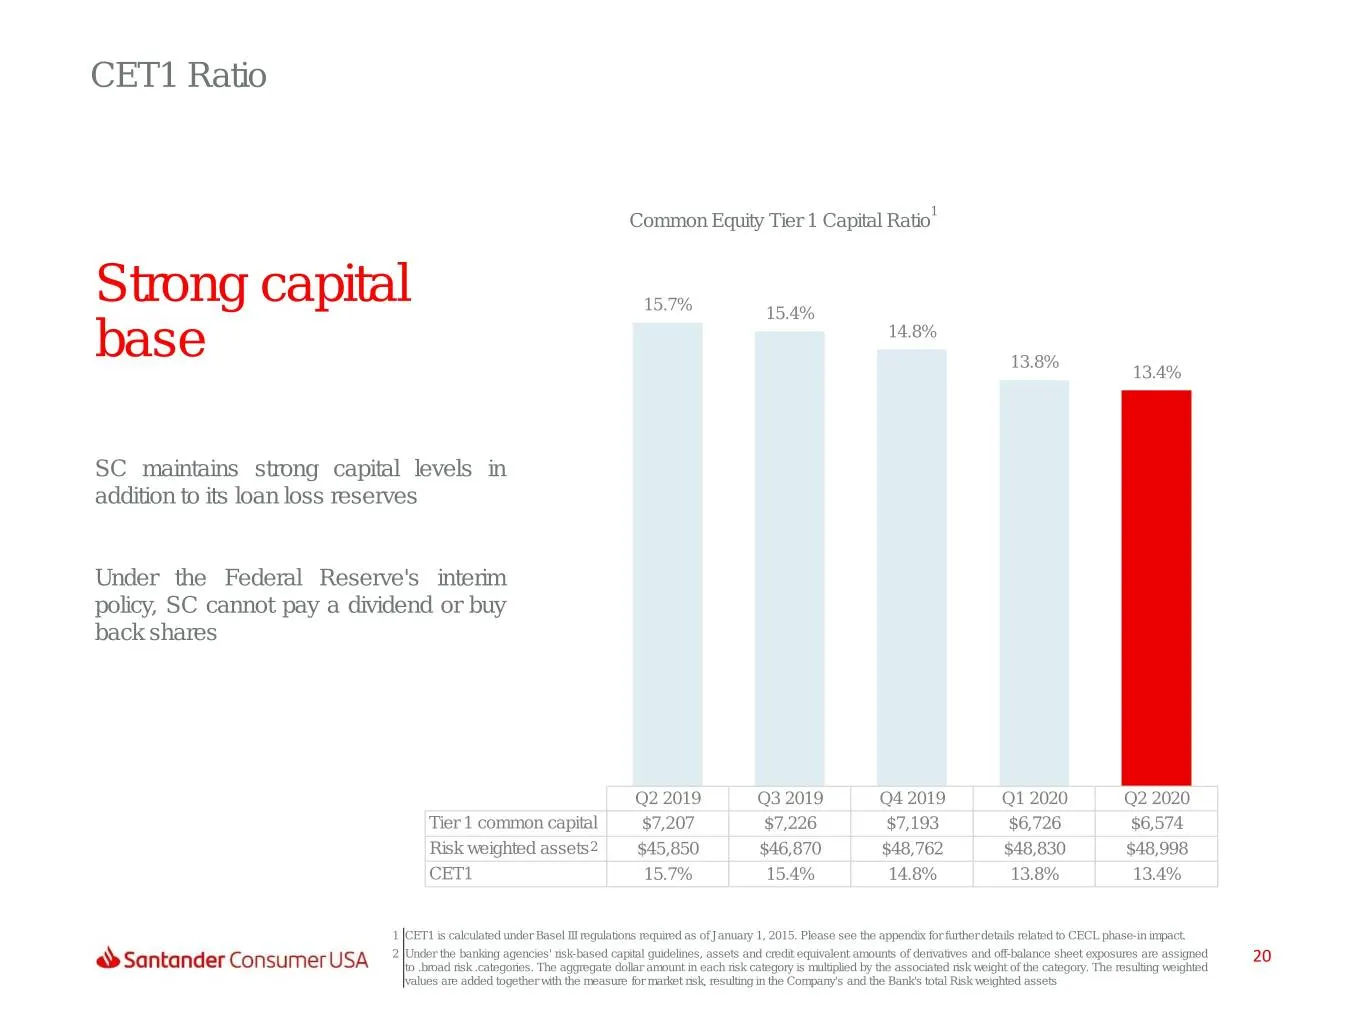
CET1 Ratio 1 Common Equity Tier 1 Capital Ratio $120,000 18.0% Strong capital 15.7% 15.4% 16.0% 14.8% $110,000 base 13.8% 13.4% 14.0% $100,000 12.0% SC maintains strong capital levels in addition to its loan loss reserves 10.0% $90,000 8.0% Under the Federal Reserve's interim policy, SC cannot pay a

Slide 21: Appendix
Appendix
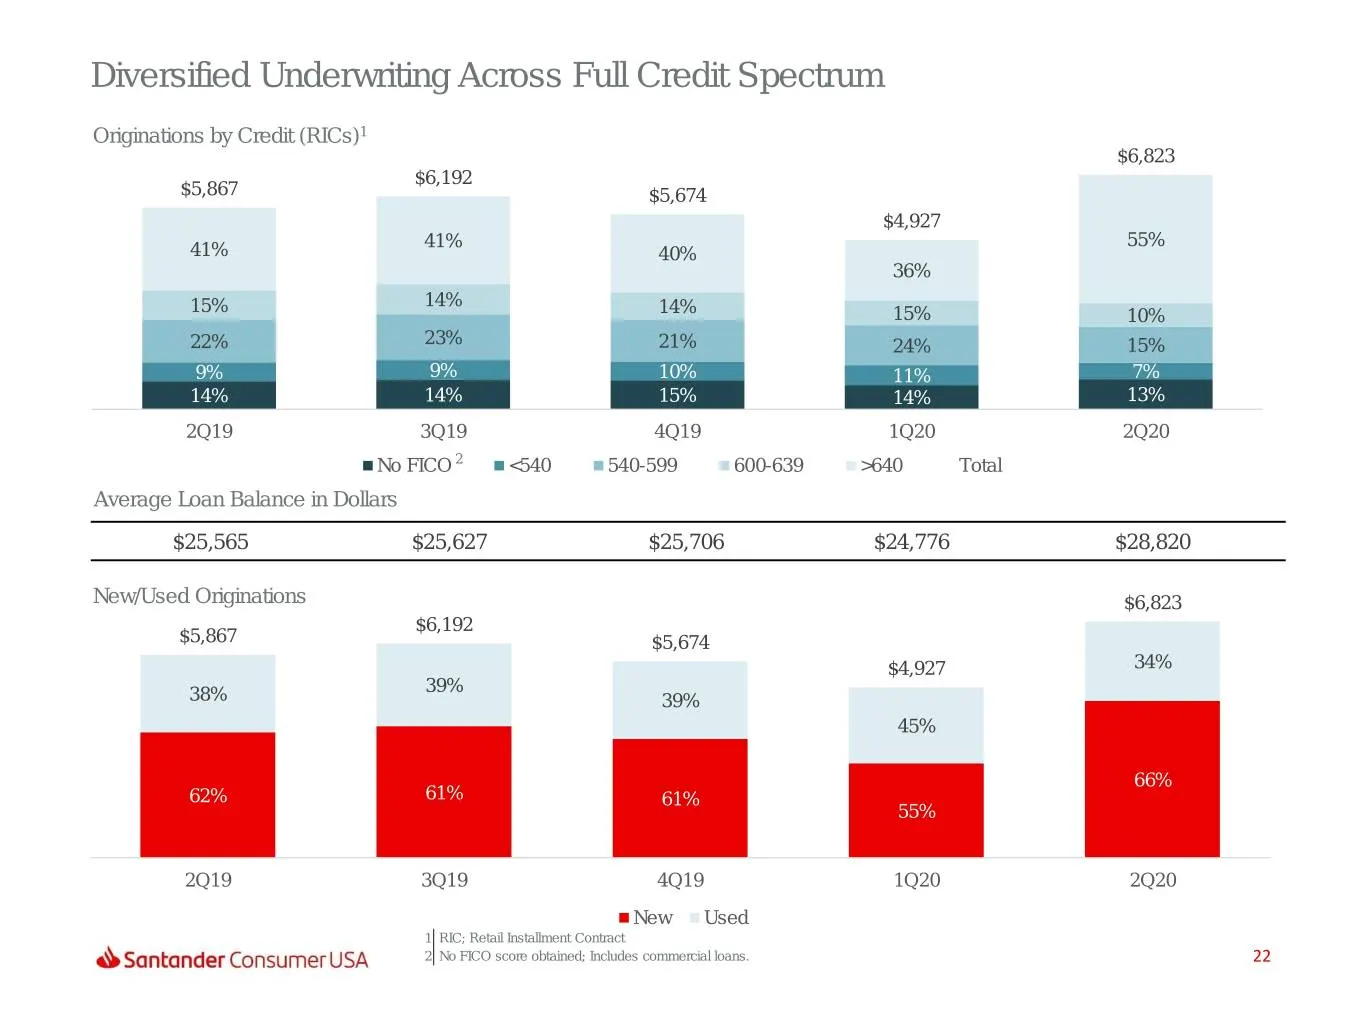
Slide 22: Diversified Underwriting Across Full Credit Spectrum
Diversified Underwriting Across Full Credit Spectrum Originations by Credit (RICs)1 $6,823 $6,192 $5,867 $5,674 $4,927 41% 55% 41% 40% 36% 15% 14% 14% 15% 10% 22% 23% 21% 24% 15% 9% 9% 10% 11% 7% 14% 14% 15% 14% 13% 2Q19 3Q19 4Q19 1Q20 2Q20 No FICO 2 <540 540-599 600-639 >640 Total Average Loan Bala
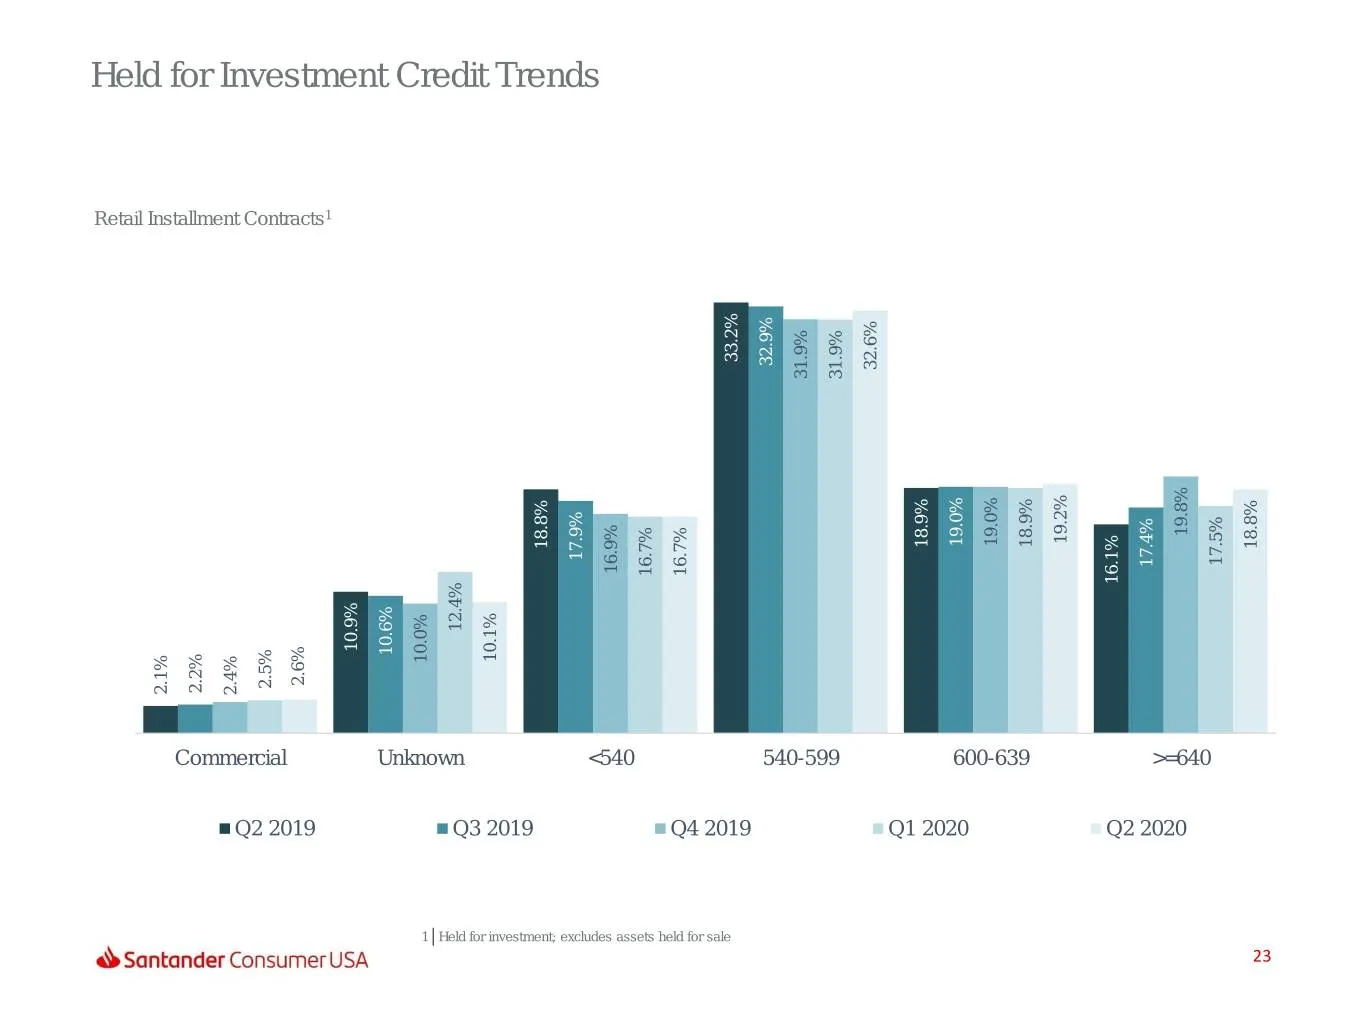
Slide 23: Held for Investment Credit Trends
Heldfor InvestmentCredit Trends Retail Installment RetailInstallment Contracts 2.1% Commercial 2.2% Q2 2019 2.4% 2.5% 2.6% 1 10.9% Unknown 10.6% 1 10.0% Held for investment; excludes assets held for sale forheld assets excludes investment; Held for Q3 2019 12.4% 10.1% 18.8% 17.9% <540 16.9% 16.7% Q4
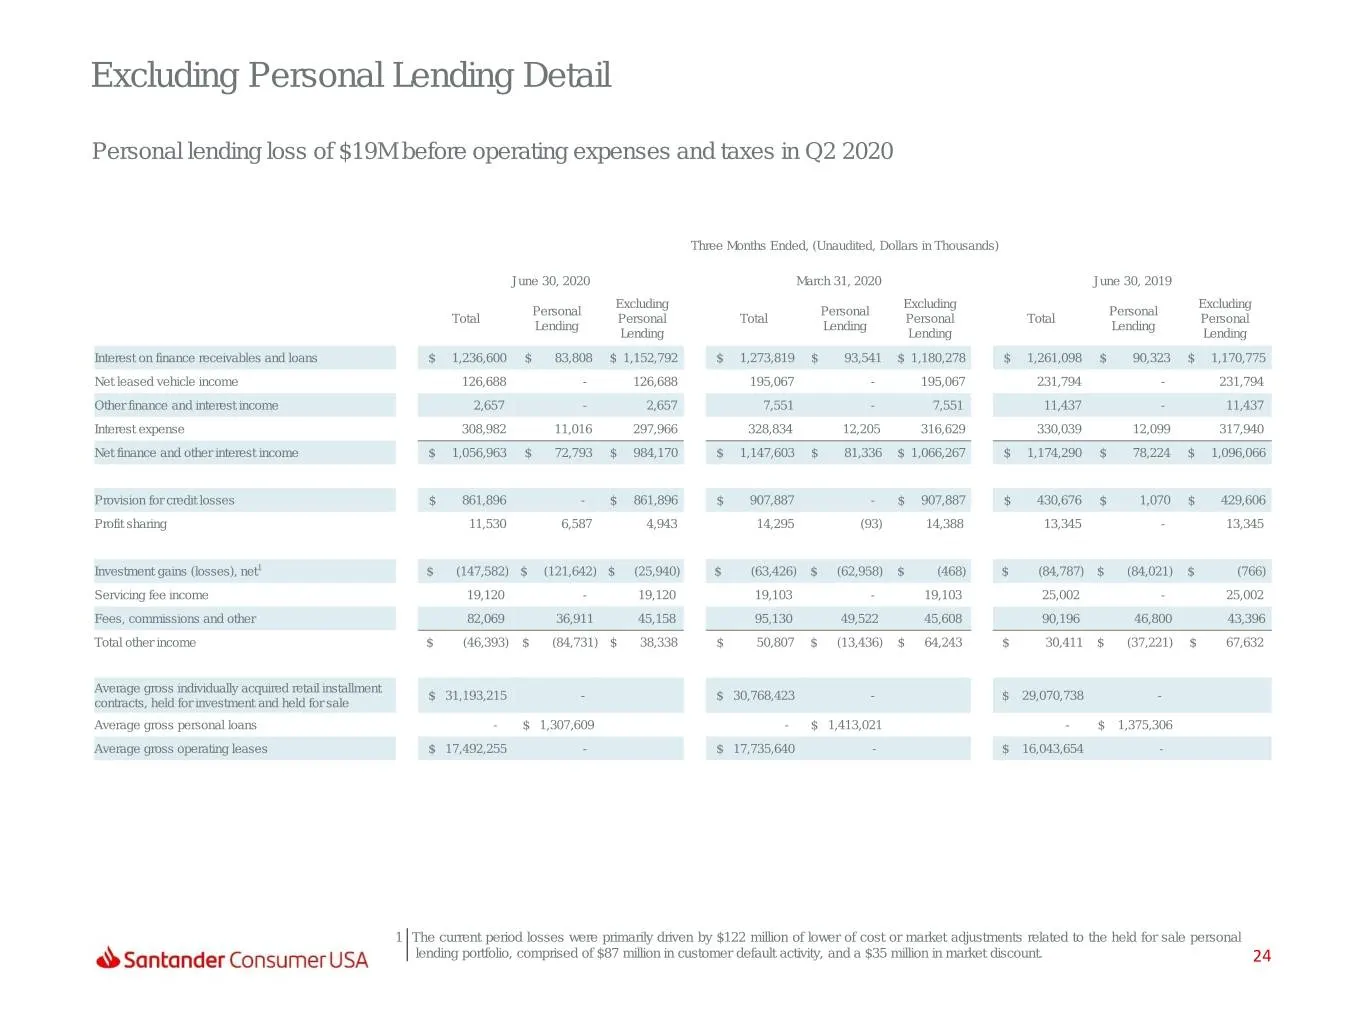
Slide 24: Excluding Personal Lending Detail
Excluding Personal Lending Detail Personal lending loss of $19M before operating expenses and taxes in Q2 2020 Three Months Ended, (Unaudited, Dollars in Thousands) June 30, 2020 March 31, 2020 June 30, 2019 Excluding Excluding Excluding Personal Personal Personal Total Personal Total Personal Total
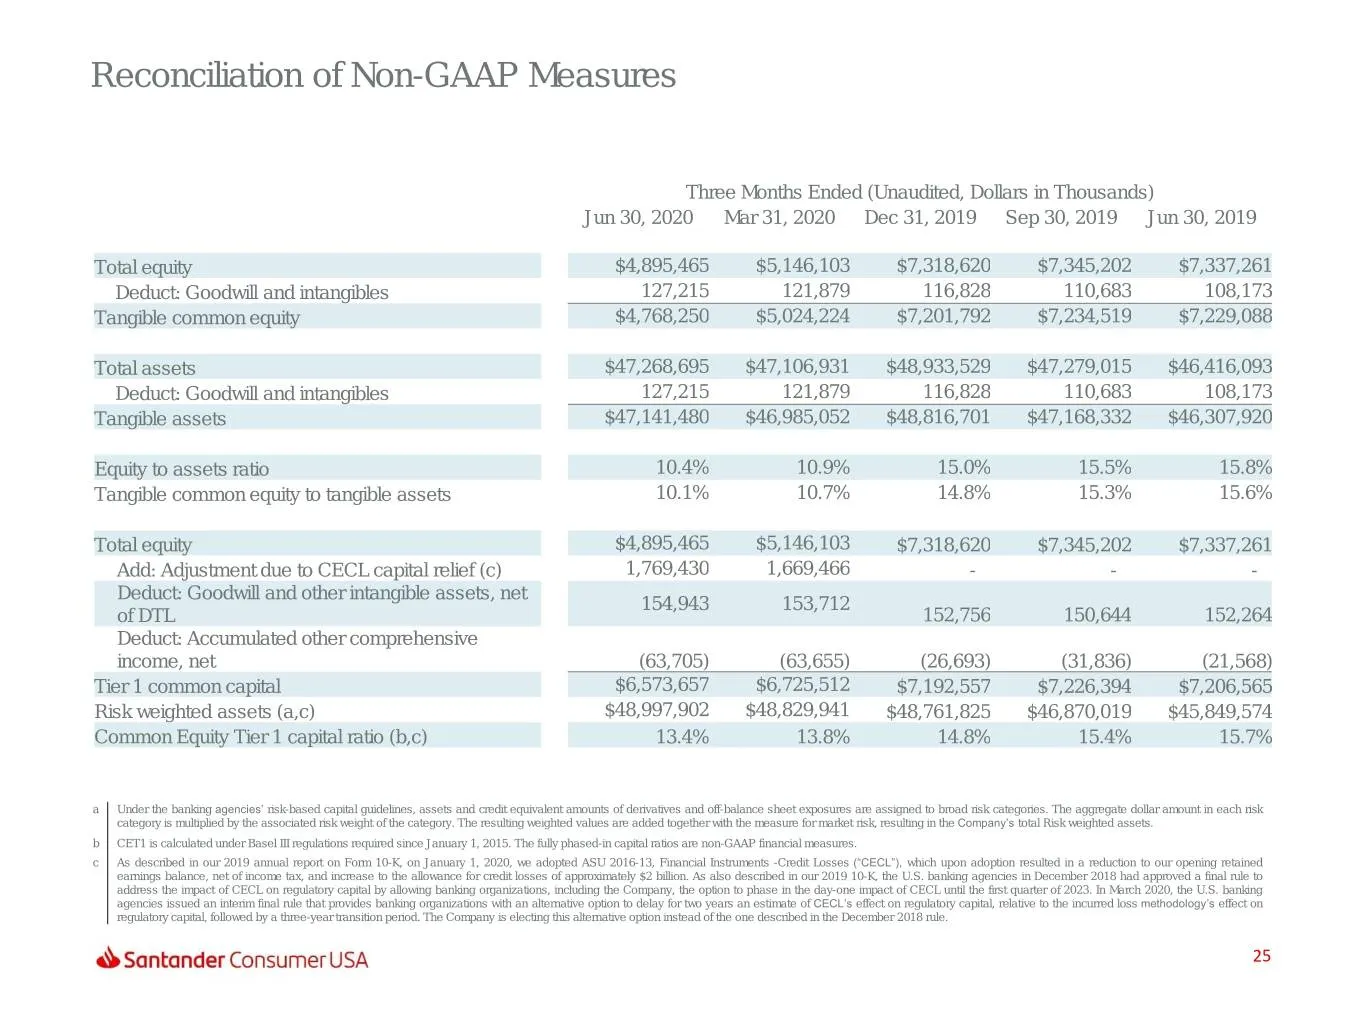
Slide 25: Reconciliation of Non-GAAP Measures
Reconciliation of Non-GAAP Measures Three Months Ended (Unaudited, Dollars in Thousands) Jun 30, 2020 Mar 31, 2020 Dec 31, 2019 Sep 30, 2019 Jun 30, 2019 Total equity $4,895,465 $5,146,103 $7,318,620 $7,345,202 $7,337,261 Deduct: Goodwill and intangibles 127,215 121,879 116,828 110,683 108,173 Tangi
Slide 26: Thank You
Thank You Our purpose is to help people and business prosper. Our culture is based on believing that everything we do should be:
Source: SEC EDGAR · 8-K filed Jul 29, 2020
More decks from Santander Consumer USA Holdings Inc
 Q3 2021 Earnings Presentation24 slides · Oct 27, 2021
 Q2 2021 Earnings Presentation24 slides · Jul 28, 2021
 Q1 2021 Earnings Presentation24 slides · Apr 28, 2021
 FY2020 Earnings Presentation28 slides · Feb 3, 2021
 Q3 2020 Earnings Presentation25 slides · Oct 28, 2020
 Q1 2020 Earnings Presentation23 slides · Apr 28, 2020