Orascom Construction PLC · EGX:ORAS
Orascom Construction — Investor Presentation (September 2021)
30 slides from Orascom Construction's investor presentation, September 2021
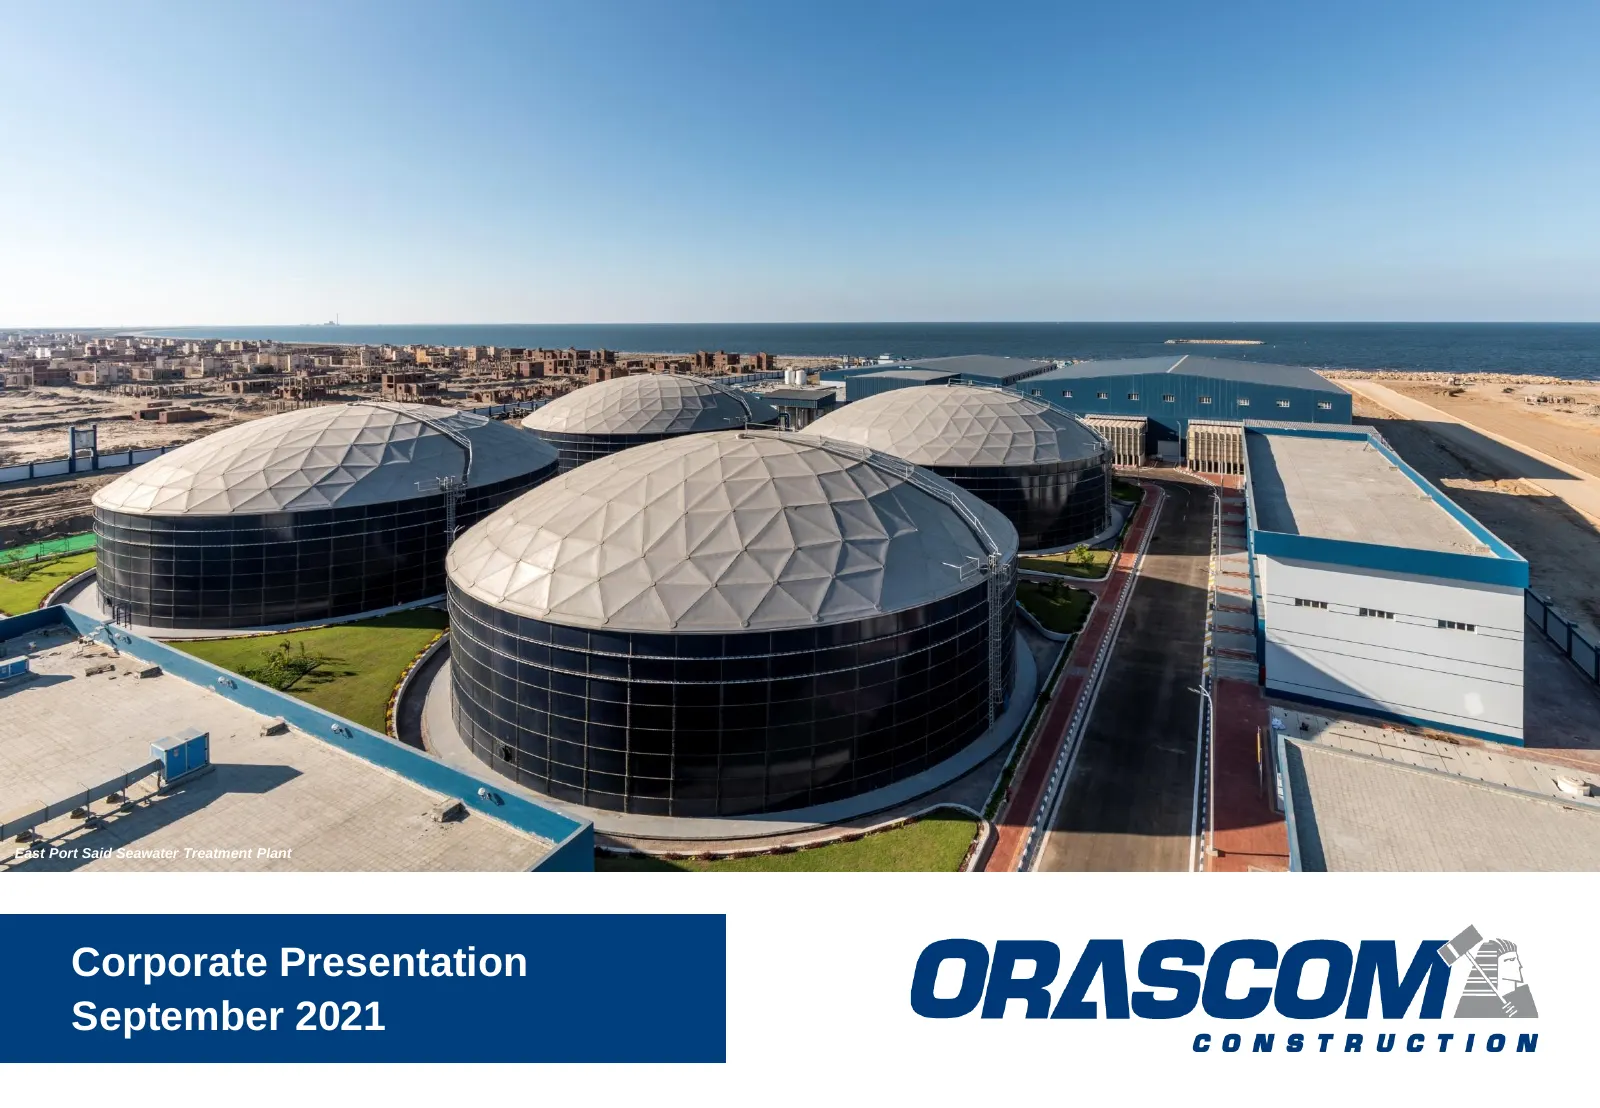
Slide 1: Corporate Presentation September 2021
East Port Said Seawater Treatment Plant Corporate Presentation September 2021
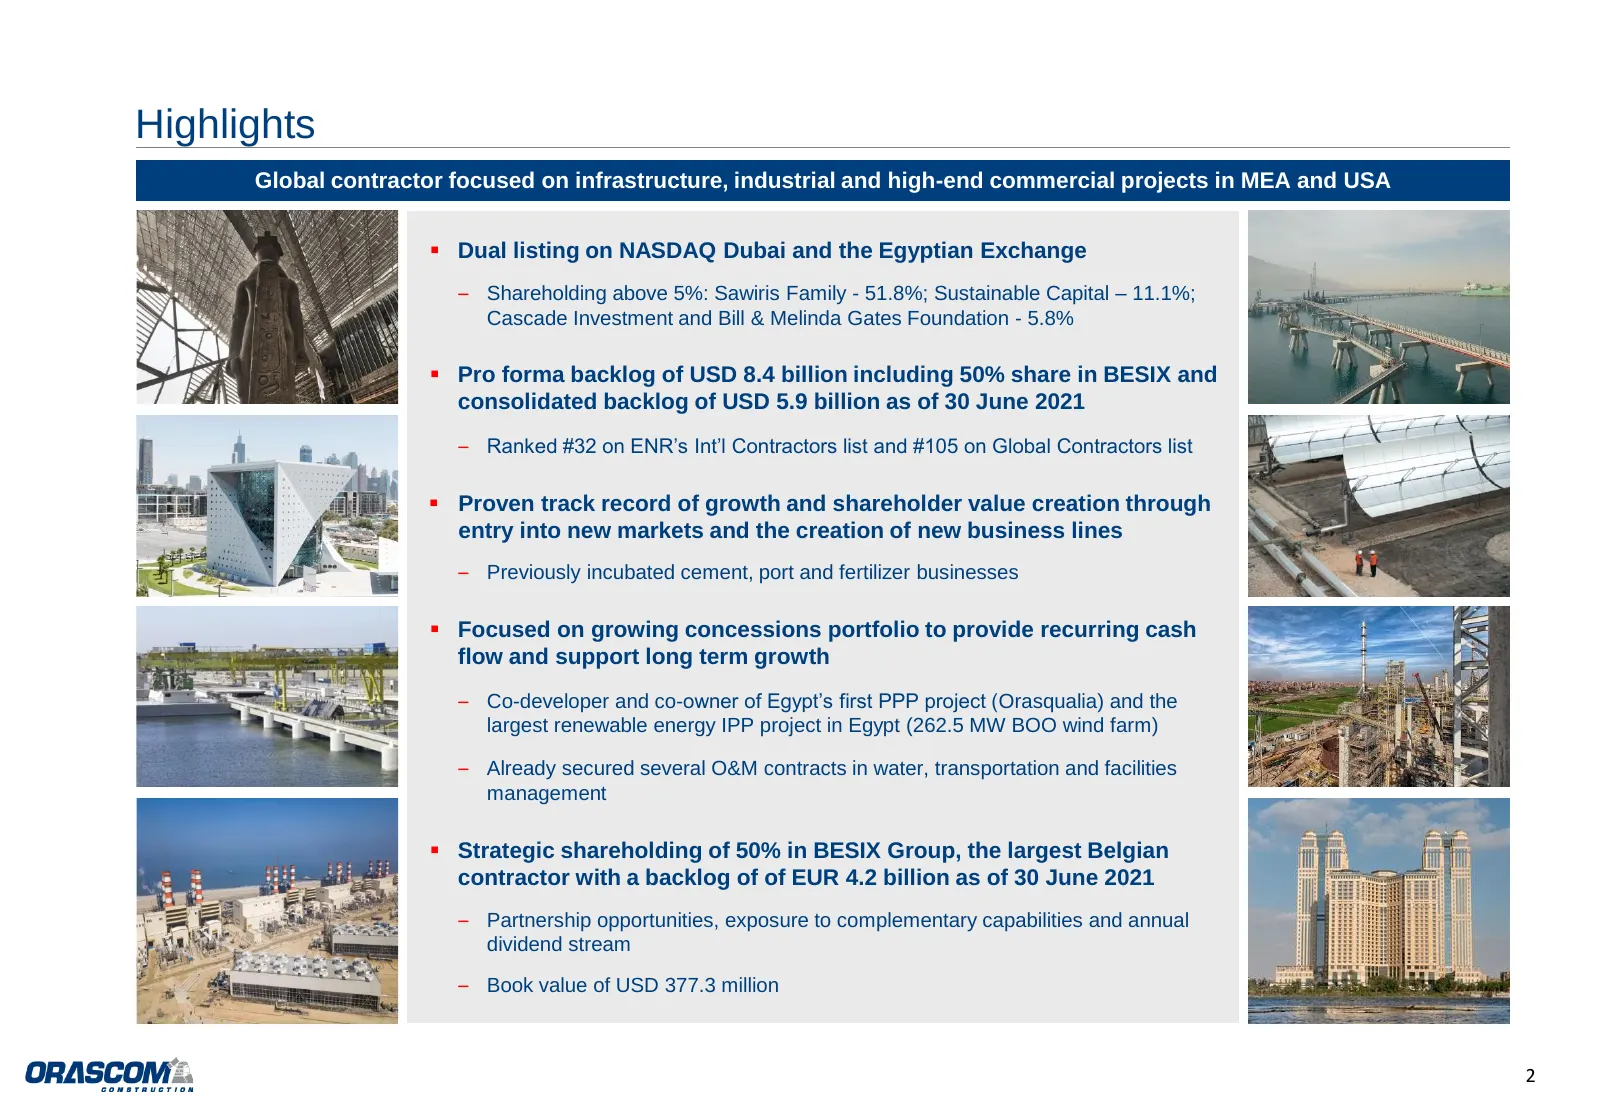
Slide 2: Highlights
Highlights Global contractor focused on infrastructure, industrial and high-end commercial projects in MEA and USA ▪ Dual listing on NASDAQ Dubai and the Egyptian Exchange – Shareholding above 5%: Sawiris Family - 51.8%; Sustainable Capital – 11.1%; Cascade Investment and Bill & Melinda Gates Founda
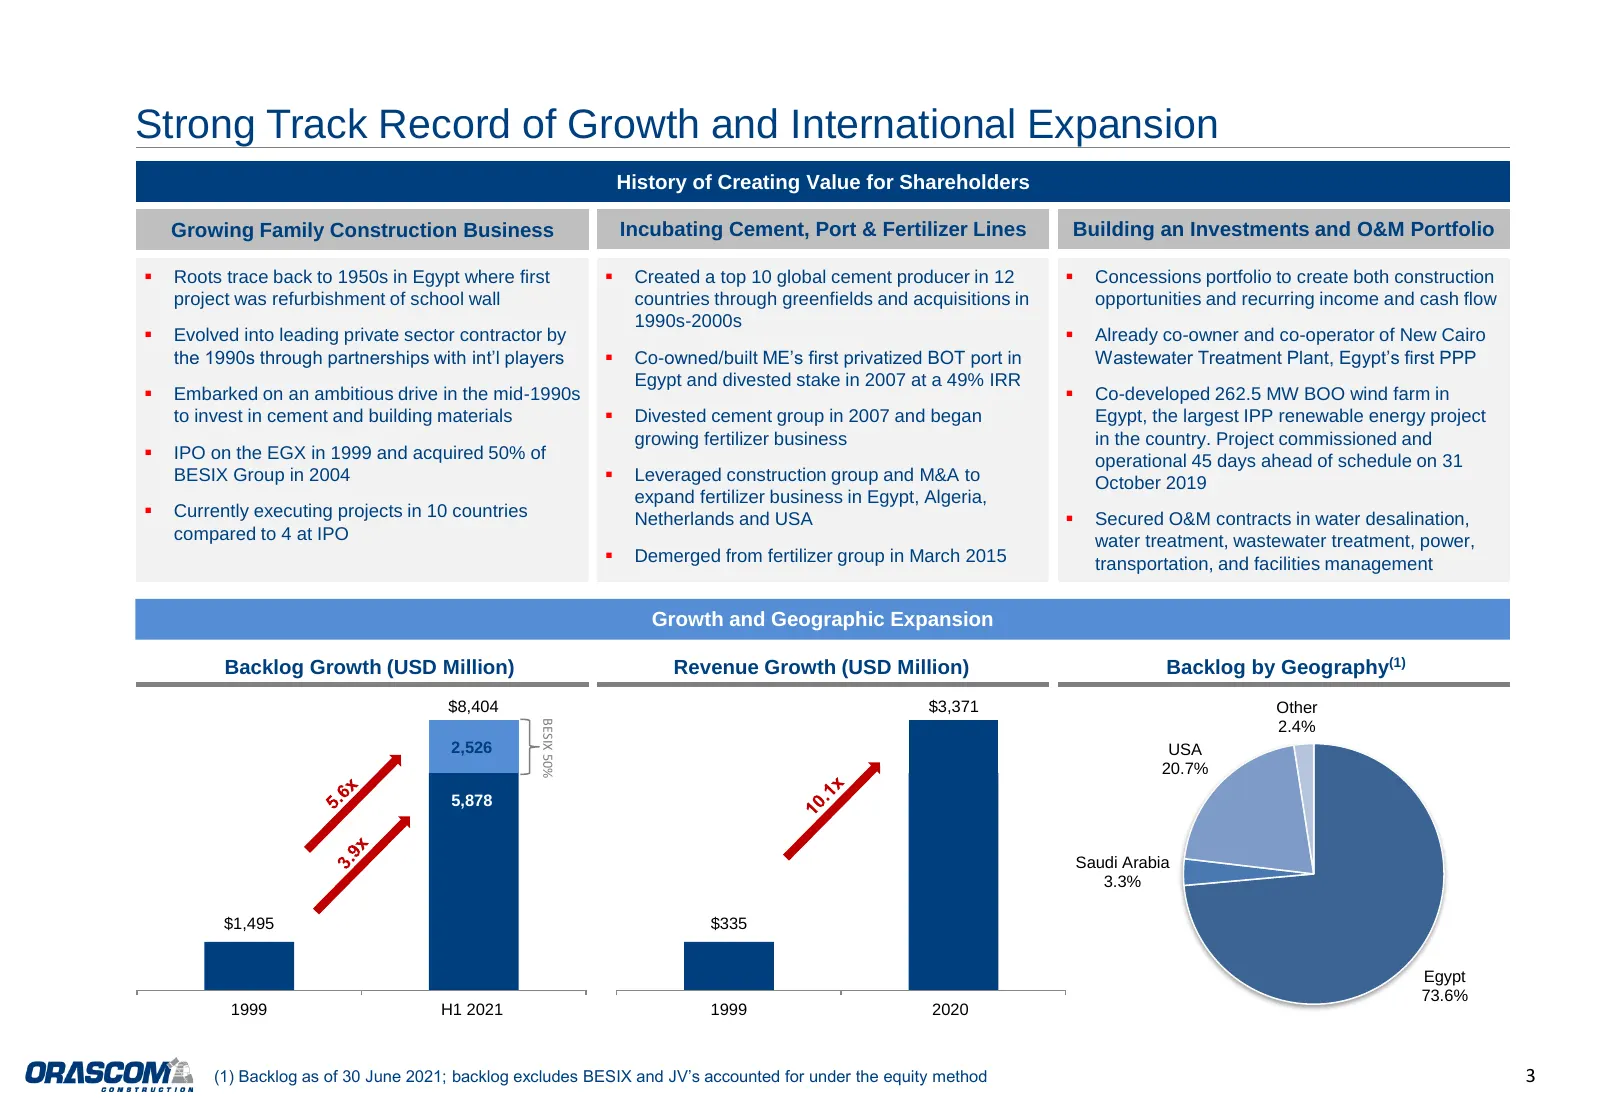
Slide 3: Strong Track Record of Growth and International Expansion
Strong Track Record of Growth and International Expansion History of Creating Value for Shareholders Growing Family Construction Business Incubating Cement, Port & Fertilizer Lines Building an Investments and O&M Portfolio ▪ Roots trace back to 1950s in Egypt where first ▪ Created a top 10 global ce
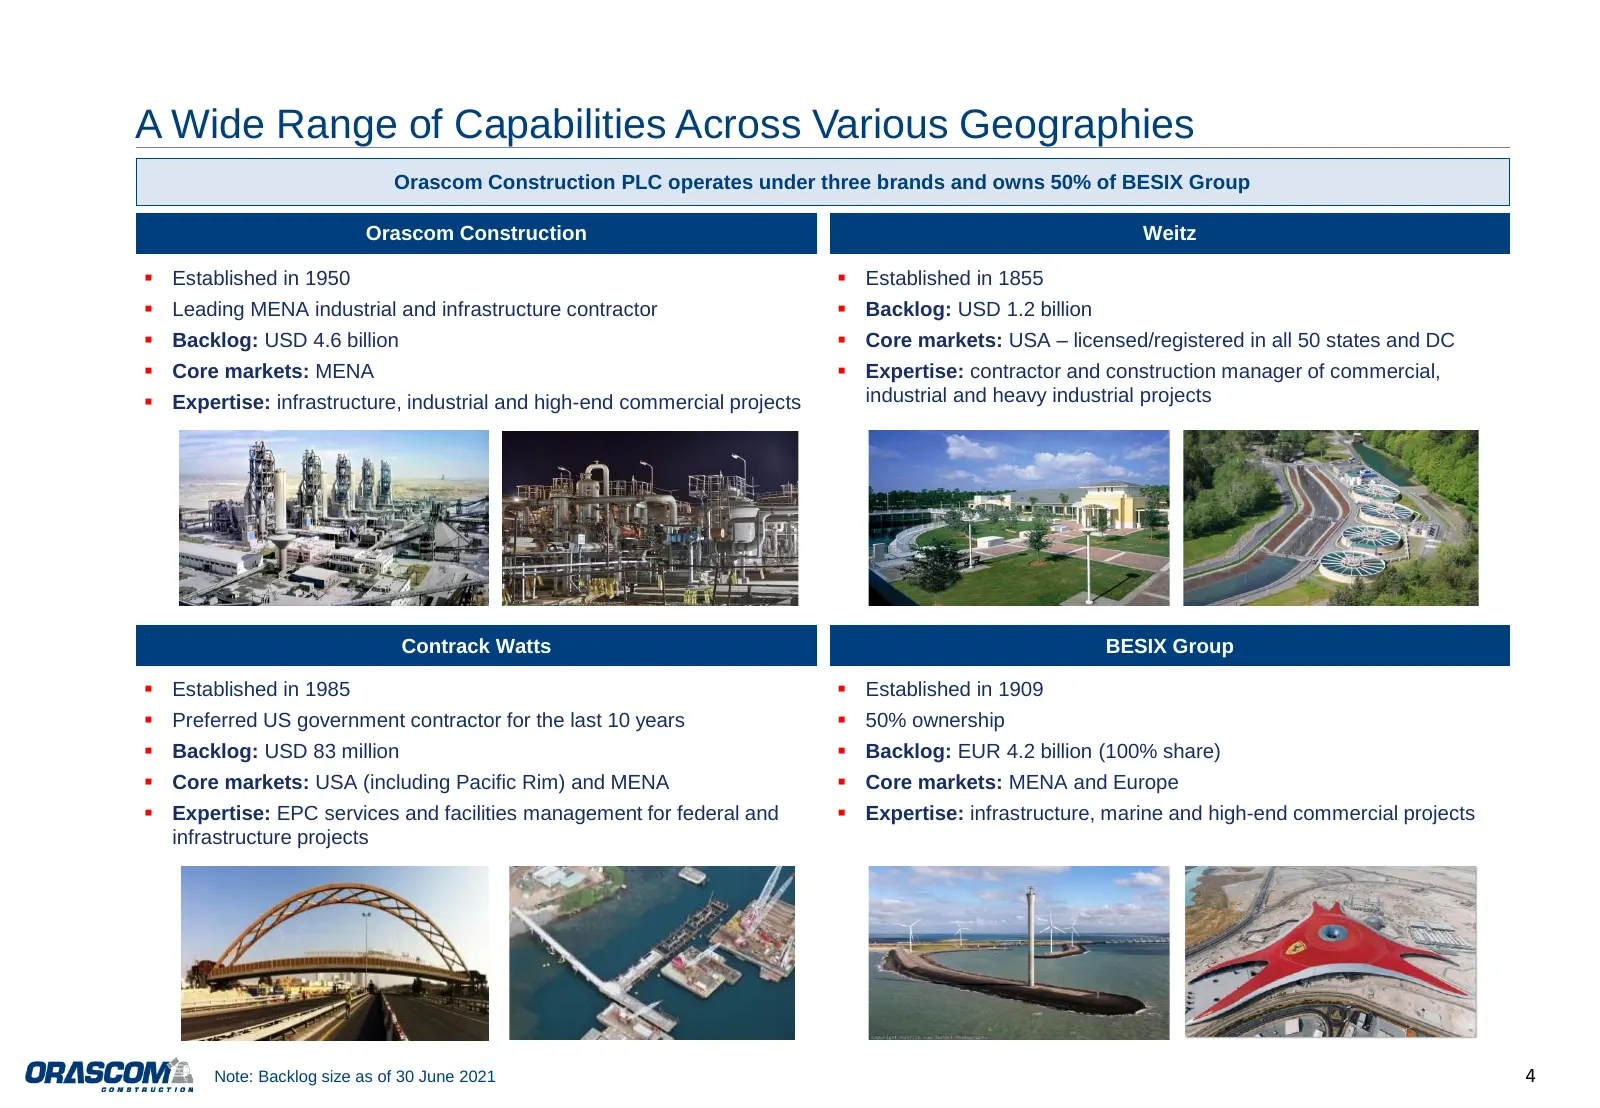
Slide 4: A Wide Range of Capabilities Across Various Geographies
A Wide Range of Capabilities Across Various Geographies Orascom Construction PLC operates under three brands and owns 50% of BESIX Group Orascom Construction Weitz ▪ Established in 1950 ▪ Established in 1855 ▪ Leading MENA industrial and infrastructure contractor ▪ Backlog: USD 1.2 billion ▪ Backlog
Slide 5: Geographic and Sector Diversification
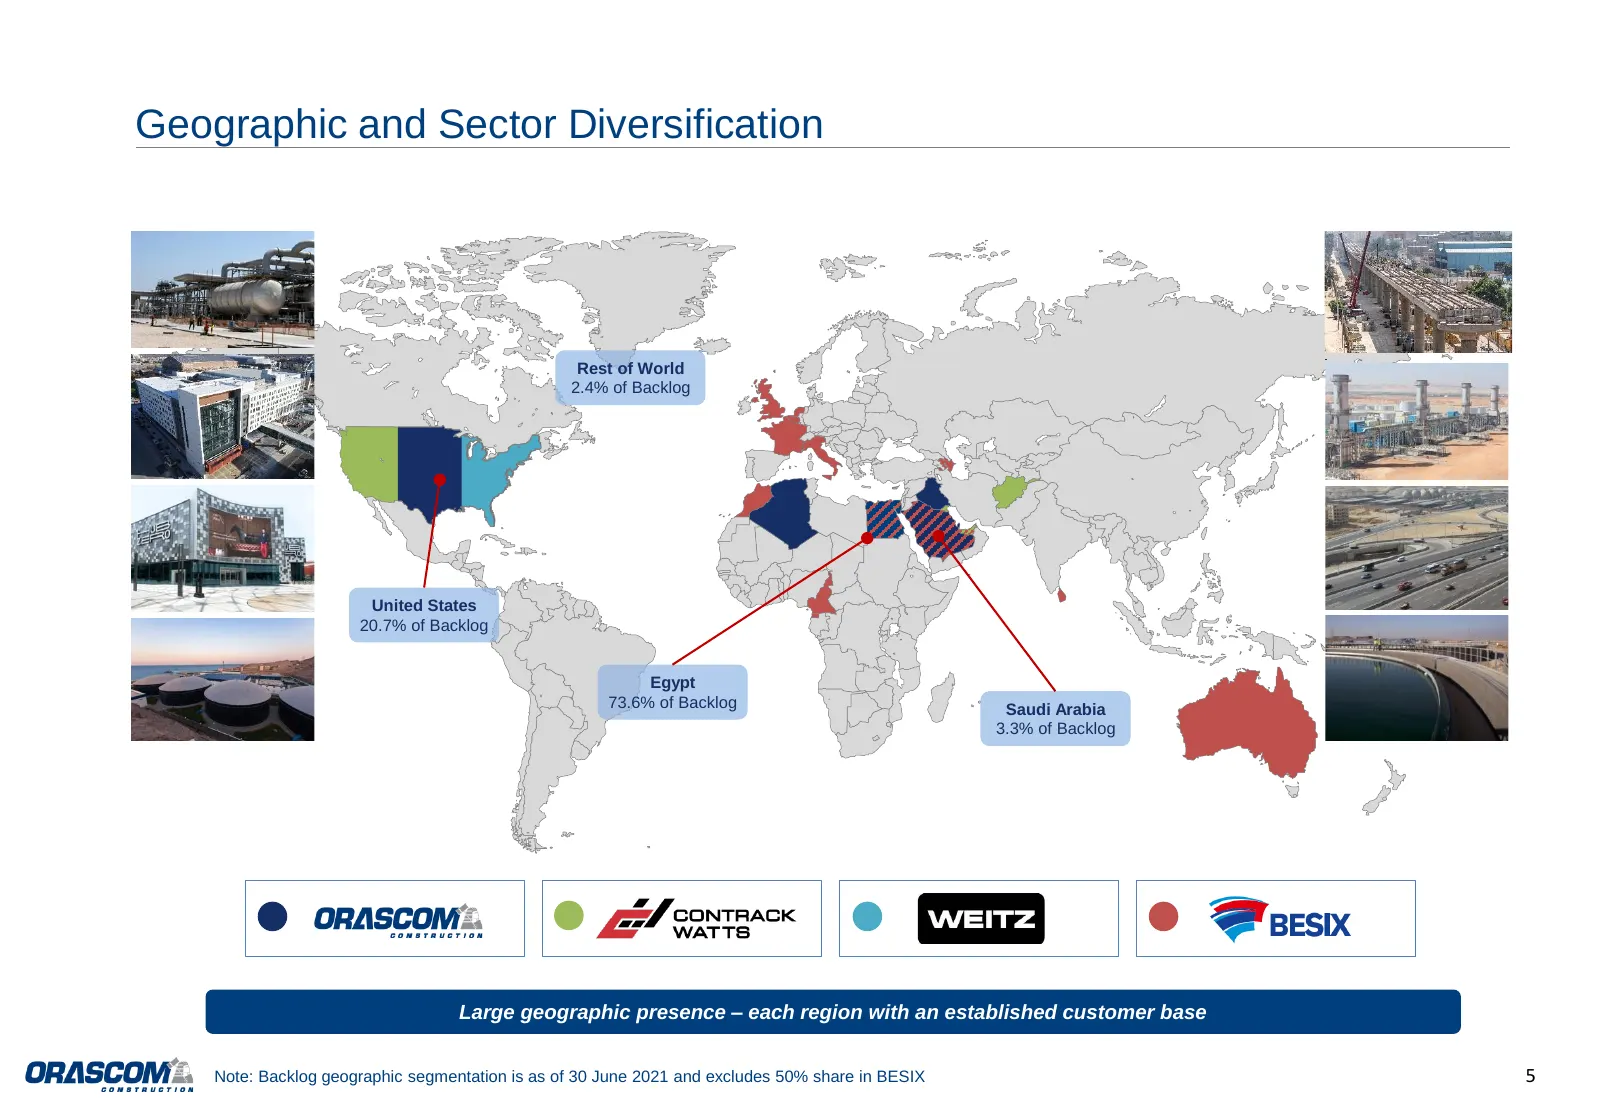
Geographic and Sector Diversification Rest of World 2.4% of Backlog United States 20.7% of Backlog Egypt 73.6% of Backlog Saudi Arabia 3.3% of Backlog Large geographic presence – each region with an established customer base Note: Backlog geographic segmentation is as of 30 June 2021 and excludes 50
Slide 6: EPC Track Record Across Several Industries and Geographies
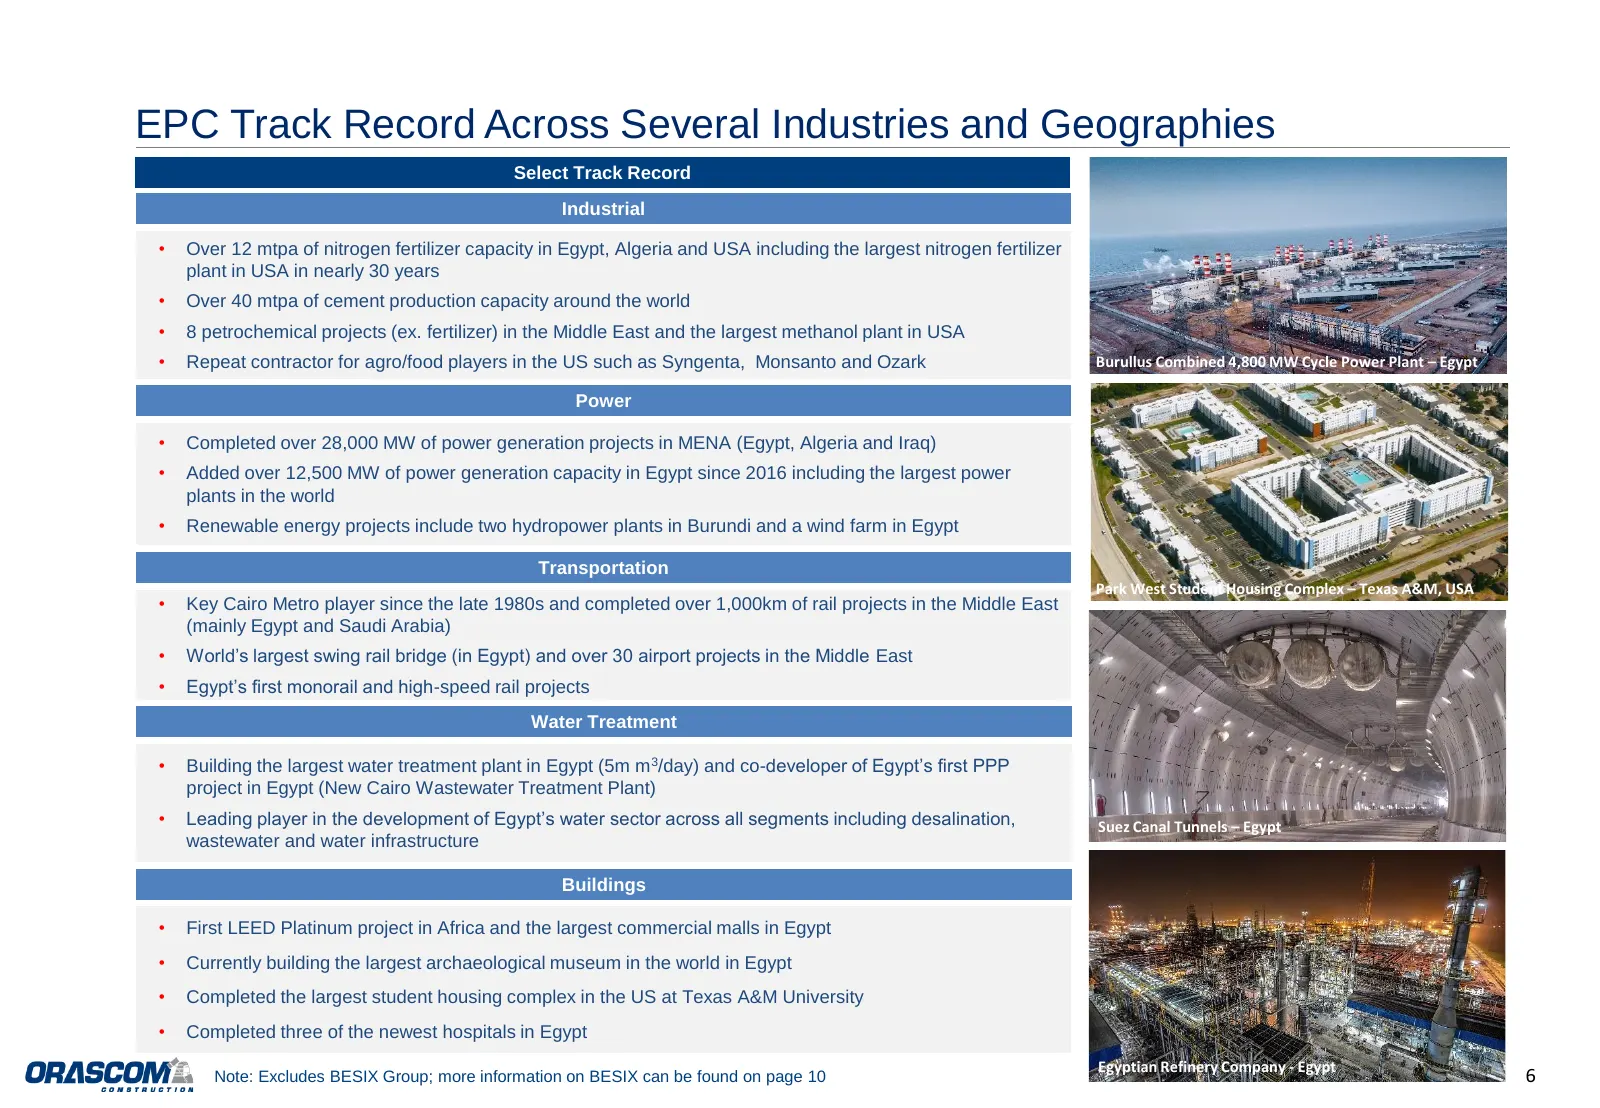
EPC Track Record Across Several Industries and Geographies Select Track Record Industrial • Over 12 mtpa of nitrogen fertilizer capacity in Egypt, Algeria and USA including the largest nitrogen fertilizer plant in USA in nearly 30 years • Over 40 mtpa of cement production capacity around the world •
Slide 7: Consolidated Backlog
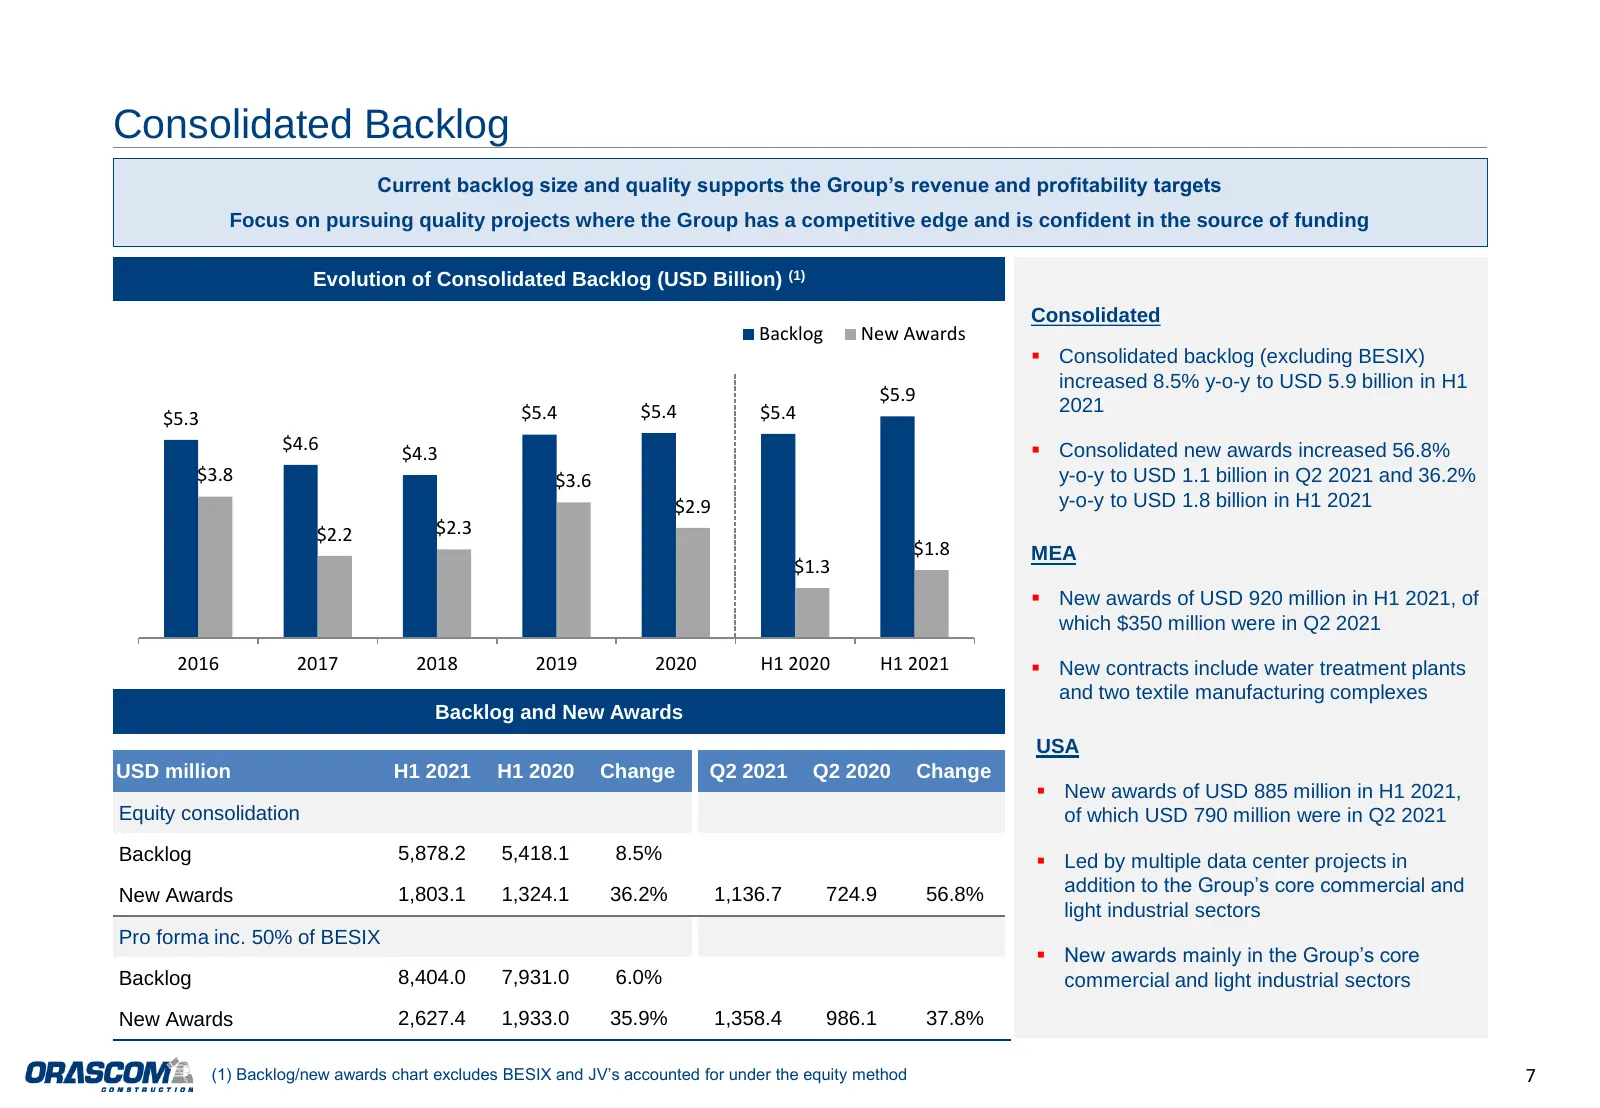
Consolidated Backlog Current backlog size and quality supports the Group’s revenue and profitability targets Focus on pursuing quality projects where the Group has a competitive edge and is confident in the source of funding Evolution of Consolidated Backlog (USD Billion) (1) Consolidated Backlog Ne
Slide 8: Consolidated Backlog Breakdown – June 2021
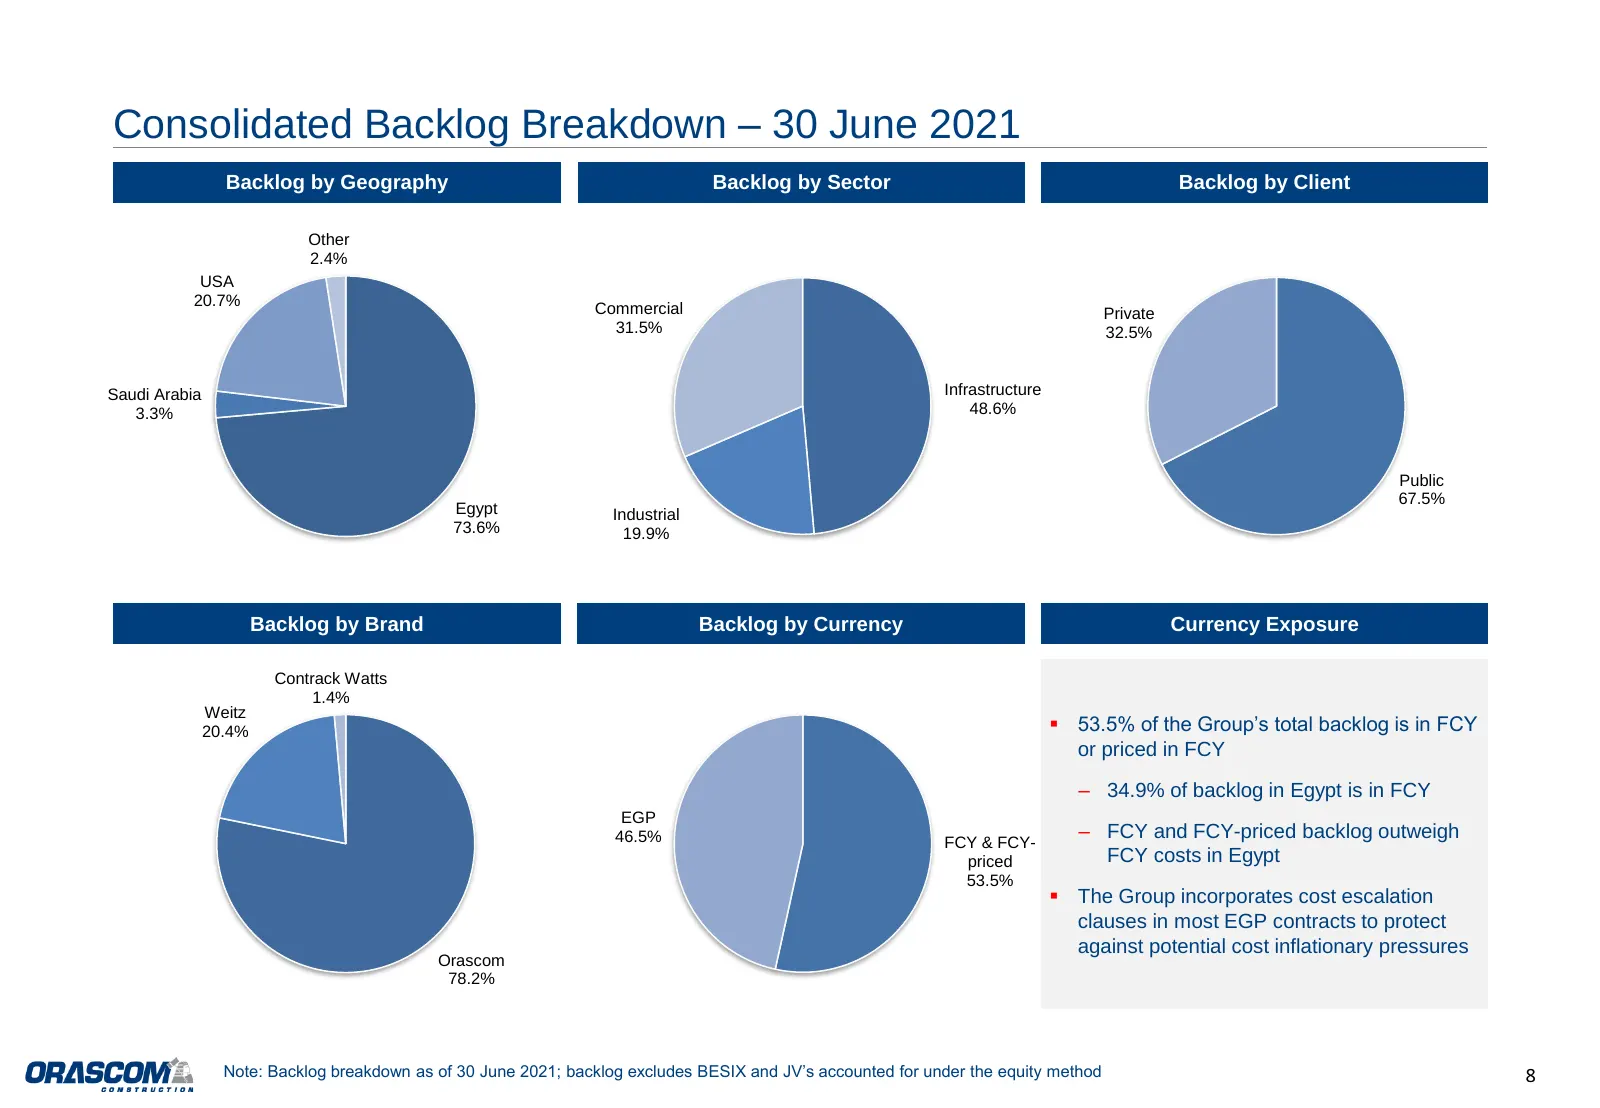
Consolidated Backlog Breakdown – 30 June 2021 Backlog by Geography Backlog by Sector Backlog by Client Other 2.4% USA 20.7% Commercial Private 31.5% 32.5% Saudi Arabia Infrastructure 3.3% 48.6% Public 67.5% Egypt Industrial 73.6% 19.9% Backlog by Brand Backlog by Currency Currency Exposure Contrack
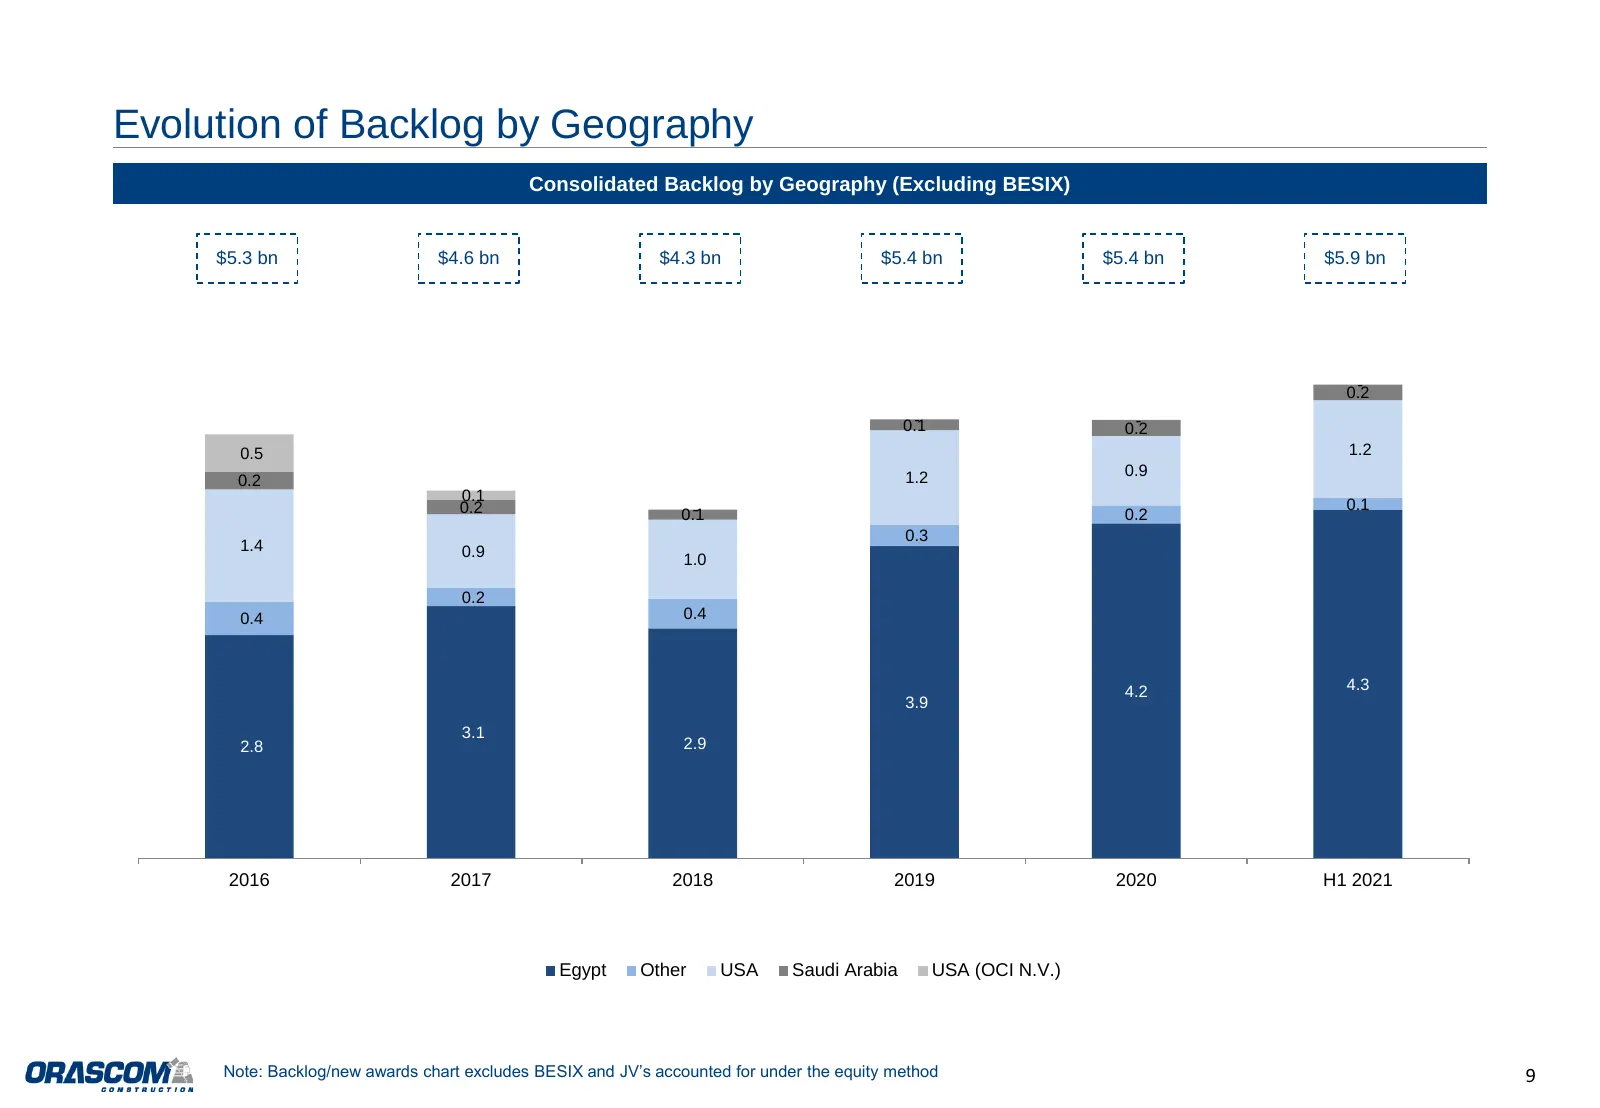
Slide 9: Evolution of Backlog by Geography
Evolution of Backlog by Geography Consolidated Backlog by Geography (Excluding BESIX) $5.3 bn $4.6 bn $4.3 bn $5.4 bn $5.4 bn $5.9 bn - 0.2 - 0.1 - 0.2 0.5 1.2 1.2 0.9 0.2 0.1 0.2 - 0.1 0.1 0.2 0.3 1.4 0.9 1.0 0.2 0.4 0.4 4.2 4.3 3.9 3.1 2.8 2.9 2016 2017 2018 2019 2020 H1 2021 Egypt Other USA Saudi
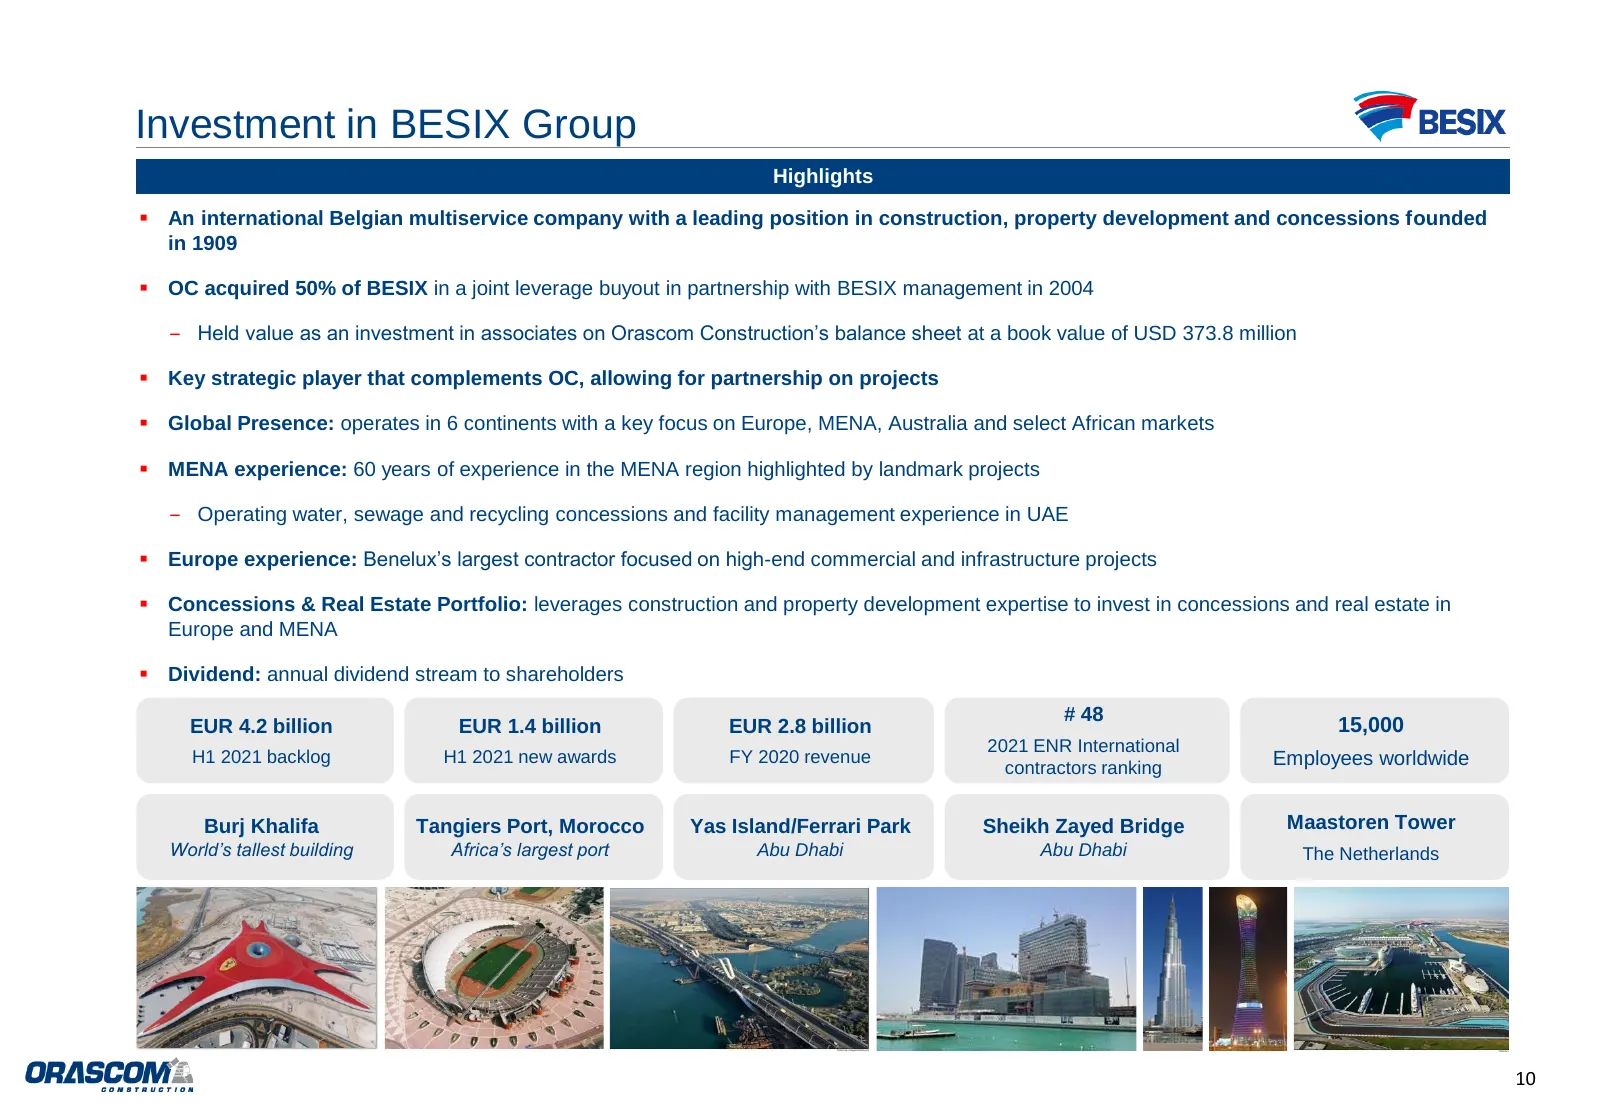
Slide 10: Investment in BESIX Group
Investment in BESIX Group Highlights ▪ An international Belgian multiservice company with a leading position in construction, property development and concessions founded in 1909 ▪ OC acquired 50% of BESIX in a joint leverage buyout in partnership with BESIX management in 2004 ‒ Held value as an inv
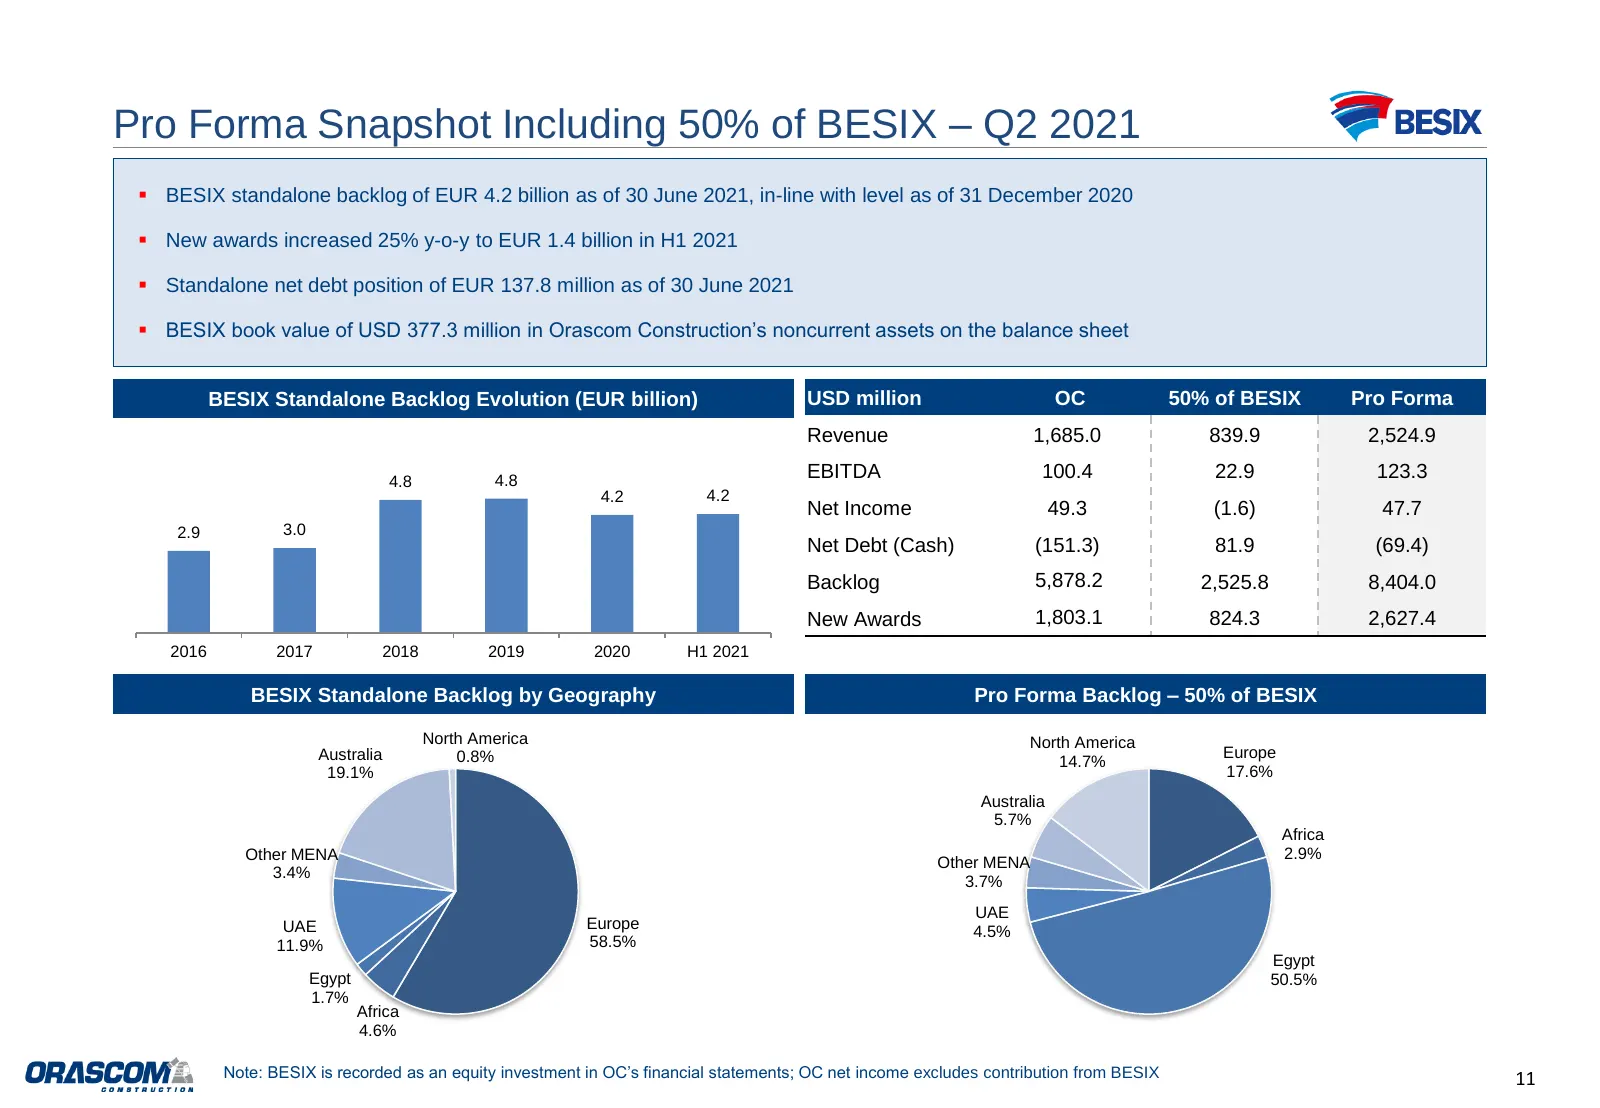
Slide 11: Pro Forma Snapshot Including 50% of BESIX – Q2 2021
Pro Forma Snapshot Including 50% of BESIX – Q2 2021 ▪ BESIX standalone backlog of EUR 4.2 billion as of 30 June 2021, in-line with level as of 31 December 2020 ▪ New awards increased 25% y-o-y to EUR 1.4 billion in H1 2021 ▪ Standalone net debt position of EUR 137.8 million as of 30 June 2021 ▪ BESI
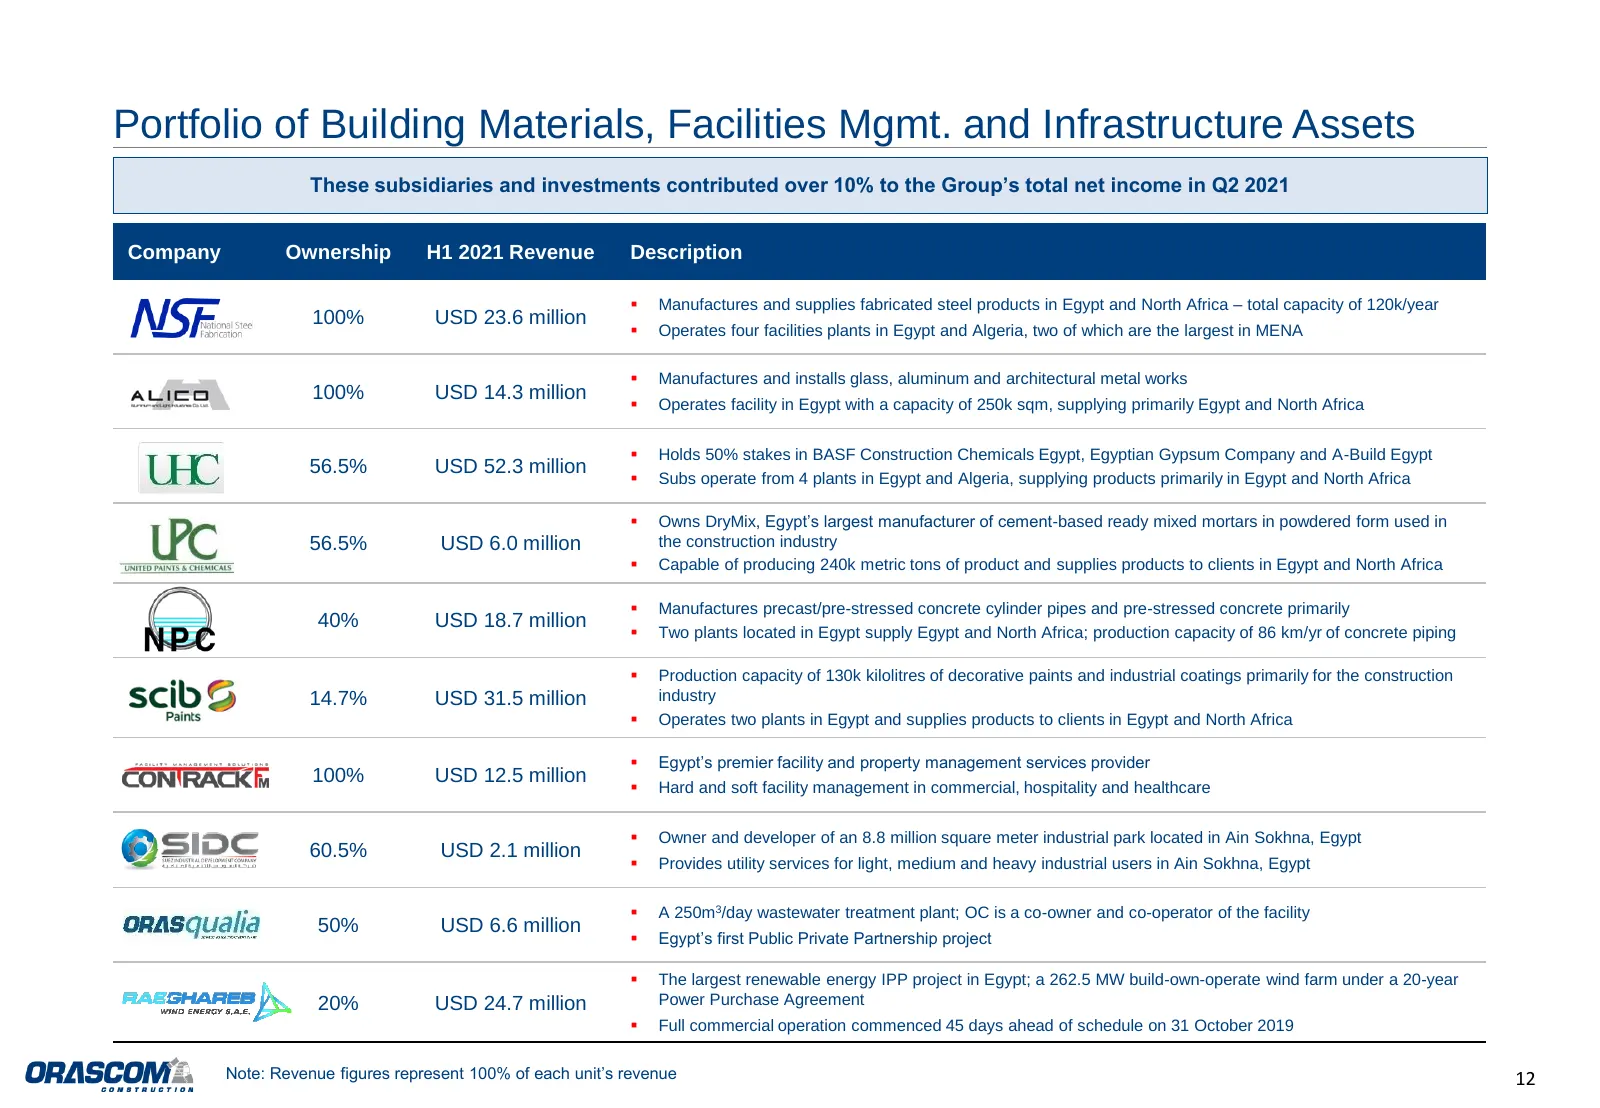
Slide 12: Portfolio of Building Materials, Facilities Mgmt. and Infrastructure Assets
Portfolio of Building Materials, Facilities Mgmt. and Infrastructure Assets These subsidiaries and investments contributed over 10% to the Group’s total net income in Q2 2021 Company Ownership H1 2021 Revenue Description ▪ Manufactures and supplies fabricated steel products in Egypt and North Africa
Slide 13: Proven Financing Capabilities
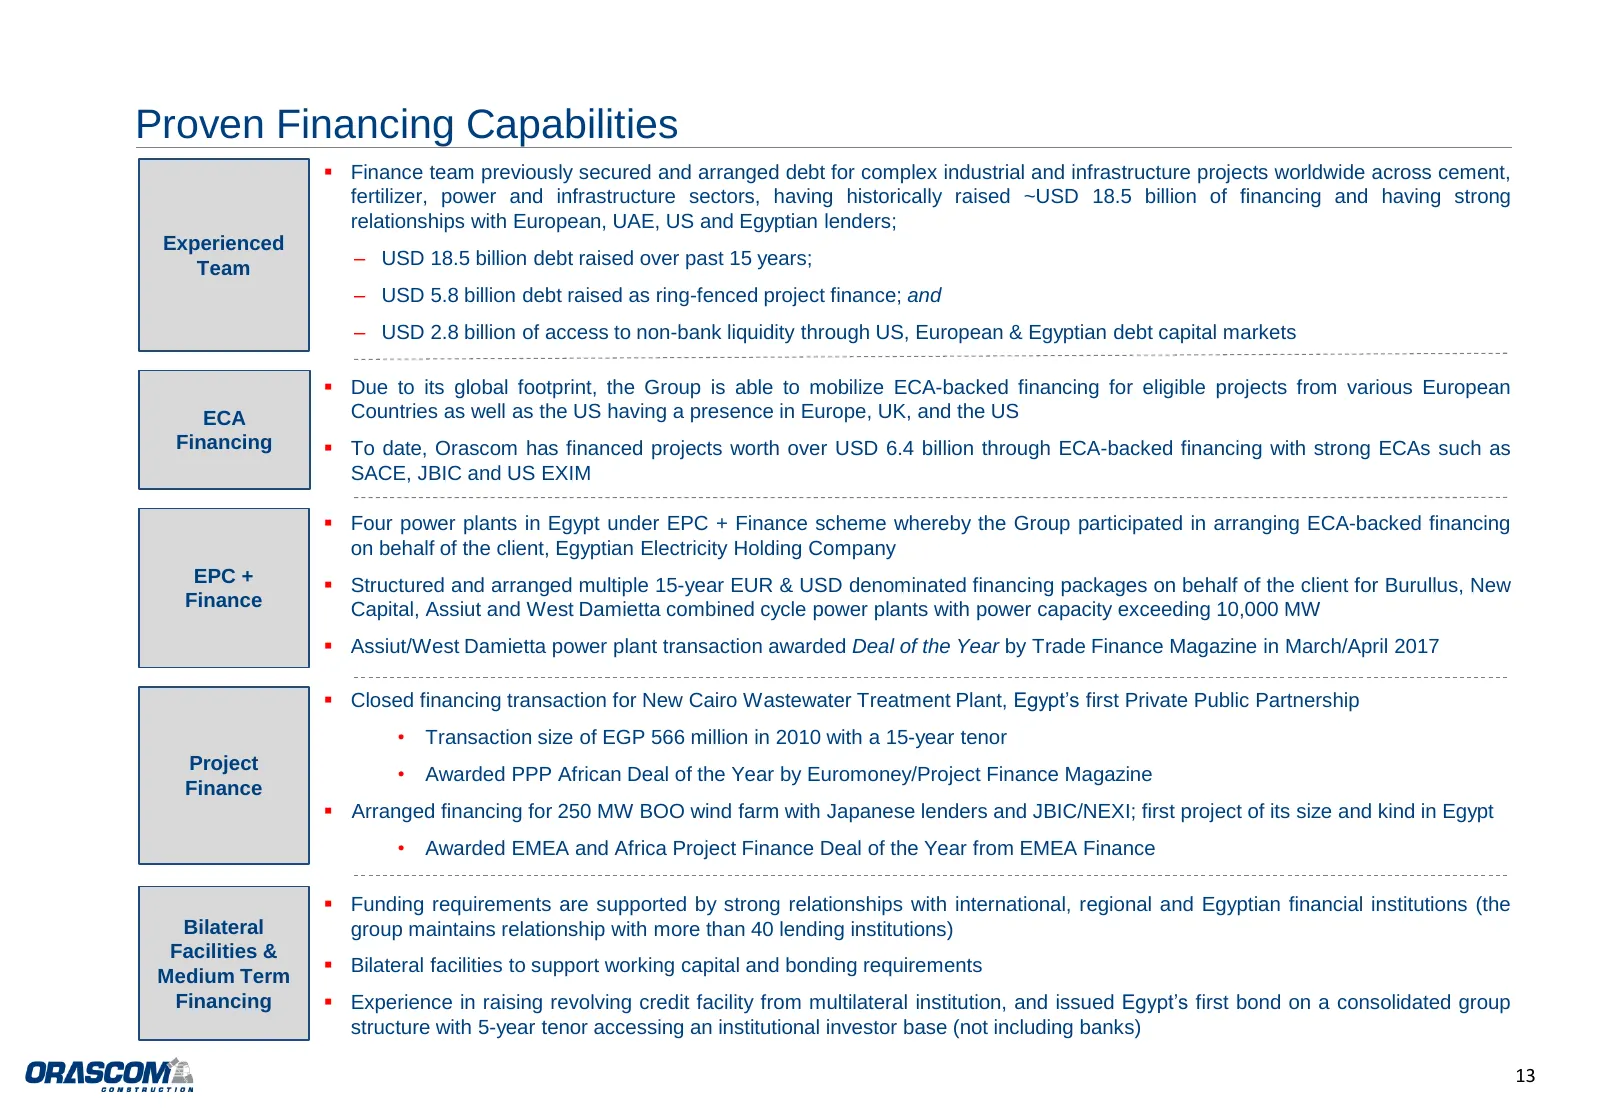
Proven Financing Capabilities ▪ Finance team previously secured and arranged debt for complex industrial and infrastructure projects worldwide across cement, fertilizer, power and infrastructure sectors, having historically raised ~USD 18.5 billion of financing and having strong relationships with E
Slide 14: Financial Section – H1 2021 Results
Financial Section – H1 2021 Results
Slide 15: Financial Highlights
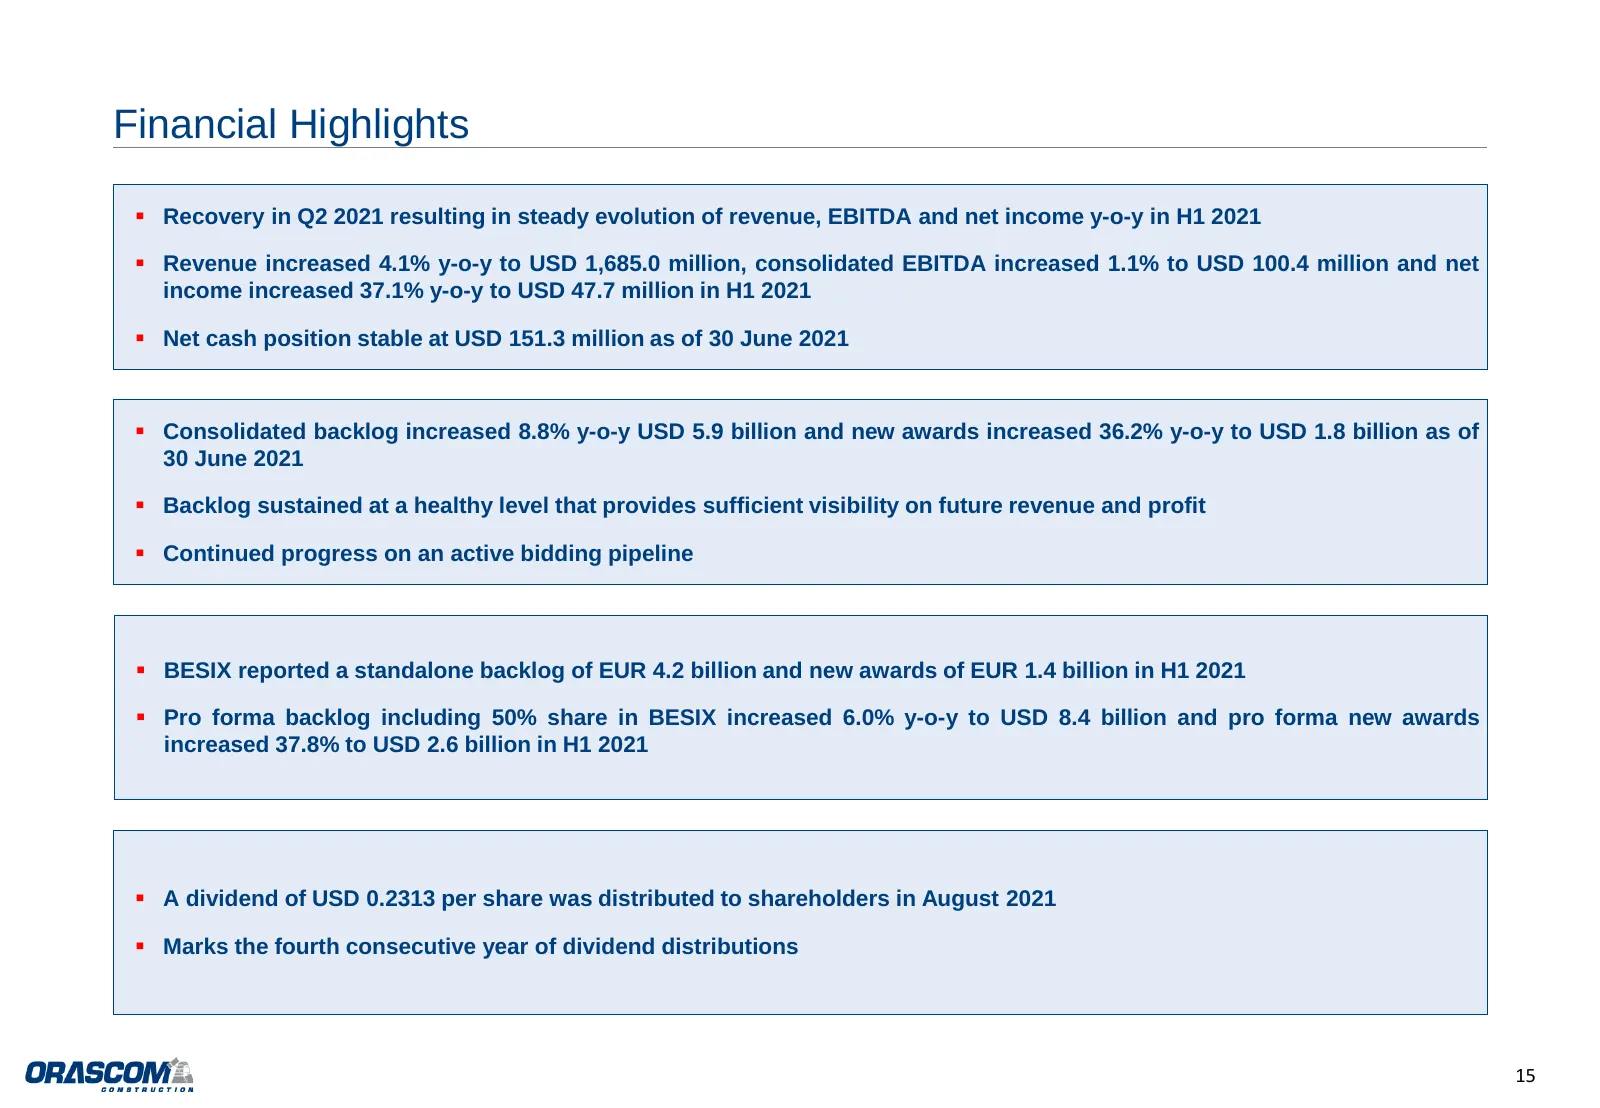
Financial Highlights ▪ Recovery in Q2 2021 resulting in steady evolution of revenue, EBITDA and net income y-o-y in H1 2021 ▪ Revenue increased 4.1% y-o-y to USD 1,685.0 million, consolidated EBITDA increased 1.1% to USD 100.4 million and net income increased 37.1% y-o-y to USD 47.7 million in H1 20
Slide 16: Summary Income Statement
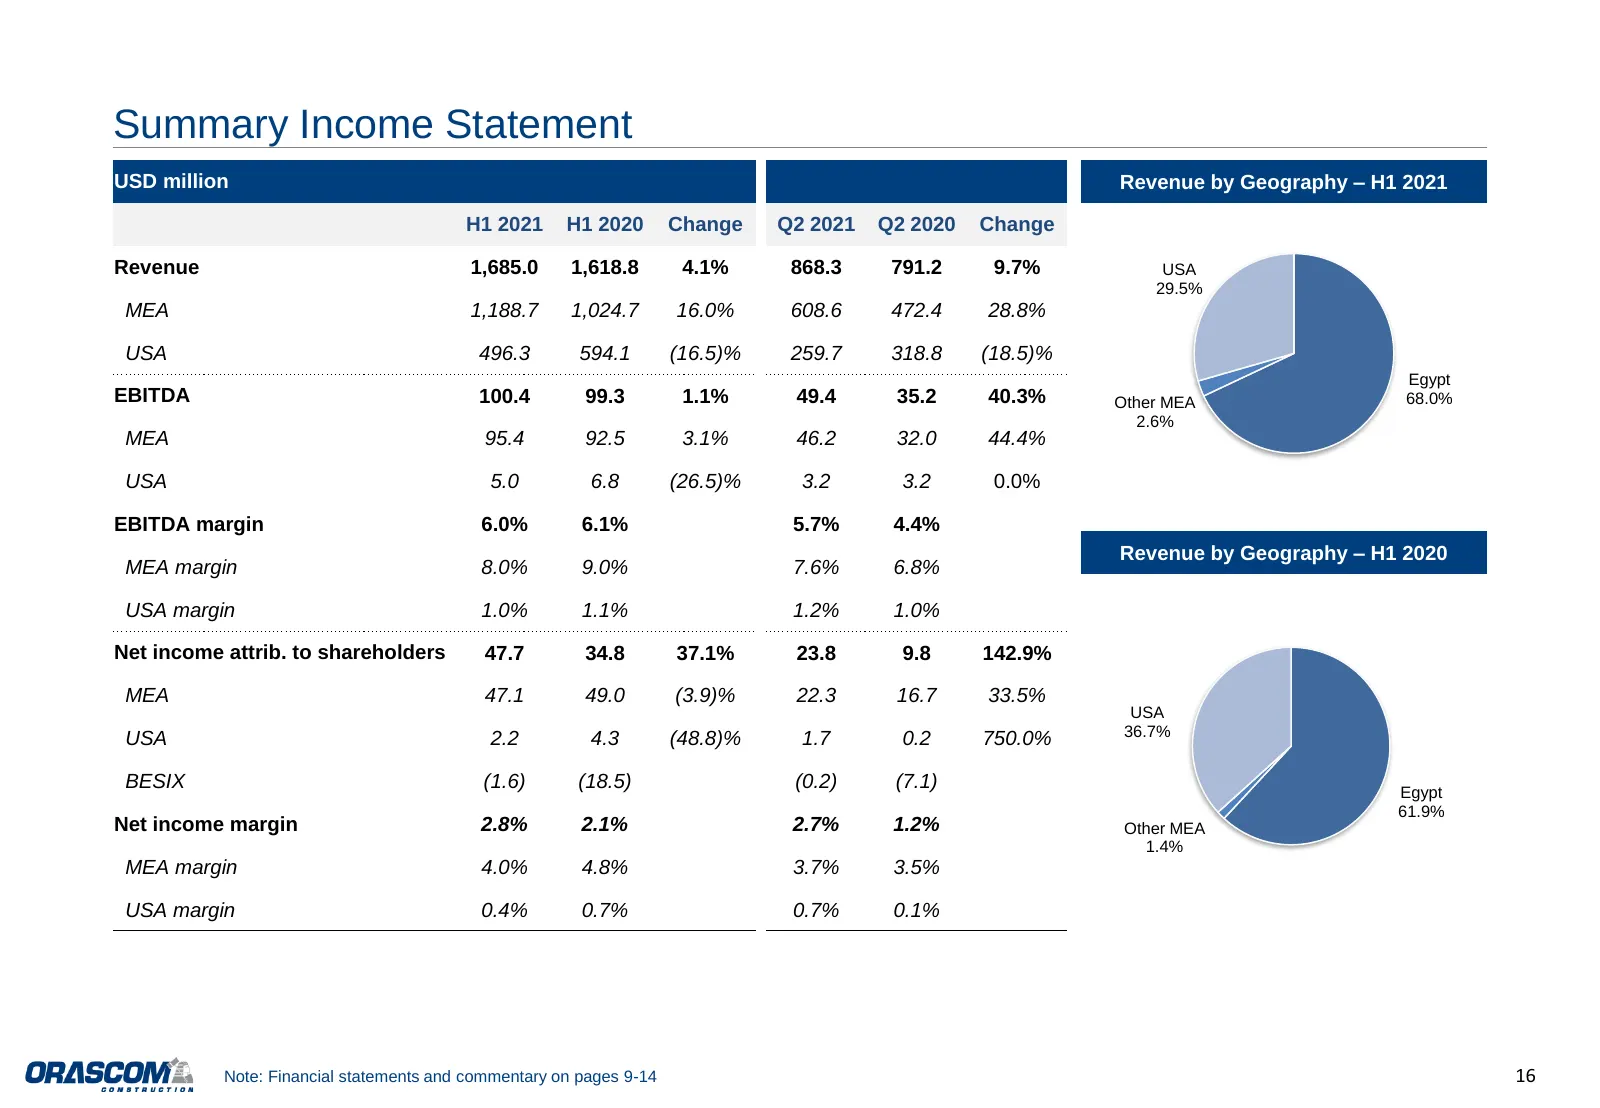
Summary Income Statement USD million Revenue by Geography – H1 2021 H1 2021 H1 2020 Change Q2 2021 Q2 2020 Change Revenue 1,685.0 1,618.8 4.1% 868.3 791.2 9.7% USA 29.5% MEA 1,188.7 1,024.7 16.0% 608.6 472.4 28.8% USA 496.3 594.1 (16.5)% 259.7 318.8 (18.5)% Egypt EBITDA 100.4 99.3 1.1% 49.4 35.2 40.
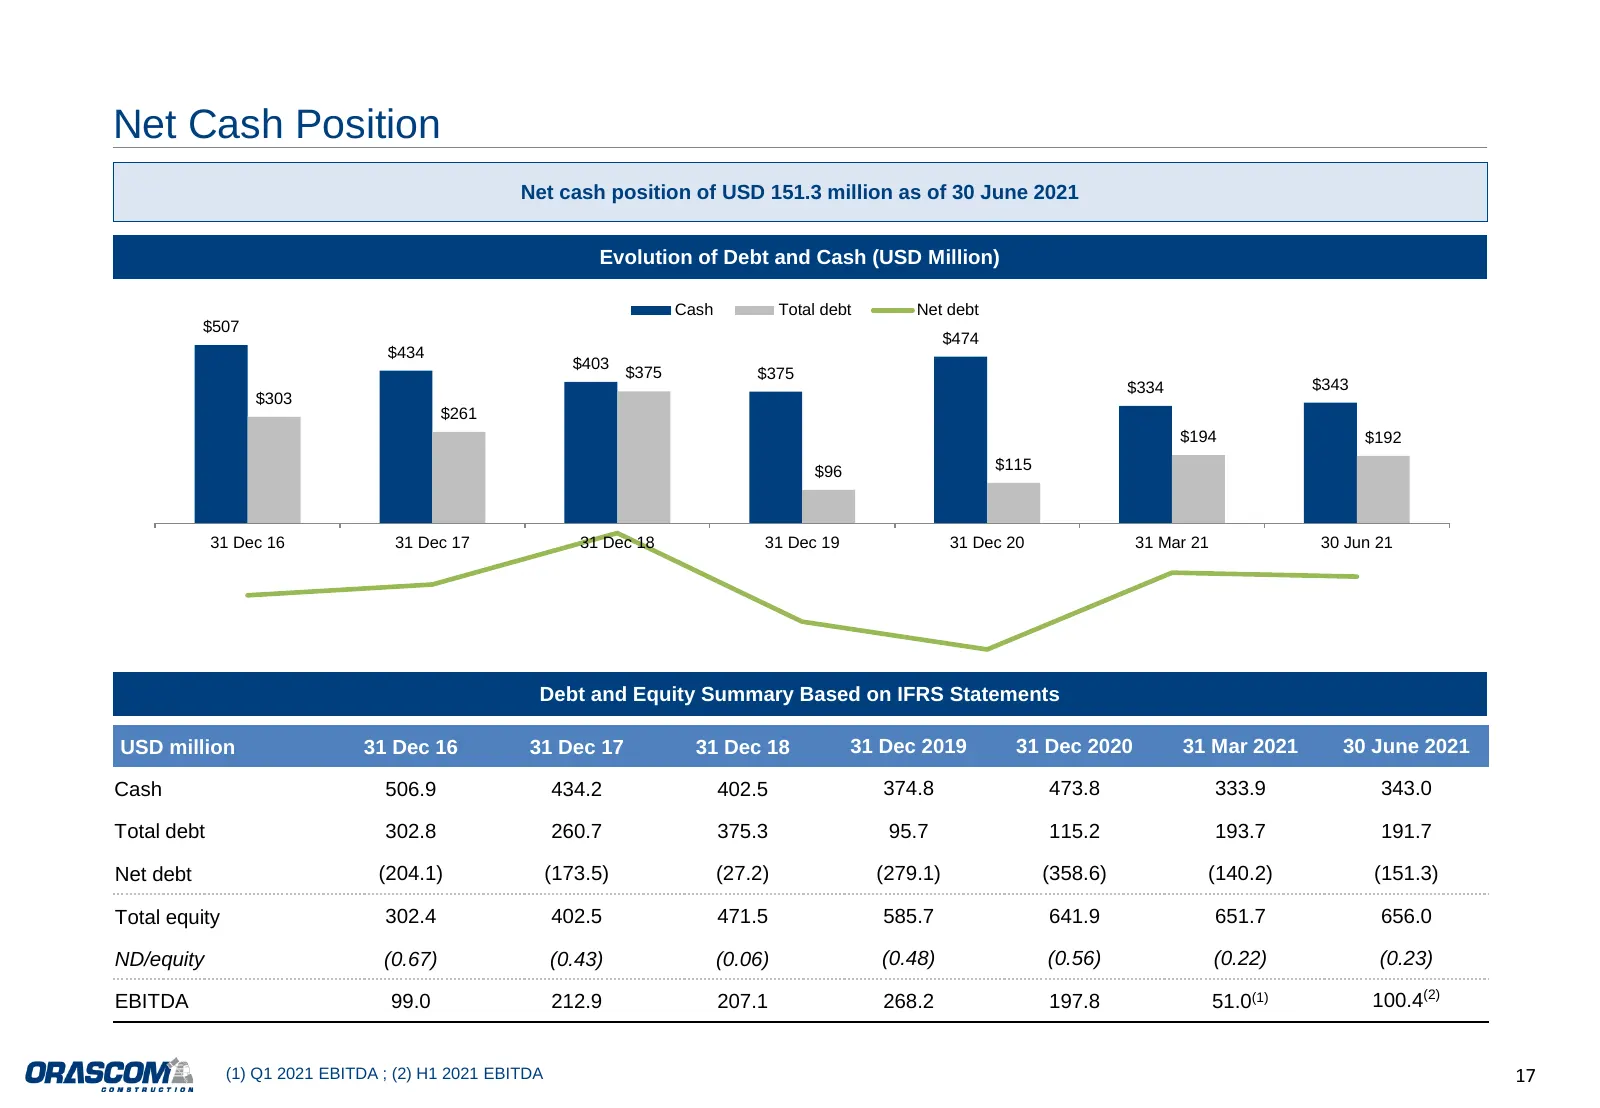
Slide 17: Net Cash Position
Net Cash Position Net cash position of USD 151.3 million as of 30 June 2021 Evolution of Debt and Cash (USD Million) Cash Total debt Net debt $507 $474 $434 $403 $375 $375 $334 $343 $303 $261 $194 $192 $96 $115 31 Dec 16 31 Dec 17 31 Dec 18 31 Dec 19 31 Dec 20 31 Mar 21 30 Jun 21 Debt and Equity Sum
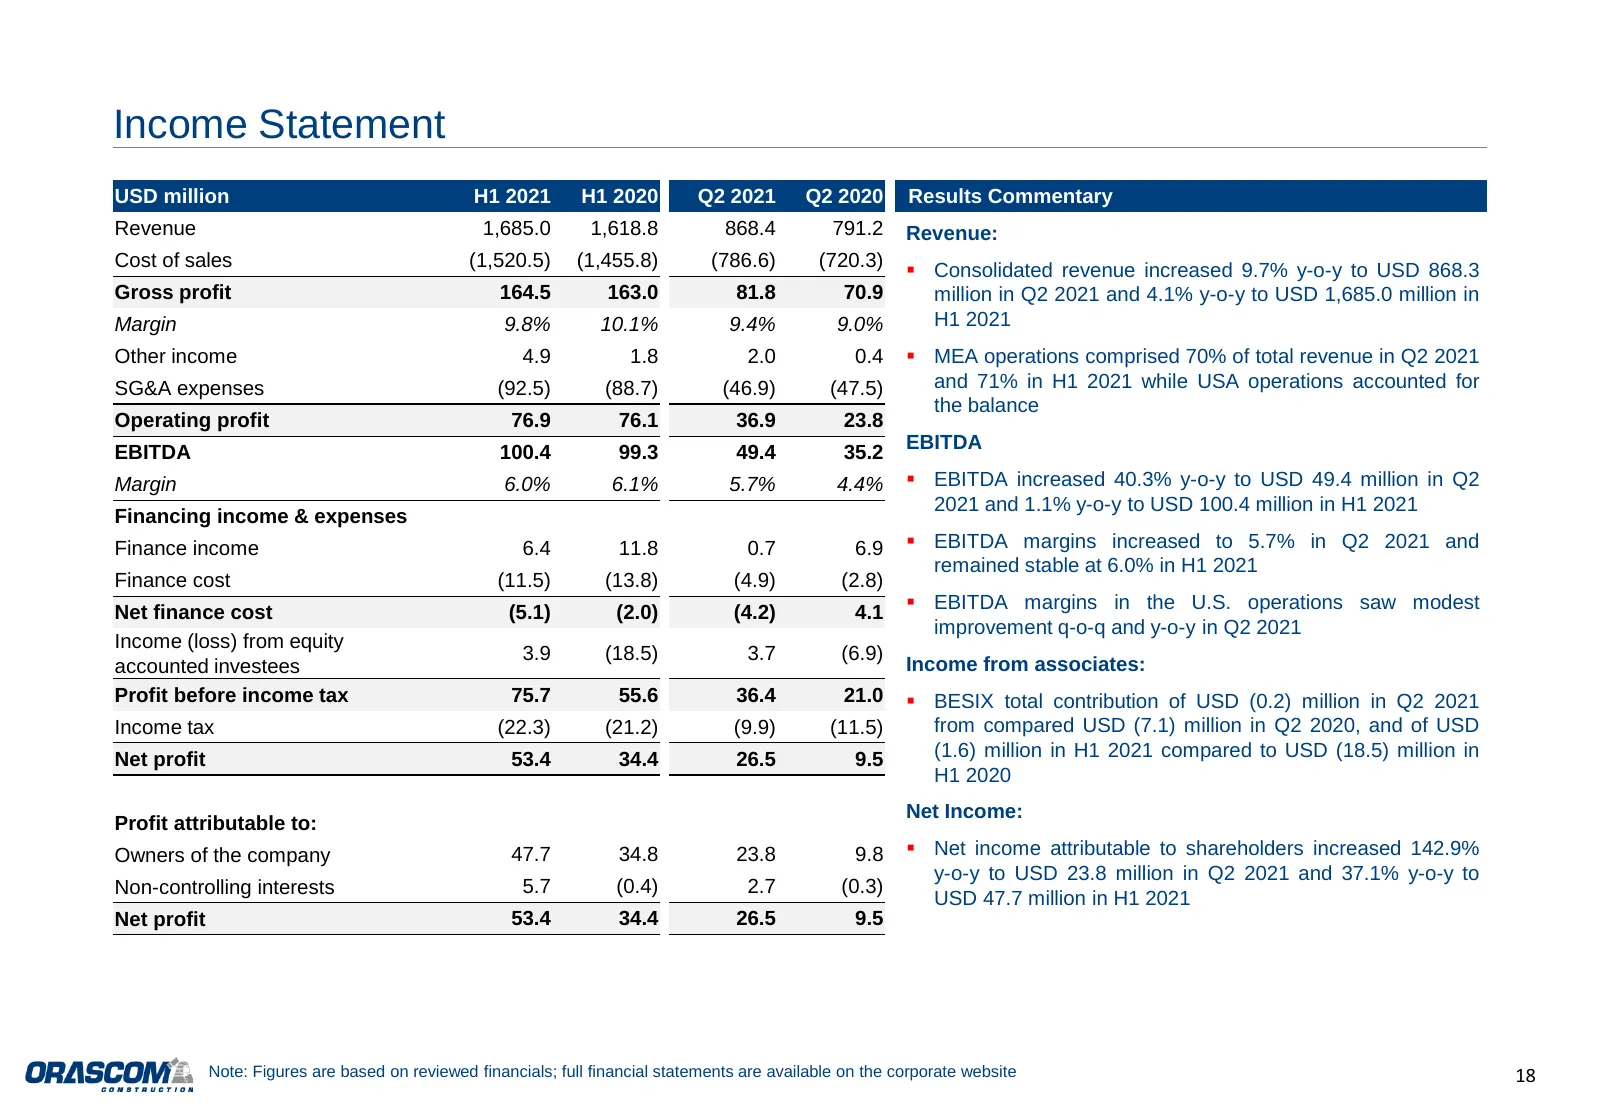
Slide 18: Income Statement
Income Statement USD million H1 2021 H1 2020 Q2 2021 Q2 2020 Results Commentary Revenue 1,685.0 1,618.8 868.4 791.2 Revenue: Cost of sales (1,520.5) (1,455.8) (786.6) (720.3) ▪ Consolidated revenue increased 9.7% y-o-y to USD 868.3 Gross profit 164.5 163.0 81.8 70.9 million in Q2 2021 and 4.1% y-o-y
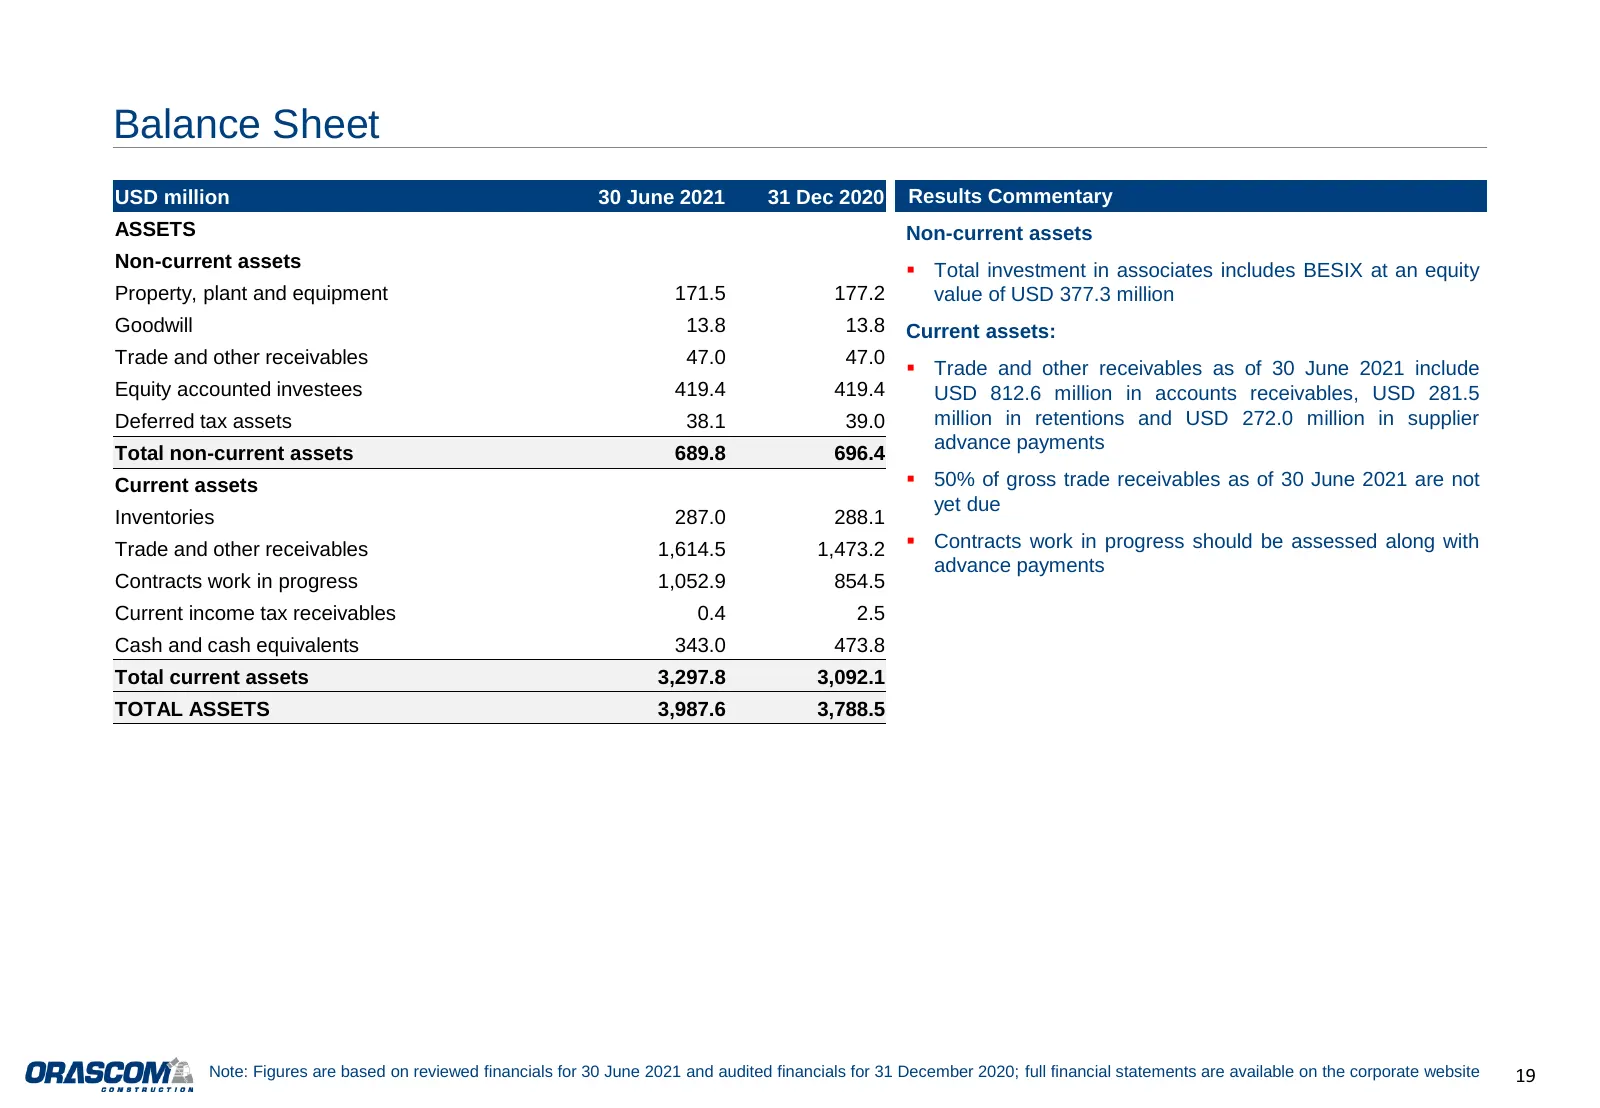
Slide 19: Balance Sheet
Balance Sheet USD million 30 June 2021 31 Dec 2020 Results Commentary ASSETS Non-current assets Non-current assets ▪ Total investment in associates includes BESIX at an equity Property, plant and equipment 171.5 177.2 value of USD 377.3 million Goodwill 13.8 13.8 Current assets: Trade and other rece
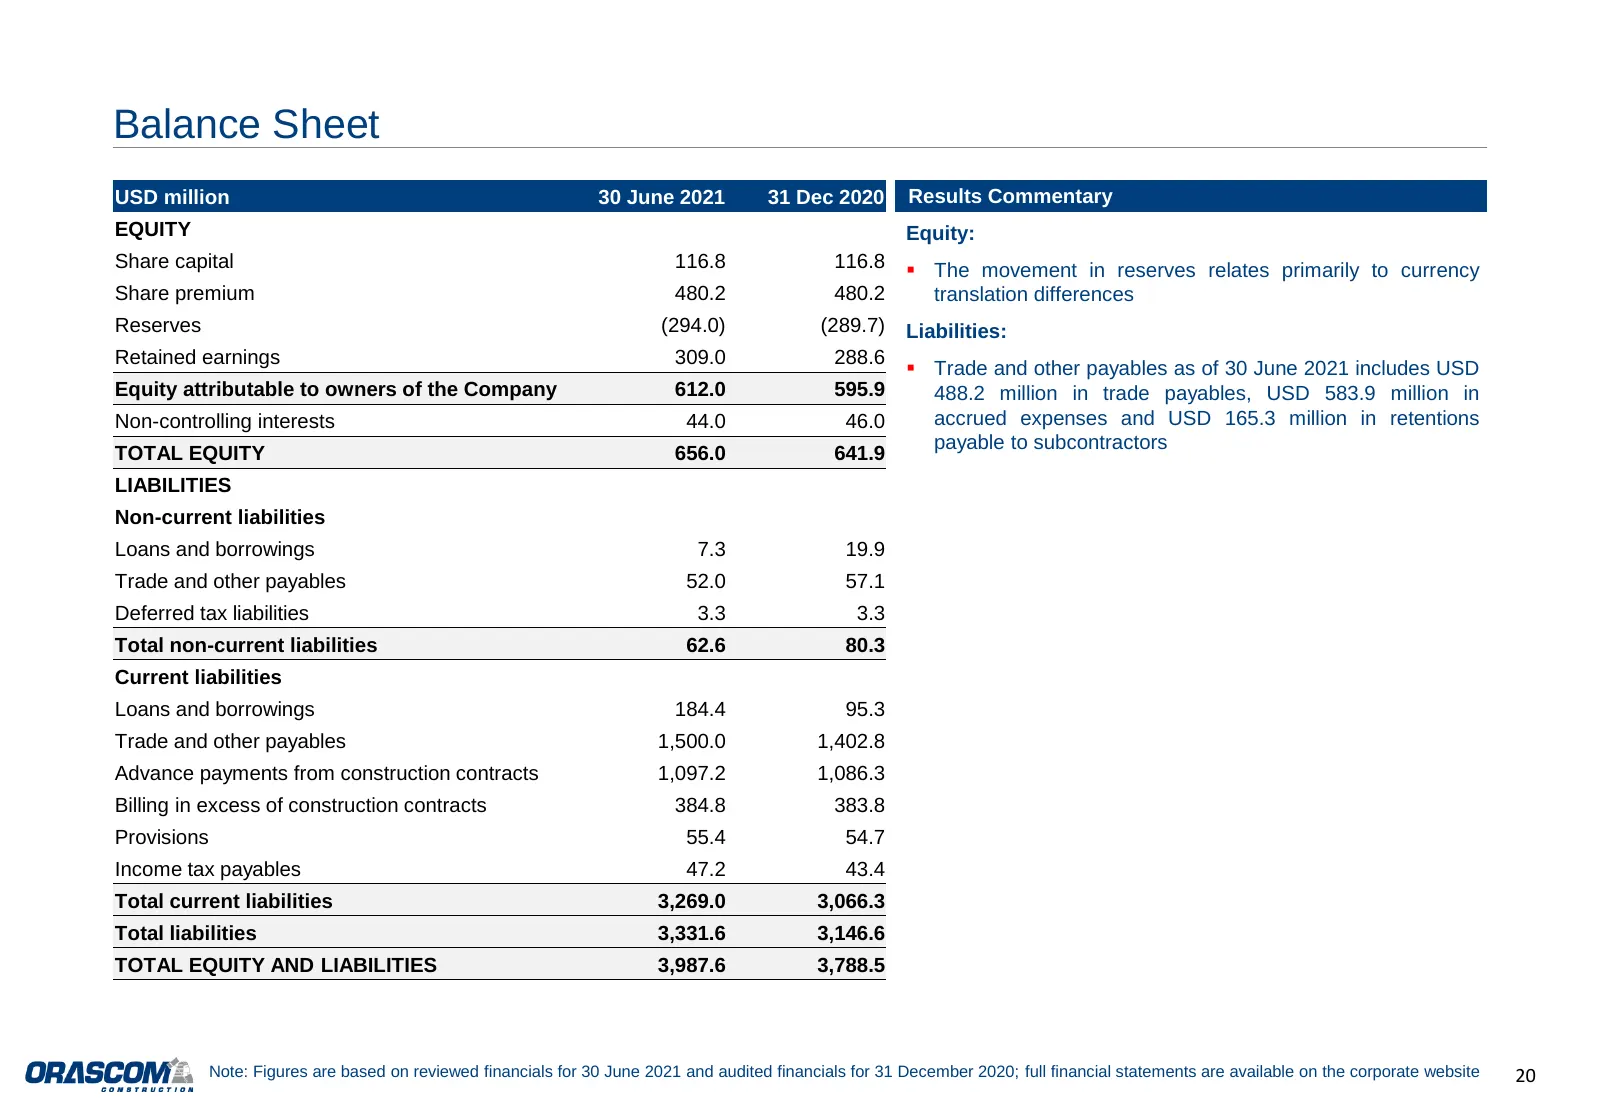
Slide 20: Balance Sheet
Balance Sheet USD million 30 June 2021 31 Dec 2020 Results Commentary EQUITY Equity: Share capital 116.8 116.8 ▪ The movement in reserves relates primarily to currency Share premium 480.2 480.2 translation differences Reserves (294.0) (289.7) Liabilities: Retained earnings 309.0 288.6 ▪ Trade and ot
Slide 21: Cash Flow Statement
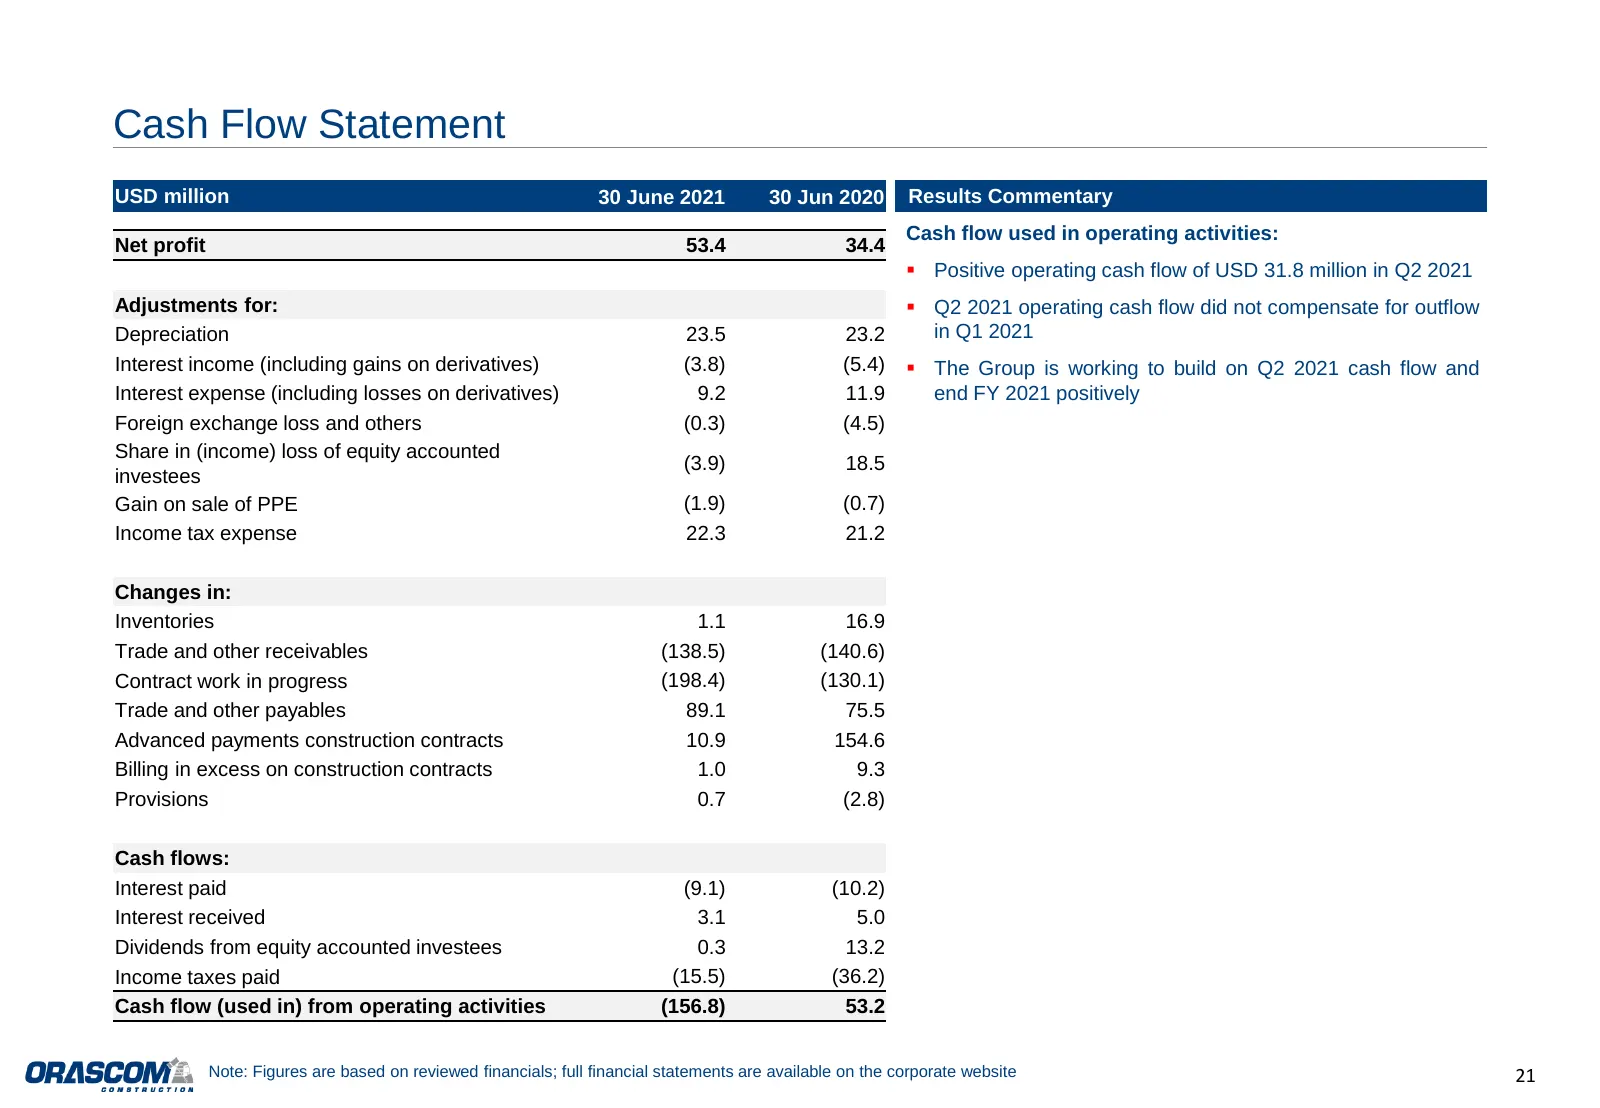
Cash Flow Statement USD million 30 June 2021 30 Jun 2020 Results Commentary Cash flow used in operating activities: Net profit 53.4 34.4 ▪ Positive operating cash flow of USD 31.8 million in Q2 2021 Adjustments for: ▪ Q2 2021 operating cash flow did not compensate for outflow Depreciation 23.5 23.2
Slide 22: Cash Flow Statement
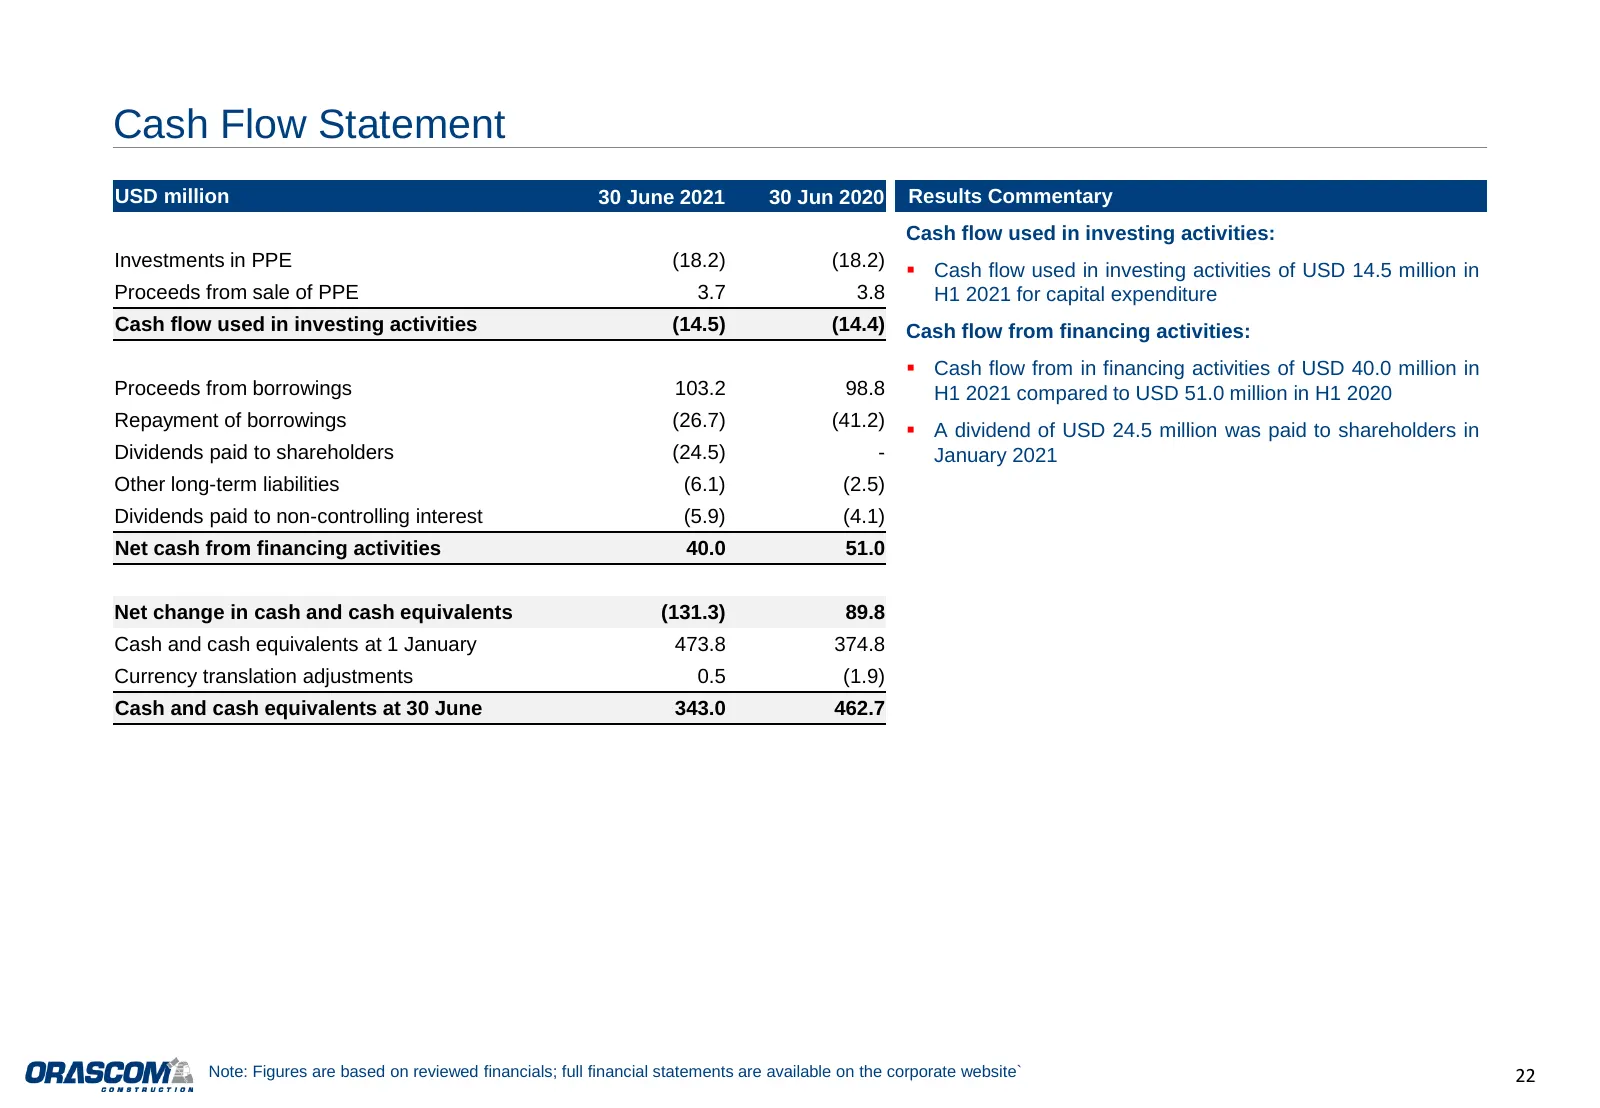
Cash Flow Statement USD million 30 June 2021 30 Jun 2020 Results Commentary Cash flow used in investing activities: Investments in PPE (18.2) (18.2) ▪ Cash flow used in investing activities of USD 14.5 million in Proceeds from sale of PPE 3.7 3.8 H1 2021 for capital expenditure Cash flow used in inv
Slide 23: Appendix
Appendix
Slide 24: Board of Directors
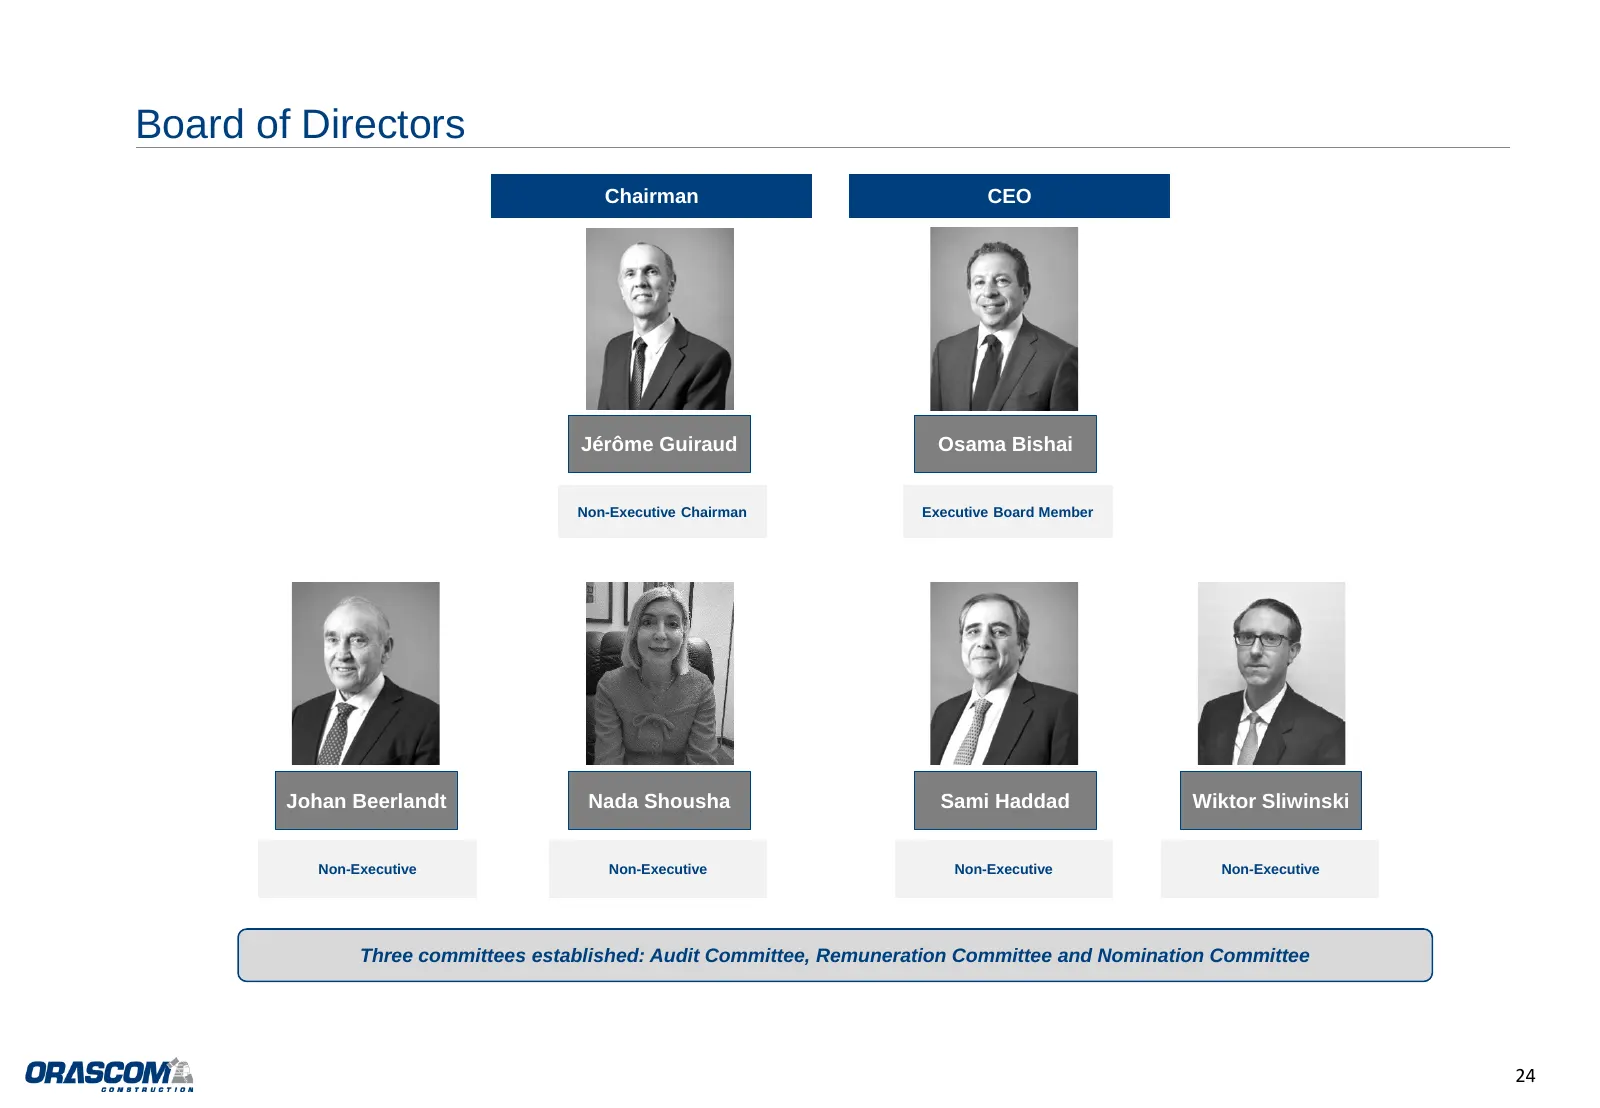
Board of Directors Chairman CEO Jérôme Guiraud Osama Bishai Non-Executive Chairman Executive Board Member Johan Beerlandt Nada Shousha Sami Haddad Wiktor Sliwinski Non-Executive Non-Executive Non-Executive Non-Executive Three committees established: Audit Committee, Remuneration Committee and Nomina
Slide 25: Entrepreneurial Track Record
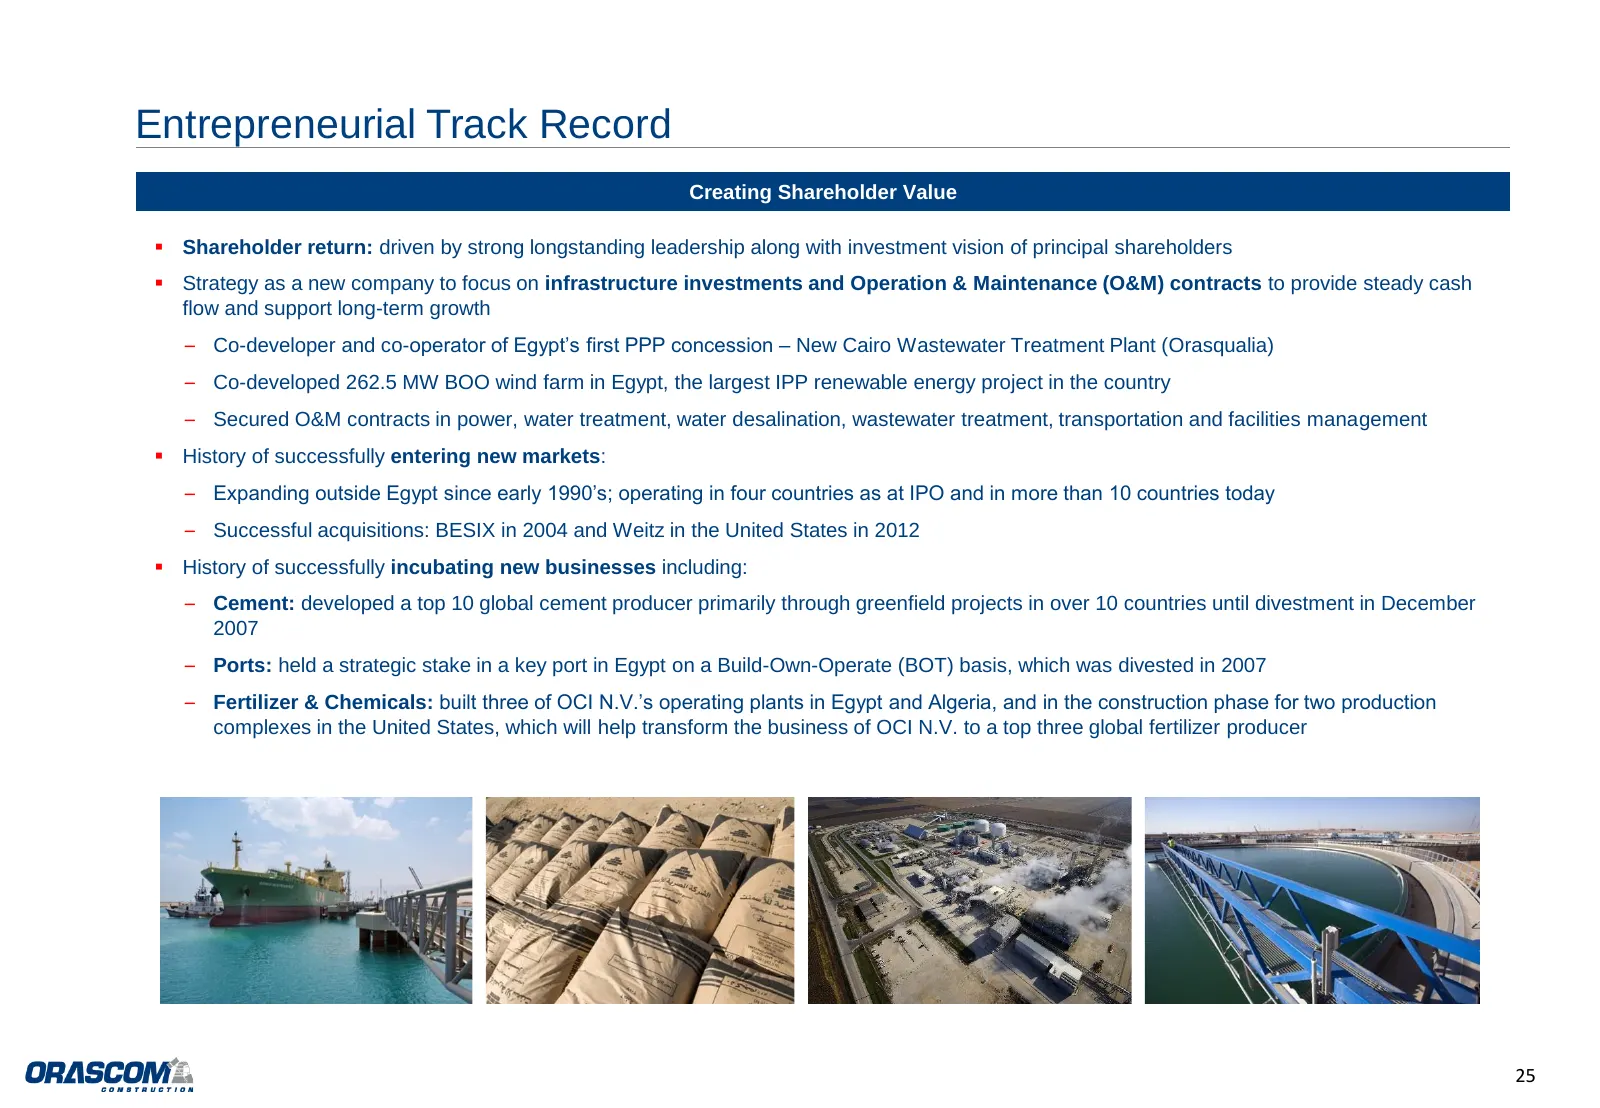
Entrepreneurial Track Record Creating Shareholder Value ▪ Shareholder return: driven by strong longstanding leadership along with investment vision of principal shareholders ▪ Strategy as a new company to focus on infrastructure investments and Operation & Maintenance (O&M) contracts to provide stea
Slide 26: Longstanding Position as Global Contractor of Choice
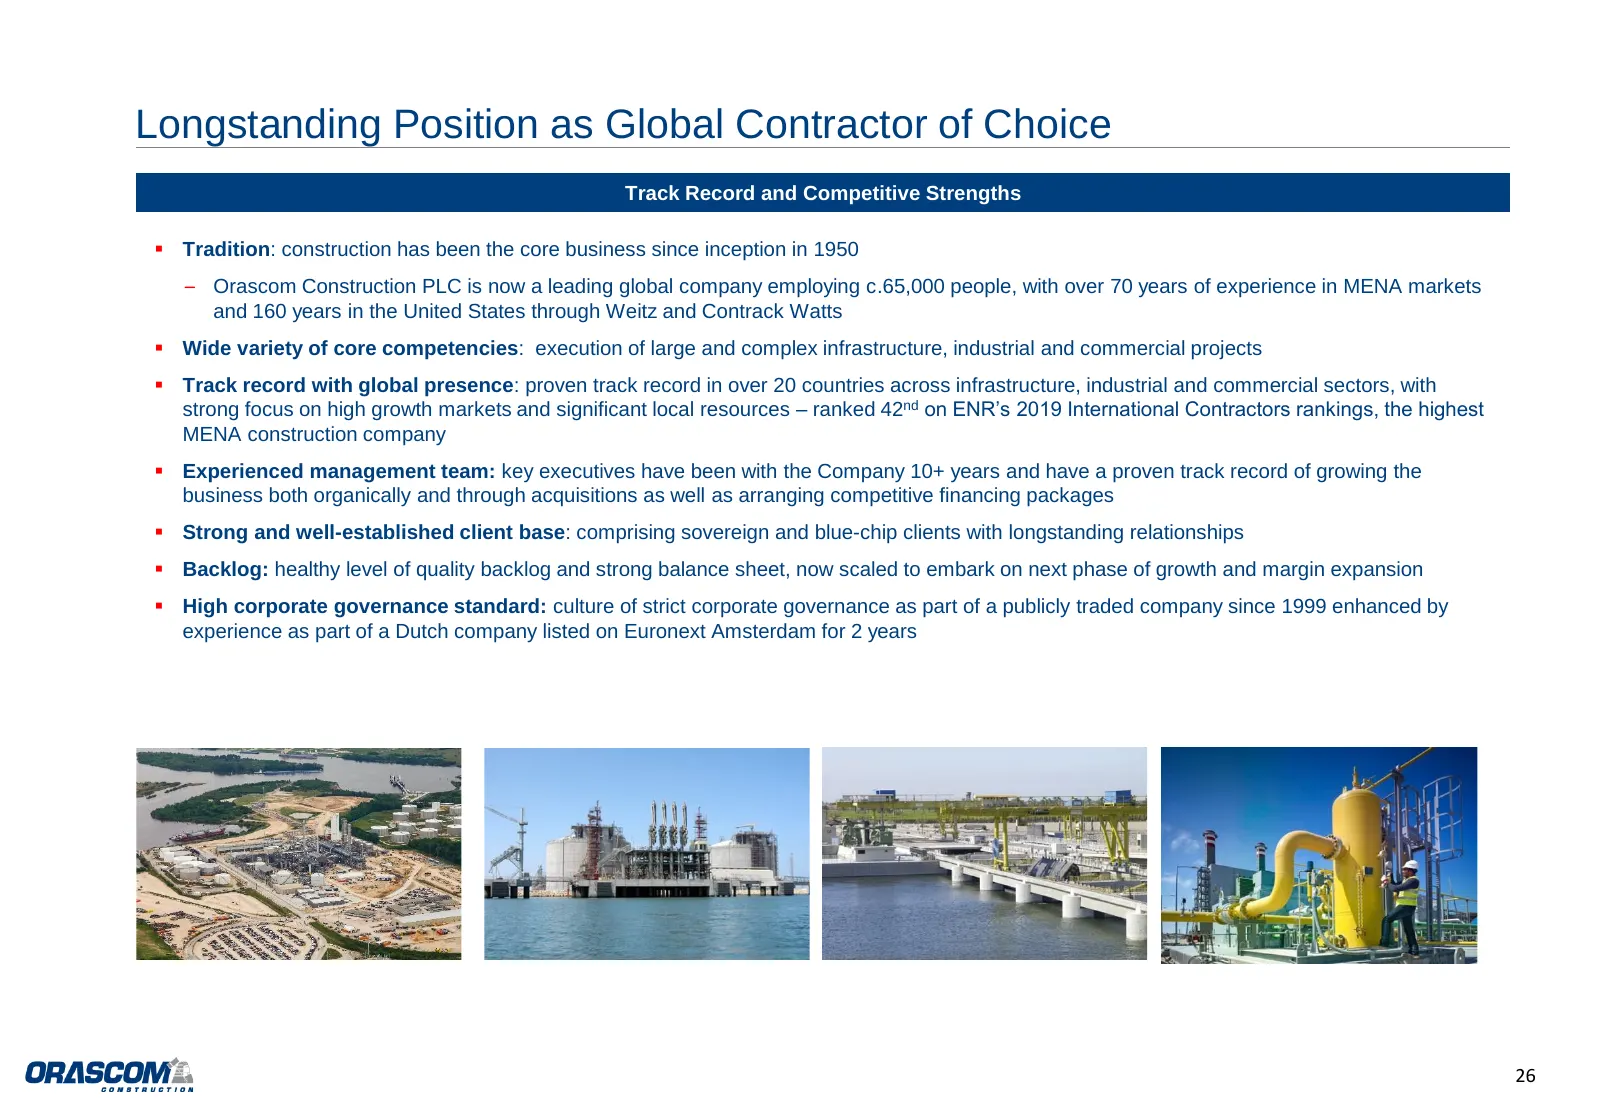
Longstanding Position as Global Contractor of Choice Track Record and Competitive Strengths ▪ Tradition: construction has been the core business since inception in 1950 – Orascom Construction PLC is now a leading global company employing c.65,000 people, with over 70 years of experience in MENA mark
Slide 27: Group Strategy Aimed at Delivering Top and Bottom Line Growth
Group Strategy Aimed at Delivering Top and Bottom Line Growth The Group has focused on creating shareholder value in the process of becoming a leading private sector contractor and an incubator of high-value industrial businesses Commitment instilled in management and founding shareholders to propel
Slide 28: Pursuing Value Accretive Investments
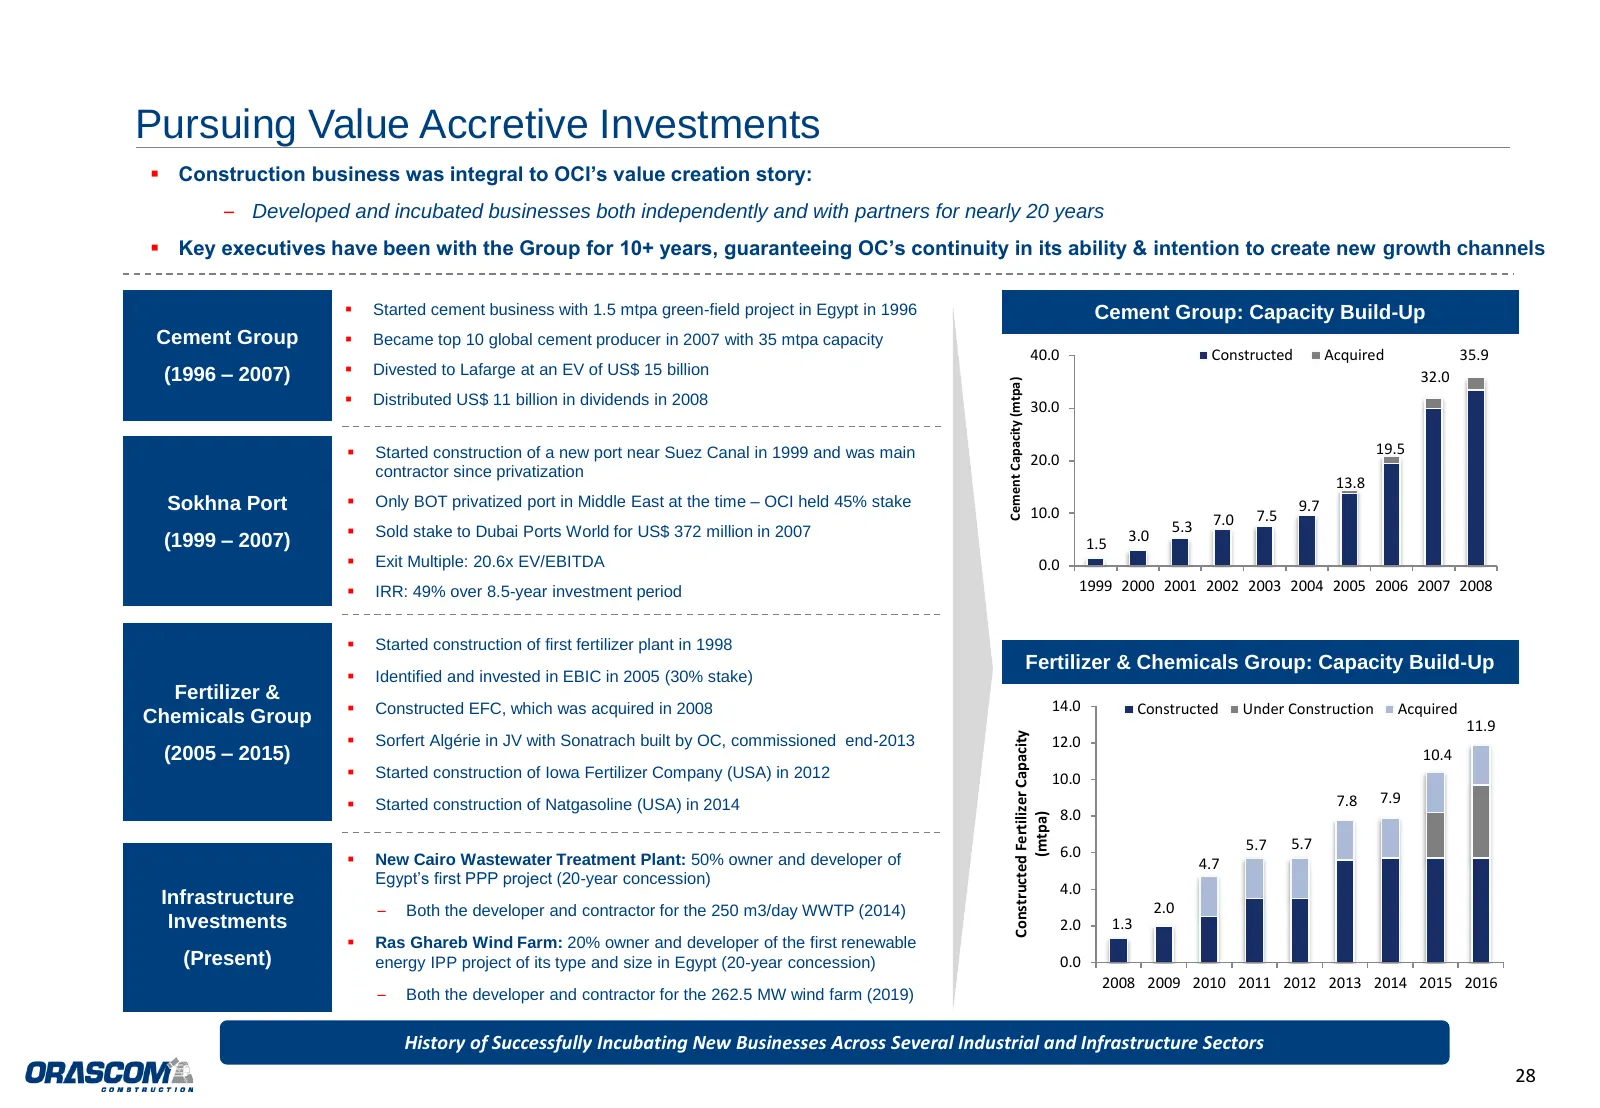
Pursuing Value Accretive Investments ▪ Construction business was integral to OCI’s value creation story: – Developed and incubated businesses both independently and with partners for nearly 20 years ▪ Key executives have been with the Group for 10+ years, guaranteeing OC’s continuity in its ability
Slide 29: Important Notice and Disclaimer
Important Notice and Disclaimer This document has been provided to you for information purposes only. This document does not constitute an offer of, or an invitation to invest or deal in, the securities of Orascom Construction PLC (the “Company”). The information set out in this document shall not f
Slide 30: Contact Investor Relations
Contact Investor Relations: Hesham El Halaby Director hesham.elhalaby@orascom.com T: +971 4 318 0900 NASDAQ Dubai: OC EGX: ORAS www.orascom.com
Source: Internet Archive copy of orascom.com
More decks from Orascom Construction PLC
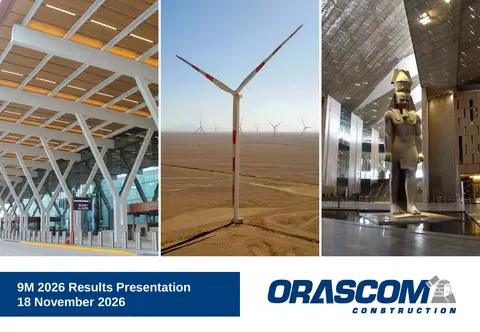 9M 2026 Earnings Presentation17 slides · Nov 18, 2026
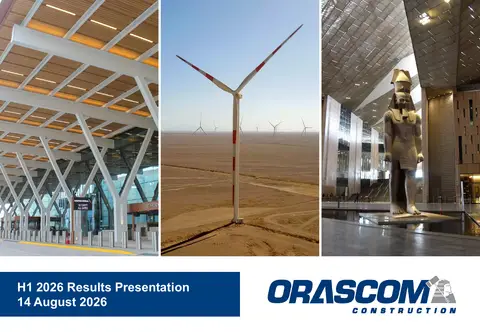 H1 2026 Earnings Presentation17 slides · Aug 14, 2026
 Investor Presentation (August 2026)27 slides · August 2026
 Q1 2026 Earnings Presentation16 slides · May 14, 2026
 Investor Presentation (May 2026)26 slides · May 2026
 Investor Presentation (April 2026)26 slides · April 2026