Shoals Technologies Group, Inc. · NASDAQ:SHLS
Shoals Technologies — Non-Deal Roadshow (August 2021)
41 slides from Shoals Technologies's roadshow presentation, August 2021
Slide 1: Q2 2021 Investor Presentation
August 2021 DRAFT TECHNOLOGIES GROUP, INC. Q2 2021 Investor Presentation
Slide 2: Disclaimer: Forward-Looking Statements and Other Information
DISCLAIMER Forward-Looking Statements and Other Information This presentation contains “forward-looking statements” within the meaning of the “safe harbor” provisions of the United States Private Securities Litigation Reform Act of 1995 and the securities laws of other jurisdictions. All statements
Slide 3: Disclaimer: Non-GAAP Financial Information
DISCLAIMER Non-GAAP Financial Information This presentation includes unaudited financial measures that exclude items and therefore are not in accordance with U.S. generally accepted accounting principles (“GAAP”), including Adjusted EBITDA and Adjusted Net Income. The Company presents Adjusted EBITD
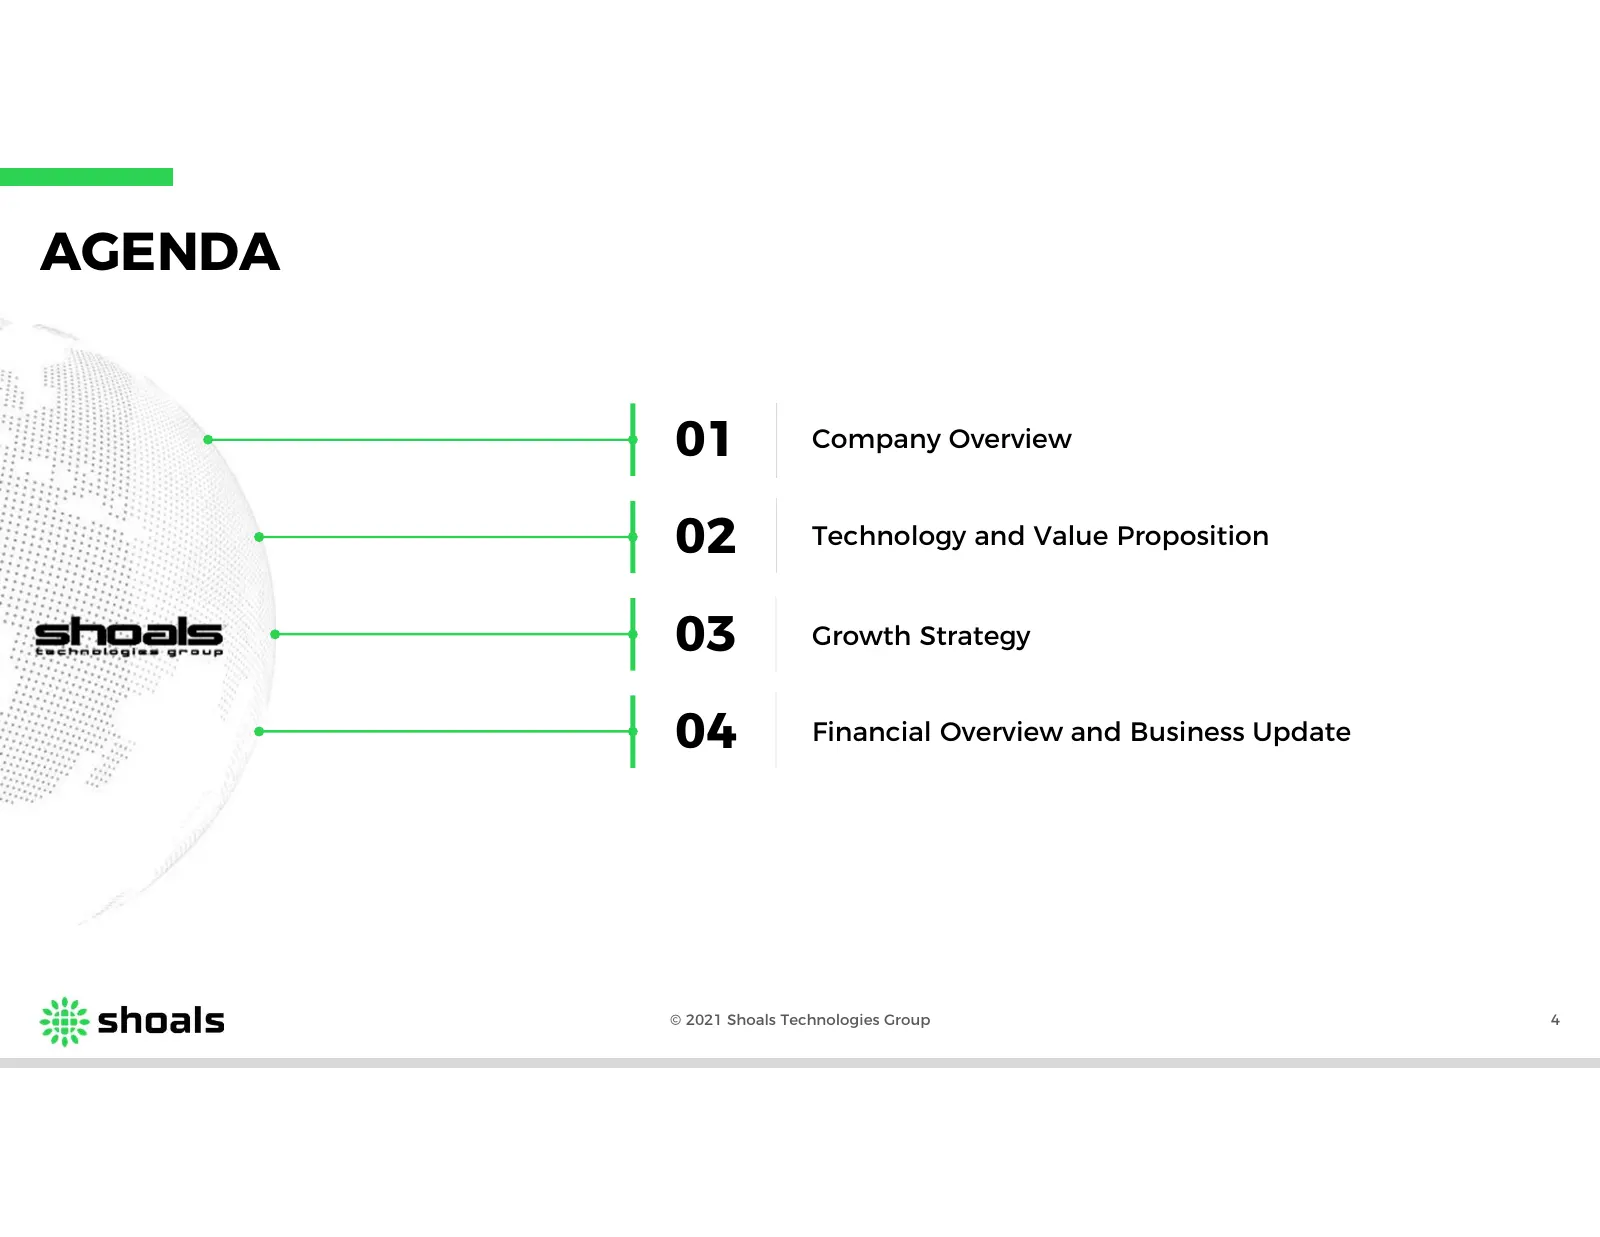
Slide 4: Agenda
AGENDA 01 Company Overview 02 Technology and Value Proposition 03 Growth Strategy 04 Financial Overview and Business Update © 2021 Shoals Technologies Group 4
Slide 5: Company Overview
Pay COMPANY OVERVIEW
Slide 6: Who We Are
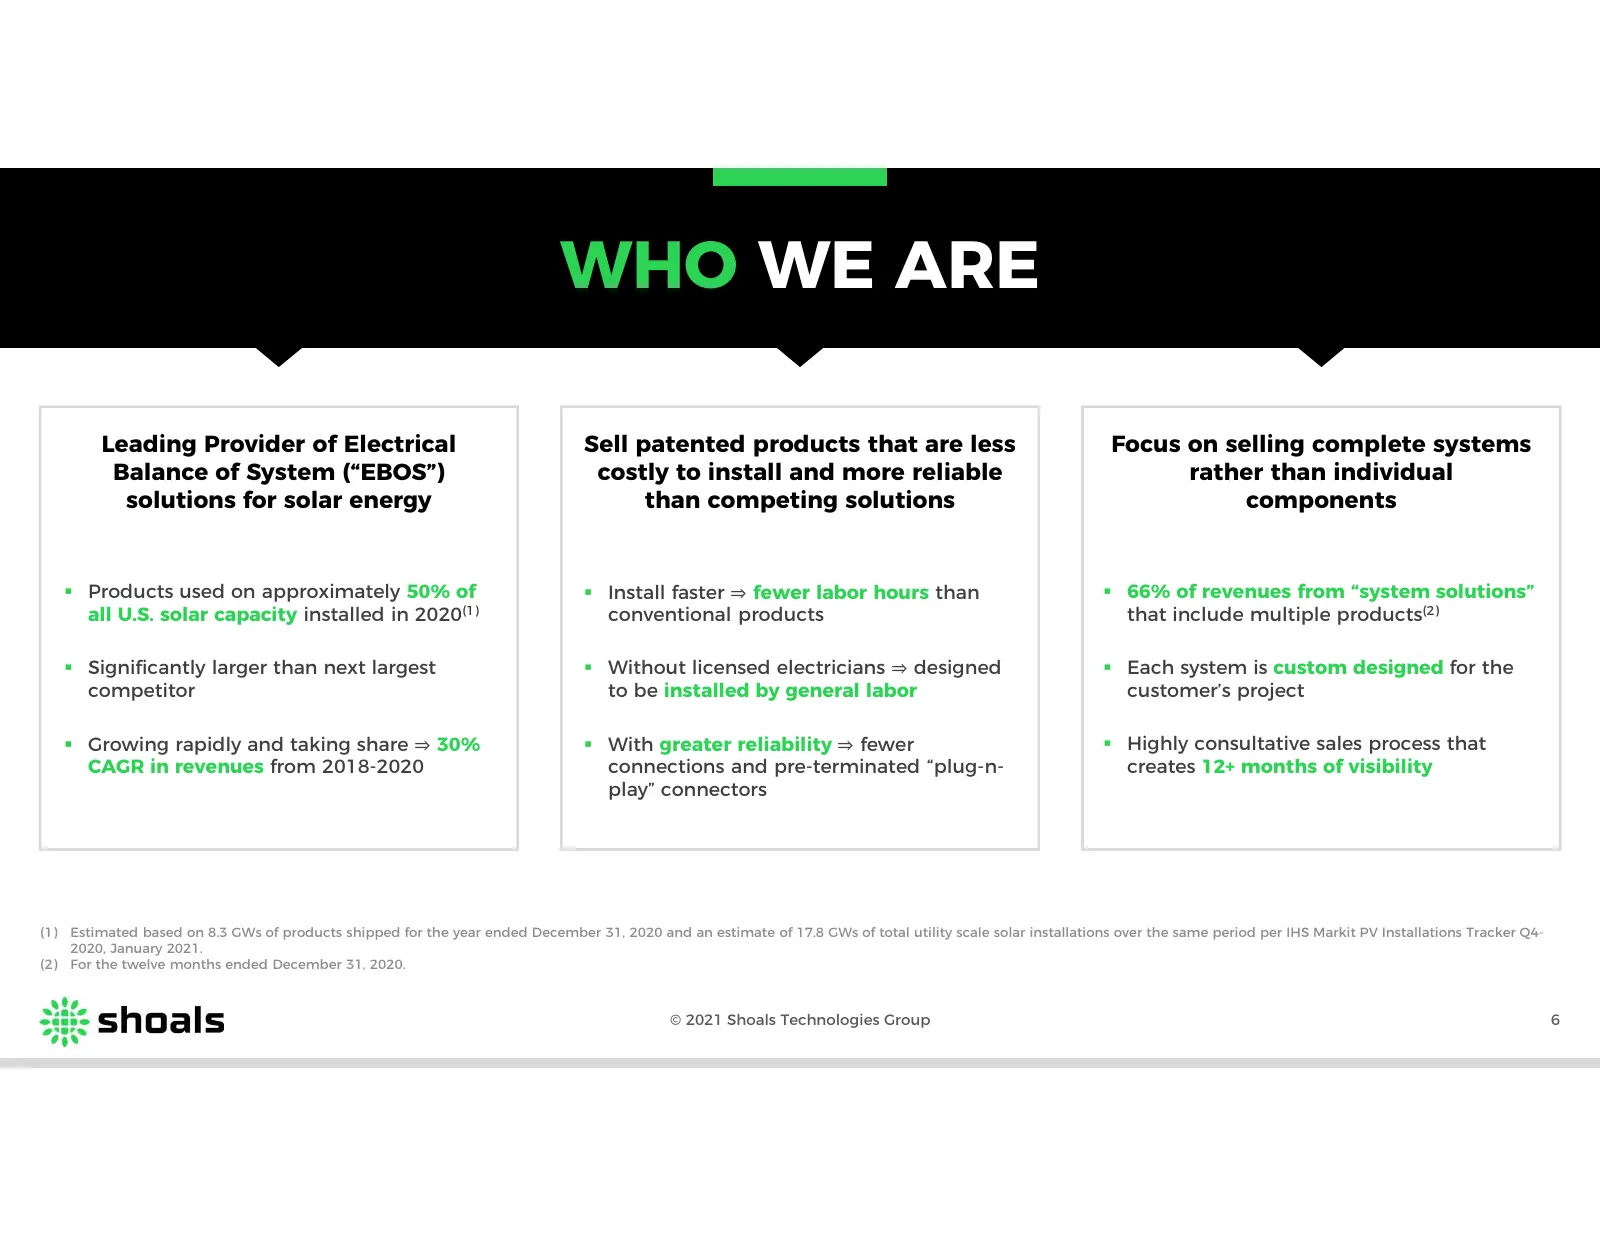
WHO WE ARE Leading Provider of Electrical Sell patented products that are less Focus on selling complete systems Balance of System (“EBOS”) costly to install and more reliable rather than individual solutions for solar energy than competing solutions components Products used on approximately 50% o
Slide 7: Our Products
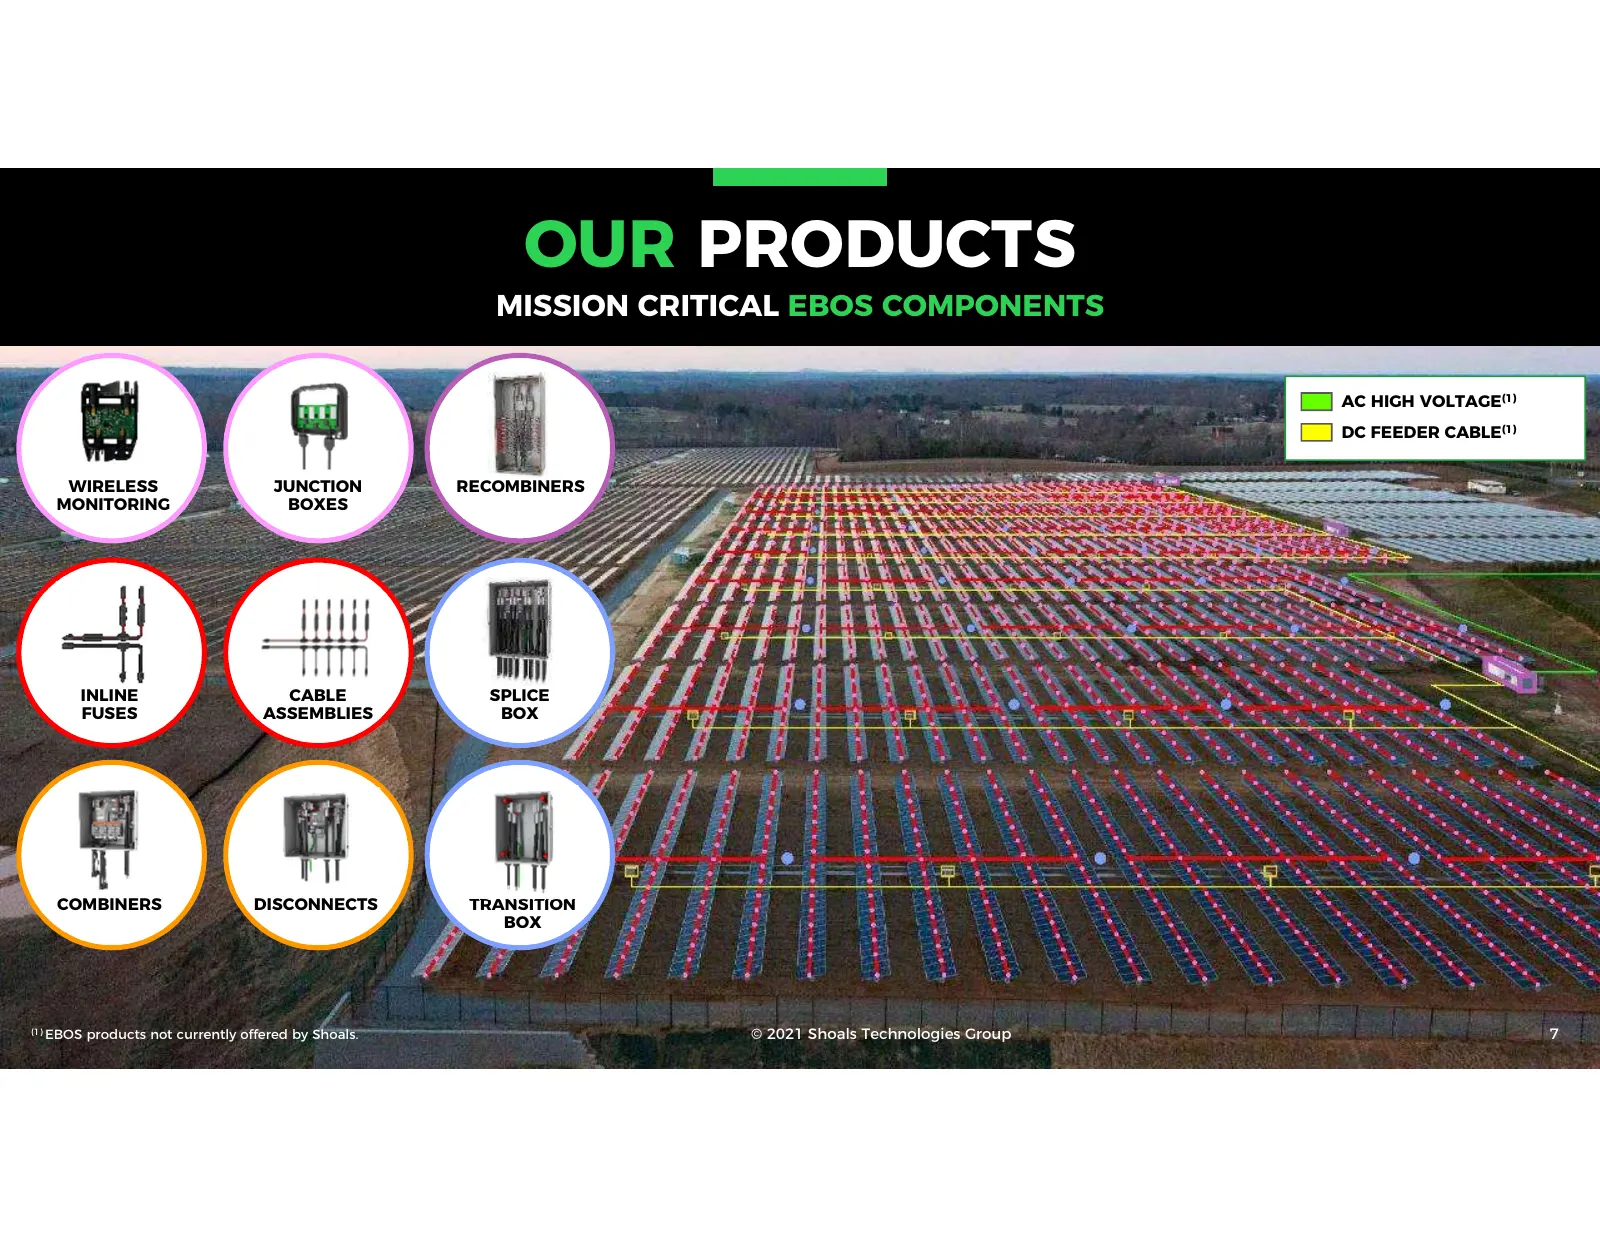
OUR PRODUCTS MISSION CRITICAL EBOS COMPONENTS AC HIGH VOLTAGE(1) DC FEEDER CABLE(1) WIRELESS JUNCTION RECOMBINERS MONITORING BOXES INLINE CABLE SPLICE FUSES ASSEMBLIES BOX COMBINERS DISCONNECTS TRANSITION BOX © 2021 Shoals Technologies Group 7 (1) EBOS products not currently offered by Shoals. © 202
Slide 8: EBOS Is an Attractive Segment
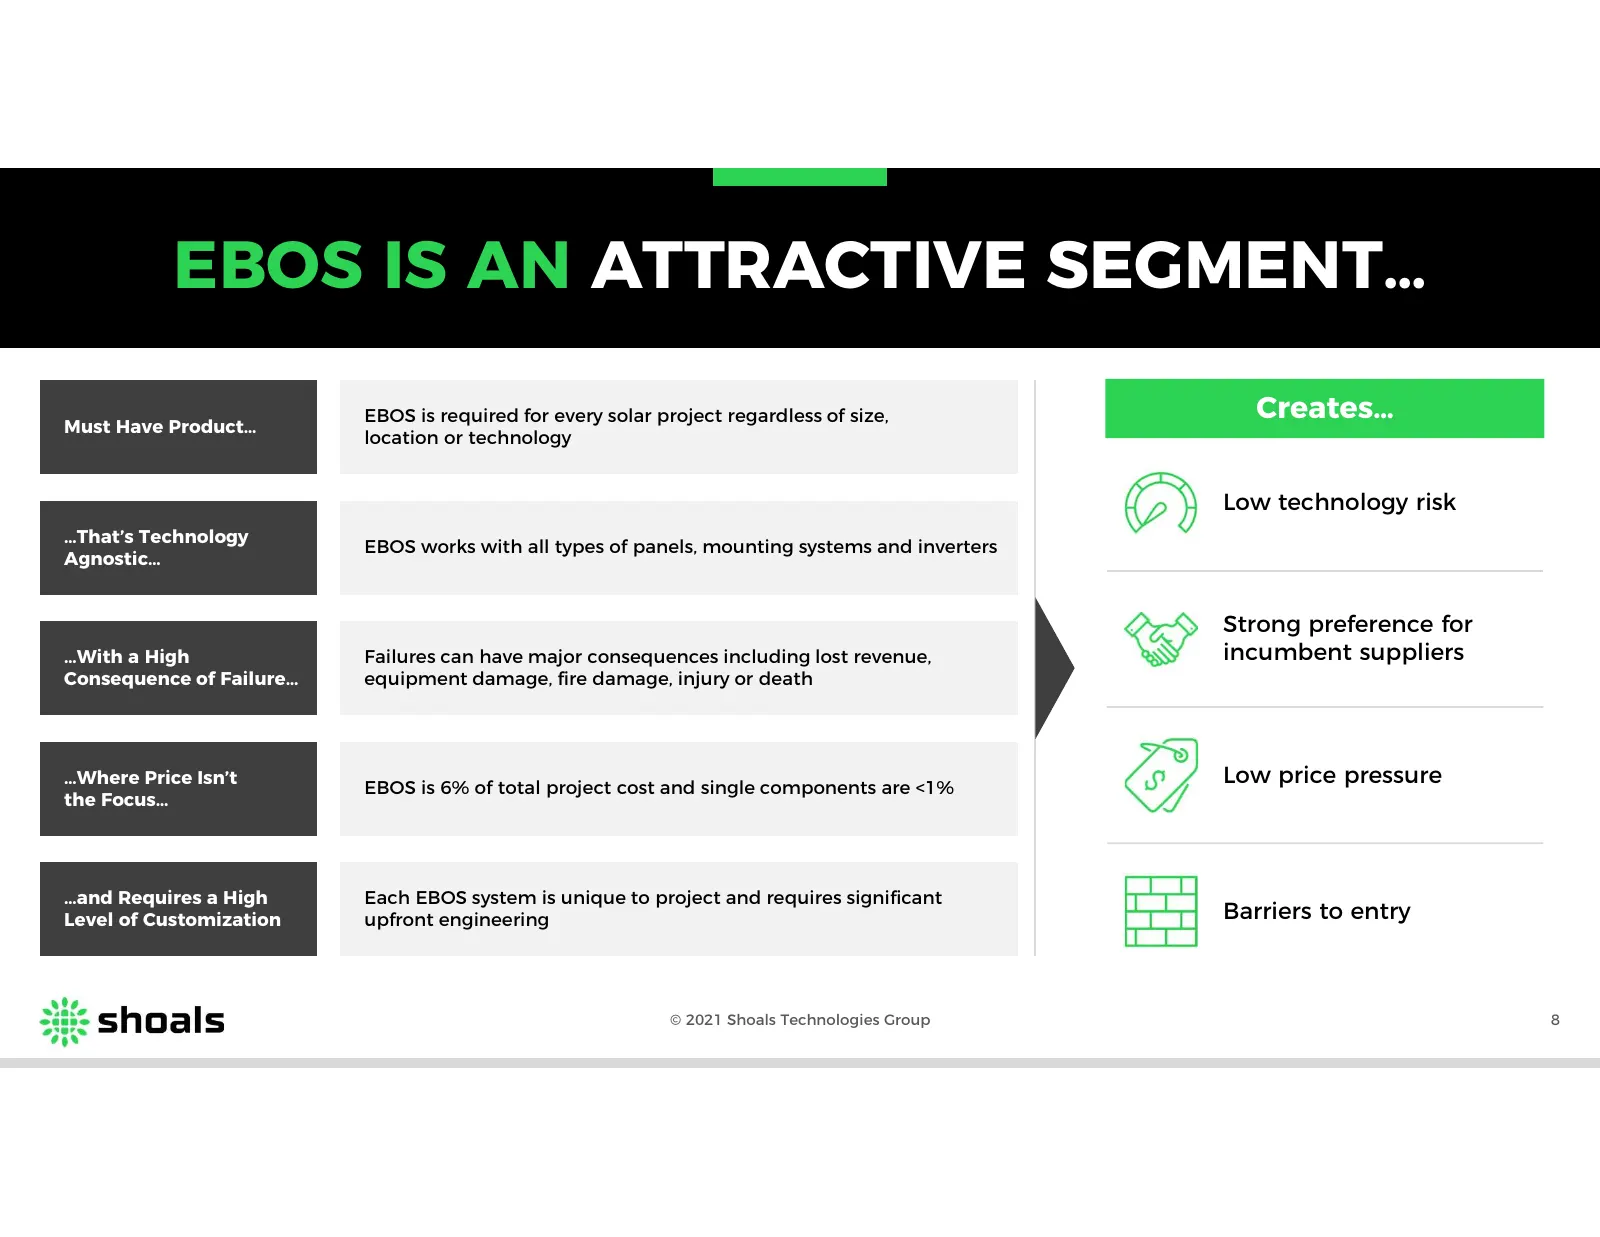
EBOS IS AN ATTRACTIVE SEGMENT… Must Have Product… EBOS is required for every solar project regardless of size, Creates… location or technology Low technology risk …That’s Technology EBOS works with all types of panels, mounting systems and inverters Agnostic… Strong preference for …With a High Failu
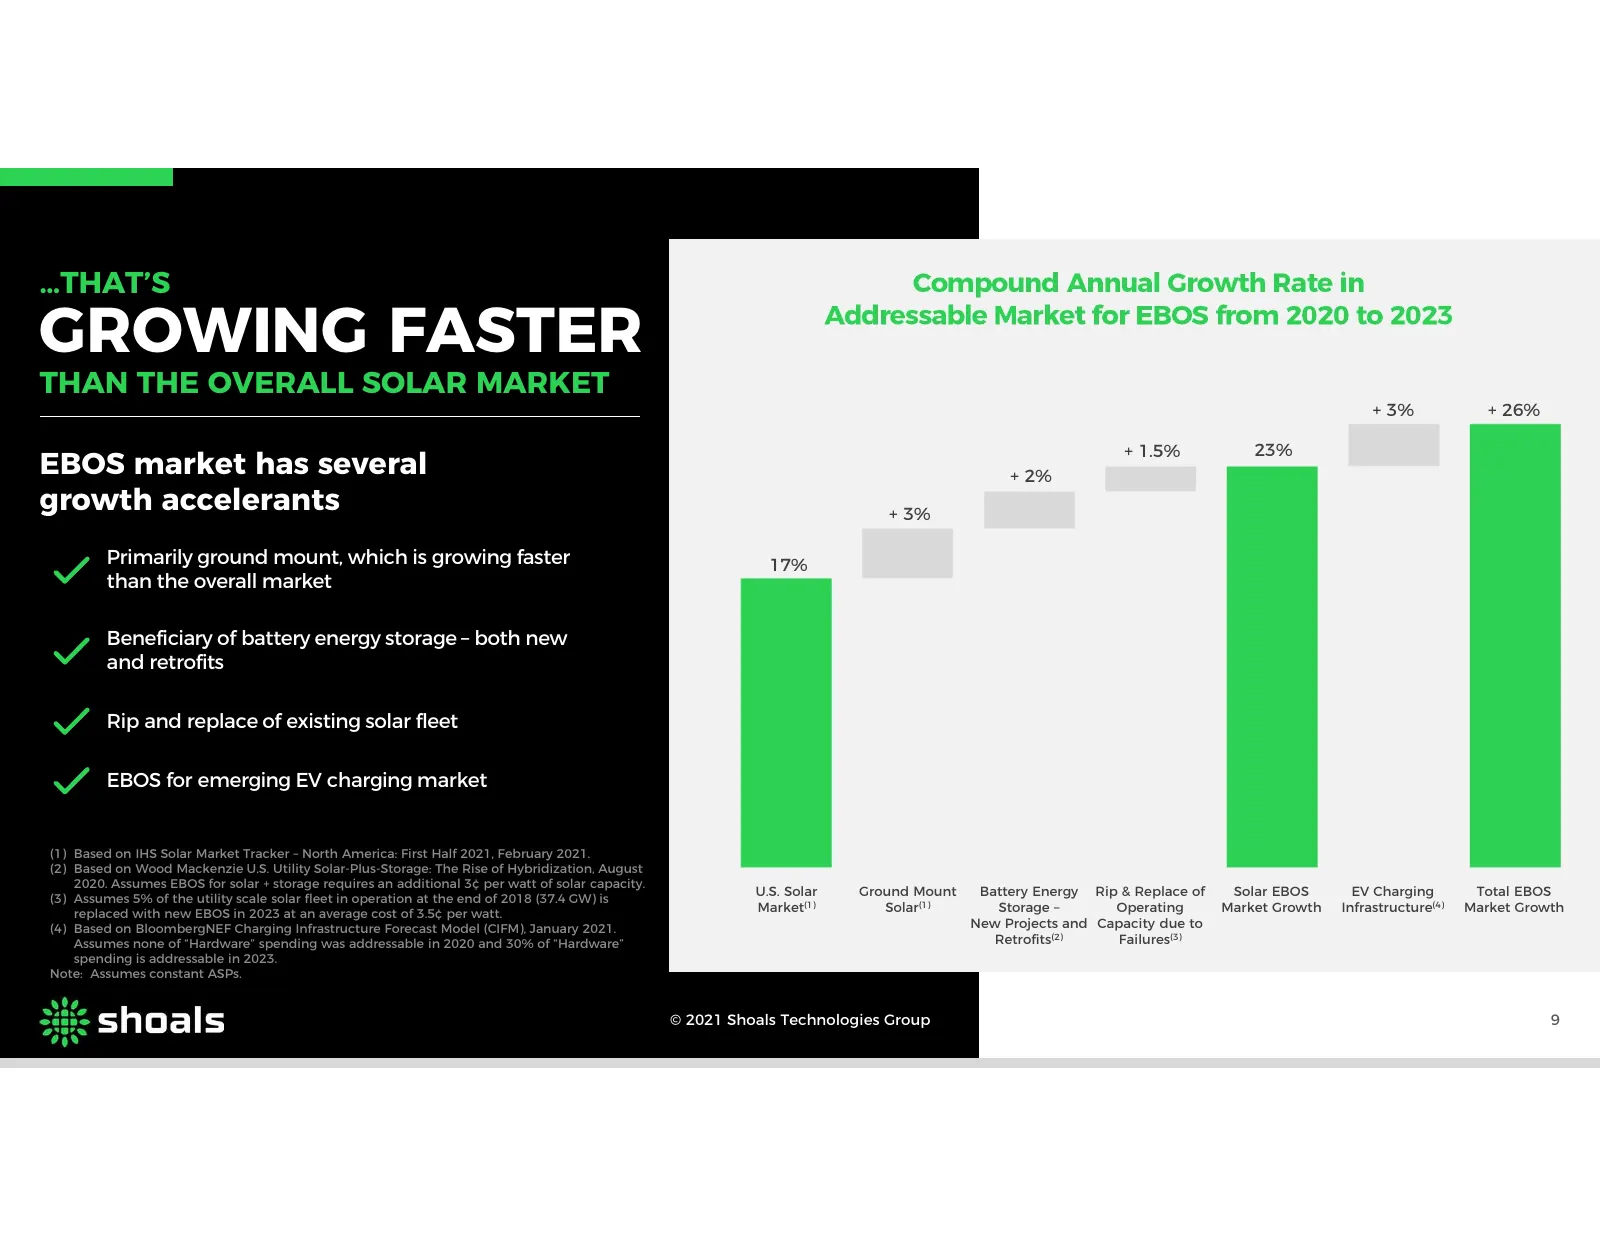
Slide 9: Growing Faster Than the Overall Solar Market
…THAT’S Compound Annual Growth Rate in GROWING FASTER Addressable Market for EBOS from 2020 to 2023 THAN THE OVERALL SOLAR MARKET + 3% + 26% + 1.5% 23% EBOS market has several + 2% growth accelerants + 3% Primarily ground mount, which is growing faster 17% than the overall market Beneficiary of batt
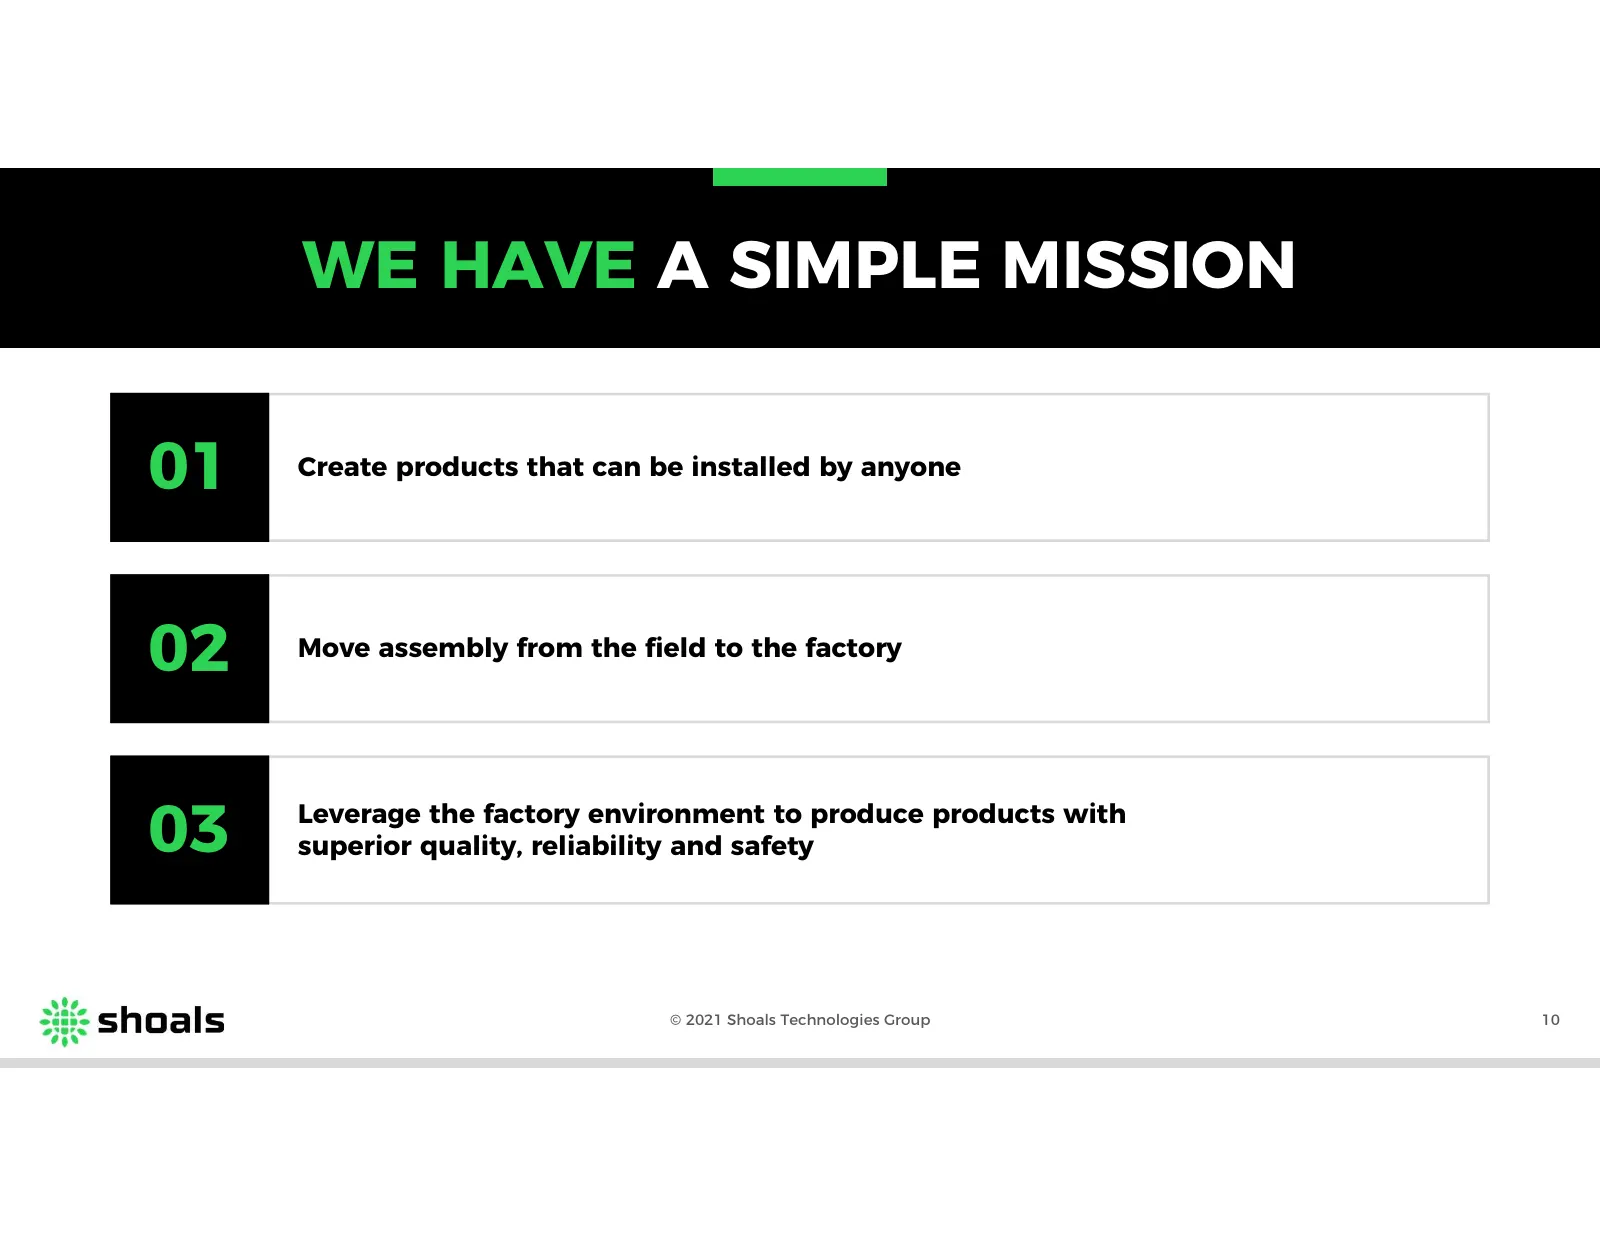
Slide 10: We Have a Simple Mission
12 I would move 3 to 2 and add comment about best value for 3 WE HAVE A SIMPLE MISSION 01 Create products that can be installed by anyone 02 Move assembly from the field to the factory 03 Leverage the factory environment to produce products with superior quality, reliability and safety © 2021 Shoals
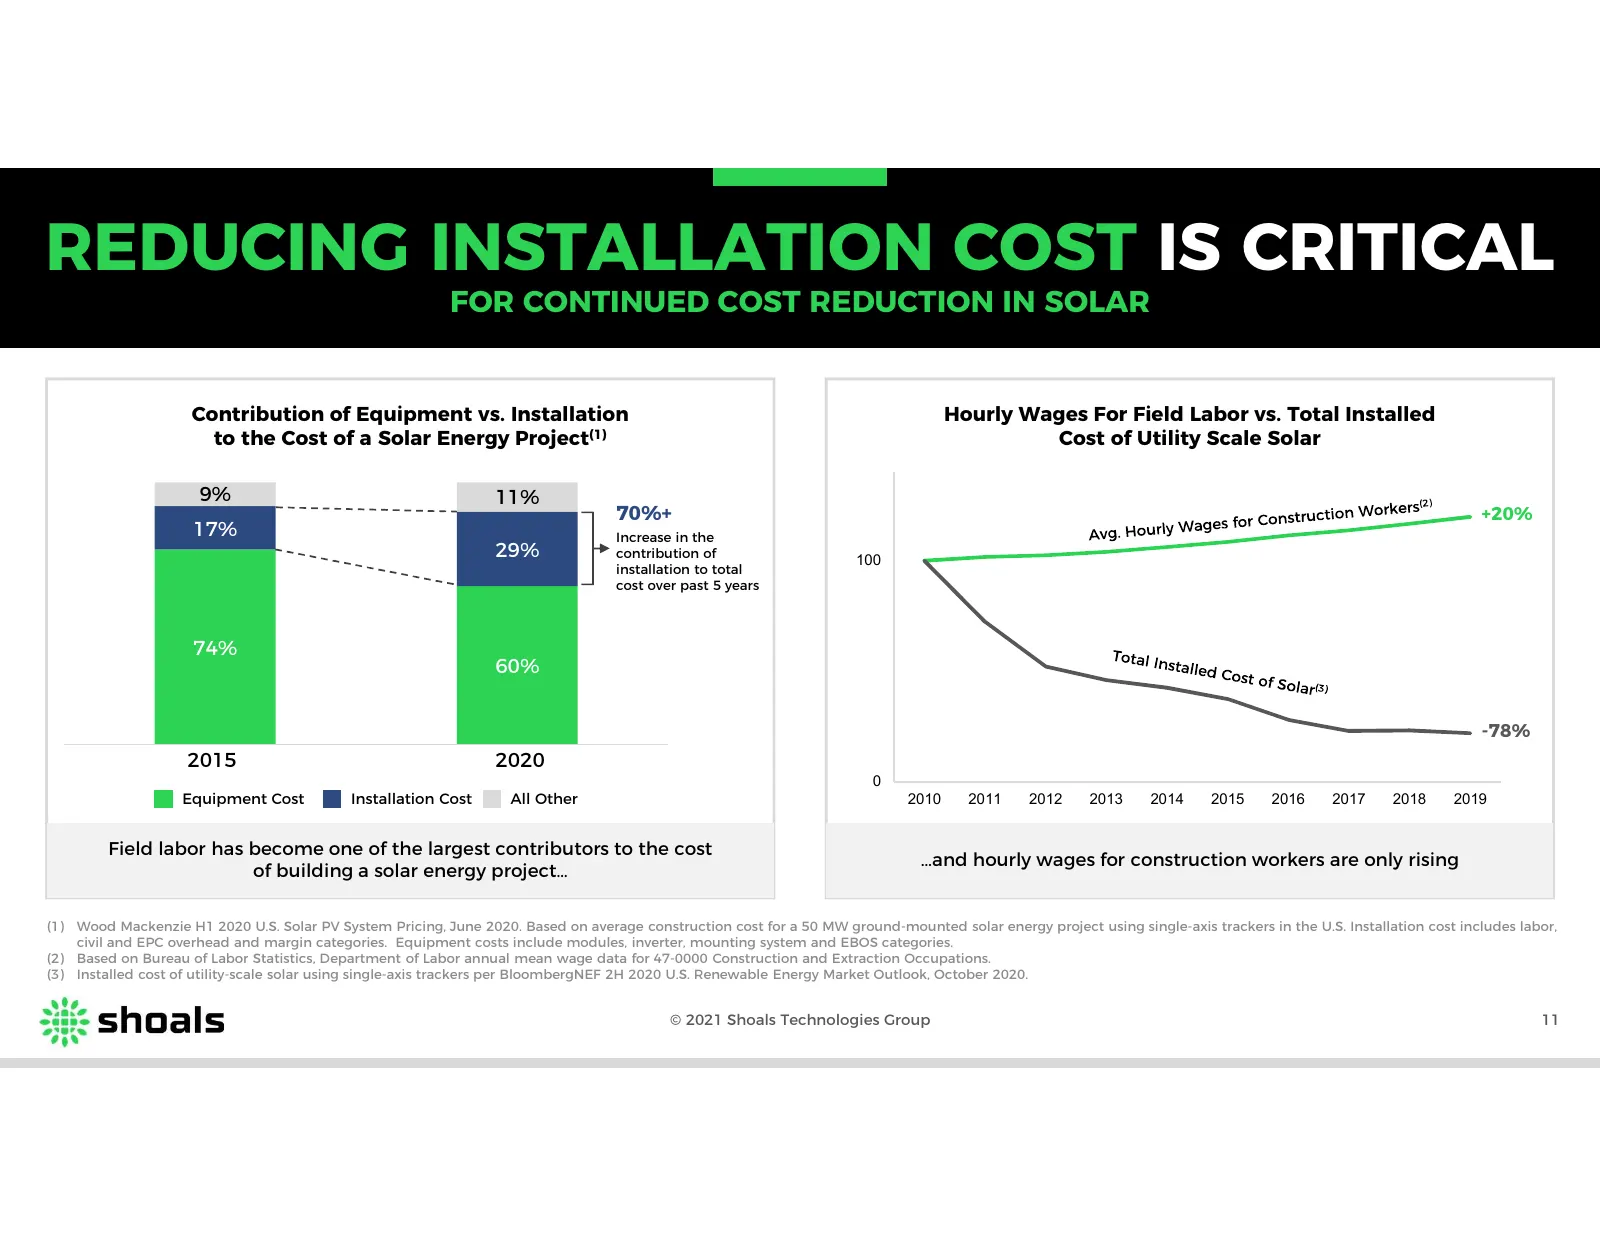
Slide 11: Reducing Installation Cost Is Critical
REDUCING INSTALLATION COST IS CRITICAL FOR CONTINUED COST REDUCTION IN SOLAR Contribution of Equipment vs. Installation Hourly Wages For Field Labor vs. Total Installed to the Cost of a Solar Energy Project(1) Cost of Utility Scale Solar 9% 11% 70%+ +20% 17% Increase in the 29% contribution of 100 i
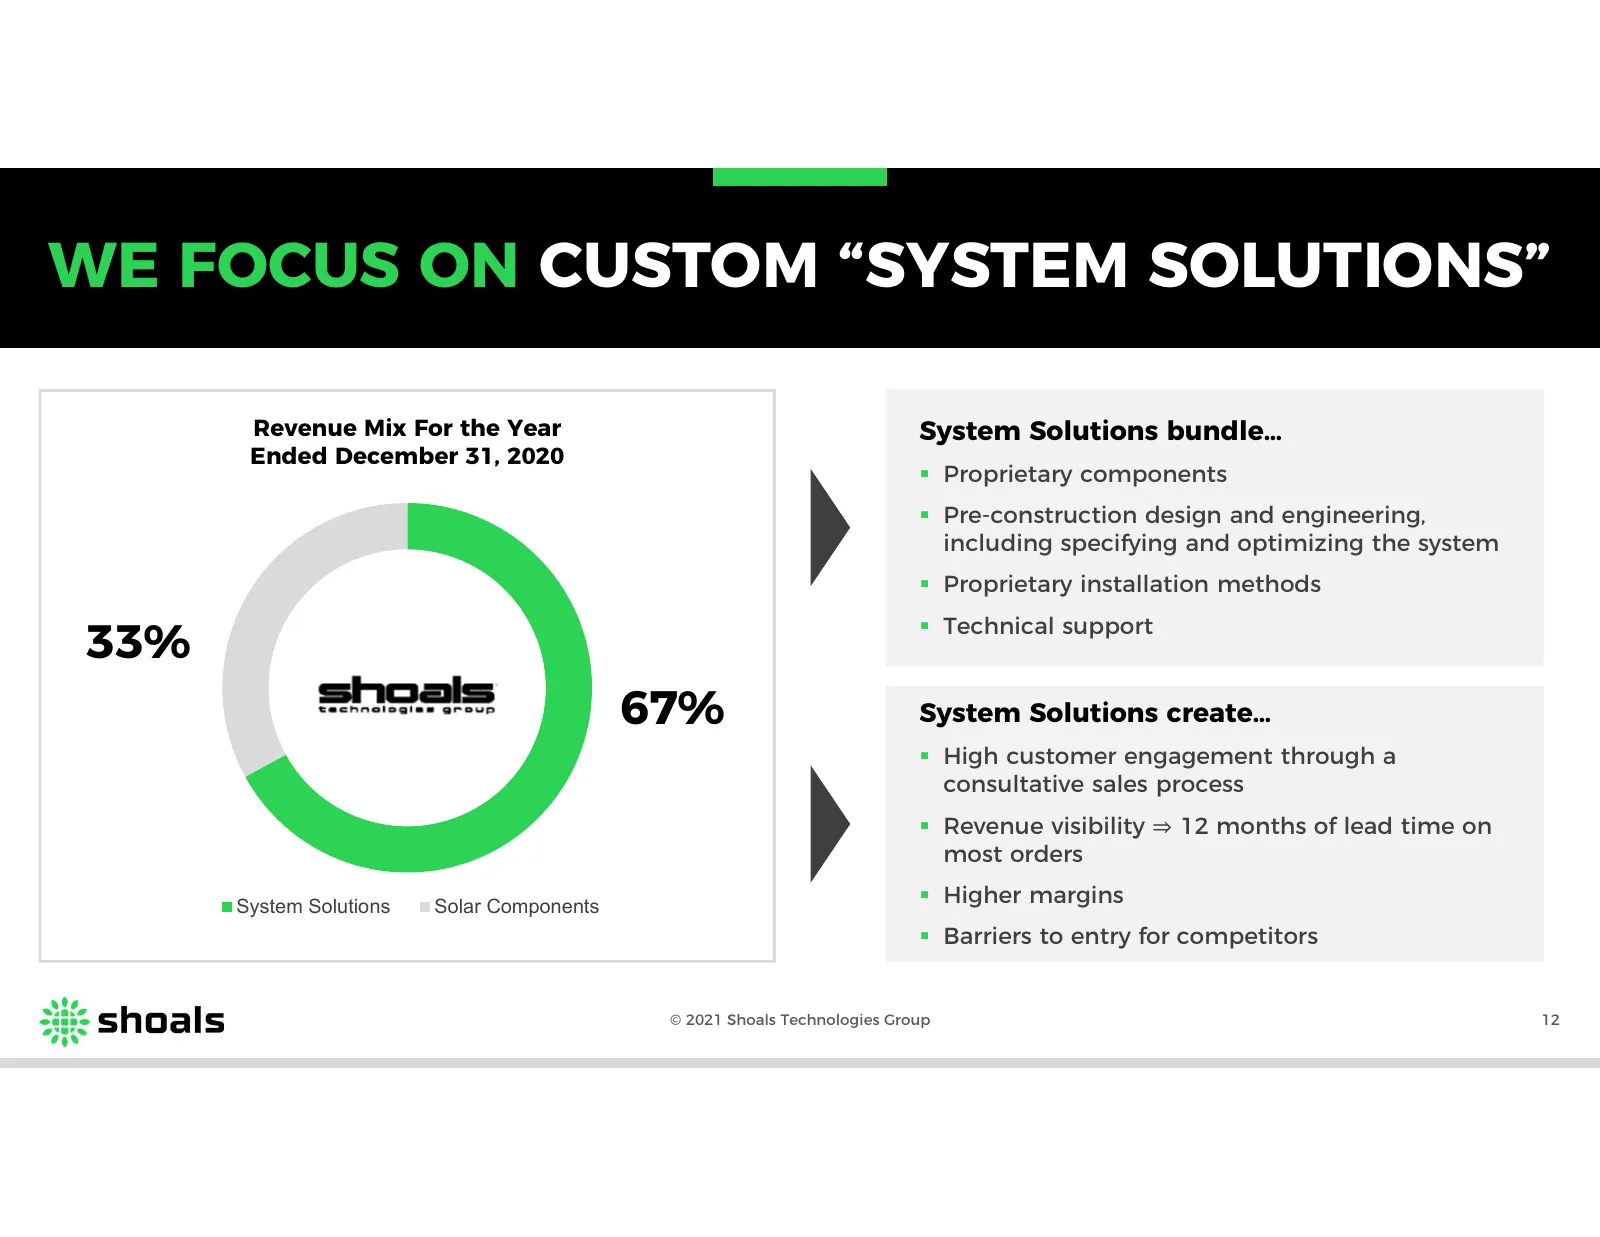
Slide 12: We Focus on Custom System Solutions
WE FOCUS ON CUSTOM “SYSTEM SOLUTIONS” Revenue Mix For the Year System Solutions bundle… Ended December 31, 2020 Proprietary components Pre-construction design and engineering, including specifying and optimizing the system Proprietary installation methods Technical support 33% 67% System Sol
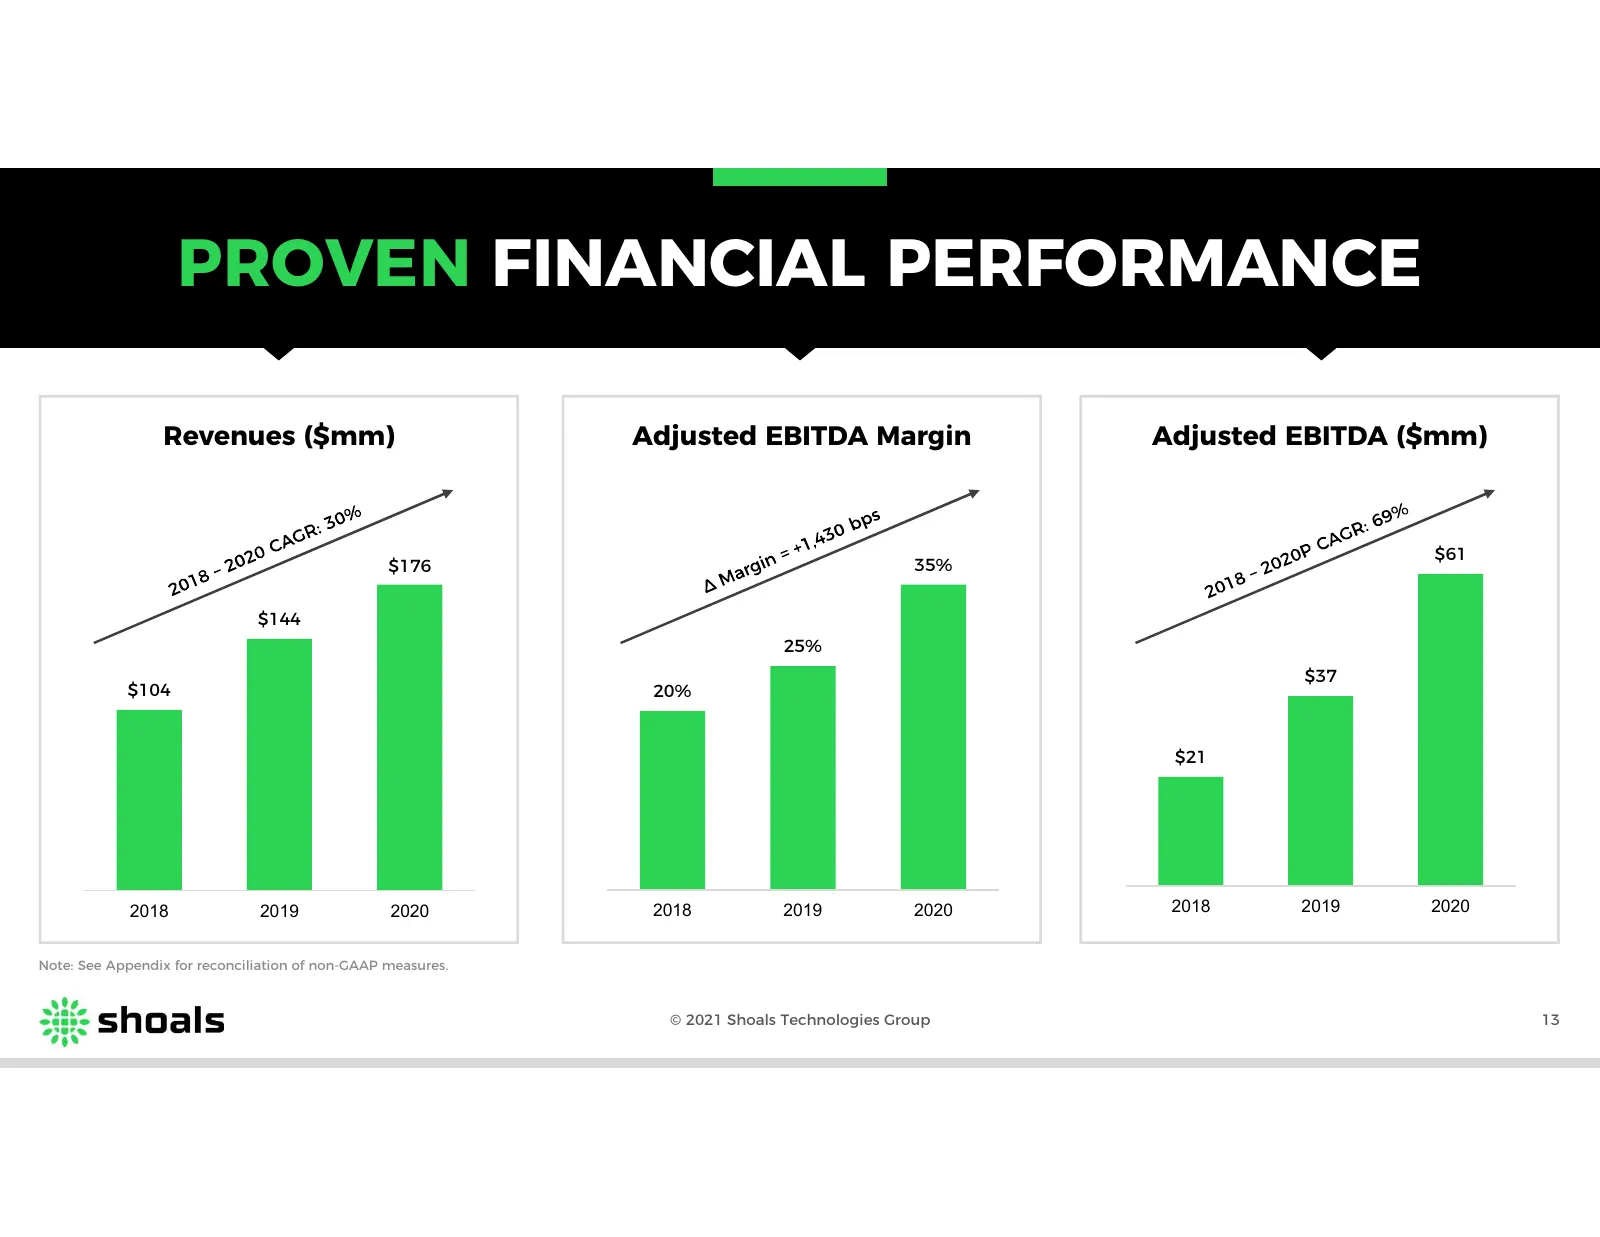
Slide 13: Proven Financial Performance
PROVEN FINANCIAL PERFORMANCE Revenues ($mm) Adjusted EBITDA Margin Adjusted EBITDA ($mm) $61 $176 35% $144 25% $37 $104 20% $21 2018 2019 2020 2018 2019 2020 2018 2019 2020 Note: See Appendix for reconciliation of non-GAAP measures. © 2021 Shoals Technologies Group 13
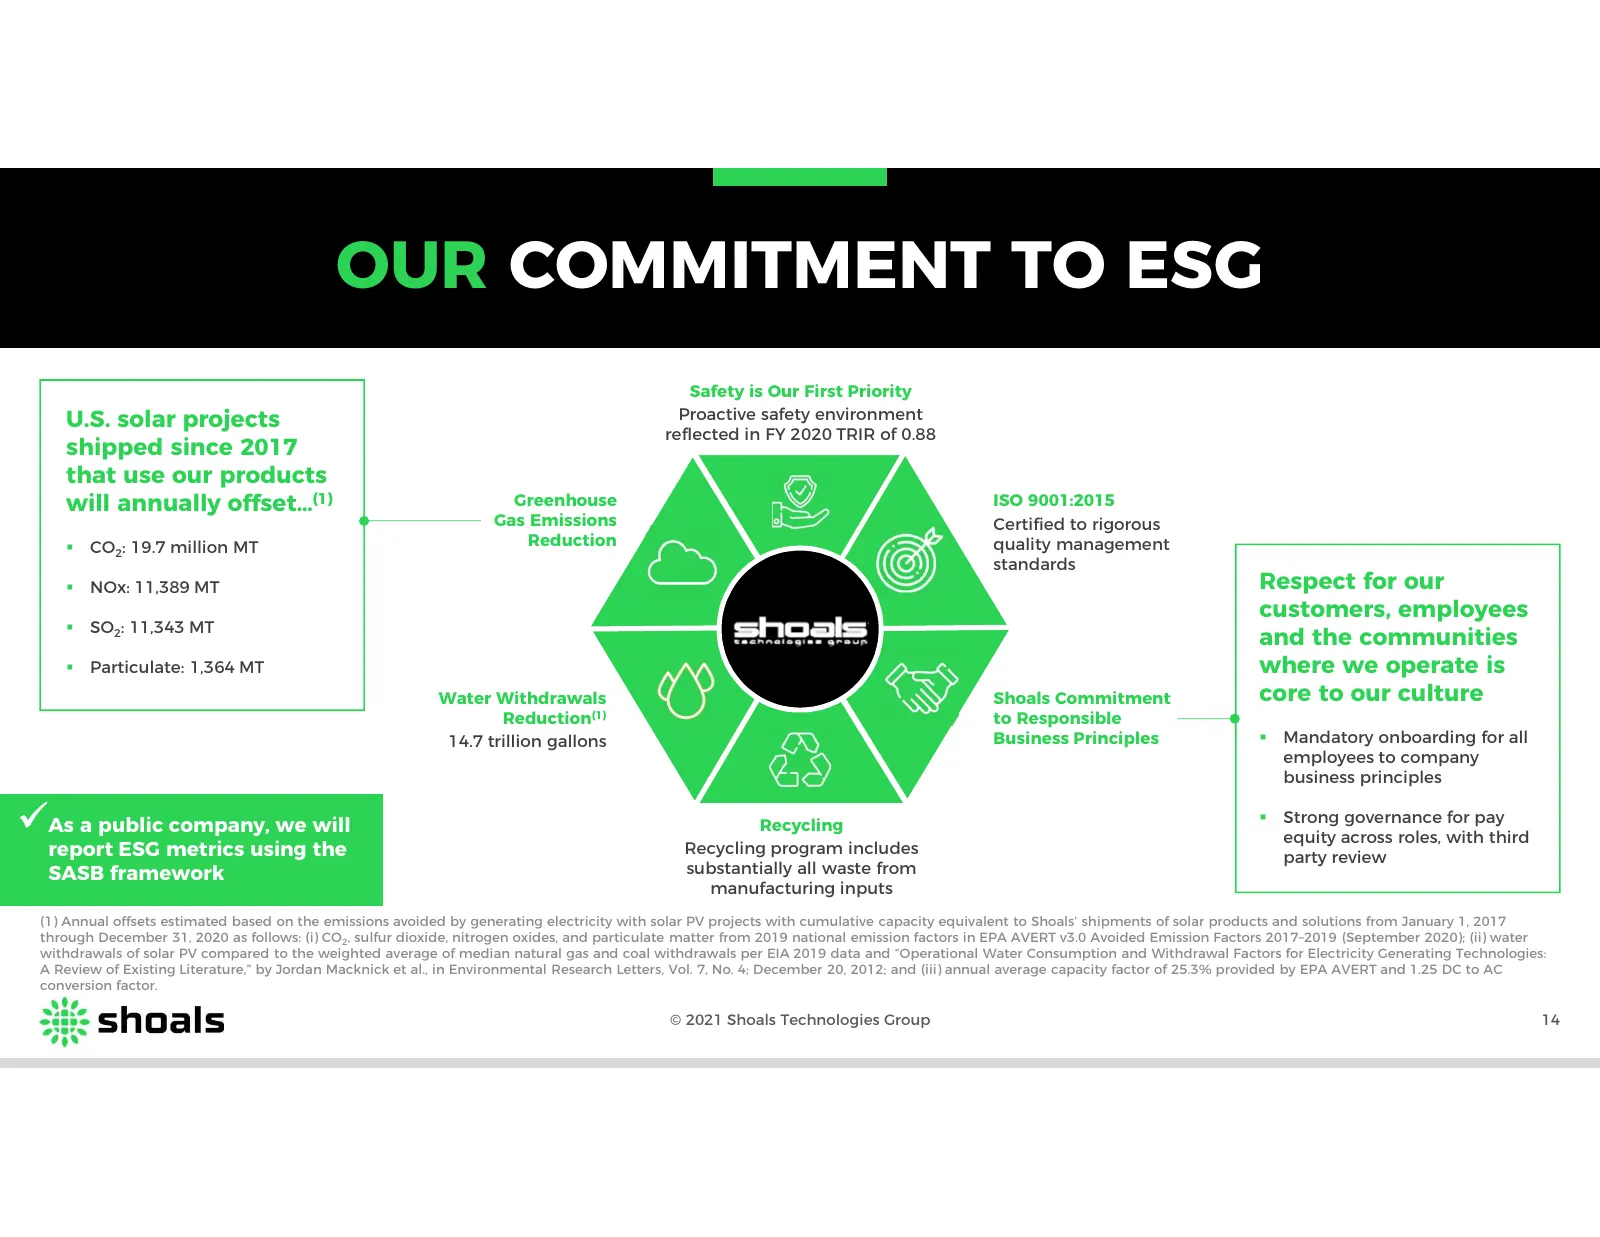
Slide 14: Our Commitment to ESG
OUR COMMITMENT TO ESG Safety is Our First Priority U.S. solar projects Proactive safety environment reflected in FY 2020 TRIR of 0.88 shipped since 2017 that use our products will annually offset…(1) Greenhouse ISO 9001:2015 Gas Emissions Certified to rigorous CO2: 19.7 million MT Reduction qualit
Slide 15: Technology and Value Proposition
TECHNOLOGY AND VALUE PROPOSITION
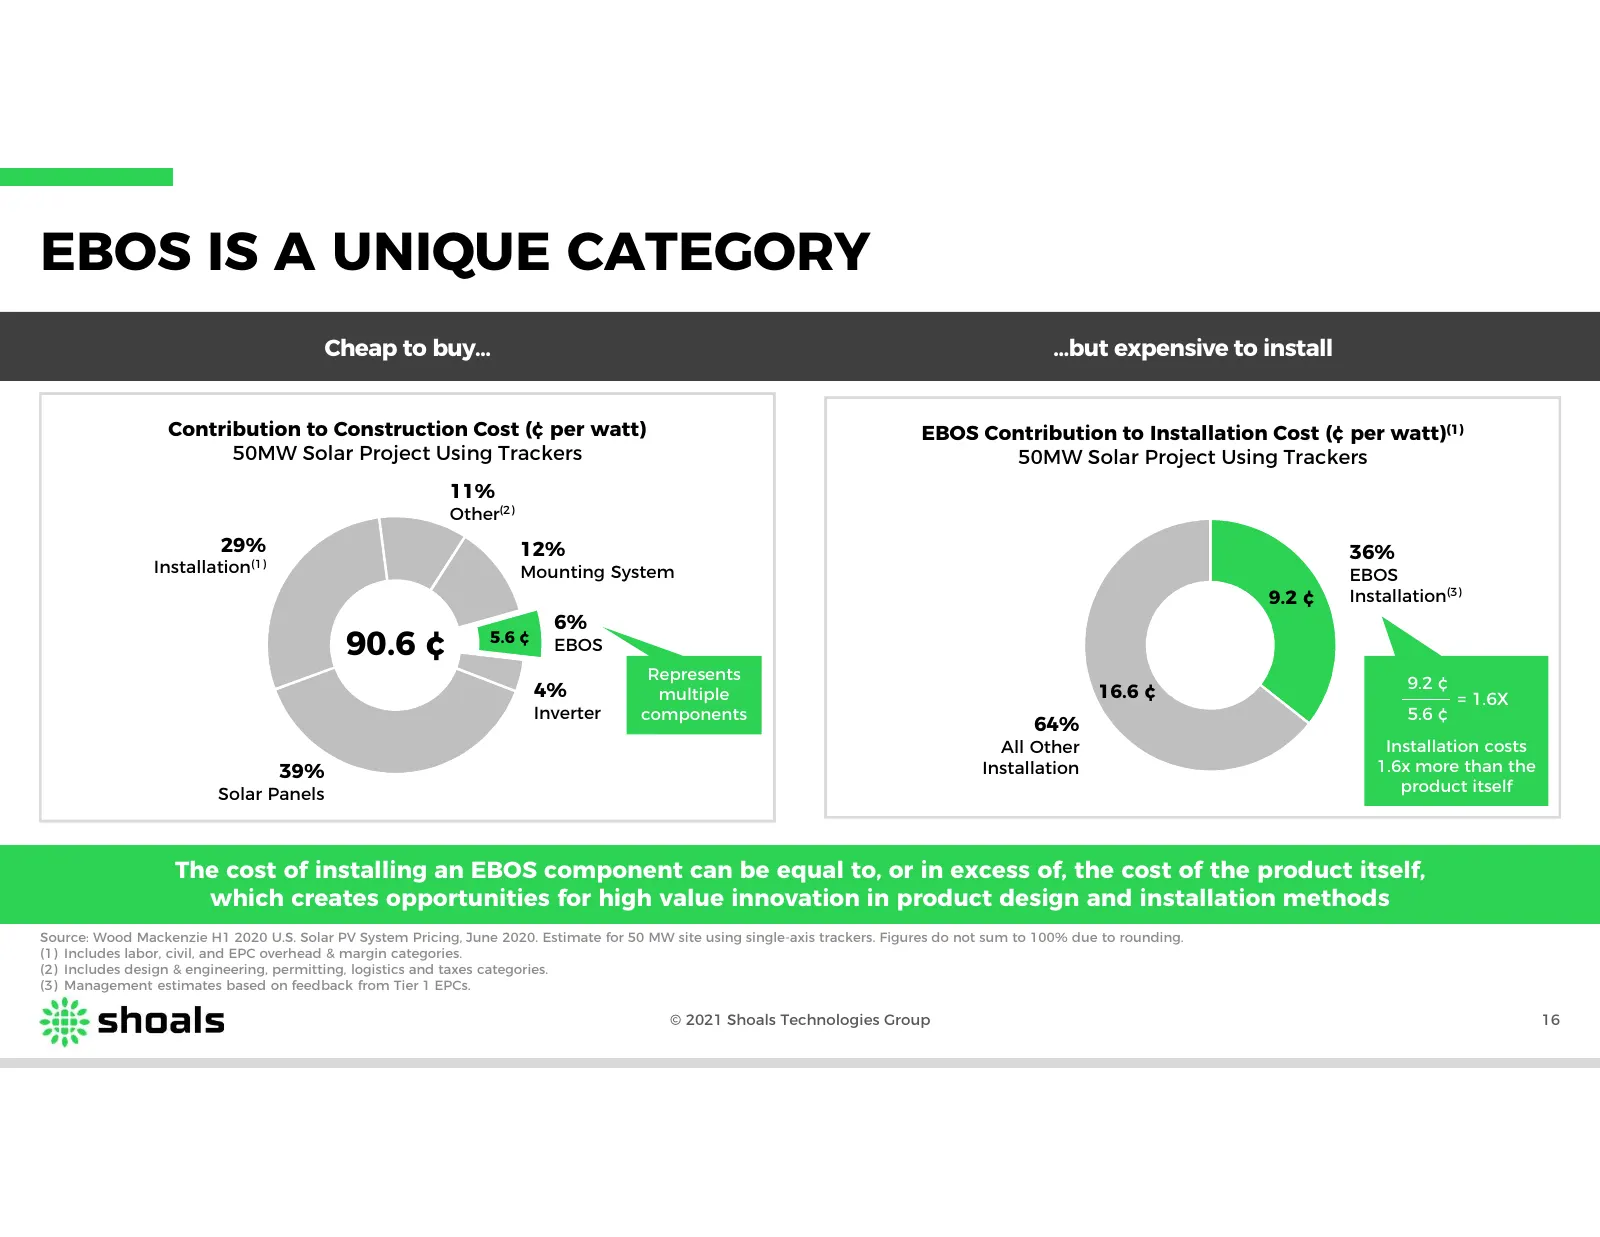
Slide 16: EBOS Is a Unique Category
EBOS IS A UNIQUE CATEGORY Cheap to buy… …but expensive to install Contribution to Construction Cost (¢ per watt) EBOS Contribution to Installation Cost (¢ per watt)(1) 50MW Solar Project Using Trackers 50MW Solar Project Using Trackers 11% Other(2) 29% 12% 36% Installation(1) Mounting System EBOS 9.
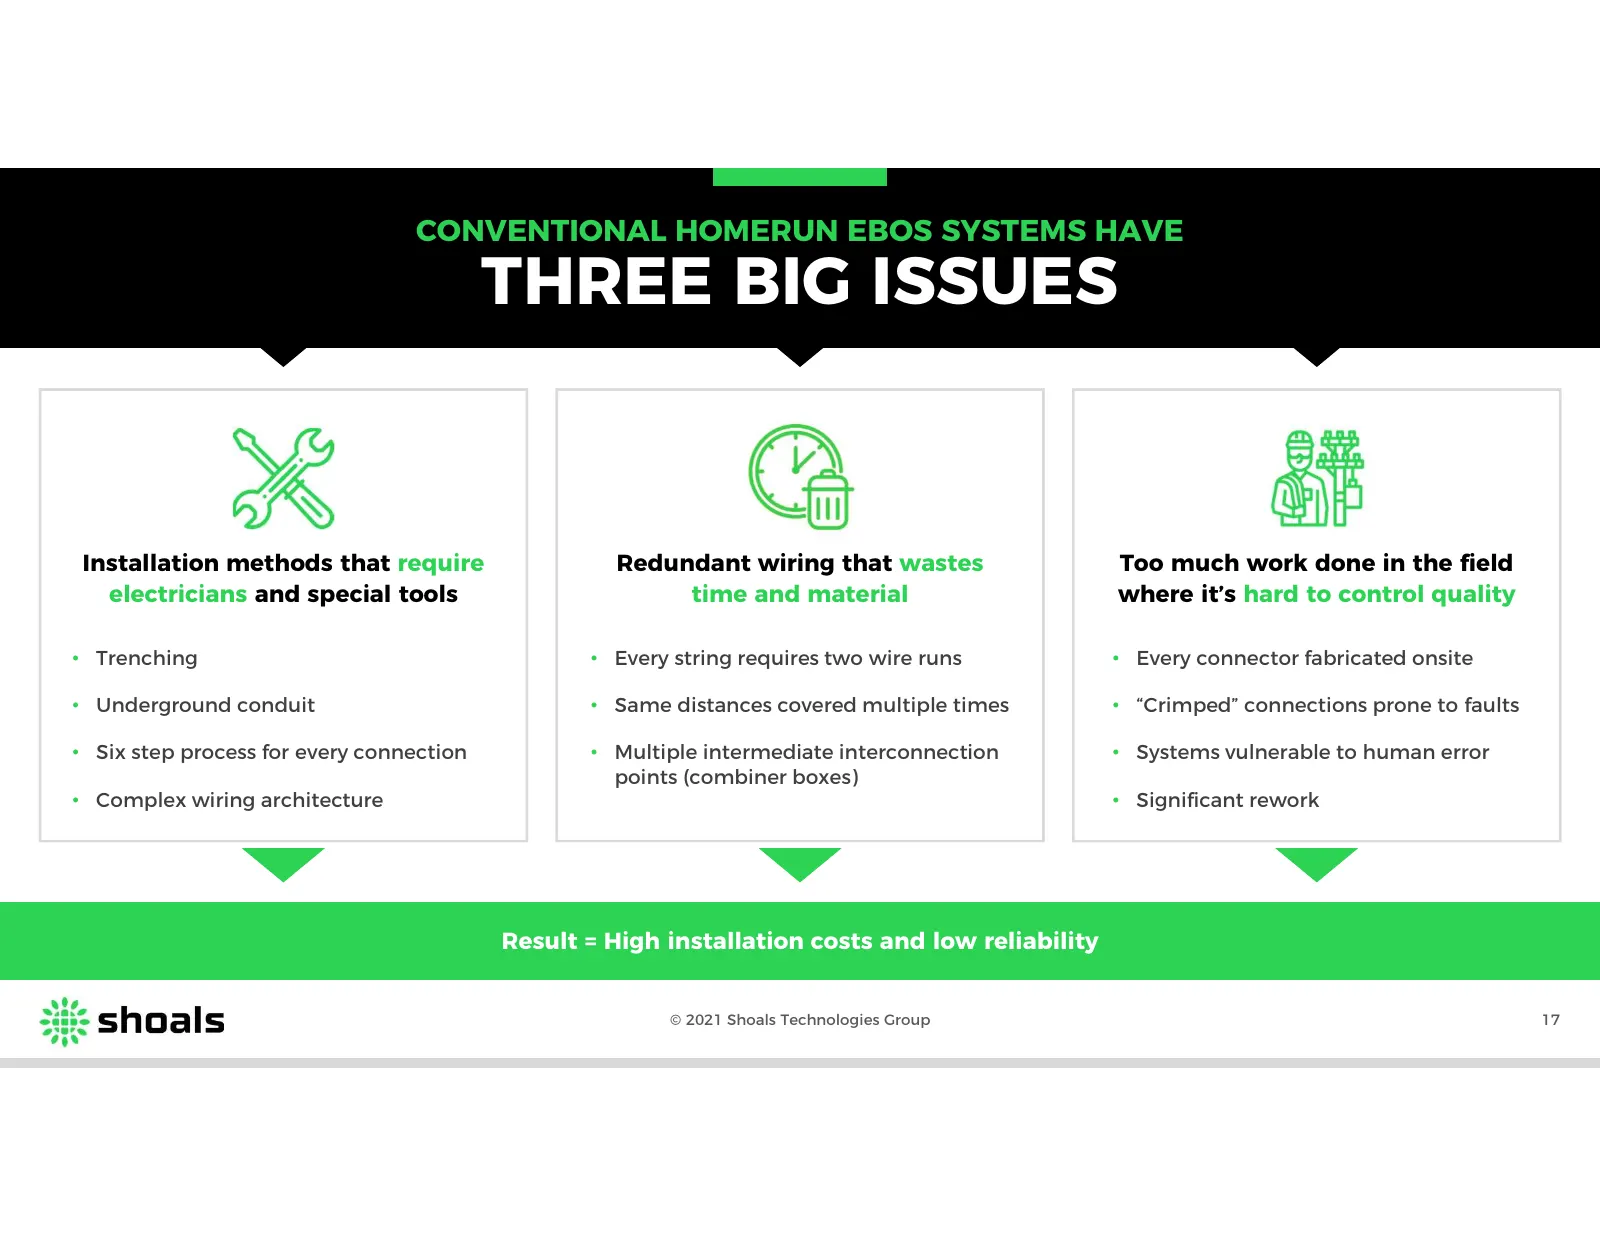
Slide 17: Three Big Issues
CONVENTIONAL HOMERUN EBOS SYSTEMS HAVE THREE BIG ISSUES Installation methods that require Redundant wiring that wastes Too much work done in the field electricians and special tools time and material where it’s hard to control quality • Trenching • Every string requires two wire runs • Every connect
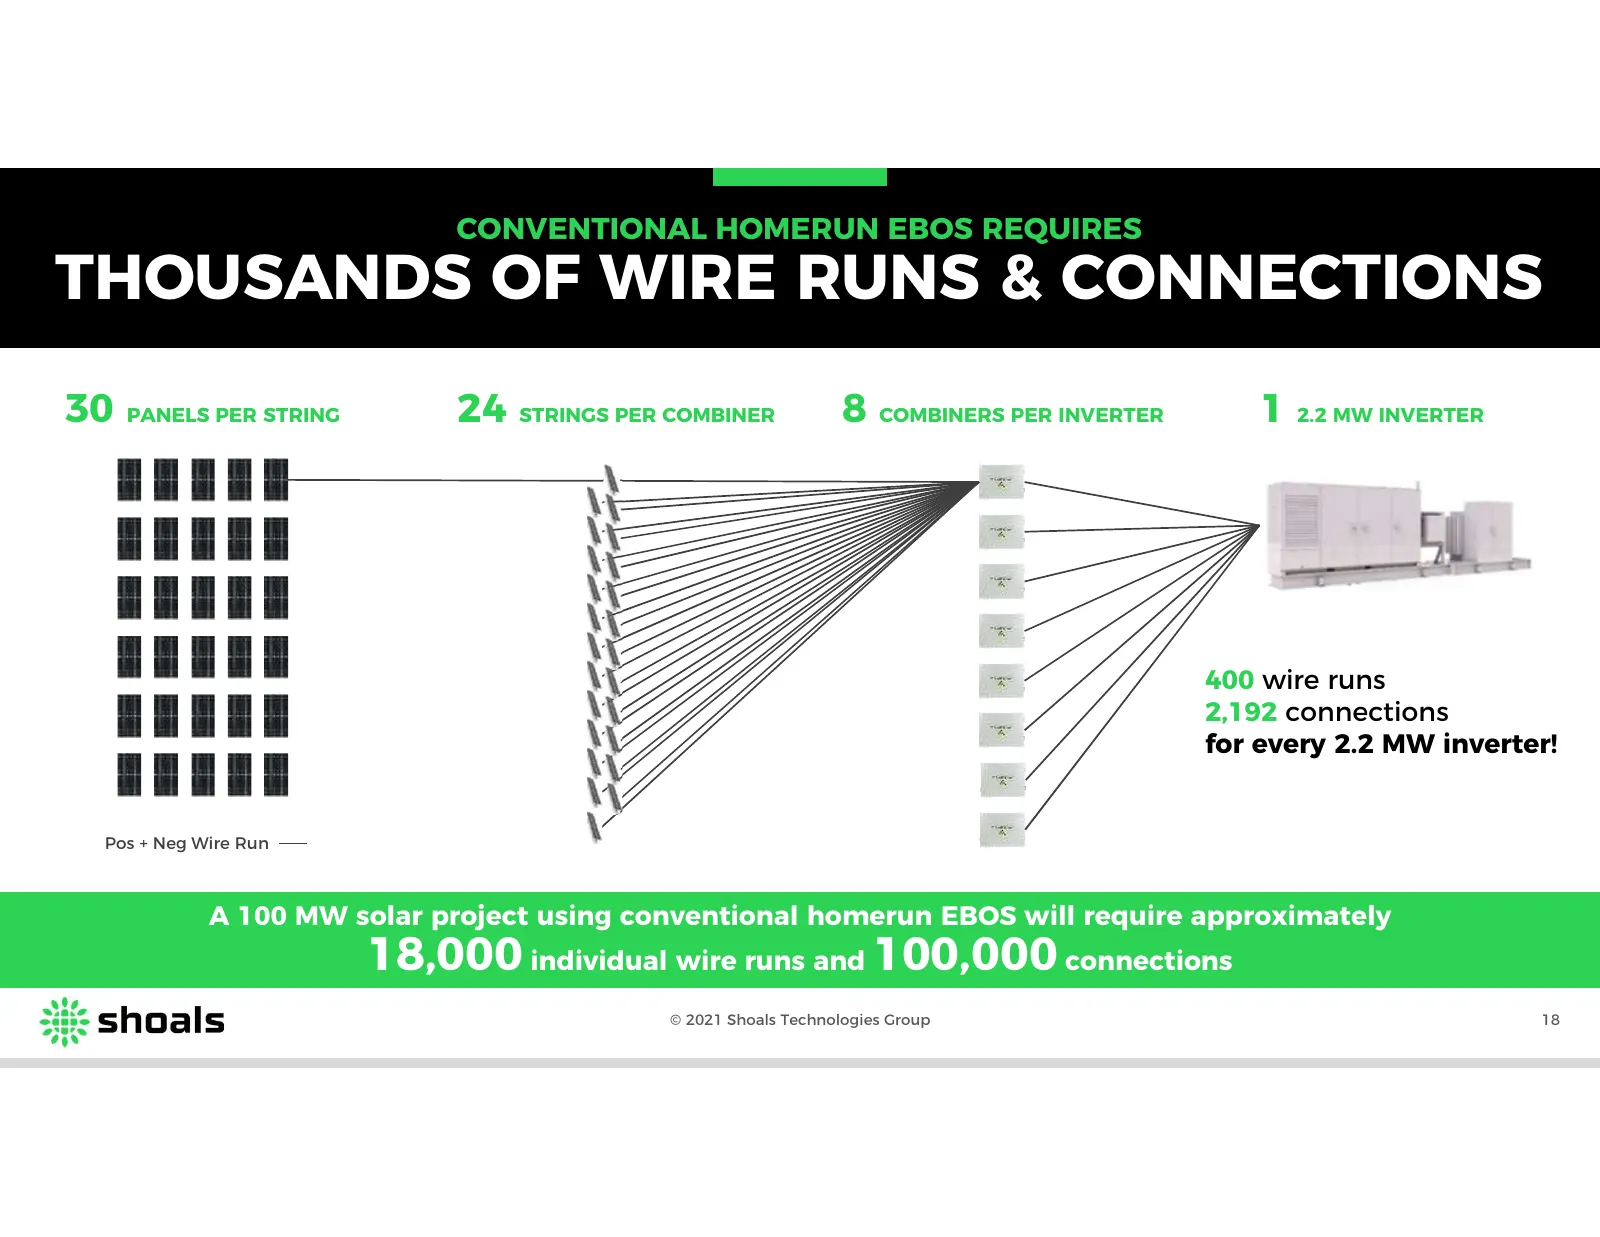
Slide 18: Thousands of Wire Runs and Connections
CONVENTIONAL HOMERUN EBOS REQUIRES THOUSANDS OF WIRE RUNS & CONNECTIONS 30 PANELS PER STRING 24 STRINGS PER COMBINER 8 COMBINERS PER INVERTER 1 2.2 MW INVERTER 400 wire runs 2,192 connections for every 2.2 MW inverter! Pos + Neg Wire Run A 100 MW solar project using conventional homerun EBOS will re
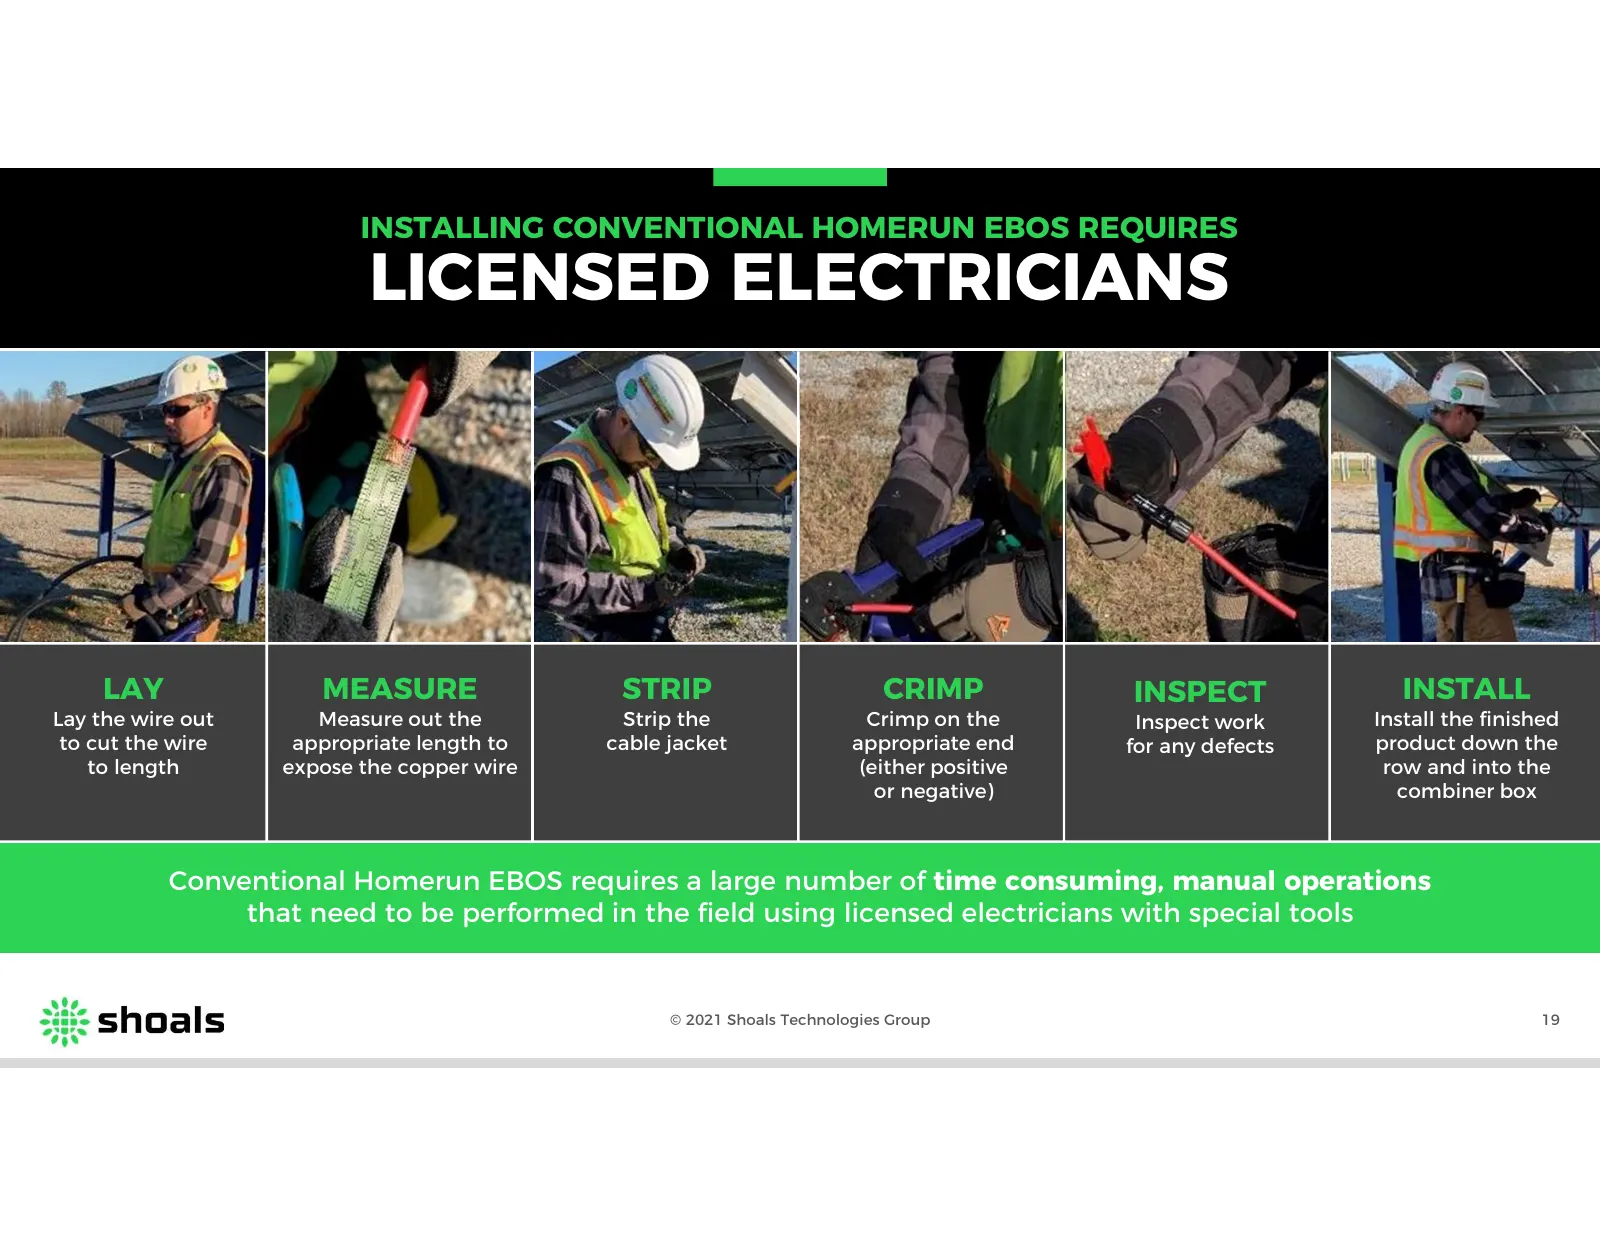
Slide 19: Licensed Electricians
INSTALLING CONVENTIONAL HOMERUN EBOS REQUIRES LICENSED ELECTRICIANS LAY MEASURE STRIP CRIMP INSPECT INSTALL Lay the wire out Measure out the Strip the Crimp on the Inspect work Install the finished to cut the wire appropriate length to cable jacket appropriate end for any defects product down the to
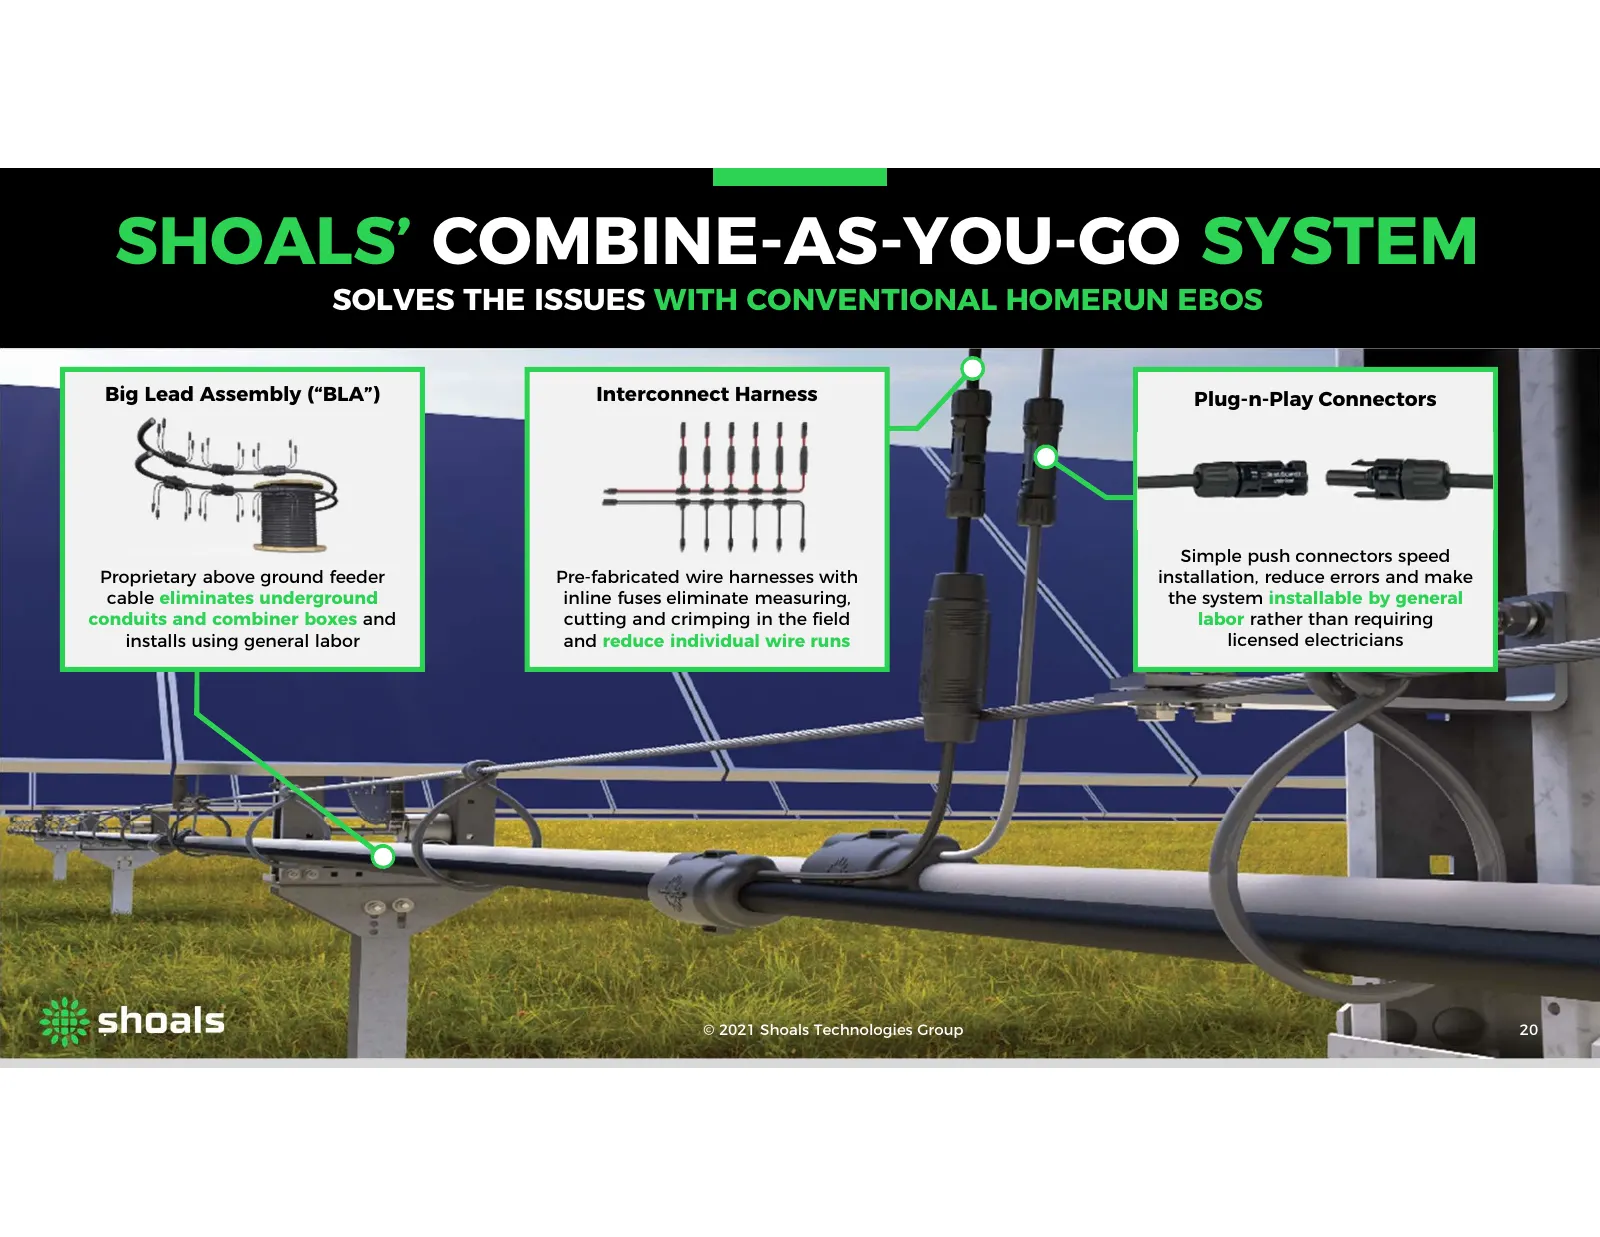
Slide 20: Shoals' Combine-as-You-Go System
SHOALS’ COMBINE-AS-YOU-GO SYSTEM SOLVES THE ISSUES WITH CONVENTIONAL HOMERUN EBOS Big Lead Assembly (“BLA”) Interconnect Harness Plug-n-Play Connectors Simple push connectors speed Proprietary above ground feeder Pre-fabricated wire harnesses with installation, reduce errors and make cable eliminate
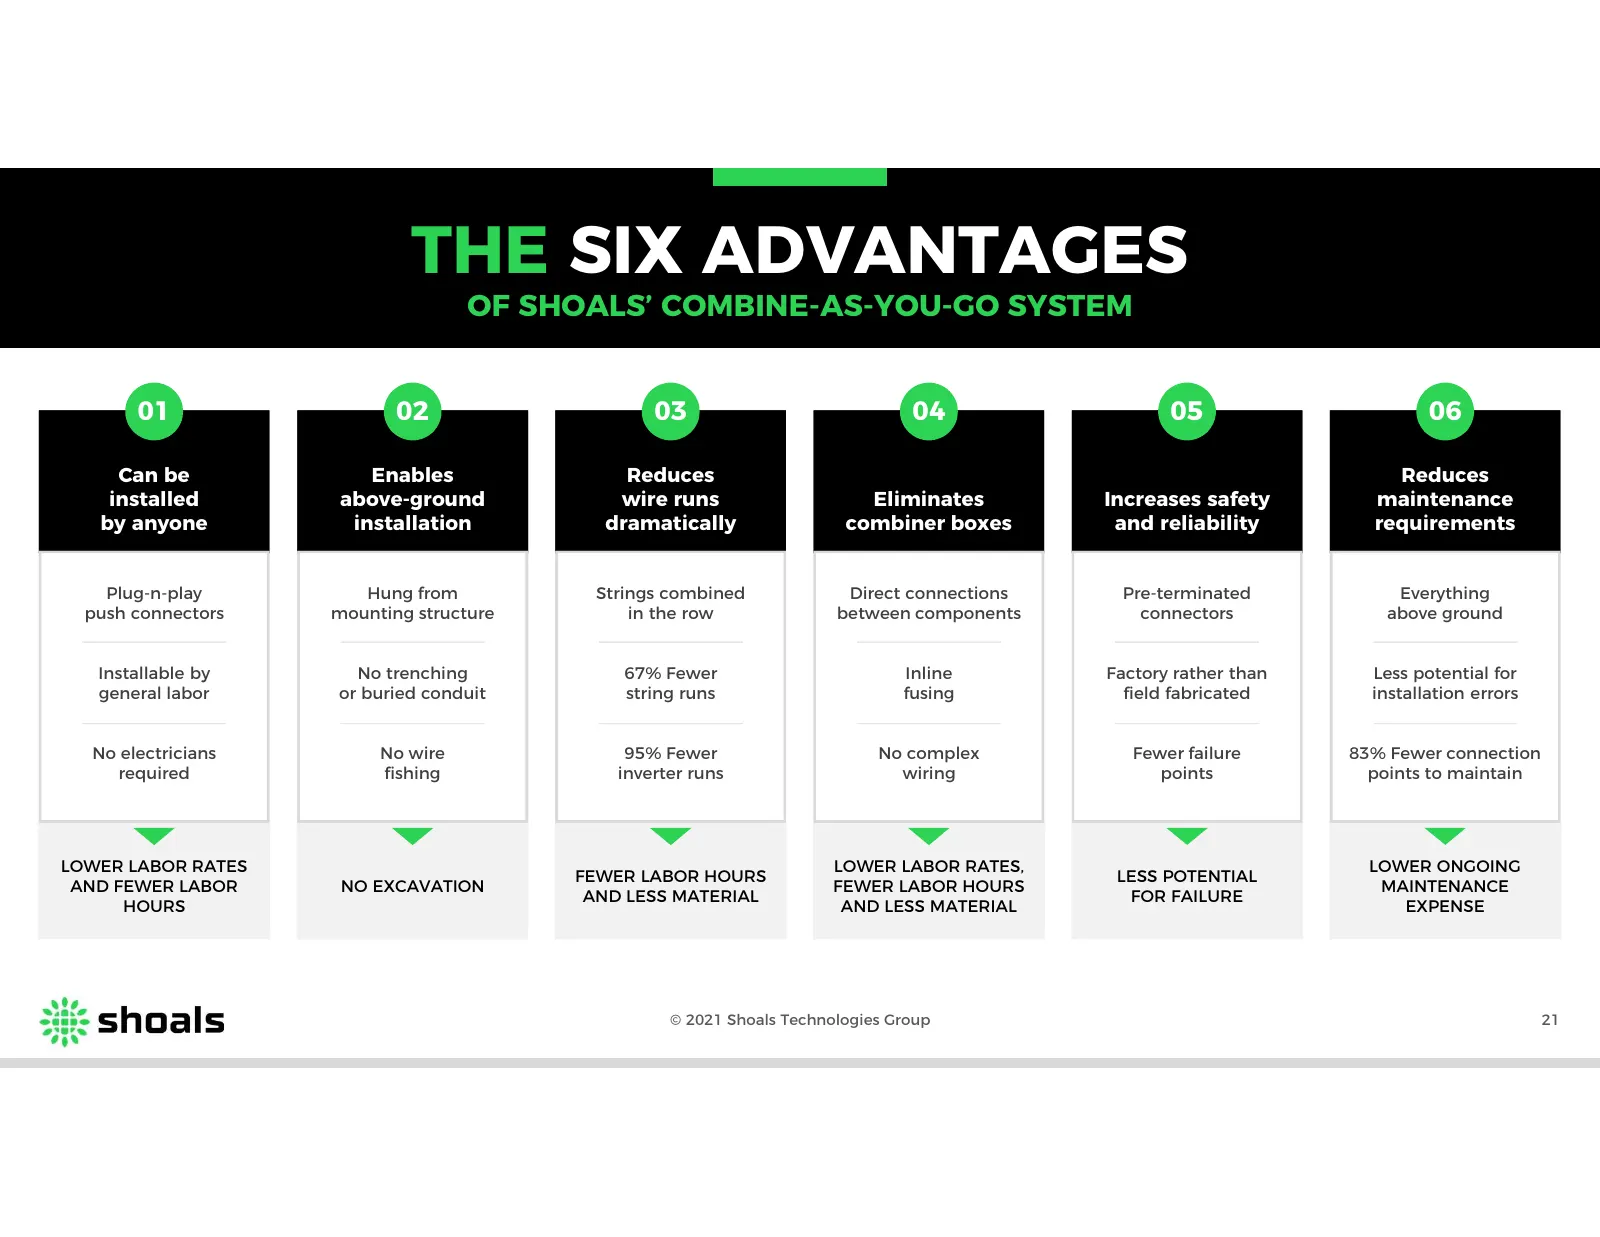
Slide 21: The Six Advantages
THE SIX ADVANTAGES OF SHOALS’ COMBINE-AS-YOU-GO SYSTEM 01 02 03 04 05 06 Can be Enables Reduces Reduces installed above-ground wire runs Eliminates Increases safety maintenance by anyone installation dramatically combiner boxes and reliability requirements Plug-n-play Hung from Strings combined Dire
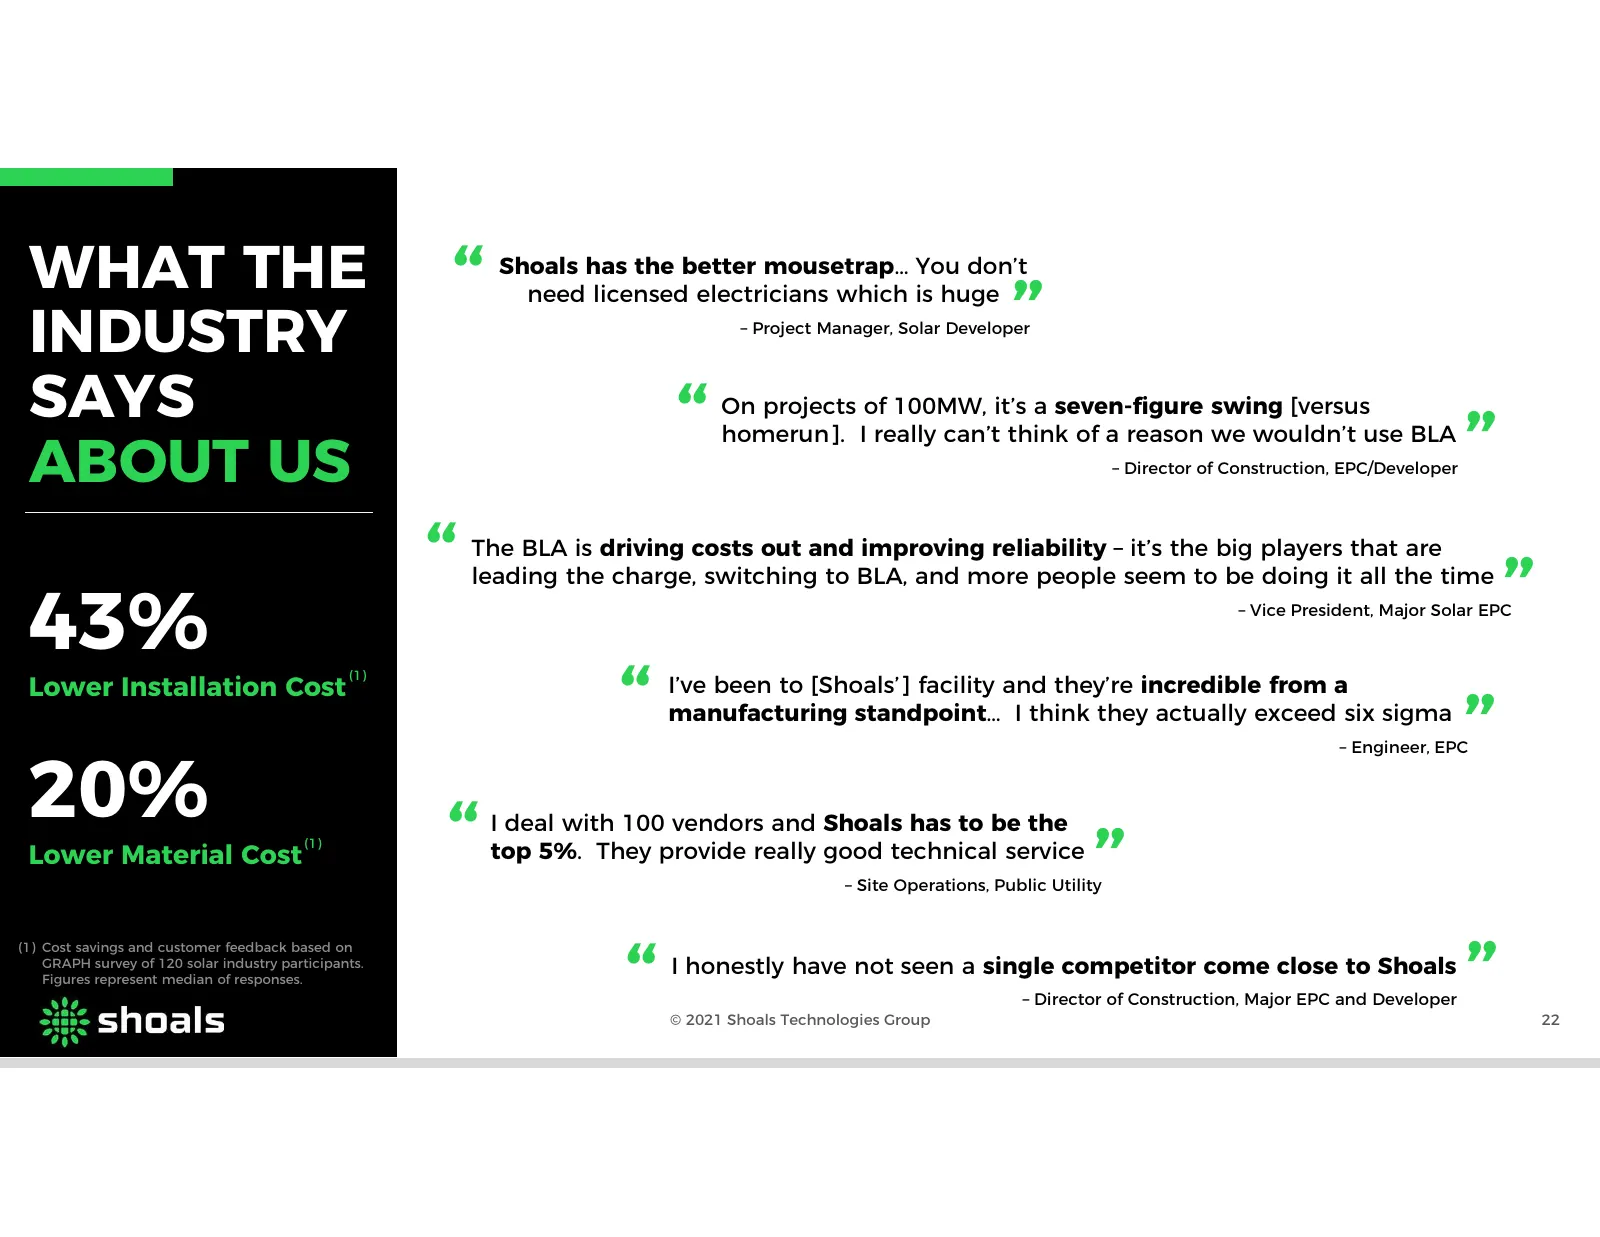
Slide 22: What the Industry Says About Us
WHAT THE INDUSTRY “ Shoals has the better mousetrap… You don’t need licensed electricians which is huge – Project Manager, Solar Developer ” SAYS ABOUT US “ On projects of 100MW, it’s a seven-figure swing [versus homerun]. I really can’t think of a reason we wouldn’t use BLA – Director of Constructi
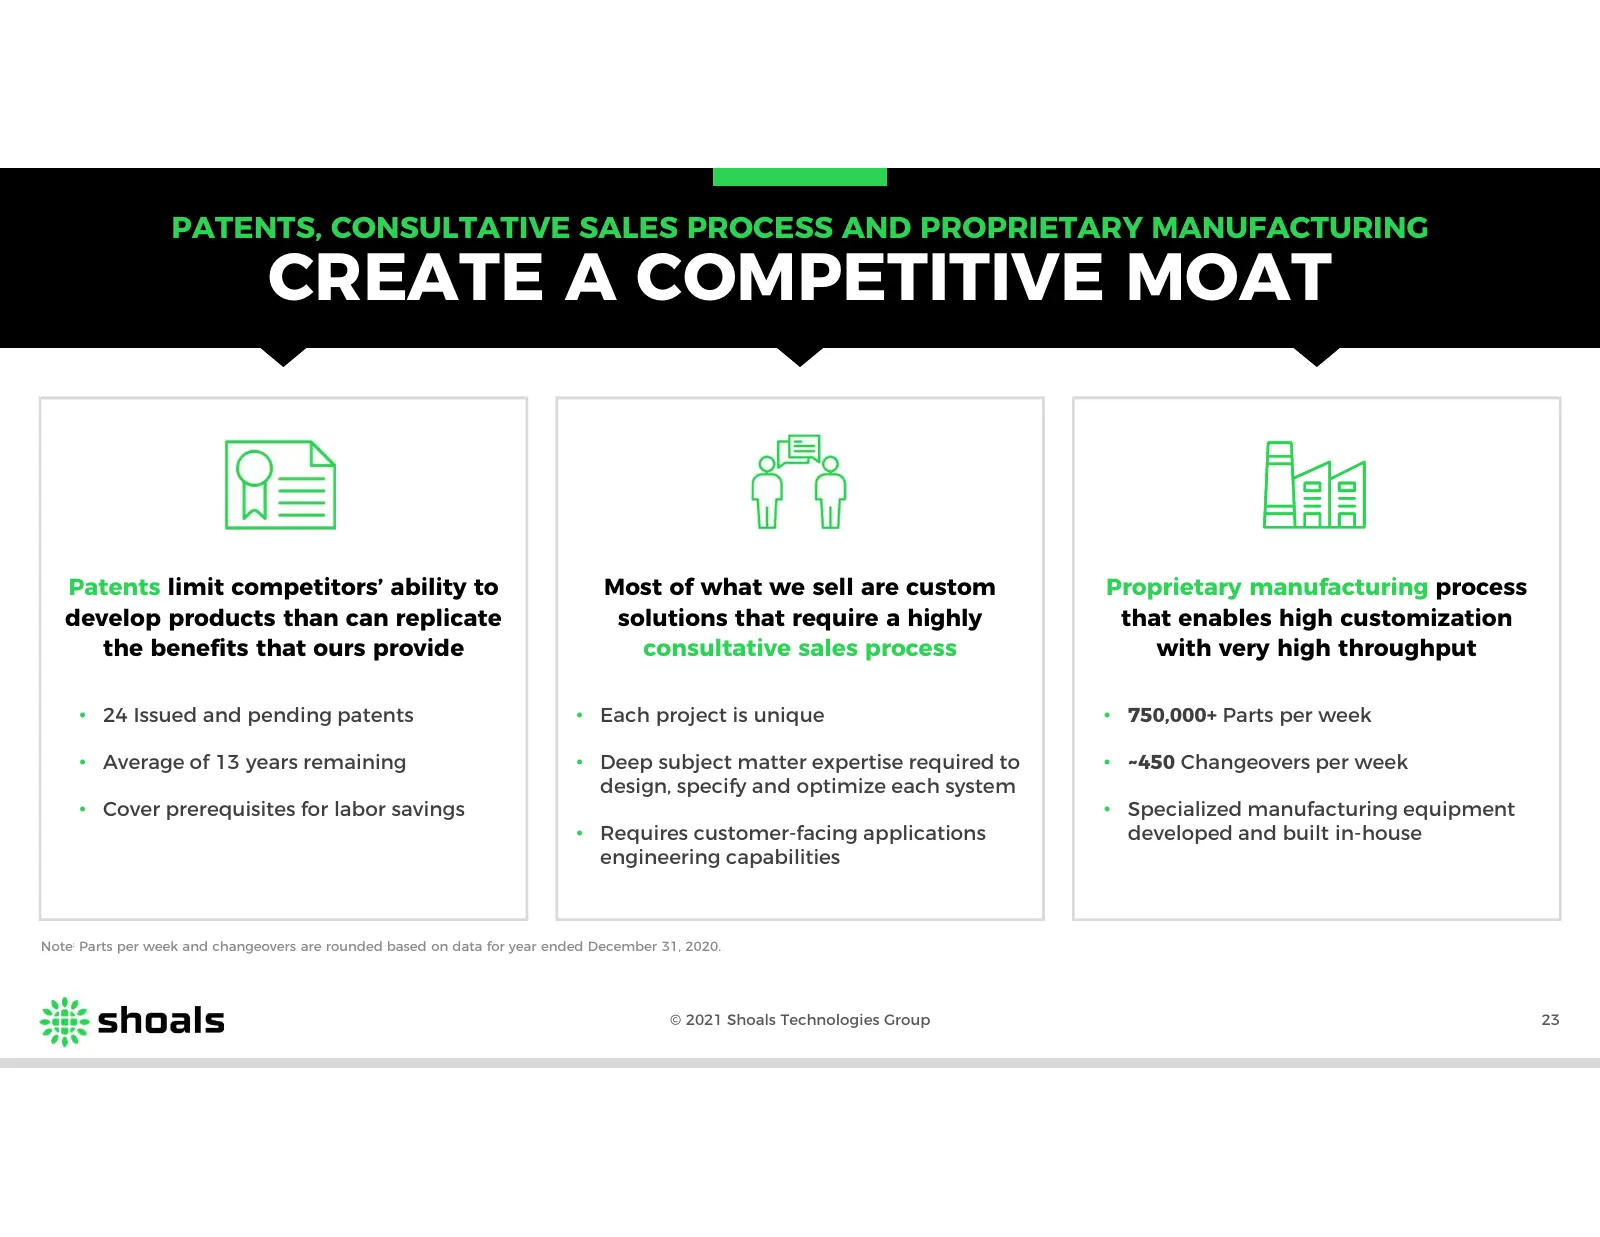
Slide 23: Create a Competitive Moat
PATENTS, CONSULTATIVE SALES PROCESS AND PROPRIETARY MANUFACTURING CREATE A COMPETITIVE MOAT Patents limit competitors’ ability to Most of what we sell are custom Proprietary manufacturing process develop products than can replicate solutions that require a highly that enables high customization the
Slide 24: Growth Strategy
Pay GROWTH STRATEGY
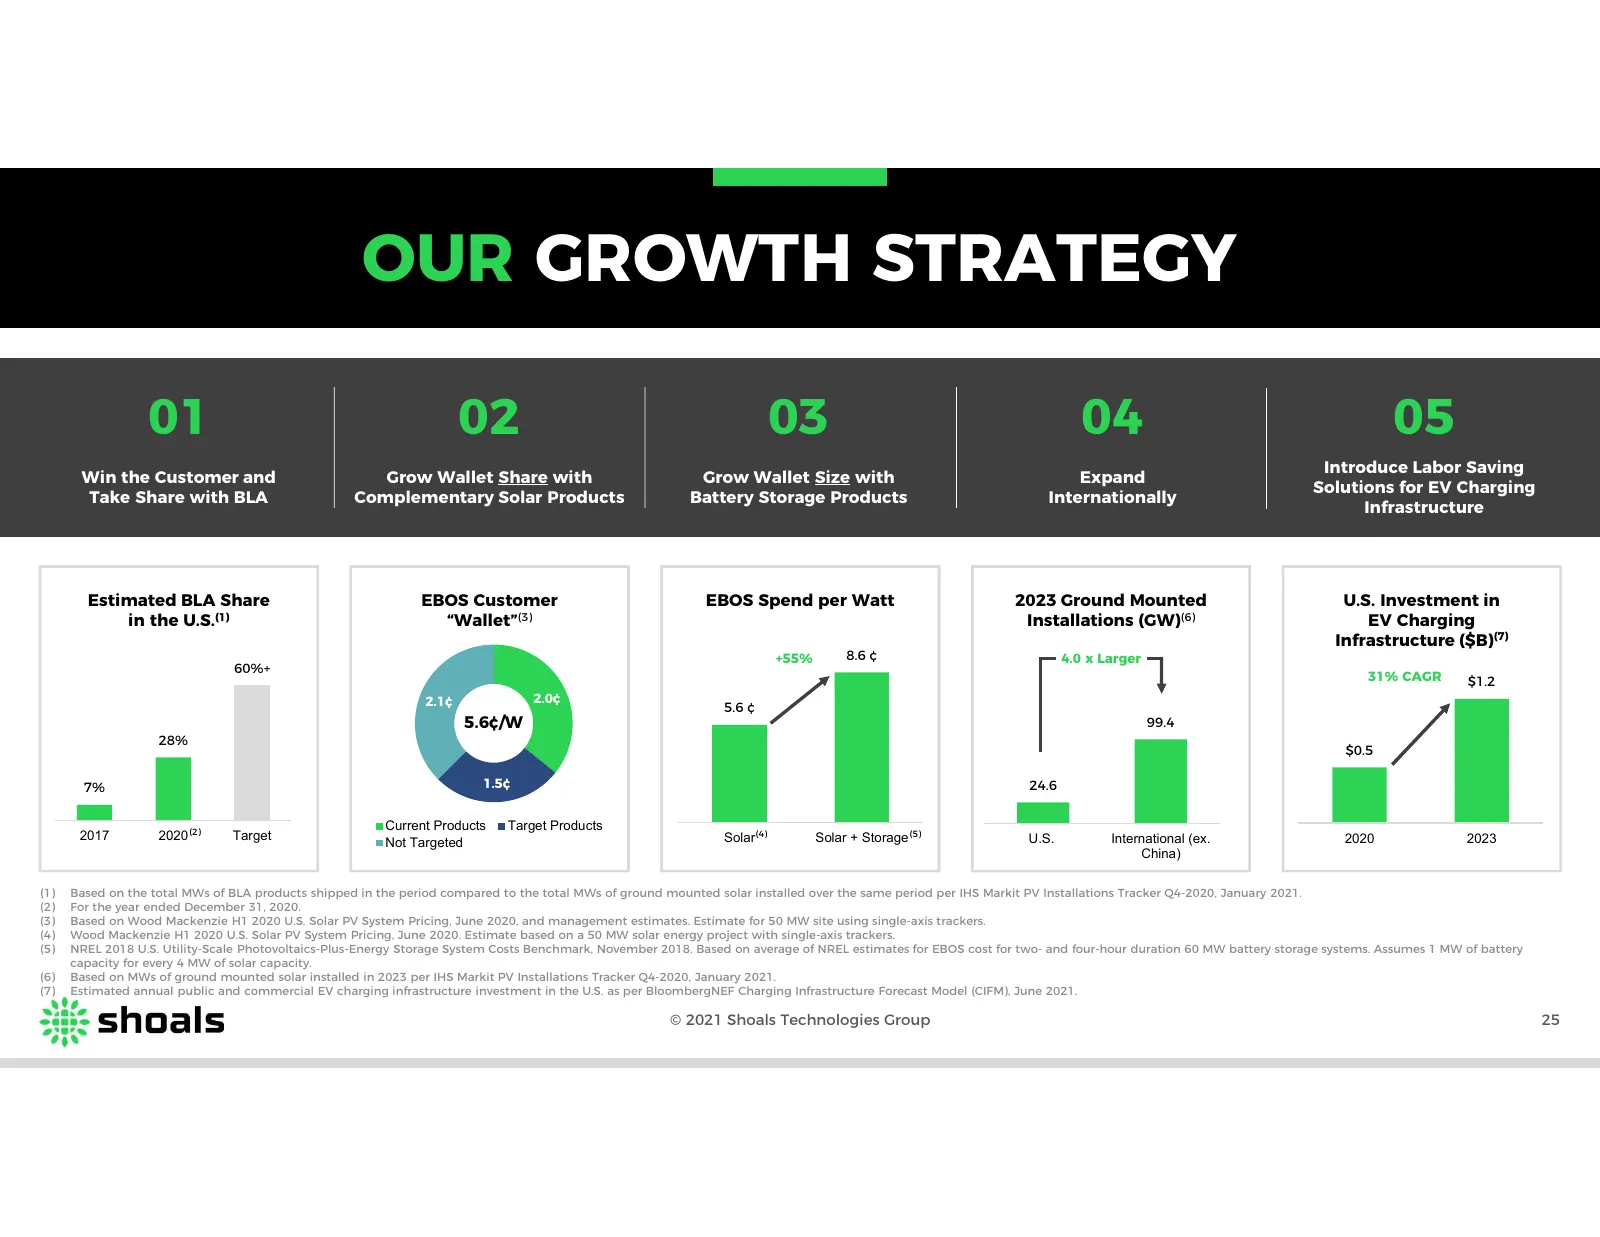
Slide 25: Our Growth Strategy
OUR GROWTH STRATEGY 01 02 03 04 05 Introduce Labor Saving Win the Customer and Grow Wallet Share with Grow Wallet Size with Expand Solutions for EV Charging Take Share with BLA Complementary Solar Products Battery Storage Products Internationally Infrastructure Estimated BLA Share EBOS Customer EBOS
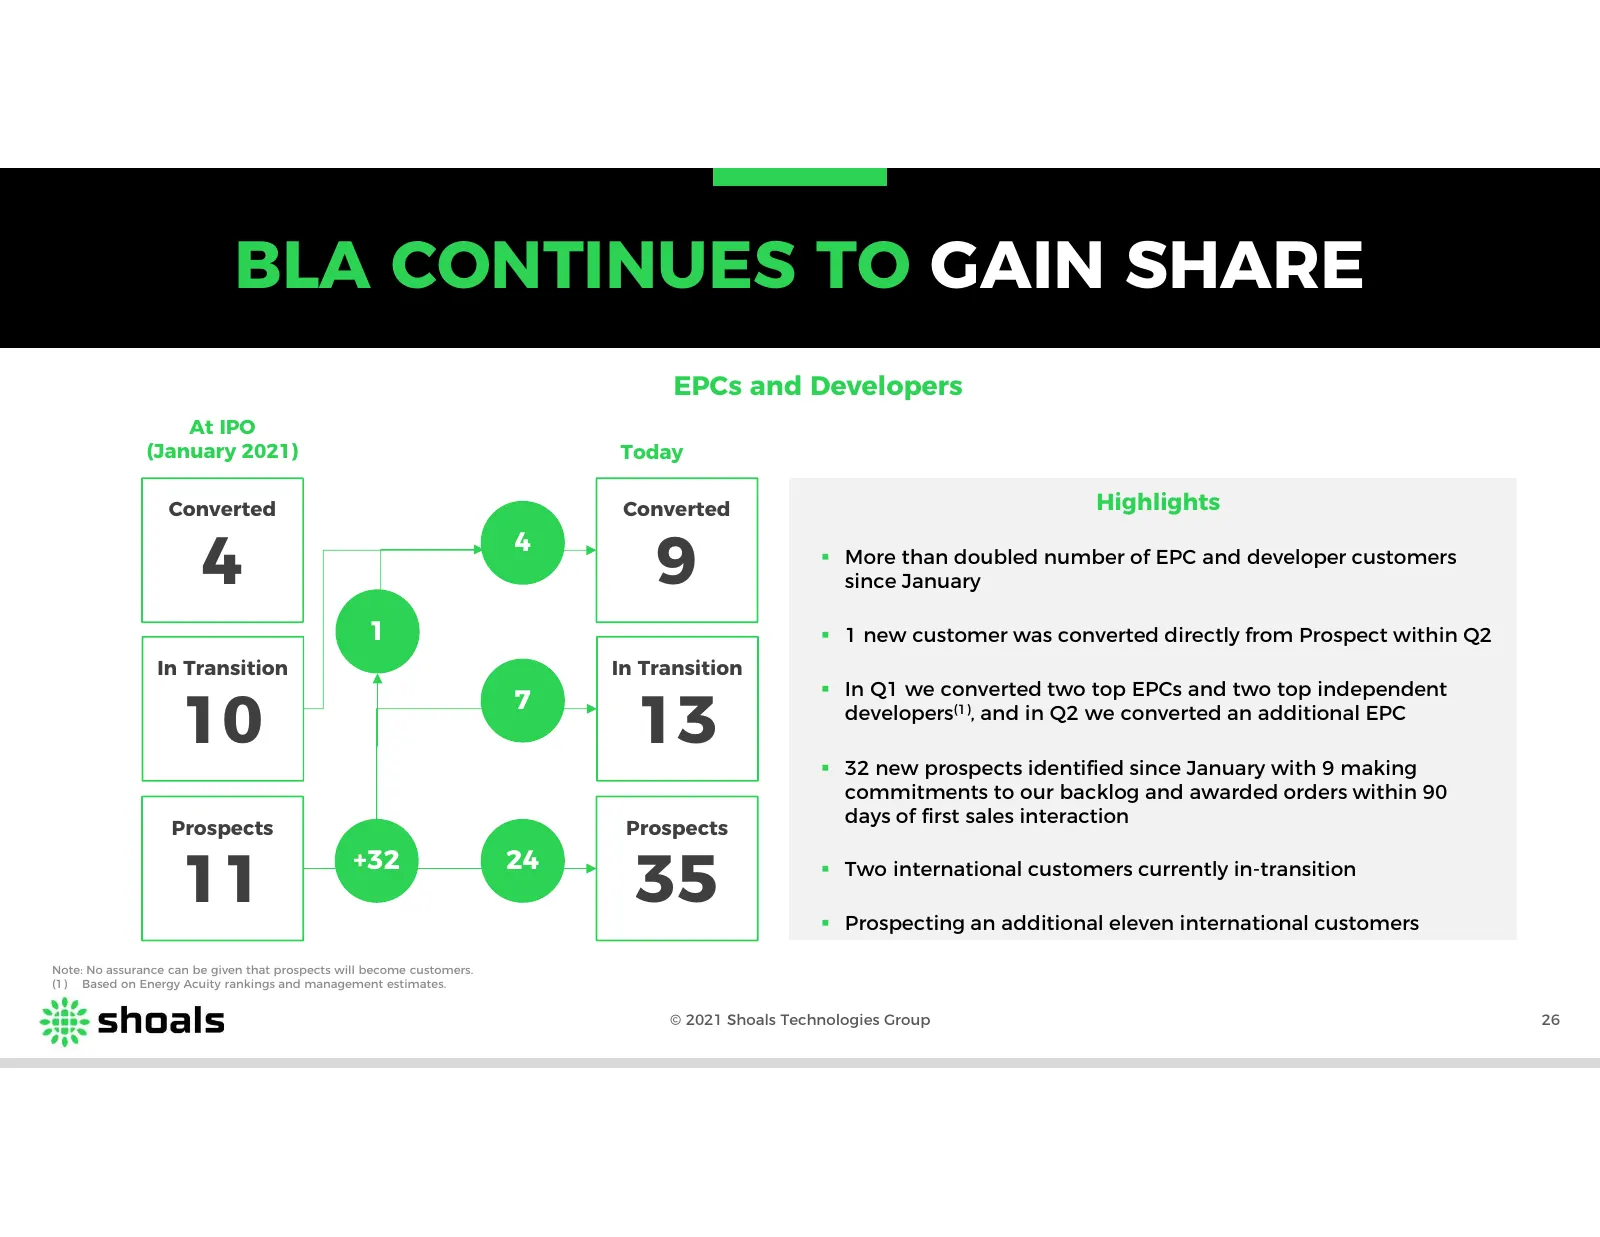
Slide 26: BLA Continues to Gain Share
BLA CONTINUES TO GAIN SHARE EPCs and Developers At IPO (January 2021) Today Converted Converted Highlights 4 4 9 More than doubled number of EPC and developer customers since January 1 1 new customer was converted directly from Prospect within Q2 In Transition In Transition In Q1 we converted
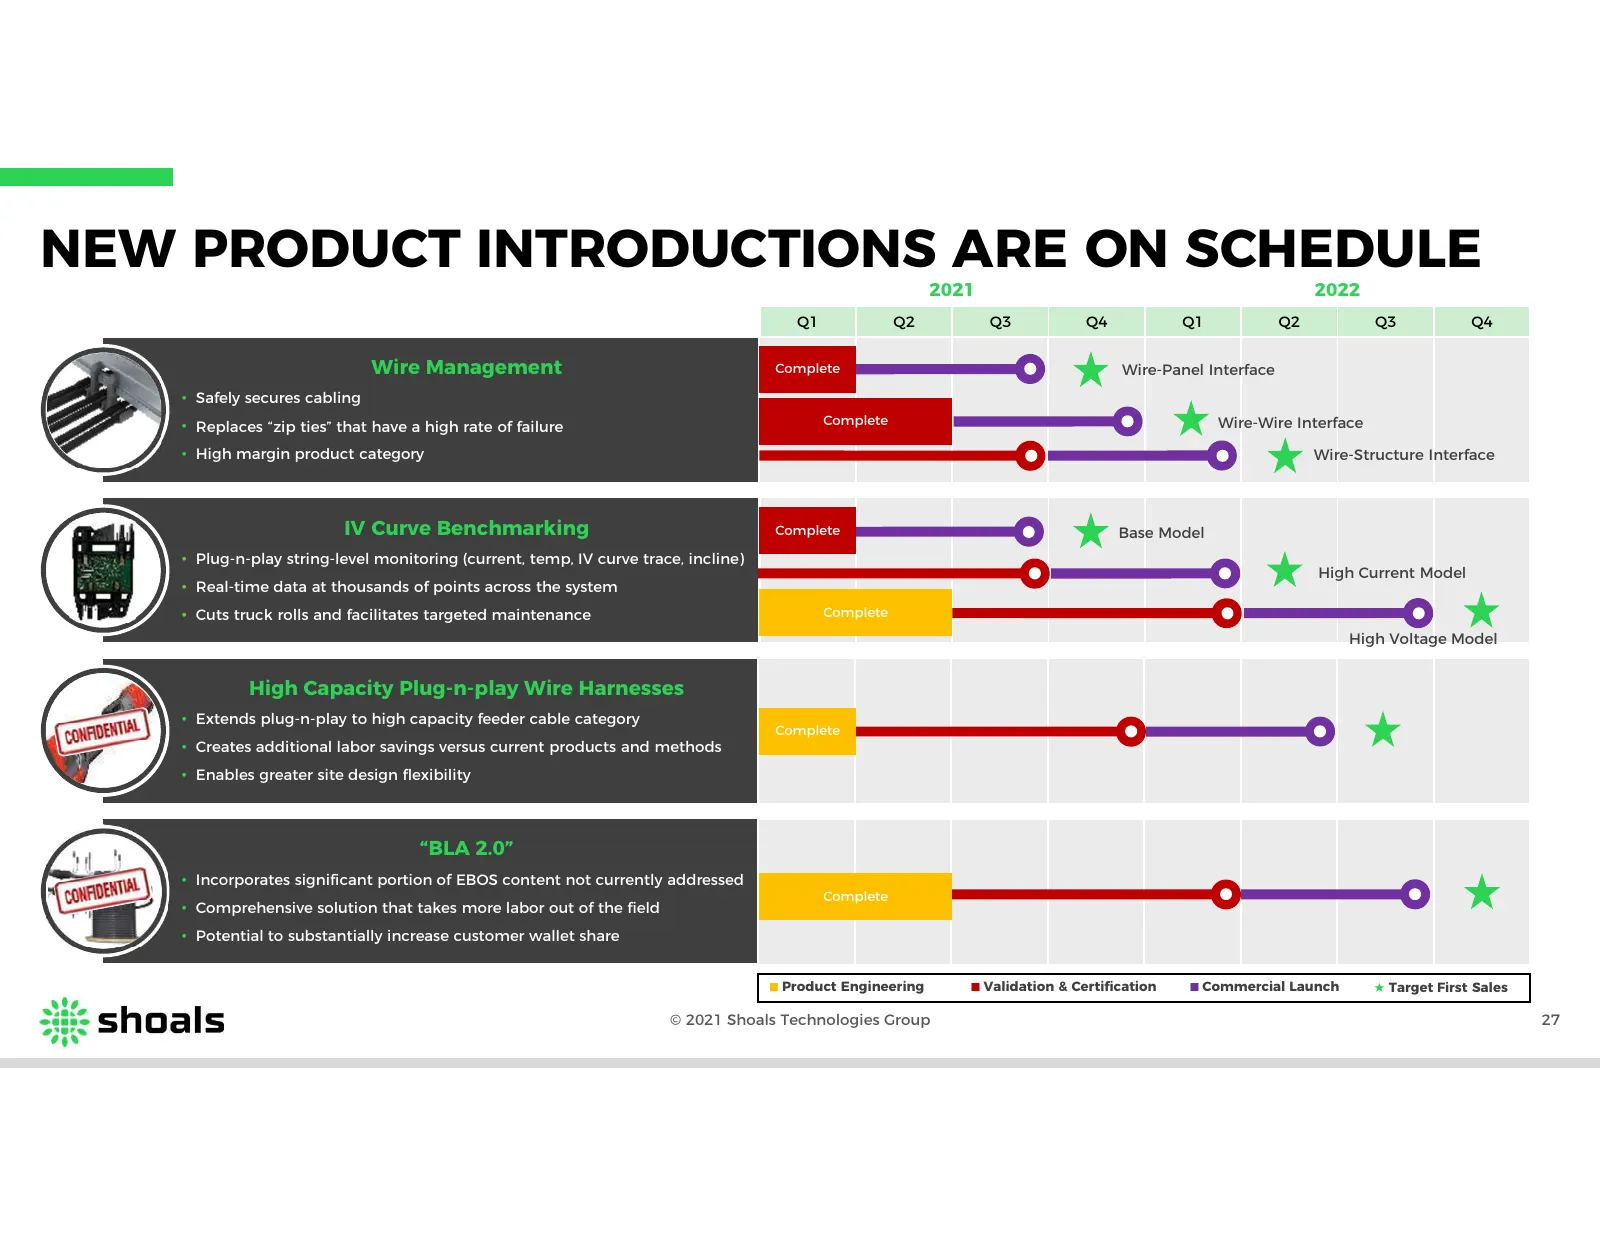
Slide 27: New Product Introductions Are on Schedule
NEW PRODUCT INTRODUCTIONS ARE ON SCHEDULE 2021 2022 Q1 Q2 Q3 Q4 Q1 Q2 Q3 Q4 Wire Management Complete Wire-Panel Interface • Safely secures cabling • Replaces “zip ties” that have a high rate of failure Complete Wire-Wire Interface • High margin product category Wire-Structure Interface IV Curve Benc
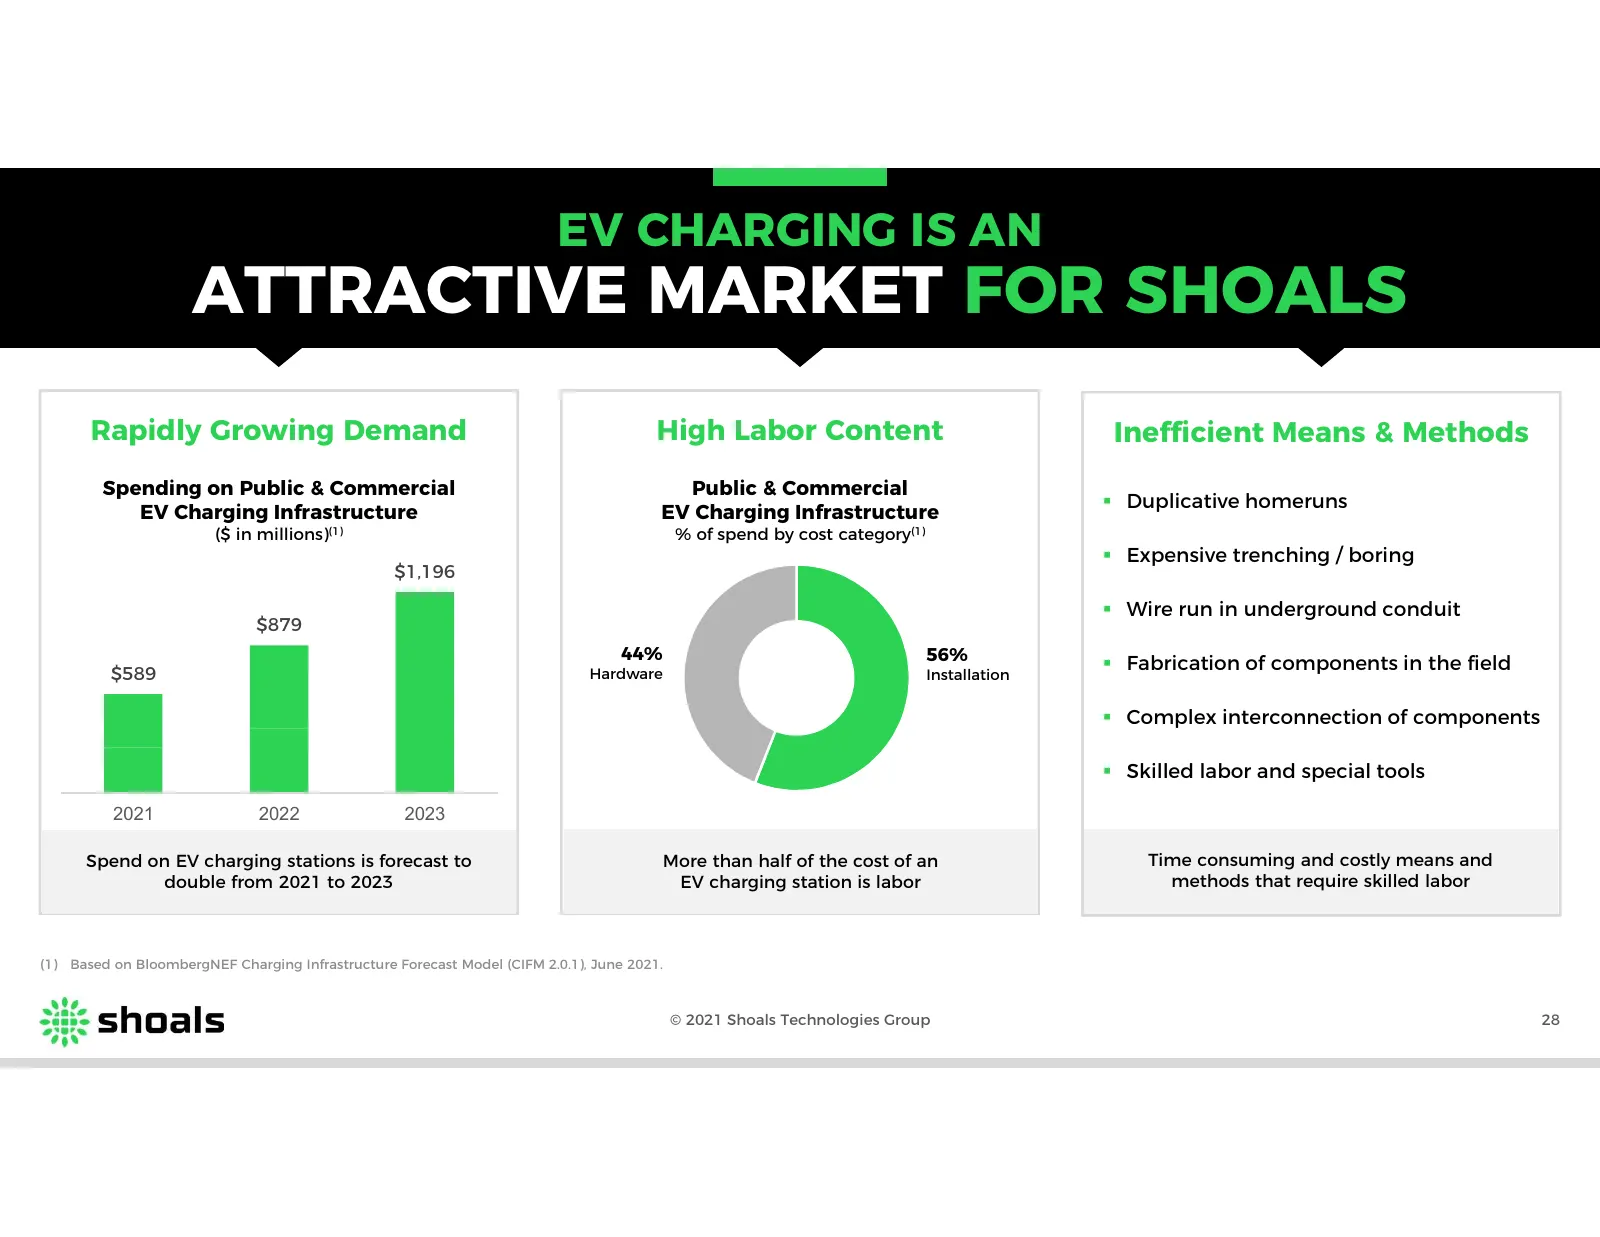
Slide 28: EV Charging Is an Attractive Market for Shoals
EV CHARGING IS AN ATTRACTIVE MARKET FOR SHOALS Rapidly Growing Demand High Labor Content Inefficient Means & Methods Spending on Public & Commercial Public & Commercial Duplicative homeruns EV Charging Infrastructure EV Charging Infrastructure ($ in millions)(1) % of spend by cost category(1) Ex
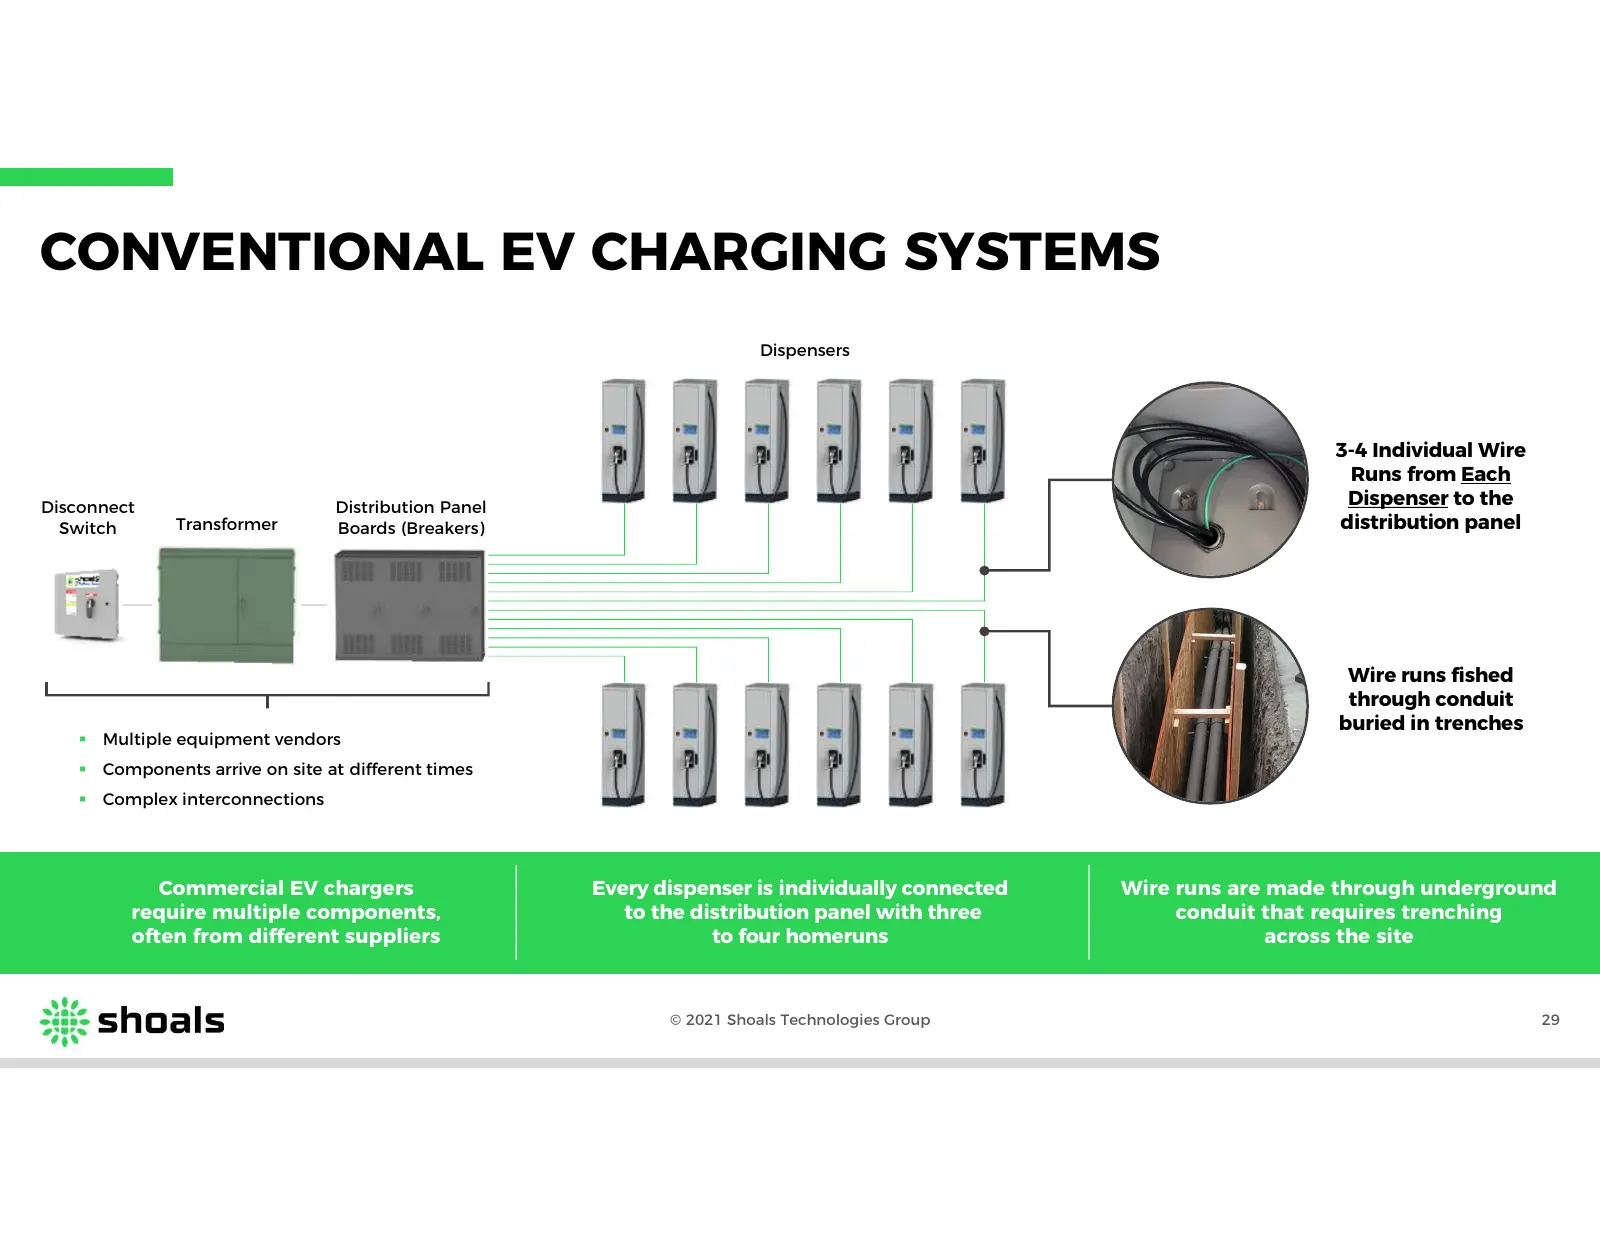
Slide 29: Conventional EV Charging Systems
CONVENTIONAL EV CHARGING SYSTEMS Dispensers 3-4 Individual Wire Runs from Each Disconnect Distribution Panel Dispenser to the Switch Transformer Boards (Breakers) distribution panel Wire runs fished through conduit buried in trenches Multiple equipment vendors Components arrive on site at differ
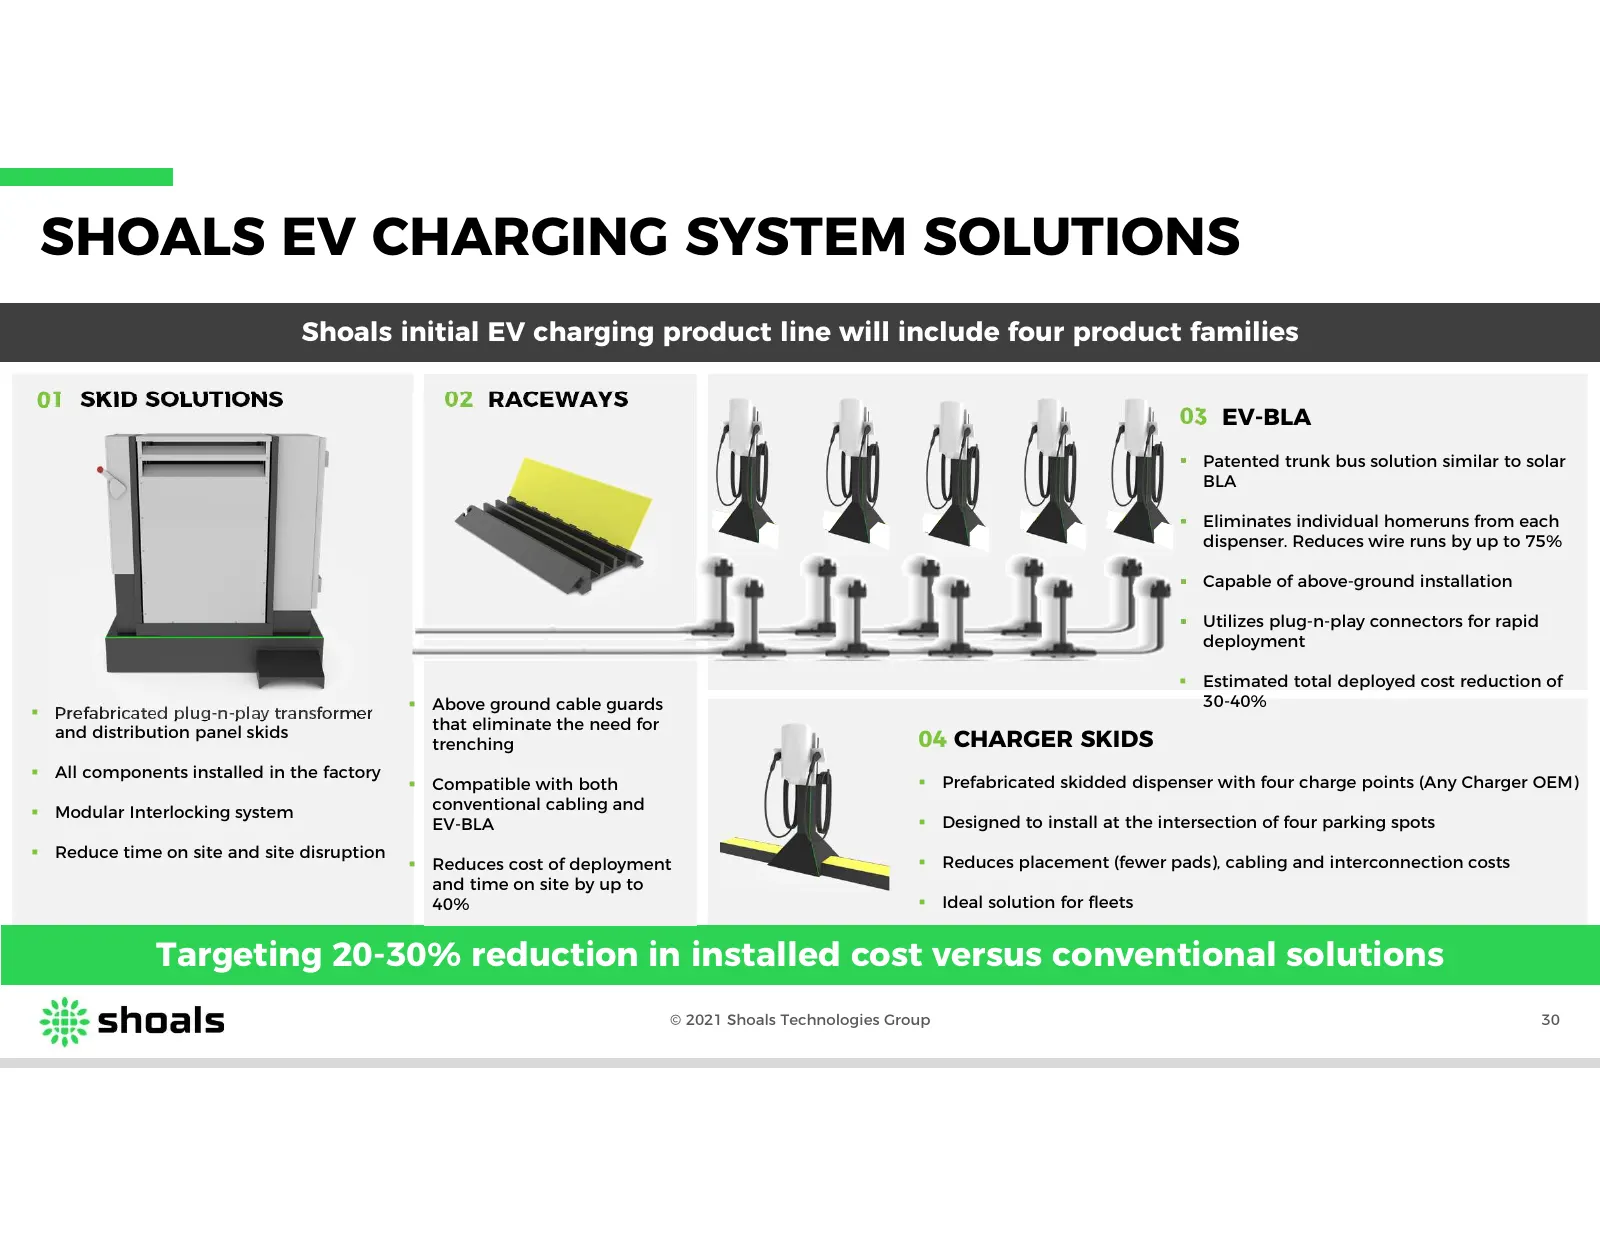
Slide 30: Shoals EV Charging System Solutions
SHOALS EV CHARGING SYSTEM SOLUTIONS Shoals initial EV charging product line will include four product families 01 SKID SOLUTIONS 02 RACEWAYS 03 EV-BLA Patented trunk bus solution similar to solar BLA Eliminates individual homeruns from each dispenser. Reduces wire runs by up to 75% Capable of
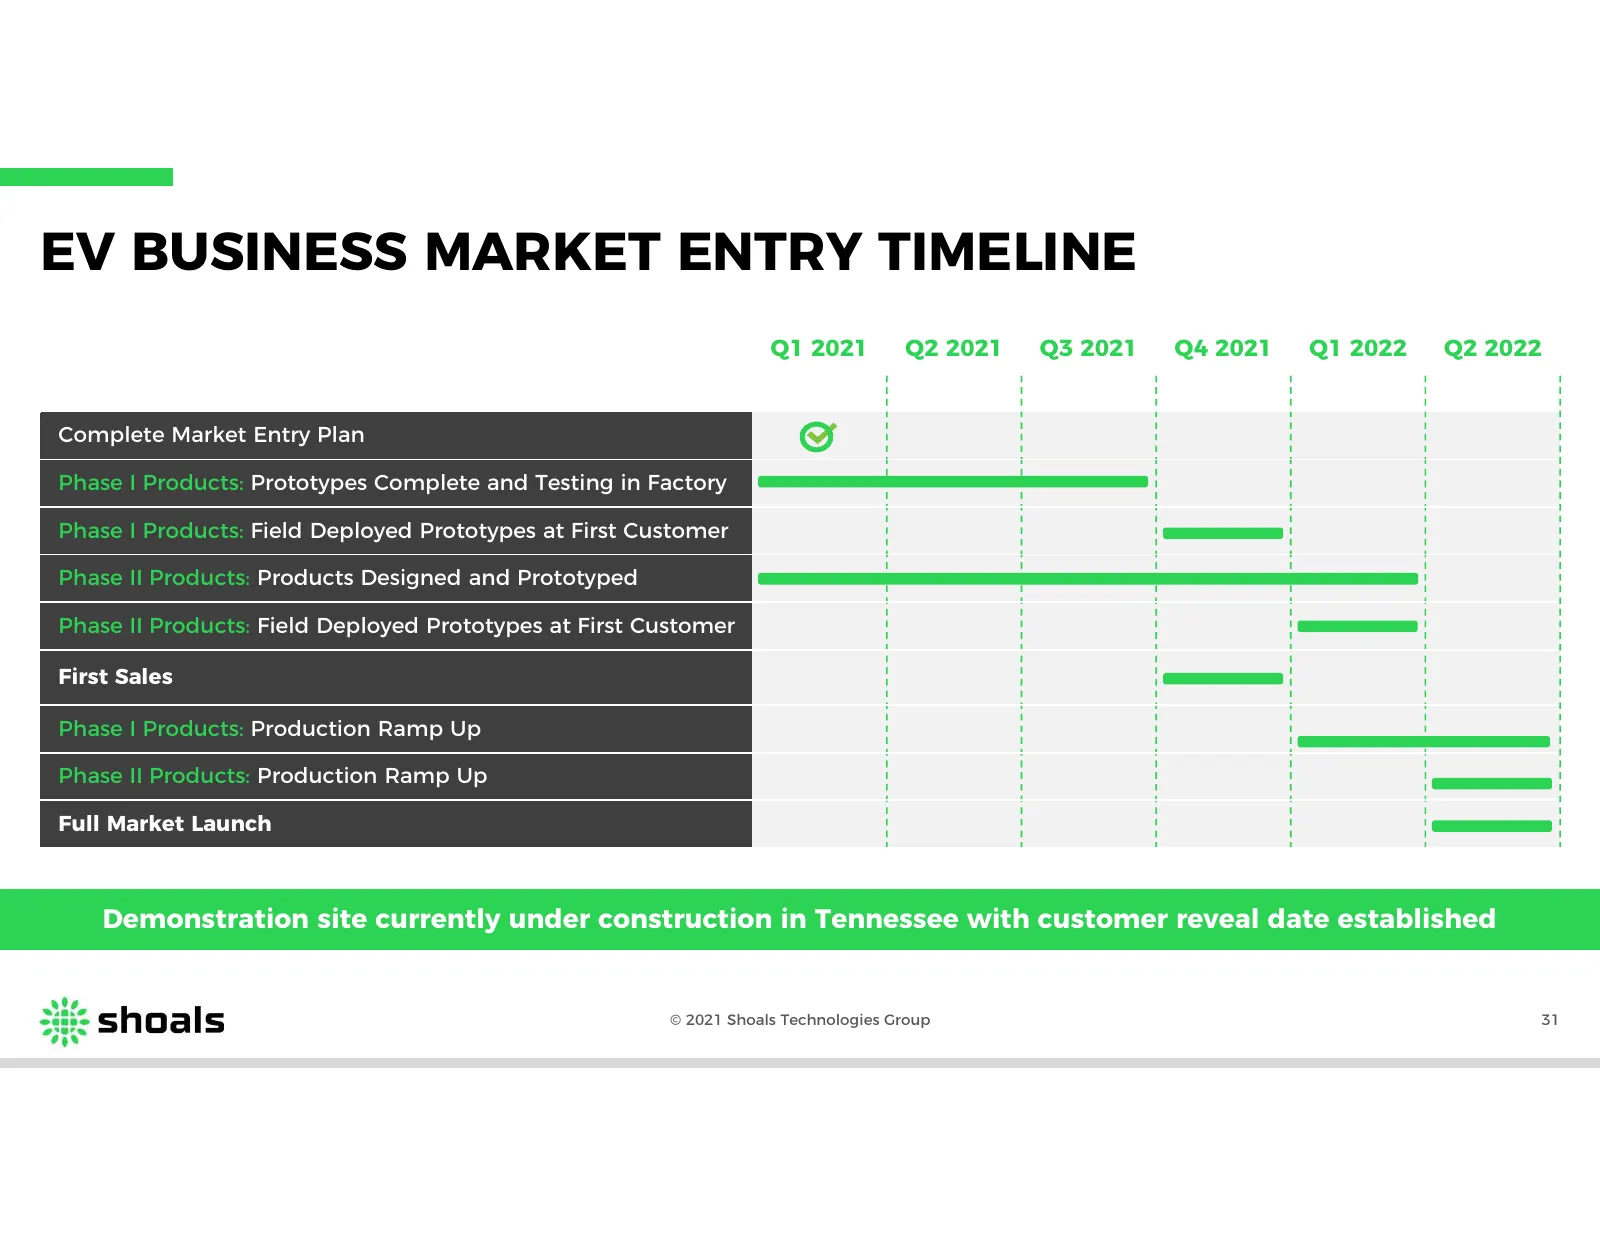
Slide 31: EV Business Market Entry Timeline
EV BUSINESS MARKET ENTRY TIMELINE Q1 2021 Q2 2021 Q3 2021 Q4 2021 Q1 2022 Q2 2022 Complete Market Entry Plan Phase I Products: Prototypes Complete and Testing in Factory Phase I Products: Field Deployed Prototypes at First Customer Phase II Products: Products Designed and Prototyped Phase II Product
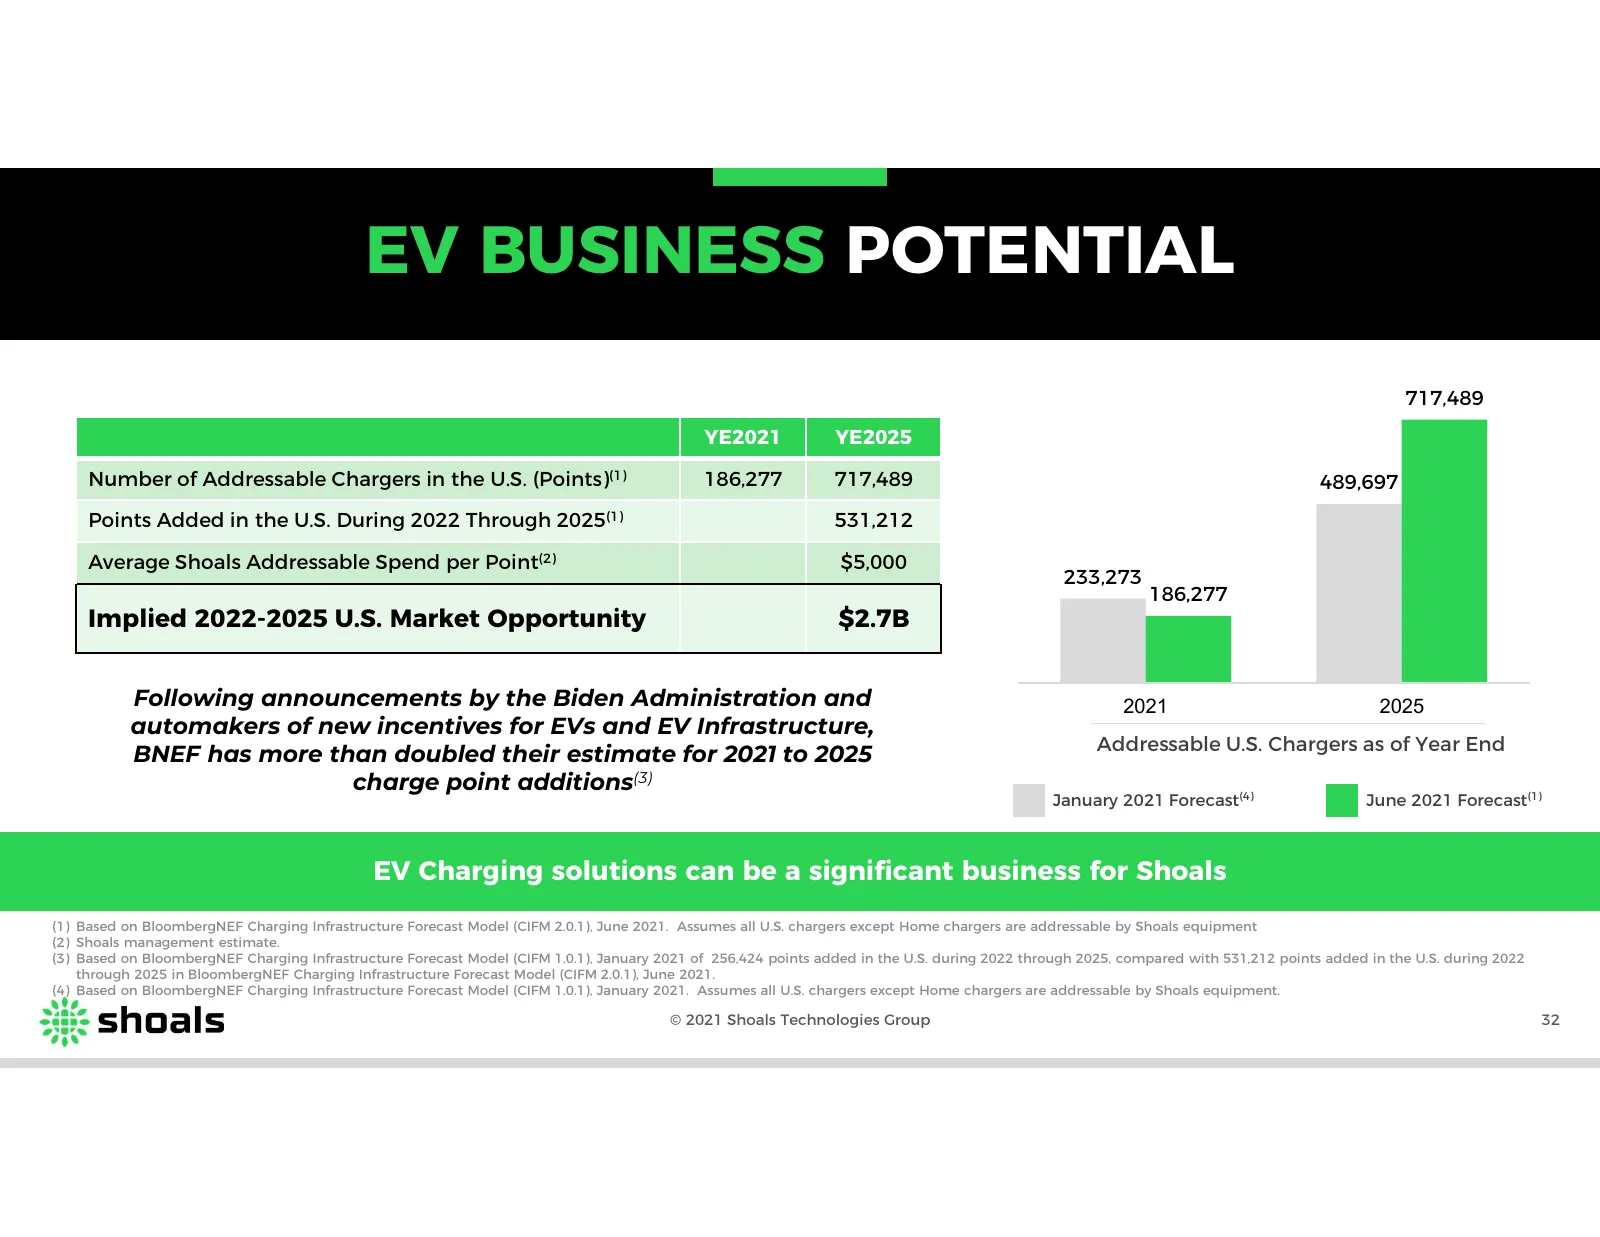
Slide 32: EV Business Potential
EV BUSINESS POTENTIAL 717,489 YE2021 YE2025 Number of Addressable Chargers in the U.S. (Points)(1) 186,277 717,489 489,697 Points Added in the U.S. During 2022 Through 2025(1) 531,212 Average Shoals Addressable Spend per Point(2) $5,000 233,273 186,277 Implied 2022-2025 U.S. Market Opportunity $2.7B
Slide 33: Financial Overview and Business Update
FINANCIAL OVERVIEW AND BUSINESS UPDATE
Slide 34: Simple Model That Delivers Strong Financial Results
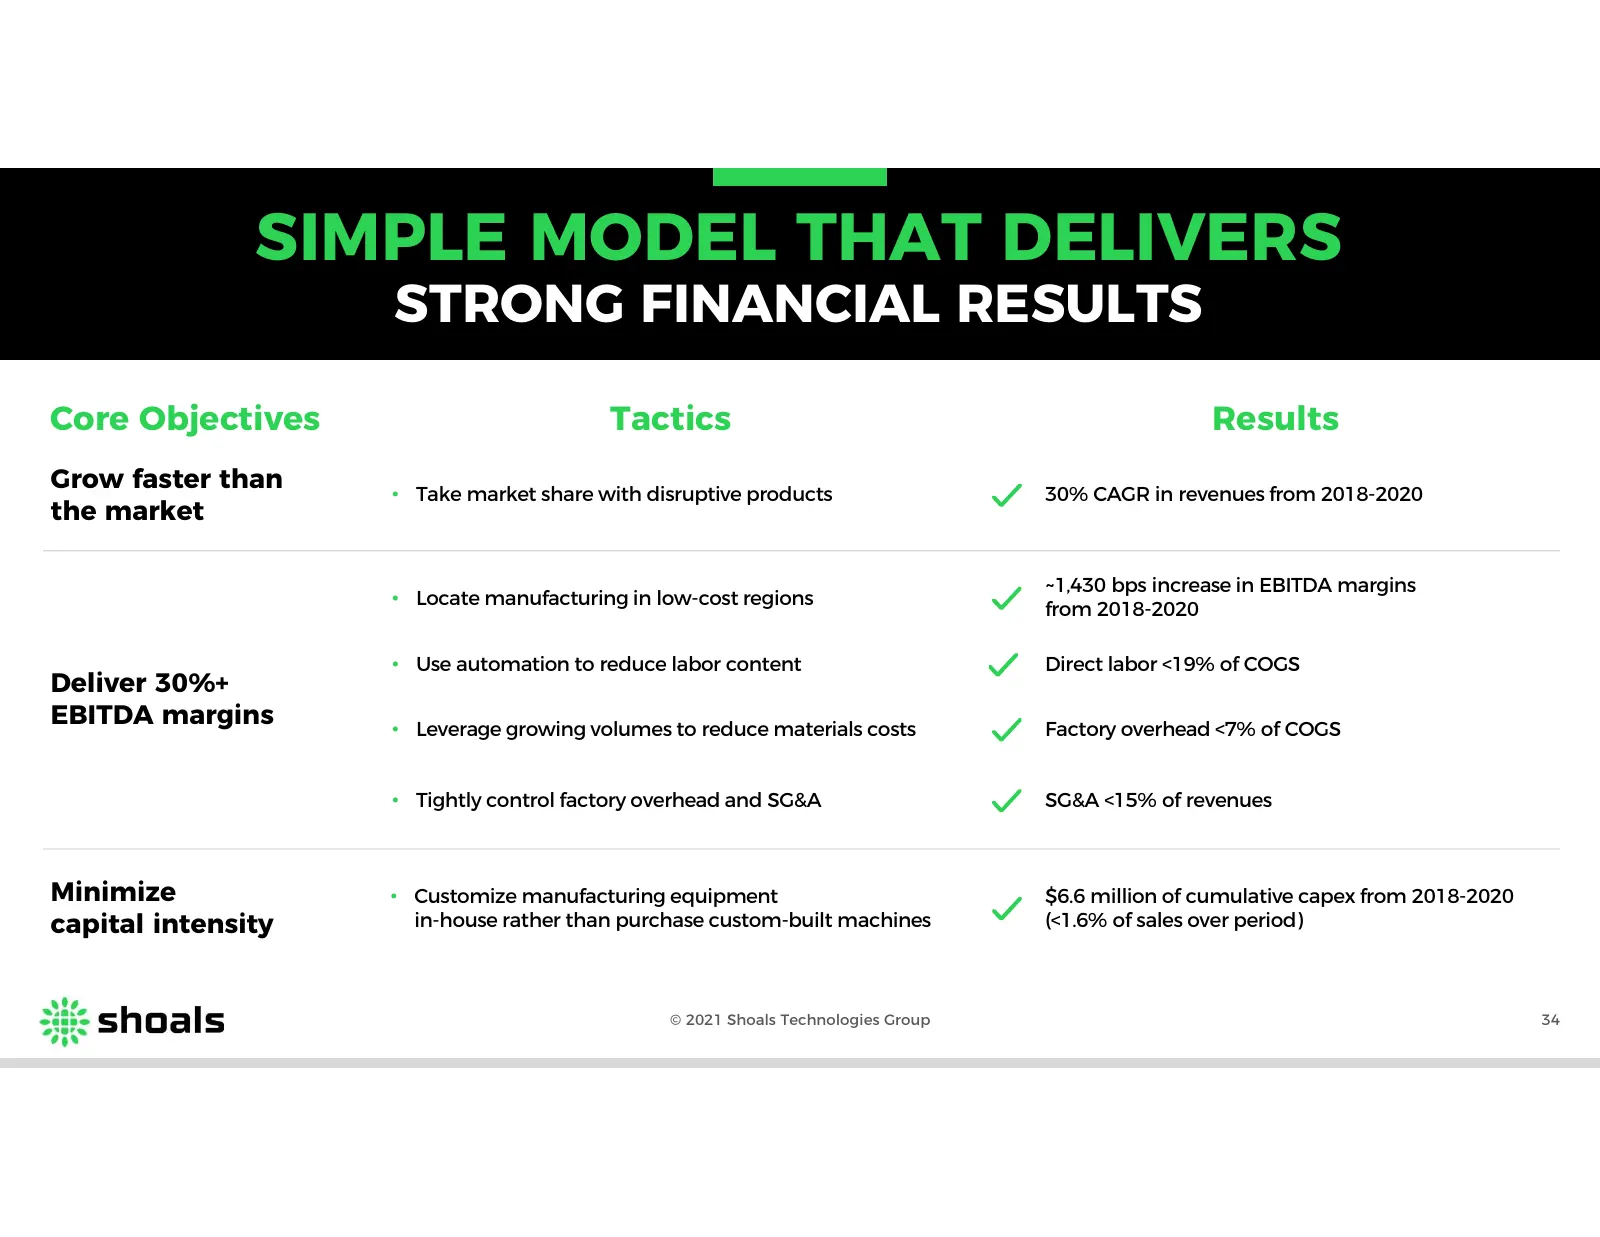
SIMPLE MODEL THAT DELIVERS STRONG FINANCIAL RESULTS Core Objectives Tactics Results Grow faster than • Take market share with disruptive products 30% CAGR in revenues from 2018-2020 the market ~1,430 bps increase in EBITDA margins • Locate manufacturing in low-cost regions from 2018-2020 • Use autom
Slide 35: High Revenue Visibility Driven by Long Project Lead Times
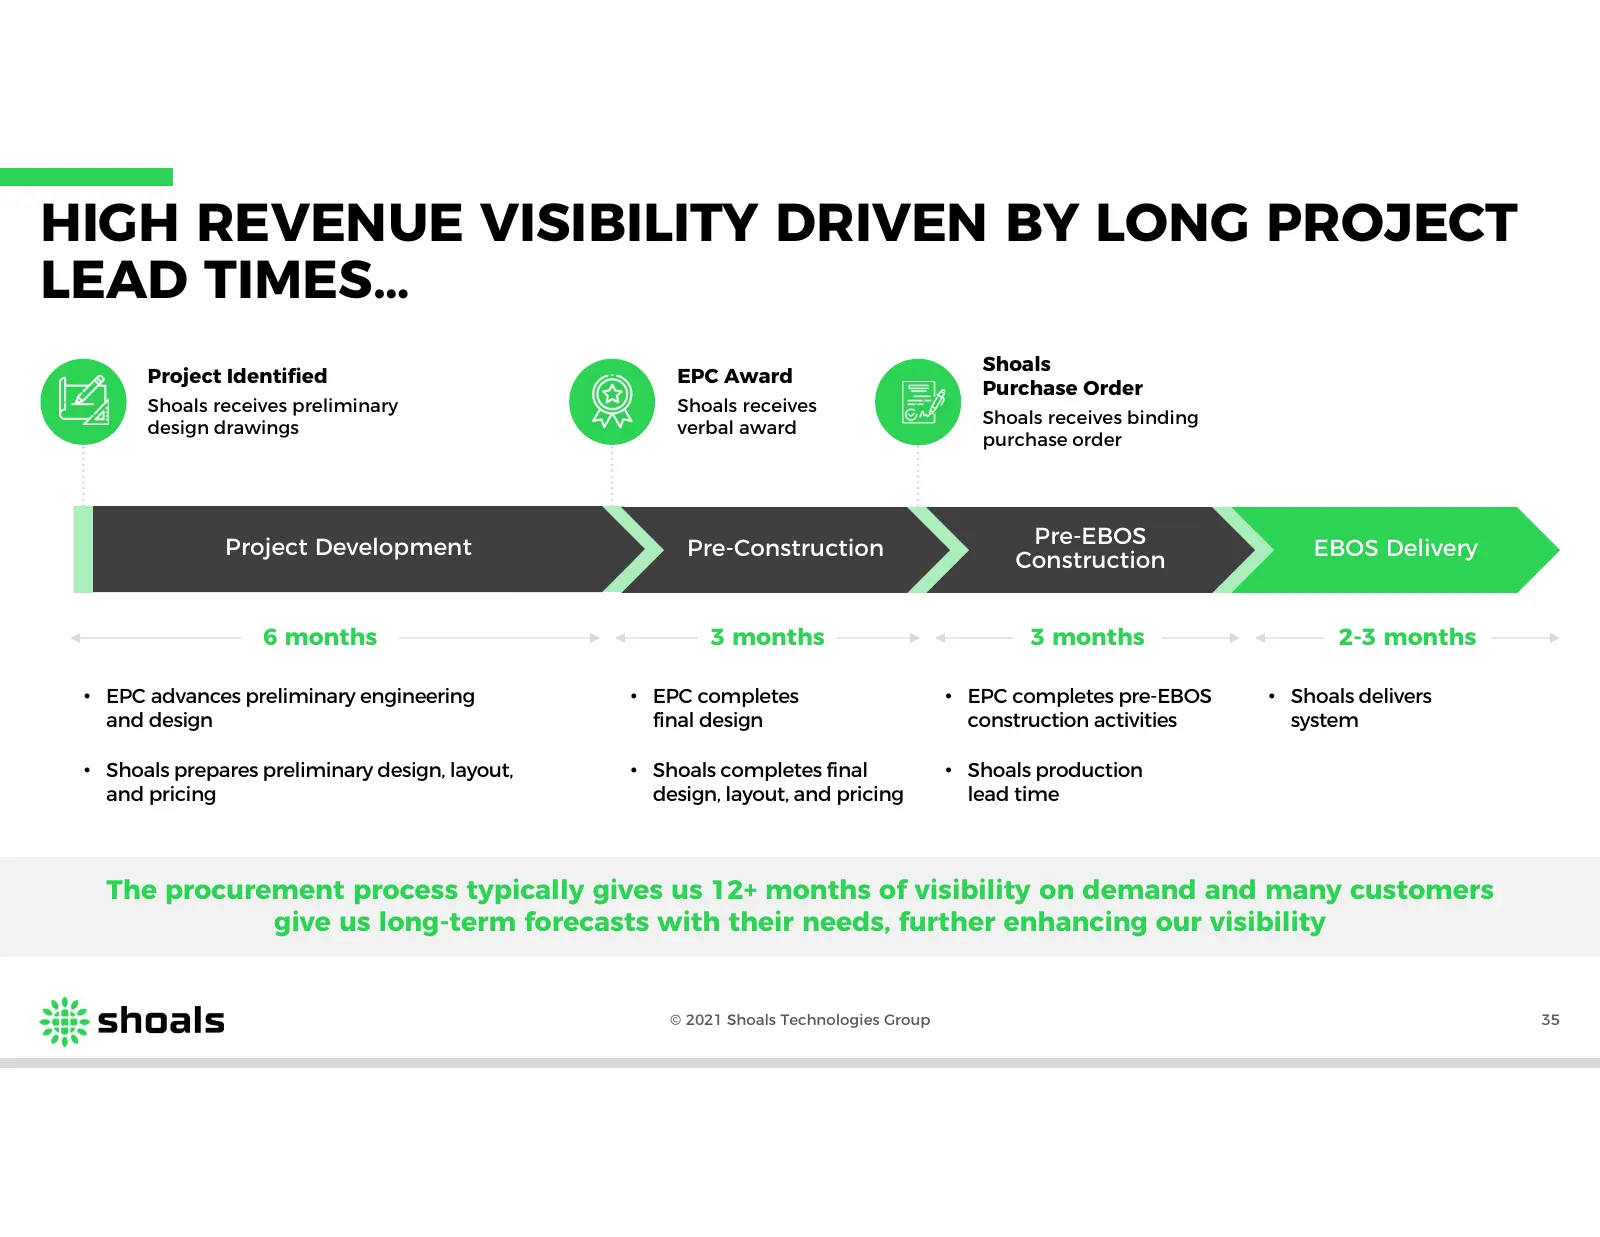
HIGH REVENUE VISIBILITY DRIVEN BY LONG PROJECT LEAD TIMES… Shoals Project Identified EPC Award Purchase Order Shoals receives preliminary Shoals receives Shoals receives binding design drawings verbal award purchase order Pre-EBOS Project Development Pre-Construction EBOS Delivery Construction 6 mon
Slide 36: Shoals Business Update
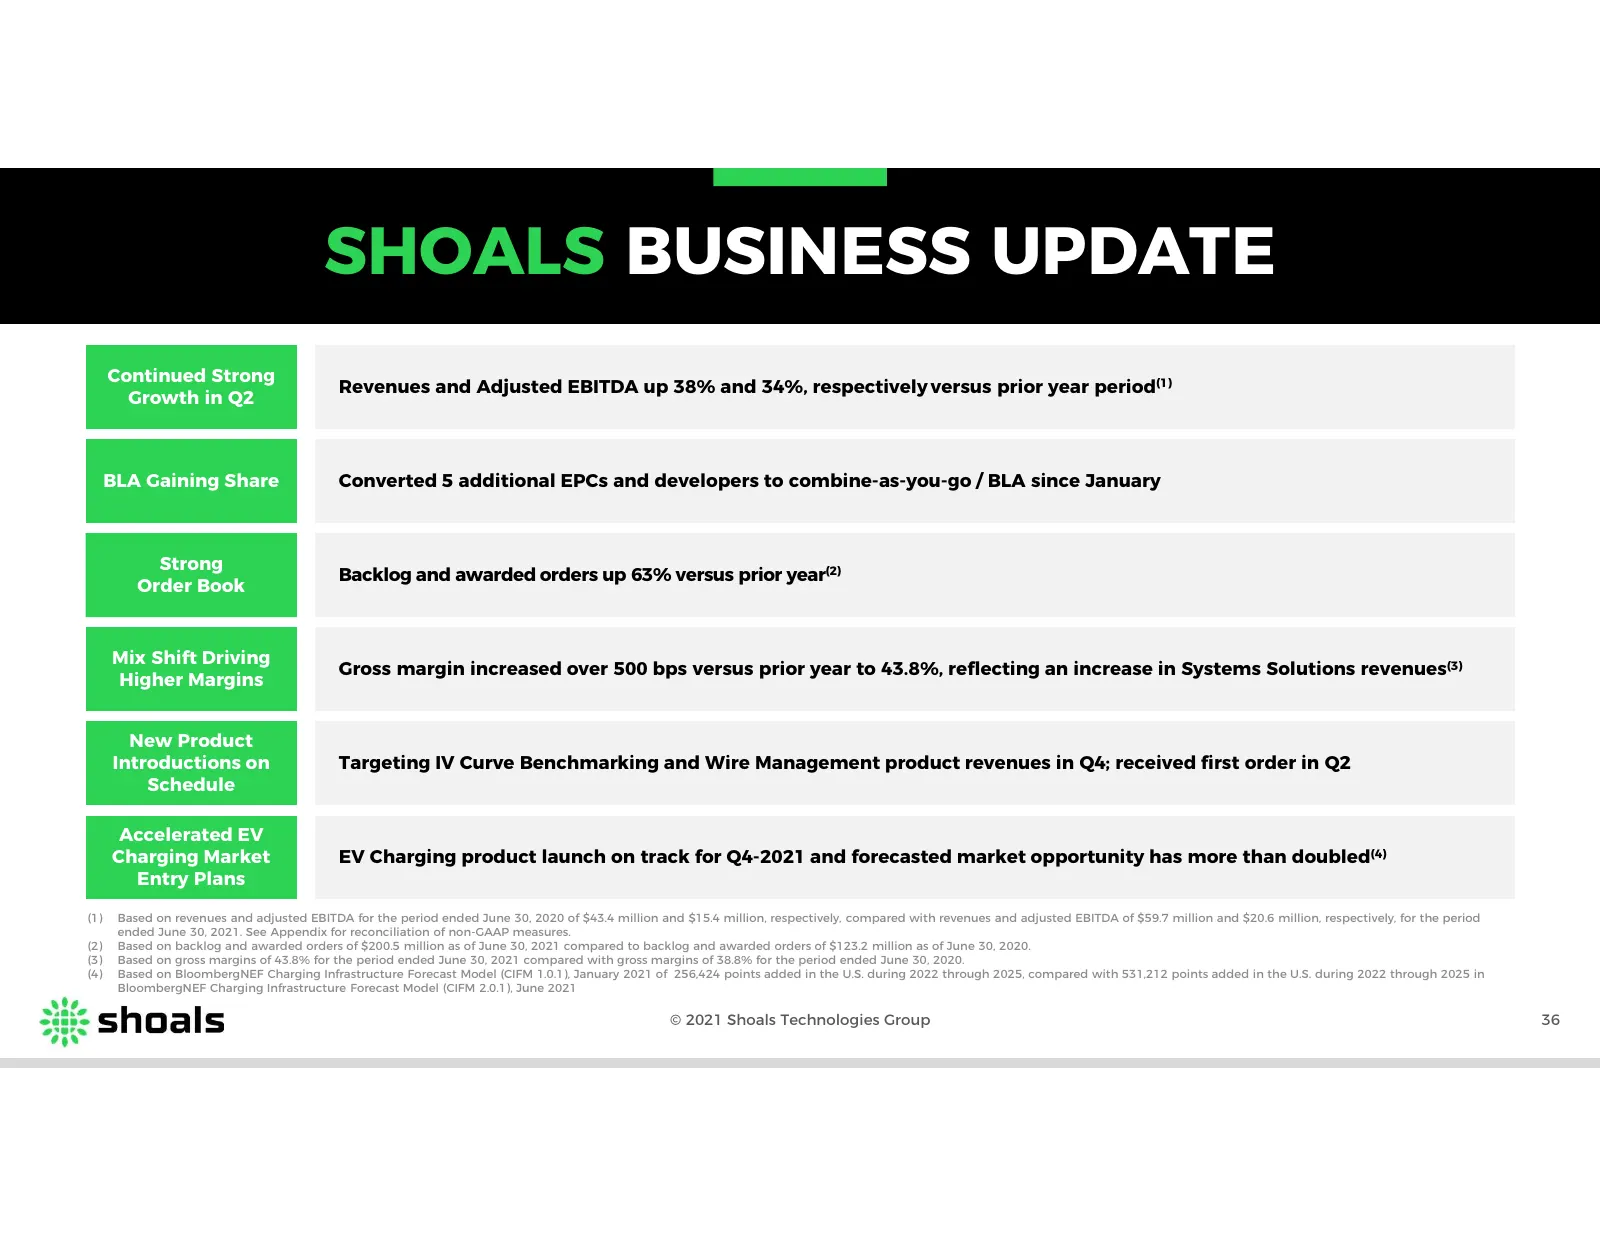
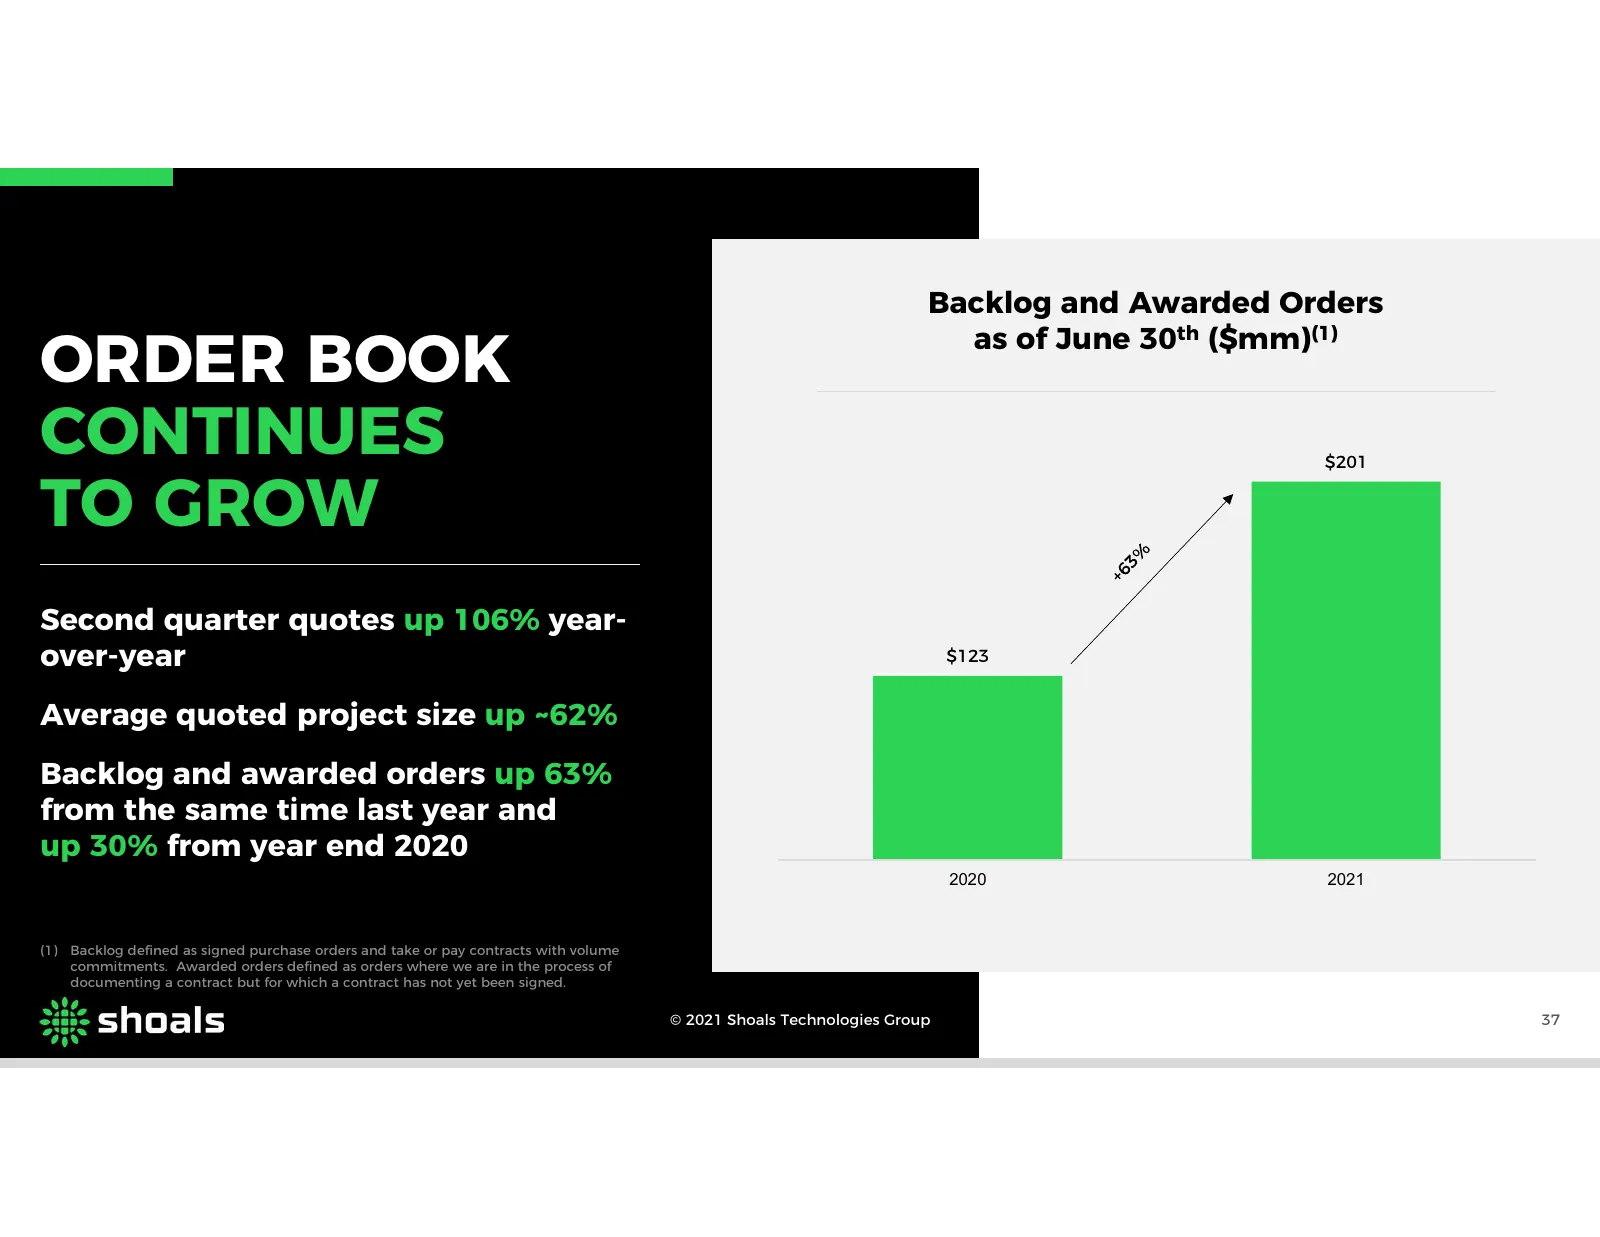
SHOALS BUSINESS UPDATE Continued Strong Revenues and Adjusted EBITDA up 38% and 34%, respectively versus prior year period(1) Growth in Q2 BLA Gaining Share Converted 5 additional EPCs and developers to combine-as-you-go / BLA since January Strong Backlog and awarded orders up 63% versus prior year(
Slide 37: Order Book Continues to Grow
Backlog and Awarded Orders ORDER BOOK as of June 30th ($mm)(1) CONTINUES $201 TO GROW Second quarter quotes up 106% year- over-year $123 Average quoted project size up ~62% Backlog and awarded orders up 63% from the same time last year and up 30% from year end 2020 2020 2021 (1) Backlog defined as s

Slide 38: Second Quarter Financial Snapshot
SECOND QUARTER FINANCIAL SNAPSHOT Revenue ($mm) System Solutions Revenue ($mm) Gross Margin (%) $59.7 $51.2 43.8% 86% of 38.8% $43.4 Total Revs $31.6 73% of Total Revs 2020 2021 2020 2021 2020 2021 3-Mos ended June 30, 3-Mos ended June 30, 3-Mos ended June 30, Adjusted EBITDA ($mm) Adjusted EBITDA M
Slide 39: Three Simple Reasons to Invest in Shoals
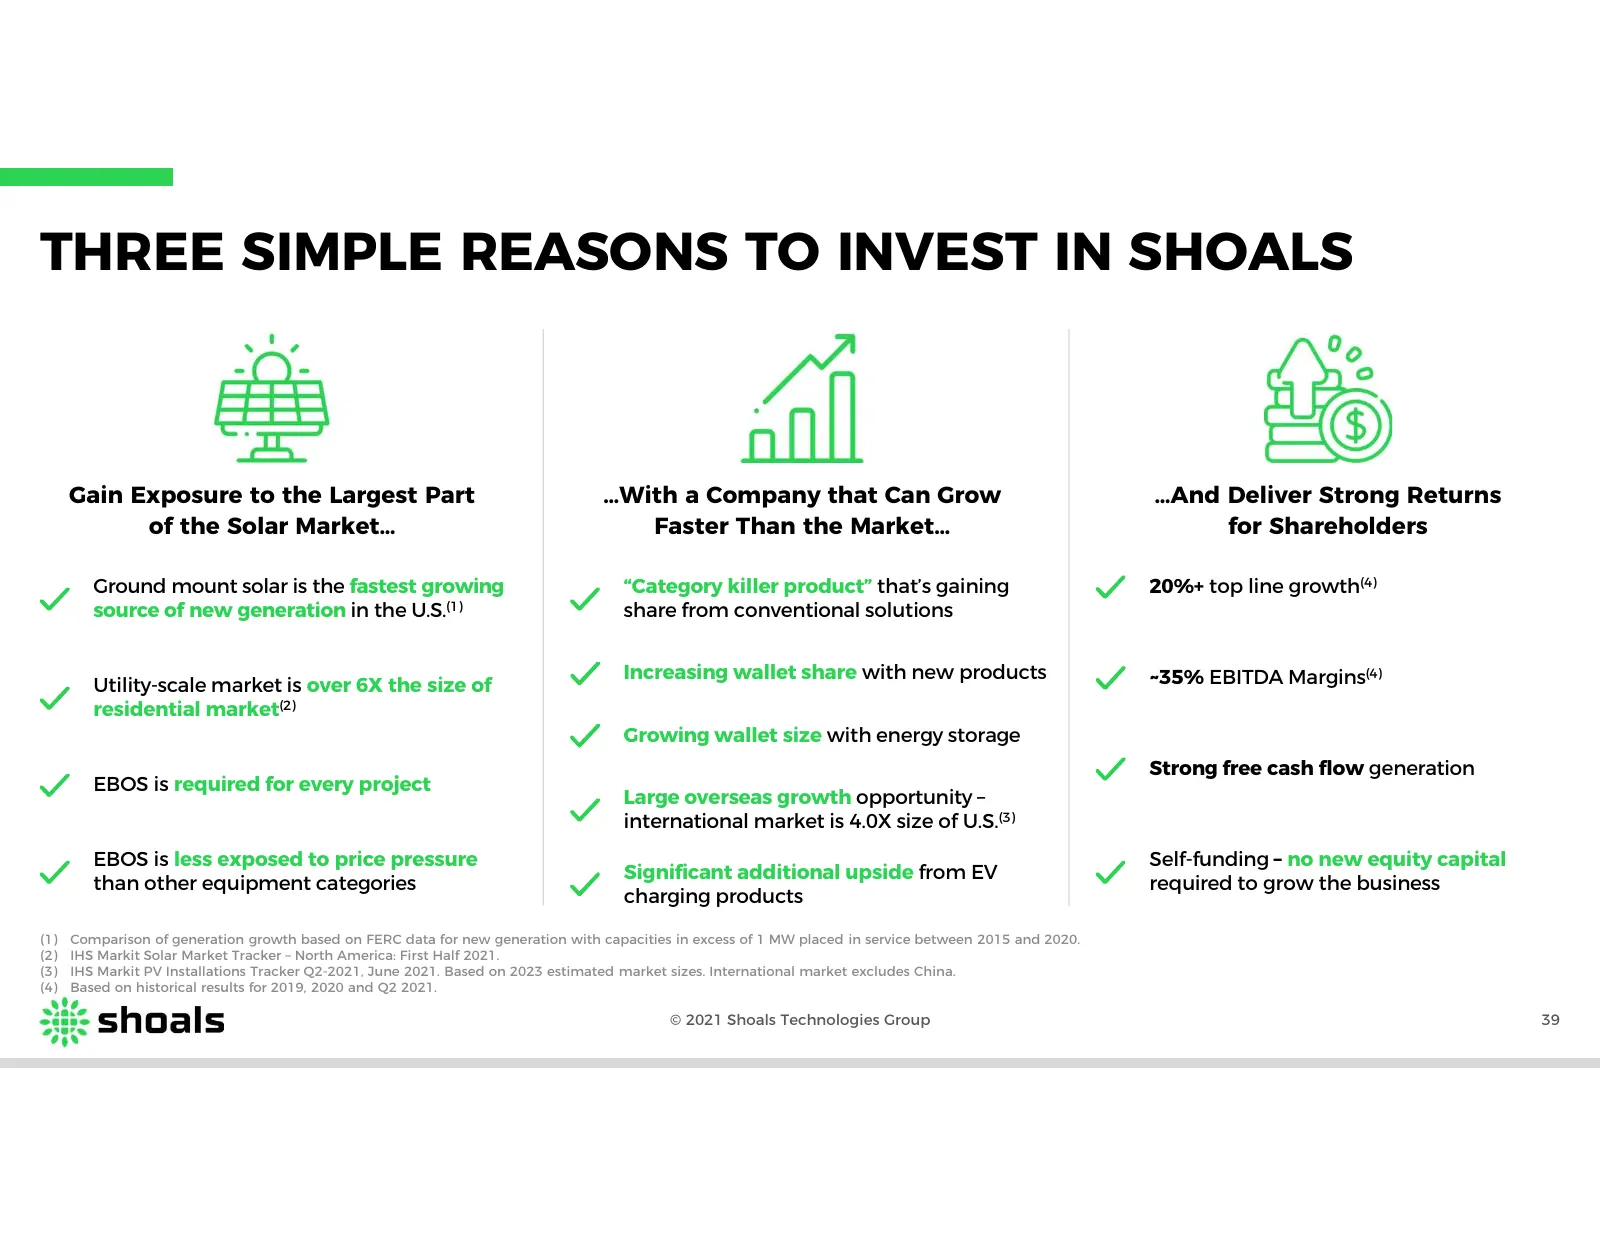
THREE SIMPLE REASONS TO INVEST IN SHOALS Gain Exposure to the Largest Part …With a Company that Can Grow …And Deliver Strong Returns of the Solar Market… Faster Than the Market… for Shareholders Ground mount solar is the fastest growing “Category killer product” that’s gaining 20%+ top line growth(4
Slide 40: Appendix
Pay APPENDIX
Slide 41: Reconciliation of Non-GAAP Measures
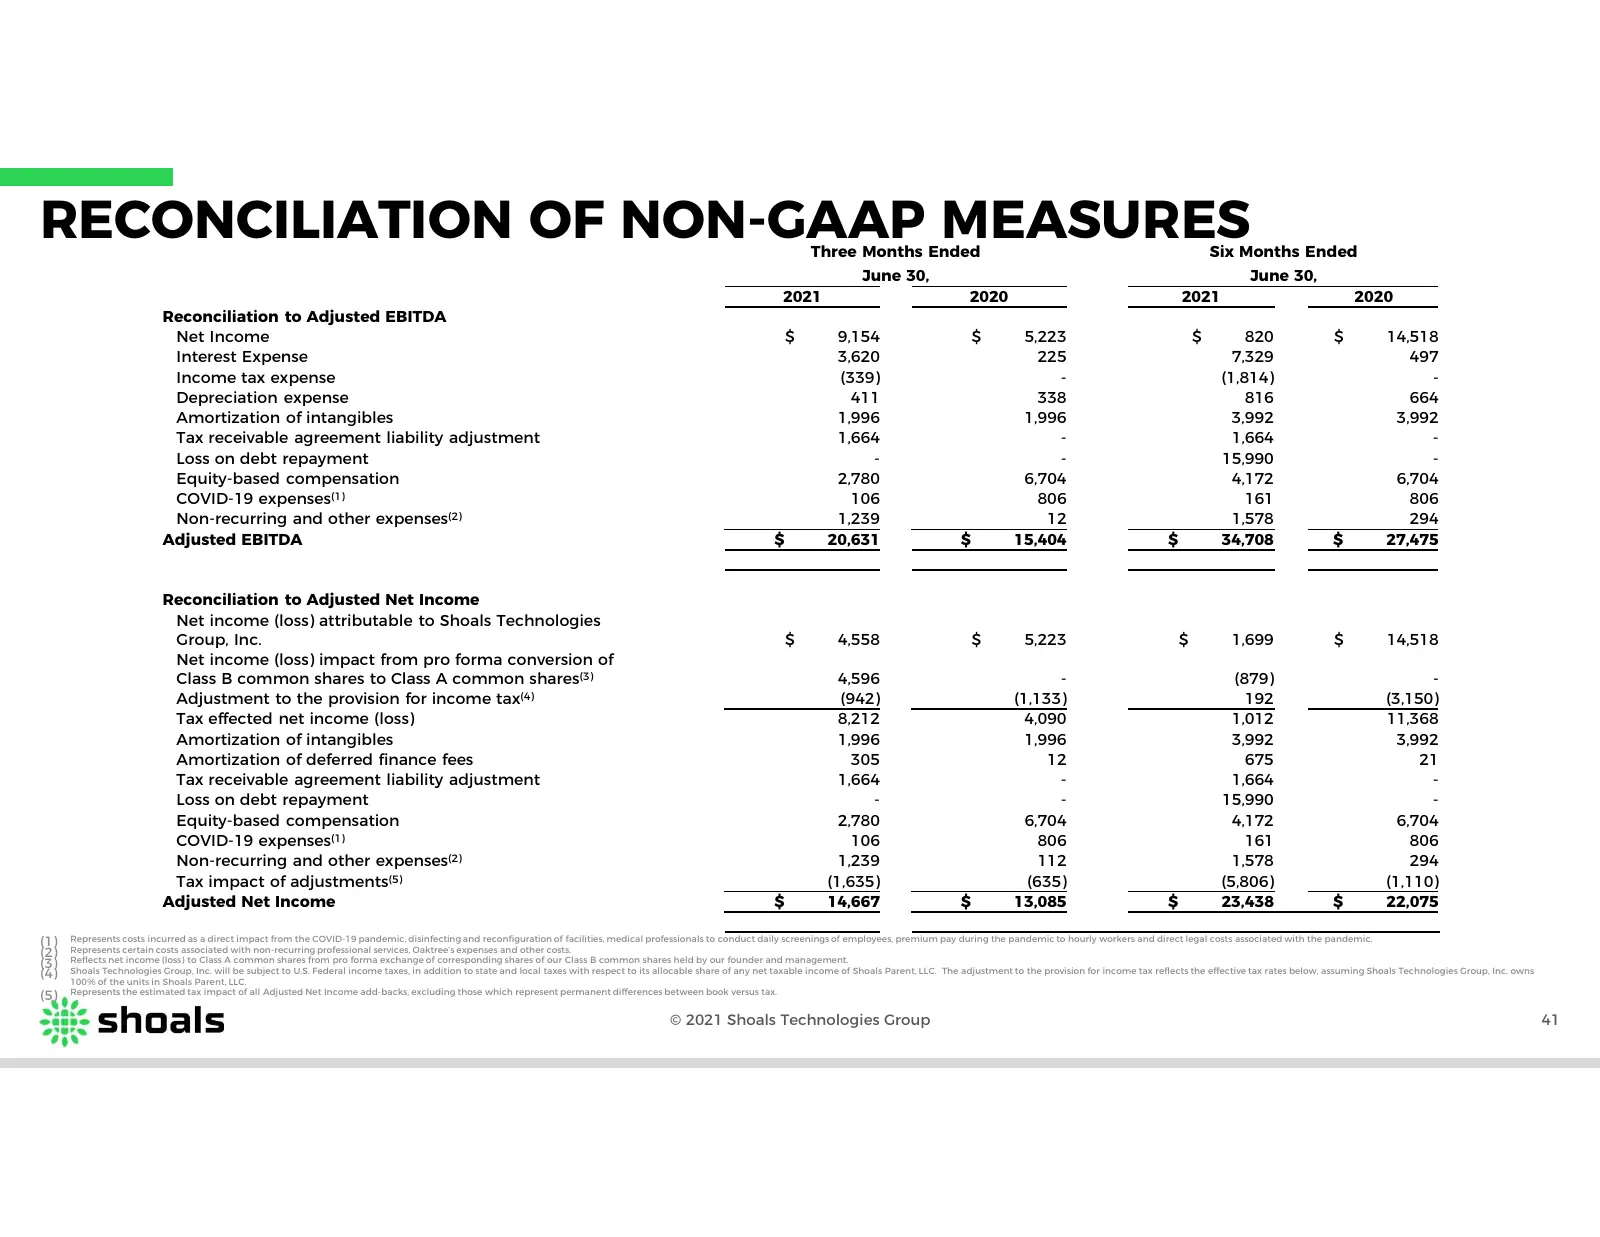
RECONCILIATION OF NON-GAAP MEASURES Three Months Ended Six Months Ended June 30, June 30, 2021 2020 2021 2020 Reconciliation to Adjusted EBITDA Net Income $ 9,154 $ 5,223 $ 820 $ 14,518 Interest Expense 3,620 225 7,329 497 Income tax expense (339) - (1,814) - Depreciation expense 411 338 816 664 Amo
Source: Internet Archive copy of s27.q4cdn.com
More decks from Shoals Technologies Group, Inc.
 Merger or Acquisition (November 2026)29 slides · Nov 4, 2026
 Q3 2026 Earnings Presentation14 slides · November 2026
 Q2 2026 Earnings Presentation15 slides · Aug 4, 2026
 Q1 2026 Earnings Presentation15 slides · May 5, 2026
 Q4 2025 Earnings Presentation20 slides · Feb 24, 2026
 Q3 2025 Earnings Presentation23 slides · November 2025