Shoals Technologies Group, Inc. · NASDAQ:SHLS
Shoals Technologies — Q3 2025 Earnings Presentation
23 slides from Shoals Technologies's earnings presentation, November 2025
Slide 1: Q3 Earnings Report
Q3 EARNINGS REPORT November 2025
Slide 2: Disclaimer
Disclaimer © 2025 Shoals Technologies Group Forward-Looking Statements This presentation contains forward-looking statements. All statements other than statements of historical fact are “forward-looking statements” for purposes of federal and state securities laws. Words, and variations of words, su
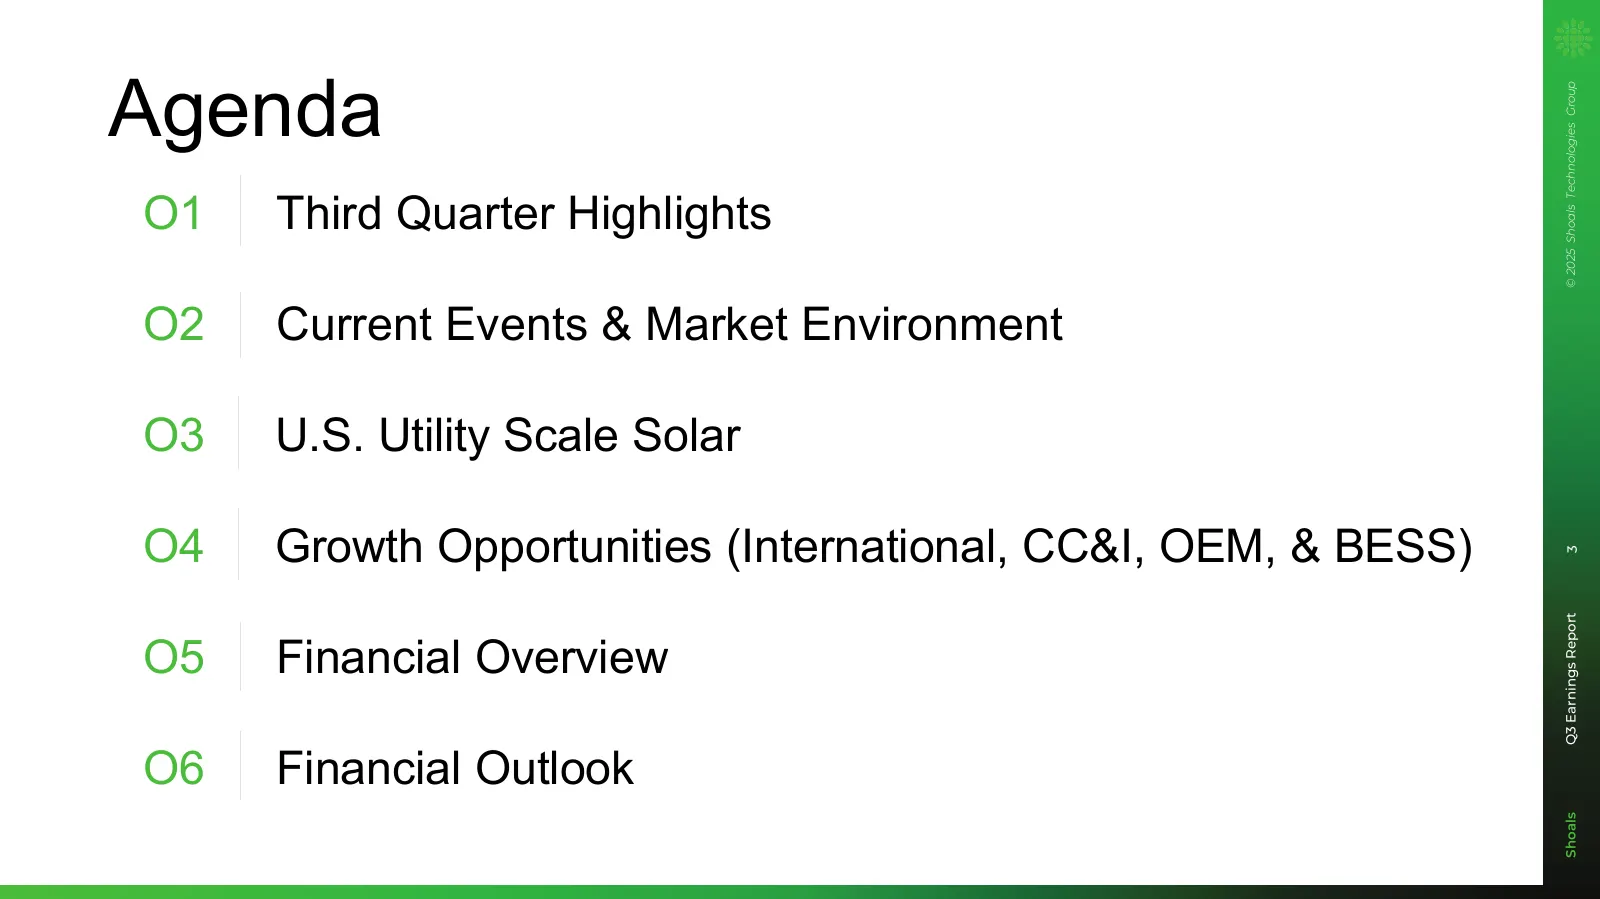
Slide 3: Agenda
Agenda © 2025 Shoals Technologies Group O1 Third Quarter Highlights O2 Current Events & Market Environment O3 U.S. Utility Scale Solar O4 Growth Opportunities (International, CC&I, OEM, & BESS) 3 3 Q2 Earnings Report Q3 Earnings Report O5 Financial Overview O6 Financial Outlook Shoals Shoals
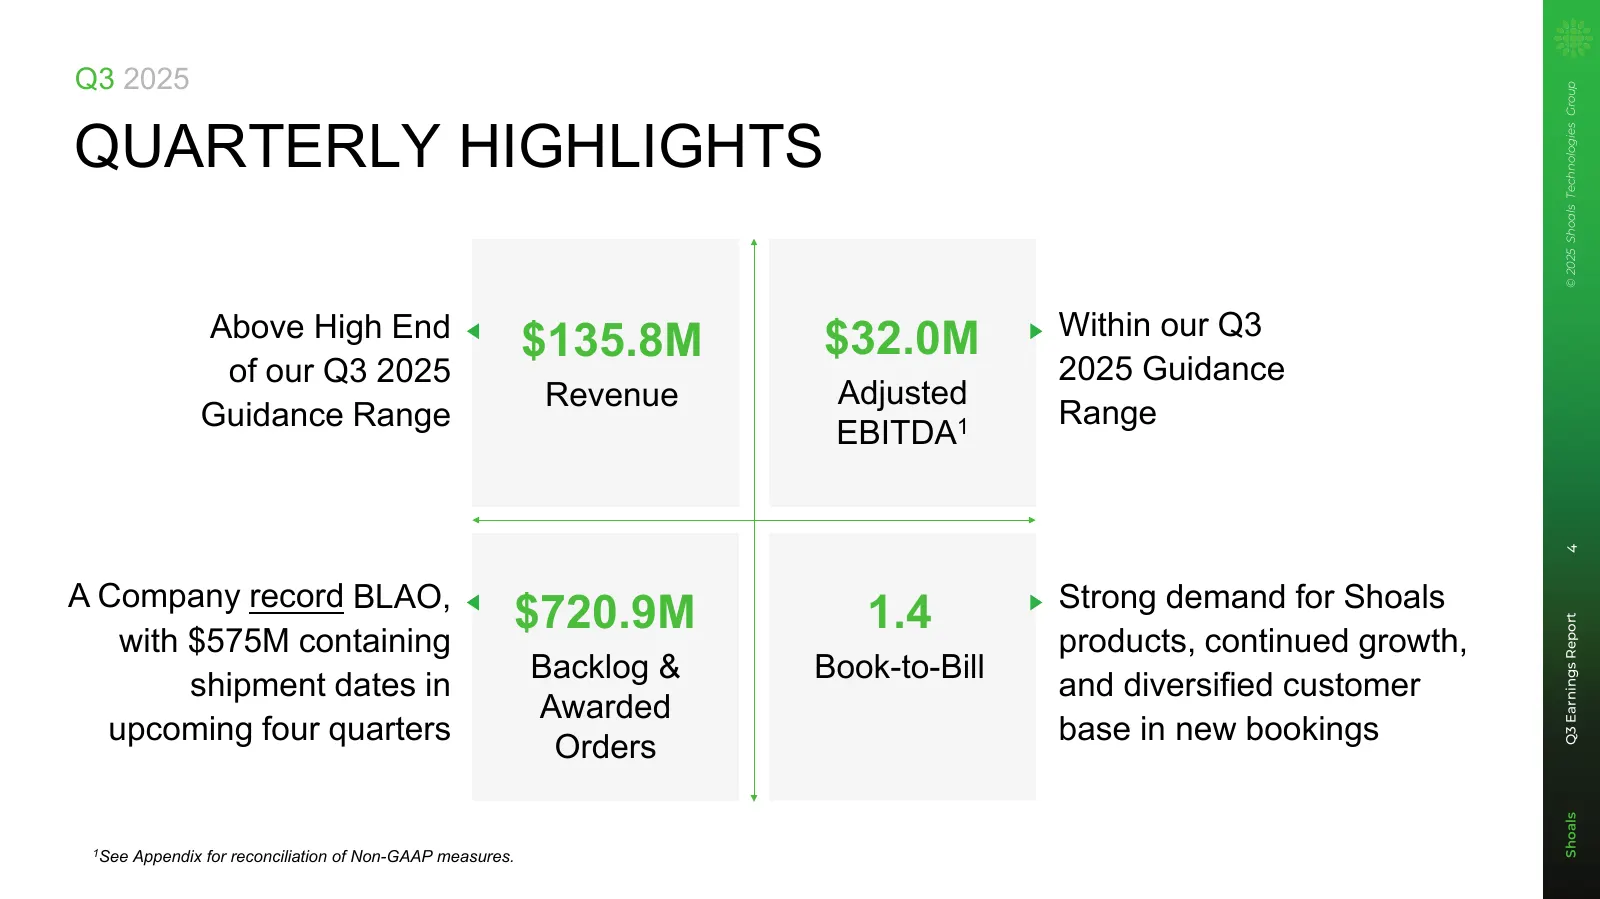
Slide 4: Quarterly Highlights
Q3 2025 © 2025 Shoals Technologies Group QUARTERLY HIGHLIGHTS Above High End Within our Q3 $135.8M $32.0M of our Q3 2025 2025 Guidance Revenue Adjusted Guidance Range Range EBITDA1 4 4 A Company record BLAO, Strong demand for Shoals $720.9M 1.4 Q3 Earnings Report with $575M containing products, cont
Slide 5: Current Events & Market Environment
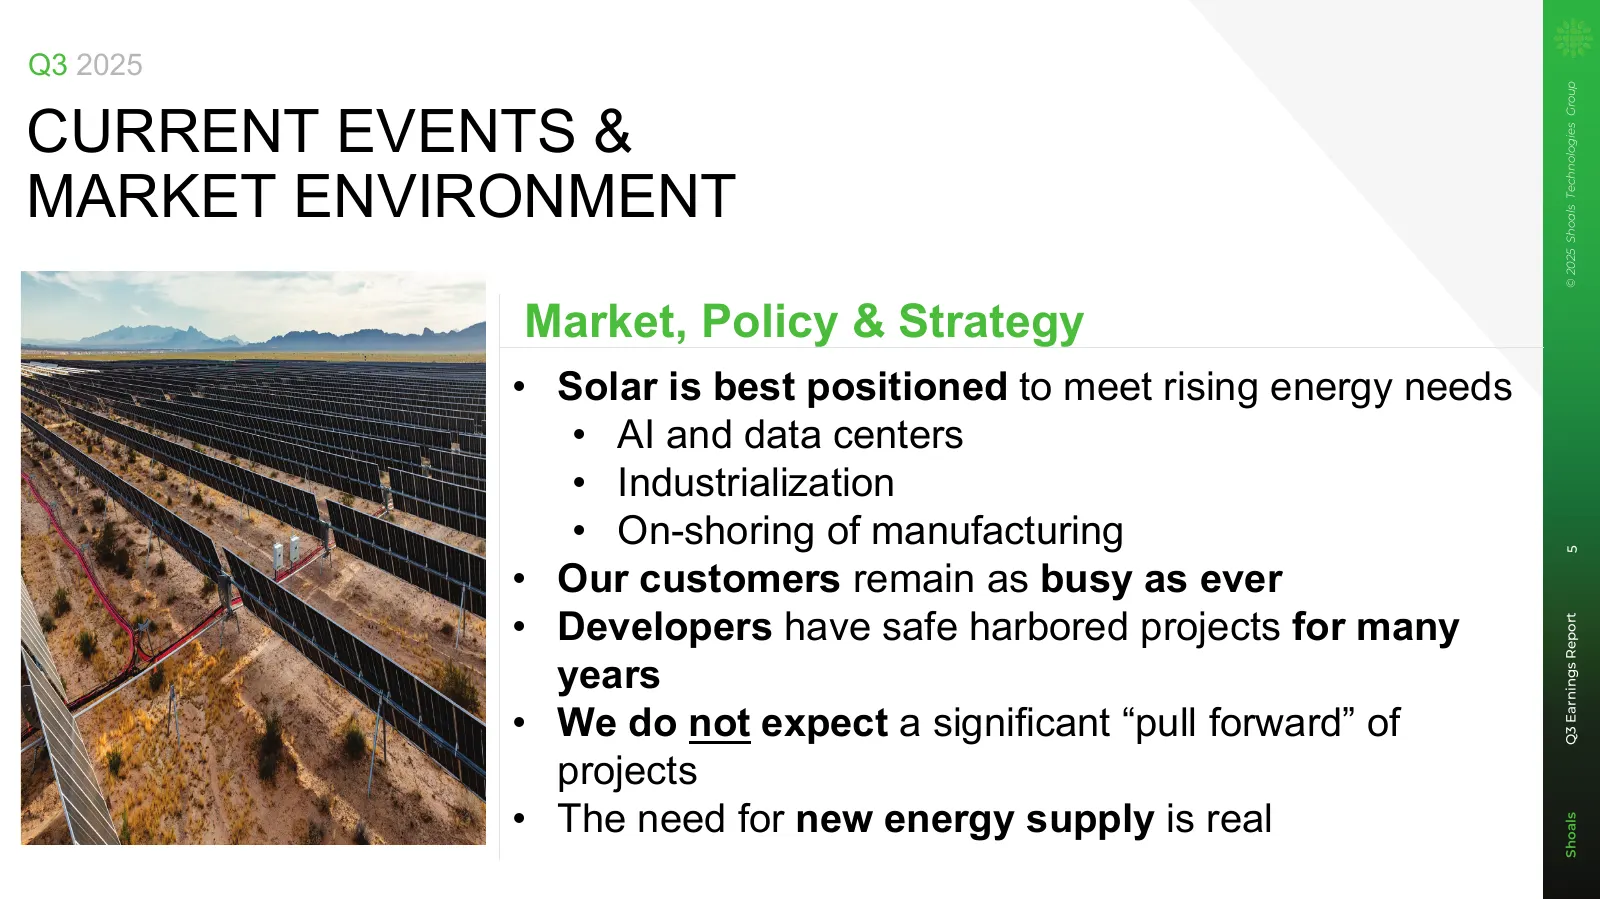
Q3 2025 © 2025 Shoals Technologies Group CURRENT EVENTS & MARKET ENVIRONMENT Market, Policy & Strategy • Solar is best positioned to meet rising energy needs • AI and data centers • Industrialization • On-shoring of manufacturing 5 5 • Our customers remain as busy as ever • Developers have safe harb
Slide 6: U.S. Utility Scale Solar Market Remains Resilient
Q3 2025 U.S. UTILITY © 2025 Shoals Technologies Group Our quote volume exceeded more than SCALE SOLAR $900M during Q3 2025 “The third quarter was another strong quarter of growth within our core U.S. Utility Scale Solar market.” Customer project U.S. Utility Scale calendars remain tight, Solar Marke
Slide 7: Growth Opportunities: International
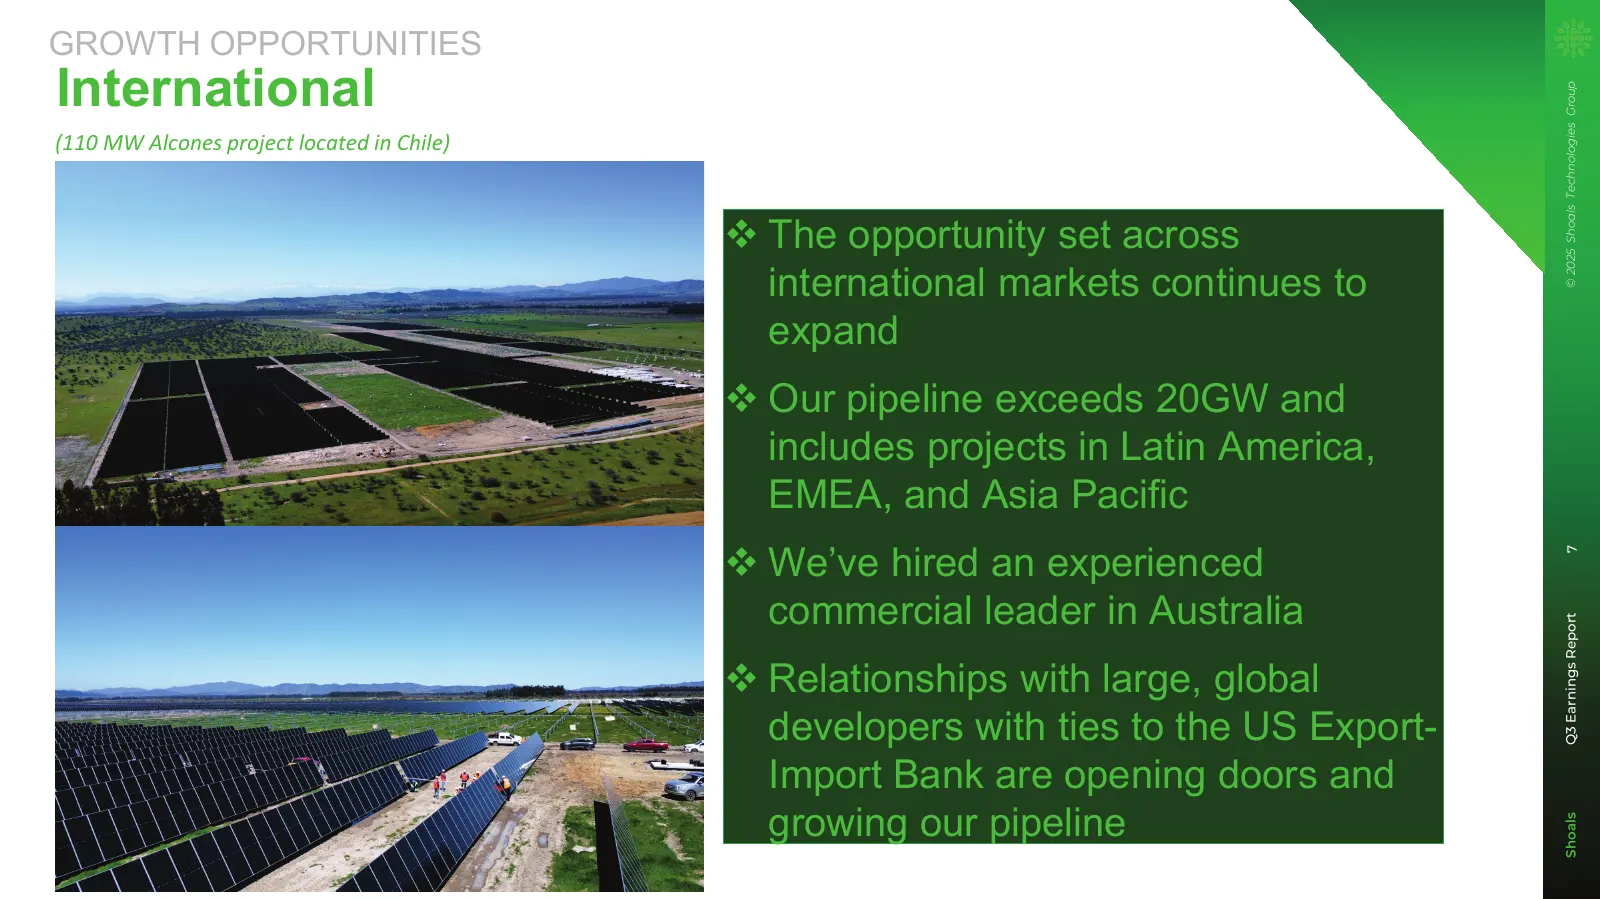
GROWTH OPPORTUNITIES International © 2025 Shoals Technologies Group (110 MW Alcones project located in Chile) The opportunity set across international markets continues to expand Our pipeline exceeds 20GW and includes projects in Latin America, EMEA, and Asia Pacific We’ve hired an experienced

Slide 8: Growth Opportunities: CC&I
GROWTH OPPORTUNITIES CC&I © 2025 Shoals Technologies Group “Our CC&I business is performing well. Our engagement with large, well respected electrical distributors is driving meaningful quote volume increases.” 8 8 Q3 Earnings Report Shoals
Slide 9: Growth Opportunities: OEM
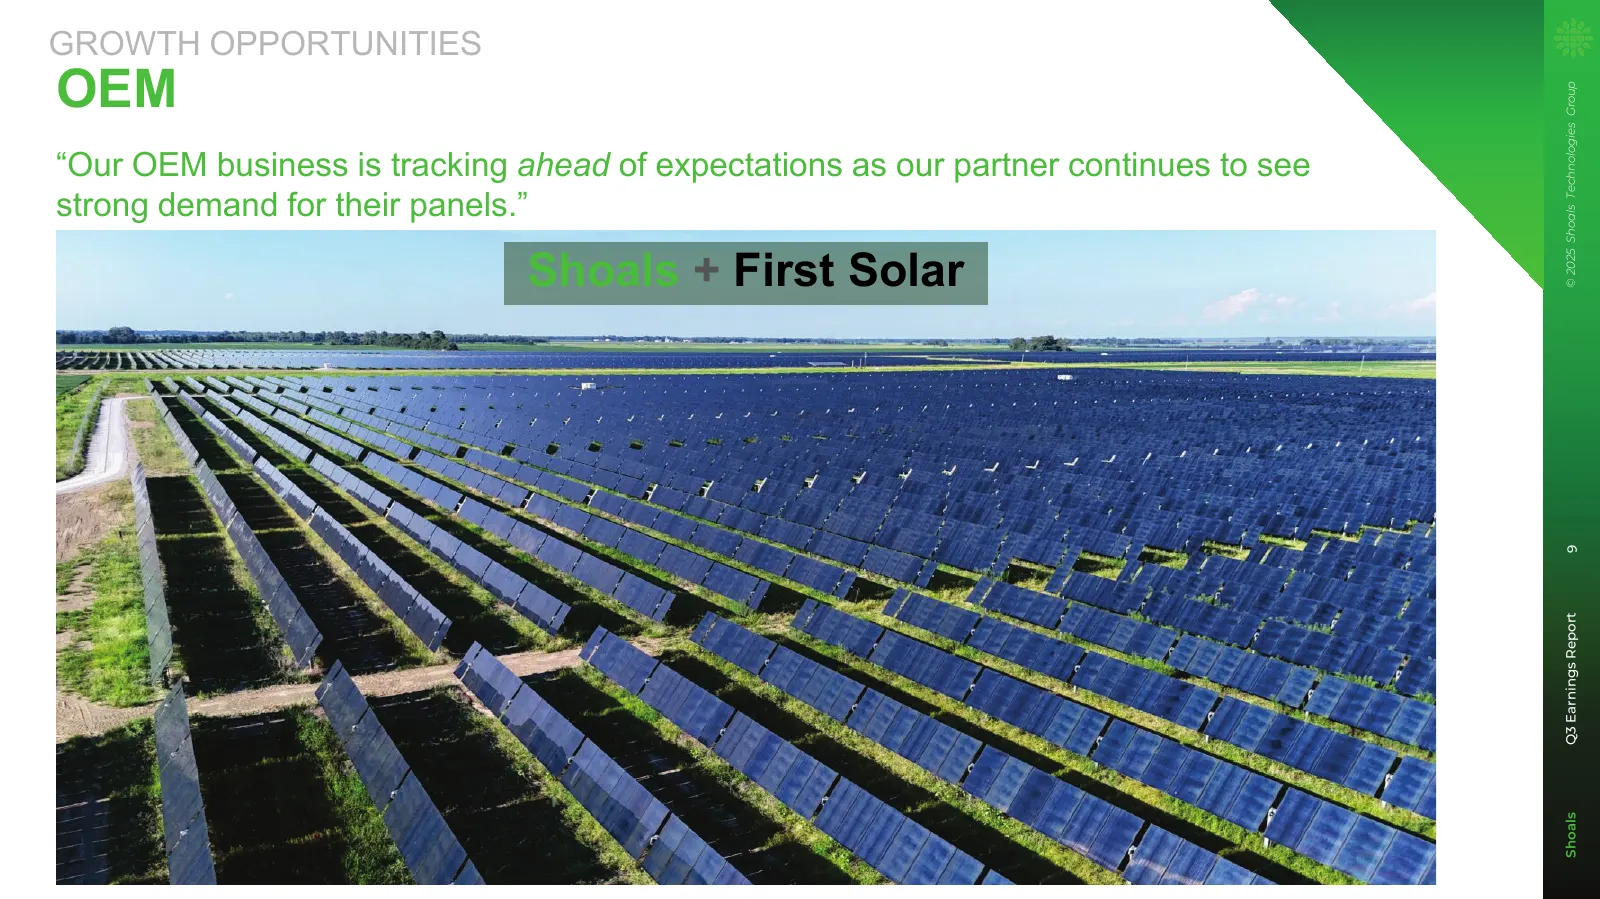
GROWTH OPPORTUNITIES OEM © 2025 Shoals Technologies Group “Our OEM business is tracking ahead of expectations as our partner continues to see strong demand for their panels.” Shoals + First Solar 9 9 Q3 Earnings Report Shoals
Slide 10: Growth Opportunities: BESS
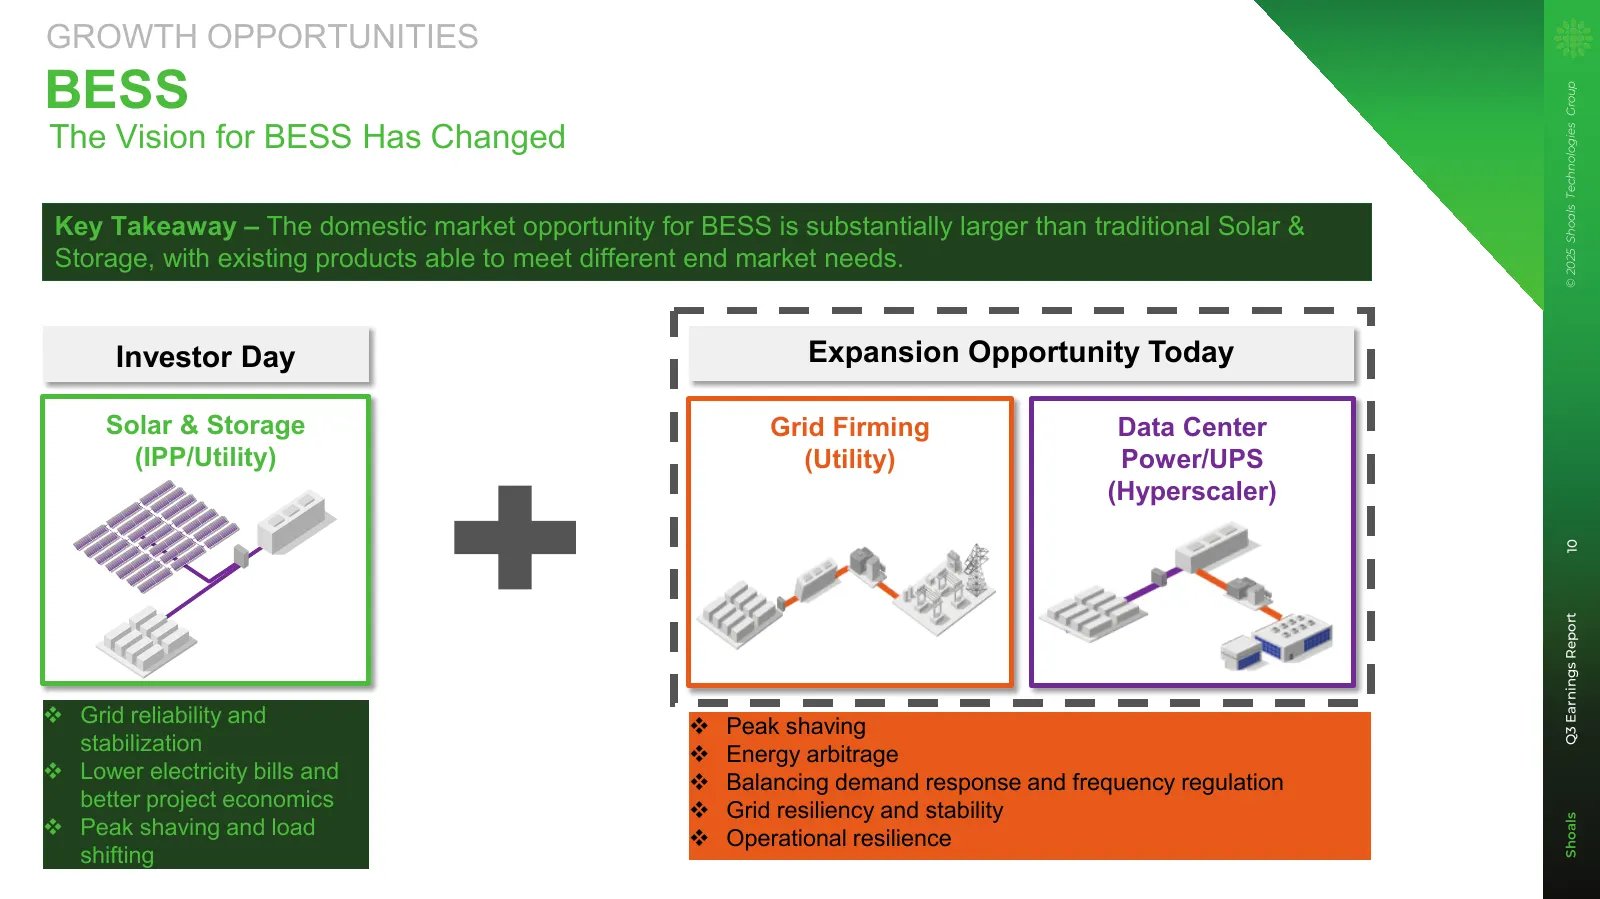
GROWTH OPPORTUNITIES BESS © 2025 Shoals Technologies Group The Vision for BESS Has Changed Key Takeaway – The domestic market opportunity for BESS is substantially larger than traditional Solar & Storage, with existing products able to meet different end market needs. Investor Day Expansion Opportun
Slide 11: Third Quarter Financial Snapshot
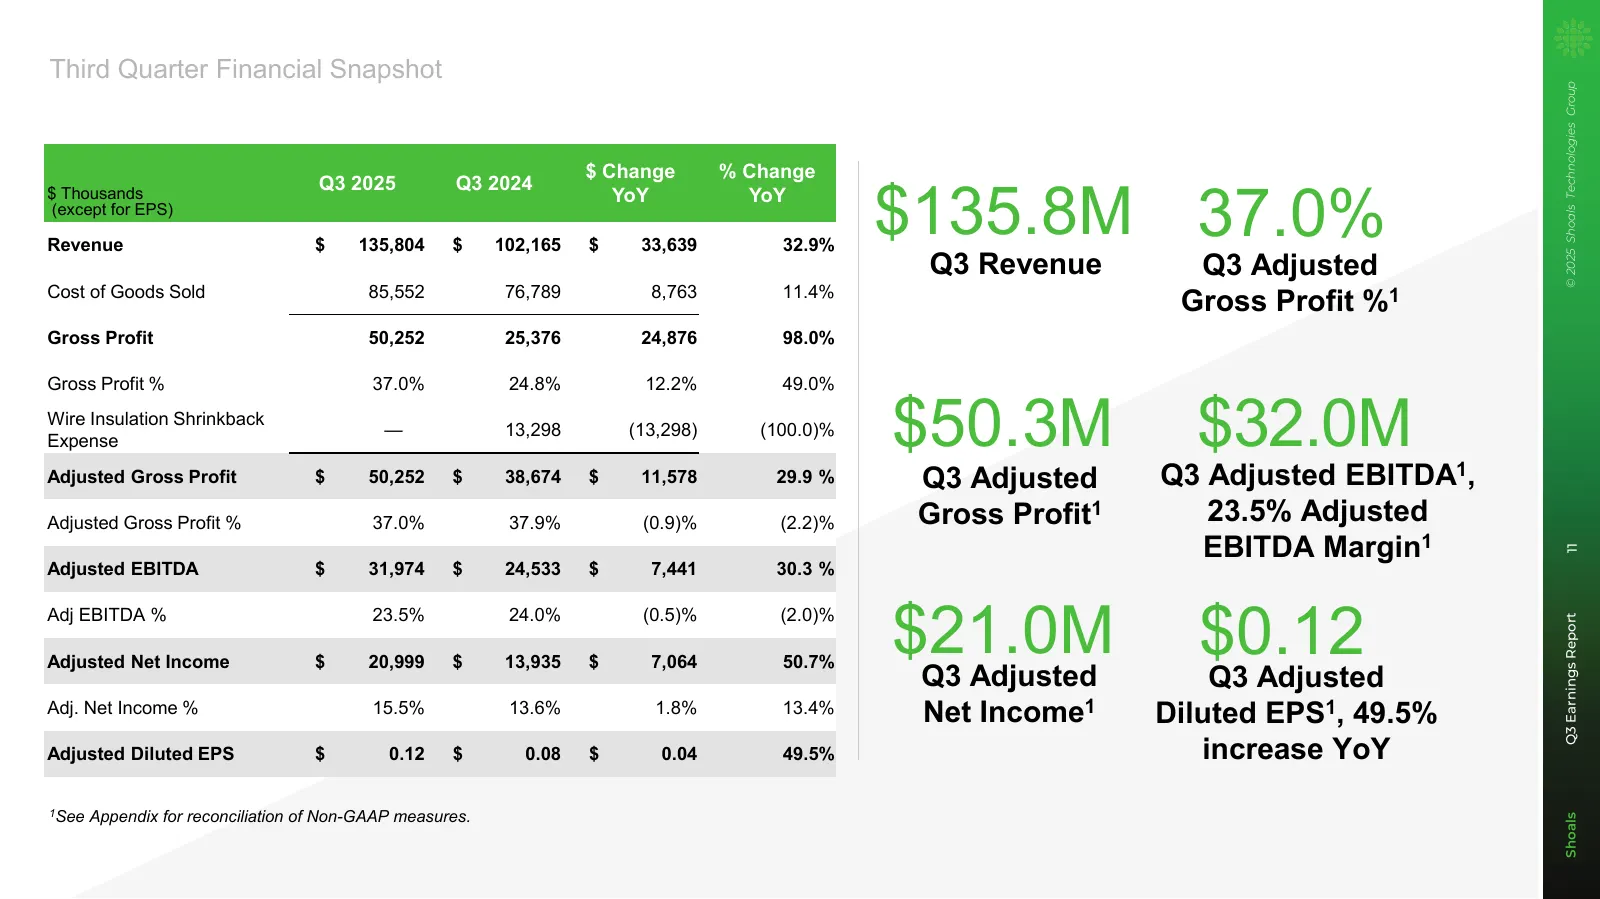
Third Quarter Financial Snapshot © 2025 Shoals Technologies Group $ Change % Change $135.8M 37.0% Q3 2025 Q3 2024 $ Thousands YoY YoY (except for EPS) Revenue $ 135,804 $ 102,165 $ 33,639 32.9% Q3 Revenue Q3 Adjusted Cost of Goods Sold 85,552 76,789 8,763 11.4% Gross Profit %1 Gross Profit 50,252 25
Slide 12: Cash Flow
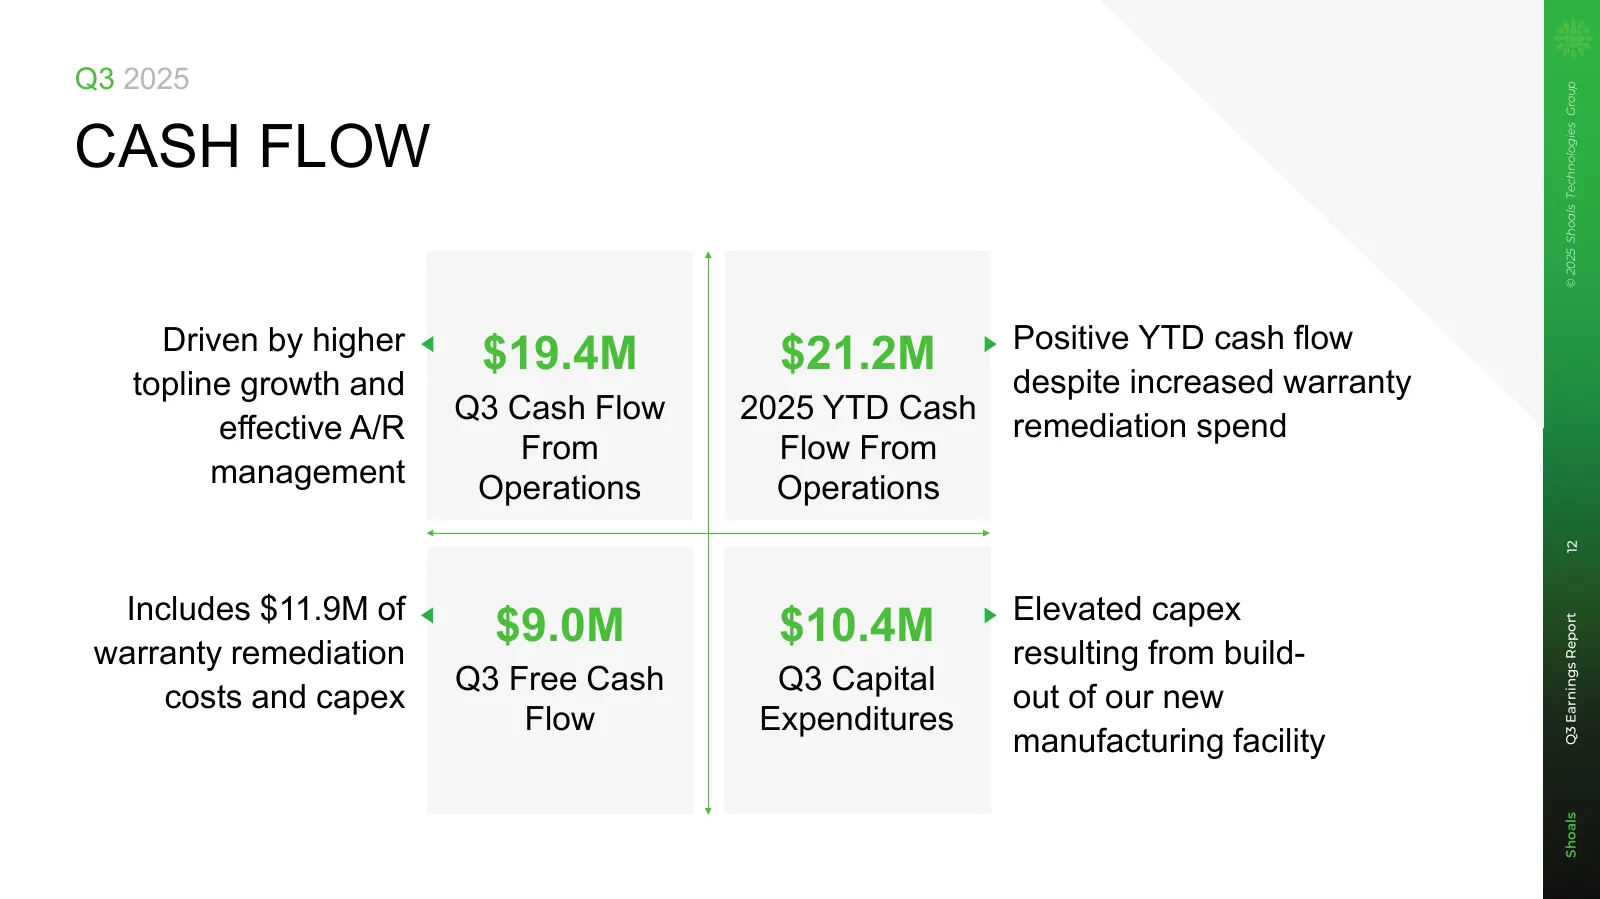
Q3 2025 © 2025 Shoals Technologies Group CASH FLOW Driven by higher Positive YTD cash flow $19.4M $21.2M topline growth and despite increased warranty Q3 Cash Flow 2025 YTD Cash effective A/R remediation spend From Flow From management Operations Operations 12 12 Includes $11.9M of Elevated capex $9
Slide 13: Debt & Liquidity
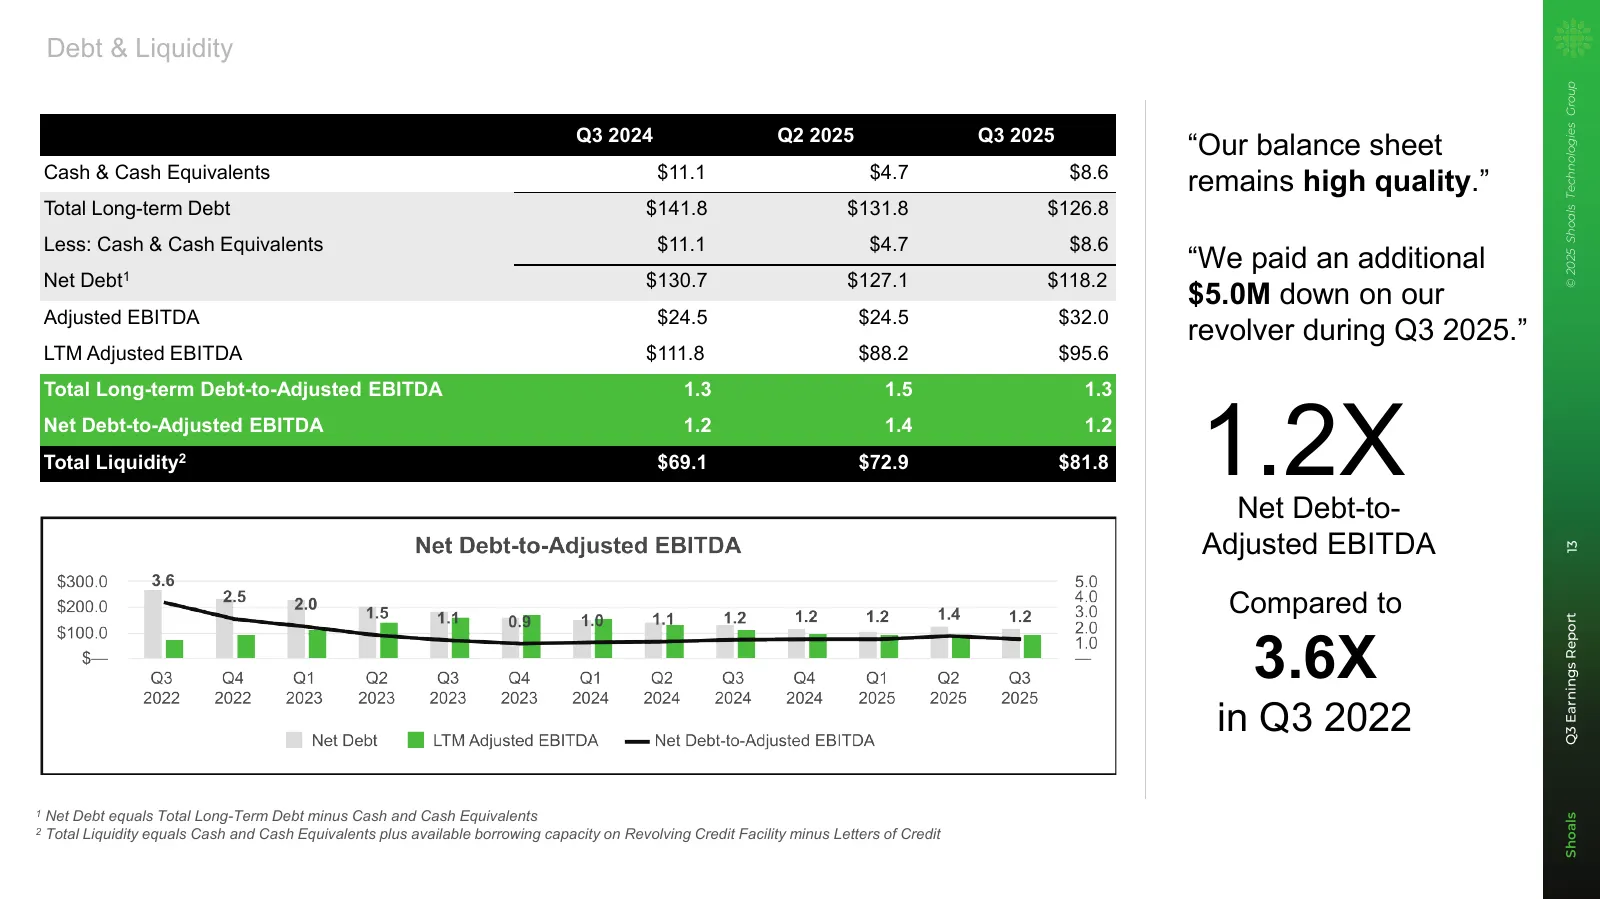
Debt & Liquidity © 2025 Shoals Technologies Group Q3 2024 Q2 2025 Q3 2025 “Our balance sheet Cash & Cash Equivalents $11.1 $4.7 $8.6 remains high quality.” Total Long-term Debt $141.8 $131.8 $126.8 Less: Cash & Cash Equivalents $11.1 $4.7 $8.6 “We paid an additional Net Debt1 $130.7 $127.1 $118.2 $5
Slide 14: Backlog & Awarded Orders
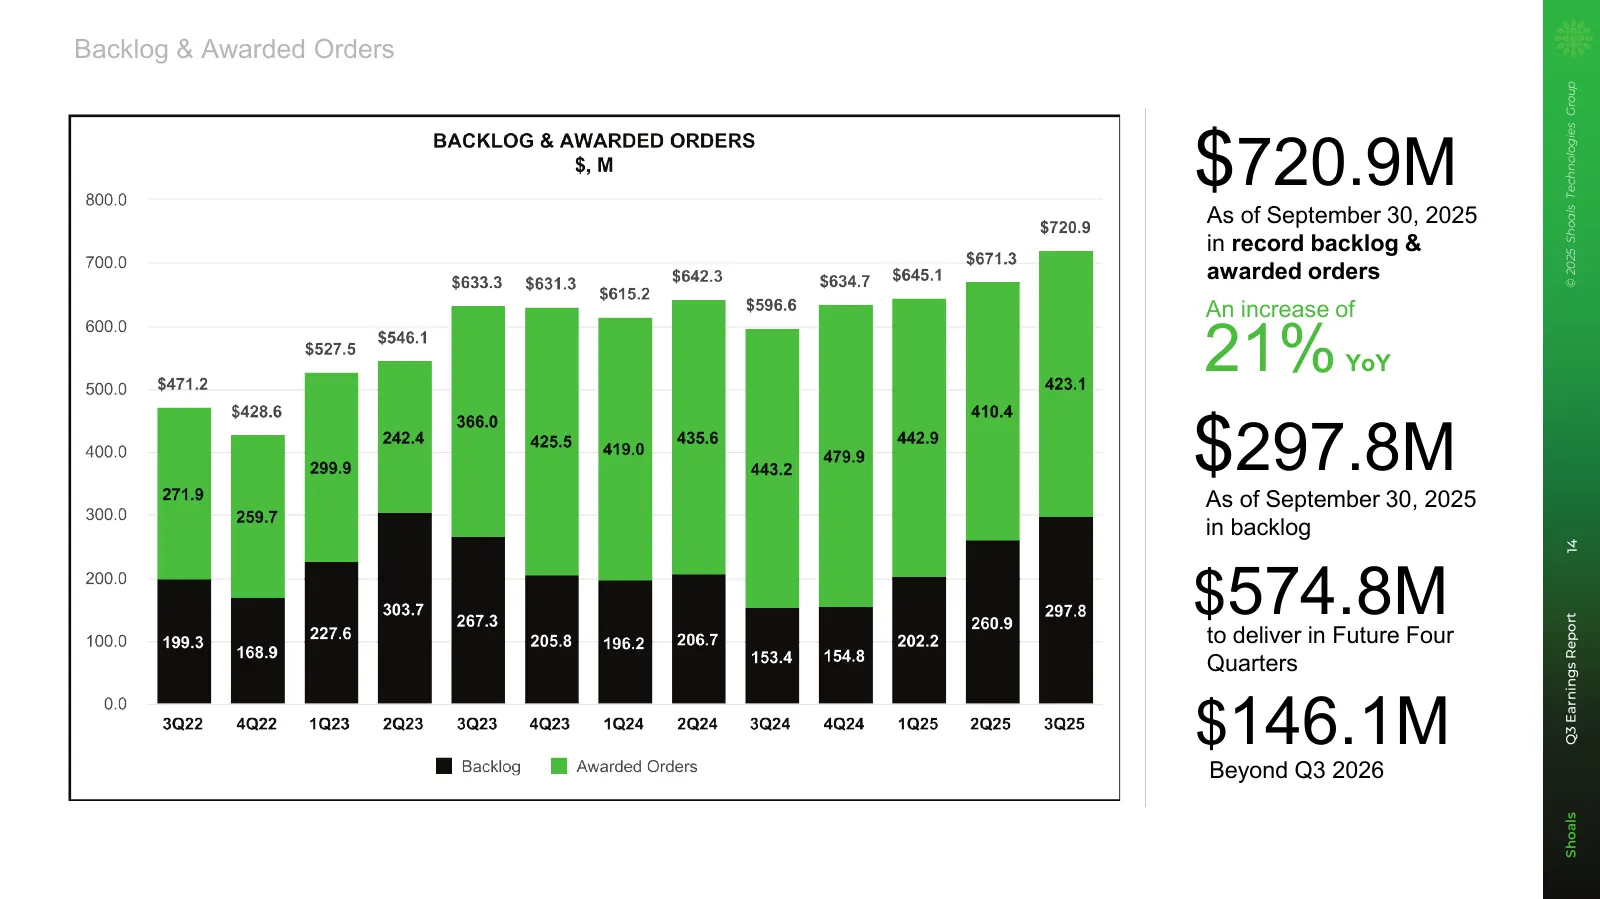
Backlog & Awarded Orders © 2025 Shoals Technologies Group $720.9M As of September 30, 2025 in record backlog & awarded orders An increase of 21% YoY $297.8M As of September 30, 2025 in backlog 14 14 $574.8M Q3 Earnings Report to deliver in Future Four Quarters $146.1M Beyond Q3 2026 Shoals
Slide 15: Financial Outlook
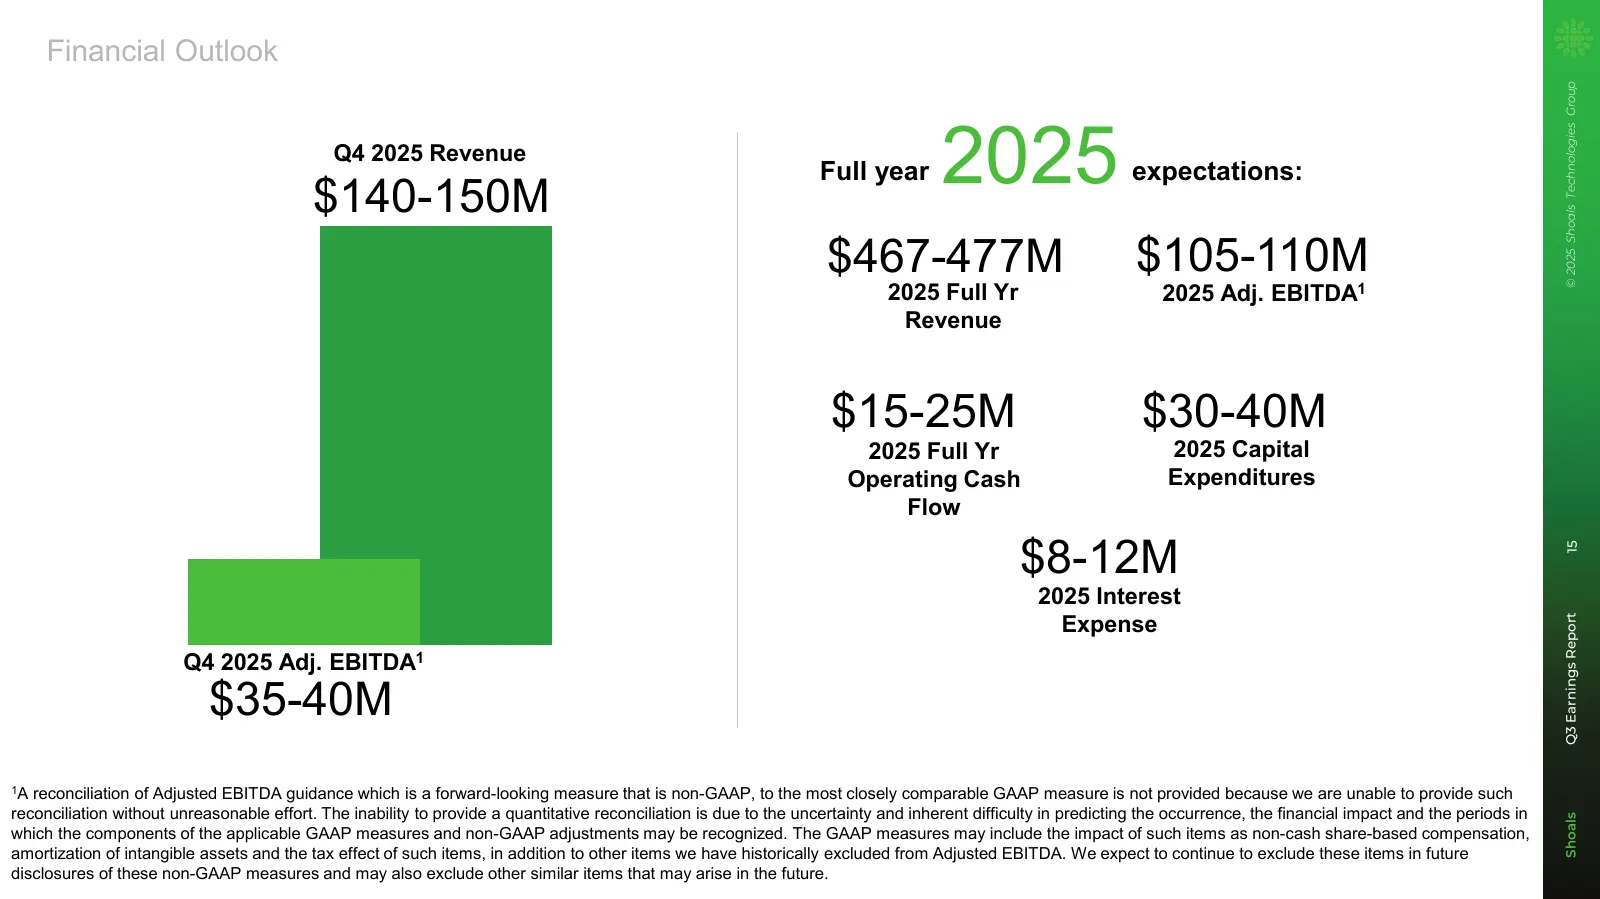
Financial Outlook © 2025 Shoals Technologies Group Q4 2025 Revenue $140-150M Full year 2025 expectations: $467-477M $105-110M 2025 Full Yr 2025 Adj. EBITDA1 Revenue $15-25M $30-40M 2025 Full Yr 2025 Capital Operating Cash Expenditures Flow $8-12M 15 15 2025 Interest Expense Q3 Earnings Report Q4 202

Slide 16: Closing Thoughts
Closing Thoughts © 2025 Shoals Technologies Group “We are building the next Business strategy initiatives taking hold at Shoals: version of Shoals – one that + Commercial and operational process improvements, and will deliver attractive returns shifts in strategic direction and focus, are enabling e

Slide 17: © 2025 Shoals Technologies Group
Shoals Q3 Earnings Report 17 © 2025 Shoals Technologies Group 17
Slide 18: Appendix
Appendix Shoals Q3 Earnings Report 18 © 2025 Shoals Technologies Group 18
Slide 19: Non-GAAP Reconciliations, Adjusted Gross Profit
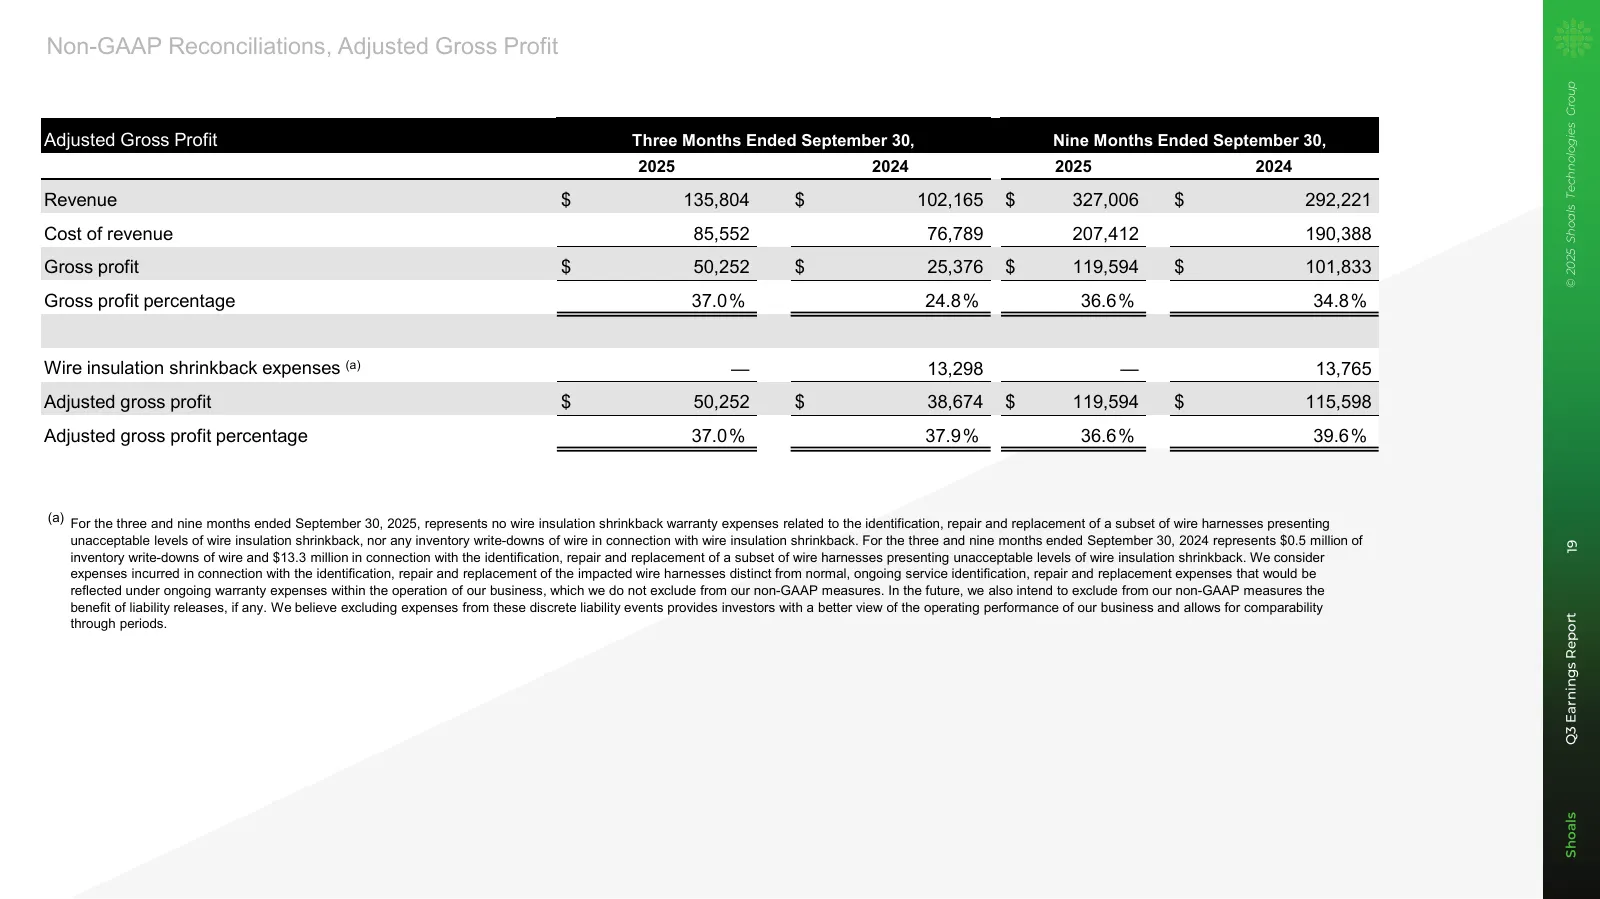
Non-GAAP Reconciliations, Adjusted Gross Profit © 2025 Shoals Technologies Group Adjusted Gross Profit Three Months Ended September 30, Nine Months Ended September 30, 2025 2024 2025 2024 Revenue $ 135,804 $ 102,165 $ 327,006 $ 292,221 Cost of revenue 85,552 76,789 207,412 190,388 Gross profit $ 50,
Slide 20: Non-GAAP Reconciliations, Adjusted EBITDA
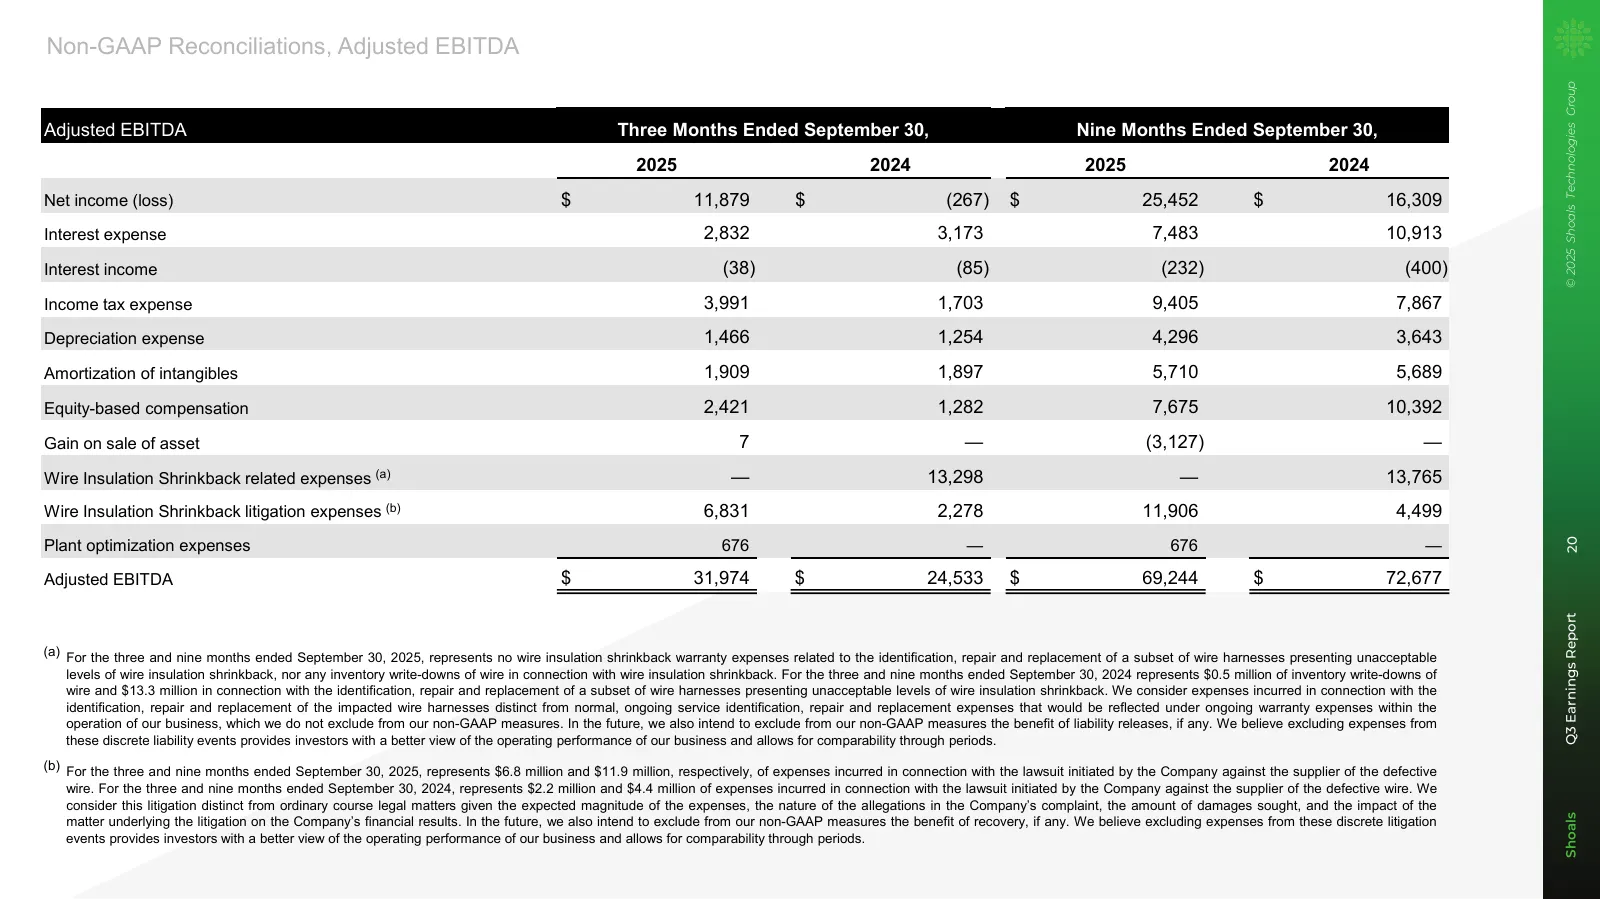
Non-GAAP Reconciliations, Adjusted EBITDA © 2025 Shoals Technologies Group Adjusted EBITDA Three Months Ended September 30, Nine Months Ended September 30, 2025 2024 2025 2024 Net income (loss) $ 11,879 $ (267) $ 25,452 $ 16,309 Interest expense 2,832 3,173 7,483 10,913 Interest income (38) (85) (23
Slide 21: Non-GAAP Reconciliations, Adjusted Net Income
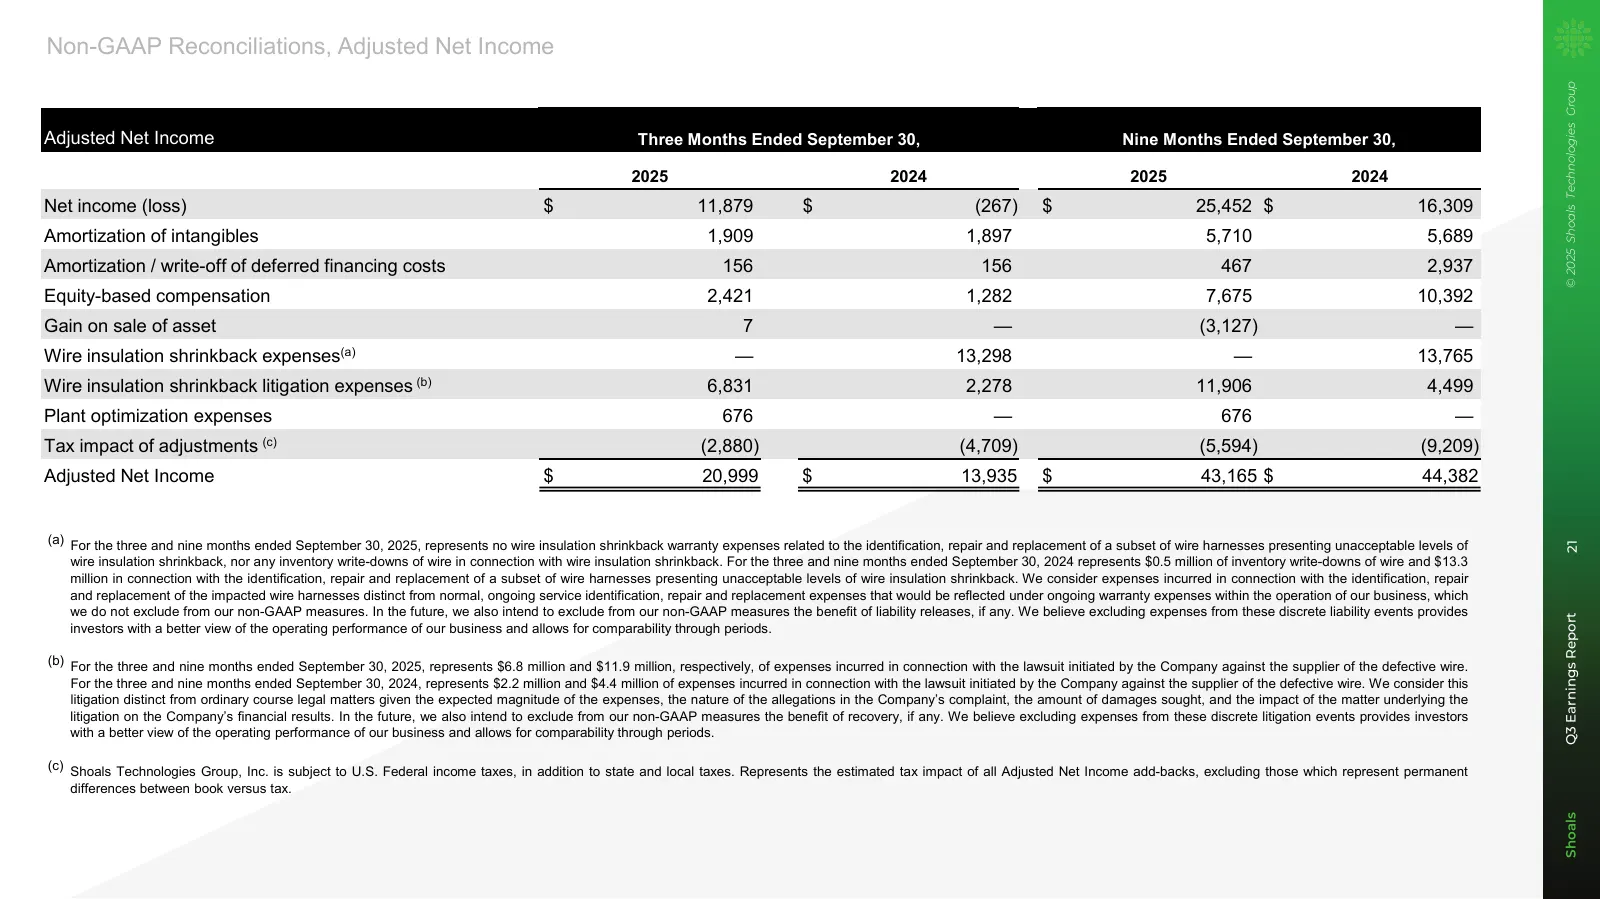
Non-GAAP Reconciliations, Adjusted Net Income © 2025 Shoals Technologies Group Adjusted Net Income Three Months Ended September 30, Nine Months Ended September 30, 2025 2024 2025 2024 Net income (loss) $ 11,879 $ (267) $ 25,452 $ 16,309 Amortization of intangibles 1,909 1,897 5,710 5,689 Amortizatio
Slide 22: Non-GAAP Reconciliations, Adjusted Diluted EPS
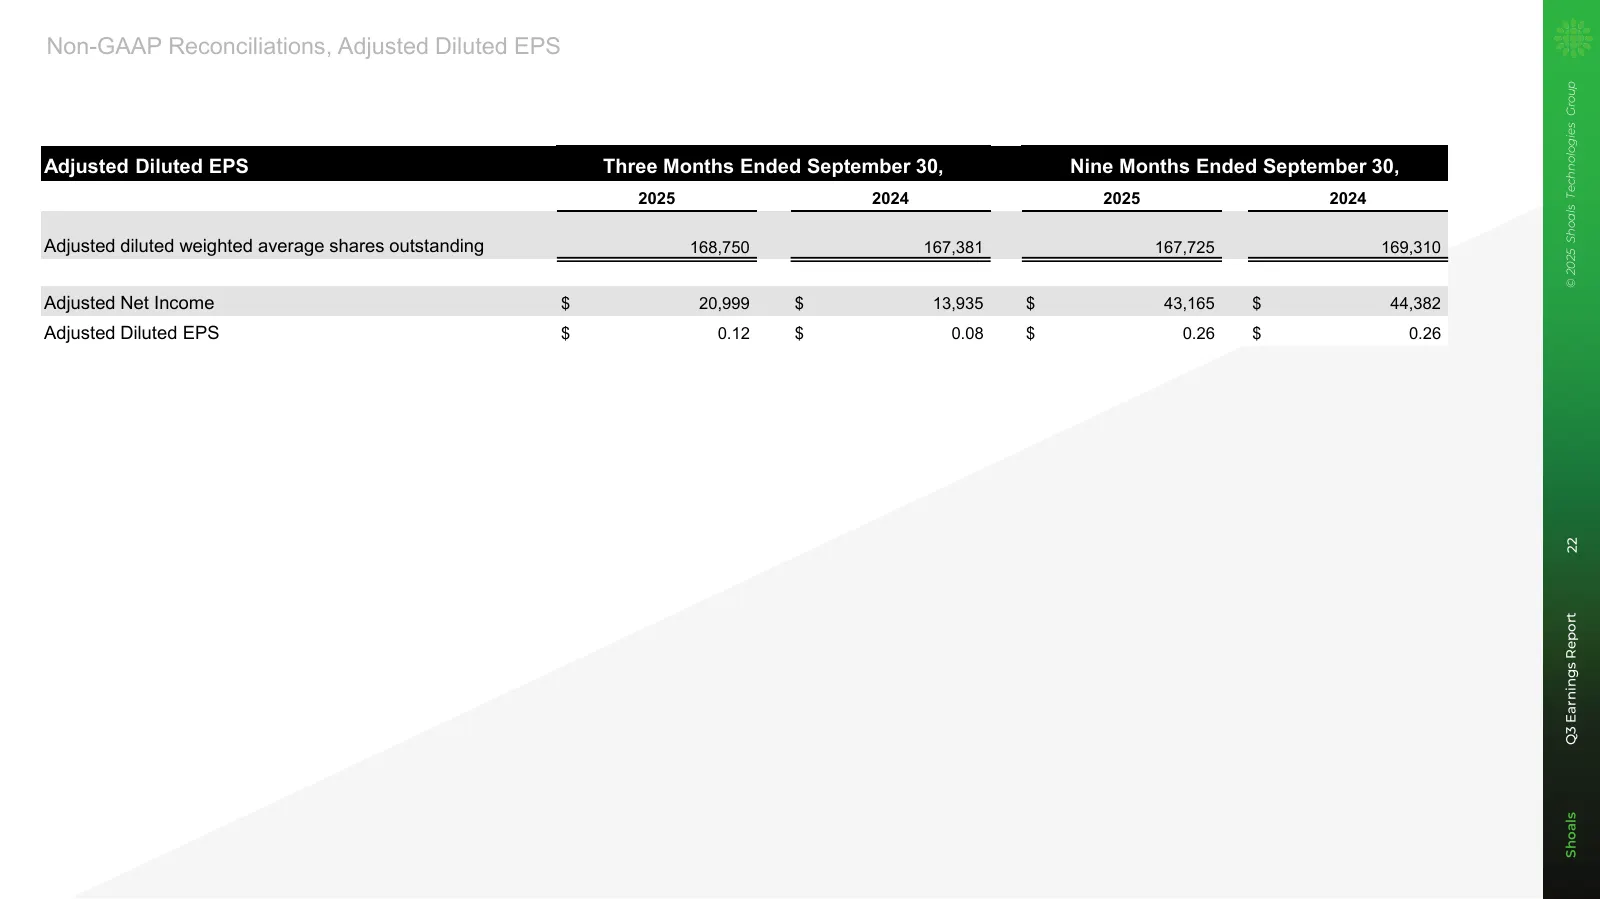
Non-GAAP Reconciliations, Adjusted Diluted EPS © 2025 Shoals Technologies Group Adjusted Diluted EPS Three Months Ended September 30, Nine Months Ended September 30, 2025 2024 2025 2024 Adjusted diluted weighted average shares outstanding 168,750 167,381 167,725 169,310 Adjusted Net Income $ 20,999
Slide 23: Thank You!
© 2025 Shoals Technologies Group 23 23 Q3 Earnings Report THANK YOU! Please reach out to investors@shoals.com with any further questions. Shoals
Source: Internet Archive copy of s27.q4cdn.com
More decks from Shoals Technologies Group, Inc.
 Merger or Acquisition (November 2026)29 slides · Nov 4, 2026
 Q3 2026 Earnings Presentation14 slides · November 2026
 Q2 2026 Earnings Presentation15 slides · Aug 4, 2026
 Q1 2026 Earnings Presentation15 slides · May 5, 2026
 Q4 2025 Earnings Presentation20 slides · Feb 24, 2026
 Q2 2025 Earnings Presentation21 slides · Aug 5, 2025