Great Western Bancorp — Q1 FY2020 Earnings Presentation
17 slides from Great Western Bancorp's earnings presentation, Jan 28, 2020
Slide 1: Earnings Release | December 31, 2019
Earnings Release | December 31, 2019
Slide 2: About GWB: Company Snapshot
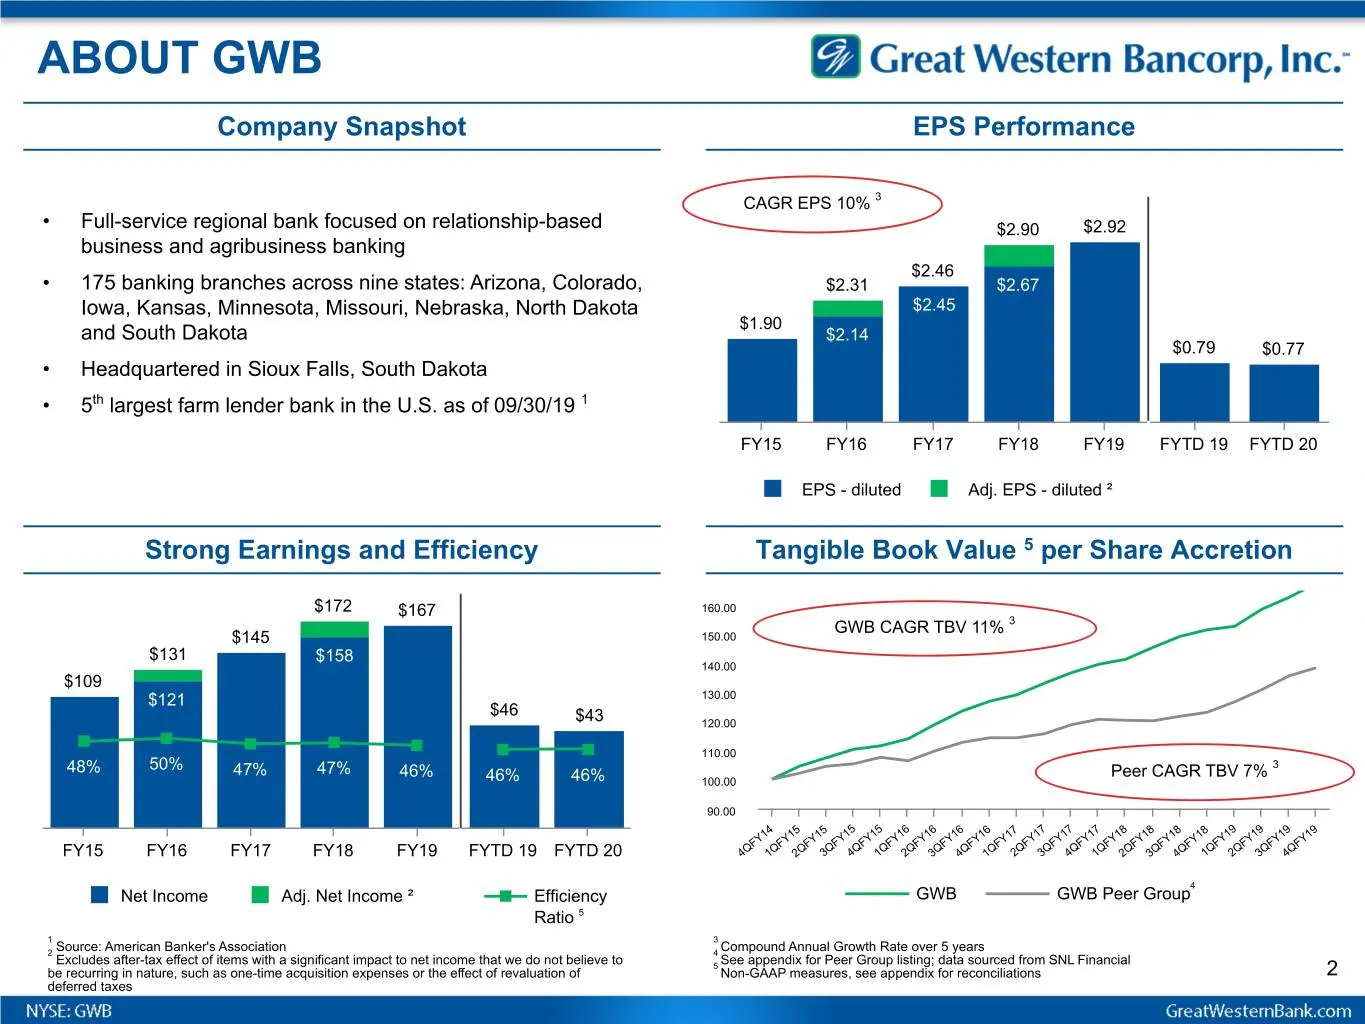
ABOUT GWB Company Snapshot EPS Performance CAGR EPS 10% 3 • Full-service regional bank focused on relationship-based $2.90 $2.92 business and agribusiness banking $2.46 • 175 banking branches across nine states: Arizona, Colorado, $2.31 $2.67 Iowa, Kansas, Minnesota, Missouri, Nebraska, North Dakota
Slide 3: Executing on Strategy
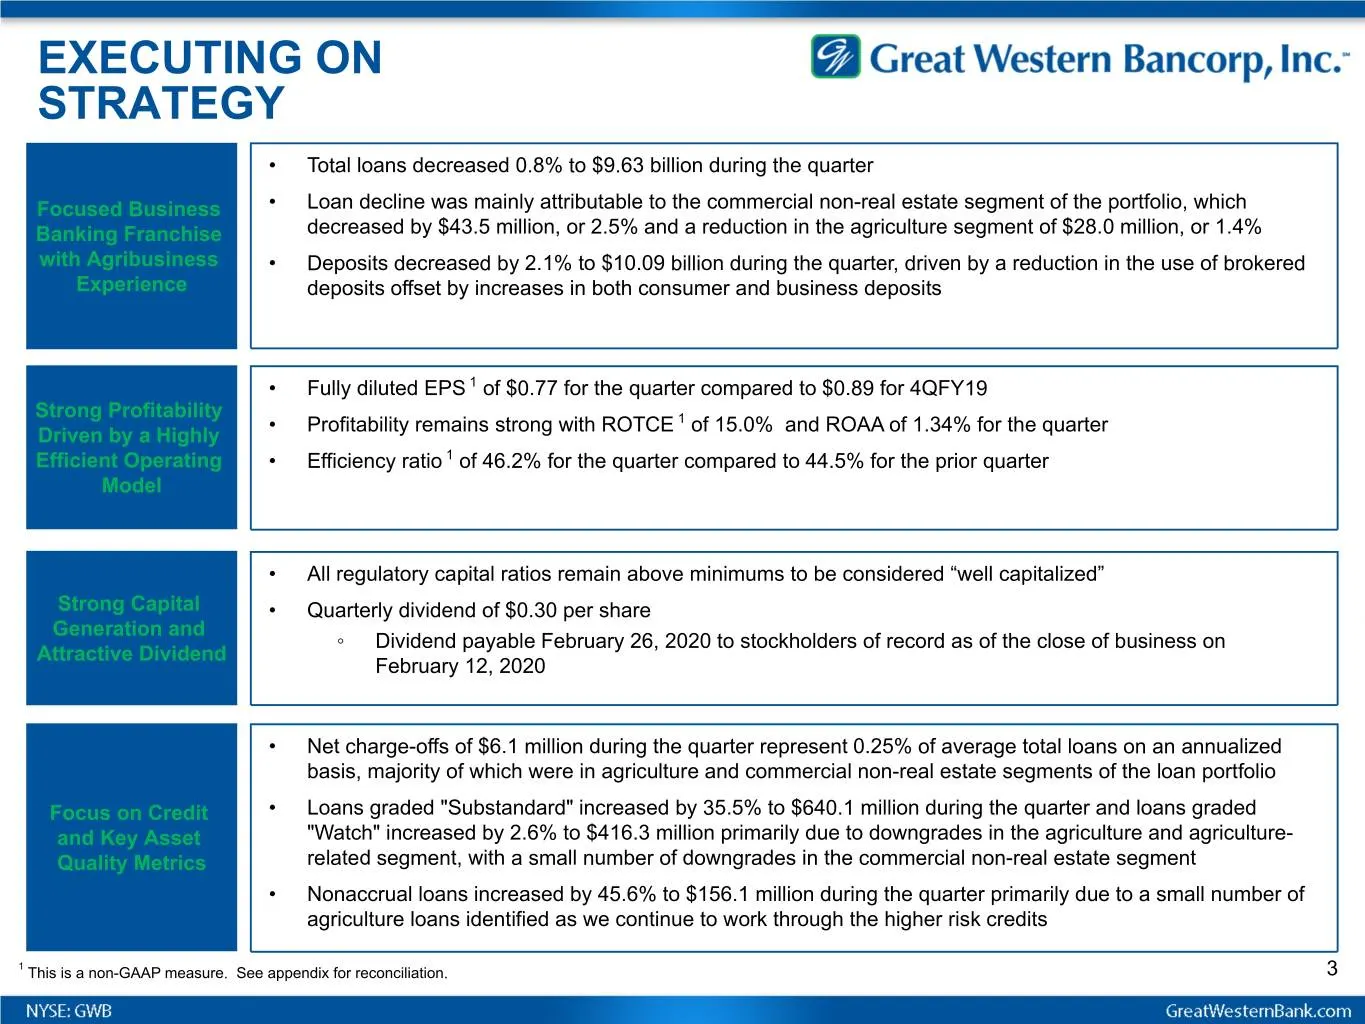
EXECUTING ON STRATEGY • Total loans decreased 0.8% to $9.63 billion during the quarter Focused Business • Loan decline was mainly attributable to the commercial non-real estate segment of the portfolio, which Banking Franchise decreased by $43.5 million, or 2.5% and a reduction in the agriculture se
Slide 4: Revenue
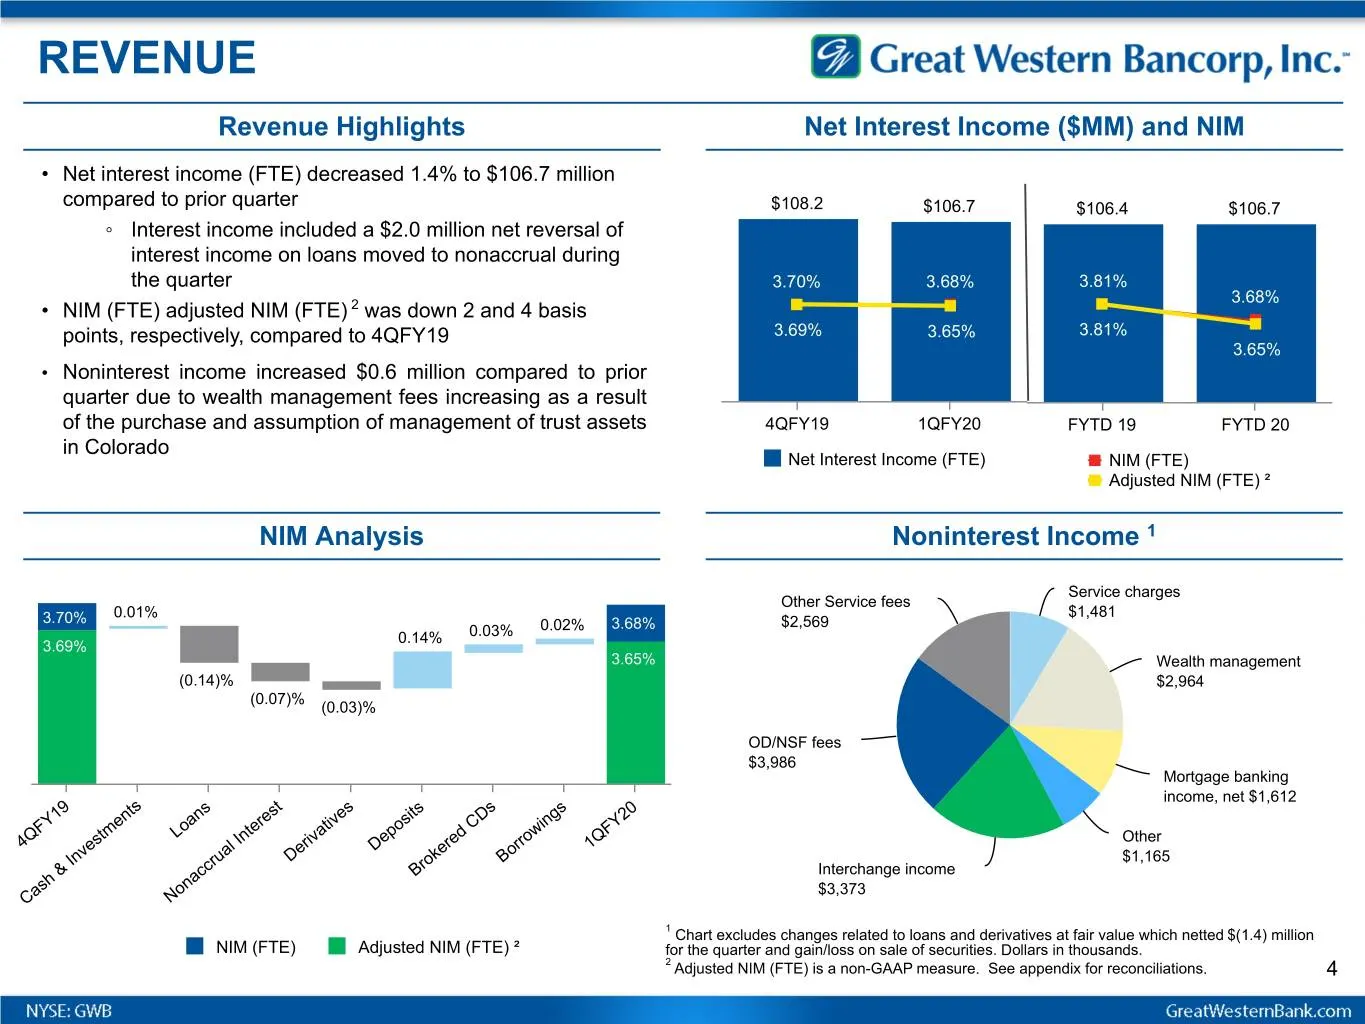
REVENUE Revenue Highlights Net Interest Income ($MM) and NIM • Net interest income (FTE) decreased 1.4% to $106.7 million compared to prior quarter $108.2 $106.7 $106.4 $106.7 ◦ Interest income included a $2.0 million net reversal of interest income on loans moved to nonaccrual during the quarter 3.
Slide 5: Earnings, Expenses & Provision
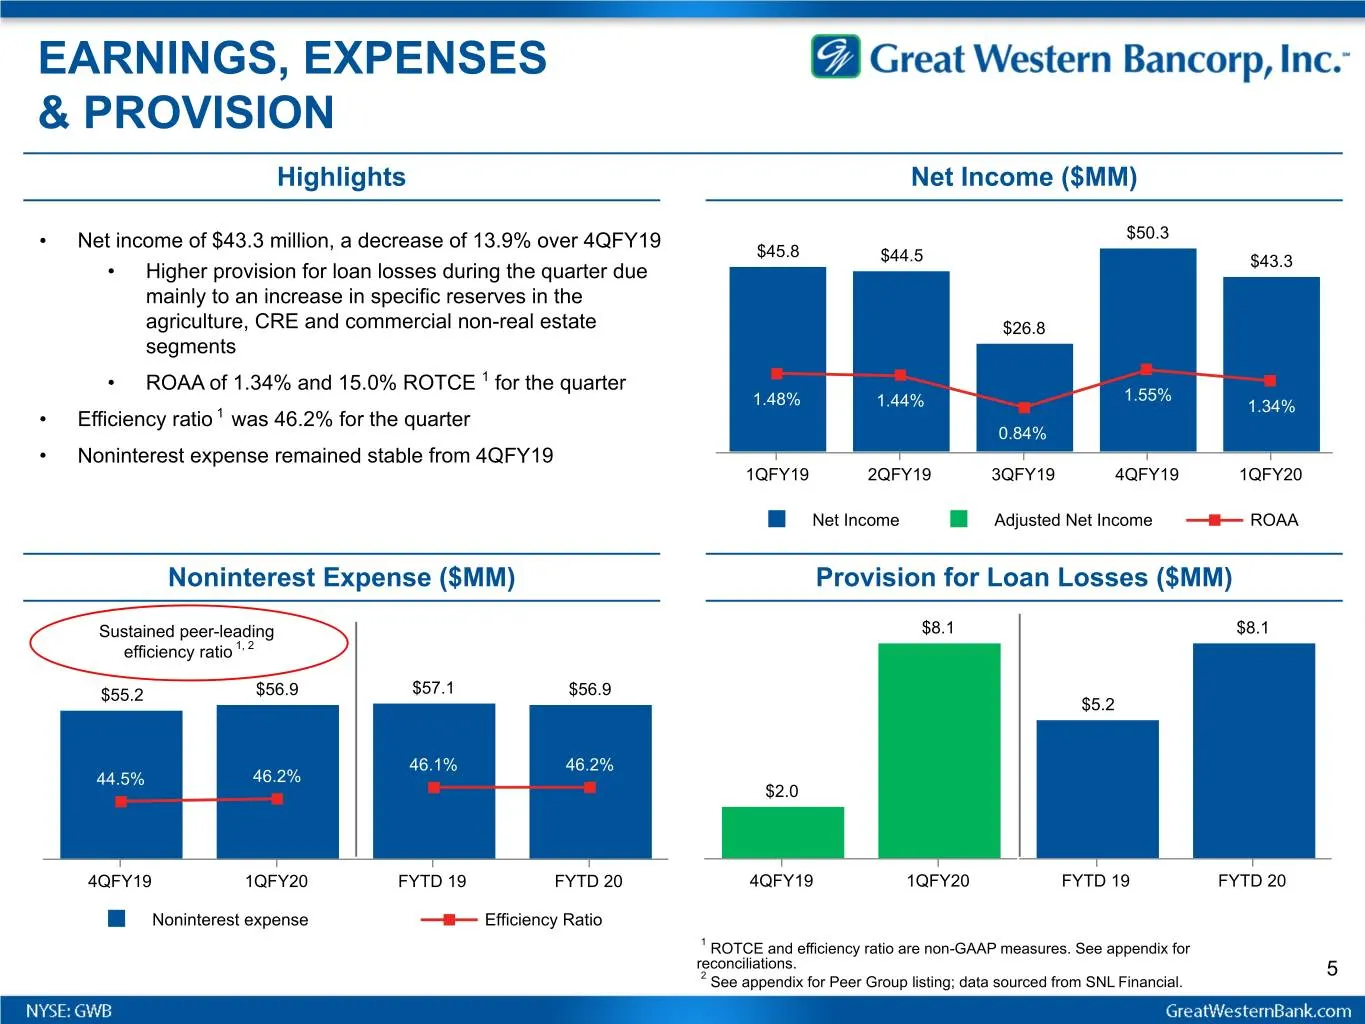
EARNINGS, EXPENSES & PROVISION Highlights Net Income ($MM) • Net income of $43.3 million, a decrease of 13.9% over 4QFY19 $50.3 $45.8 $44.5 • Higher provision for loan losses during the quarter due $43.3 mainly to an increase in specific reserves in the agriculture, CRE and commercial non-real estat
Slide 6: Balance Sheet Overview
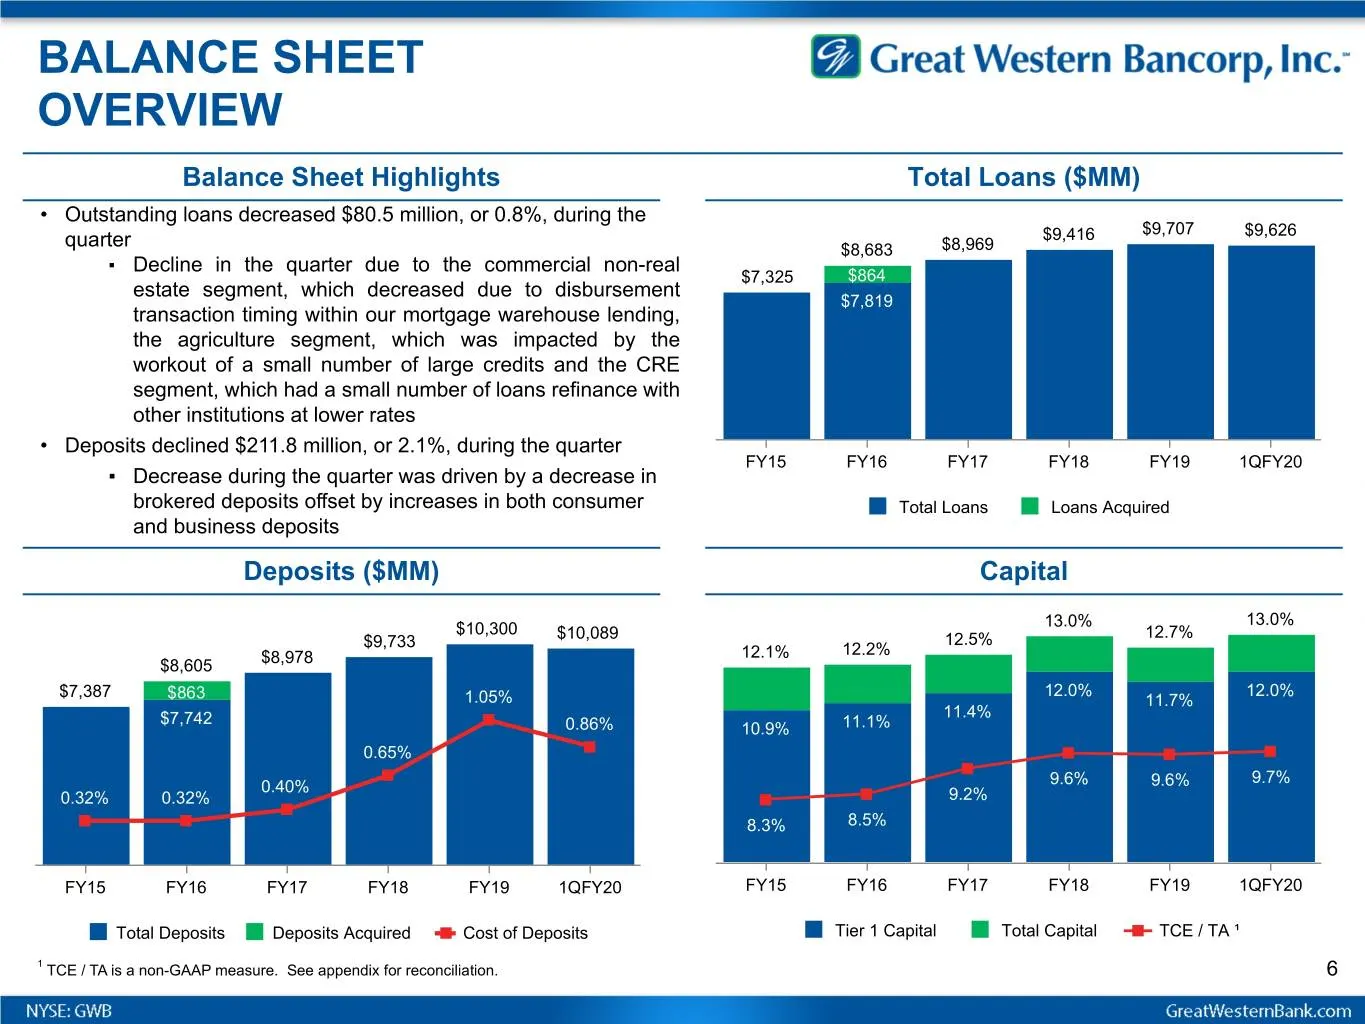
BALANCE SHEET OVERVIEW Balance Sheet Highlights Total Loans ($MM) • Outstanding loans decreased $80.5 million, or 0.8%, during the $9,416 $9,707 $9,626 quarter $8,683 $8,969 ▪ Decline in the quarter due to the commercial non-real $7,325 $864 estate segment, which decreased due to disbursement $7,819
Slide 7: Asset Quality
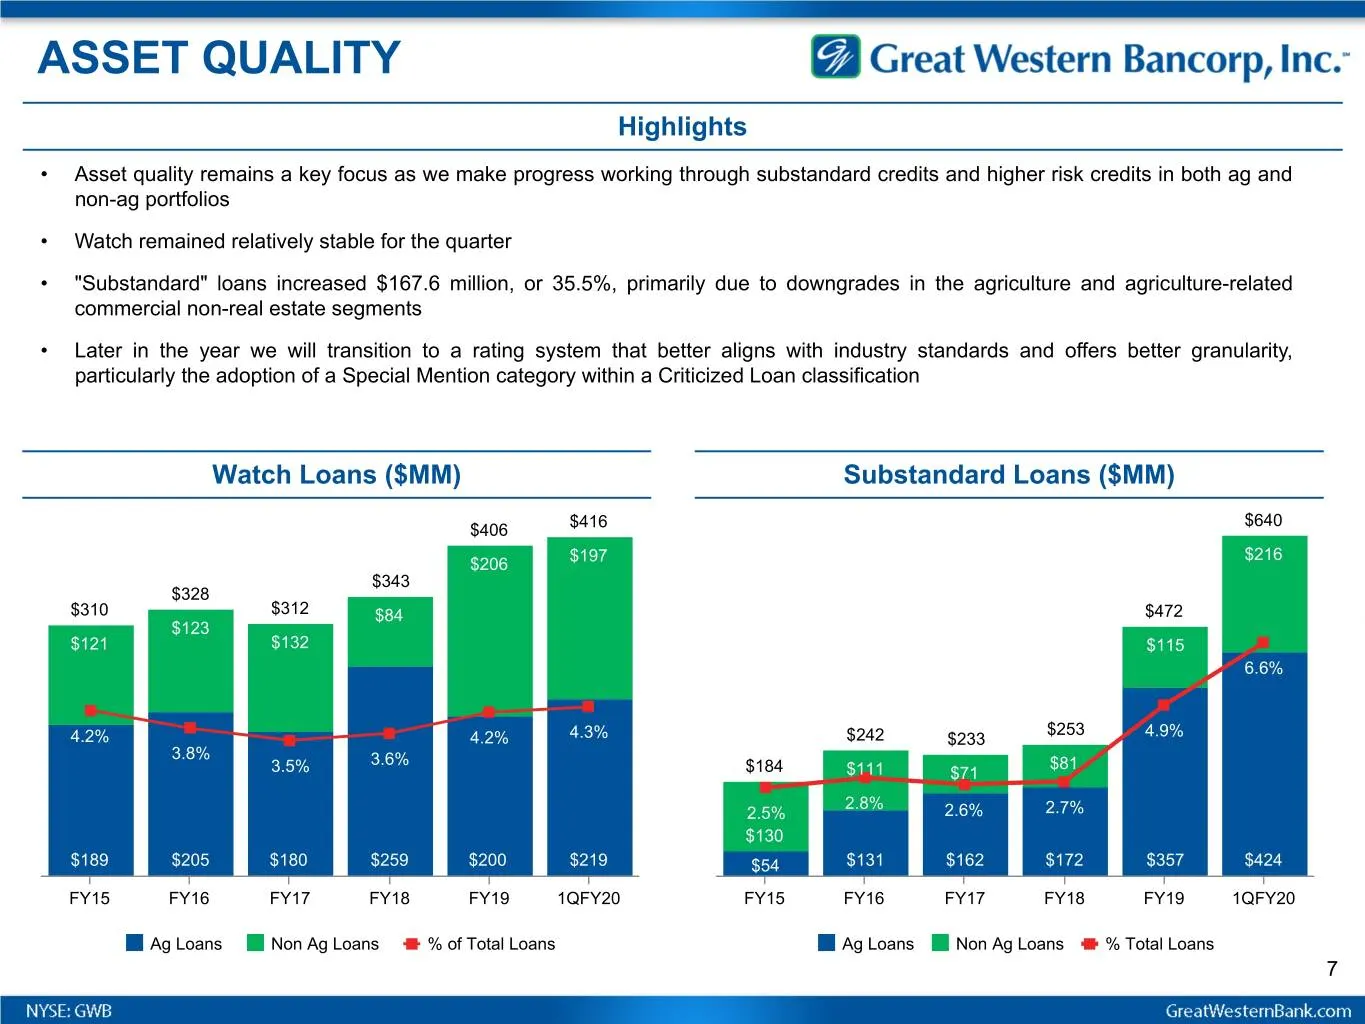
ASSET QUALITY Highlights • Asset quality remains a key focus as we make progress working through substandard credits and higher risk credits in both ag and non-ag portfolios • Watch remained relatively stable for the quarter • "Substandard" loans increased $167.6 million, or 35.5%, primarily due to
Slide 8: Asset Quality
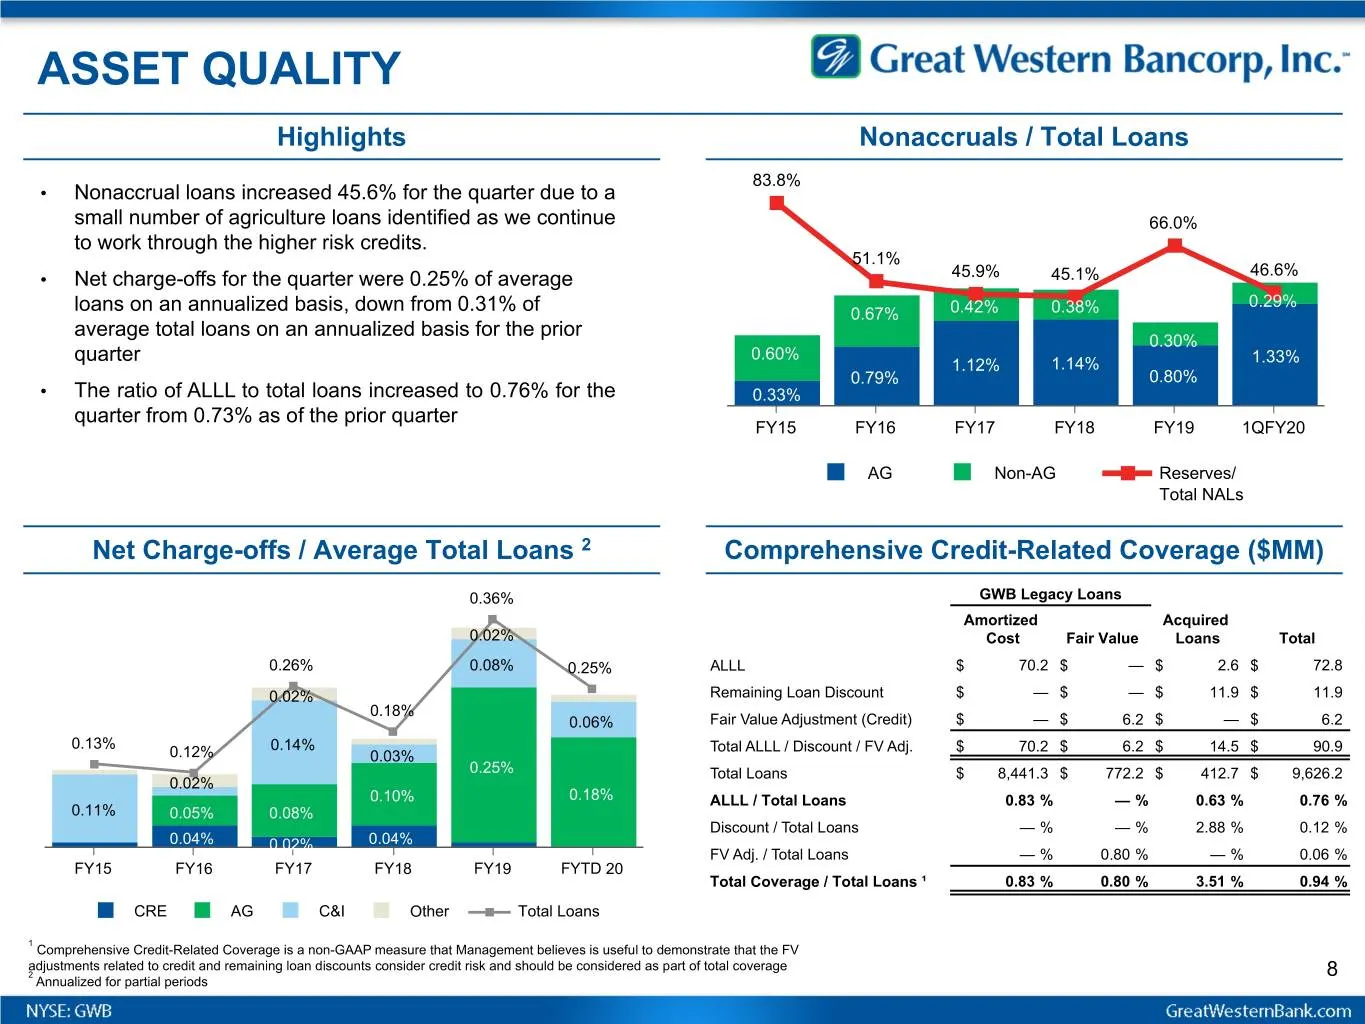
ASSET QUALITY Highlights Nonaccruals / Total Loans 83.8% • Nonaccrual loans increased 45.6% for the quarter due to a small number of agriculture loans identified as we continue 66.0% to work through the higher risk credits. 51.1% 46.6% • Net charge-offs for the quarter were 0.25% of average 45.9% 45
Slide 9: Ag Loan Asset Quality
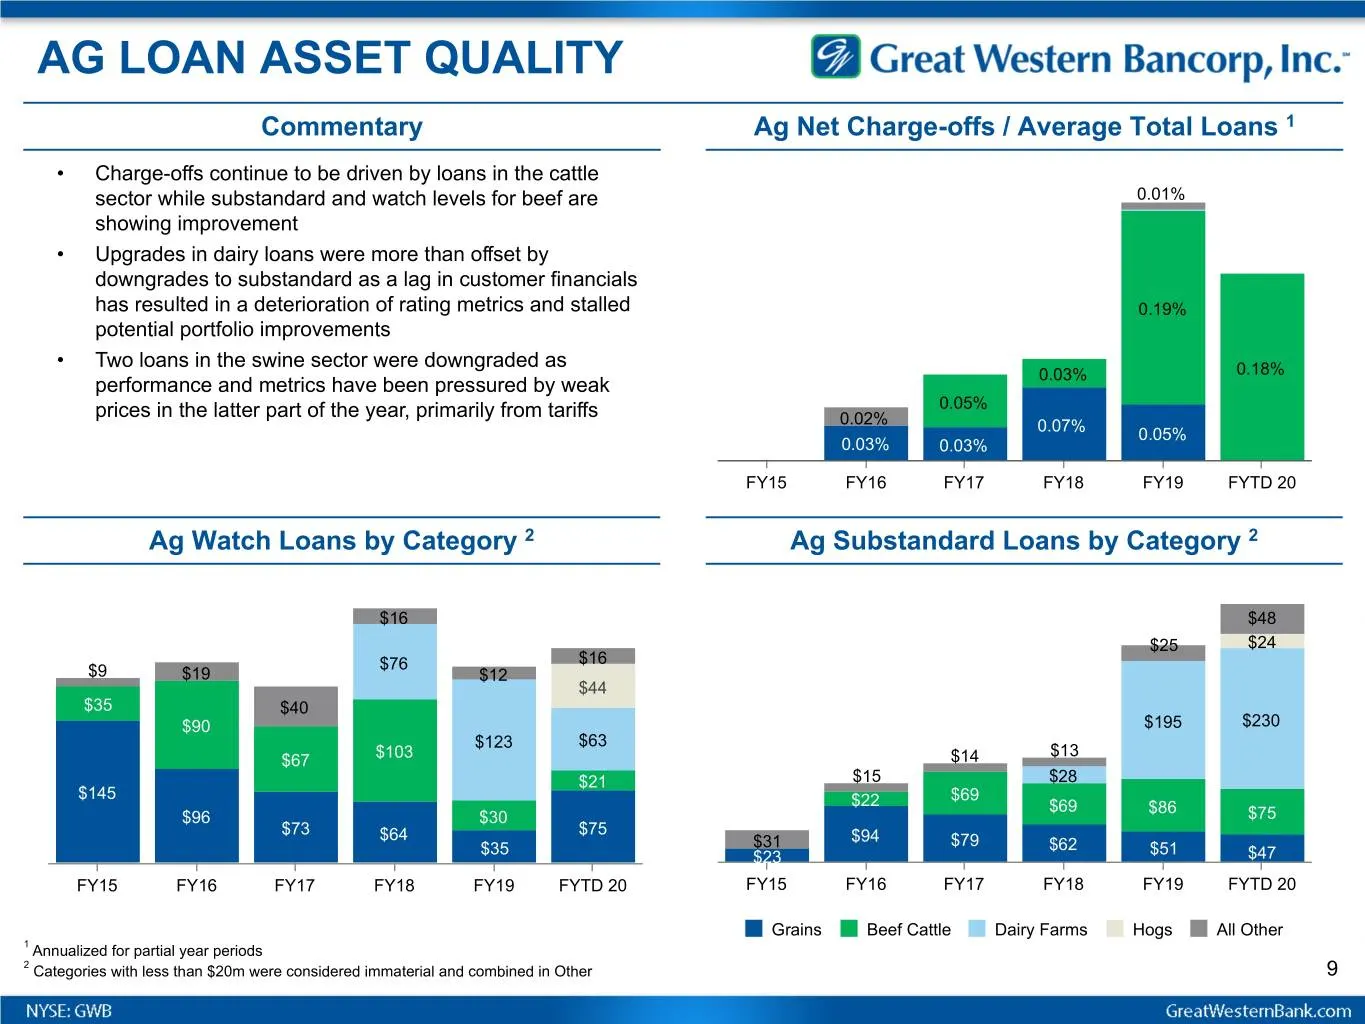
AG LOAN ASSET QUALITY Commentary Ag Net Charge-offs / Average Total Loans 1 • Charge-offs continue to be driven by loans in the cattle sector while substandard and watch levels for beef are 0.01% showing improvement • Upgrades in dairy loans were more than offset by downgrades to substandard as a la
Slide 10: Proven Business Strategy
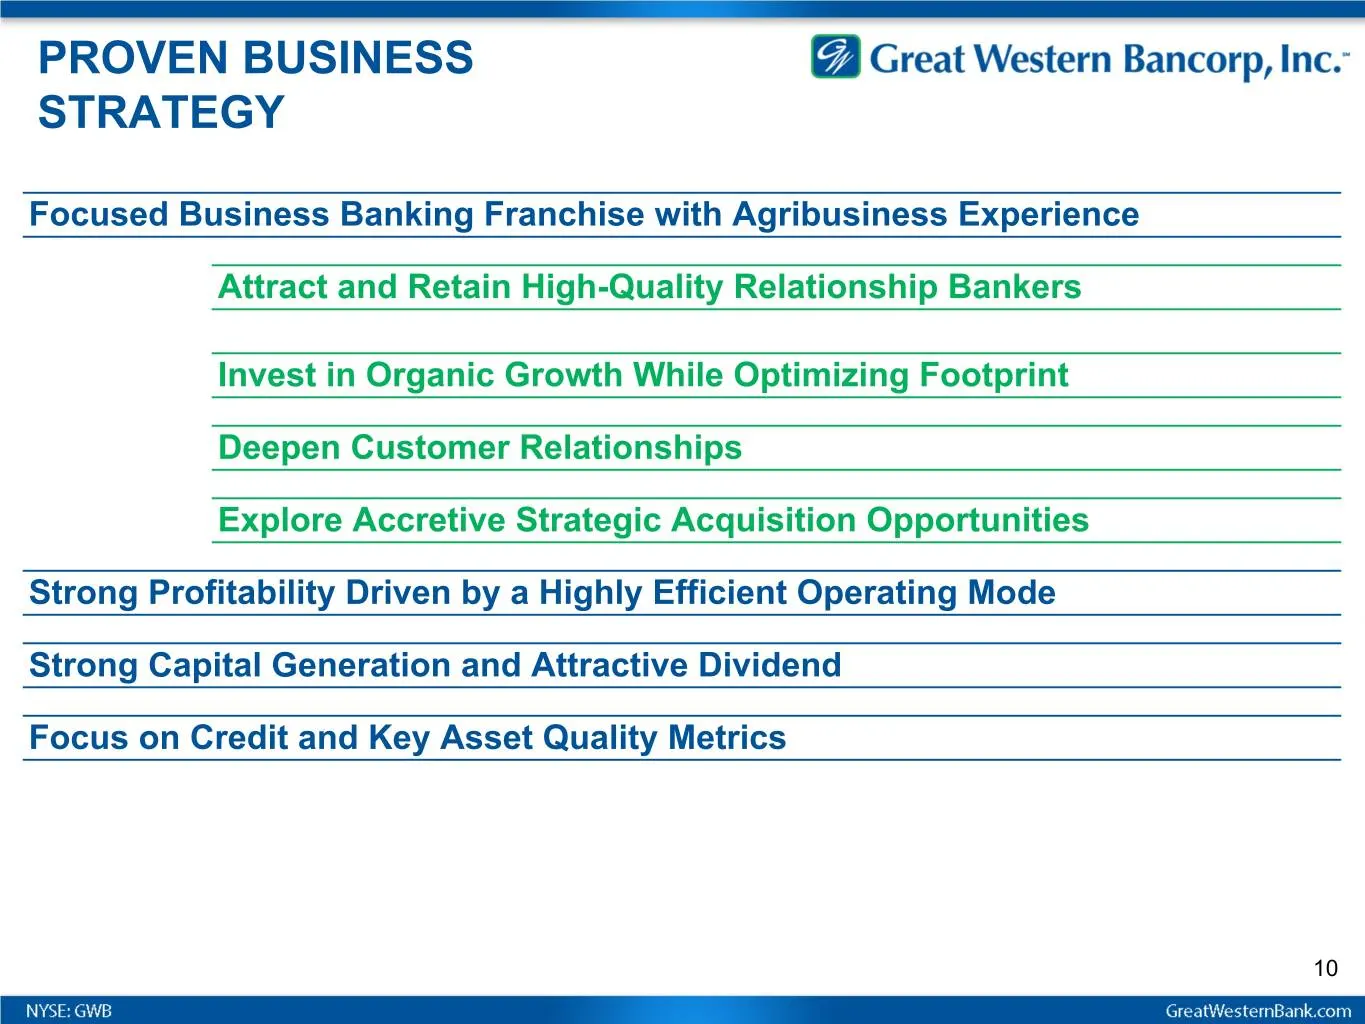
PROVEN BUSINESS STRATEGY Focused Business Banking Franchise with Agribusiness Experience Attract and Retain High-Quality Relationship Bankers Invest in Organic Growth While Optimizing Footprint Deepen Customer Relationships Explore Accretive Strategic Acquisition Opportunities Strong Profitability D
Slide 11: Disclosures
DISCLOSURES Forward-Looking Statements: This presentation contains forward-looking statements within the meaning of the Private Securities Litigation Reform Act of 1995. Statements about Great Western Bancorp, Inc.’s expectations, beliefs, plans, strategies, predictions, forecasts, objectives, assum
Slide 12: Appendix: Non-GAAP Measures
Appendix 1 Non-GAAP Measures
Slide 13: Non-GAAP Measures
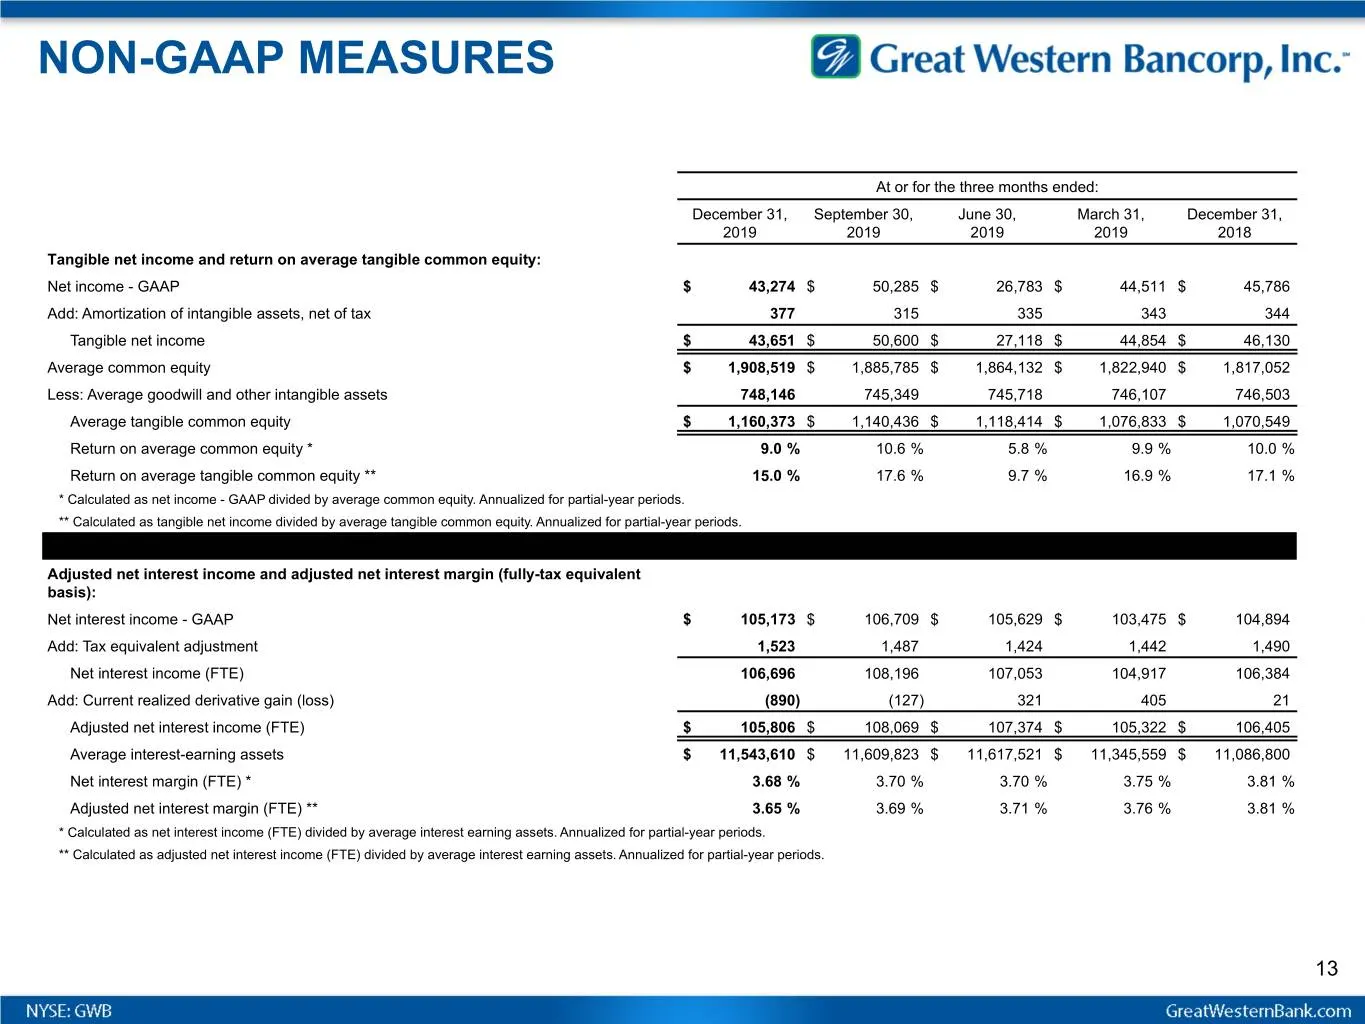
NON-GAAP MEASURES At or for the three months ended: December 31, September 30, June 30, March 31, December 31, 2019 2019 2019 2019 2018 Tangible net income and return on average tangible common equity: Net income - GAAP $ 43,274 $ 50,285 $ 26,783 $ 44,511 $ 45,786 Add: Amortization of intangible ass
Slide 14: Non-GAAP Measures
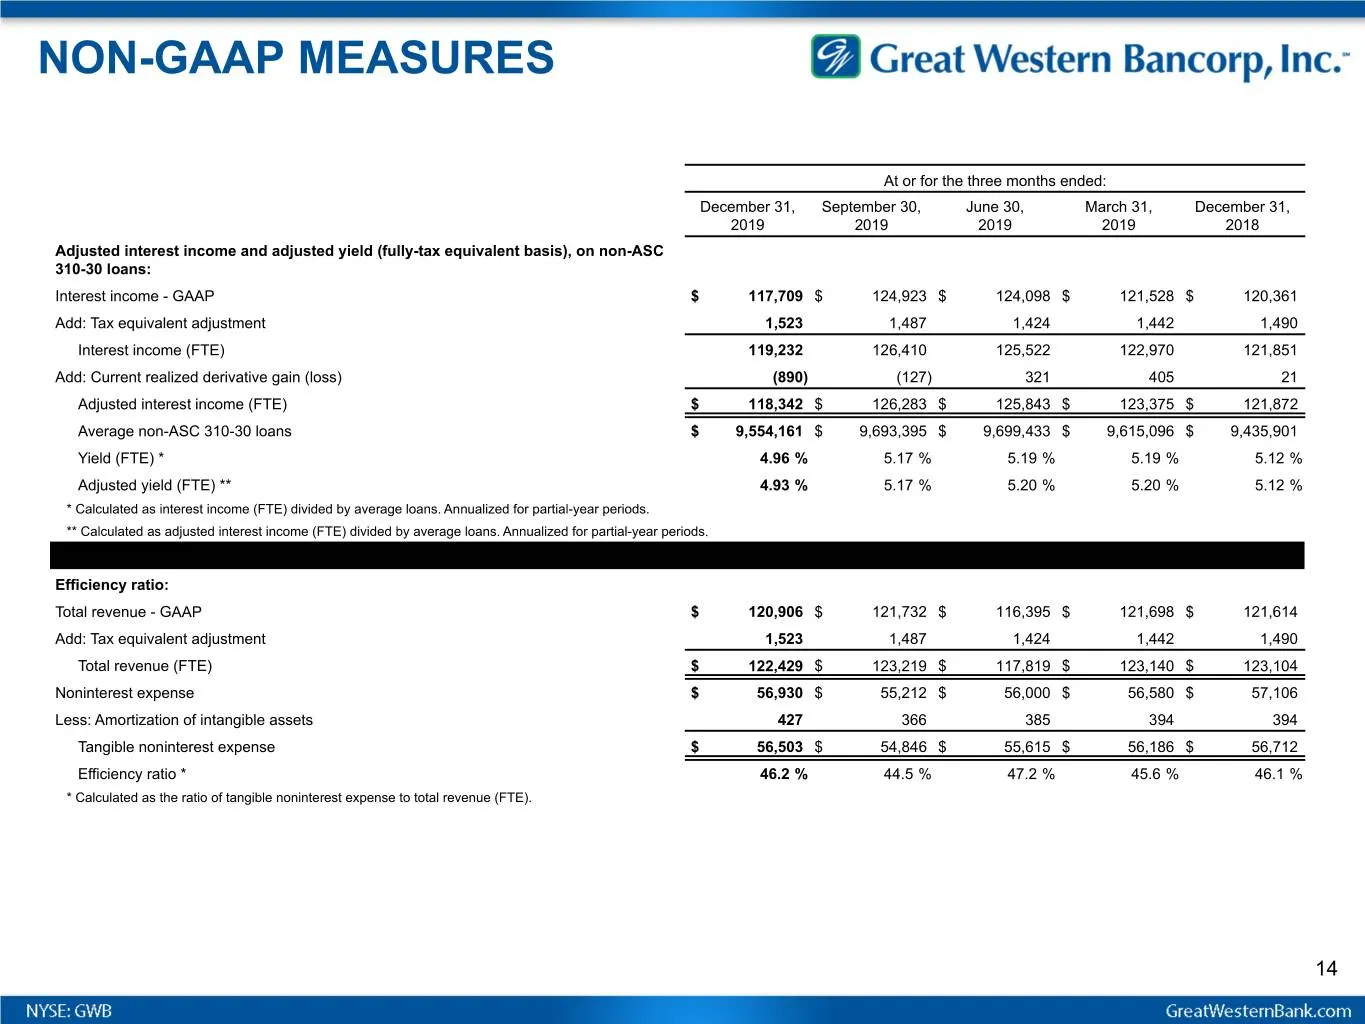
NON-GAAP MEASURES At or for the three months ended: December 31, September 30, June 30, March 31, December 31, 2019 2019 2019 2019 2018 Adjusted interest income and adjusted yield (fully-tax equivalent basis), on non-ASC 310-30 loans: Interest income - GAAP $ 117,709 $ 124,923 $ 124,098 $ 121,528 $
Slide 15: Non-GAAP Measures
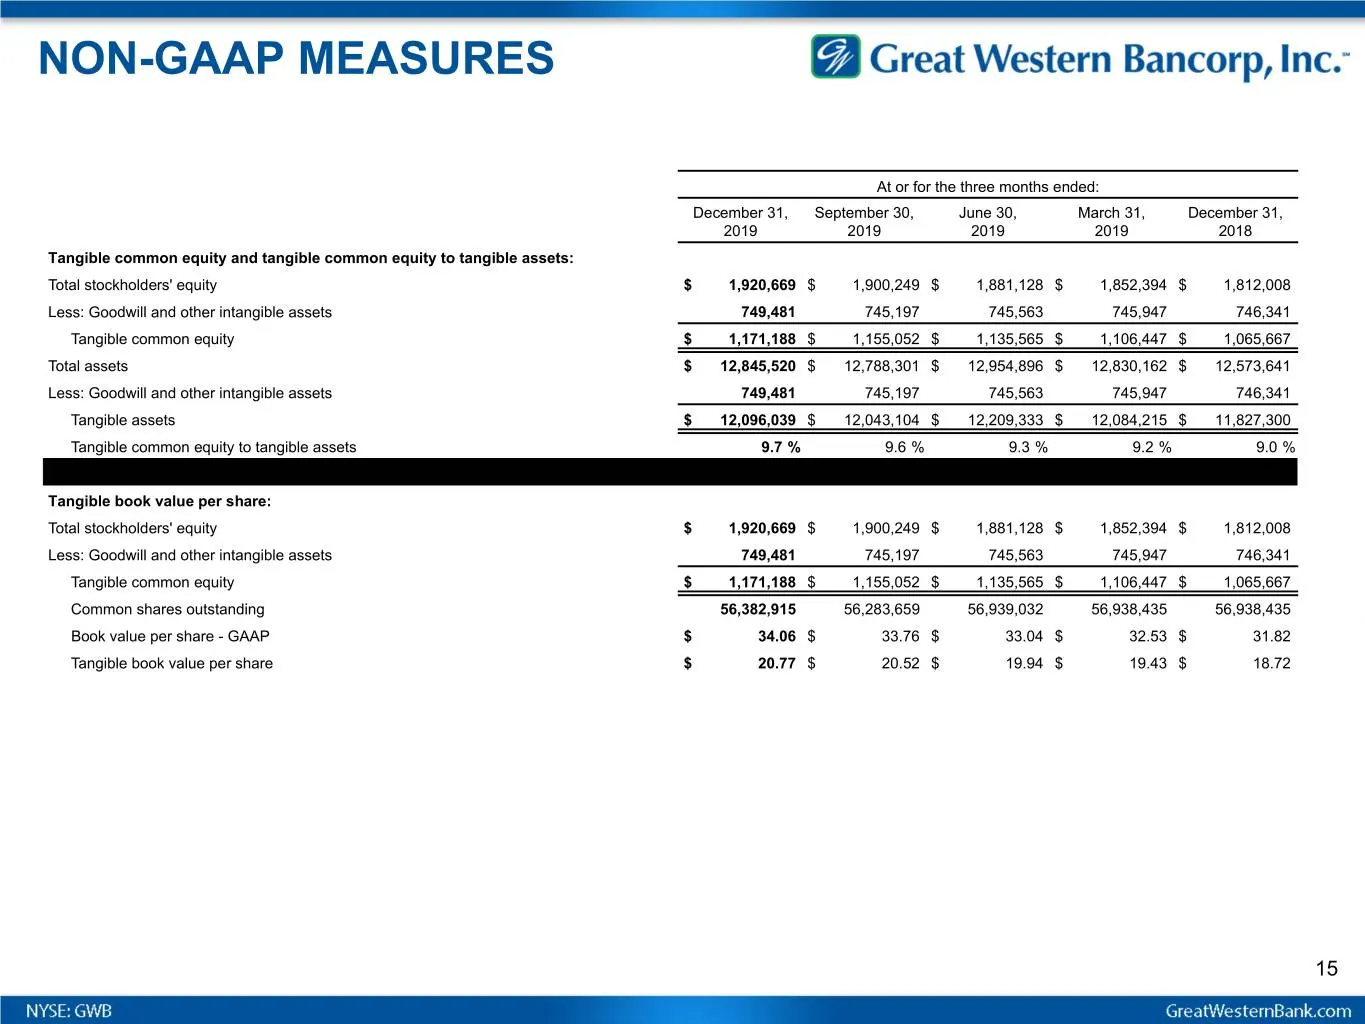
NON-GAAP MEASURES At or for the three months ended: December 31, September 30, June 30, March 31, December 31, 2019 2019 2019 2019 2018 Tangible common equity and tangible common equity to tangible assets: Total stockholders' equity $ 1,920,669 $ 1,900,249 $ 1,881,128 $ 1,852,394 $ 1,812,008 Less: G
Slide 16: Appendix: Accounting for Loans at FV and Related Derivatives
Appendix 2 Accounting for Loans at FV and Related Derivatives
Slide 17: Loans at Fair Value & Related Derivatives
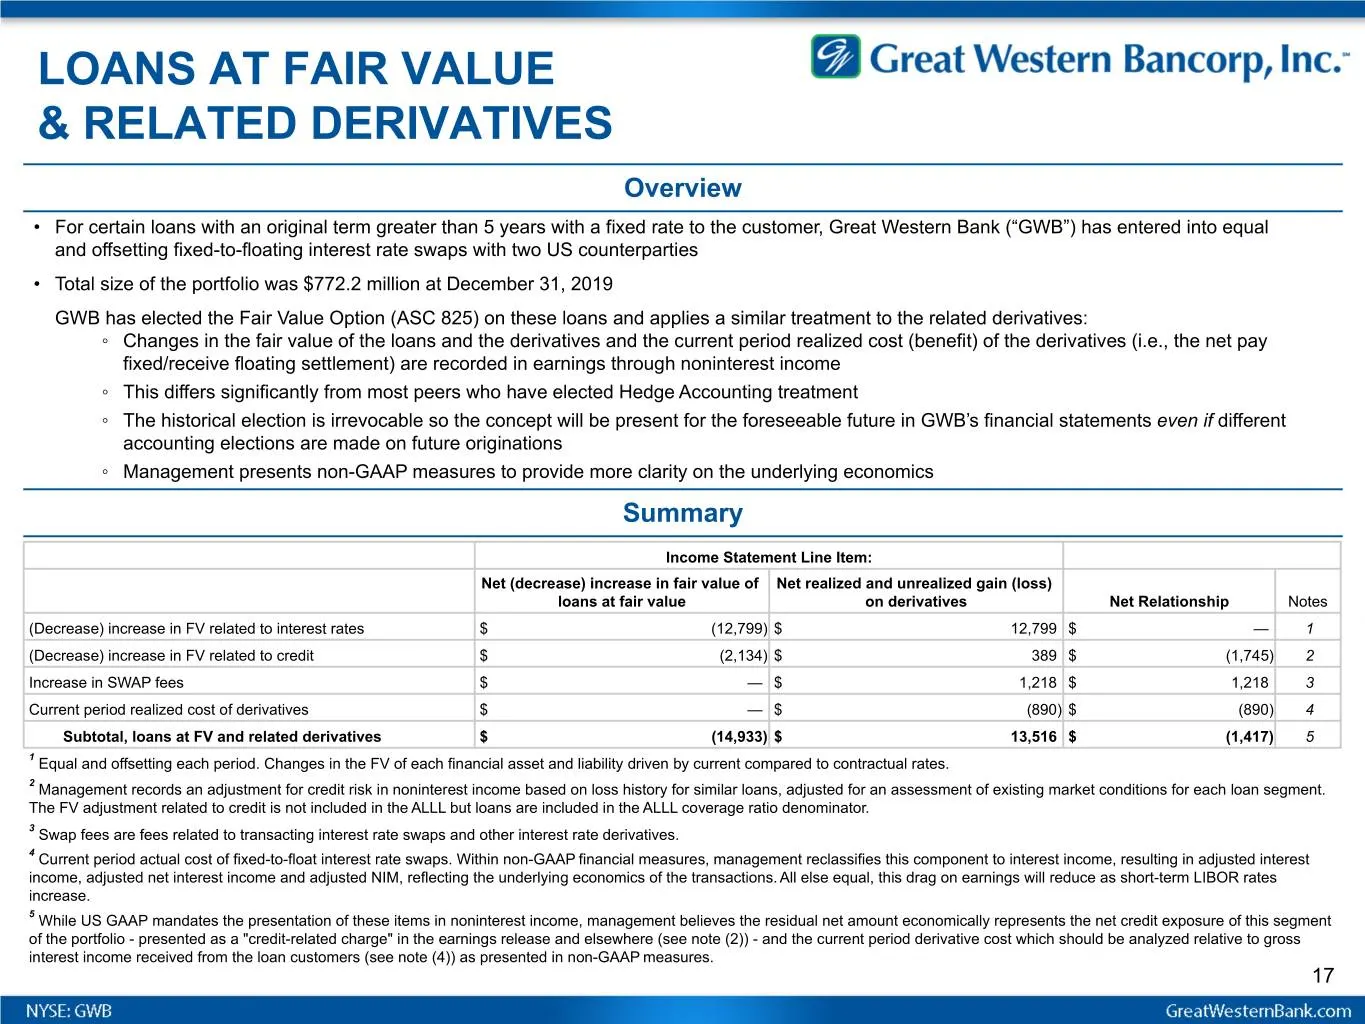
LOANS AT FAIR VALUE & RELATED DERIVATIVES Overview • For certain loans with an original term greater than 5 years with a fixed rate to the customer, Great Western Bank (“GWB”) has entered into equal and offsetting fixed-to-floating interest rate swaps with two US counterparties • Total size of the p
Source: SEC EDGAR · 8-K filed Jan 28, 2020
More decks from Great Western Bancorp Inc
 Q1 FY2022 Earnings Presentation27 slides · Jan 27, 2022
 Merger or Acquisition (October 2021)55 slides · Oct 29, 2021
 Q4 2021 Earnings Presentation28 slides · Oct 26, 2021
 Merger or Acquisition (September 2021)14 slides · Sep 21, 2021
 Merger or Acquisition (September 2021)28 slides · Sep 16, 2021
 Q3 FY2021 Earnings Presentation32 slides · Jul 29, 2021