Transat A.T. Inc. · TSX:TRZ
Transat A.T — Investor Presentation (June 2016)
39 slides from Transat A.T's investor presentation, June 2016
Slide 1: Building Platform for Profitability and Growth
BUILDING PLATFORM FOR PROFITABILITY AND GROWTH Investors Presentation June 2016
Slide 2: Forward-Looking Statements
FORWARD-LOOKING STATEMENTS THIS PRESENTATION CONTAINS CERTAIN FORWARD-LOOKING STATEMENTS WITH RESPECT TO THE CORPORATION. THESE FORWARD-LOOKING STATEMENTS, BY THEIR NATURE, NECESSARILY INVOLVE RISKS AND UNCERTAINTIES THAT COULD CAUSE ACTUAL RESULTS TO DIFFER MATERIALLY FROM THOSE CONTEMPLATED BY THE
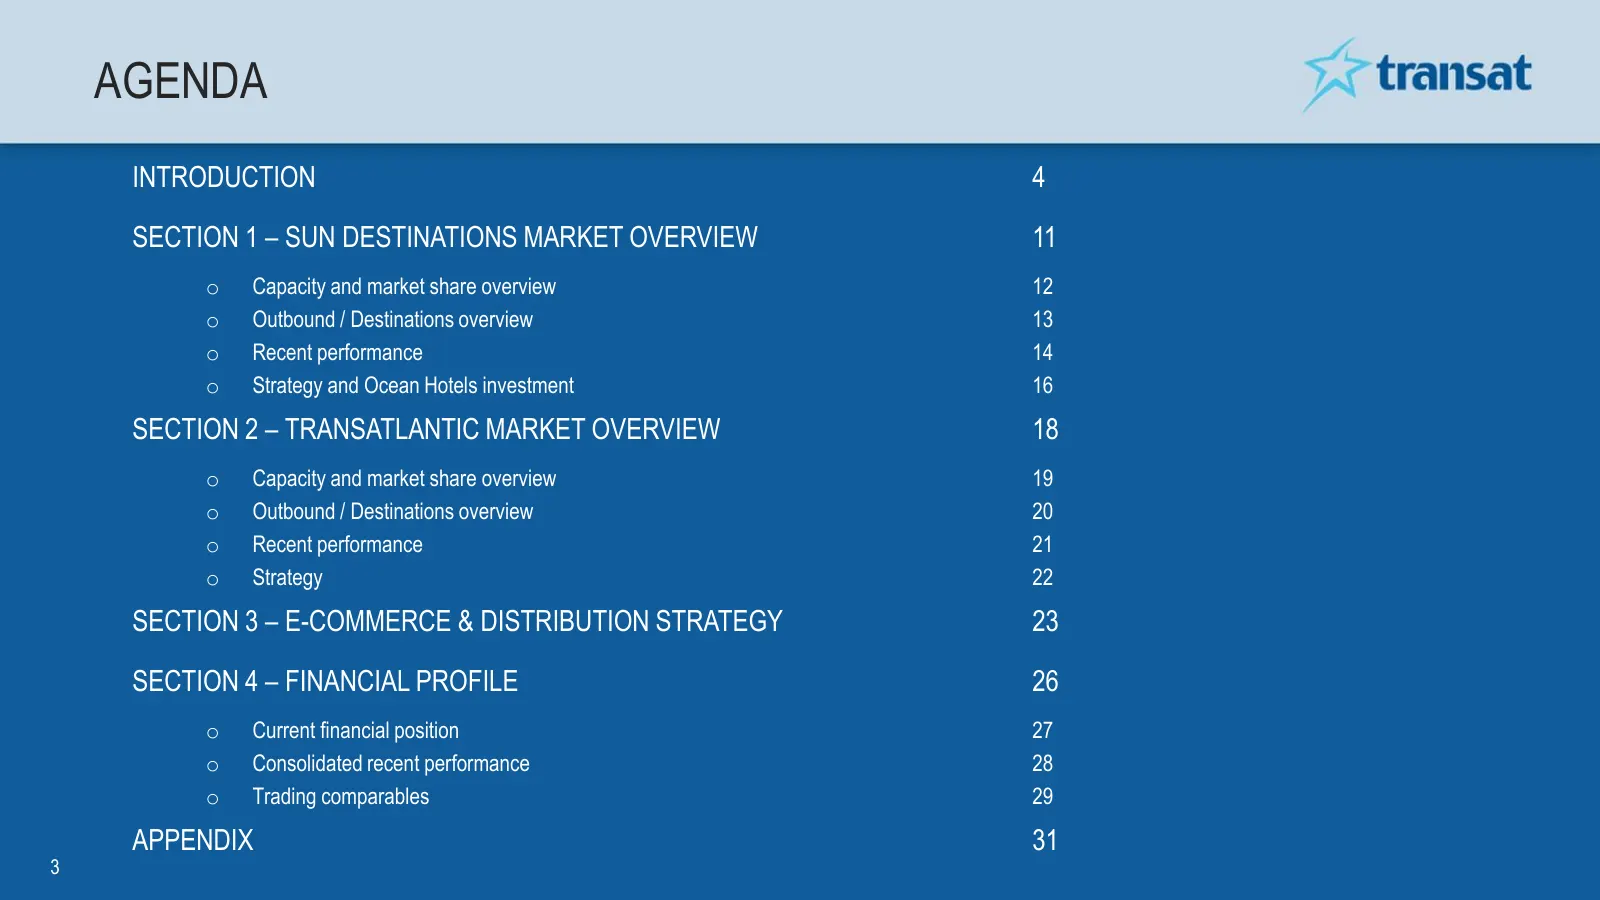
Slide 3: Agenda
AGENDA INTRODUCTION 4 SECTION 1 – SUN DESTINATIONS MARKET OVERVIEW 11 o Capacity and market share overview 12 o Outbound / Destinations overview 13 o Recent performance 14 o Strategy and Ocean Hotels investment 16 SECTION 2 – TRANSATLANTIC MARKET OVERVIEW 18 o Capacity and market share overview 19 o
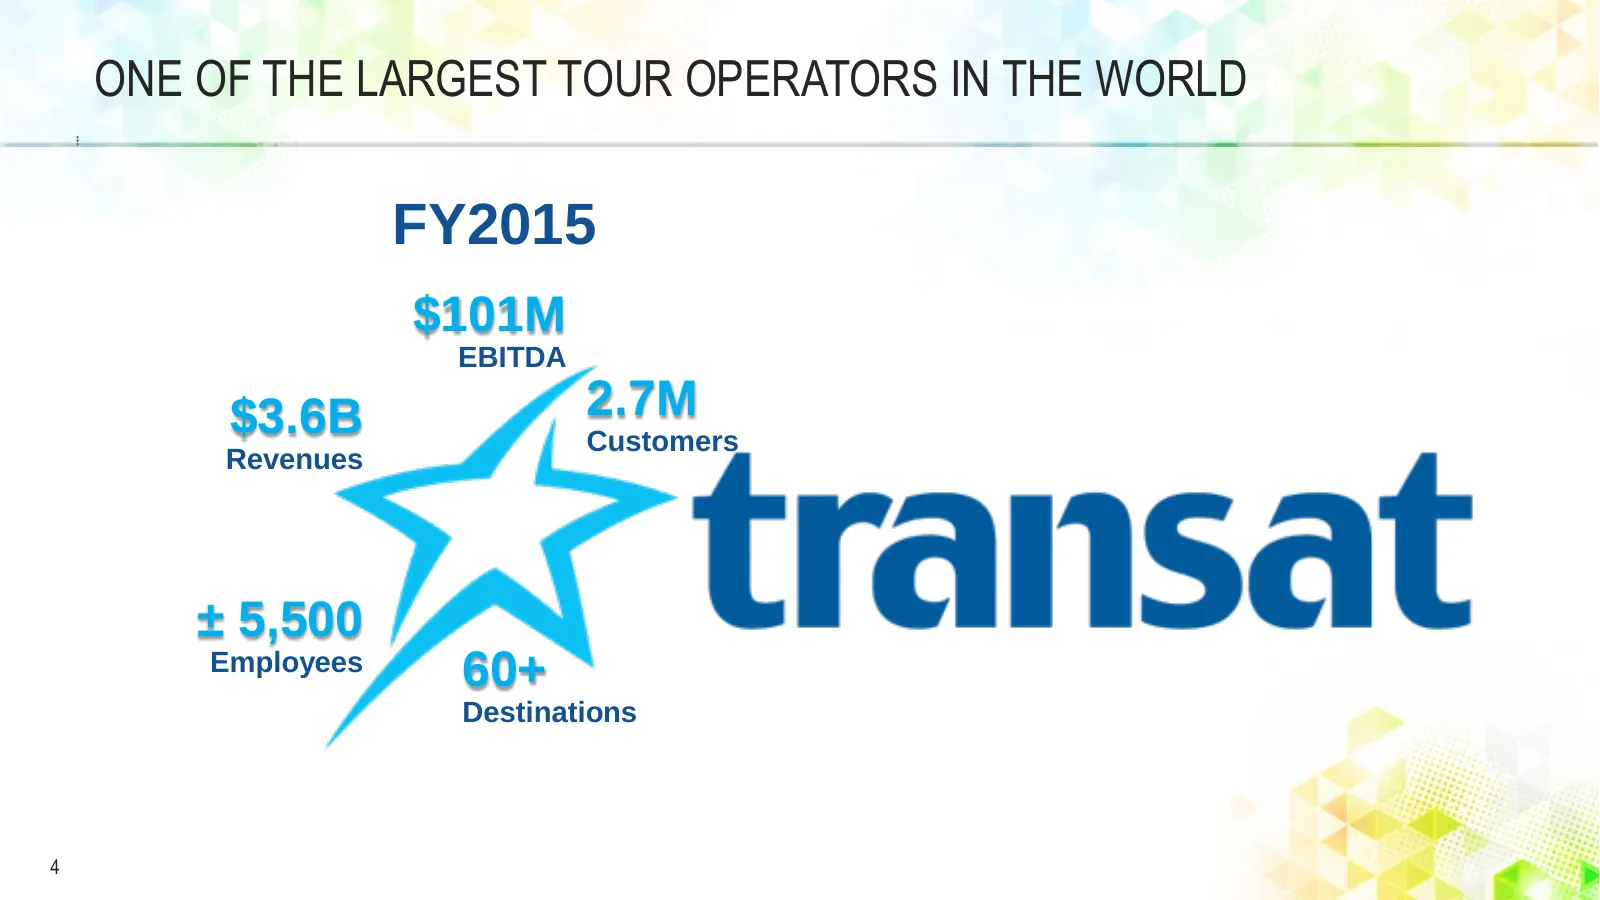
Slide 4: One of the Largest Tour Operators in the World FY2015
ONE OF THE LARGEST TOUR OPERATORS IN THE WORLD FY2015 $101M EBITDA $3.6B 2.7M Customers Revenues ± 5,500 Employees 60+ Destinations 4
Slide 5: One of the Largest Tour Operators in the World FY2015 (continuing operations)
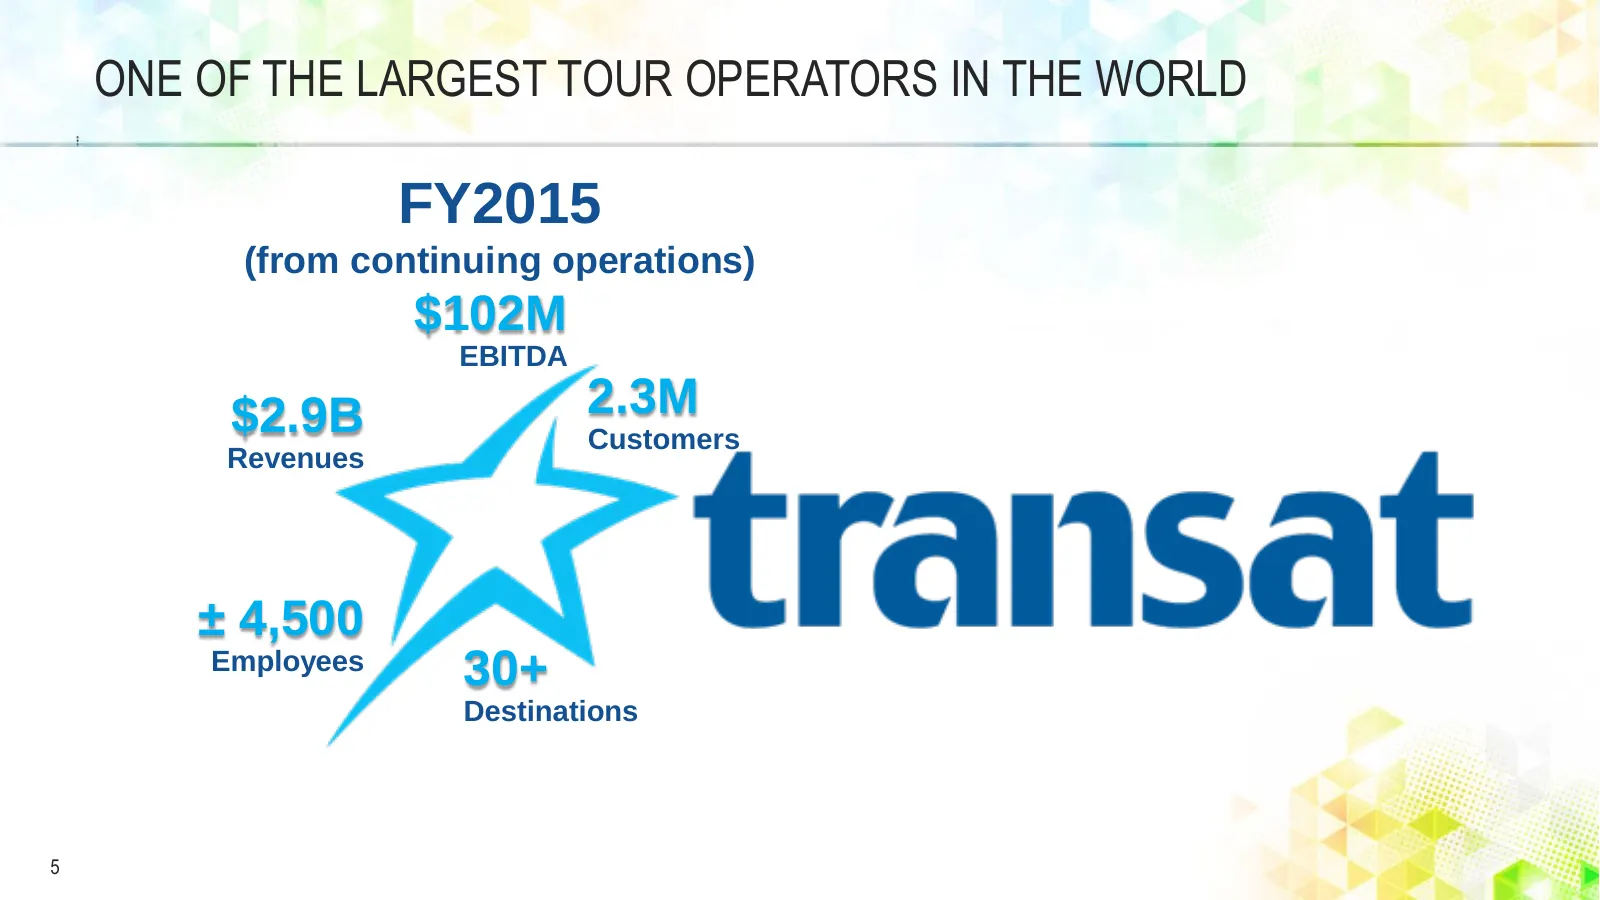
ONE OF THE LARGEST TOUR OPERATORS IN THE WORLD FY2015 (from continuing operations) $102M EBITDA $2.9B 2.3M Customers Revenues ± 4,500 Employees 30+ Destinations 5
Slide 6: True Vertically-Integrated Travel Provider
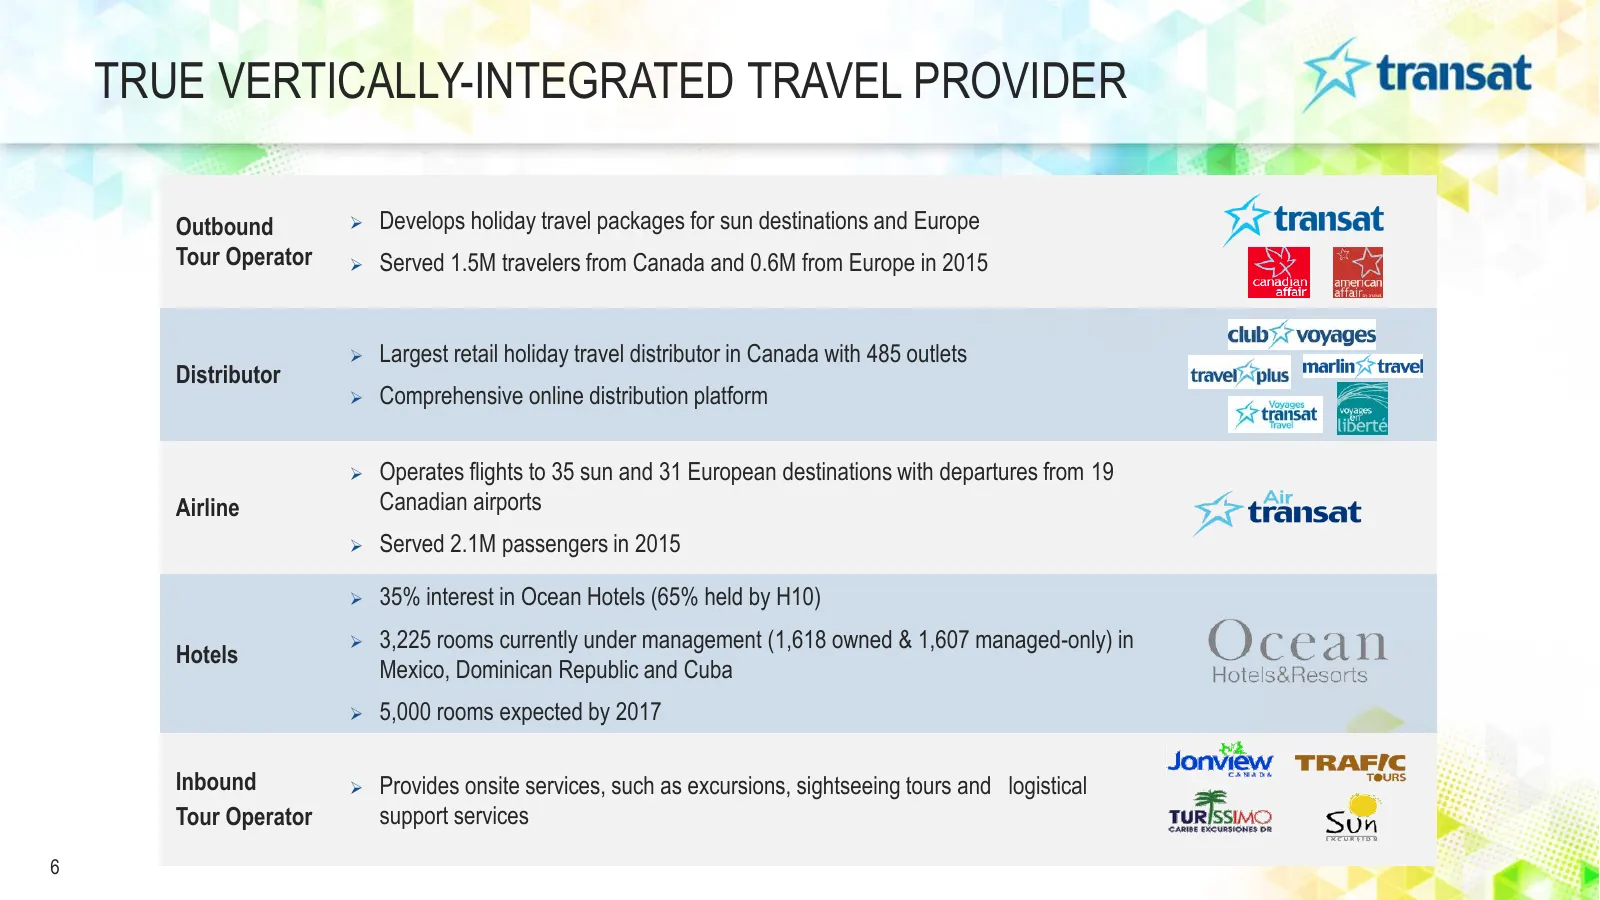
TRUE VERTICALLY-INTEGRATED TRAVEL PROVIDER Outbound Develops holiday travel packages for sun destinations and Europe Tour Operator Served 1.5M travelers from Canada and 0.6M from Europe in 2015 Largest retail holiday travel distributor in Canada with 485 outlets Distributor Comprehensive onl
Slide 7: Distinct Summer and Winter Markets
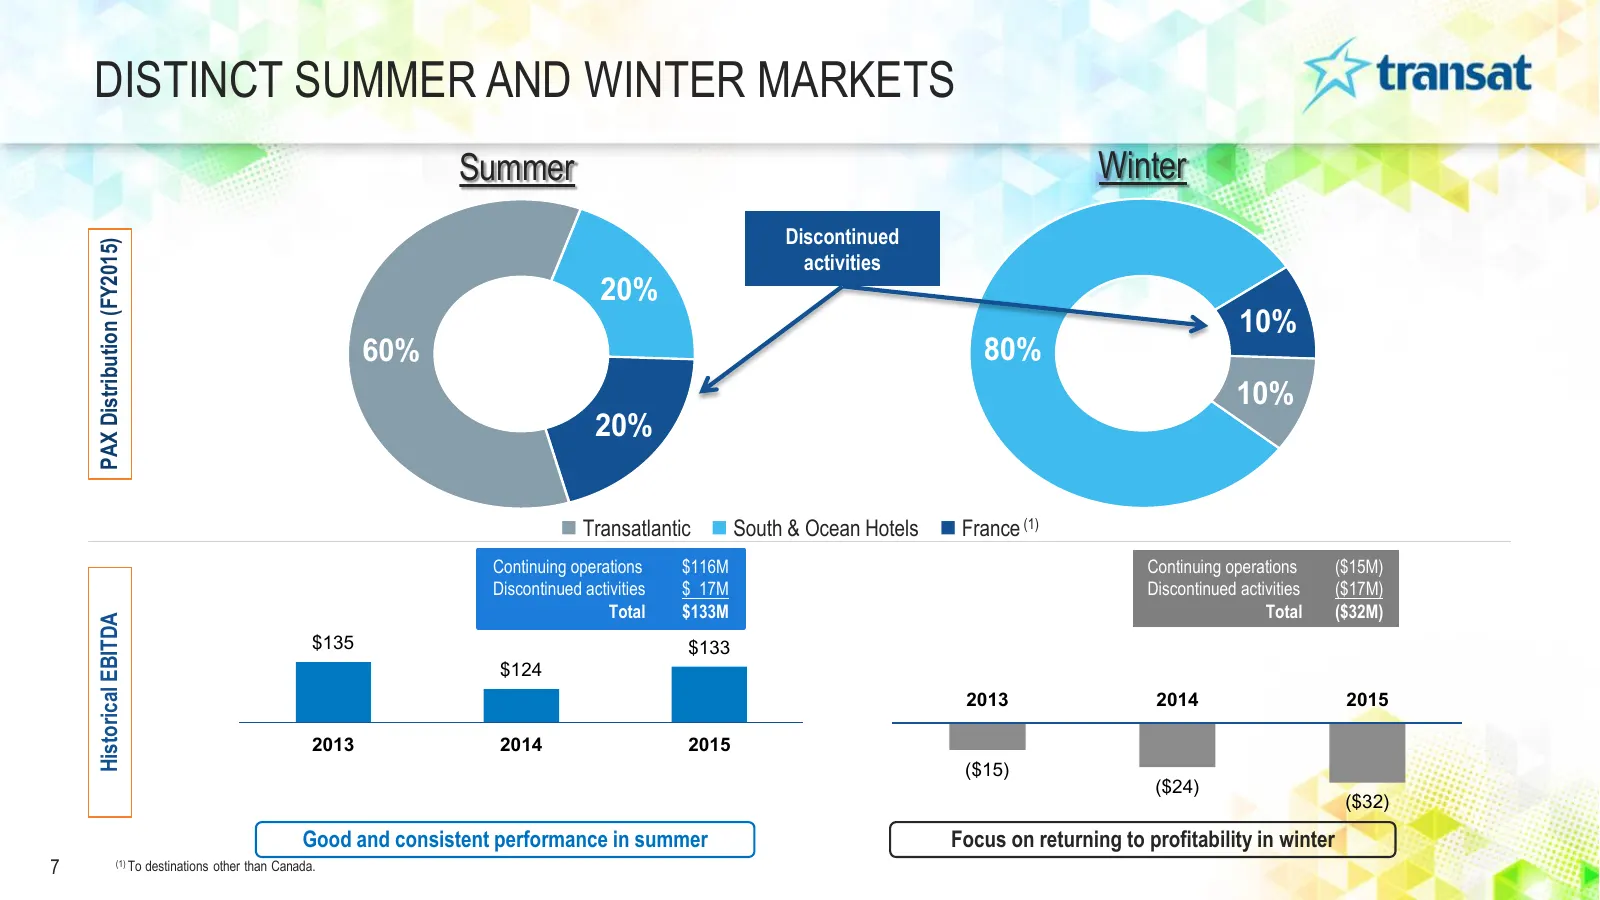
DISTINCT SUMMER AND WINTER MARKETS Summer Winter Discontinued PAX Distribution (FY2015) activities 20% 10% 60% 80% 10% 20% Transatlantic South & Ocean Hotels France (1) Continuing operations $116M Continuing operations ($15M) Discontinued activities $ 17M Discontinued activities ($17M) Total $
Slide 8: 2015-2017 Strategic Plan
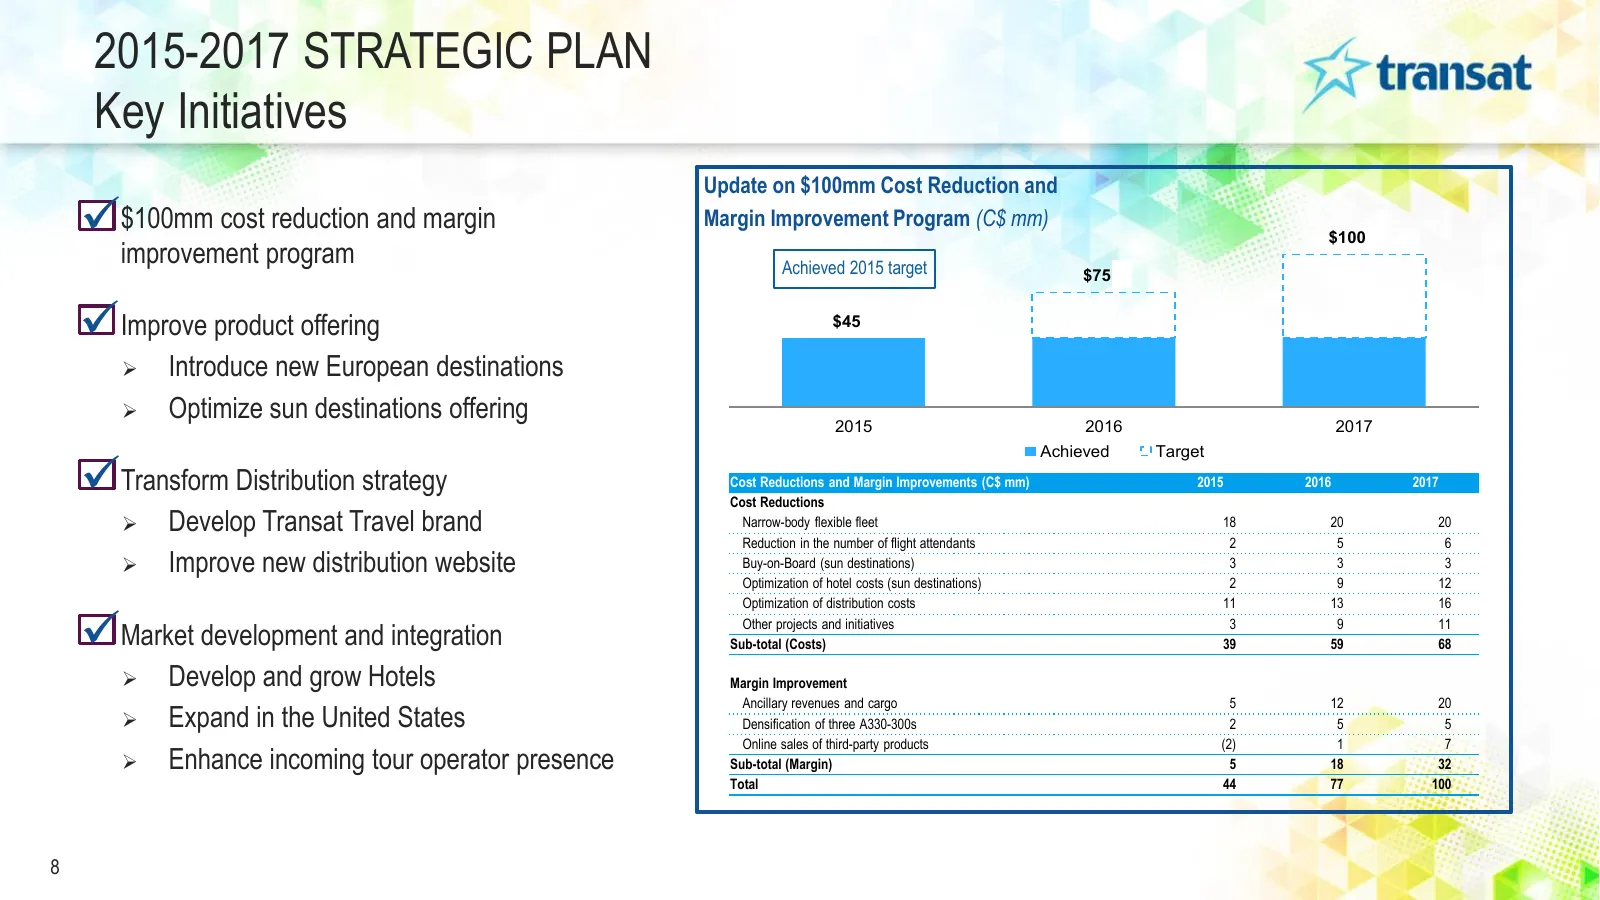
2015-2017 STRATEGIC PLAN Key Initiatives Update on $100mm Cost Reduction and $100mm cost reduction and margin Margin Improvement Program (C$ mm) $100.0 improvement program Achieved 2015 target $75.0 Improve product offering $45.0 Introduce new European destinations Optimize sun destinations of
Slide 9: Multiple Value Drivers
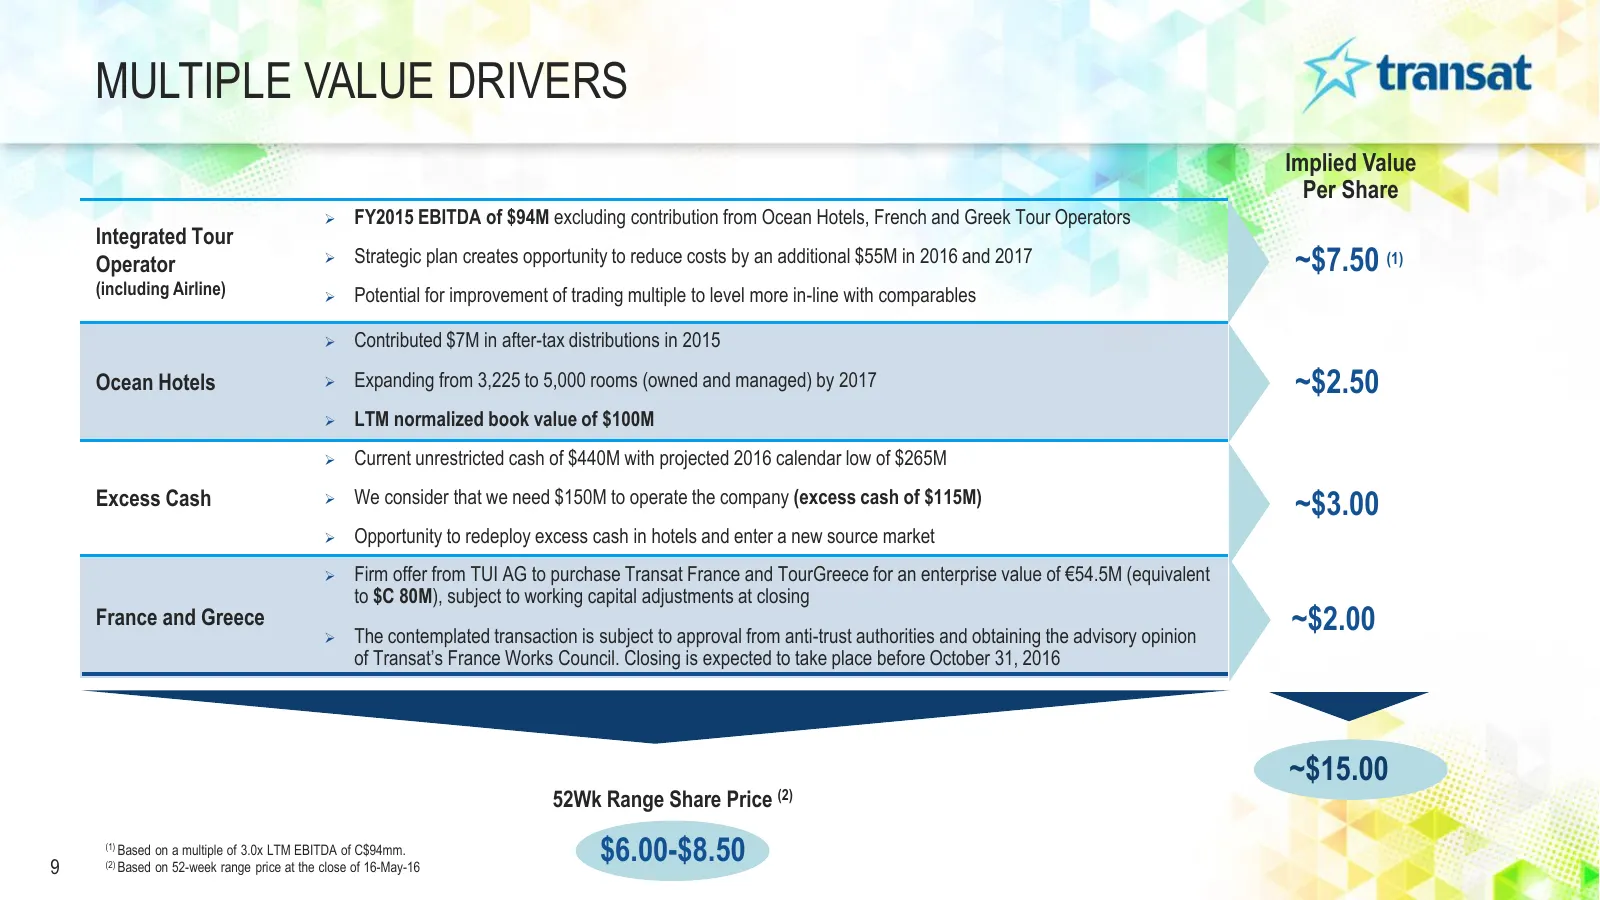
MULTIPLE VALUE DRIVERS Implied Value Per Share FY2015 EBITDA of $94M excluding contribution from Ocean Hotels, French and Greek Tour Operators Integrated Tour Operator Strategic plan creates opportunity to reduce costs by an additional $55M in 2016 and 2017 ~$7.50 (1) (including Airline) Poten
Slide 10: Investment Highlights
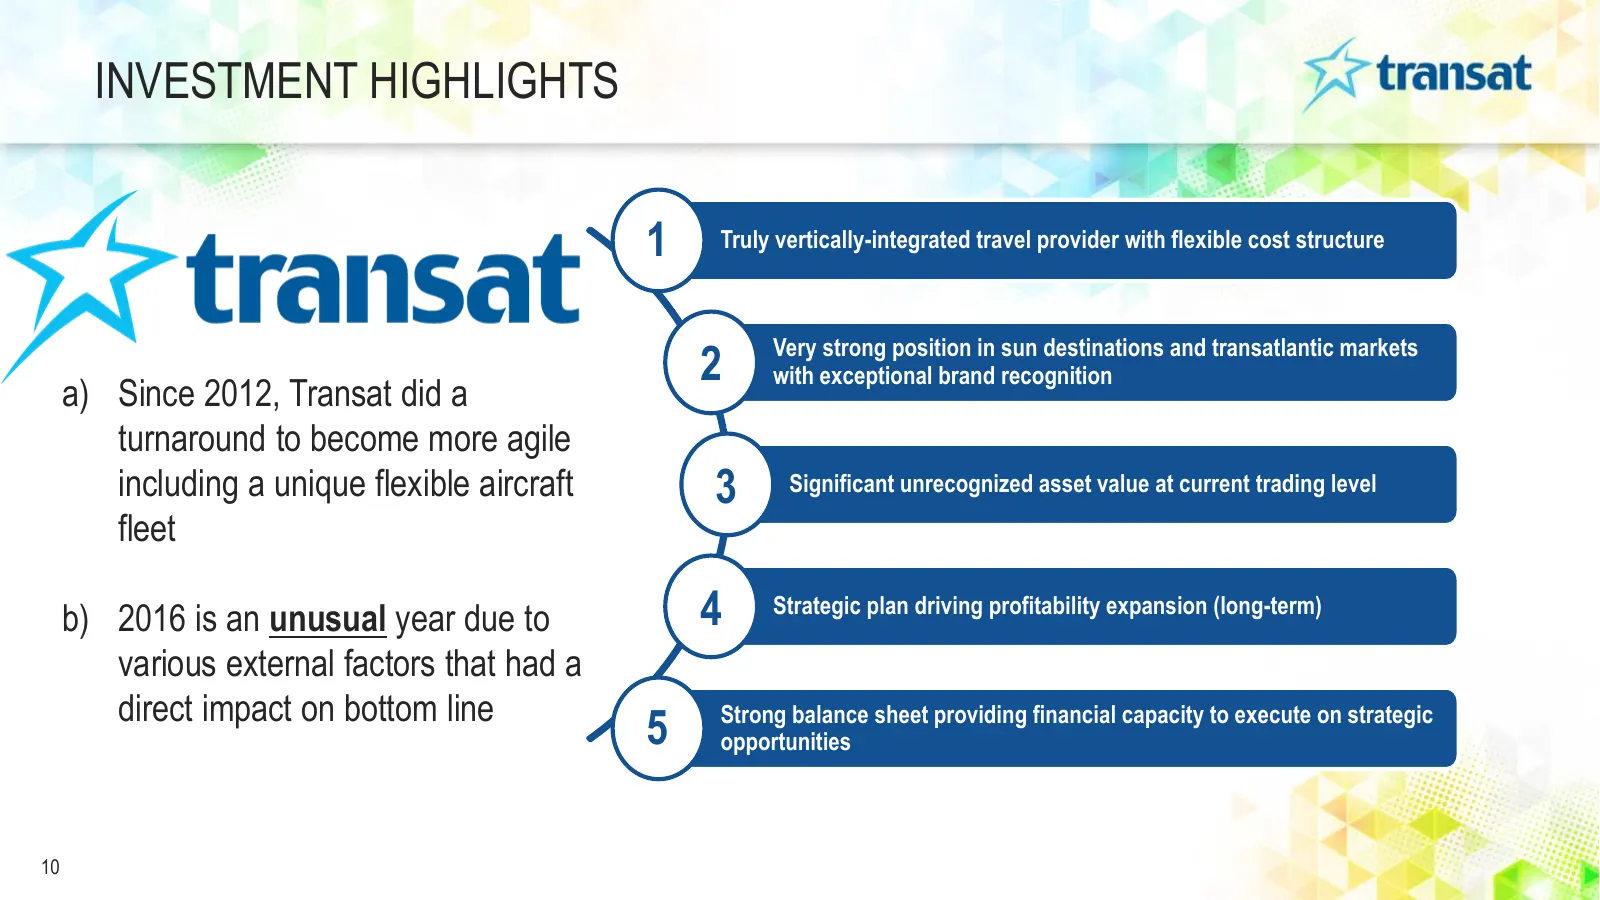
INVESTMENT HIGHLIGHTS 1 Truly vertically-integrated travel provider with flexible cost structure Very strong position in sun destinations and transatlantic markets 2 with exceptional brand recognition a) Since 2012, Transat did a turnaround to become more agile including a unique flexible aircraft 3
Slide 11: Section 1 – Sun Destinations Market Overview
SECTION 1 – SUN DESTINATIONS MARKET OVERVIEW 11
Slide 12: Sun Destinations Market Overview: Capacity and Market Share
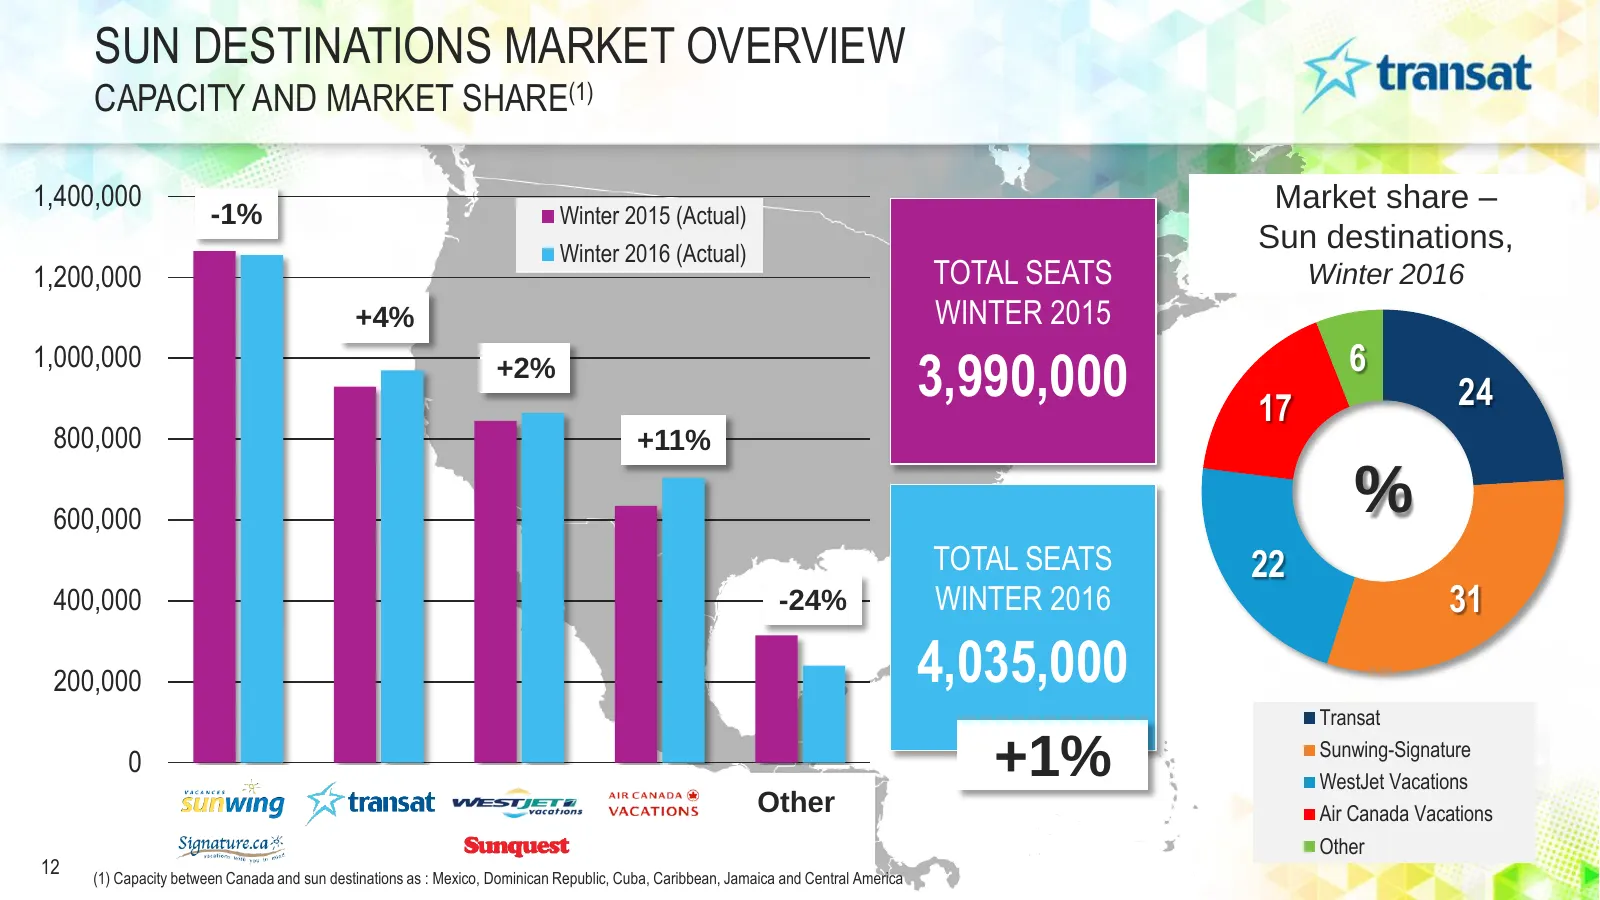
SUN DESTINATIONS MARKET OVERVIEW CAPACITY AND MARKET SHARE(1) 1,400,000 Market share – -1% Winter 2015 (Actual) Winter 2016 (Actual) Sun destinations, 1,200,000 TOTAL SEATS Winter 2016 +4% WINTER 2015 1,000,000 6 +2% 3,990,000 17 24 800,000 +11% 600,000 % TOTAL SEATS 22 400,000 -24% WINTER 2016 31 2
Slide 13: Winter 2016: 970,000 Travellers
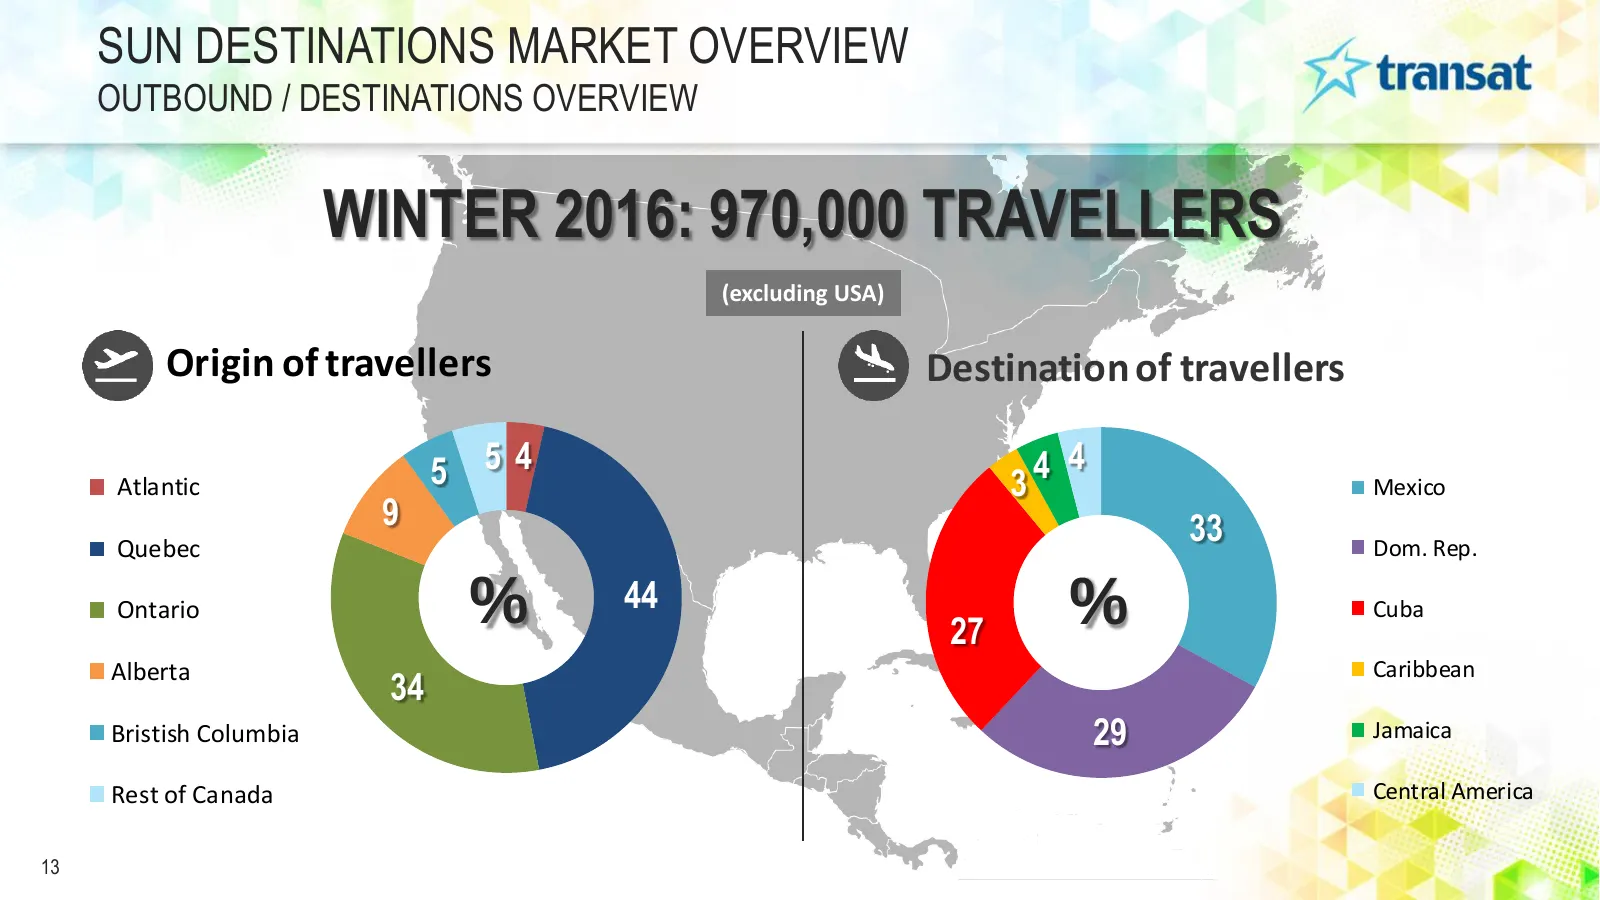
SUN DESTINATIONS MARKET OVERVIEW OUTBOUND / DESTINATIONS OVERVIEW WINTER 2016: 970,000 TRAVELLERS (excluding USA) Origin of travellers Destination of travellers Atlantic 5 54 3 4 4 Mexico 9 33 Quebec Dom. Rep. Ontario % 44 % Cuba 27 Alberta Caribbean 34 Bristish Columbia 29 Jamaica Rest of Canada Ce
Slide 14: Sun Destinations Recent Performance: Q2 Highlights
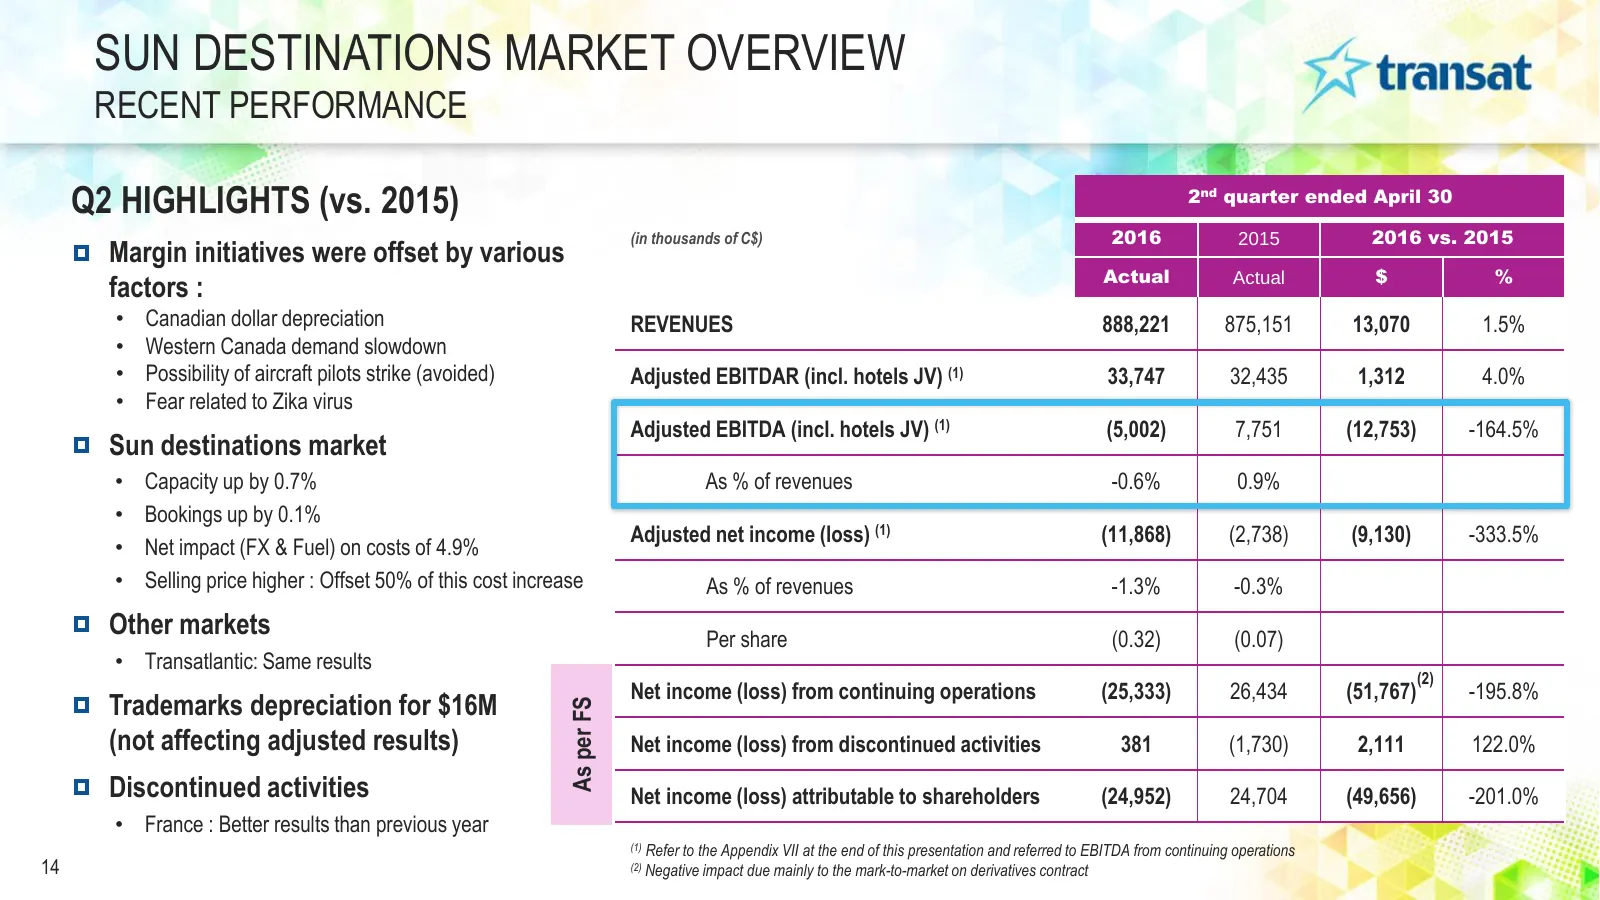
SUN DESTINATIONS MARKET OVERVIEW RECENT PERFORMANCE Q2 HIGHLIGHTS (vs. 2015) 2nd quarter ended April 30 (in thousands of C$) 2016 2015 2016 vs. 2015 Margin initiatives were offset by various Actual $ % factors : Actual • Canadian dollar depreciation REVENUES 888,221 875,151 13,070 1.5% • Western Can
Slide 15: Sun Destinations Recent Performance: Winter Highlights
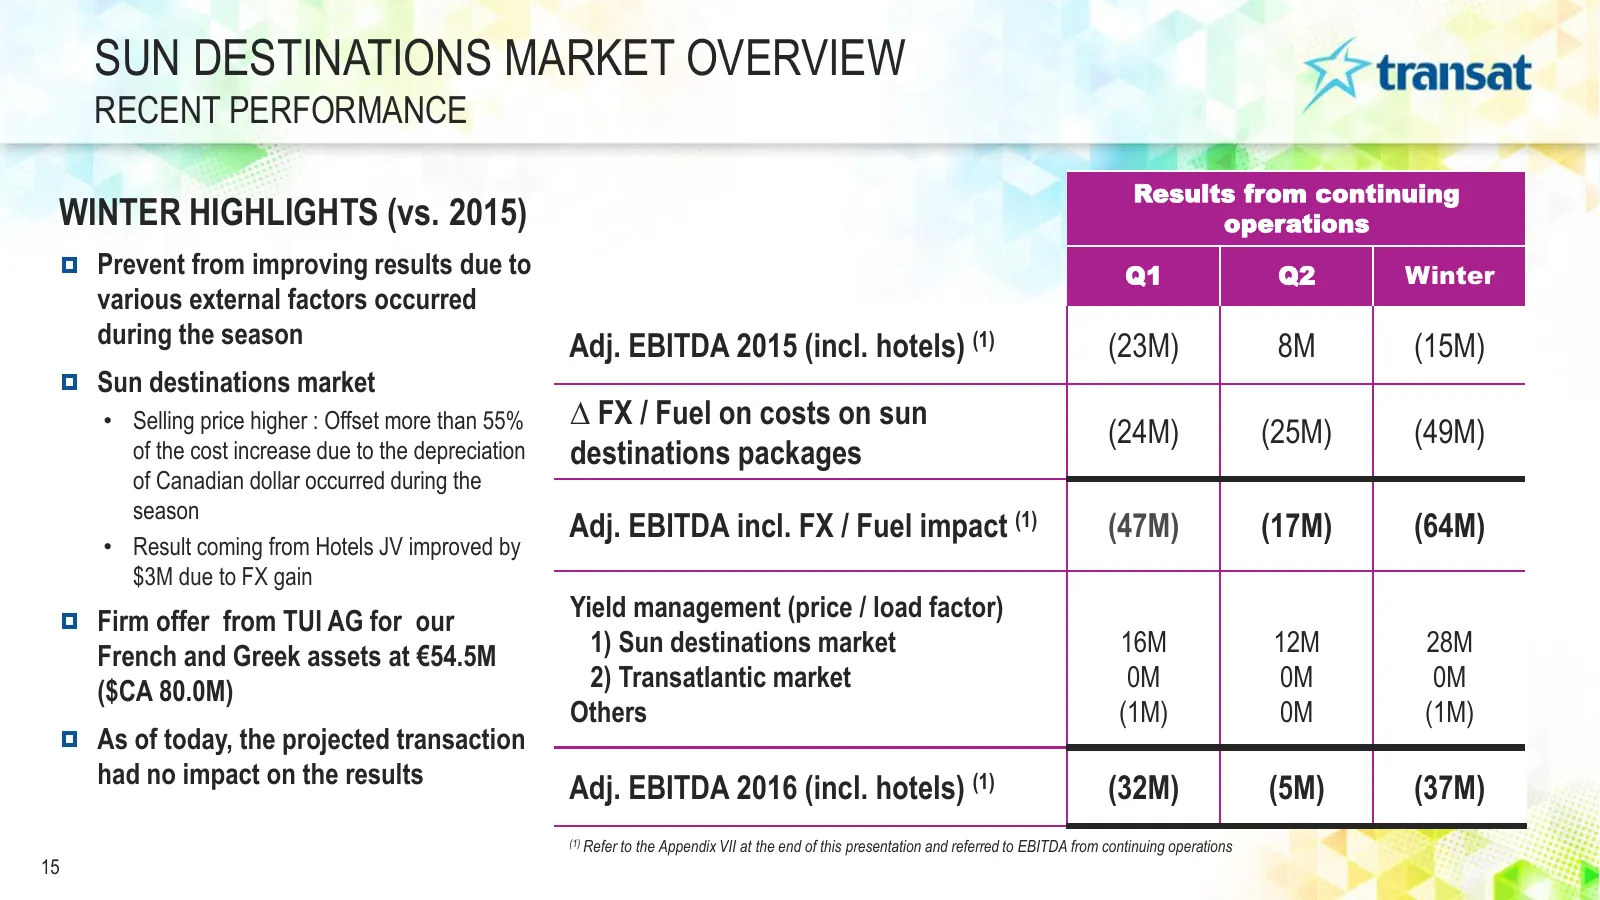
SUN DESTINATIONS MARKET OVERVIEW RECENT PERFORMANCE Results from continuing WINTER HIGHLIGHTS (vs. 2015) operations Prevent from improving results due to Q1 Q2 Winter various external factors occurred during the season Adj. EBITDA 2015 (incl. hotels) (1) (23M) 8M (15M) Sun destinations market • Sell
Slide 16: Fleet Strategy
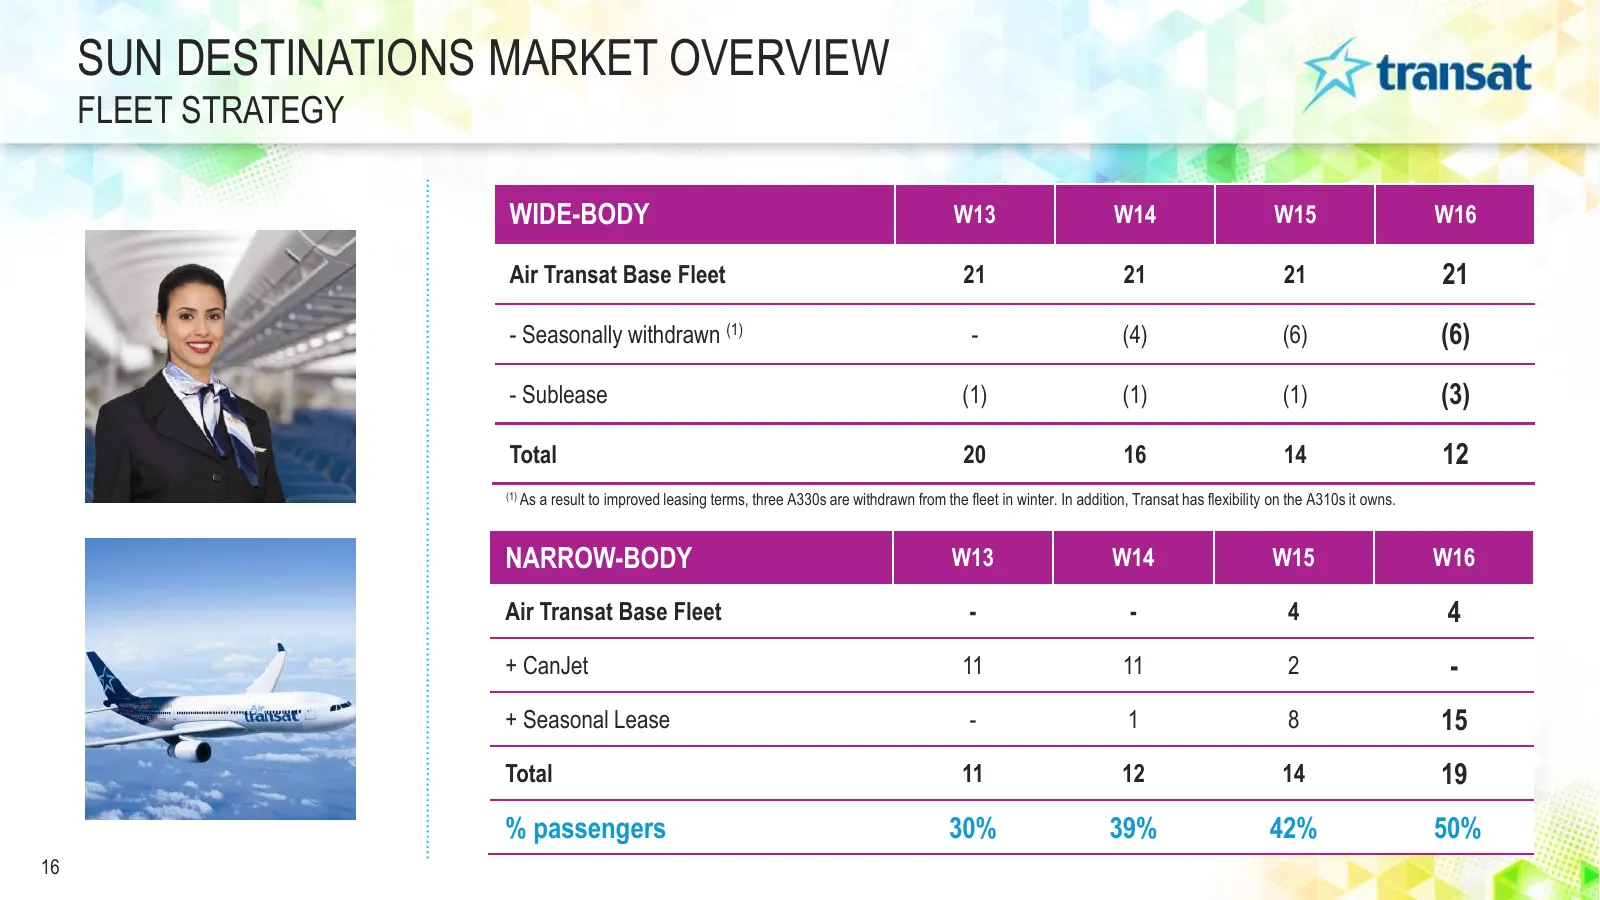
SUN DESTINATIONS MARKET OVERVIEW FLEET STRATEGY WIDE-BODY W13 W14 W15 W16 Air Transat Base Fleet 21 21 21 21 - Seasonally withdrawn (1) - (4) (6) (6) - Sublease (1) (1) (1) (3) Total 20 16 14 12 (1) As a result to improved leasing terms, three A330s are withdrawn from the fleet in winter. In additio
Slide 17: Ocean Hotels Investment
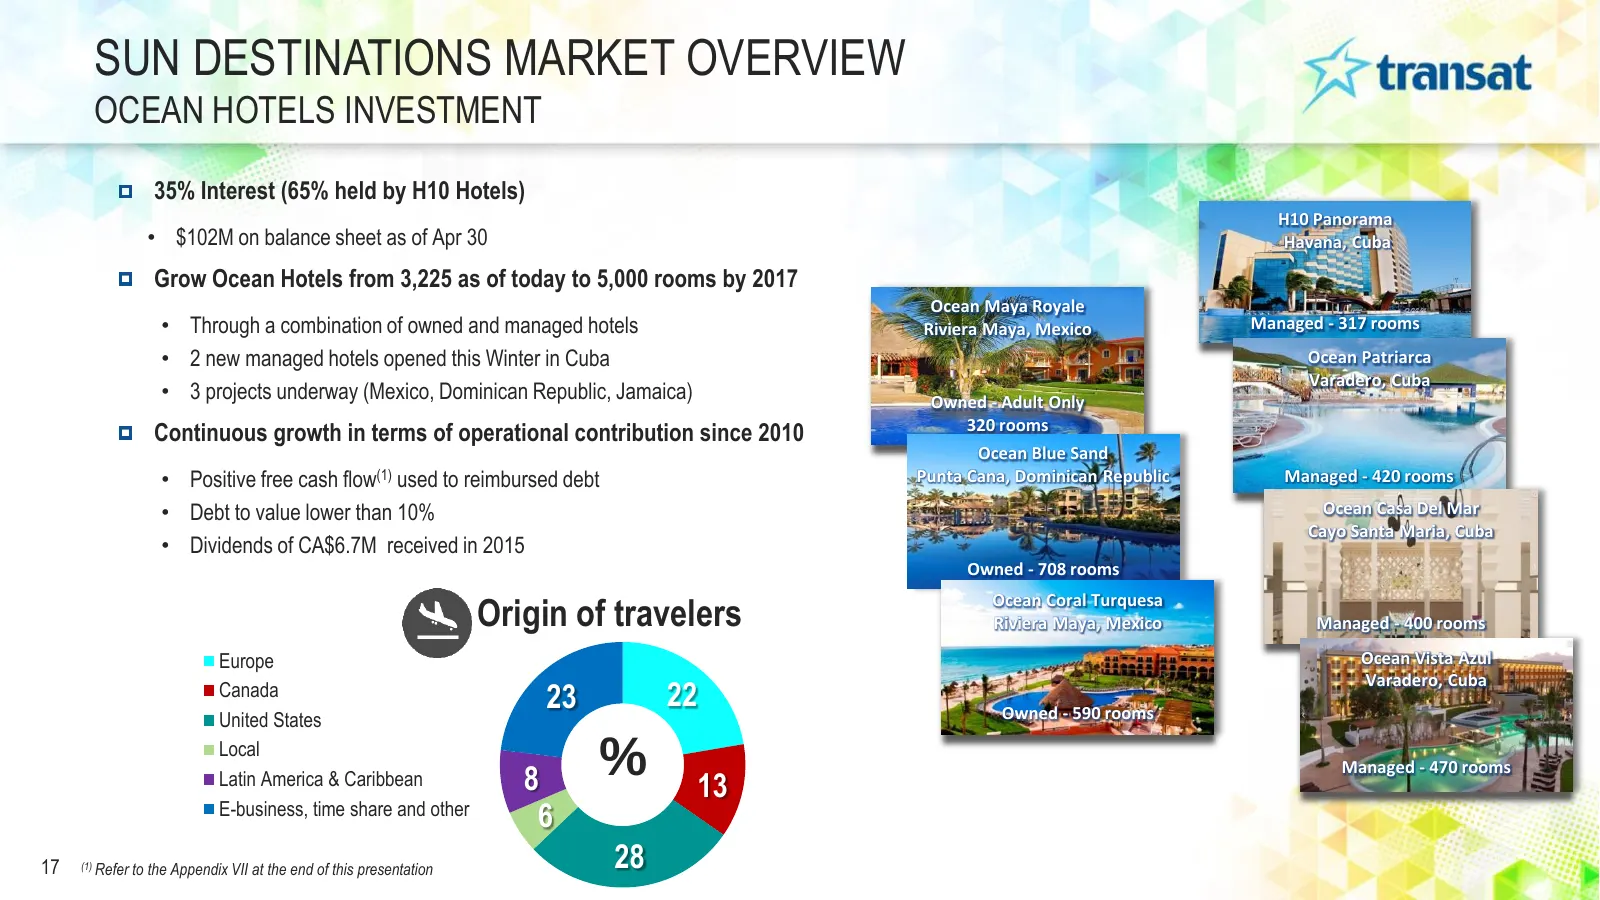
SUN DESTINATIONS MARKET OVERVIEW OCEAN HOTELS INVESTMENT 35% Interest (65% held by H10 Hotels) H10 Panorama • $102M on balance sheet as of Apr 30 Havana, Cuba Grow Ocean Hotels from 3,225 as of today to 5,000 rooms by 2017 Ocean Maya Royale • Through a combination of owned and managed hotels Riviera

Slide 18: Section 2 – Transatlantic Market Overview
SECTION 2 – TRANSATLANTIC MARKET OVERVIEW 16 18
Slide 19: Transatlantic Market: Capacity and Market Share
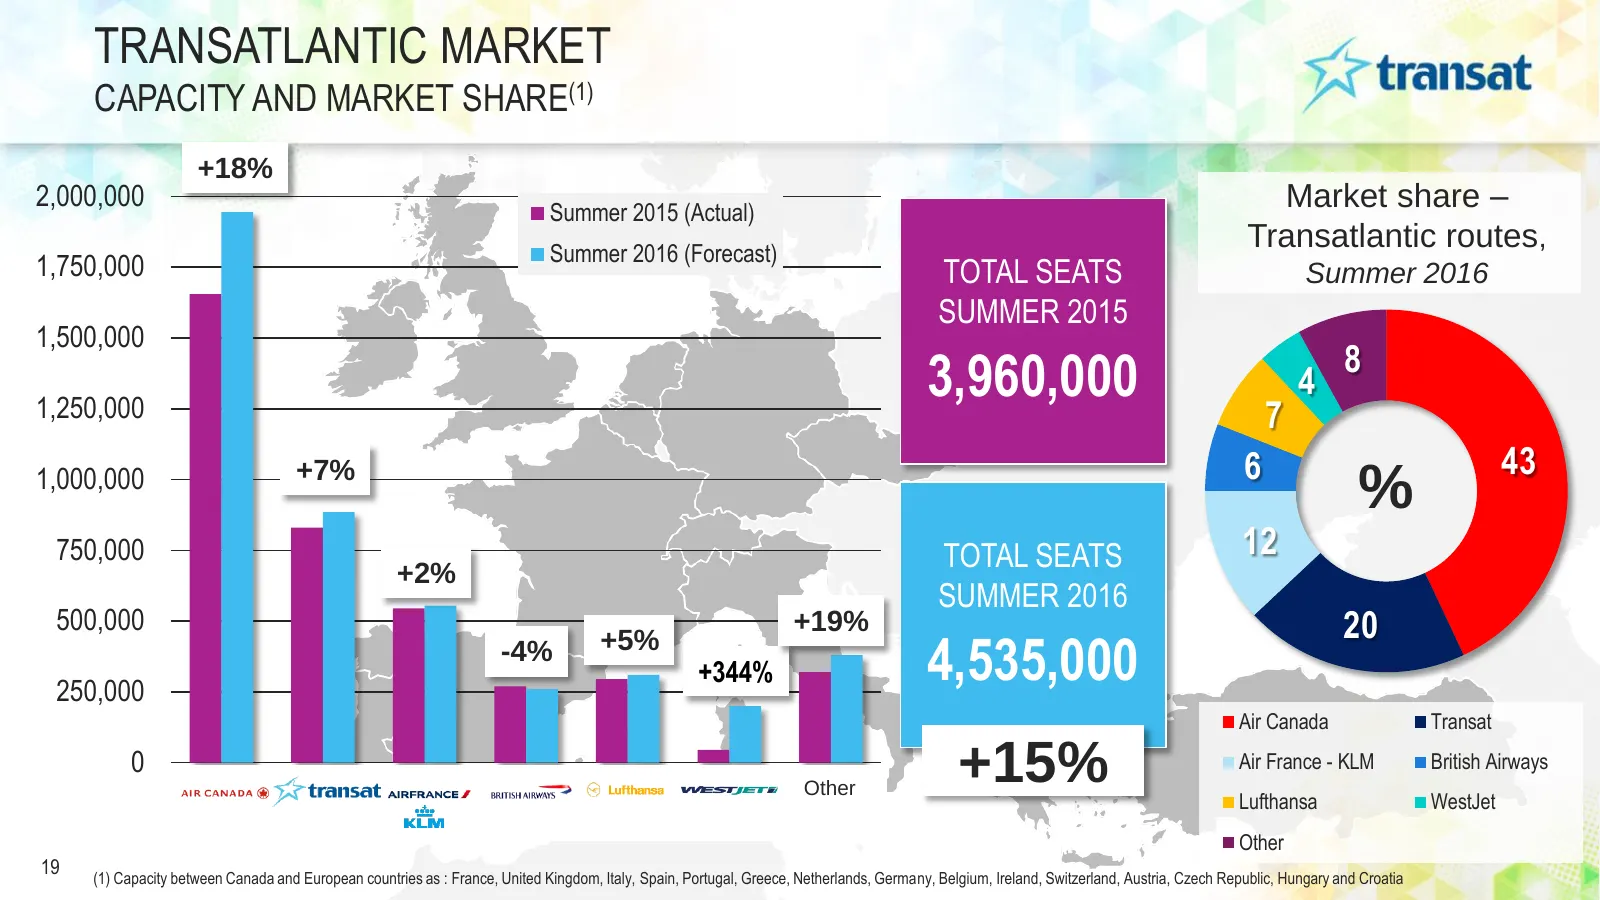
TRANSATLANTIC MARKET CAPACITY AND MARKET SHARE(1) +18% 2,000,000 Summer 2015 (Actual) Market share – Summer 2016 (Forecast) Transatlantic routes, 1,750,000 TOTAL SEATS Summer 2016 SUMMER 2015 1,500,000 8 1,250,000 3,960,000 4 7 1,000,000 +7% 6 43 % 750,000 TOTAL SEATS 12 +2% SUMMER 2016 500,000 +19%
Slide 20: Market Share by Destinations (Summer 2016)
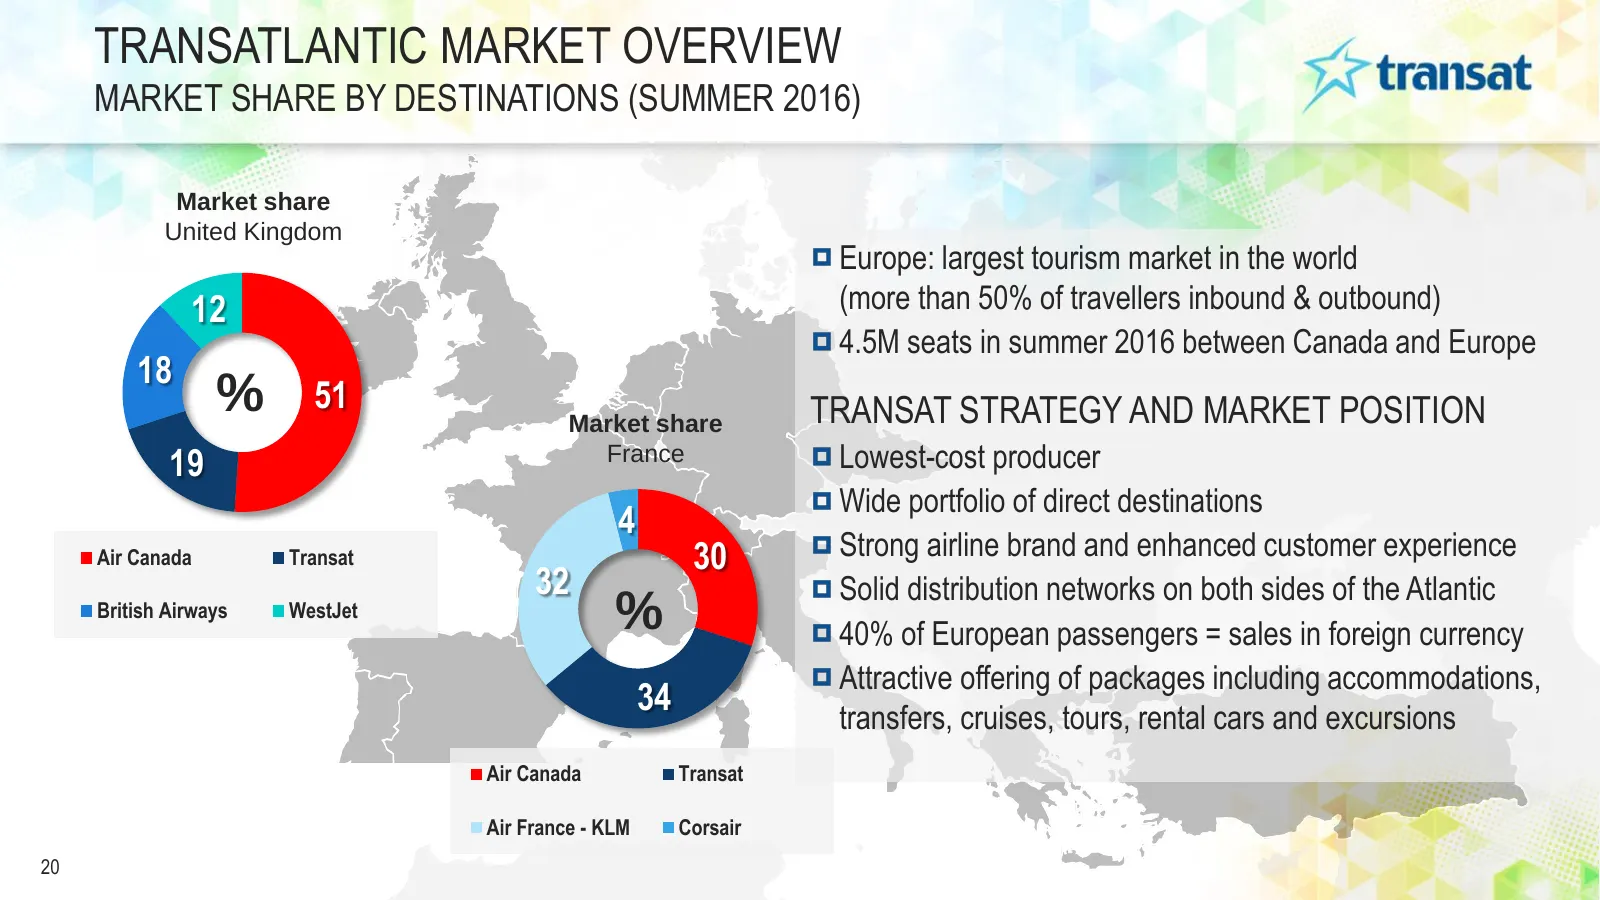
TRANSATLANTIC MARKET OVERVIEW MARKET SHARE BY DESTINATIONS (SUMMER 2016) Market share United Kingdom Europe: largest tourism market in the world 12 (more than 50% of travellers inbound & outbound) 4.5M seats in summer 2016 between Canada and Europe 18 % 51 Market share TRANSAT STRATEGY AND MARKET PO
Slide 21: Transatlantic Recent Performance: Summer Highlights
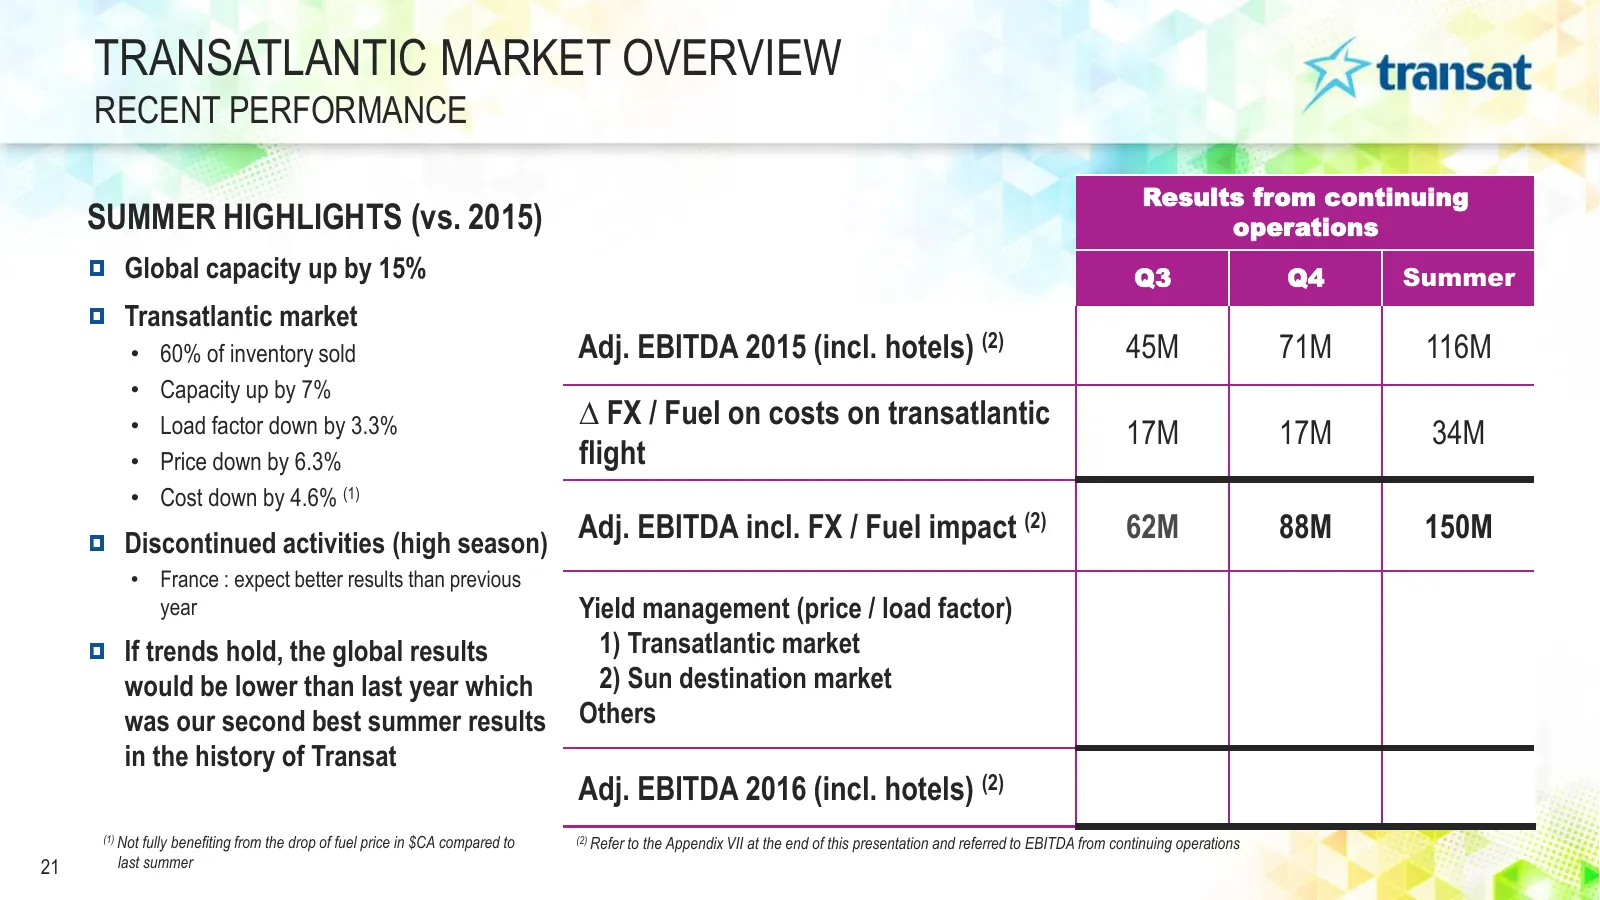
TRANSATLANTIC MARKET OVERVIEW RECENT PERFORMANCE Results from continuing SUMMER HIGHLIGHTS (vs. 2015) operations Global capacity up by 15% Q3 Q4 Summer Transatlantic market • 60% of inventory sold Adj. EBITDA 2015 (incl. hotels) (2) 45M 71M 116M • Capacity up by 7% • Load factor down by 3.3% ∆ FX /
Slide 22: Ancillary Revenues
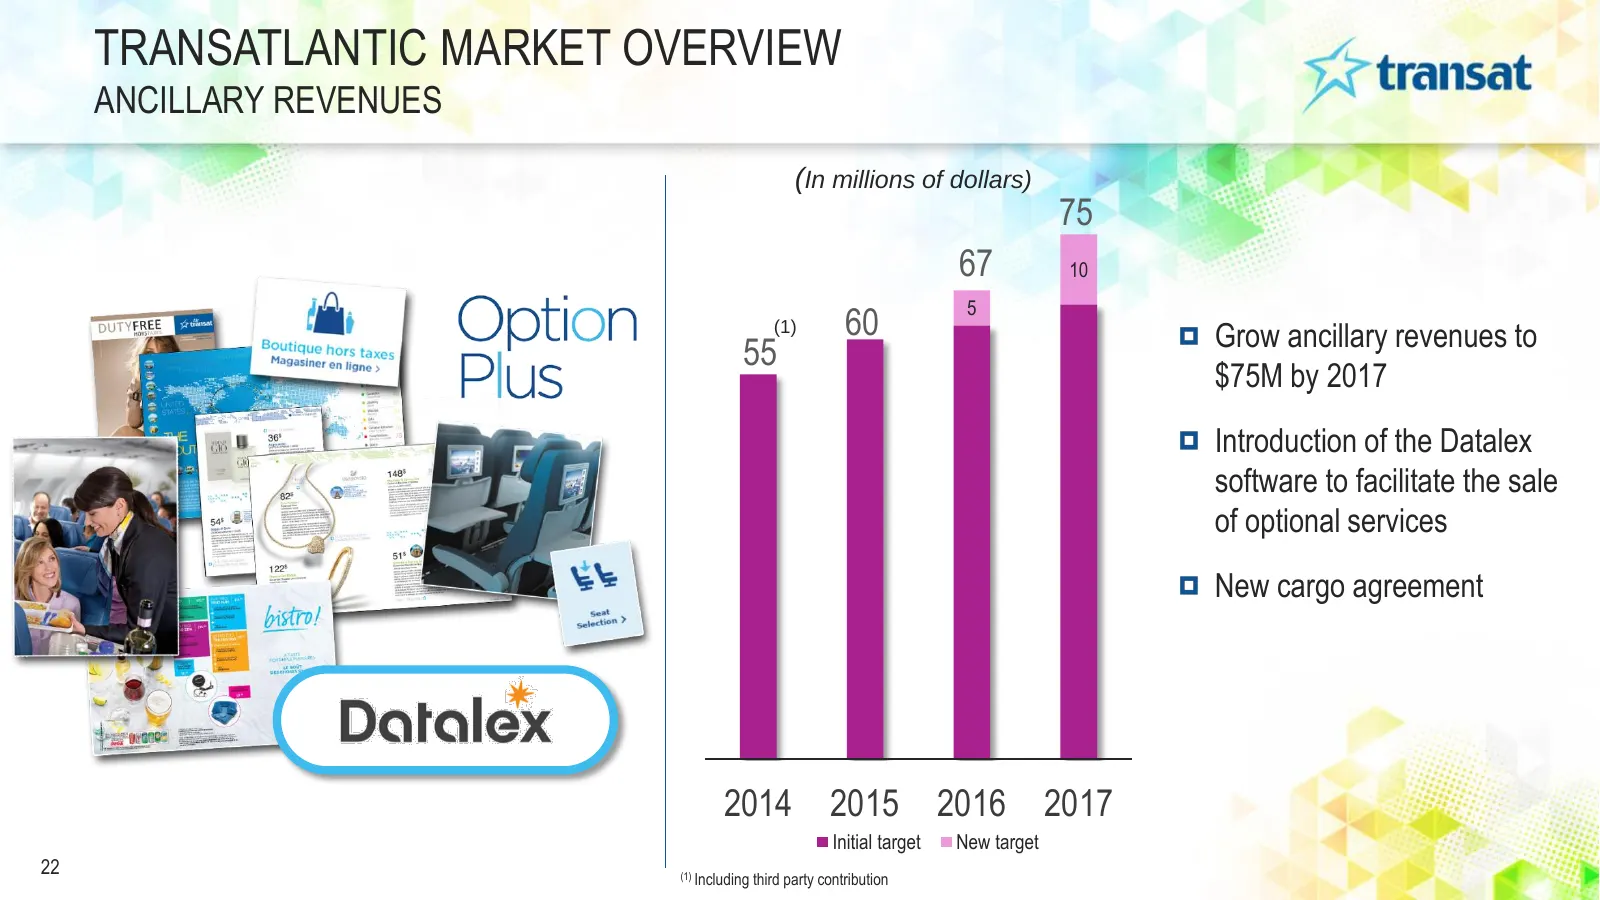
TRANSATLANTIC MARKET OVERVIEW ANCILLARY REVENUES (In millions of dollars) 75 67 10 5 (1) 60 Grow ancillary revenues to 55 $75M by 2017 Introduction of the Datalex software to facilitate the sale of optional services New cargo agreement 2014 2015 2016 2017 Initial target New target 22 (1) Including t
Slide 23: Section 3 – E-Commerce & Distribution Strategy
SECTION 3 – E-COMMERCE & DISTRIBUTION STRATEGY 23
Slide 24: Canada Web + Call Center Results
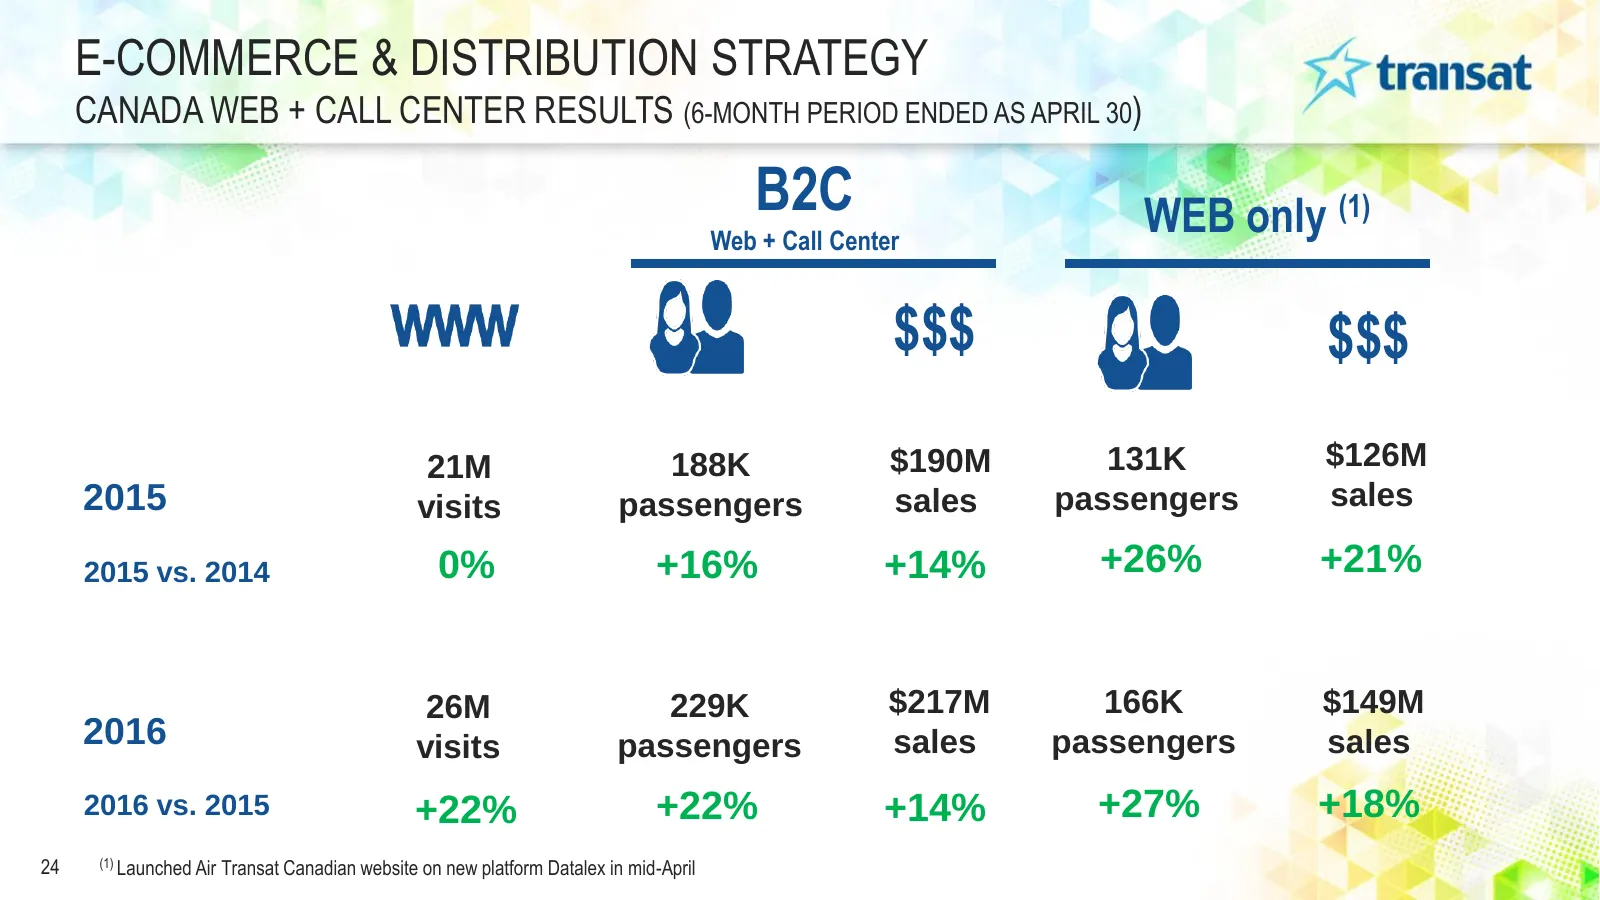
E-COMMERCE & DISTRIBUTION STRATEGY CANADA WEB + CALL CENTER RESULTS (6-MONTH PERIOD ENDED AS APRIL 30) B2C WEB only (1) Web + Call Center $$$ $$$ 21M 188K $190M 131K $126M 2015 visits passengers sales passengers sales 2015 vs. 2014 0% +16% +14% +26% +21% 26M 229K $217M 166K $149M 2016 visits passeng
Slide 25: Renewed Distribution
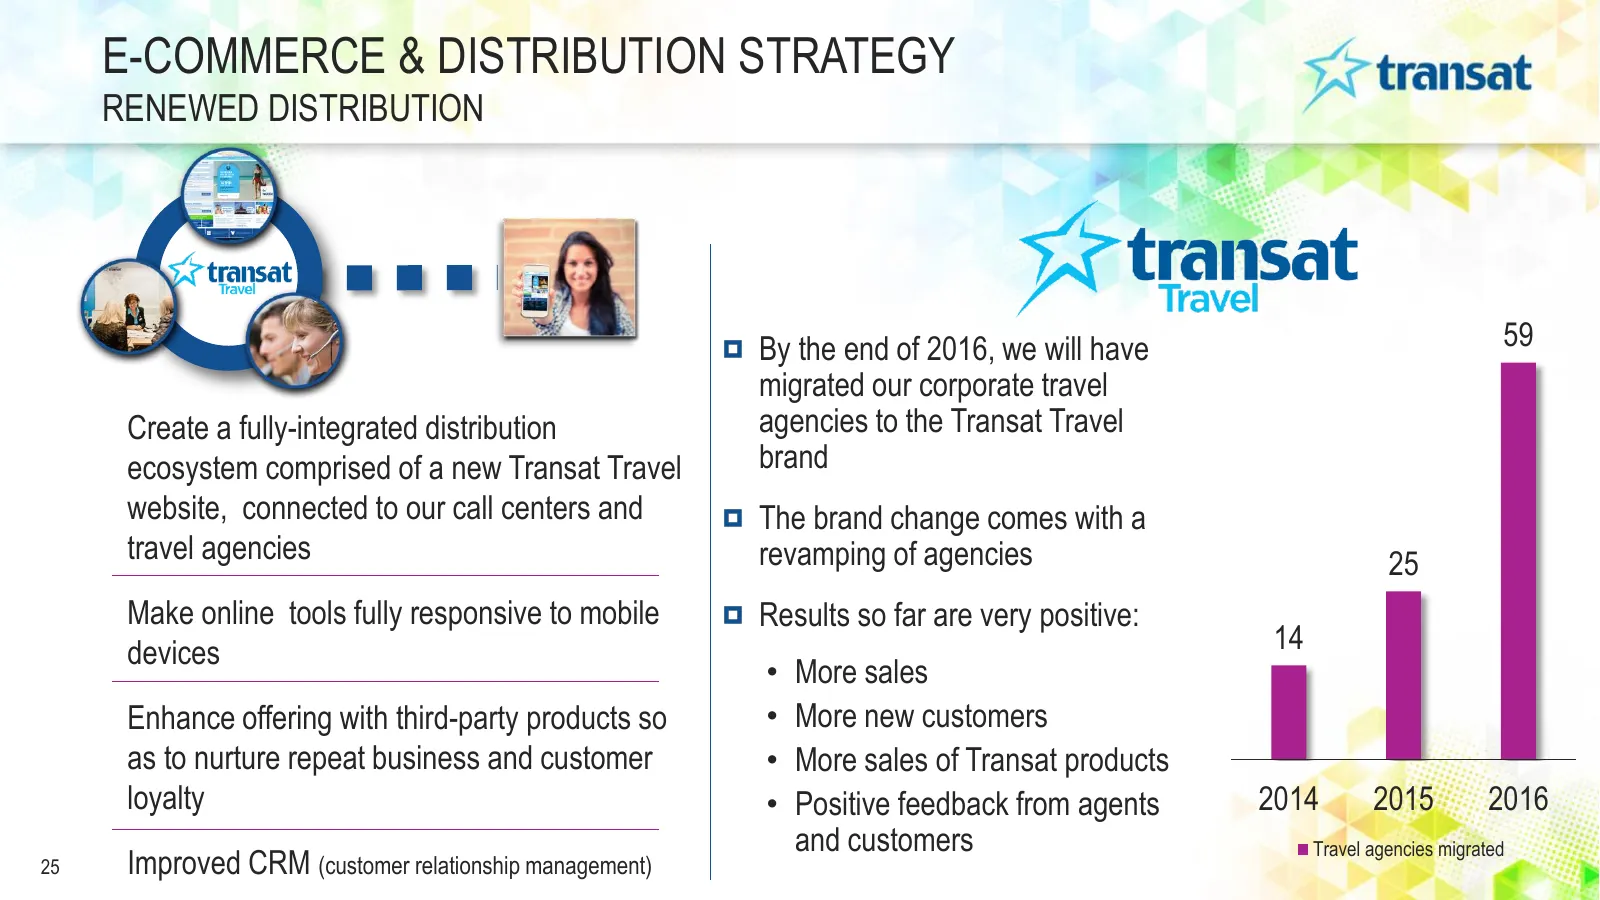
E-COMMERCE & DISTRIBUTION STRATEGY RENEWED DISTRIBUTION By the end of 2016, we will have 59 migrated our corporate travel Create a fully-integrated distribution agencies to the Transat Travel ecosystem comprised of a new Transat Travel brand website, connected to our call centers and The brand chang

Slide 26: Section 4 – Financial Profile
SECTION 4 – FINANCIAL PROFILE 26
Slide 27: Current Financial Position
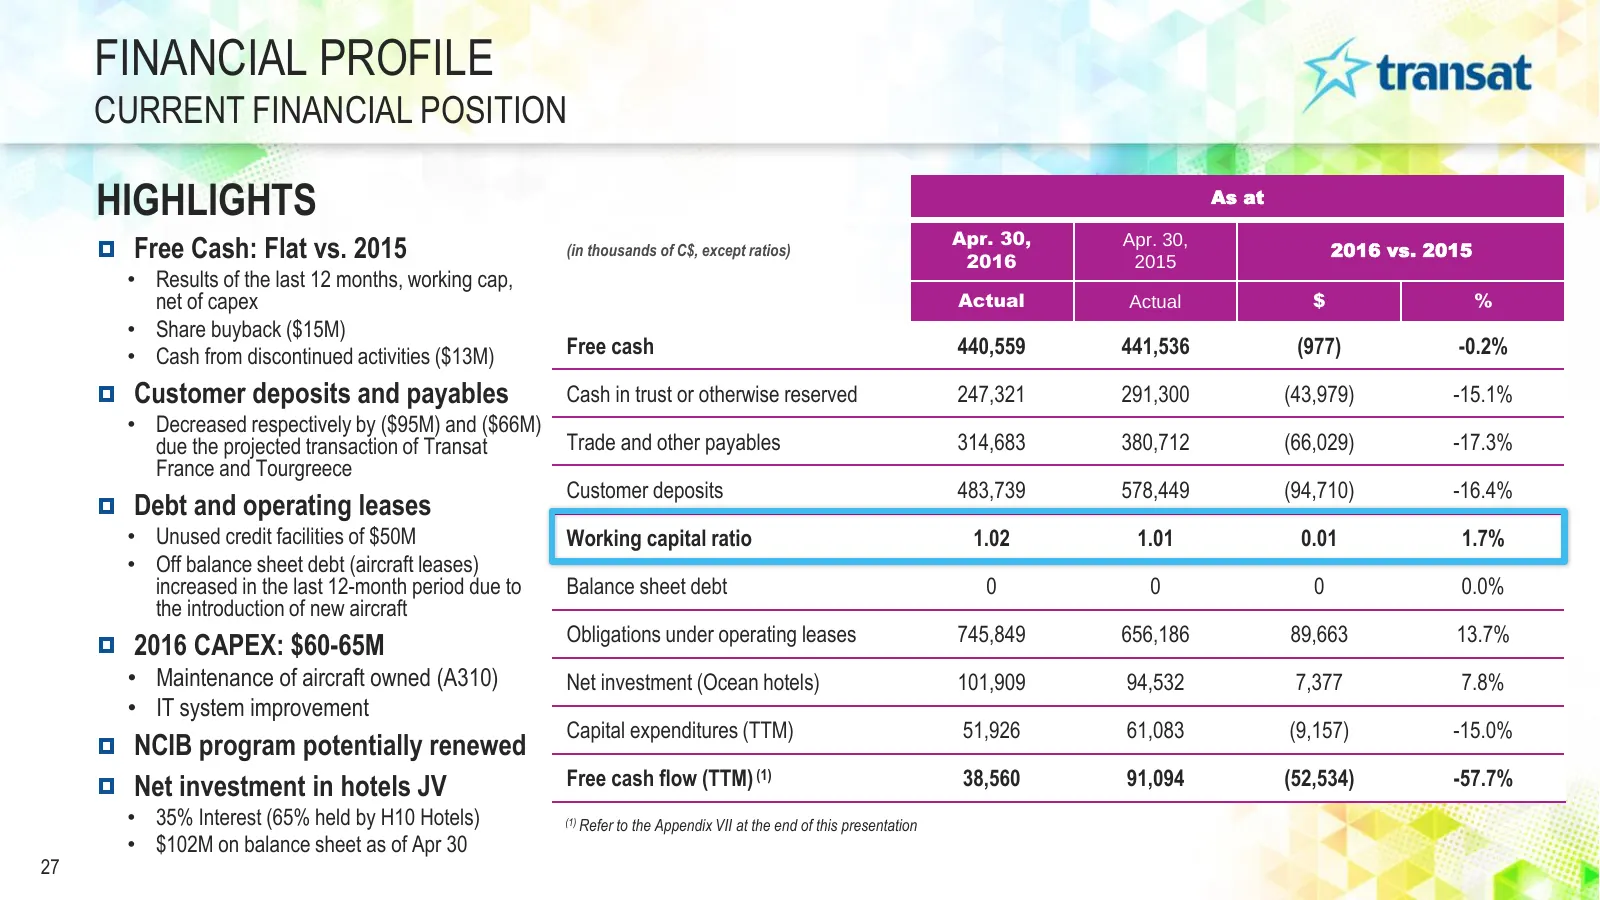
FINANCIAL PROFILE CURRENT FINANCIAL POSITION HIGHLIGHTS As at Apr. 30, Free Cash: Flat vs. 2015 (in thousands of C$, except ratios) 2016 Apr. 30, 2015 2016 vs. 2015 • Results of the last 12 months, working cap, net of capex Actual Actual $ % • Share buyback ($15M) • Cash from discontinued activities
Slide 28: Consolidated Recent Performance
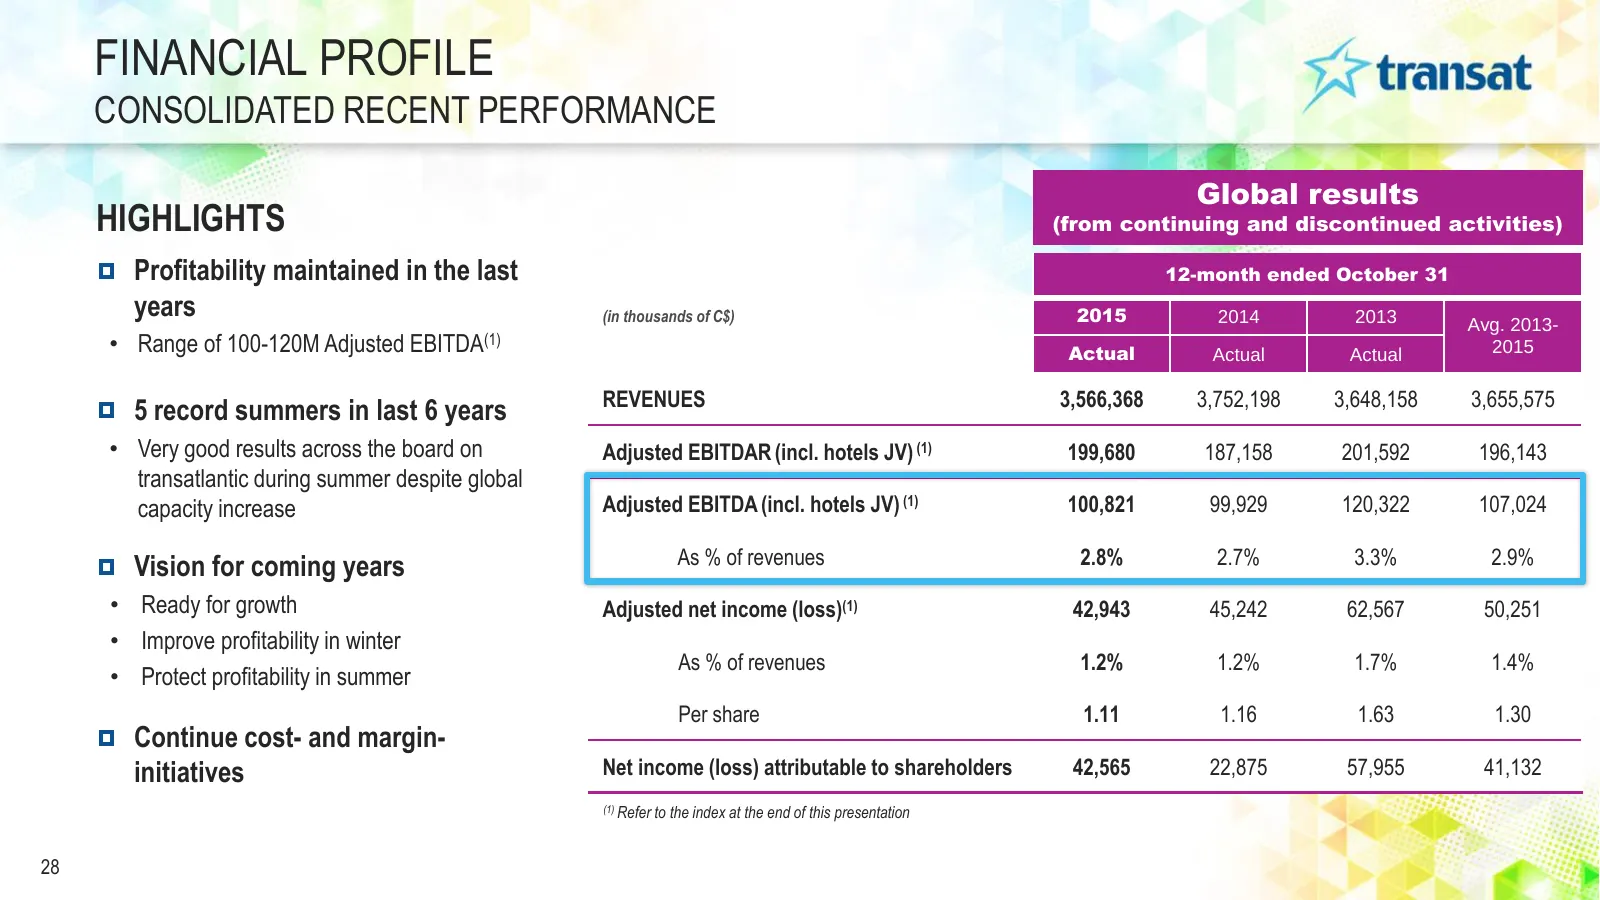
FINANCIAL PROFILE CONSOLIDATED RECENT PERFORMANCE Global results HIGHLIGHTS (from continuing and discontinued activities) Profitability maintained in the last 12-month ended October 31 years (in thousands of C$) 2015 2014 2013 Avg. 2013- • Range of 100-120M Adjusted EBITDA(1) Actual Actual Actual 20
Slide 29: Trading Comparables (Valuation Metrics)
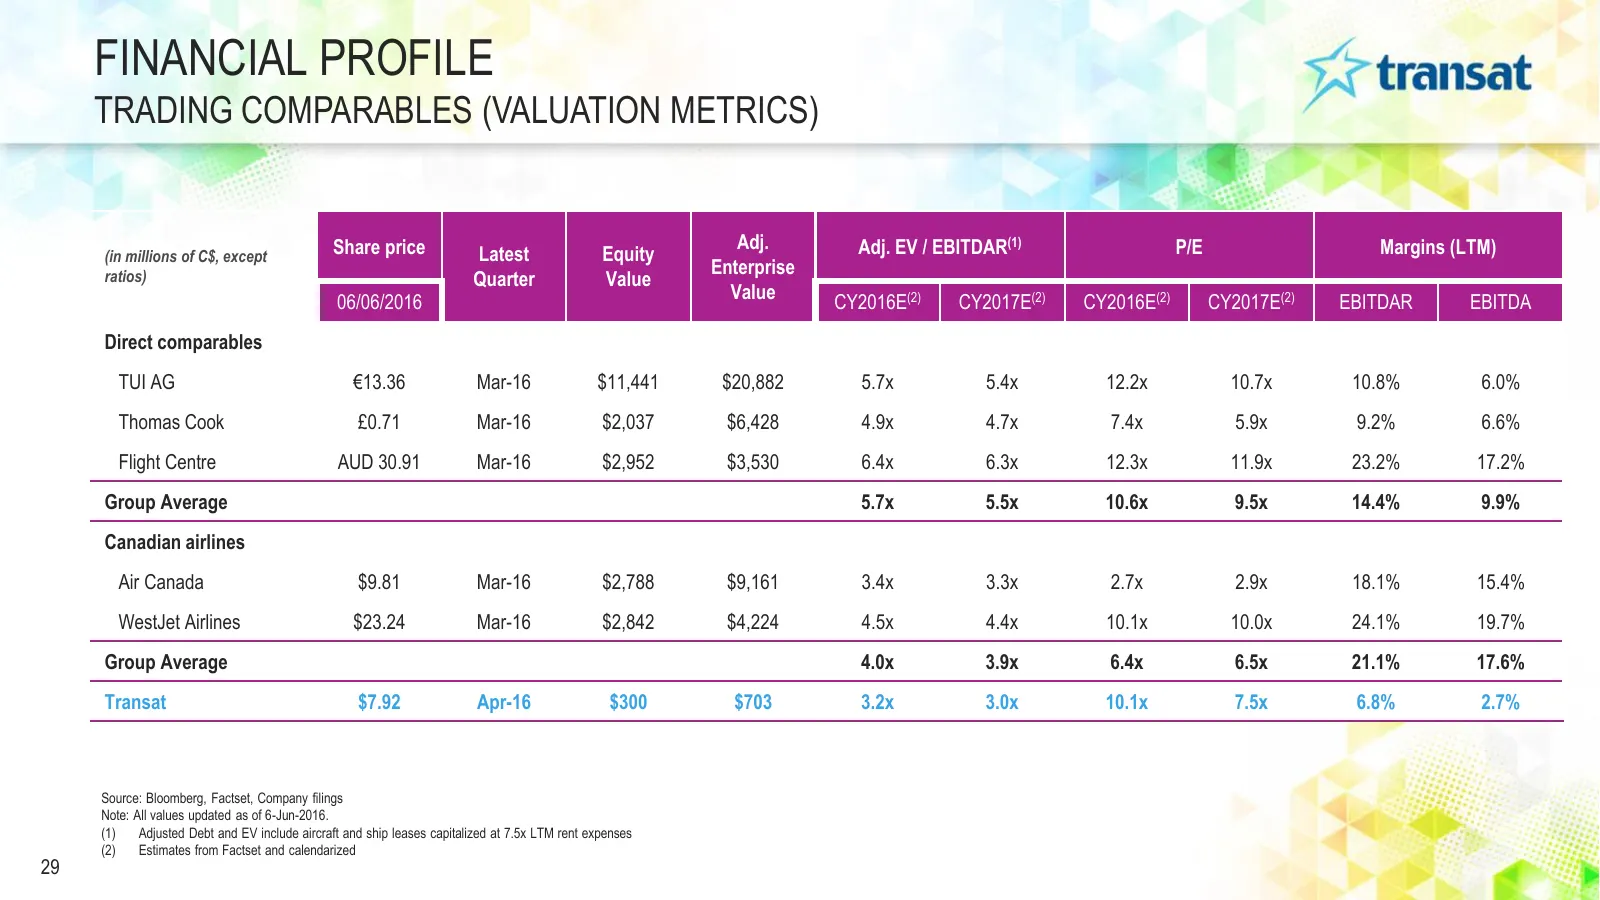
FINANCIAL PROFILE TRADING COMPARABLES (VALUATION METRICS) Share price Adj. Adj. EV / EBITDAR(1) P/E Margins (LTM) (in millions of C$, except Latest Equity ratios) Enterprise Quarter Value 06/06/2016 Value CY2016E(2) CY2017E(2) CY2016E(2) CY2017E(2) EBITDAR EBITDA Direct comparables TUI AG €13.36 Mar
Slide 30: Trading Comparables (Capital Structure)
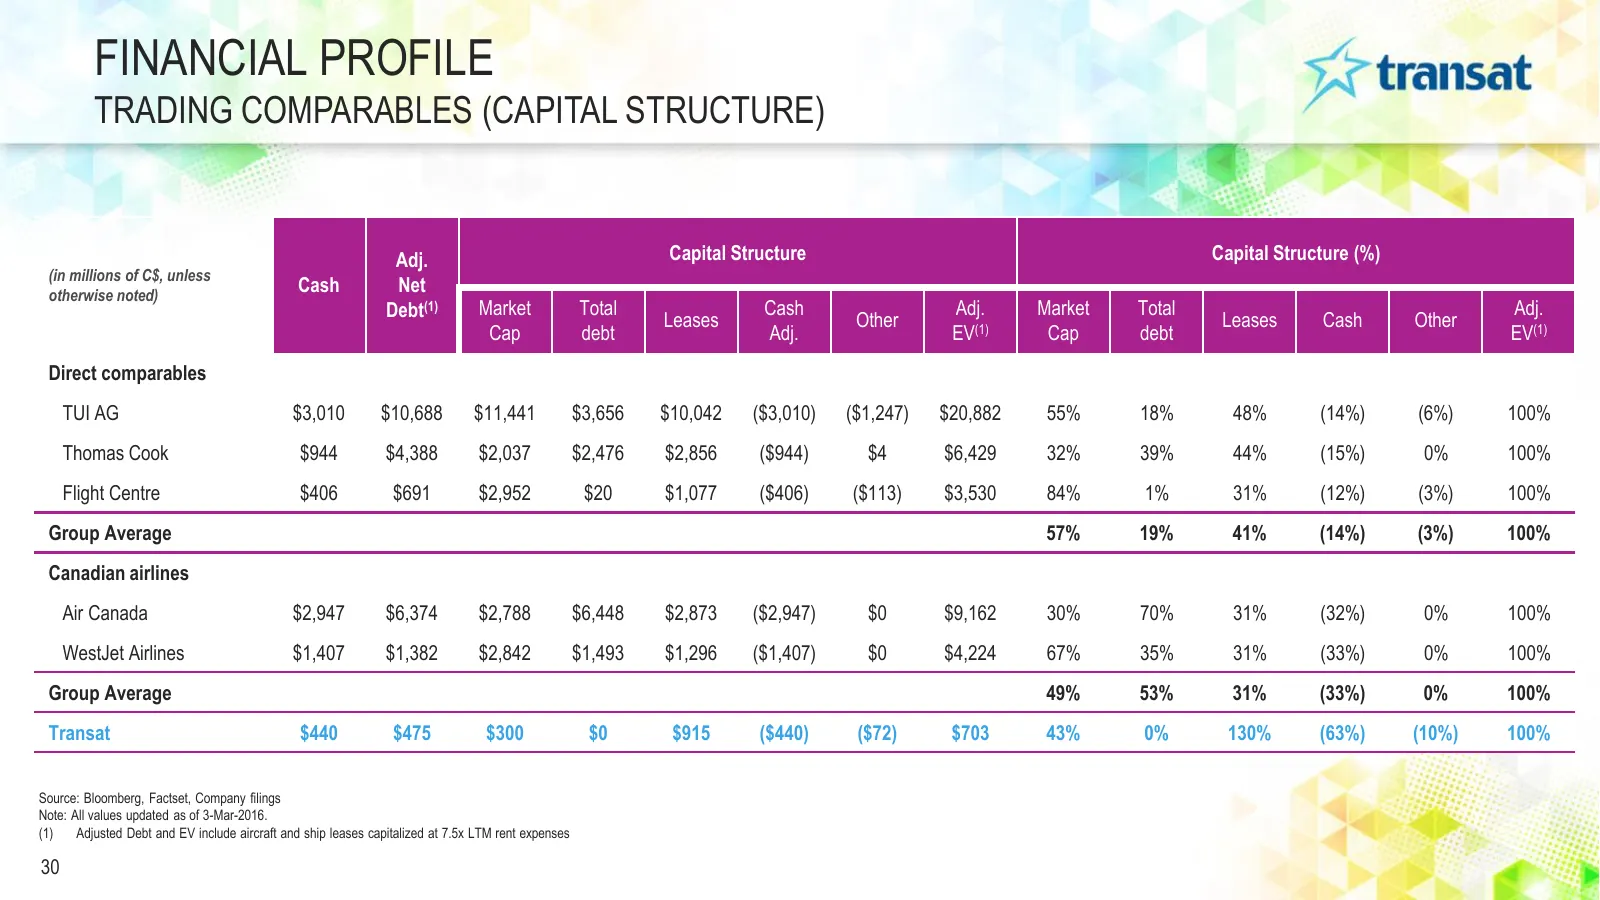
FINANCIAL PROFILE TRADING COMPARABLES (CAPITAL STRUCTURE) Adj. Capital Structure Capital Structure (%) (in millions of C$, unless otherwise noted) Cash Net Debt(1) Market Total Cash Adj. Market Total Adj. Leases Other Leases Cash Other Cap debt Adj. EV(1) Cap debt EV(1) Direct comparables TUI AG $3,
Slide 31: Appendix
tees y NP8ate Bienvenido. Villkonamen geldiniz BED VENUE |
Slide 32: Appendix I: Winter Financial Results
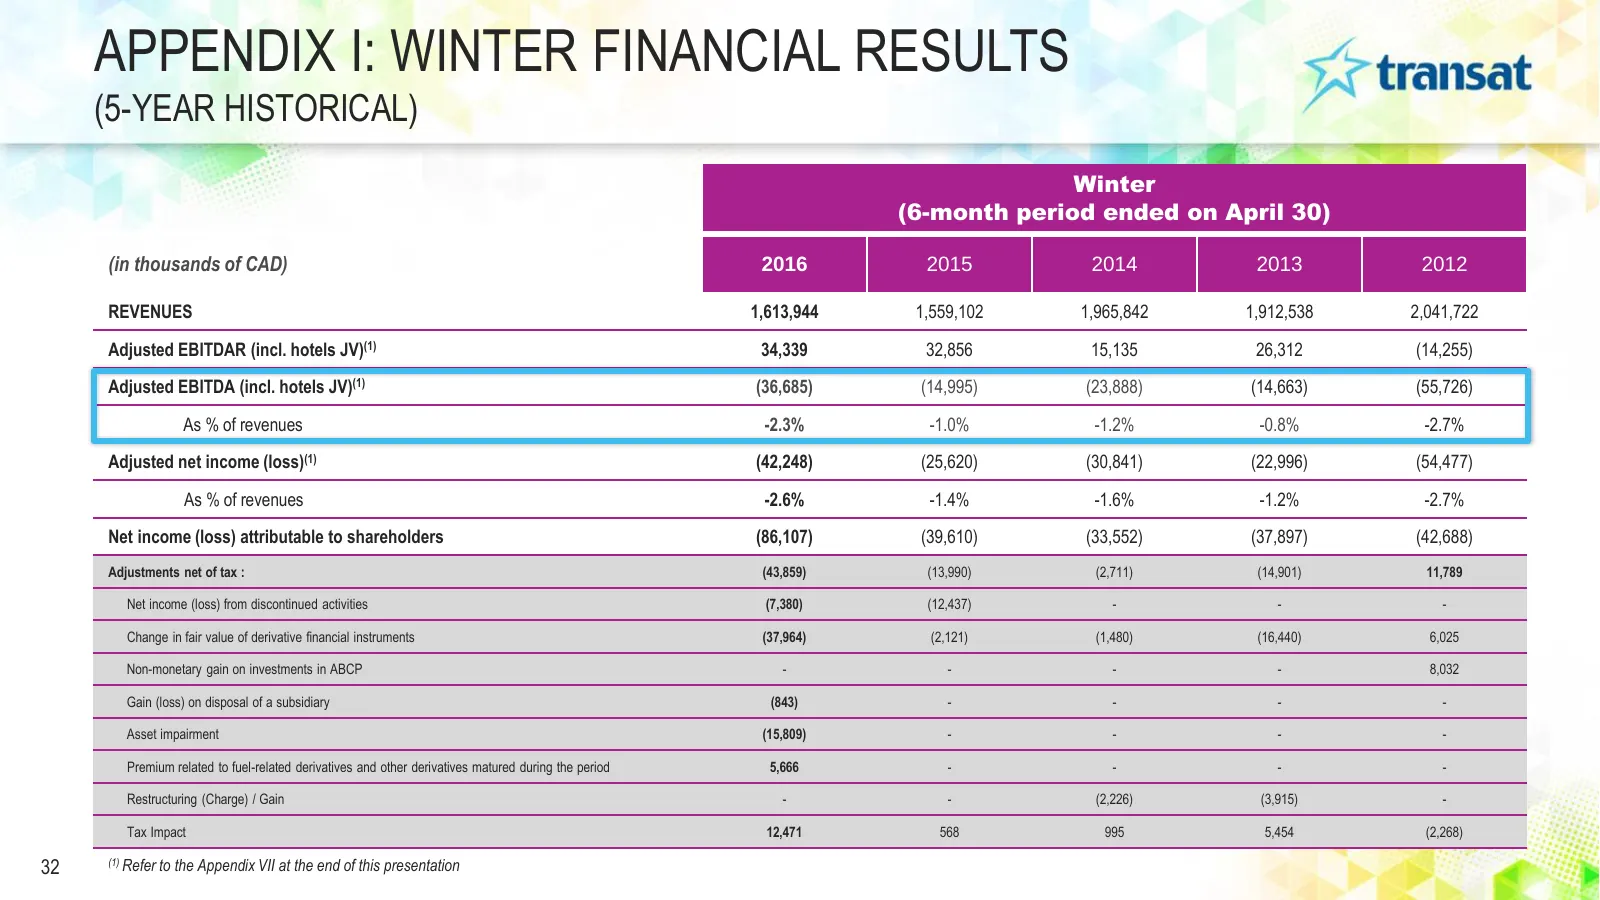
APPENDIX I: WINTER FINANCIAL RESULTS (5-YEAR HISTORICAL) Winter (6-month period ended on April 30) (in thousands of CAD) 2016 2015 2014 2013 2012 REVENUES 1,613,944 1,559,102 1,965,842 1,912,538 2,041,722 Adjusted EBITDAR (incl. hotels JV)(1) 34,339 32,856 15,135 26,312 (14,255) Adjusted EBITDA (inc
Slide 33: Appendix II: Summer Financial Results
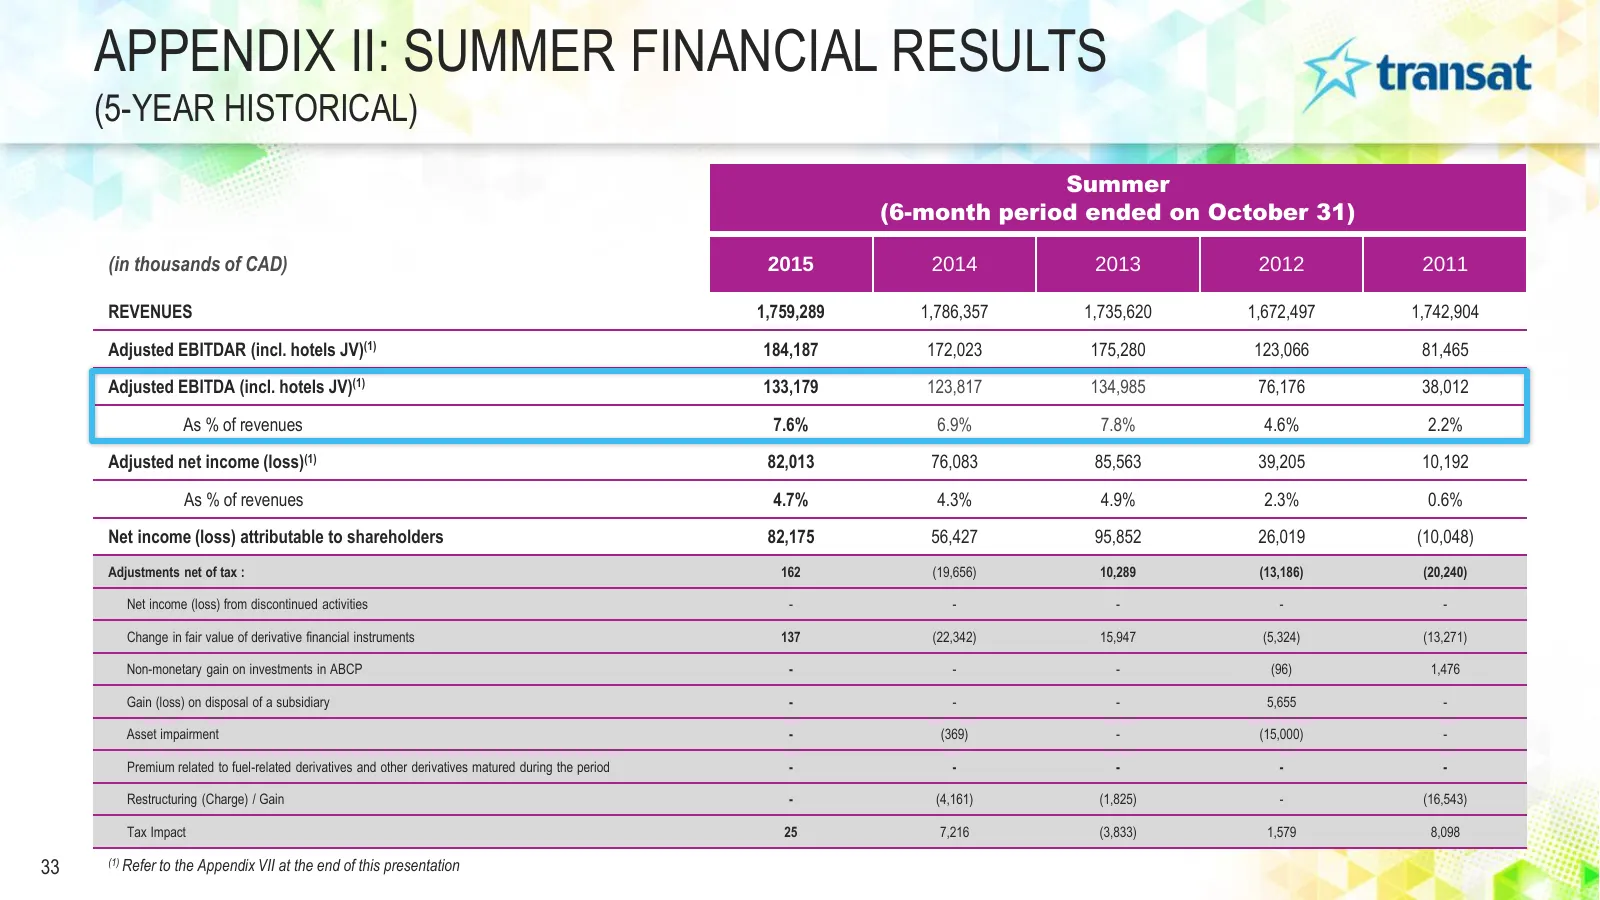
APPENDIX II: SUMMER FINANCIAL RESULTS (5-YEAR HISTORICAL) Summer (6-month period ended on October 31) (in thousands of CAD) 2015 2014 2013 2012 2011 REVENUES 1,759,289 1,786,357 1,735,620 1,672,497 1,742,904 Adjusted EBITDAR (incl. hotels JV)(1) 184,187 172,023 175,280 123,066 81,465 Adjusted EBITDA
Slide 34: Appendix III: Annual Financial Results
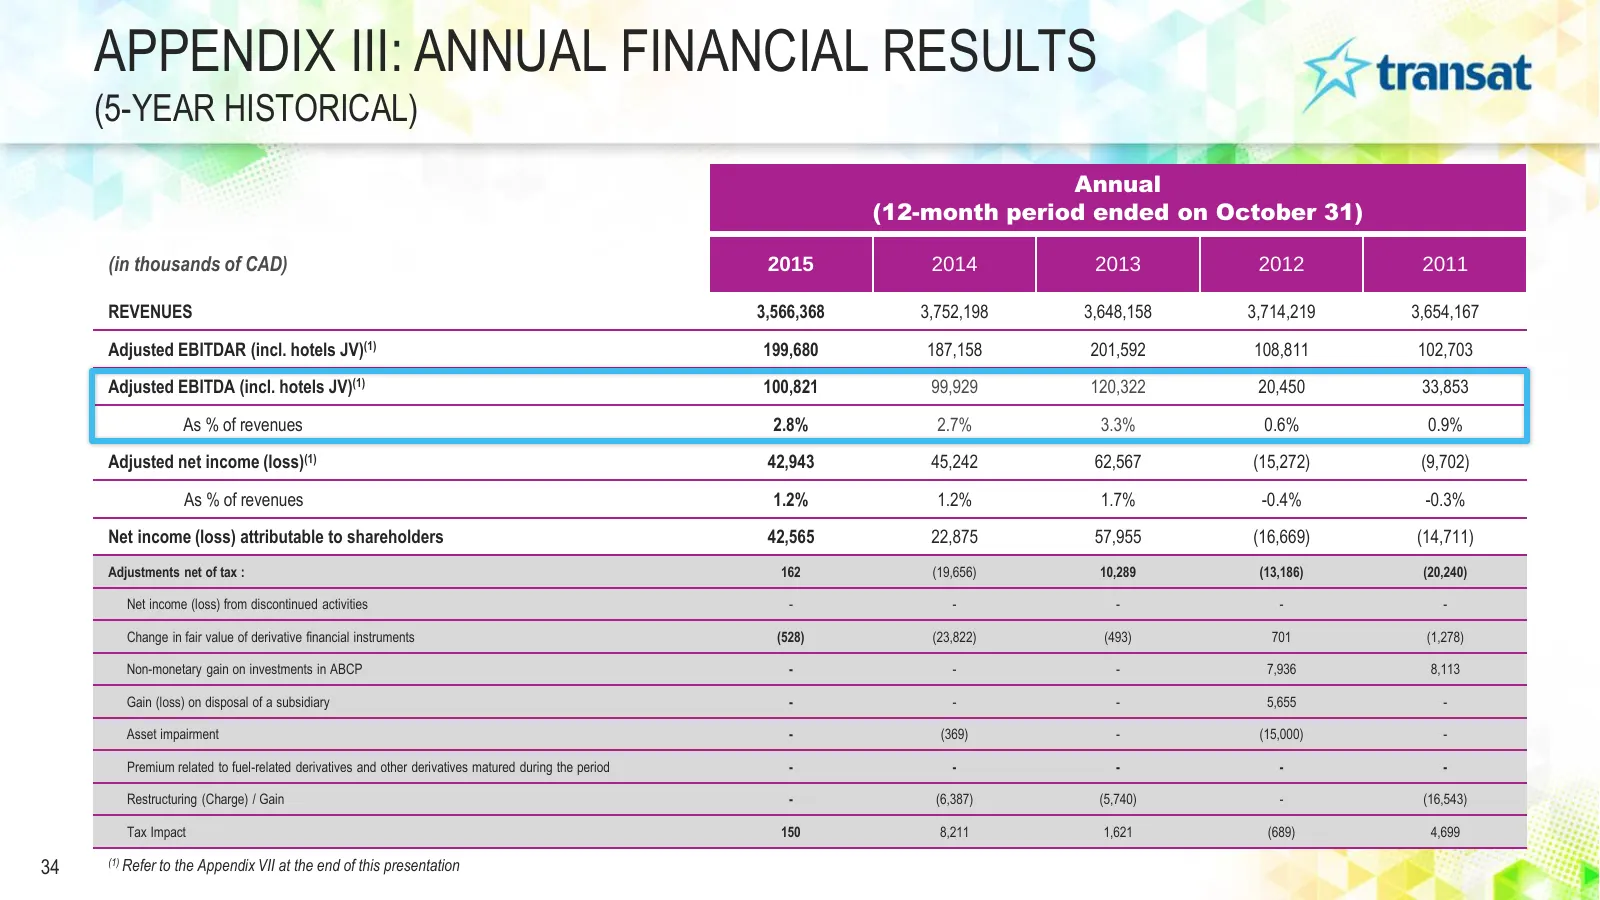
APPENDIX III: ANNUAL FINANCIAL RESULTS (5-YEAR HISTORICAL) Annual (12-month period ended on October 31) (in thousands of CAD) 2015 2014 2013 2012 2011 REVENUES 3,566,368 3,752,198 3,648,158 3,714,219 3,654,167 Adjusted EBITDAR (incl. hotels JV)(1) 199,680 187,158 201,592 108,811 102,703 Adjusted EBI
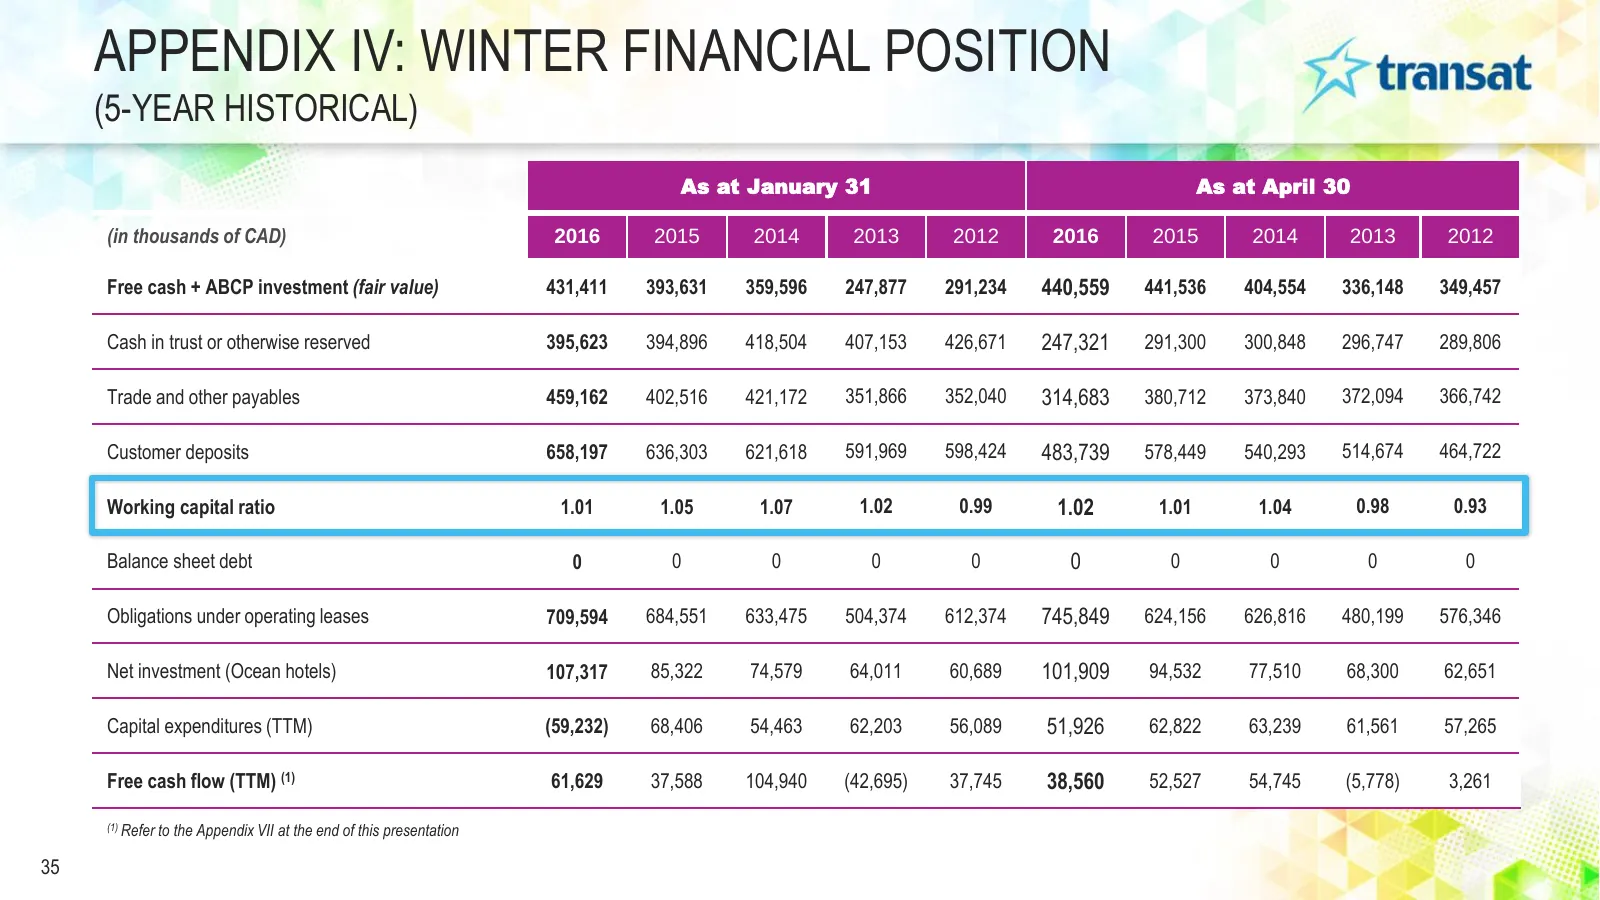
Slide 35: Appendix IV: Winter Financial Position
APPENDIX IV: WINTER FINANCIAL POSITION (5-YEAR HISTORICAL) As at January 31 As at April 30 (in thousands of CAD) 2016 2015 2014 2013 2012 2016 2015 2014 2013 2012 Free cash + ABCP investment (fair value) 431,411 393,631 359,596 247,877 291,234 440,559 441,536 404,554 336,148 349,457 Cash in trust or
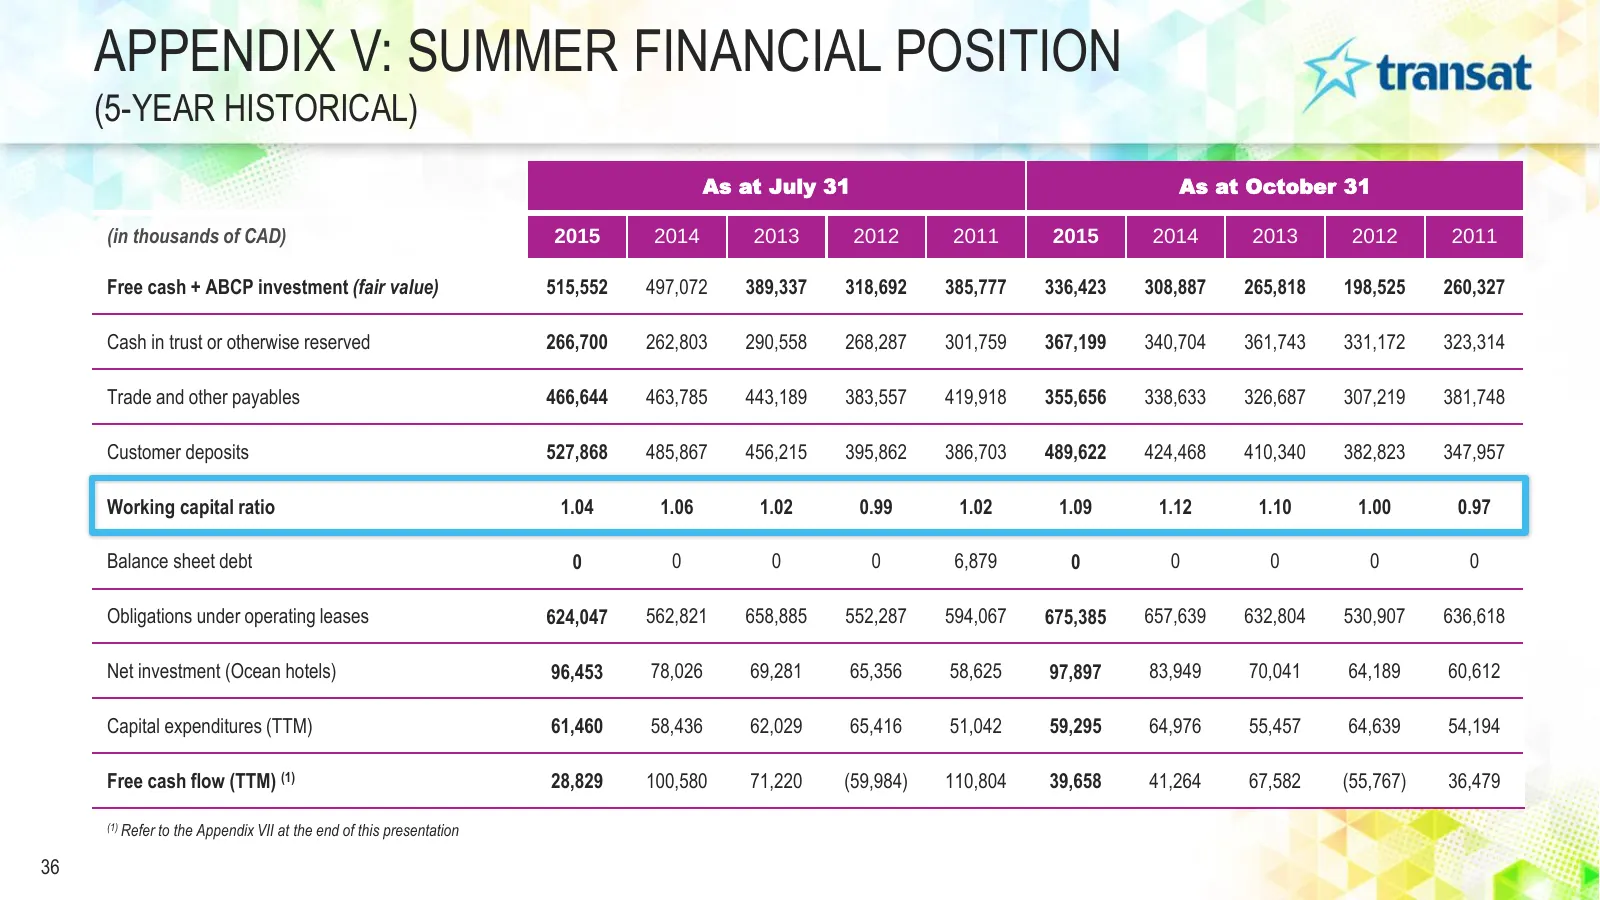
Slide 36: Appendix V: Summer Financial Position
APPENDIX V: SUMMER FINANCIAL POSITION (5-YEAR HISTORICAL) As at July 31 As at October 31 (in thousands of CAD) 2015 2014 2013 2012 2011 2015 2014 2013 2012 2011 Free cash + ABCP investment (fair value) 515,552 497,072 389,337 318,692 385,777 336,423 308,887 265,818 198,525 260,327 Cash in trust or o
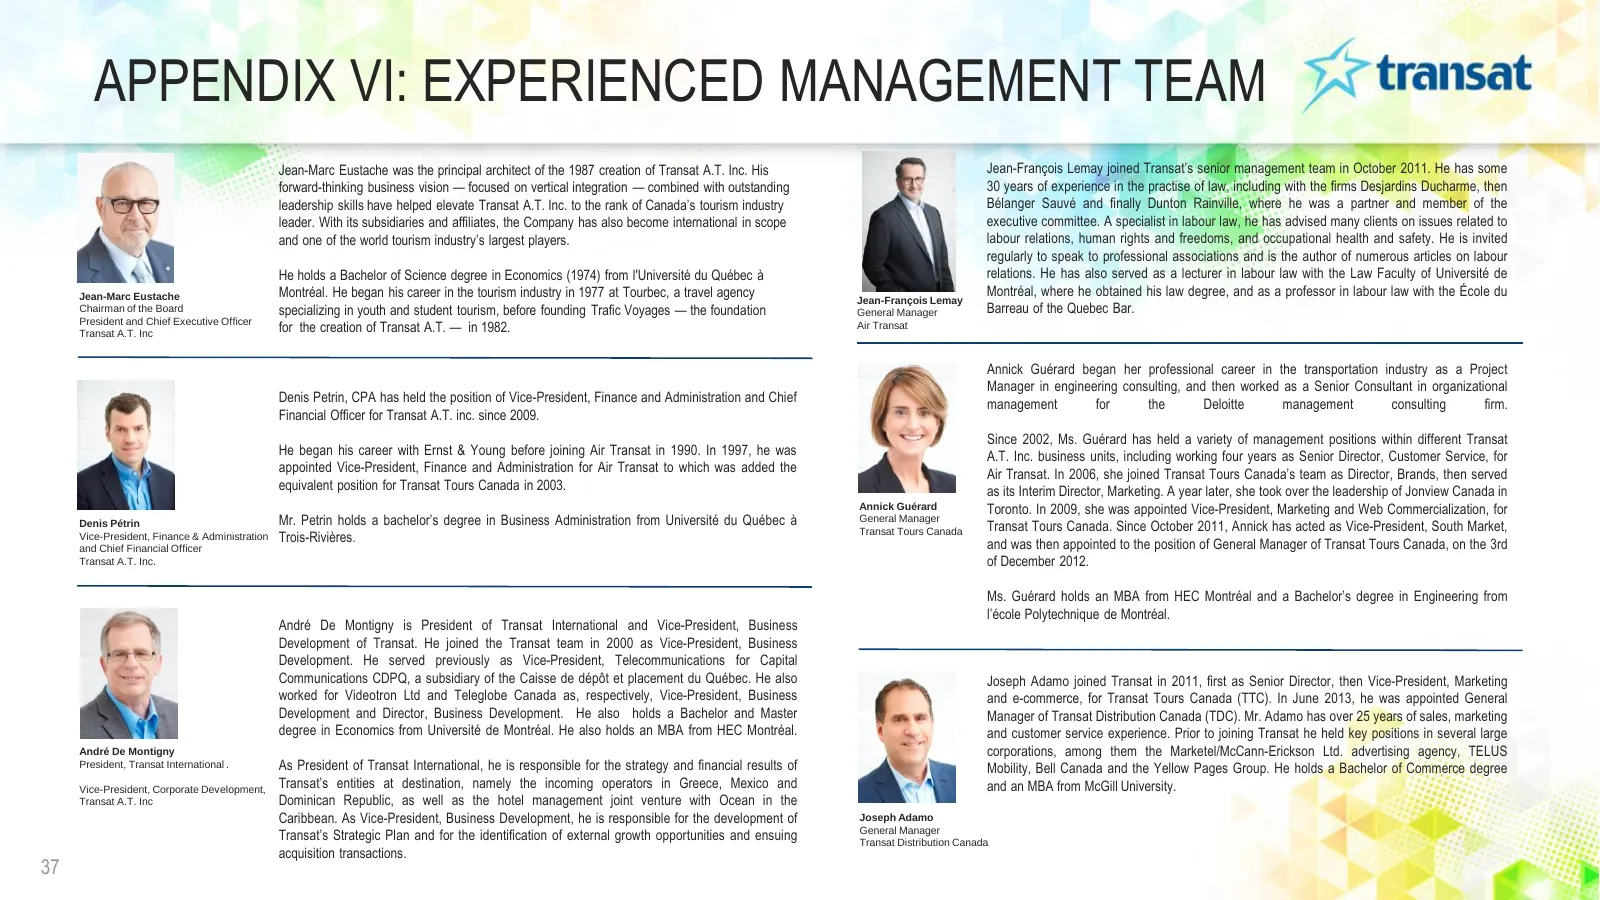
Slide 37: Appendix VI: Experienced Management Team
APPENDIX VI: EXPERIENCED MANAGEMENT TEAM Jean-Marc Eustache was the principal architect of the 1987 creation of Transat A.T. Inc. His Jean-François Lemay joined Transat’s senior management team in October 2011. He has some forward-thinking business vision — focused on vertical integration — combined
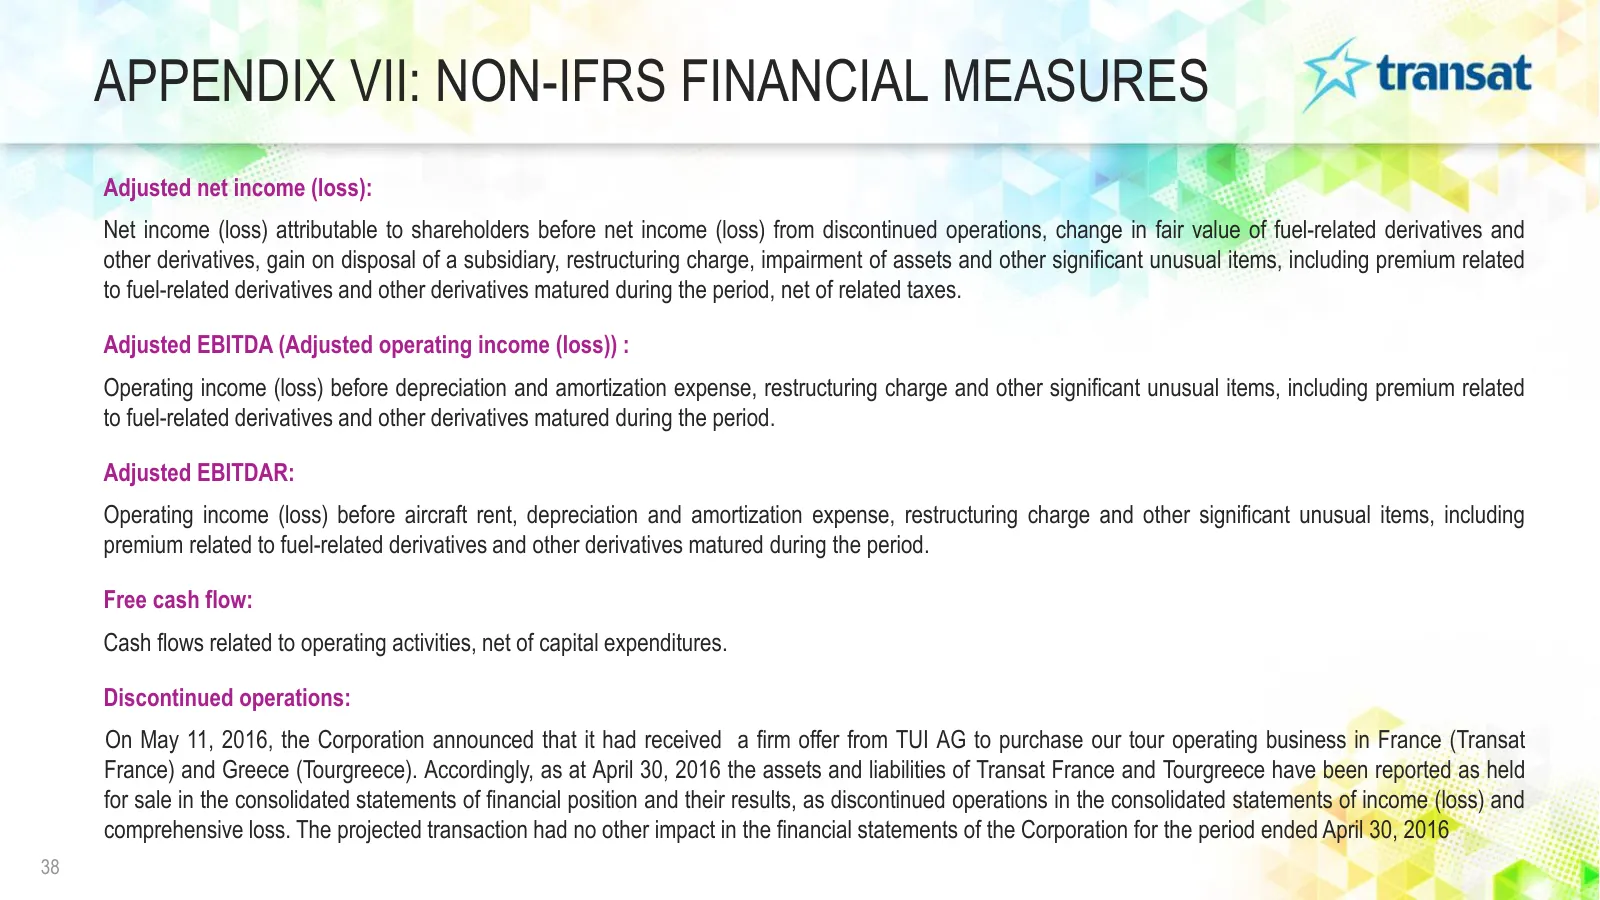
Slide 38: Appendix VII: Non-IFRS Financial Measures
APPENDIX VII: NON-IFRS FINANCIAL MEASURES Adjusted net income (loss): Net income (loss) attributable to shareholders before net income (loss) from discontinued operations, change in fair value of fuel-related derivatives and other derivatives, gain on disposal of a subsidiary, restructuring charge,
Slide 39: Thank You
THANK YOU BUILDING PLATFORM FOR PROFITABILITY AND GROWTH
Source: Internet Archive copy of transat.com
More decks from Transat A.T. Inc.
 Q3 2026 Earnings Presentation14 slides · Sep 10, 2026
 Q1 2026 Earnings Presentation15 slides · Mar 10, 2026
 Q4 2025 Earnings Presentation16 slides · Dec 18, 2025
 Q3 2025 Earnings Presentation16 slides · Sep 11, 2025
 Q1 2024 Earnings Presentation19 slides · March 2024
 Q4 2023 Earnings Presentation20 slides · December 2023