Meiko Electronics Co., Ltd. · TSE:6787
Meiko Electronics — Q1 FY2026 Earnings Presentation
5 slides from Meiko Electronics's earnings presentation, Aug 6, 2026
Slide 1: FY2026 Q1 Financial Results Briefing
FY2026 Q1 Financial Results Briefing Aug 6, 2026 (Securities Identification Code: 6787)
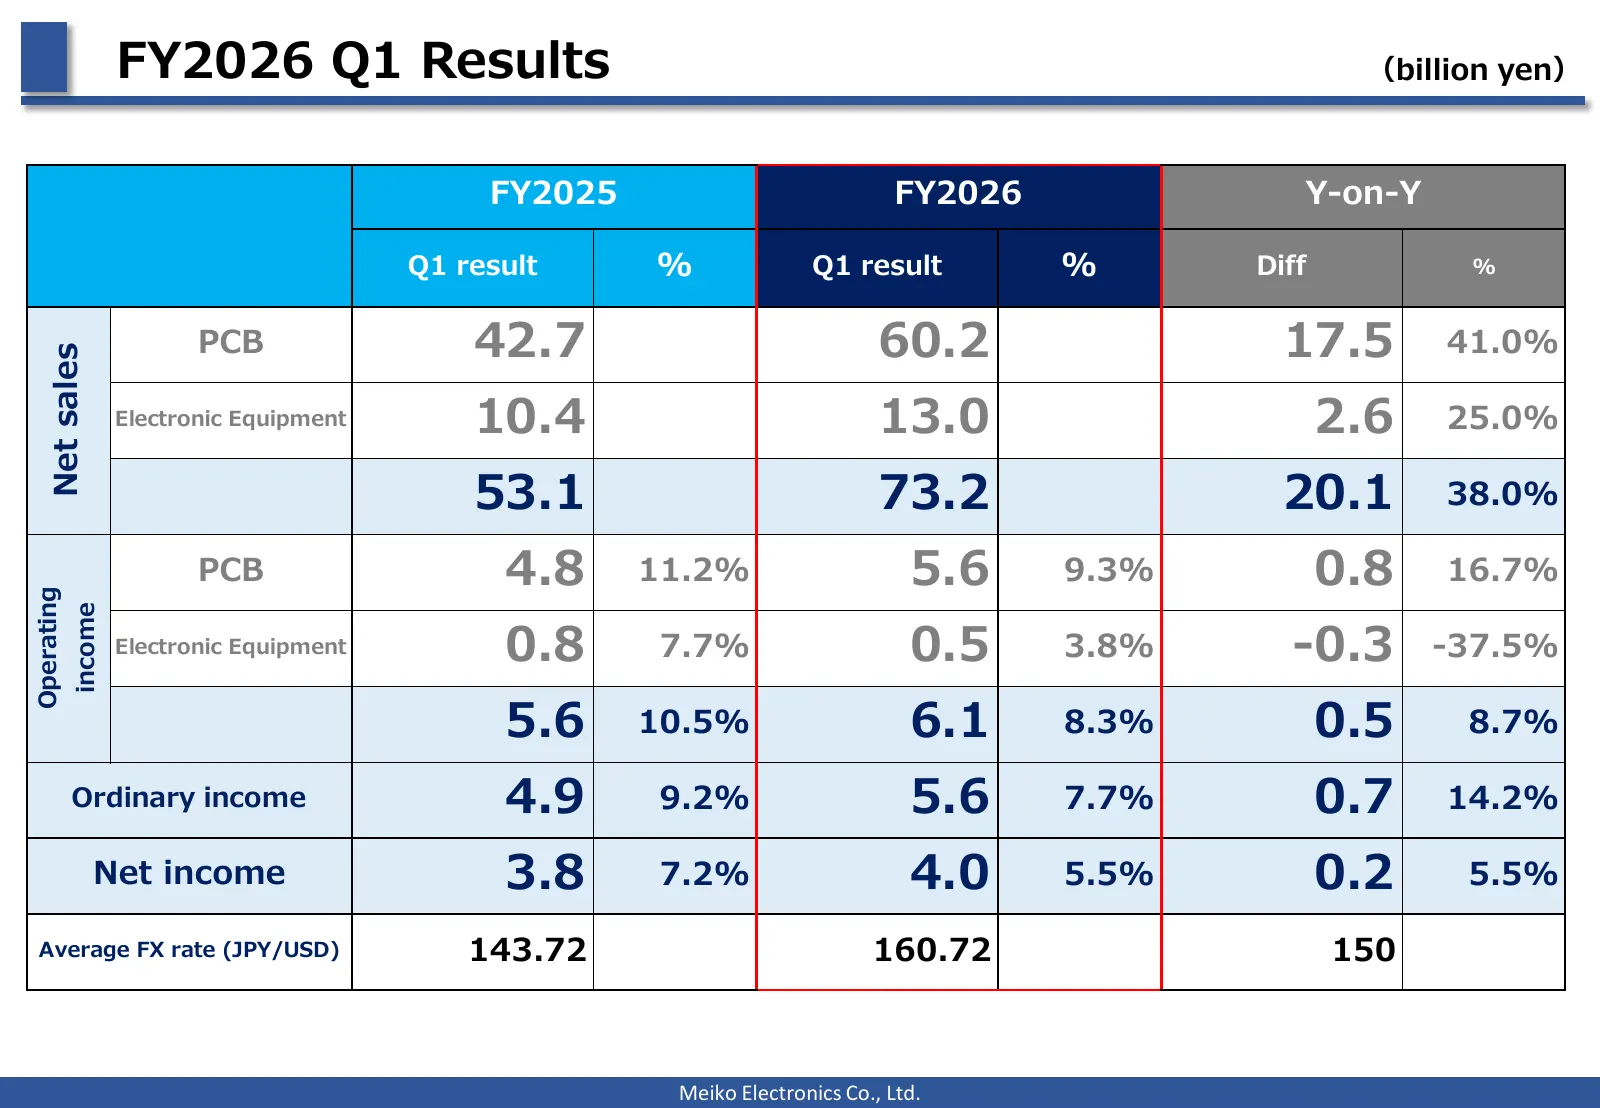
Slide 2: FY2026 Q1 Results
FY2026 Q1 Results (billion yen) FY2025 FY2026 Y-on-Y Q1 result % Q1 result % Diff % PCB 42.7 60.2 17.5 41.0% Net sales Electronic Equipment 10.4 13.0 2.6 25.0% 53.1 73.2 20.1 38.0% PCB 4.8 11.2% 5.6 9.3% 0.8 16.7% Operating income Electronic Equipment 0.8 7.7% 0.5 3.8% -0.3 -37.5% 5.6 10.5% 6.1 8.3%
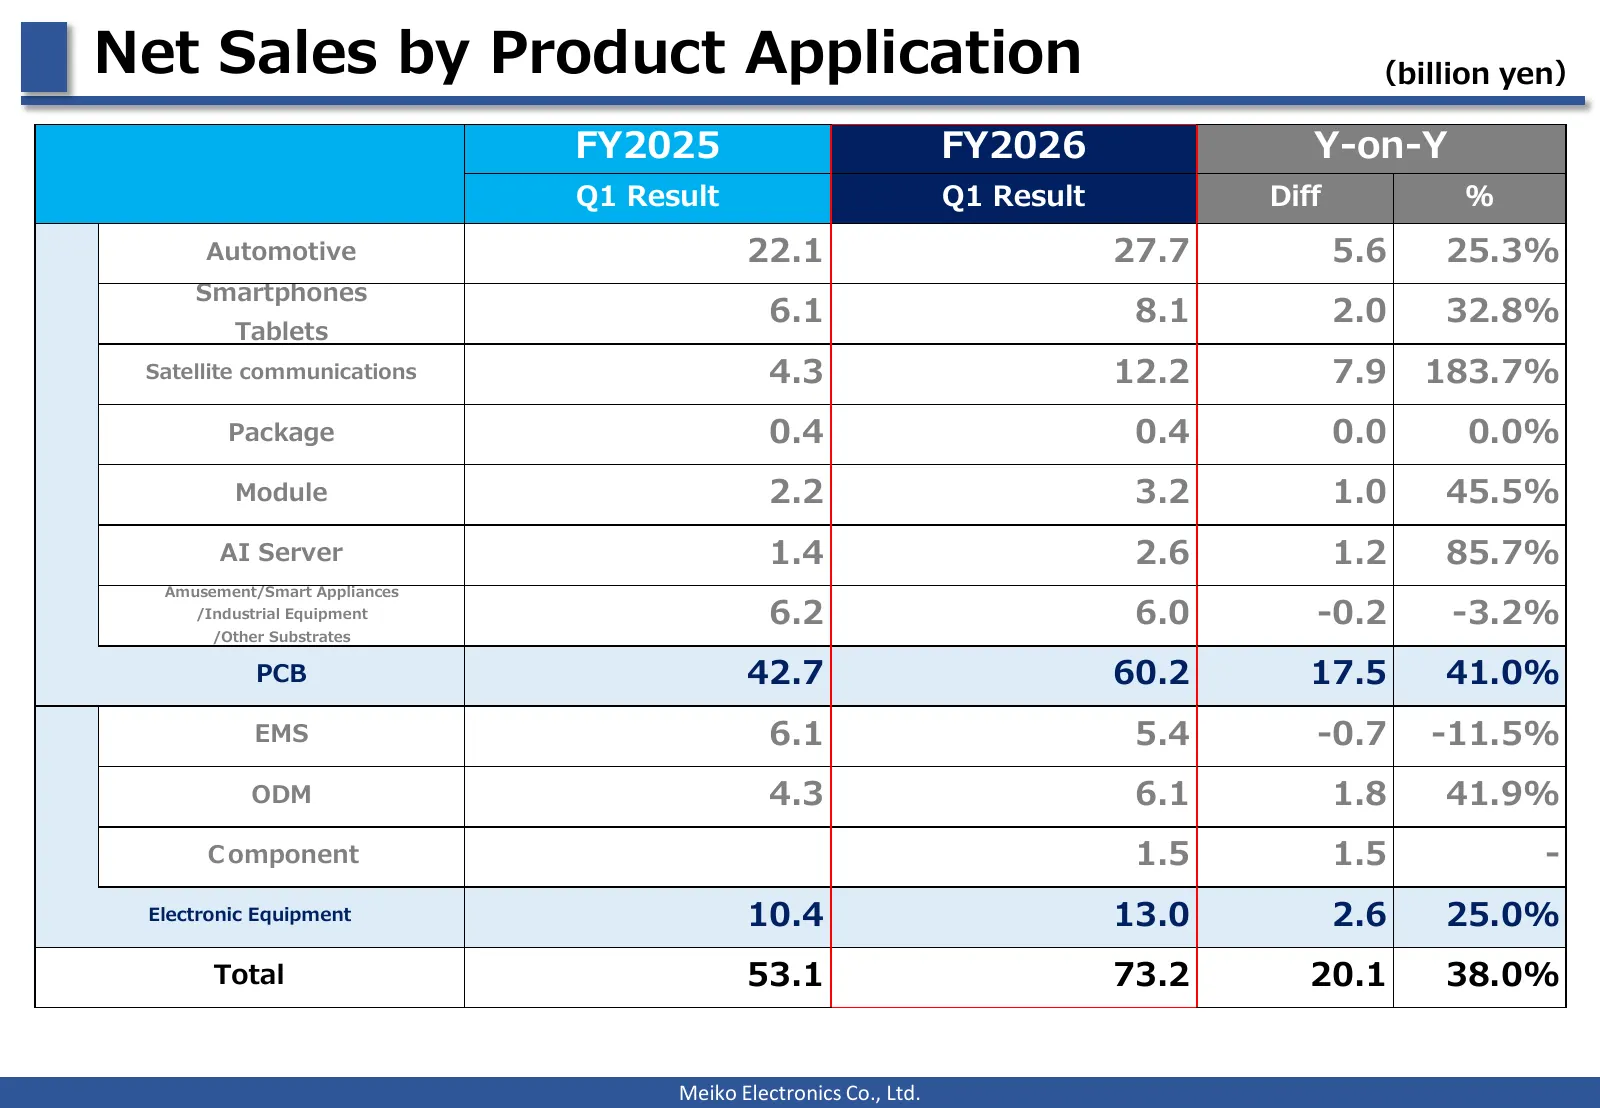
Slide 3: Net Sales by Product Application
Net Sales by Product Application (billion yen) FY2025 FY2026 Y-on-Y Q1 Result Q1 Result Diff % Automotive 22.1 27.7 5.6 25.3% Smartphones 6.1 8.1 2.0 32.8% Tablets Satellite communications 4.3 12.2 7.9 183.7% Package 0.4 0.4 0.0 0.0% Module 2.2 3.2 1.0 45.5% AI Server 1.4 2.6 1.2 85.7% Amusement/Sma
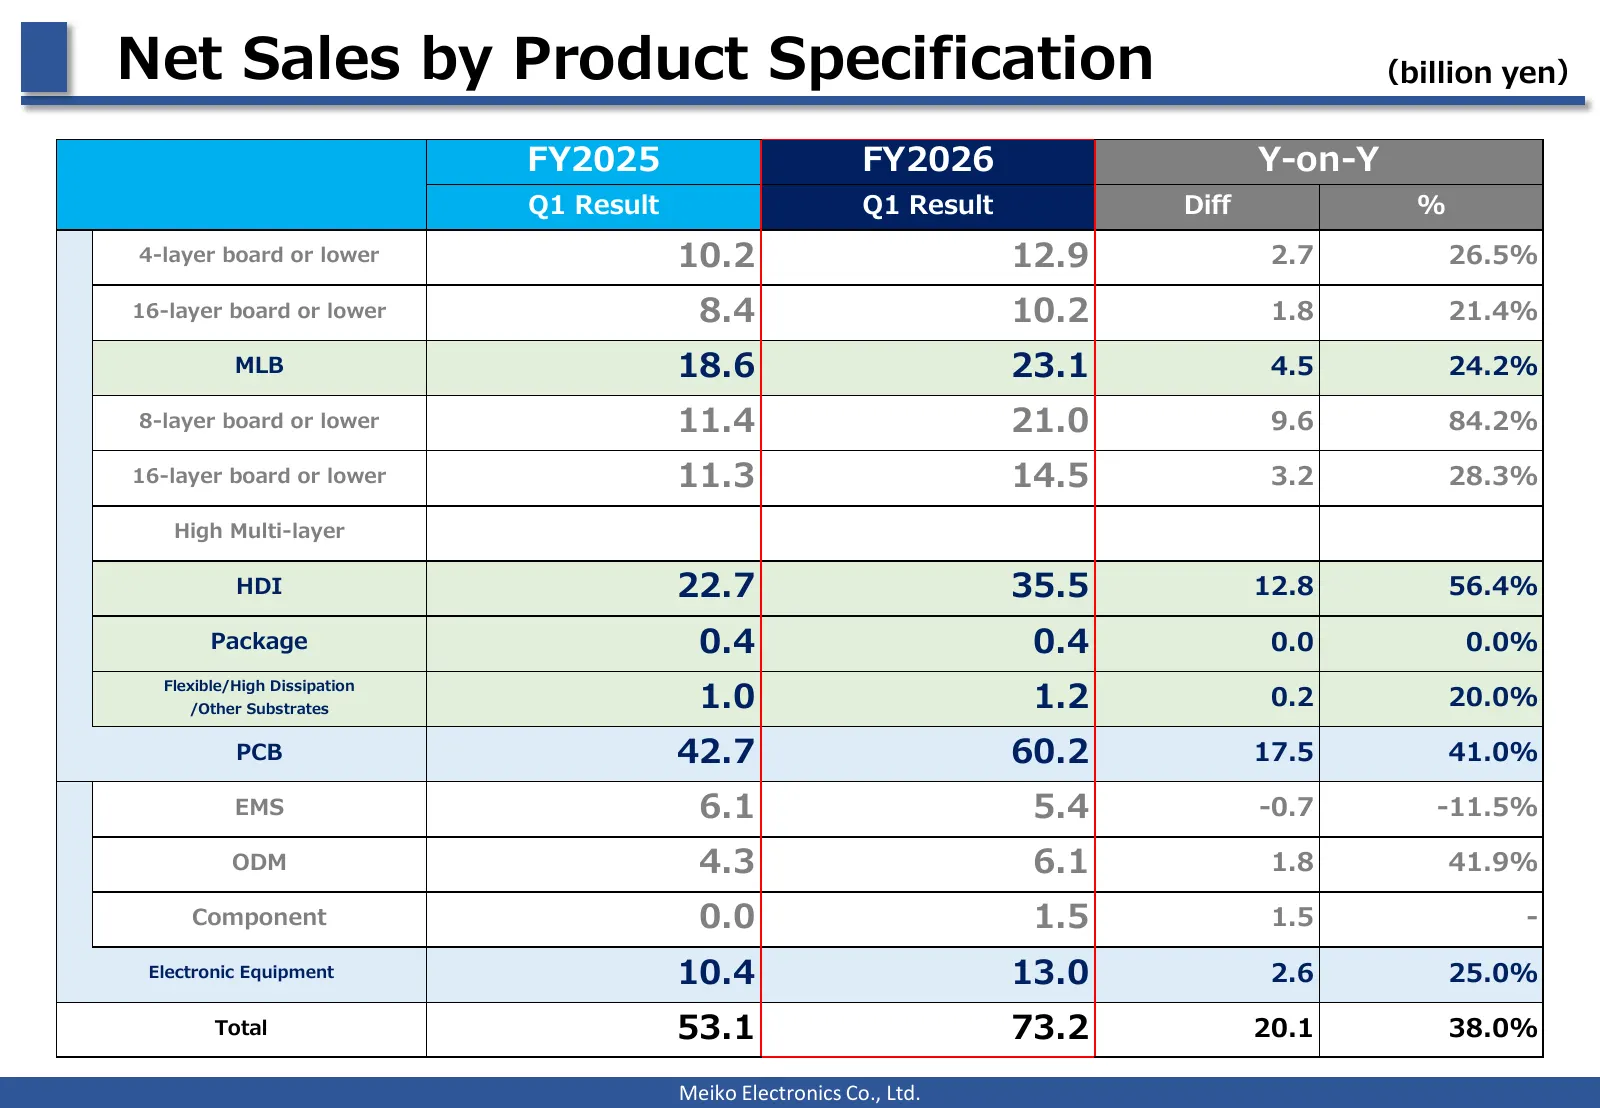
Slide 4: Net Sales by Product Specification
Net Sales by Product Specification (billion yen) FY2025 FY2026 Y-on-Y Q1 Result Q1 Result Diff % 4-layer board or lower 10.2 12.9 2.7 26.5% 16-layer board or lower 8.4 10.2 1.8 21.4% MLB 18.6 23.1 4.5 24.2% 8-layer board or lower 11.4 21.0 9.6 84.2% 16-layer board or lower 11.3 14.5 3.2 28.3% High M
Slide 5: Disclaimer
Disclaimer: This presentation contains forward-looking statements concerning Meiko Group’s future plans, strategies and performance. However, Meiko does not publish this presentation as a disclosure document based on the Financial Instruments and Exchange Act of Japan. These forward-looking statemen
Source: company website
More decks from Meiko Electronics Co., Ltd.
 Q2 2026 Earnings Presentation20 slides · Nov 12, 2026
 H1 FY2026 Earnings Presentation20 slides · Nov 12, 2026
 Q2 FY2026 Earnings Presentation11 slides · Nov 6, 2026
 H1 FY2026 Earnings Presentation11 slides · Nov 6, 2026
 Q1 FY2026 Earnings Presentation5 slides · Aug 6, 2026
 FY2025 Earnings Presentation22 slides · May 21, 2026