Duke Realty — Citi Global Property CEO Conference 2013
55 slides from Duke Realty's conference presentation, Mar 4, 2013
Slide 1: Citi Global Property CEO Conference
RELIABLE. ANSWERS. Citi Global Property CEO Conference March 4-6, 2013 Exhibit 99.1
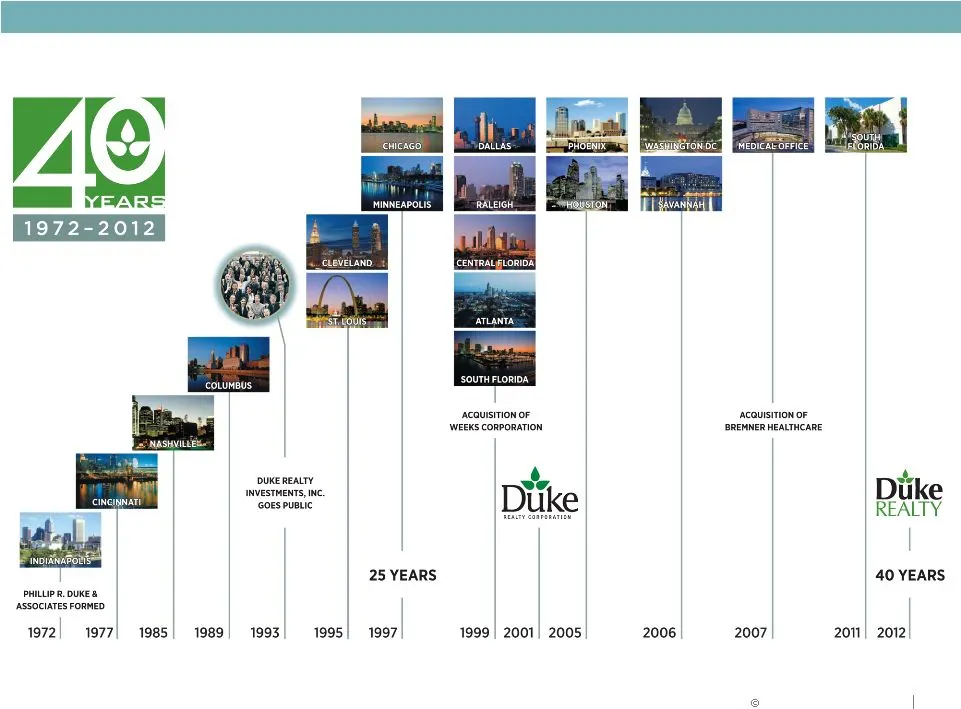
Slide 2: 40 Years Timeline
RELIABLE. ANSWERS . 40 Years Timeline
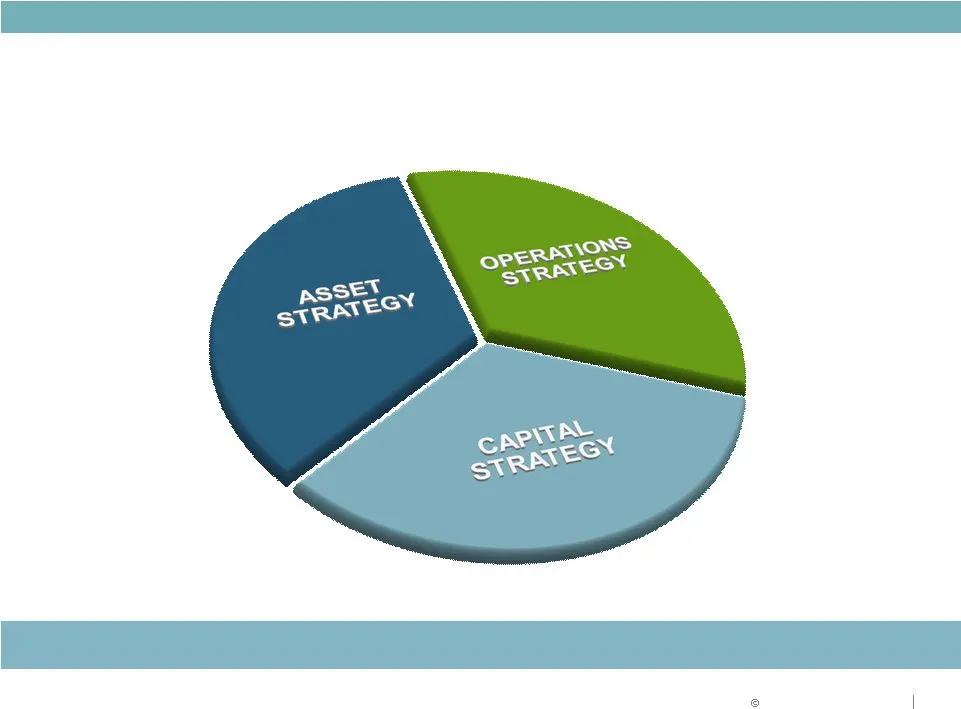
Slide 3: Three-Pronged Strategy for Success
RELIABLE. ANSWERS . Three-Pronged Strategy for Success Strategies for delivering shareholder value

Slide 4: Exceptional Real Estate Brand
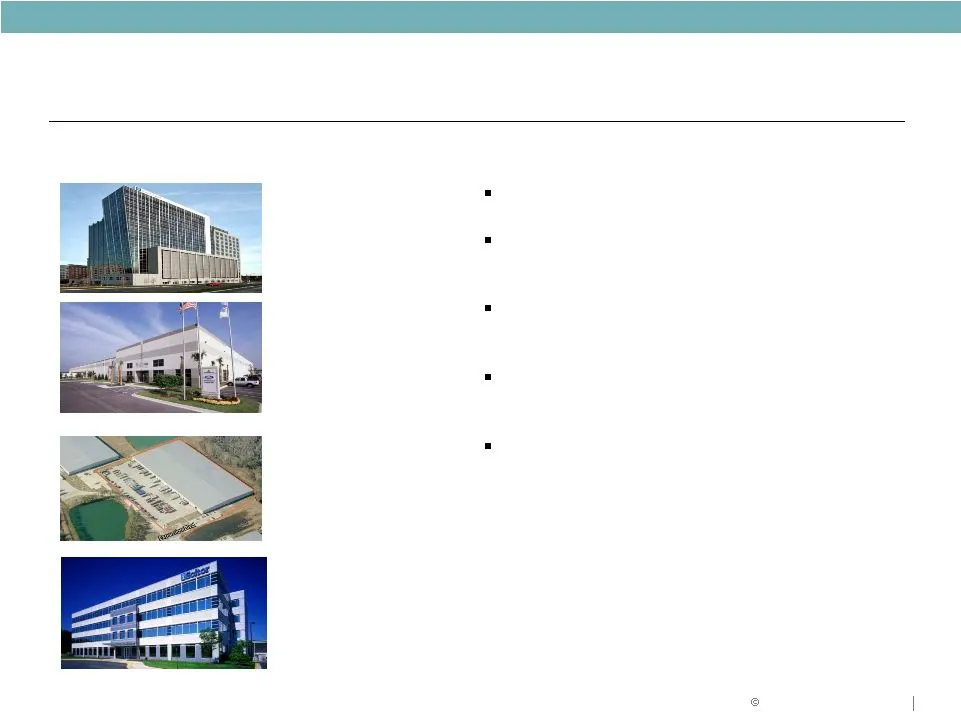
RELIABLE. ANSWERS . Exceptional Real Estate Brand Duke Realty a Leading Real Estate Investment Company since 1972 Over 40 years history as an industrial, owner, operator and developer; Over years as a medical office developer Top 57 leaders with over 15 years average experience at Duke Realty; 33 le

Slide 5: Operations Strategy
OPERATIONS STRATEGY
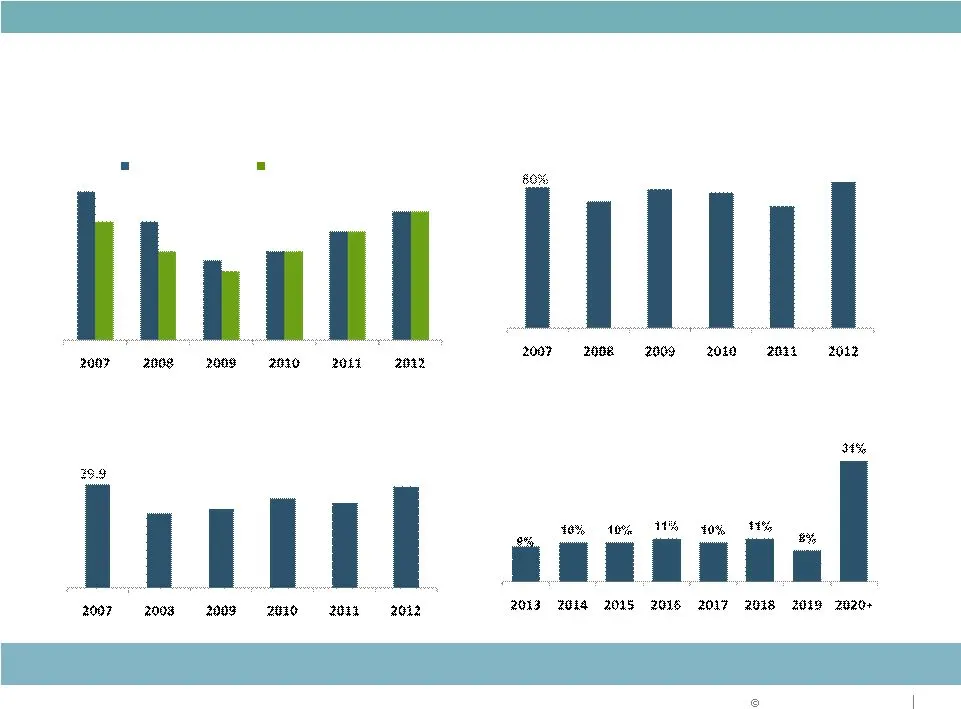
Slide 6: Consistent Operating Performance
OPERATIONS STRATEGY Consistent Operating Performance Stabilized Occupancy (%) Strong historical stabilized occupancy – fundamentals improving Lease Renewals (%) Strong lease renewal percentages Stabilized occupancy In-service occupancy Leasing Activity New Leases and Renewals – Consistent Execution
Slide 7: Consistent NOI Growth Outperformance
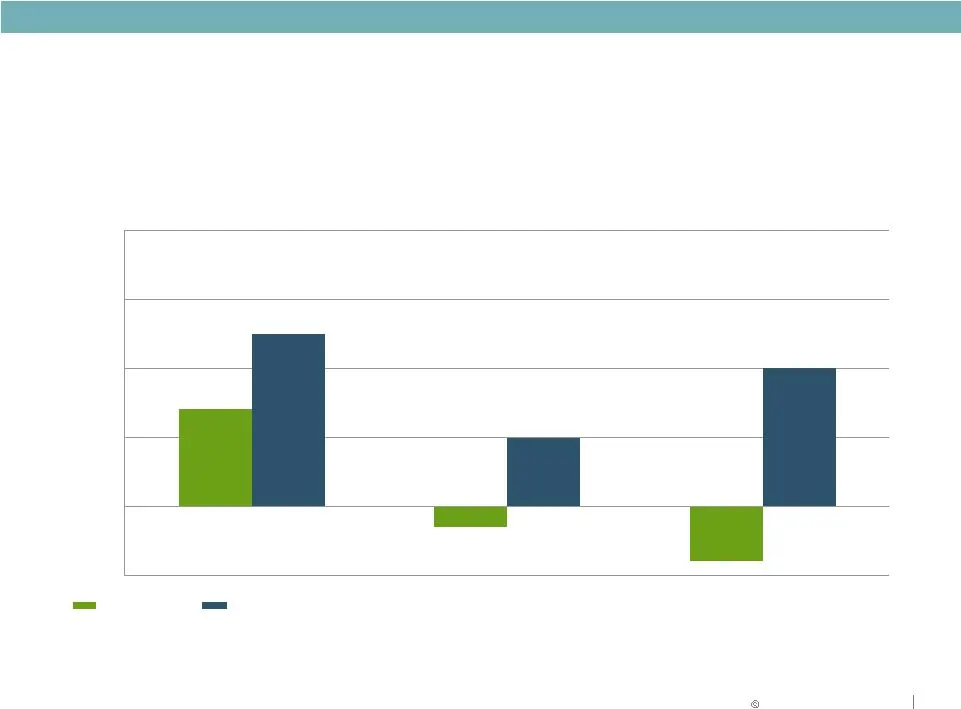
OPERATIONS STRATEGY Notes 1. Based on simple average of calendar year-over-year annual same-property cash NOI growth. Five year analysis measures - 2. Suburban Office Peers include BDN, CLI, HIW, OFC and LRY; weighted by historical market cap 3. Industrial includes DCT, EGP, FR, AMB and PLD; weighte
Slide 8: Positioned for NAV Growth
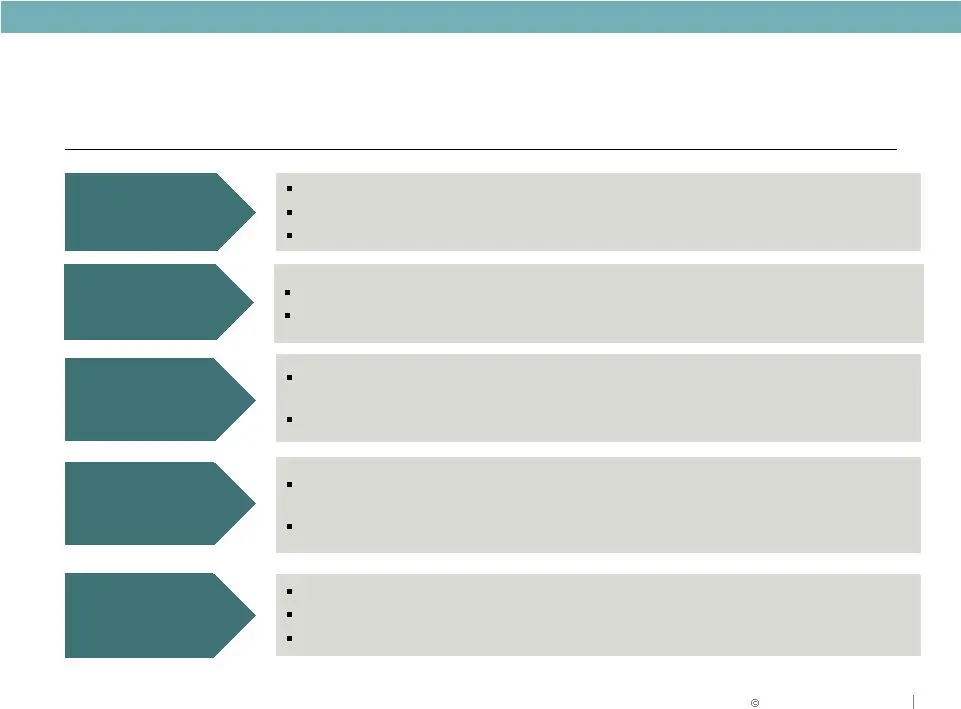
Lease up existing vacancy Increased management & service fees Accretive future development Accretive future acquisitions Increase Rents/ Reduced Capex OPERATIONS STRATEGY Positioned for NAV Growth KEY NAV GROWTH DRIVERS Portfolio occupancy of 92.4% Strong leasing pipeline Demonstrated track record o
Slide 9: Land and Development Capabilities
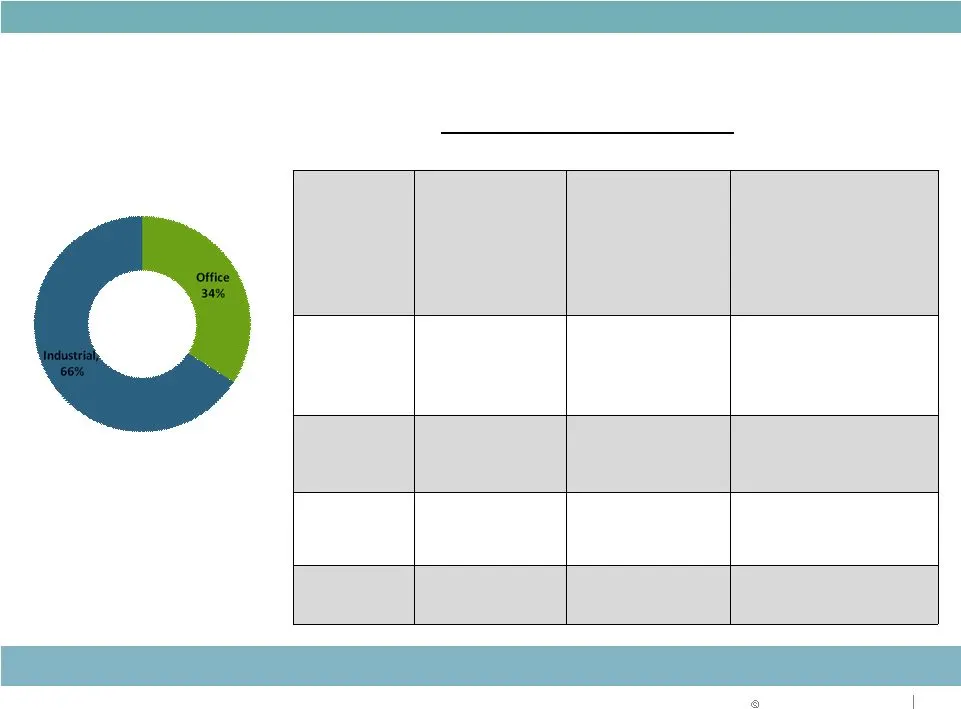
OPERATIONS STRATEGY Land and Development Capabilities $540 million HELD FOR DEVELOPMENT Industrial Office Midwest 25.8 2.8 Indianapolis, Chicago, Cincinnati, Columbus, Minneapolis, and St. Louis major positions East 3.8 2.3 New Jersey, Baltimore, Washington D.C. and Raleigh Southeast 9.0 1.2 Atlanta
Slide 10: Select 2012 Industrial Development Starts
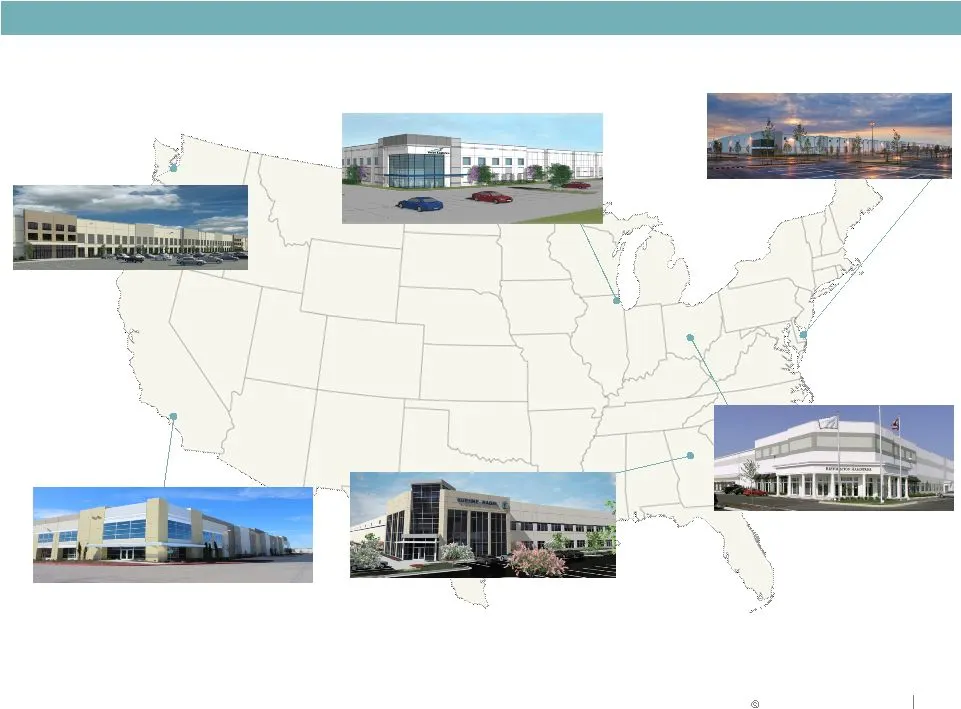
OPERATIONS STRATEGY Chicago Industrial • Yusen Logistics build-to-suit • O’Hare submarket on acre brownfield redevelopment • 230,000 square feet • year lease term • $21.3 million project • 12-year projected average yield of 7.0% Select 2012 Industrial Development Starts Columbus Industrial • Restora
Slide 11: 2013 YTD Development Starts
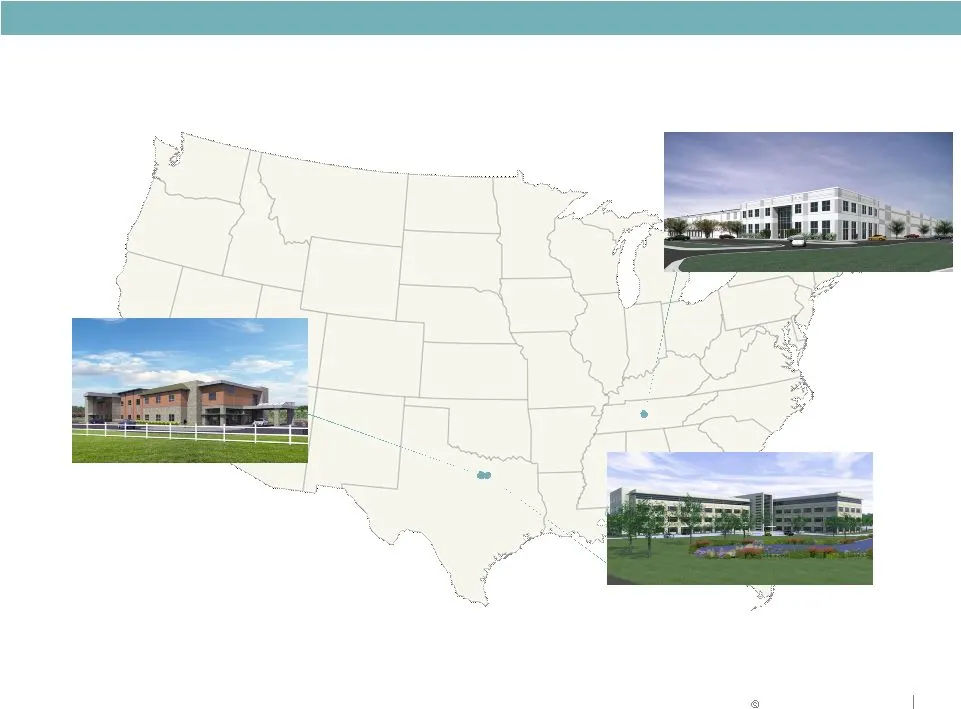
OPERATIONS STRATEGY 2013 YTD Development Starts Nashville Industrial • Regional distribution center build-to-suit for Starbucks • 680,000 square feet • 7.5 year lease term • $26 million project • Projected average yield of 7.7% Dallas Medical Office • Three Baylor Emergency (ER) facilities in Metro

Slide 12: Development Strategic Advantages
RELIABLE. ANSWERS . Development Strategic Advantages Development platform creates value Duke Realty 40 years of experience in development Recognized as one of the leading commercial developers in each of our 18 markets Land bank in strategic locations that can support approximately 55 million square

Slide 13: Asset Strategy
ASSET STRATEGY
Slide 14: Track Record
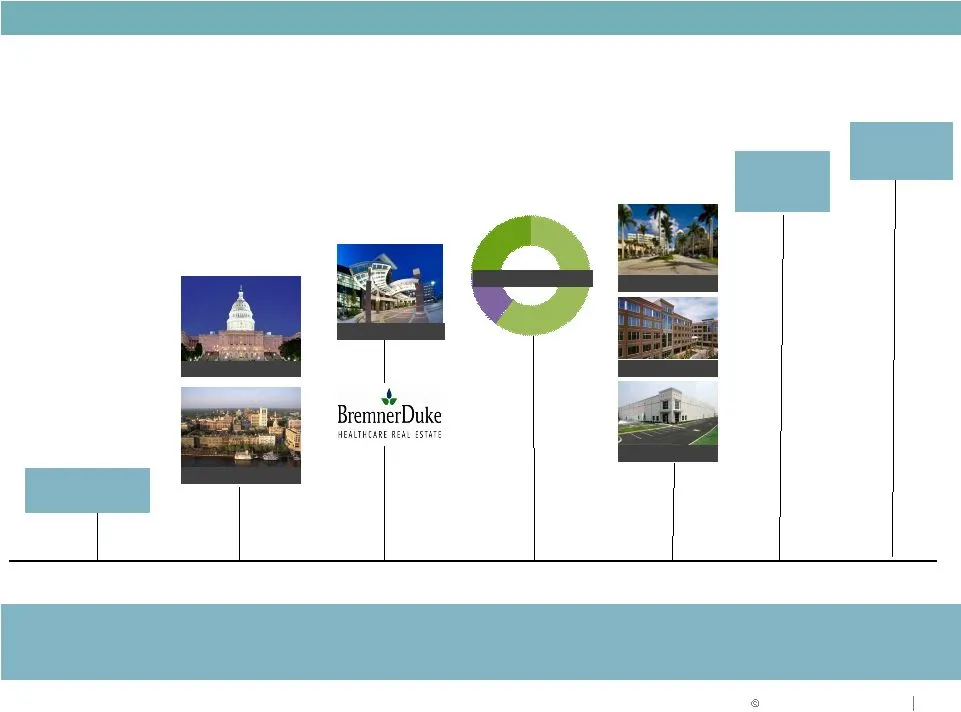
Savannah Washington DC Healthcare Asset Strategy Dugan CBRERT Premier ASSET STRATEGY Track Record Proven ability to execute and allocate investments in alignment with our strategy Flex Disposition $1 Billion Suburban Office disposition $1 Billion MOB and Industrial acquisitions $800 Million
Slide 15: Asset Strategy
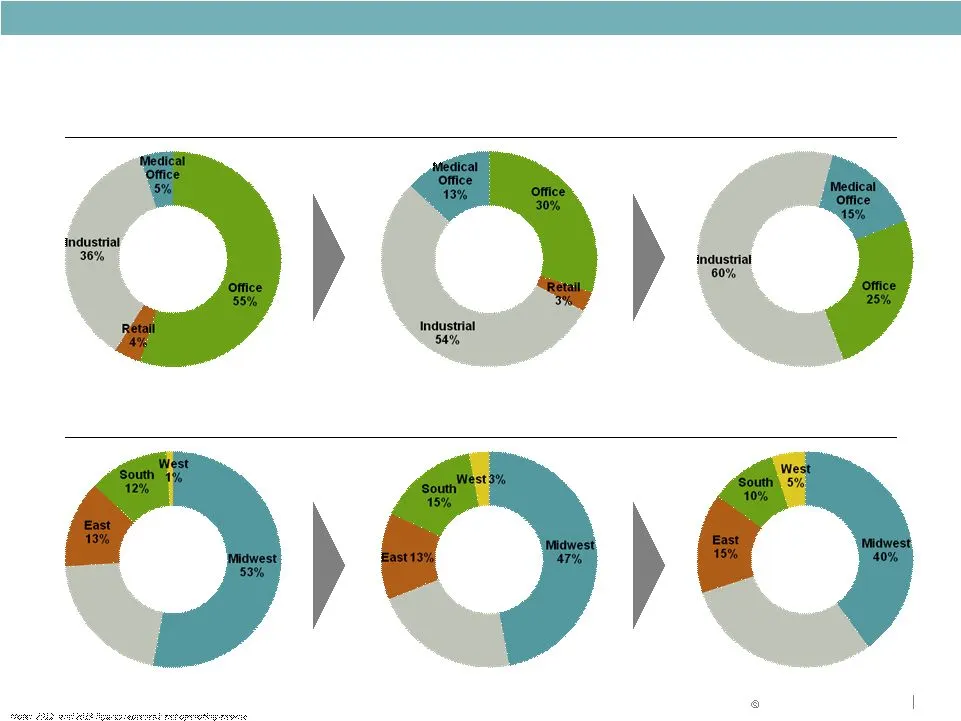
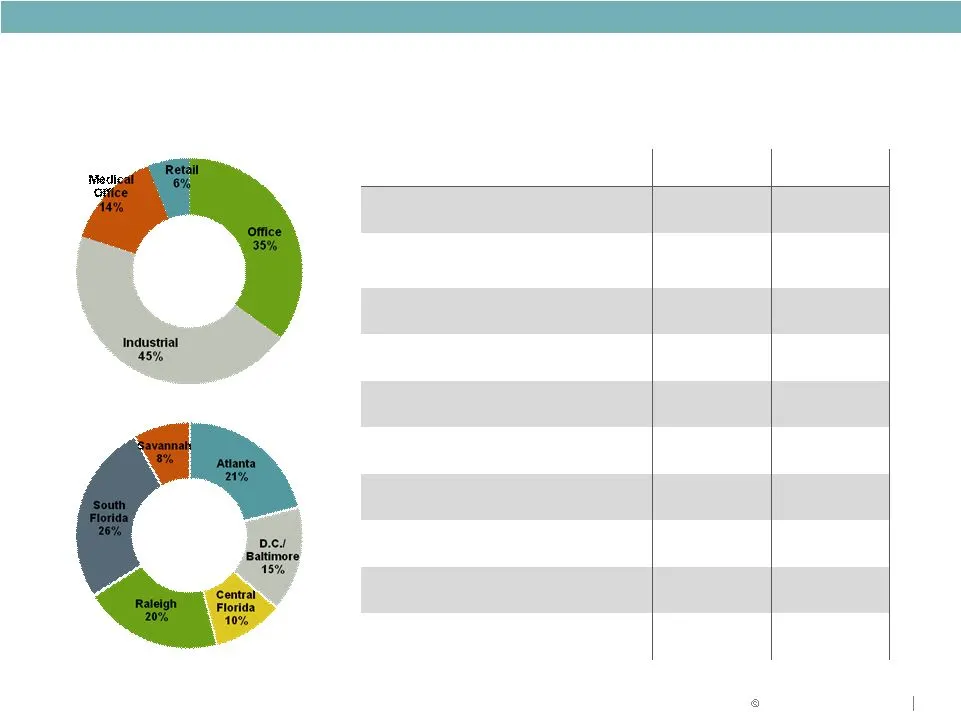
ASSET STRATEGY Asset Strategy BY PRODUCT BY GEOGRAPHY Southeast 21% Southeast 30% Southeast 22%
Slide 16: New, High Quality Portfolio with Long-term Leases
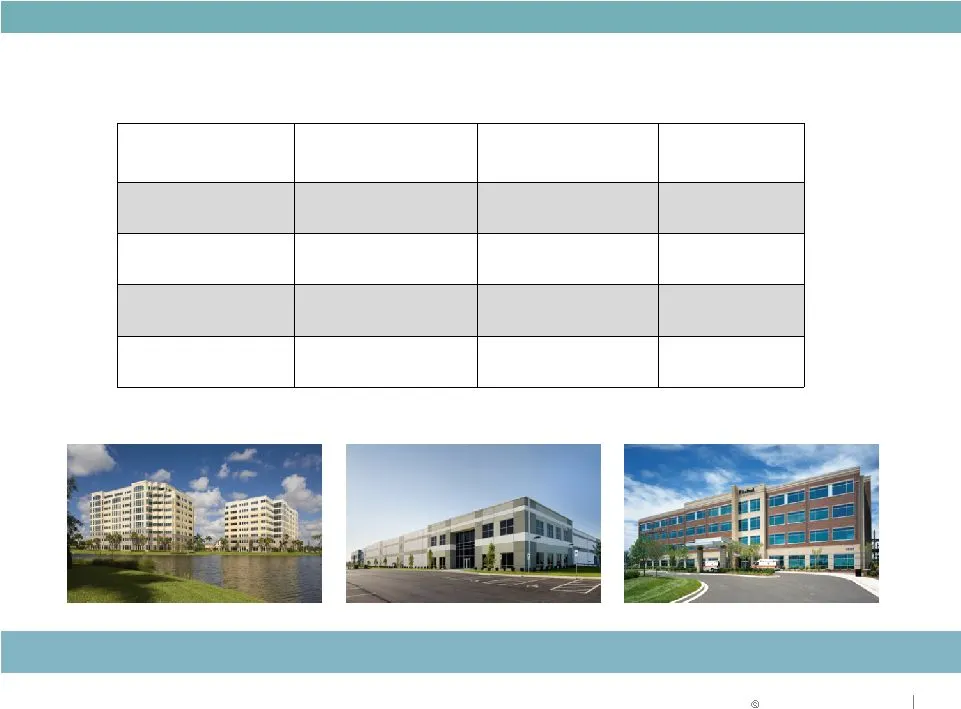
ASSET STRATEGY New, High Quality Portfolio with Long-term Leases Premier portfolio of assets Portfolio average Bulk Industrial Suburban Office Medical Office Property age 11.1 years 14.0 years 7.1 years Property size 229,000 SF 118,000 SF 79,000 SF Lease term 7.2 years 7.3 years 11.2 years Tenant si
Slide 17: Premier Quality Industrial Portfolio
ASSET STRATEGY Premier Quality Industrial Portfolio Industry leading focus on newer built, modern bulk warehouse type with strong performance characteristics <100,000 100,000-500,000 >500,000 % Total Square Feet 9% 54% 37% Building Square Footage (000's) 10,000 60,000 41,000 No. of Buildings Average
Slide 18: Select Industrial Acquisitions in 2011 & 2012
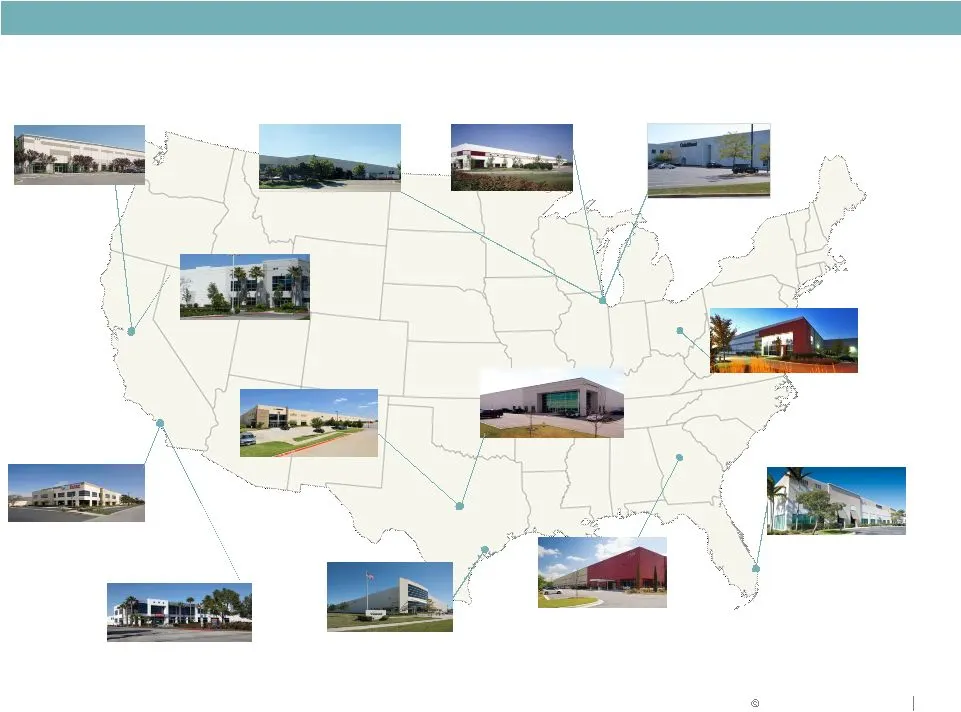
ASSET STRATEGY Select Industrial Acquisitions in 2011 & 2012 Southern California Industrial Staples Distribution Center 497,620 SF, 100% leased Atlanta Industrial Hartman Business Center V 569,674 SF, 100% leased Columbus Industrial Creekside XIV & XXII 1,076,625 SF, 86% leased Chicago Industrial Cr

Slide 19: Medical Office Strategy & Performance Update
MEDICAL OFFICE STRATEGY & Performance Update
Slide 20: Healthcare Trends
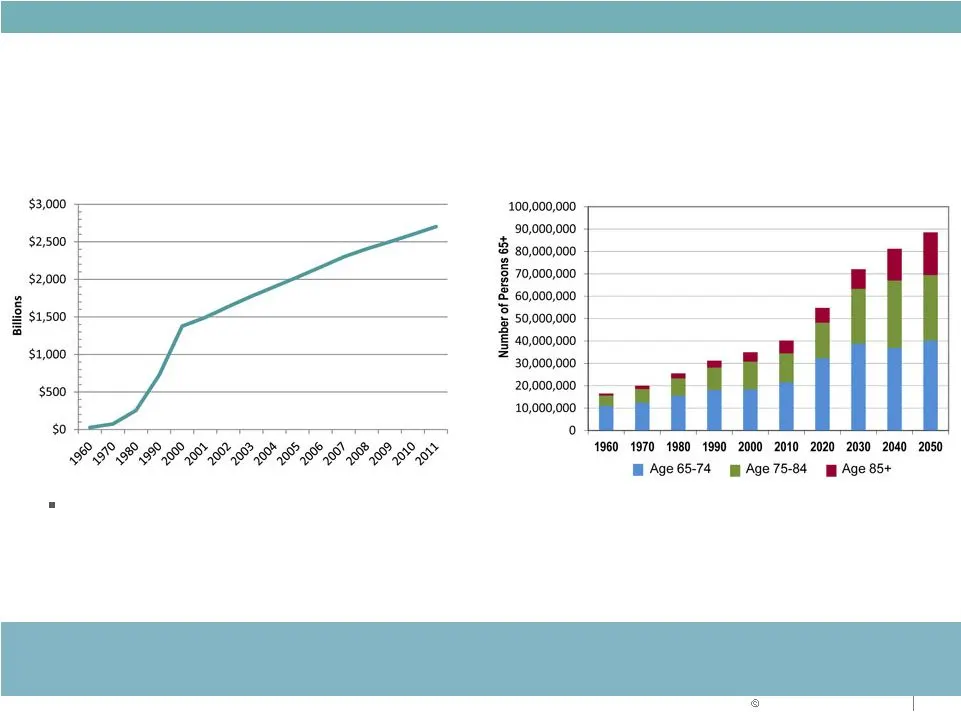
MEDICAL OFFICE STRATEGY Healthcare Trends The nation’s largest industry • More than 17% of GDP; predicted to exceed 23% by 2020 • U.S. population 65+ expected to approach 90 million by 2050 • Aging population driving increase in healthcare expenditures Annual Healthcare Expenditures Source: U.S. Bur
Slide 21: Sas
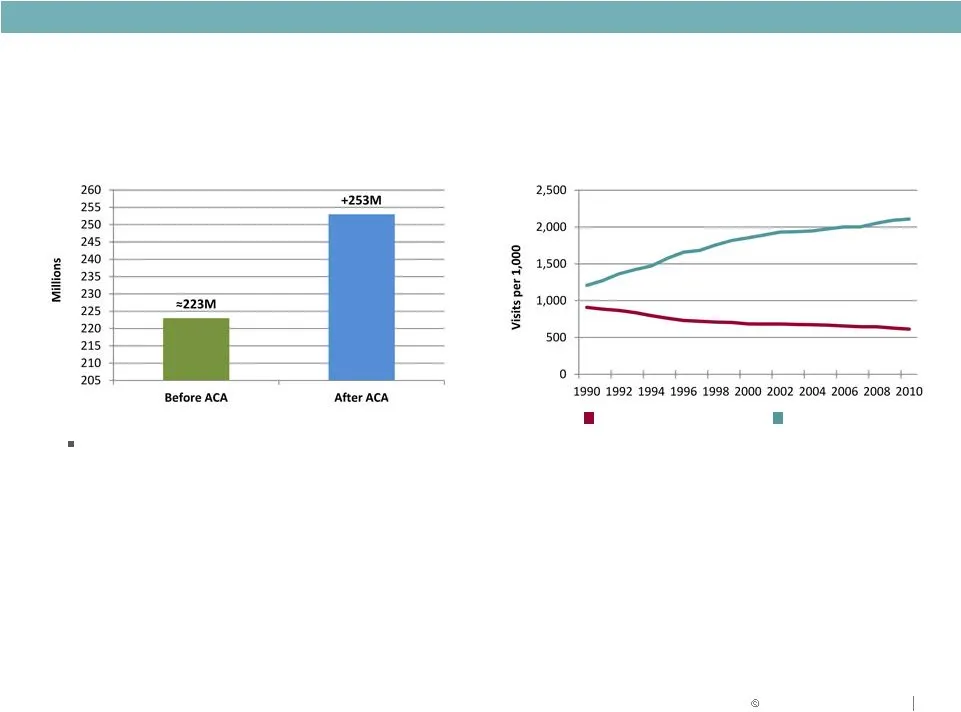
260 255, 250 245 240 235 230 225 220 215 210 205 2,500 +253M. 56 Sas z =223M. z 1,000 S Se 500 o — rom, Guinnaianaians
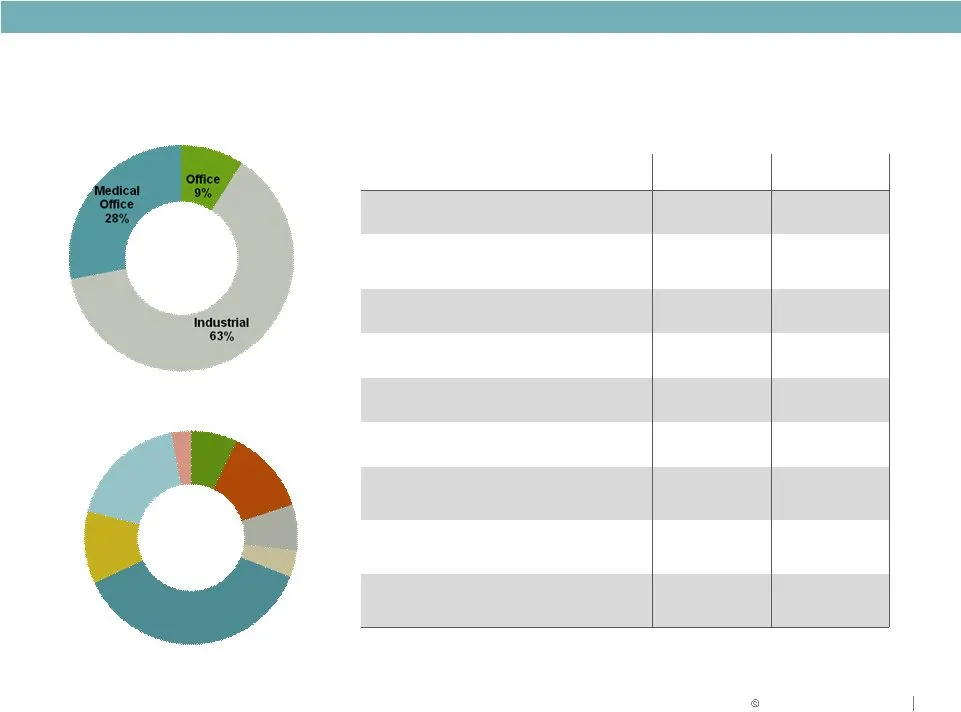
Slide 22: Medical Office Portfolio at December 31, 2012
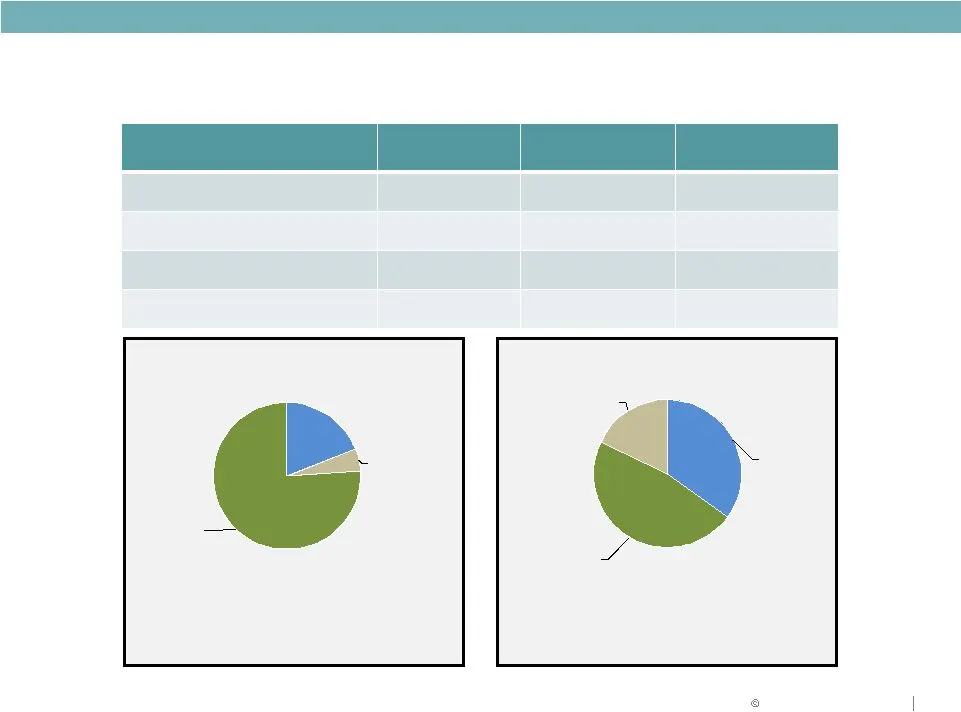
In-Service Under Development Total MEDICAL OFFICE STRATEGY 35% 47% 18% Properties Investment $ $1.2 B $240 M $1.4 B Square Feet 5.4 M 884 K 6.3 M Leased Occupancy 91% 100% 93% Local Regional National Portfolio investment by product type Portfolio investment by hospital system 19% 5% 76% MOB On-Campu
Slide 23: Top Health System Relationships and Lease Expirations
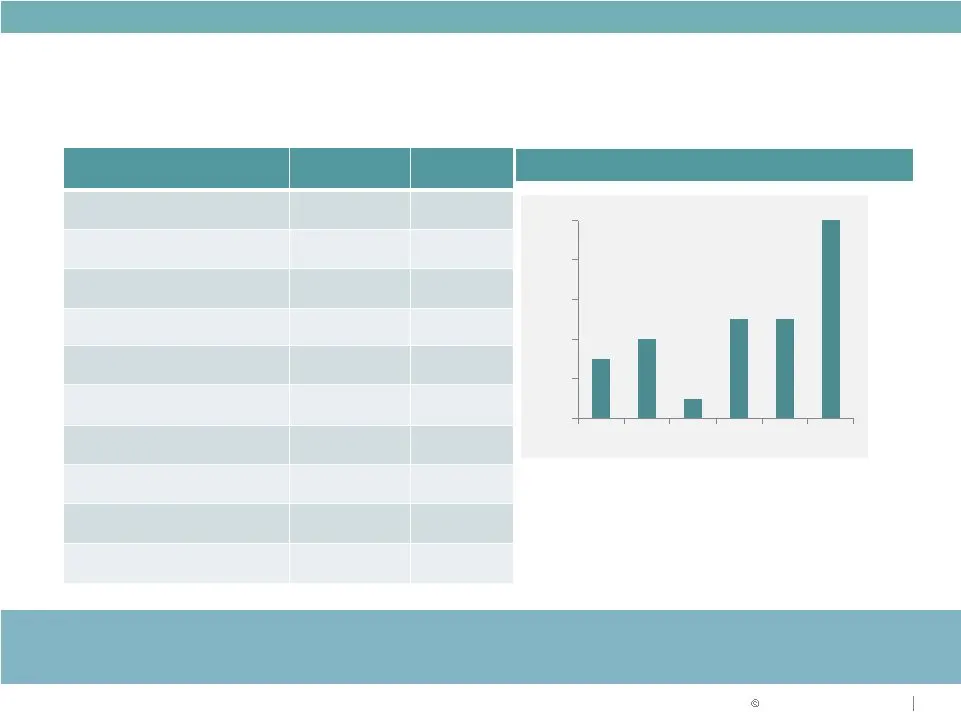
Lease Expirations (% of In - Service Sq. Ft.) Health System Credit Rating ( Moody's) Rentable SF MEDICAL OFFICE STRATEGY 3% 4% 1% 5% 5% 10% 0% 2% 4% 6% 8% 10% High credit tenants and limited lease maturity result in stable and growing cash flow Top Health System Relationships Ascension Health Aa1 51
Slide 24: Medical Office NOI and Portfolio Occupancy
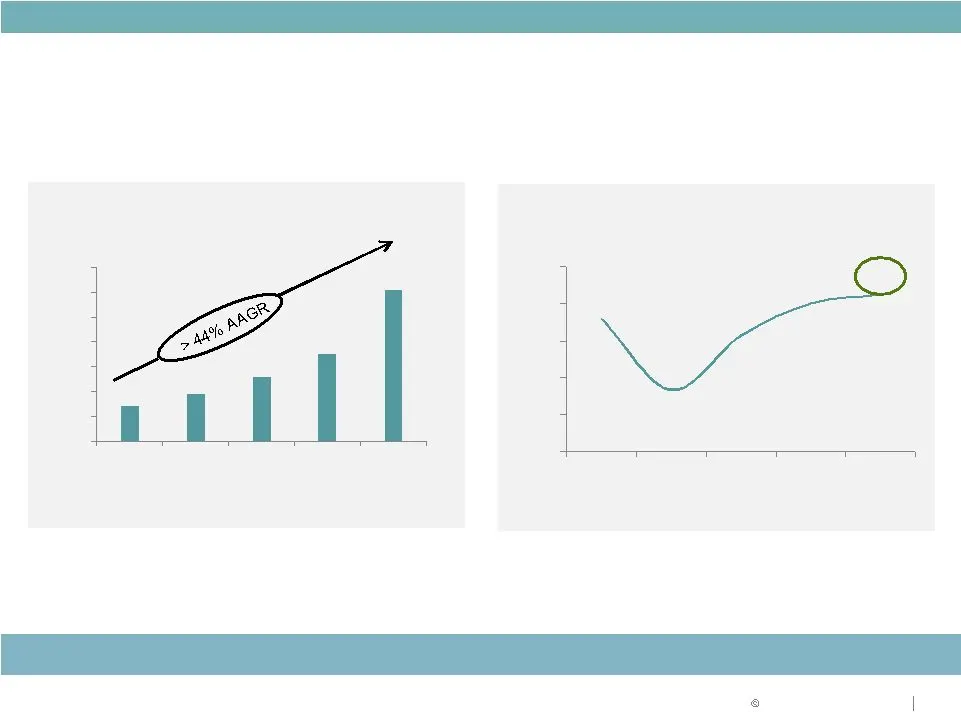
MEDICAL OFFICE STRATEGY Medical office portfolio projected to exceed 15% of total asset base by 2013 NOI in $millions Annual NOI 88.0% 78.4% 85.8% 90.1% 91.3% 70% 75% 80% 85% 90% 95% In-Service Portfolio Occupancy As of 12/31/2012 Medical Office NOI and Portfolio Occupancy
Slide 25: Healthcare Development Pipeline
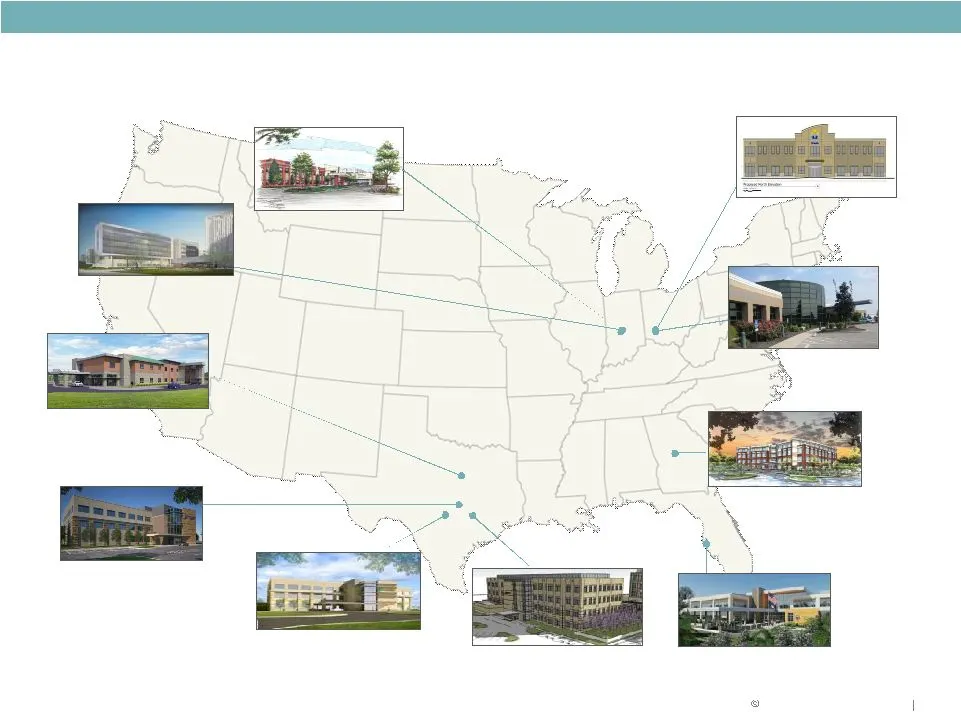
MEDICAL OFFICE STRATEGY Healthcare Development Pipeline VA Tampa Tampa, FL 117,000 SF, 100% preleased Scott and White MOB Marble Falls, TX 67,000 SF, 100% preleased Wishard Health FOB Indianapolis, IN 275,000 SF, 100% preleased Scott & White MOB College Station, TX 119,000 SF, 100% preleased Tri Hea
Slide 26: Goal: Grow Medical Office Primarily through Development
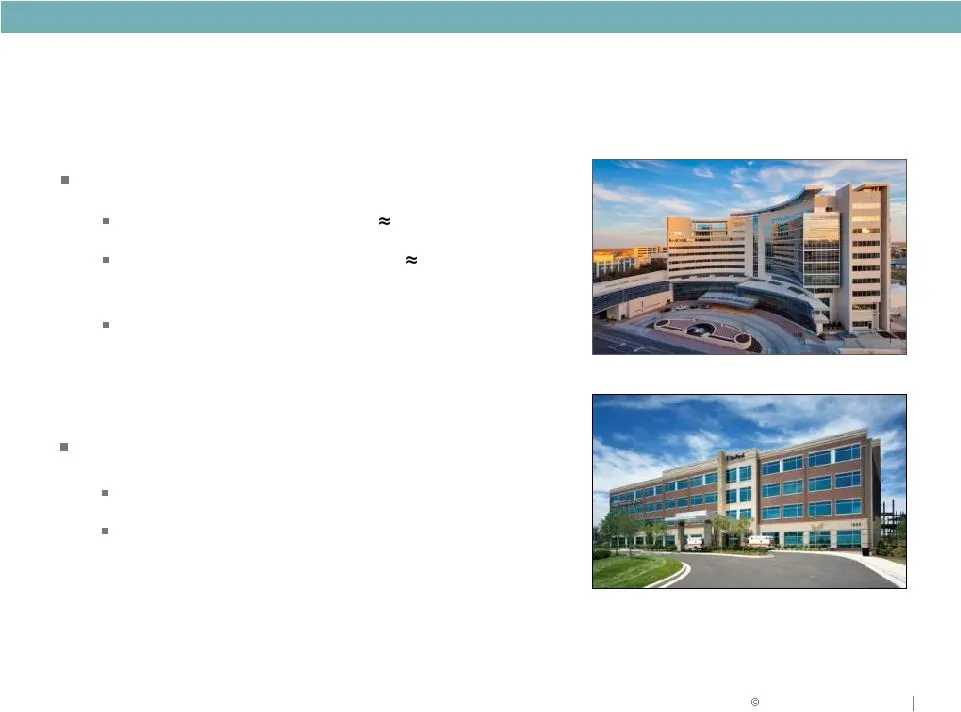
MEDICAL OFFICE STRATEGY Goal: Grow Medical Office Primarily through Development Our Plan Existing healthcare assets $1.4 Billion New developments projected $200 Million in Lease-up space for growth – 92.5% leased at December 31, 2012 . . . projected to increase in Our Focus On-campus assets Major ho

Slide 27: Strategic Benefits to Duke Realty
MEDICAL OFFICE STRATEGY Strategic Benefits to Duke Realty Medical office to provide solid NOI growth and lower volatility • Reliable NOI growth with long term leases averaging over 11 years with very high tenant retention o Typical lease includes 2-3% annual rent escalators and expenses passed throu

Slide 28: Capital Strategy and 2013 Guidance
CAPITAL STRATEGY AND 2013 GUIDANCE

Slide 29: Capital Strategy Focus
CAPITAL STRATEGY 1 2 3 4 Capital Strategy Focus Reducing leverage Increasing coverage ratios Maintaining size and quality of unencumbered asset base Executing portfolio repositioning in alignment with capital strategy objectives Further improve balance sheet strength and ratings
Slide 30: Key Metrics & Goals
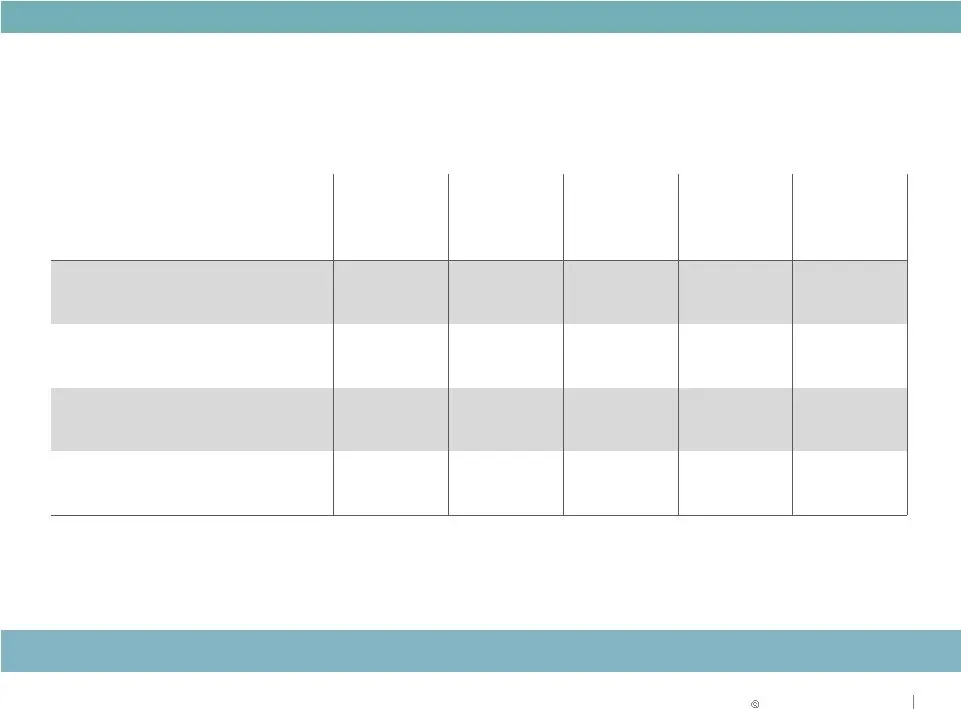
CAPITAL STRATEGY Key Metrics & Goals Actual Actual Actual Proforma 2012* Goal Debt to Gross Assets 44.5% 46.3% 46.8% 45.5% 45.0% Debt + Preferred to Gross Assets 54.9% 55.5% 55.6% 51.7% 50.0% Fixed Charge Coverage Ratio 1.79 : 1 1.79 : 1 1.82 : 1 1.81 : 1 2.00 : 1 Debt + Preferred/EBITDA 8.47 8.88 8
Slide 31: Relative Performance of Duke Realty
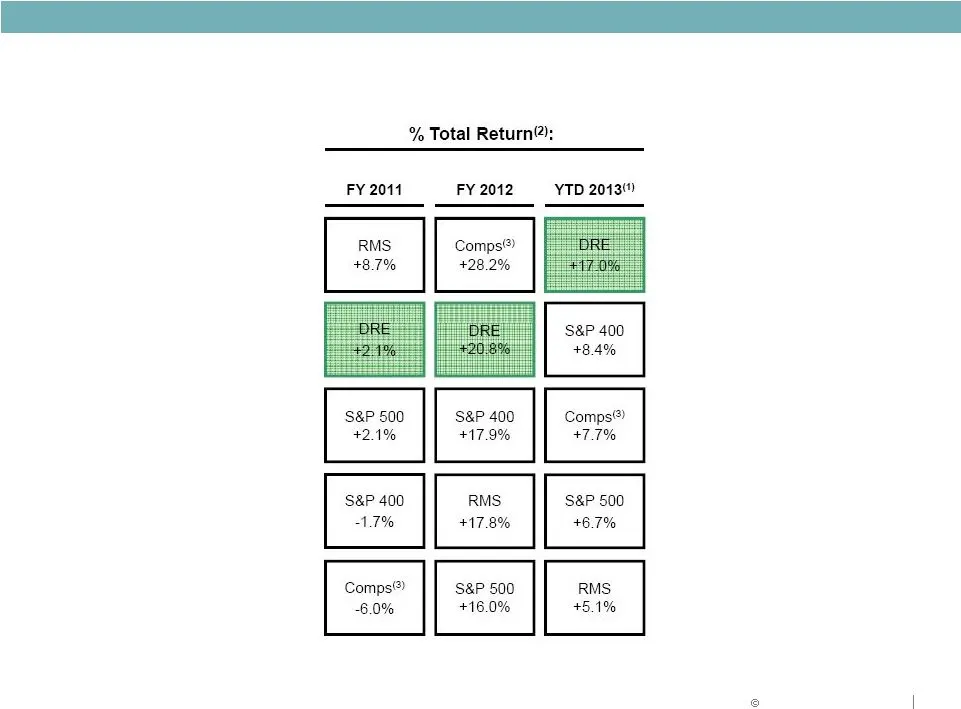
RELIABLE. ANSWERS . Relative Performance of Duke Realty Notes 1. DRE stock price as of end of trading 2/27/13, @ $16.06 2. Total return for comparable companiescalculatedon a market cap weighted basis 3. Comparables include PLD, BDN, CLI, DCT, HIW, LRY, FR, OFC, and EGP; PLD and AMB are included his
Slide 32: Executing on capital strategy objectives
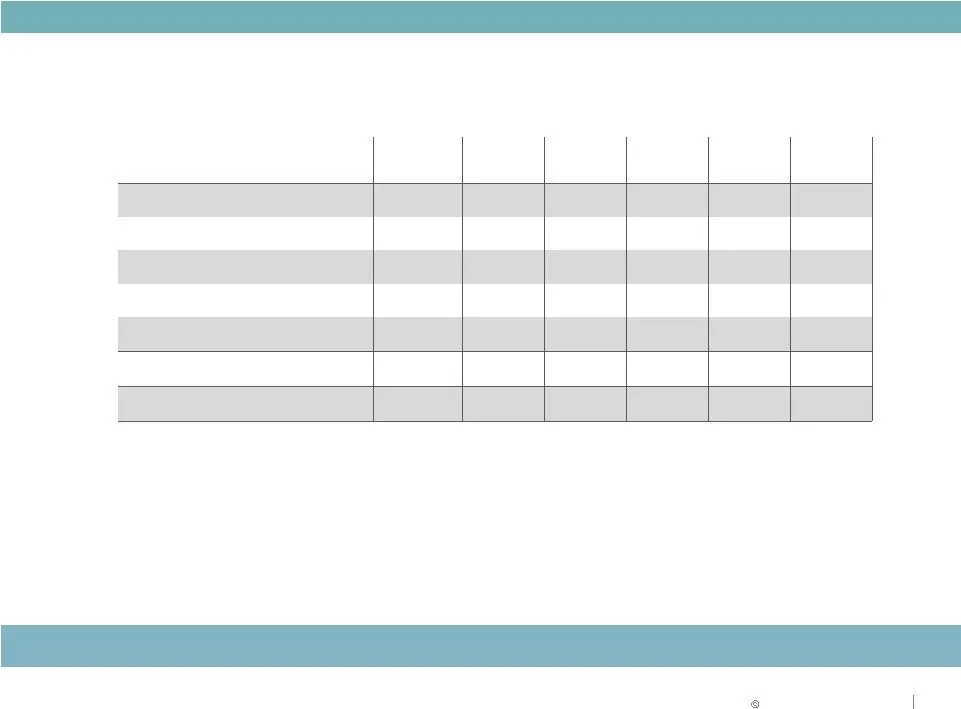
CAPITAL STRATEGY Executing on capital strategy objectives CAPITAL SOURCE TOTAL Common Stock - $575 $311 - $241 $1,127 Preferred Stock $300 - - - - $300 Unsecured Debt $325 $500 $250 - $600 $1,675 Secured Debt - $270 - - - $270 Asset Dispositions $475 $300 $533 $1,650 $153 $3,111 TOTAL $1,100 $1,645
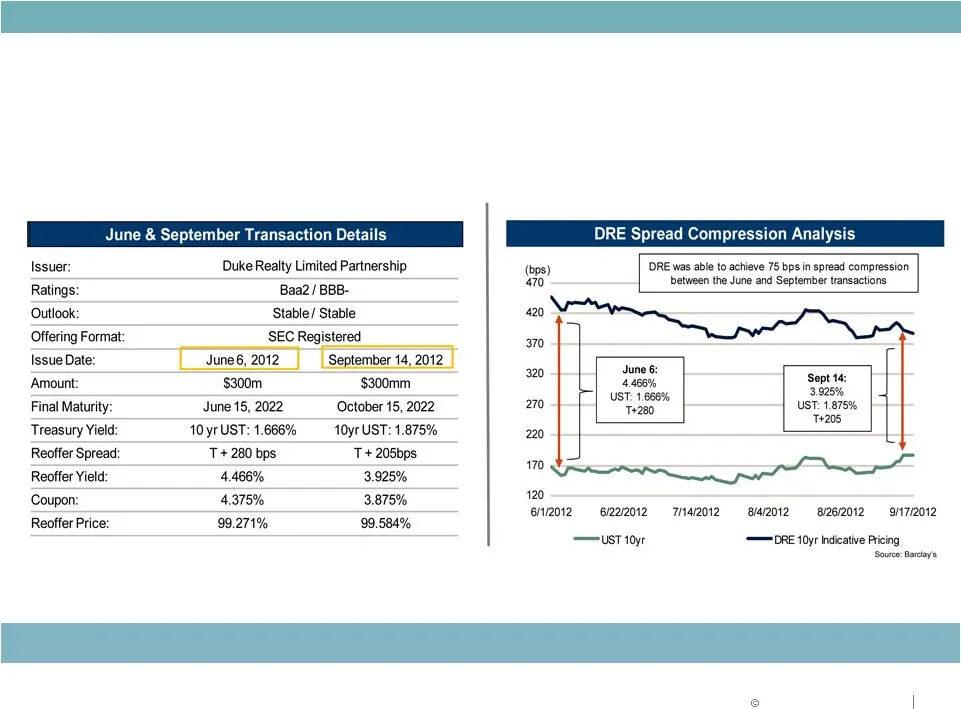
Slide 33: Duke Realty 2012 Transactions
CAPITAL STRATEGY Duke Realty 2012 Transactions Lowering Cost of Capital with Highly Efficient Bond Offering Executions
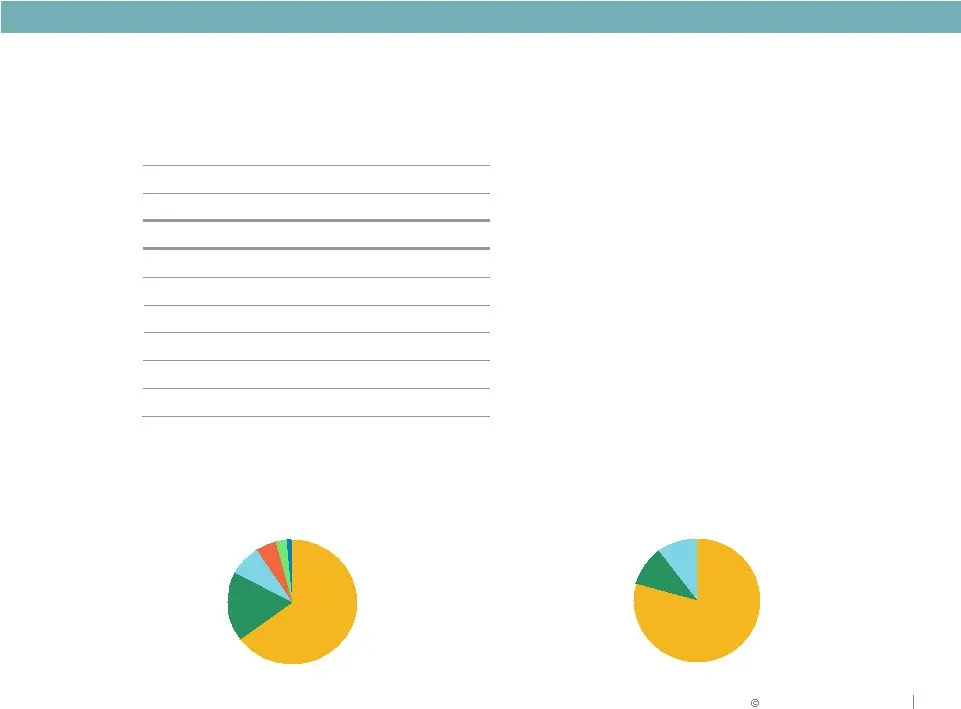
Slide 34: $590MM Overnight Marketed Offering
CAPITAL STRATEGY January 10, 2013 Duke Realty $590MM Overnight Marketed Offering Source Morgan Stanley Summary of Deal Terms Post Over-Allotment Option Launch Date January9, 2013(Post-Close) Pricing Date January10, 2013(Pre-Open) Offer Price $14.25 % File/ Offer Discount -2.1% Days Trading 21.0x % o
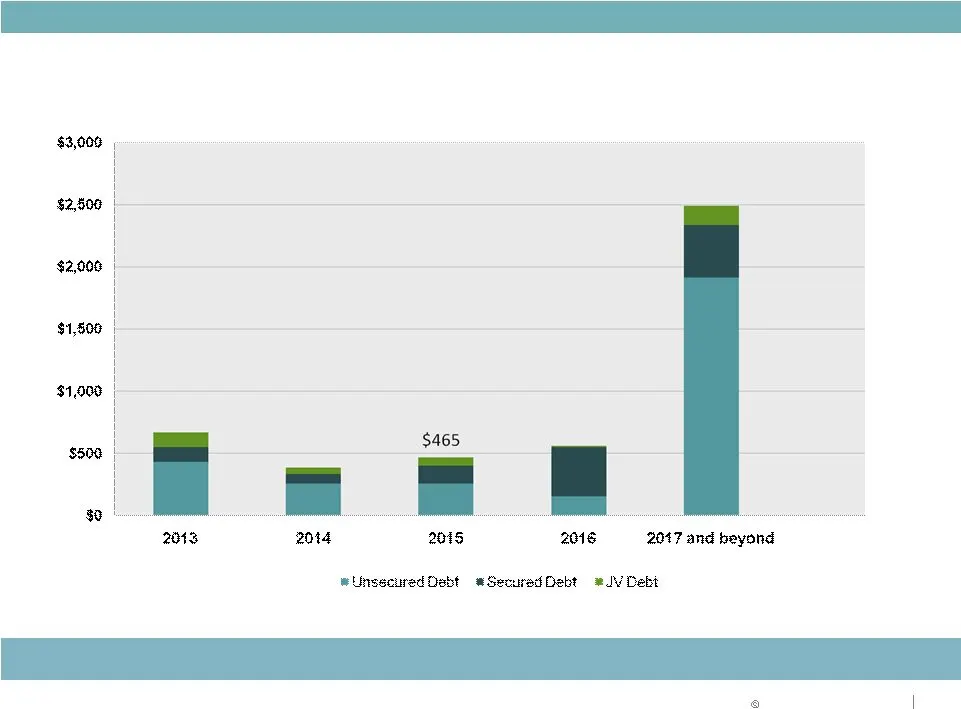
Slide 35: Liquidity Position
CAPITAL STRATEGY Liquidity Position ($ in millions) Manageable debt maturities $667 $383 $559 $2,493 Debt Maturity and Amortization Schedule December 31, 2012
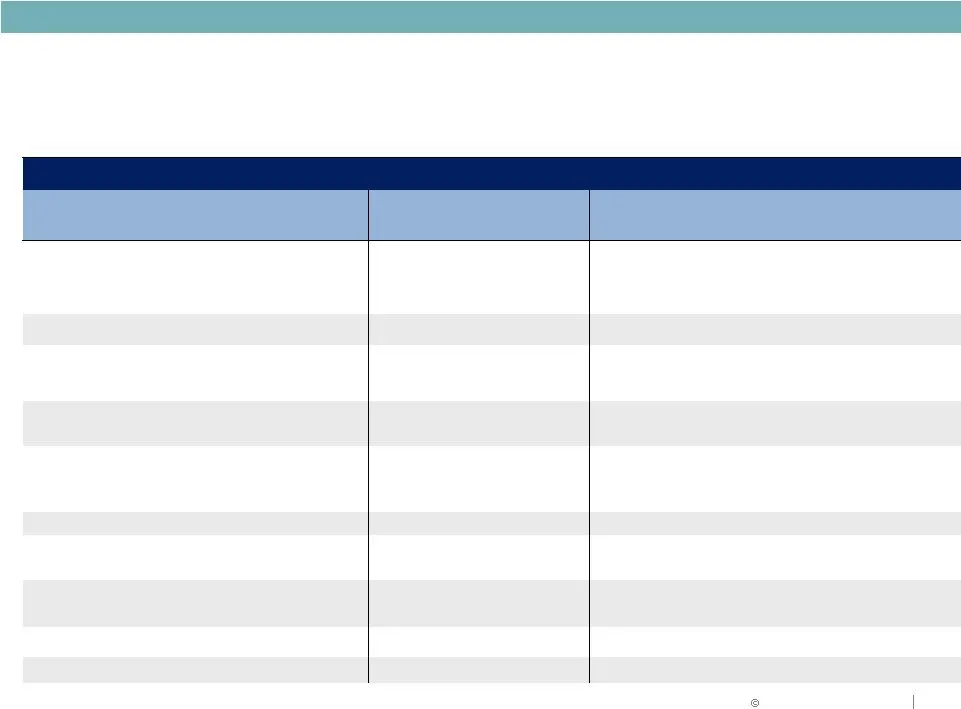
Slide 36: 2013 Range of Estimates
RELIABLE. ANSWERS . 2013 Range of Estimates 2013 Range of Estimates Metrics Actual Pessimistic Optimisti Key Assumptions Core FFO per share $1.02 $1.03 $1.11 - Continued improvement in operating fundamentals - Development projects - Growth in asset base from repositioning actitivies AFFO Payout Rati

Slide 37: Why Duke Realty?
RELIABLE. ANSWERS WHY DUKE REALTY? ¦ Quality portfolio improving with asset strategy ¦ Solid balance sheet improving with capital strategy ¦ Unmatched ability to execute on daily operations ¦ Development capabilities in place with existing land bank ¦ Talent and leadership depth to execute Deliverin

Slide 38: Appendix
APPENDIX
Slide 39: Strategic Focus
RELIABLE. ANSWERS . Strategic Focus 2012 Goals and Objectives 2012 Update • Lease-up portfolio, manage cap ex; reach positive same property income growth • Balance execution with capital strategy relative to level and quality of cash flow and same property NOI • Development starts of $ 150 to $250MM
Slide 40: U.S. Rail and Highway Logistics Routes & Corridors
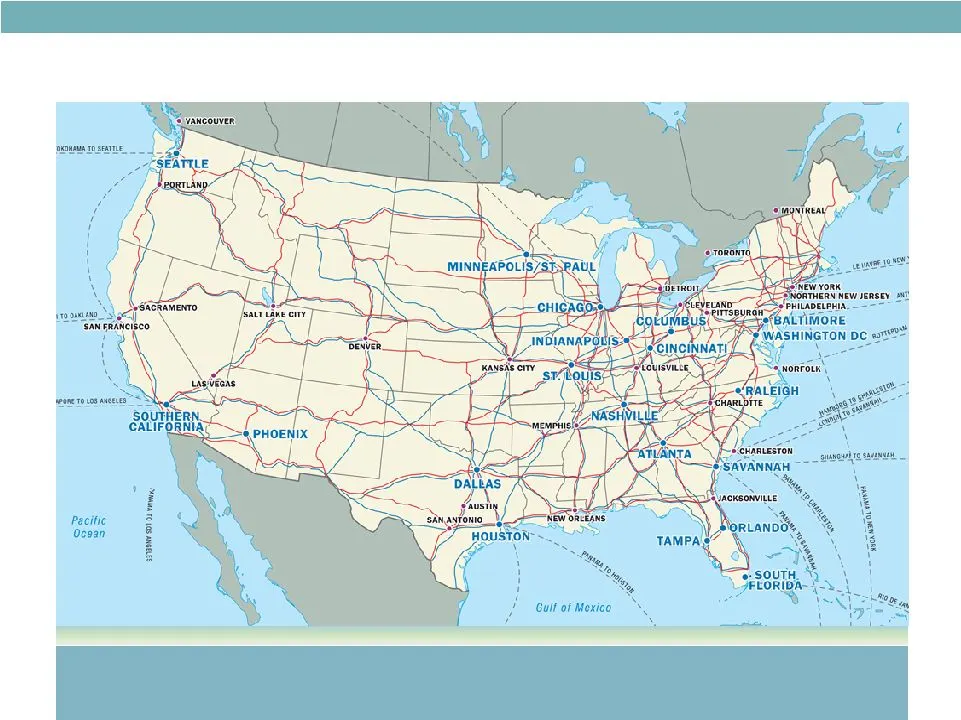
RELIABLE. ANSWERS . U.S. Rail and Highway Logistics Routes & Corridors Duke Realty’s Primary Markets Strategically Placed in Key Distribution Corridors Note : Duke Realty Primary Industrial Markets in Bold Blue ; Rail lines in medium blue, Interstate highway system in red lines
Slide 41: Midwest Overview
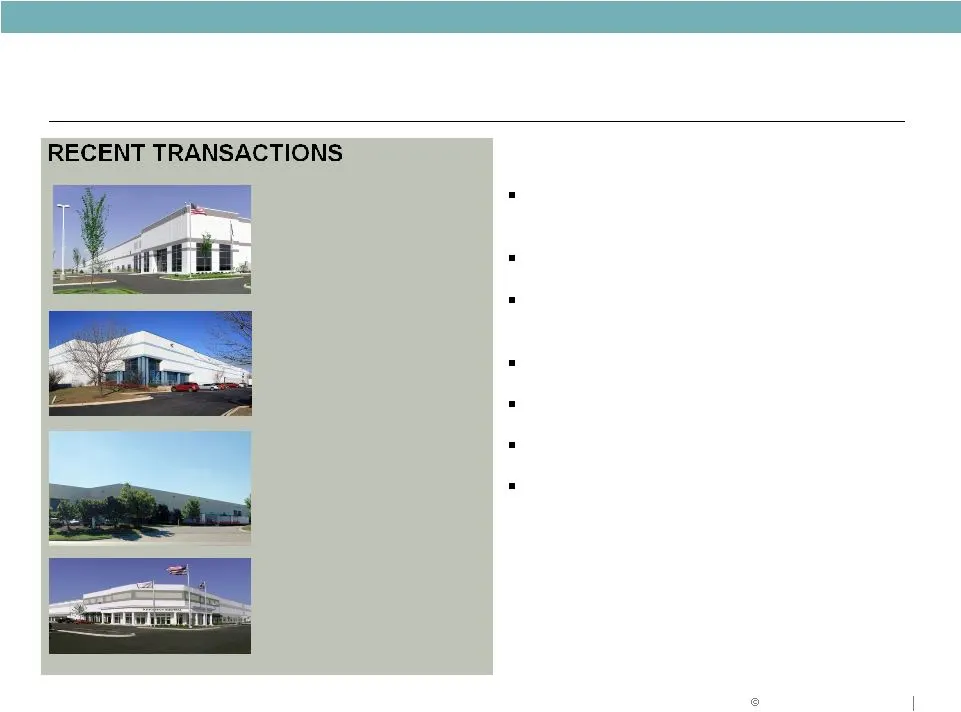
MIDWEST OVERVIEW Midwest Expansion - Industrial Restoration Hardware Columbus 418,655 SF Term 15 years Renewal & Expansion – Industrial McGraw-Hill Companies Columbus 668,000 SF Weighted Term 5.5 years MARKET OVERVIEW & KEY POINTS Committed to Midwest because we perform… Midwest remains a key compon
Slide 42: Midwest Overview
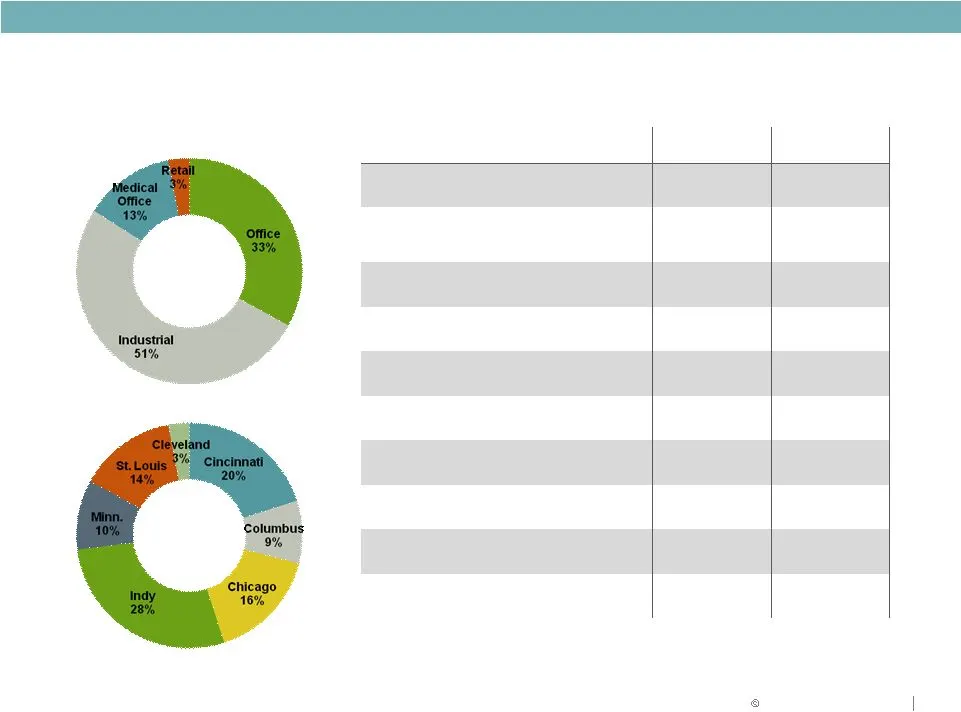
MIDWEST OVERVIEW Midwest Overview Location Product Type Industrial Office Average Age 12.4 years 17.2 years Average Building Size 259,000 SF 126,000 SF Total Square Footage 57.7 million 12.3 million Current Occupancy 95.7% 83.8% Indianapolis 94.3% 92.3% Chicago 96.9% 90.2% Cincinnati 94.5% 84.6% St.

Slide 43: Midwest Focus
MIDWEST OVERVIEW Midwest Focus DOMINANT POSITION BULK INDUSTRIAL REDUCE OFFICE CONCENTRATION Enhancing dominant industrial position in Midwest

Slide 44: East & Southeast Overview Performance Update
EAST & SOUTHEAST OVERVIEW Performance Update
Slide 45: East & Southeast Overview
EAST & SOUTHEAST OVERVIEW RECENT TRANSACTIONS East & Southeast Overview Disposition – Industrial CapTrust Tower Raleigh 300,00 SF Leased: 95% MARKET OVERVIEW & KEY POINTS New/Renewal - Office Liberty Center II Washington, D.C. Scitor Corp 159,000 SF Term: 10 years Renewal - Industrial Port City Logi
Slide 46: East & Southeast Overview
EAST & SOUTHEAST OVERVIEW East & Southeast Overview Location Product Type Industrial Office Average Age 10.0 years 10.8 years Average Building Size 169,000 SF 114,000 SF Total Square Footage 30.0 million 9.4 million Current Occupancy 91.3% 88.5% Atlanta 87.9% 86.5% South Florida 89.8% 87.4% Raleigh
Slide 47: East & Southeast Focus
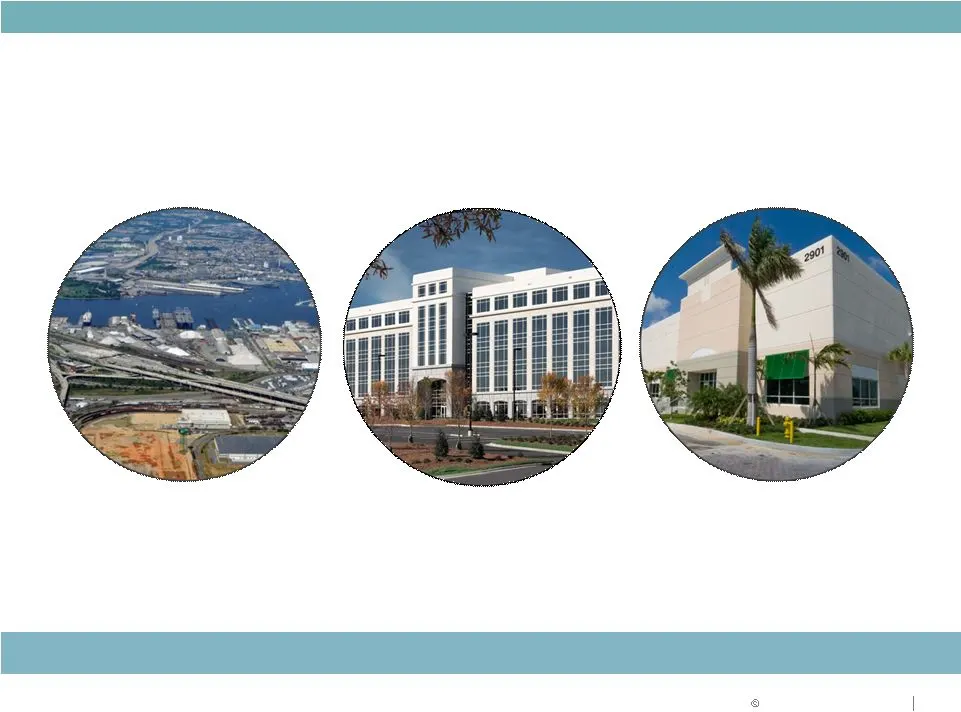
EAST & SOUTHEAST OVERVIEW East & Southeast Focus BULK INDUSTRIAL/PORTS LEASE UP AND RENT GROWTH ACQUISITIONS & DEVELOPMENT Maximize assets and market position

Slide 48: South & West Overview Performance Update
SOUTH & WEST OVERVIEW Performance Update
Slide 49: South & West
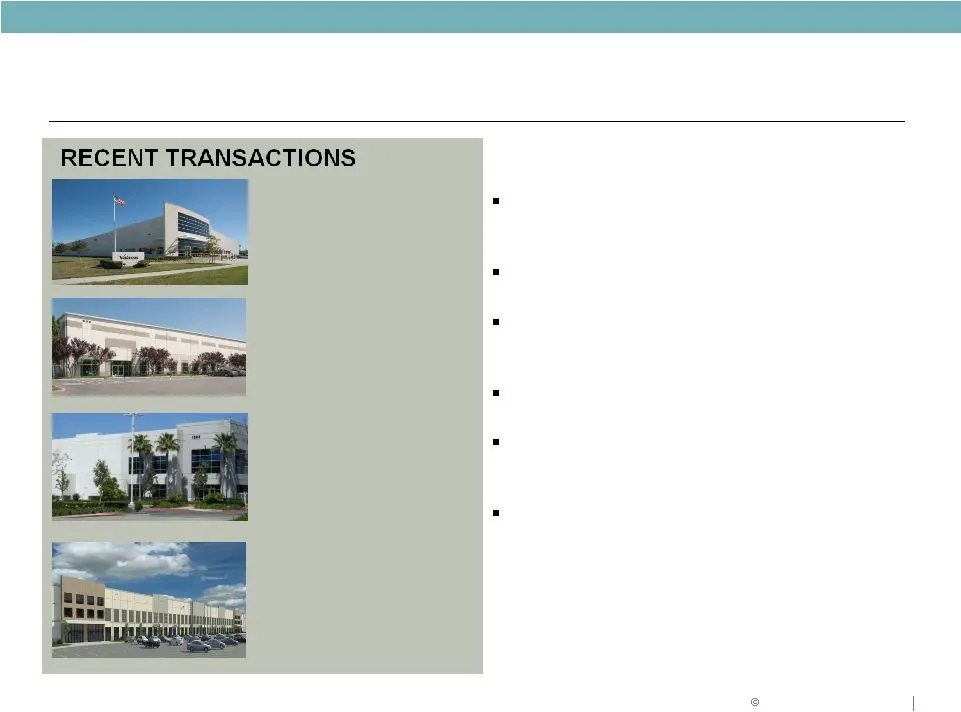
SOUTH & WEST OVERVIEW South & West Acquisition – Industrial Northern California Delicato Wines 552,000 SF Leased: 100% Acquisition - Industrial Northern California ConAgra 727,000 SF Leased: 100% MARKET OVERVIEW & KEY POINTS New Lease - Industrial Greater Seattle Area Internet Retailer 1,016,000 SF
Slide 50: South & West Overview
SOUTH & WEST OVERVIEW South & West Overview Location Product Type Industrial Office Average Age 9.3 years 8.3 years Average Building Size 291,000 SF 110,000 SF Total Square Footage 26.8 million 1.8 million Current Occupancy 92.6% 86.6% Dallas 90.8% 100.0% Nashville 95.8% 93.3% Houston 100.0% 61.2% P
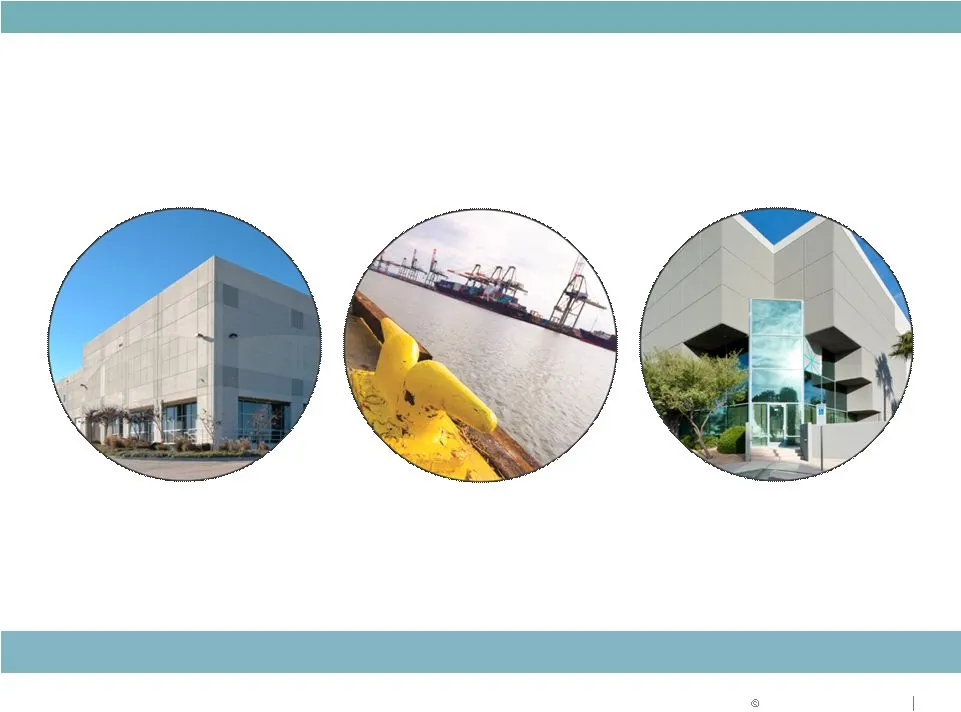
Slide 51: South & West Focus
SOUTH & WEST OVERVIEW South & West Focus DALLAS LEASE-UP HOUSTON INDUSTRIAL PORT DALLAS INLAND PORT SOUTHERN CALIFORNIA EXPANSION Grow
Slide 52: Duke Realty Benchmarking Statistics
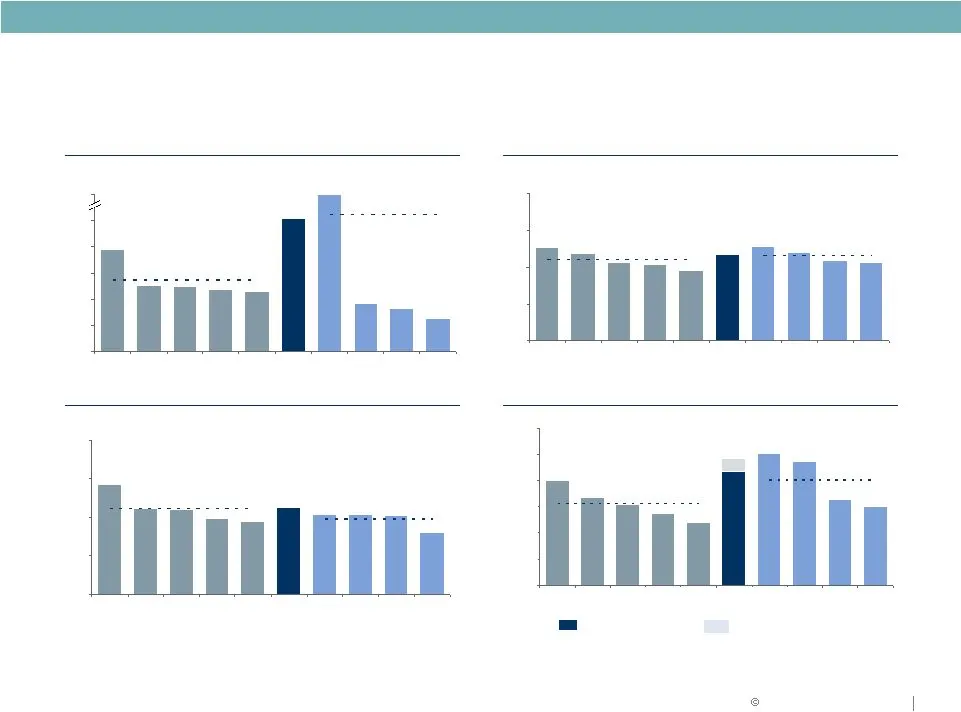
RELIABLE. ANSWERS . 93.0% 89.2% 88.3% 90.0% 89.9% 87.2% 92.1% 95.1% 94.2% 89.0% 94.6% 80% 83% 86% 89% 92% 95% 98% LRY HIW OFC BDN CLI DRE EGP PLD FR DCT $7,753 $3,678 $3,226 $2,543 $5,053 $4,574 $4,727 $4,951 $10,134 $0 $2,000 $4,000 $6,000 $8,000 $10,000 $12,000 LRY HIW CLI BDN OFC DRE PLD DCT FR E
Slide 53: Duke Realty Valuation Statistics
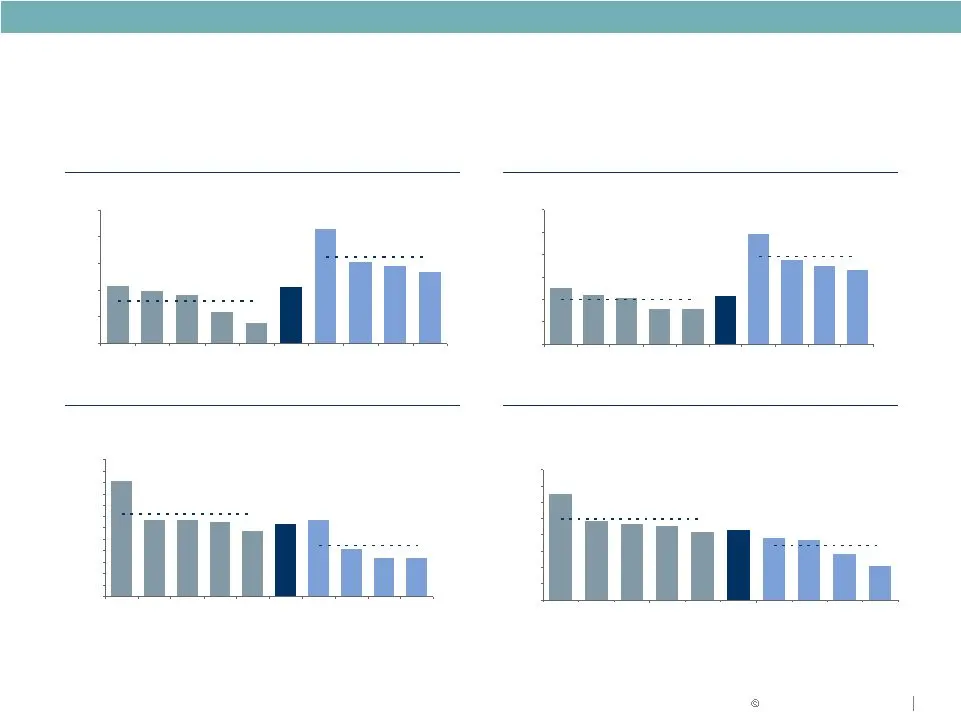
RELIABLE. ANSWERS . Industrial Average: 18.9x Office Average: 12.4x 14.7x 13.9x 14.6x 23.2x 9.1x 13.3x 17.6x 10.8x 18.2x 16.8x 6.0x 10.0x 14.0x 18.0x 22.0x 26.0x LRY OFC HIW CLI BDN DRE PLD EGP FR DCT Industrial Average: 25.6x Industrial Average: 3.4% Office Average: 18.0x Office Average: 5.0% Offic
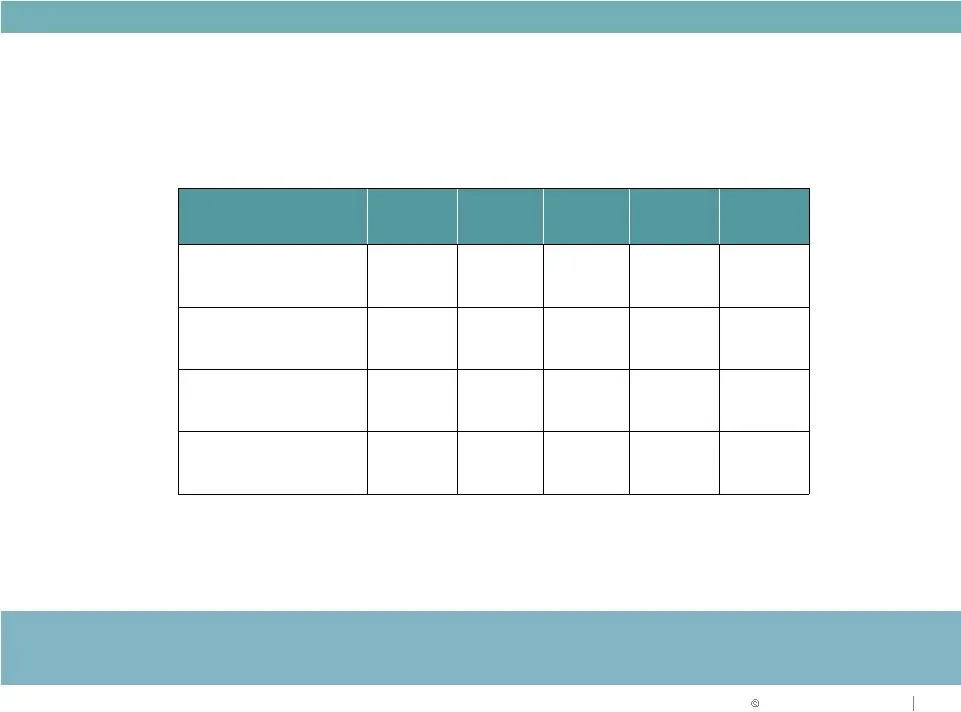
Slide 54: Historical Barra Beta Analysis 2002-2013
RELIABLE. ANSWERS . Historical Barra Beta Analysis 2002-2013 Current (1) 1 Year Avg 5 Year Avg 10 Year Avg 12/31/11 DRE 1.19 1.28 1.55 1.16 1.49 Office Comps (2) 1.05 1.12 1.27 0.99 1.26 Industrial Comps (3)(4) 1.05 1.14 1.40 1.00 1.28 Healthcare Comps (5) 0.91 0.98 1.20 0.98 1.07 Notes 1. As of mos

Slide 55: Forward-Looking Statement
RELIABLE. ANSWERS . Forward-Looking Statement This slide presentation contains statements that constitute “forward-looking statements” within the meaning of the Securities Act of 1933 and the Securities Exchange Act of 1934 as amended by the Private Securities Litigation Reform Act of 1995. These fo
Source: SEC EDGAR · 8-K filed Mar 4, 2013
More decks from Duke Realty Corporation
 Merger or Acquisition (June 2022)14 slides · Jun 13, 2022
 Investor Presentation (June 2021)58 slides · Jun 7, 2021
 Investor Presentation (May 2021)44 slides · May 10, 2021
 Investor Presentation (February 2021)58 slides · Feb 22, 2021
 NAREIT REITworld Virtual Investor Conference 202056 slides · Nov 16, 2020
 B of A Securities 2020 Global Real Estate Conference56 slides · Sep 15, 2020