Aryzta AG · SIX:ARYN
Aryzta — FY2018 Earnings Presentation
59 slides from Aryzta's earnings presentation, October 2018

Slide 1: ARYZTA | A Global Leader in Frozen Bakery
ARYZTA | A Global Leader in Frozen Bakery October 2018
Slide 2: Disclaimer
Disclaimer These materials may not be published, distributed or transmitted, directly or indirectly, in or into the United States, Canada, Australia or Japan. These materials are not an offer of securities of ARYZTA AG (the “Company”), are for background purposes only and do not purport to be full o
Slide 3: Agenda
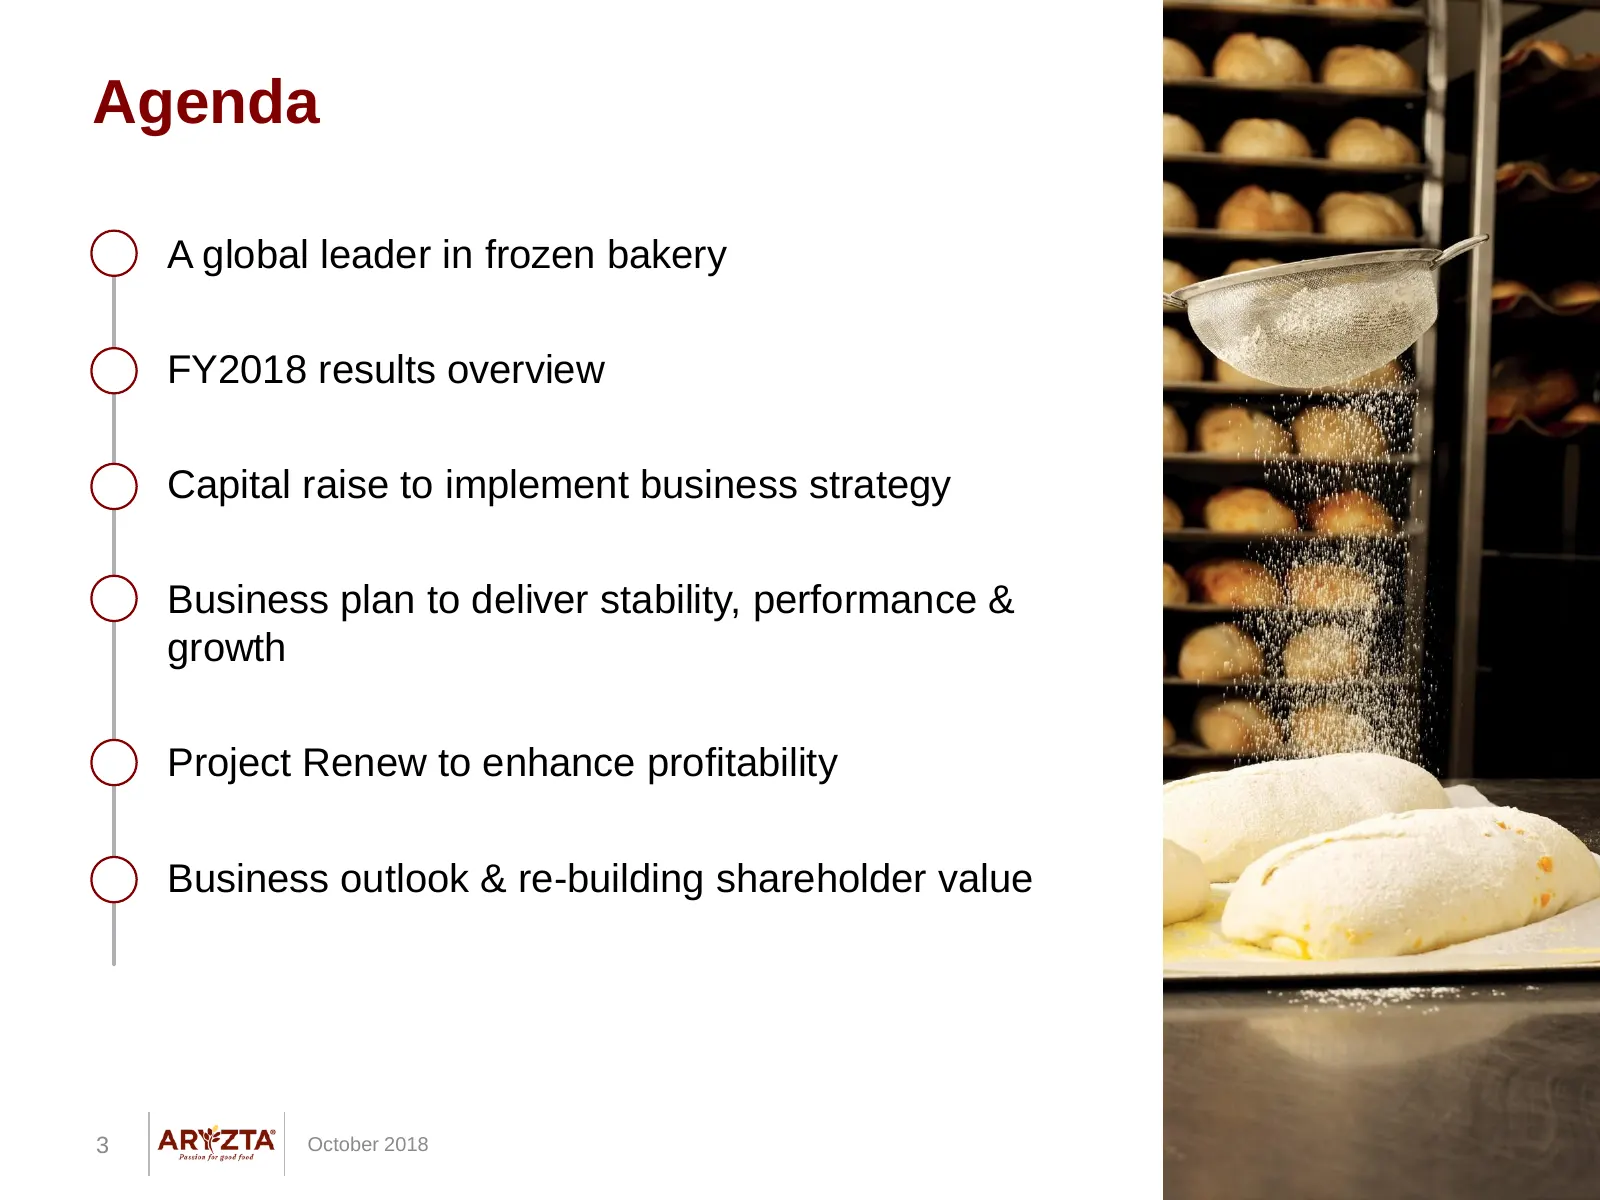
Agenda • A global leader in frozen bakery • FY2018 results overview • Capital raise to implement business strategy • Business plan to deliver stability, performance & growth • Project Renew to enhance profitability • Business outlook & re-building shareholder value 3 October 2018
Slide 4: Investment Case
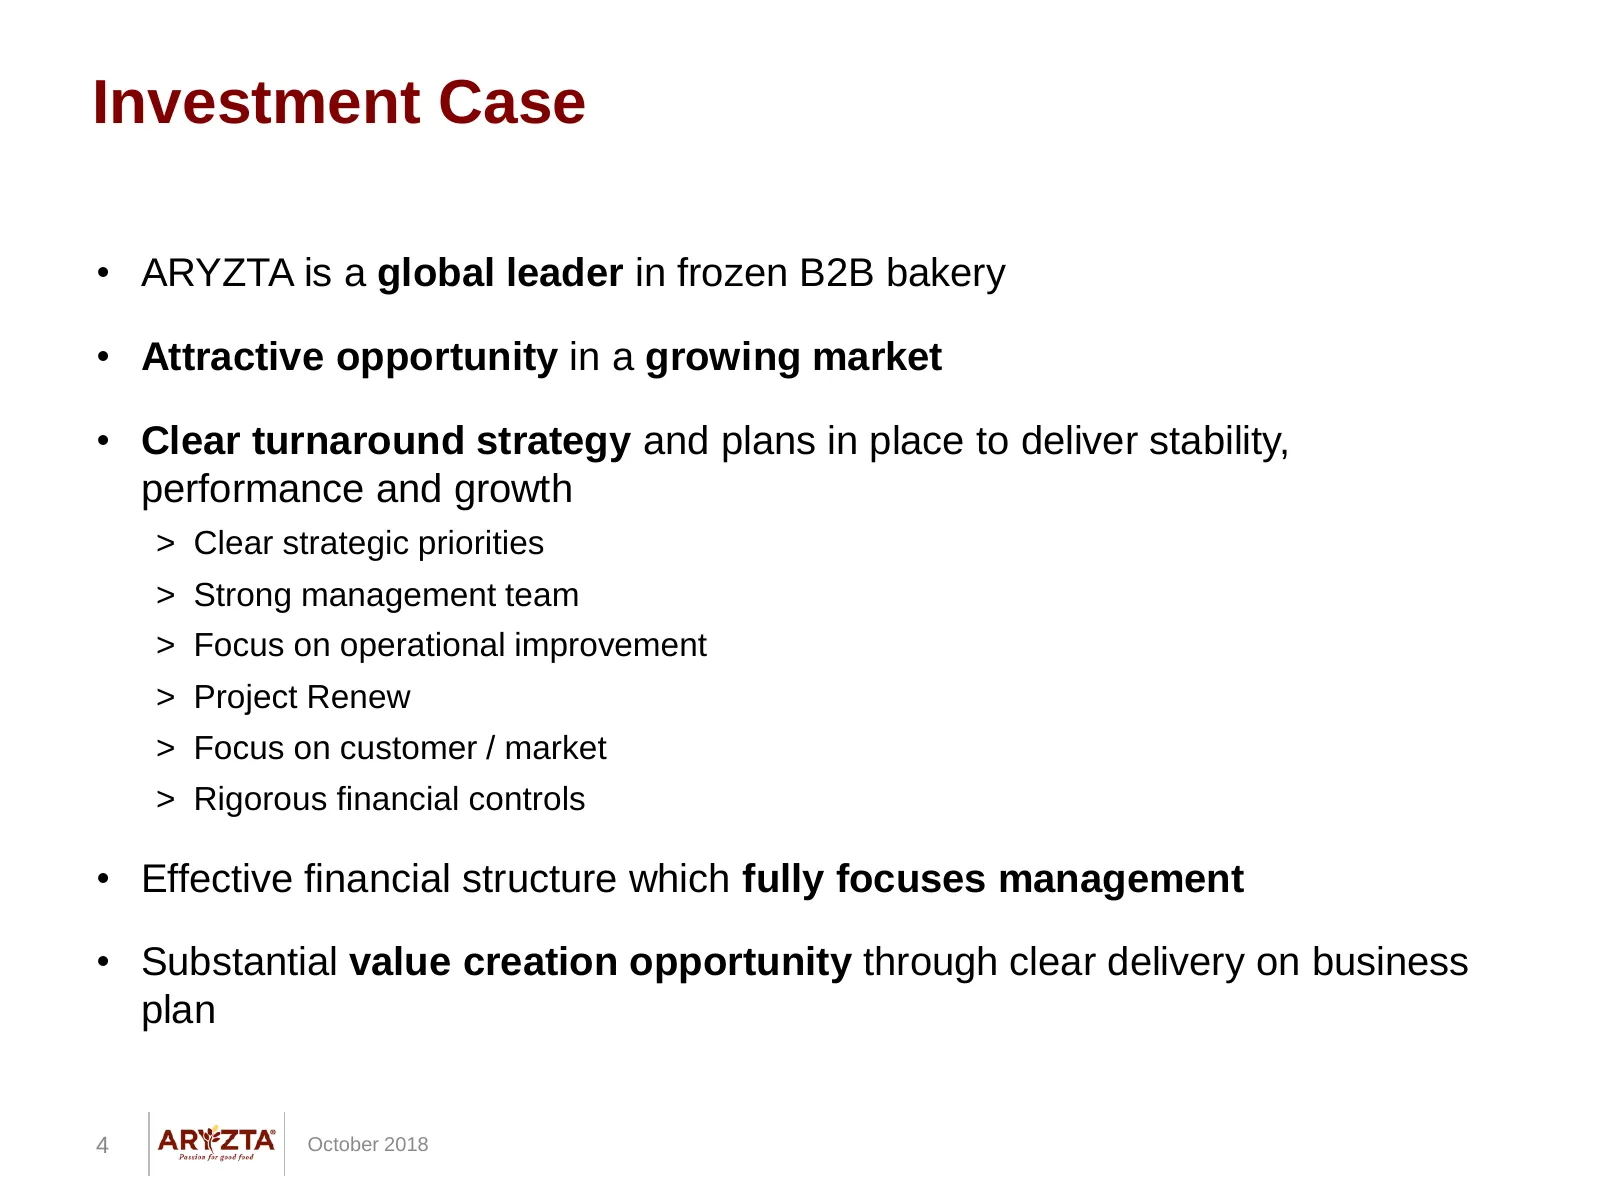
Investment Case • ARYZTA is a global leader in frozen B2B bakery • Attractive opportunity in a growing market • Clear turnaround strategy and plans in place to deliver stability, performance and growth > Clear strategic priorities > Strong management team > Focus on operational improvement > Project
Slide 5: Global Footprint in Frozen B2B Bakery
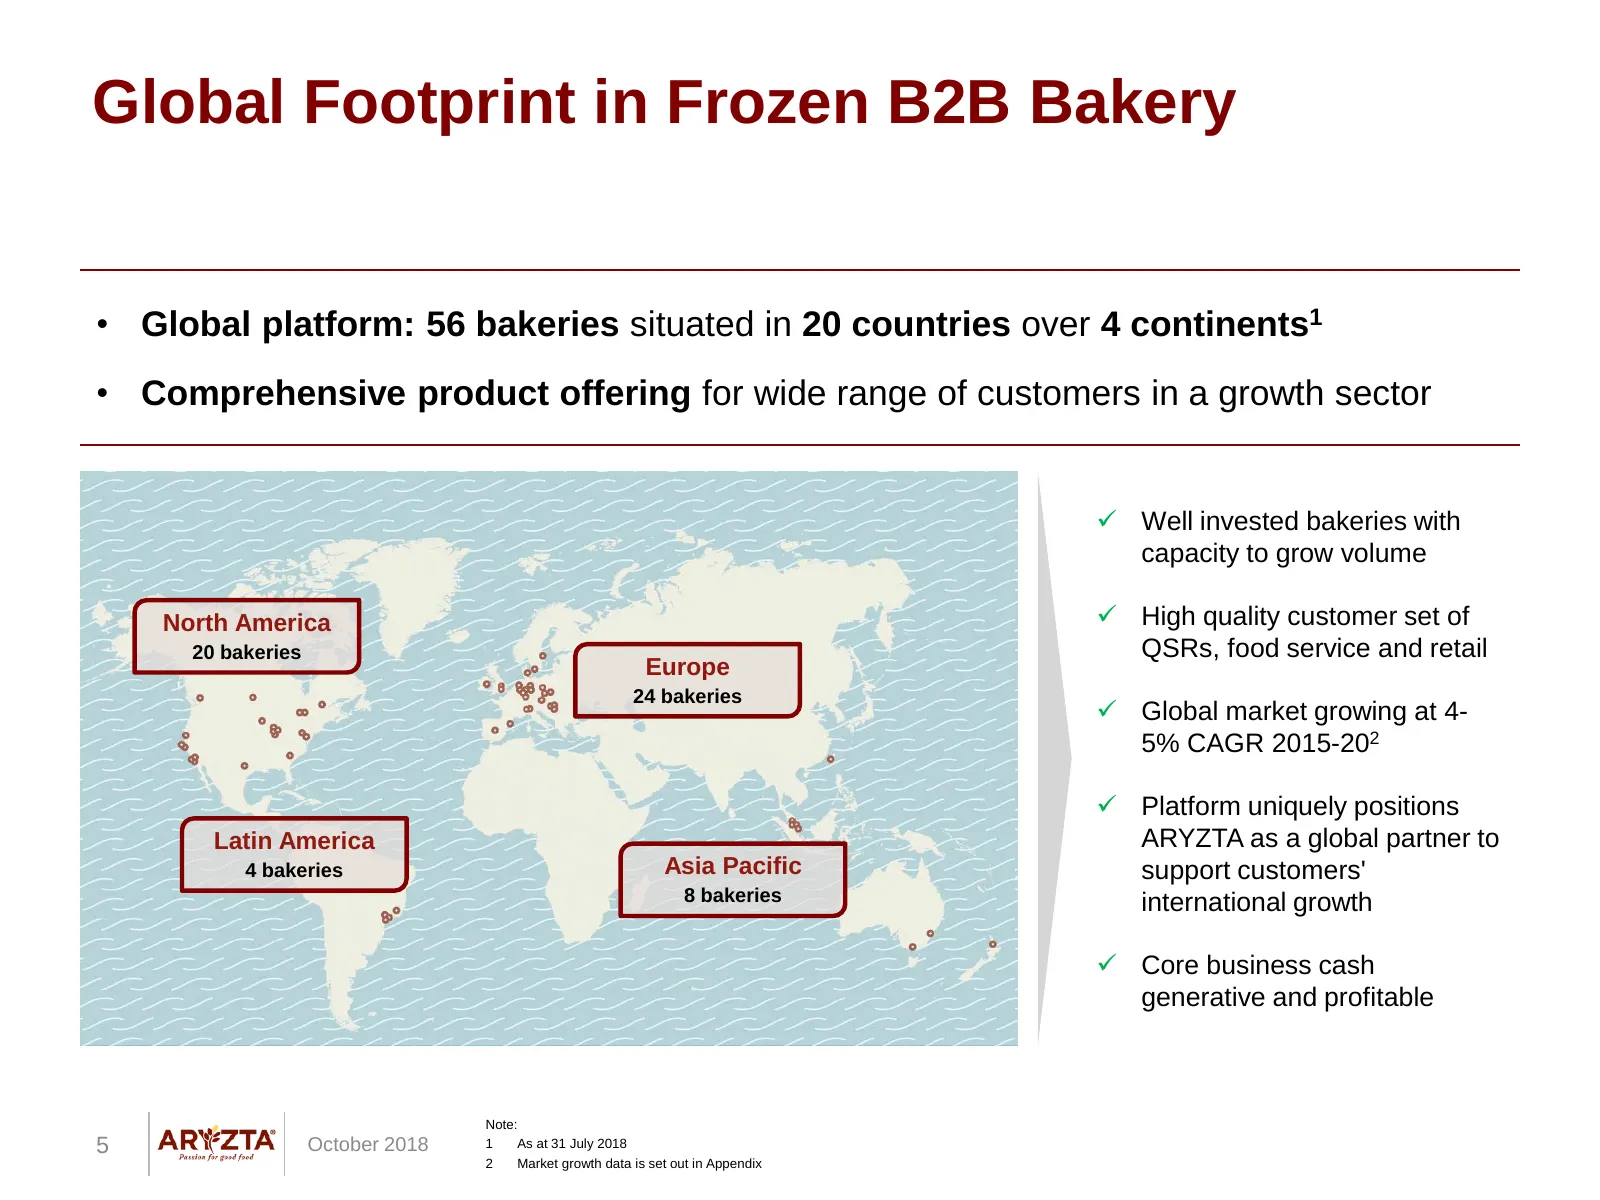
Global Footprint in Frozen B2B Bakery • Global platform: 56 bakeries situated in 20 countries over 4 continents1 • Comprehensive product offering for wide range of customers in a growth sector Well invested bakeries with capacity to grow volume North America High quality customer set of 20 baker
Slide 6: Legacy Issues vs. Core Strengths
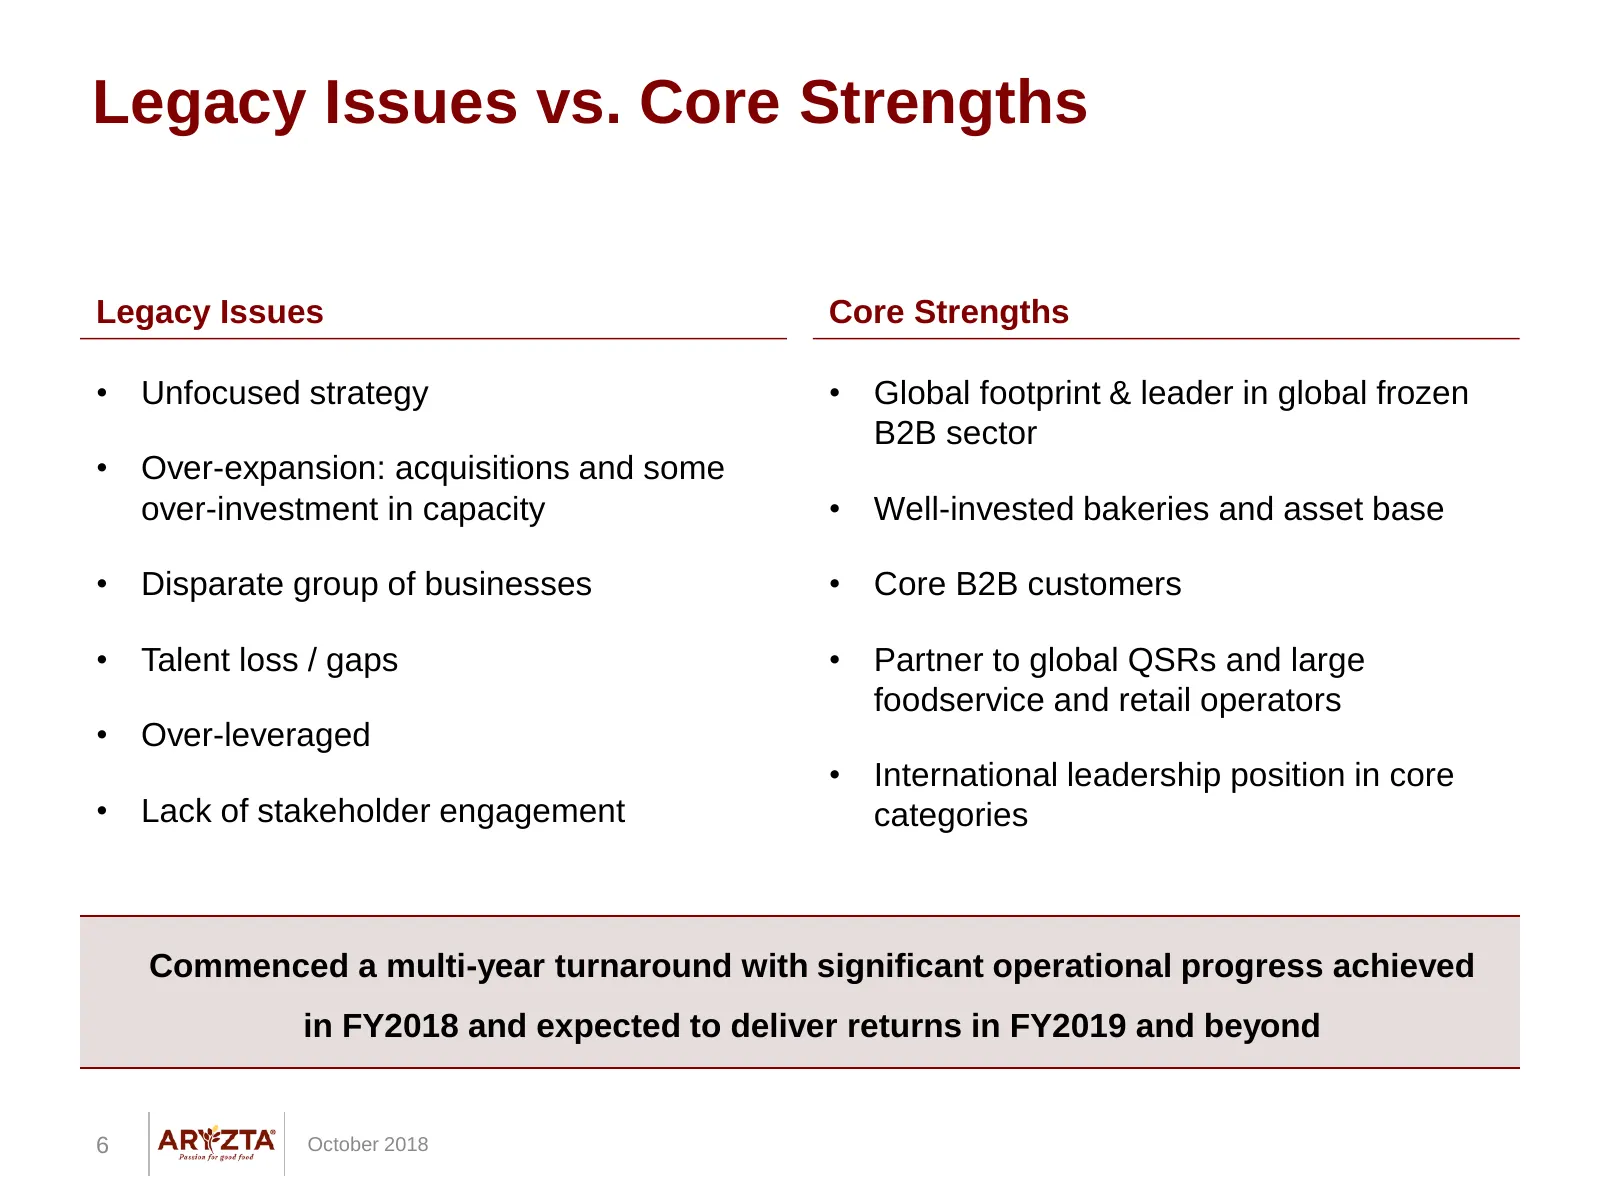
Legacy Issues vs. Core Strengths Legacy Issues Core Strengths • Unfocused strategy • Global footprint & leader in global frozen B2B sector • Over-expansion: acquisitions and some over-investment in capacity • Well-invested bakeries and asset base • Disparate group of businesses • Core B2B customers
Slide 7: Addressing Performance Headwinds
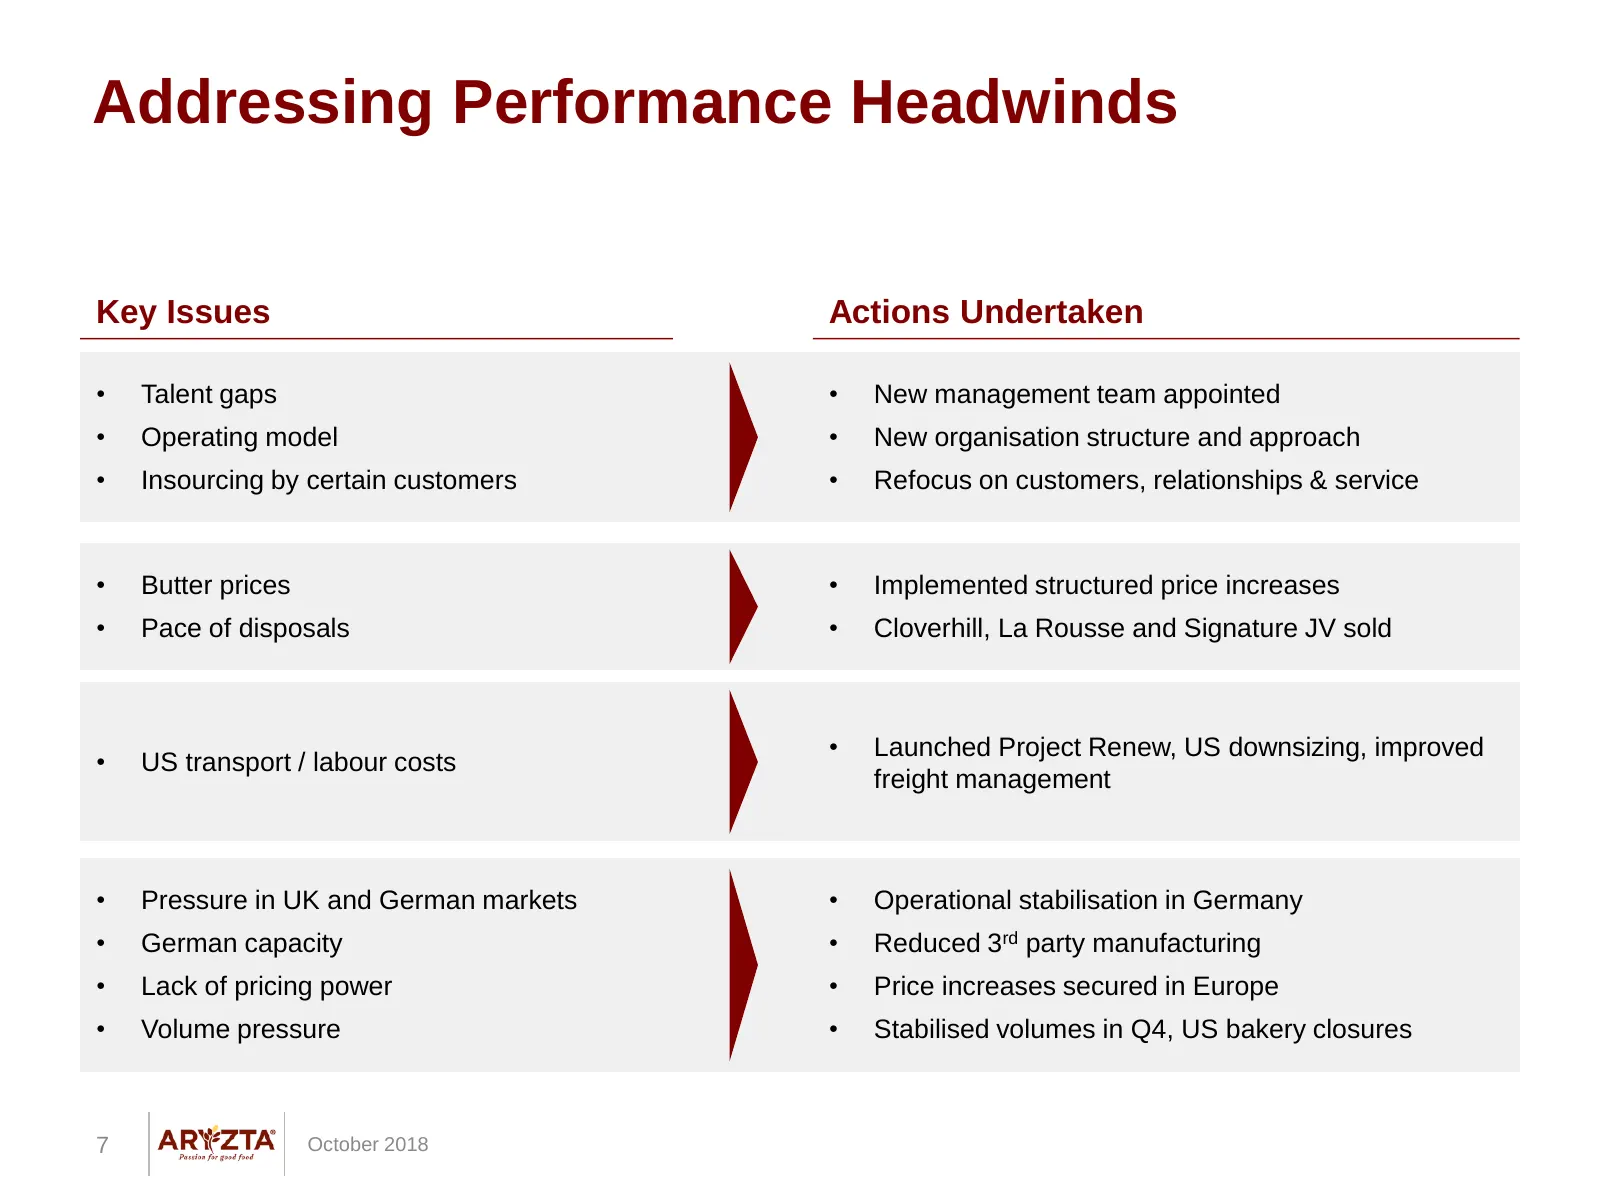
Addressing Performance Headwinds Key Issues Actions Undertaken • Talent gaps • New management team appointed • Operating model • New organisation structure and approach • Insourcing by certain customers • Refocus on customers, relationships & service • Butter prices • Implemented structured price in
Slide 8: €800m Capital Raise
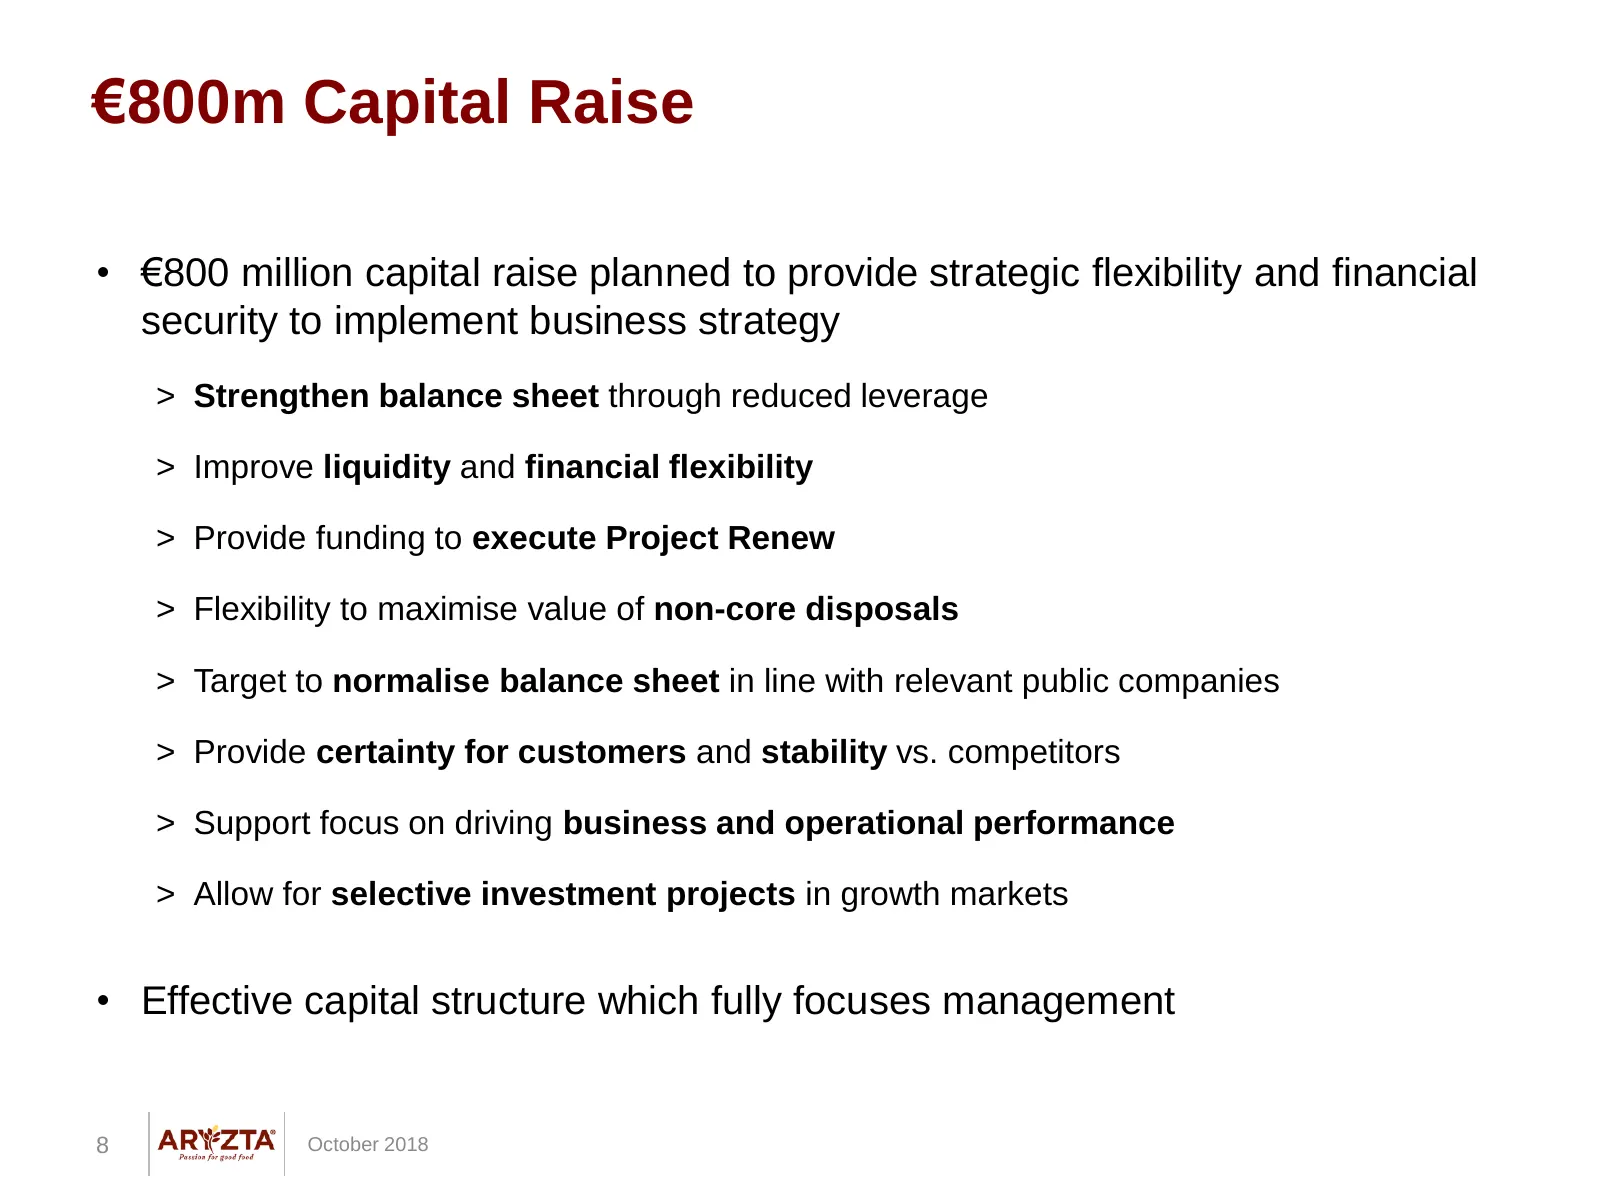
€800m Capital Raise • €800 million capital raise planned to provide strategic flexibility and financial security to implement business strategy > Strengthen balance sheet through reduced leverage > Improve liquidity and financial flexibility > Provide funding to execute Project Renew > Flexibility t
Slide 9: FY2018 Financial Review
FY2018 FINANCIAL REVIEW 9 October 2018
Slide 10: ARYZTA Group | Underlying Income Statement
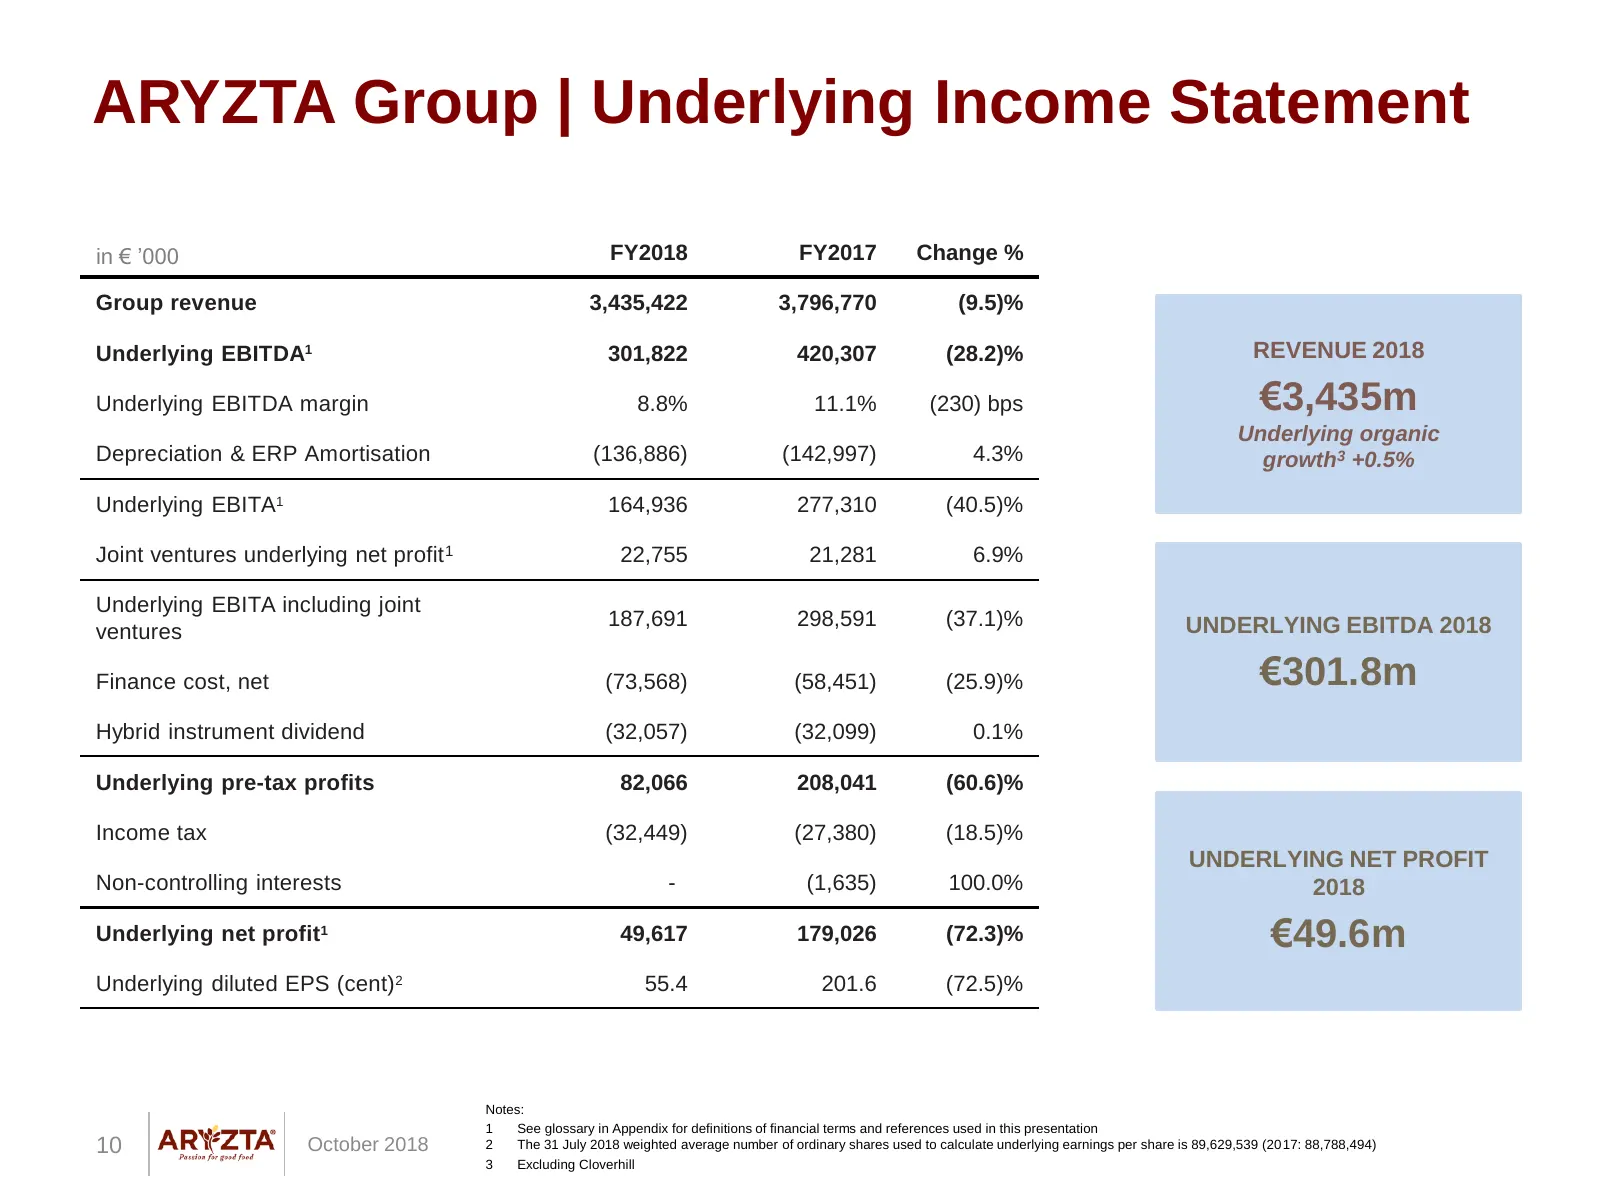
ARYZTA Group | Underlying Income Statement in € ’000 FY2018 FY2017 Change % Group revenue 3,435,422 3,796,770 (9.5)% Underlying EBITDA1 301,822 420,307 (28.2)% REVENUE 2018 Underlying EBITDA margin 8.8% 11.1% (230) bps €3,435m Underlying organic Depreciation & ERP Amortisation (136,886) (142,997) 4.
Slide 11: Underlying EBITDA to IFRS Reconciliation
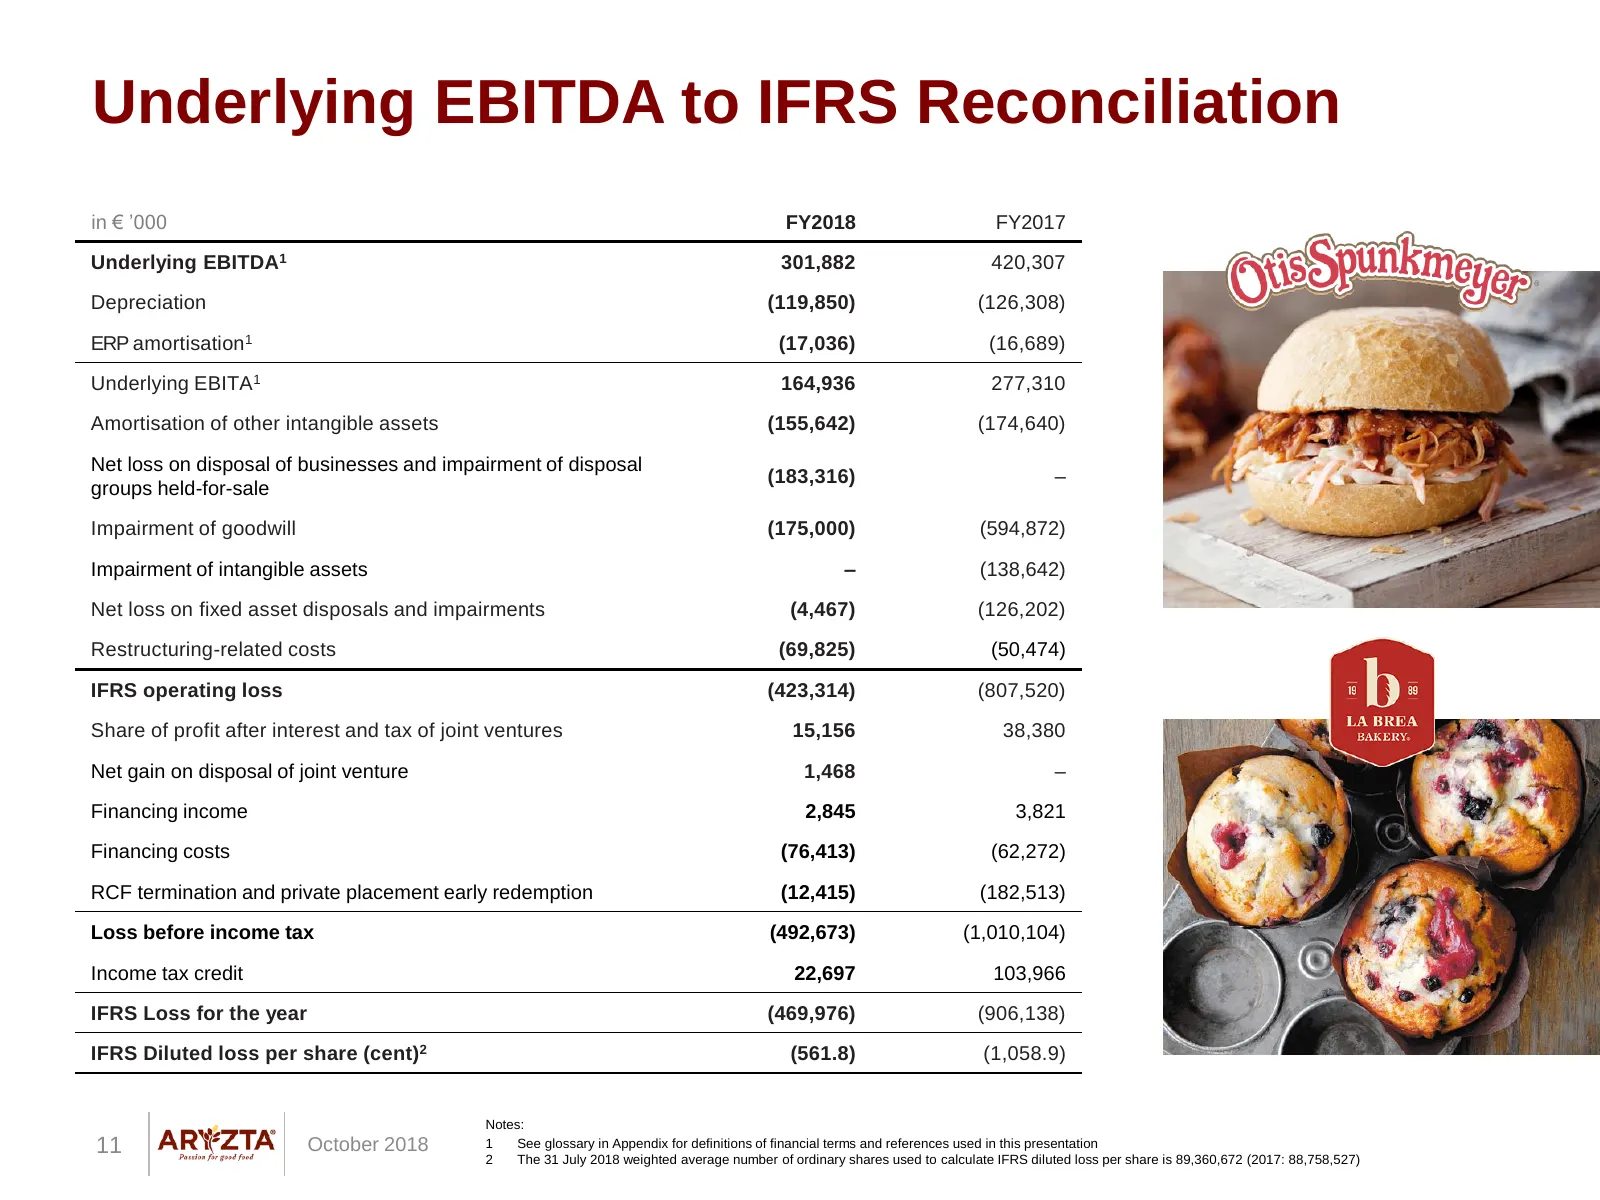
Underlying EBITDA to IFRS Reconciliation in € ’000 FY2018 FY2017 Underlying EBITDA1 301,882 420,307 Depreciation (119,850) (126,308) ERP amortisation 1 (17,036) (16,689) Underlying EBITA 1 164,936 277,310 Amortisation of other intangible assets (155,642) (174,640) Net loss on disposal of businesses
Slide 12: ARYZTA Group | Revenue
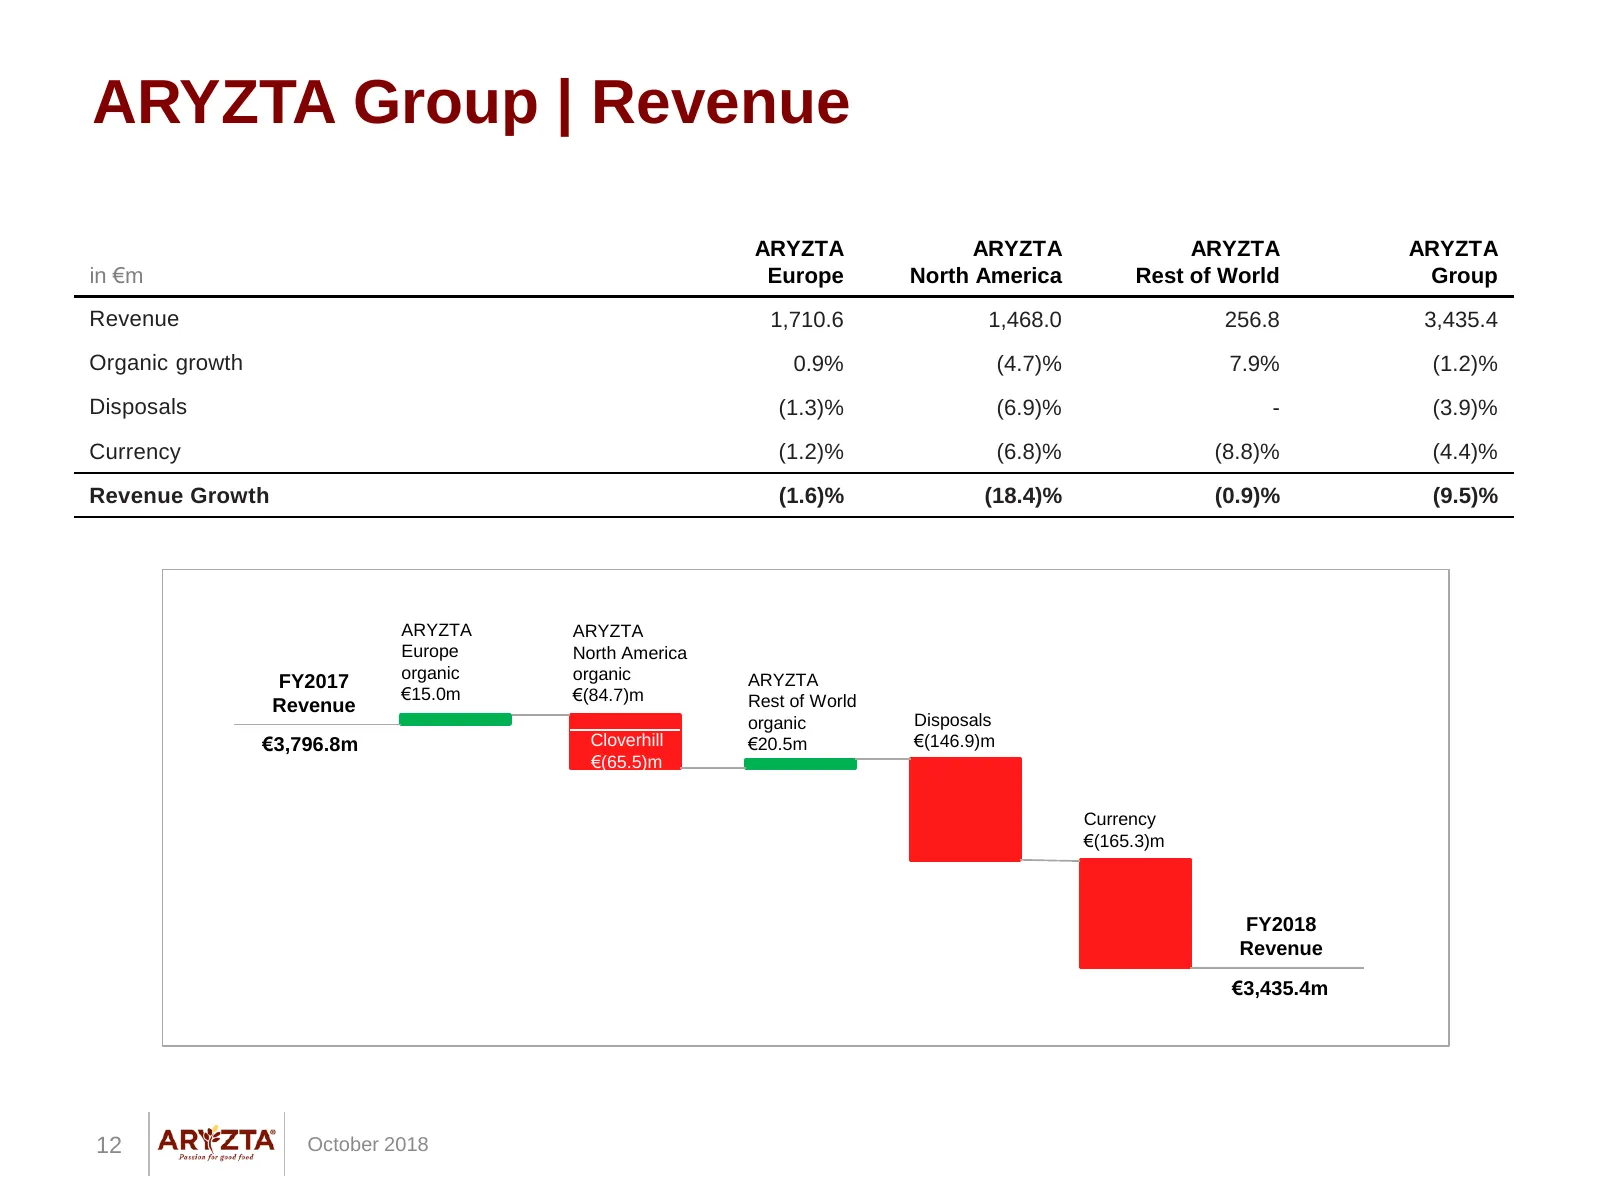
ARYZTA Group | Revenue ARYZTA ARYZTA ARYZTA ARYZTA in €m Europe North America Rest of World Group Revenue 1,710.6 1,468.0 256.8 3,435.4 Organic growth 0.9% (4.7)% 7.9% (1.2)% Disposals (1.3)% (6.9)% - (3.9)% Currency (1.2)% (6.8)% (8.8)% (4.4)% Revenue Growth (1.6)% (18.4)% (0.9)% (9.5)% ARYZTA ARYZ
Slide 13: Volume & Price / Mix Trend
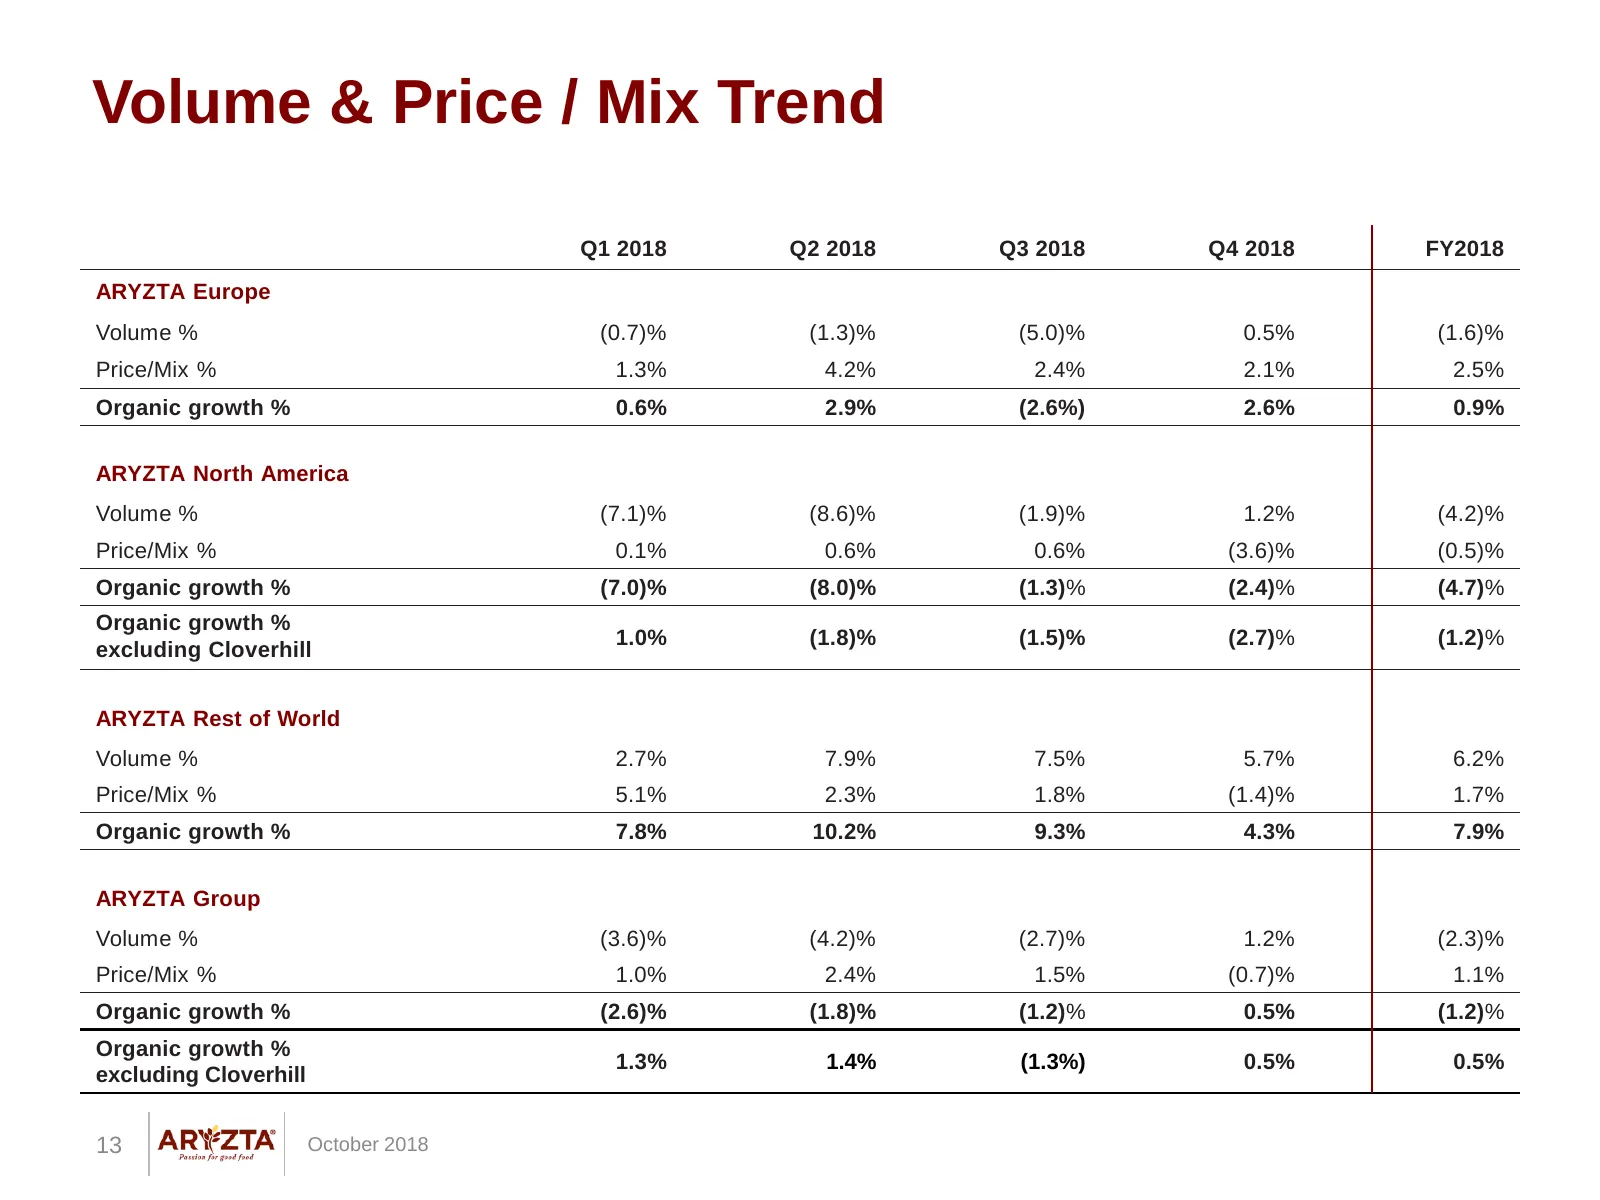
Volume & Price / Mix Trend Q1 2018 Q2 2018 Q3 2018 Q4 2018 FY2018 ARYZTA Europe Volume % (0.7)% (1.3)% (5.0)% 0.5% (1.6)% Price/Mix % 1.3% 4.2% 2.4% 2.1% 2.5% Organic growth % 0.6% 2.9% (2.6%) 2.6% 0.9% ARYZTA North America Volume % (7.1)% (8.6)% (1.9)% 1.2% (4.2)% Price/Mix % 0.1% 0.6% 0.6% (3.6)%
Slide 14: Segmental Underlying EBITDA
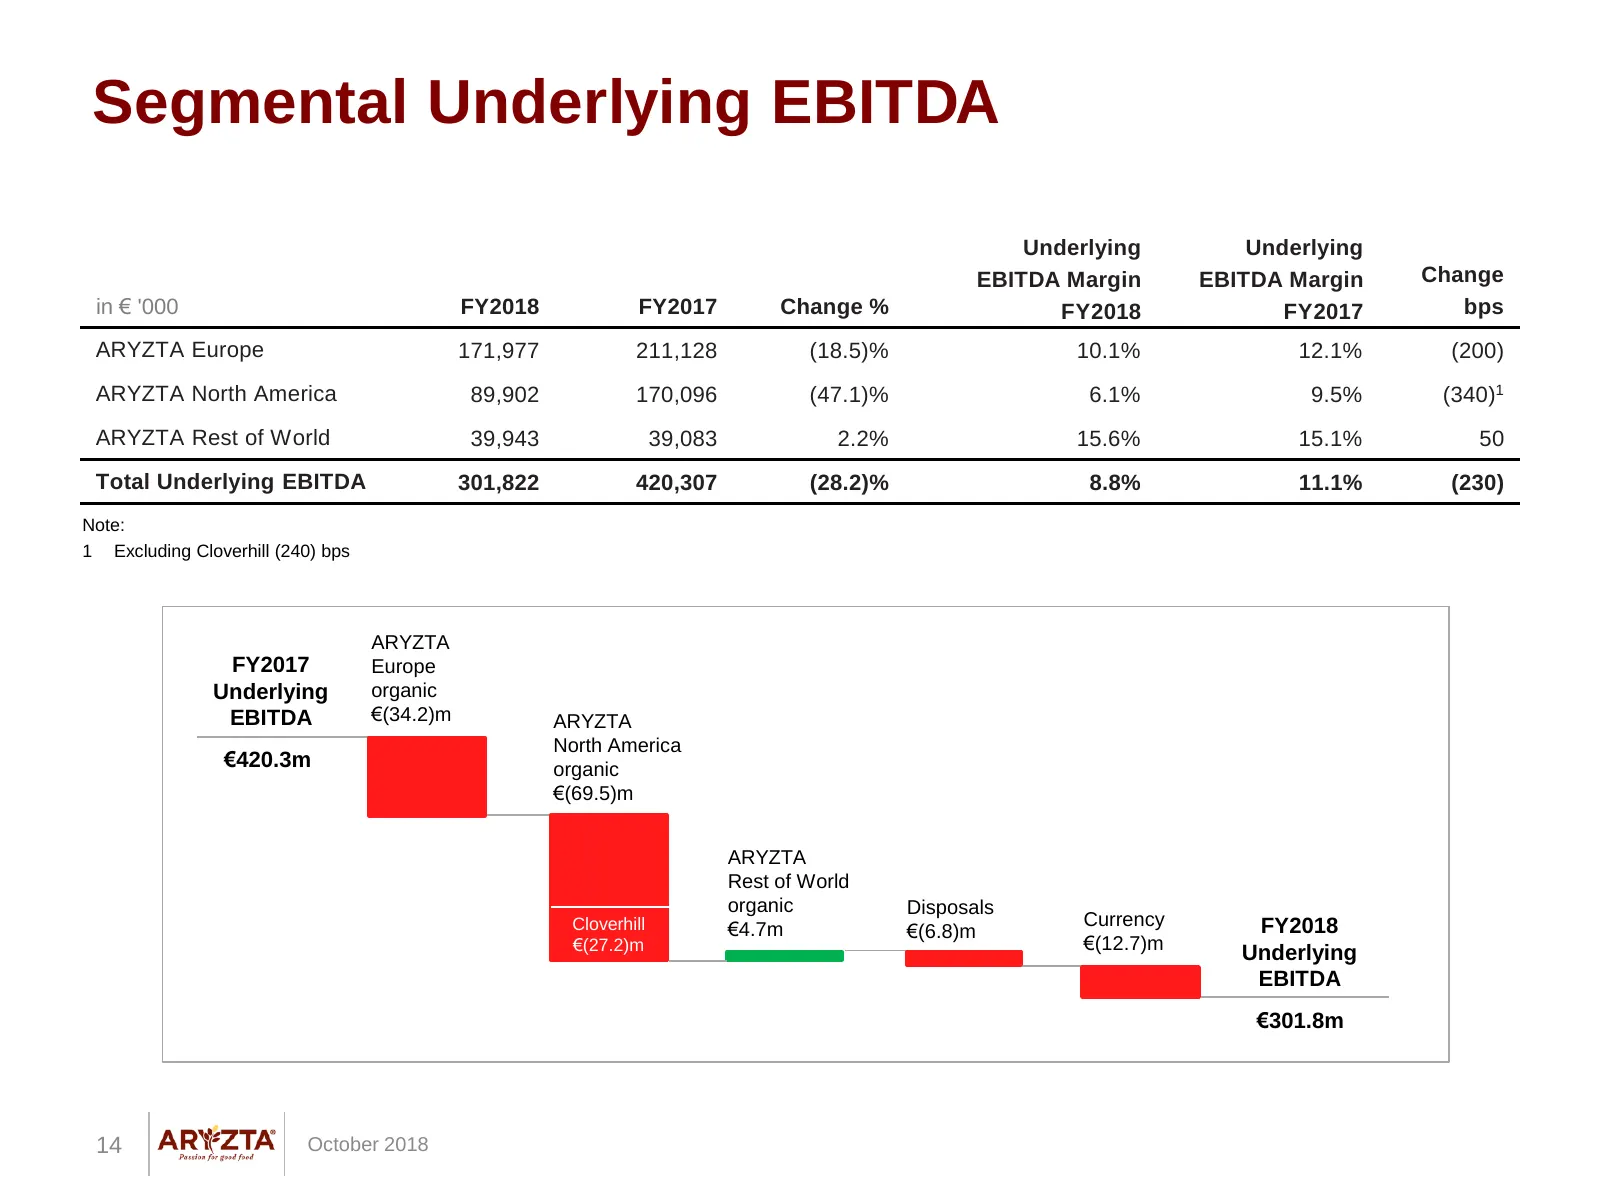
Segmental Underlying EBITDA Underlying Underlying EBITDA Margin EBITDA Margin Change in € '000 FY2018 FY2017 Change % FY2018 FY2017 bps ARYZTA Europe 171,977 211,128 (18.5)% 10.1% 12.1% (200) ARYZTA North America 89,902 170,096 (47.1)% 6.1% 9.5% (340)1 ARYZTA Rest of World 39,943 39,083 2.2% 15.6% 1
Slide 15: ARYZTA Europe
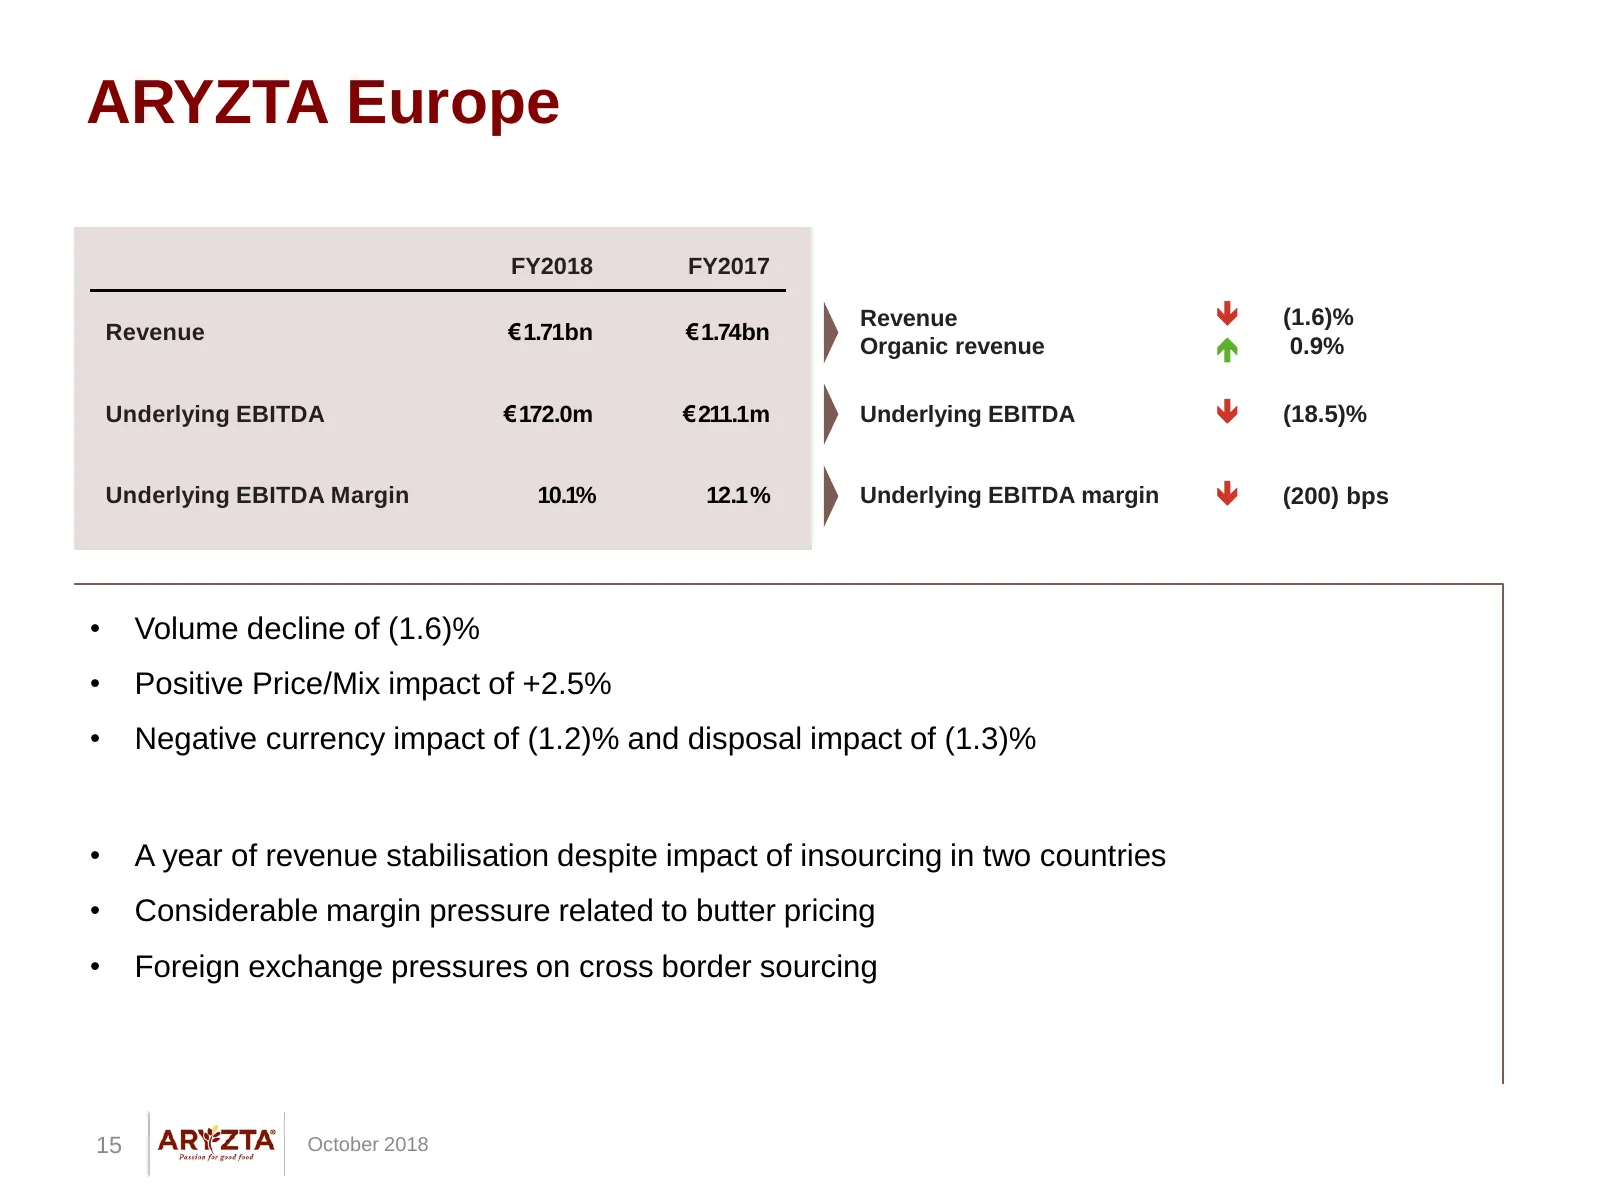
ARYZTA Europe FY2018 FY2017 Revenue (1.6)% Revenue € 1.71bn € 1.74bn Organic revenue 0.9% Underlying EBITDA € 172.0m € 211.1m Underlying EBITDA (18.5)% Underlying EBITDA Margin 10.1% 12.1 % Underlying EBITDA margin (200) bps • Volume decline of (1.6)% • Positive Price/Mix impact of +2.5% • N
Slide 16: ARYZTA North America
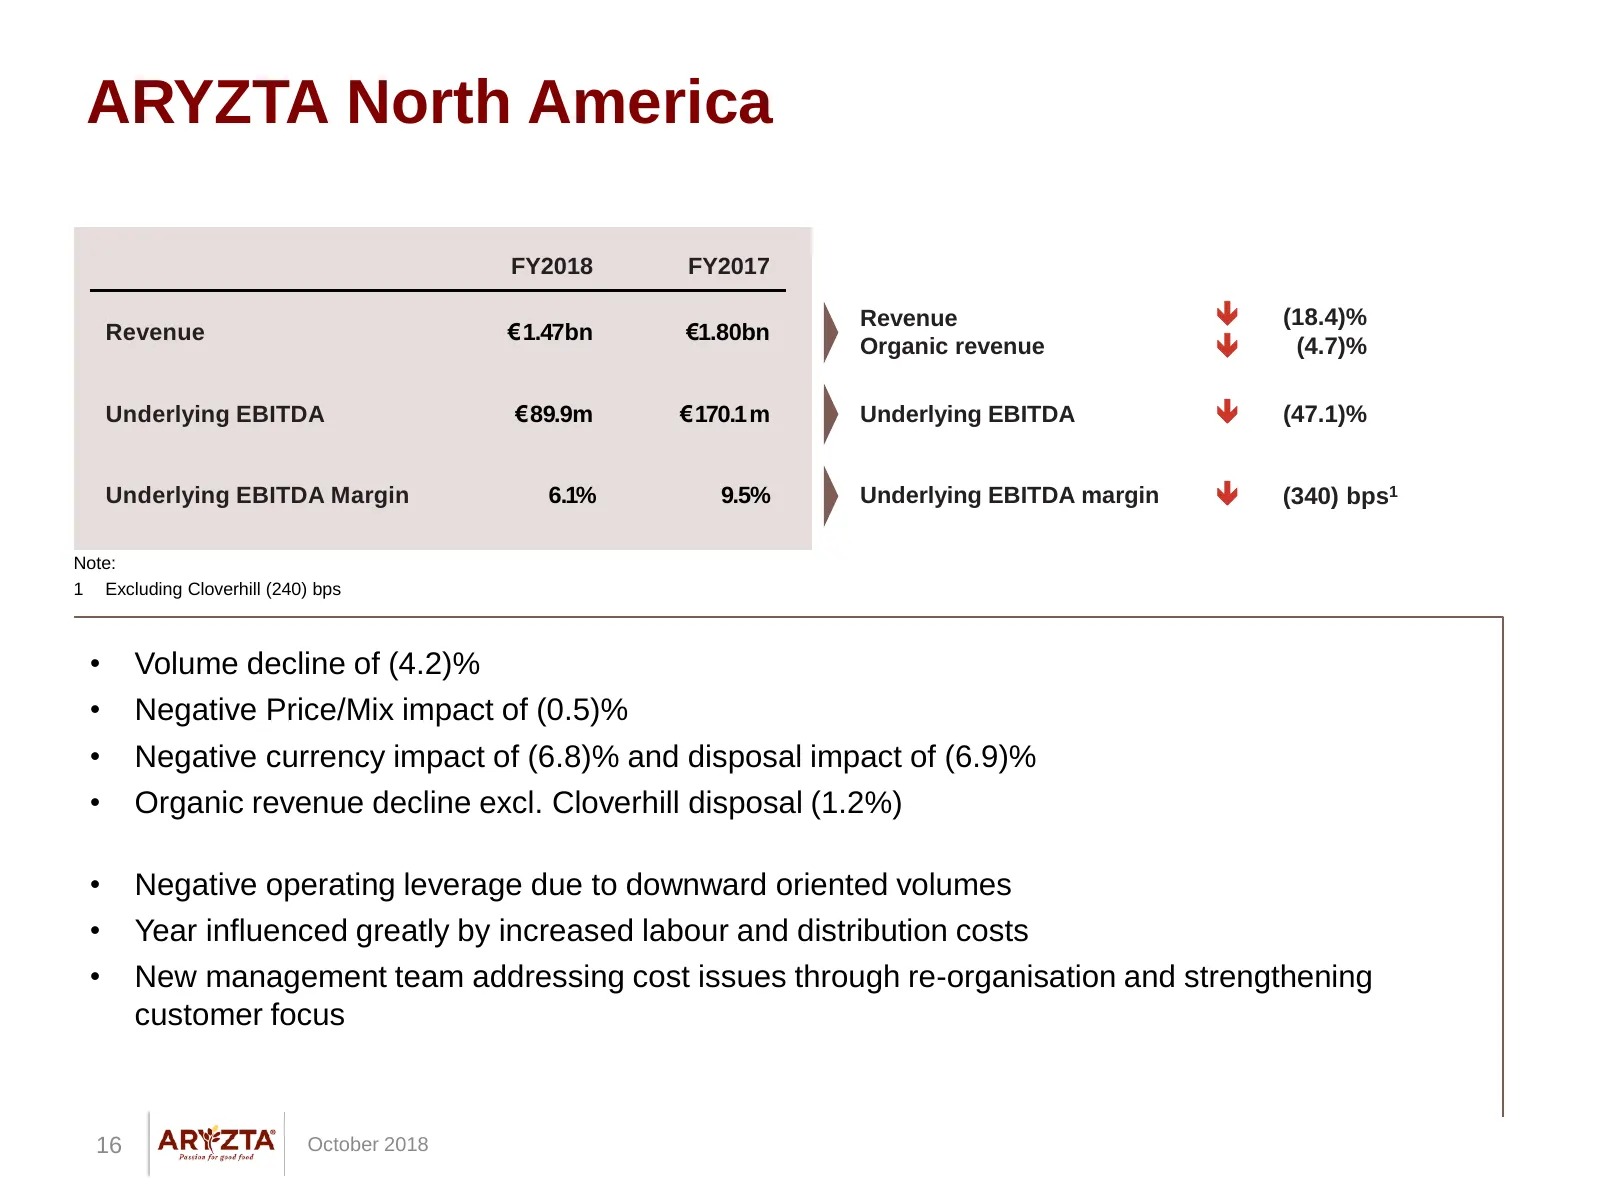
ARYZTA North America FY2018 FY2017 Revenue (18.4)% Revenue € 1.47bn €1.80bn Organic revenue (4.7)% Underlying EBITDA € 89.9m € 170.1 m Underlying EBITDA (47.1)% Underlying EBITDA Margin 6.1% 9.5% Underlying EBITDA margin (340) bps1 Note: 1 Excluding Cloverhill (240) bps • Volume decline of (
Slide 17: ARYZTA Rest of World
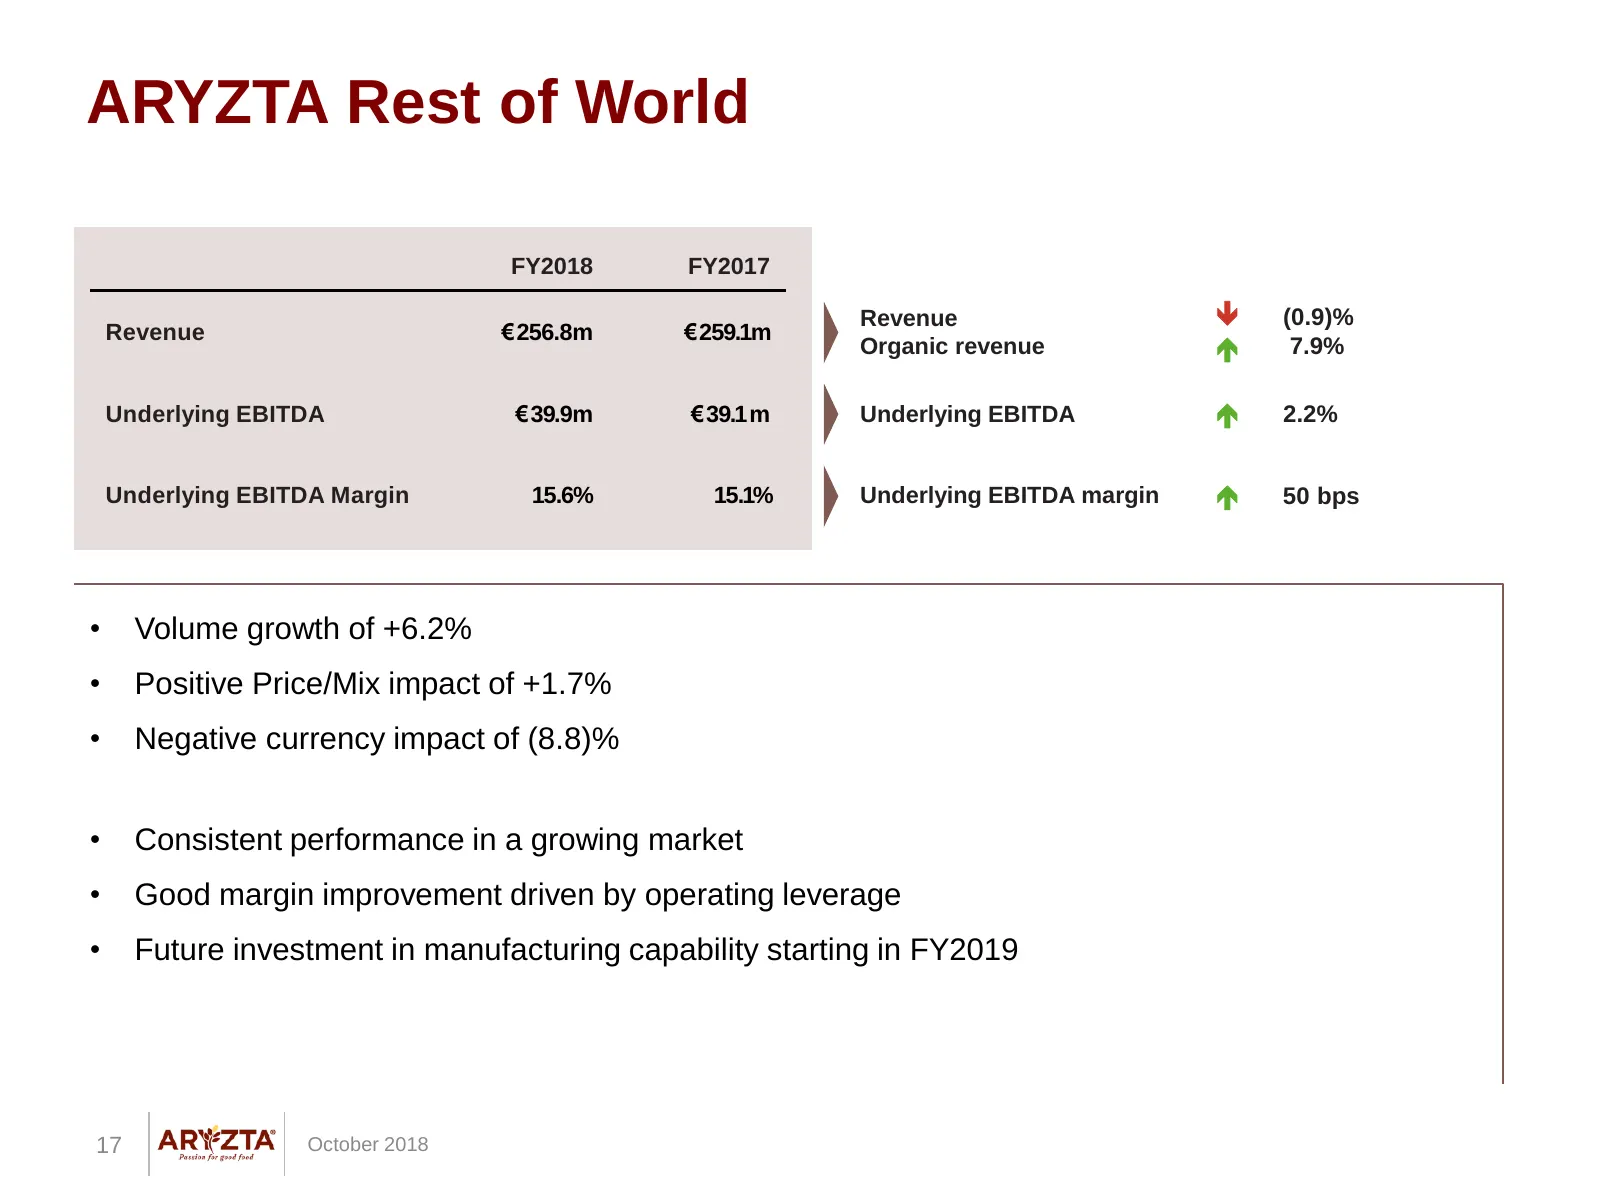
ARYZTA Rest of World FY2018 FY2017 Revenue (0.9)% Revenue € 256.8m € 259.1m Organic revenue 7.9% Underlying EBITDA € 39.9m € 39.1 m Underlying EBITDA 2.2% Underlying EBITDA Margin 15.6% 15.1% Underlying EBITDA margin 50 bps • Volume growth of +6.2% • Positive Price/Mix impact of +1.7% • Nega
Slide 18: Impairment, Disposal and Restructuring
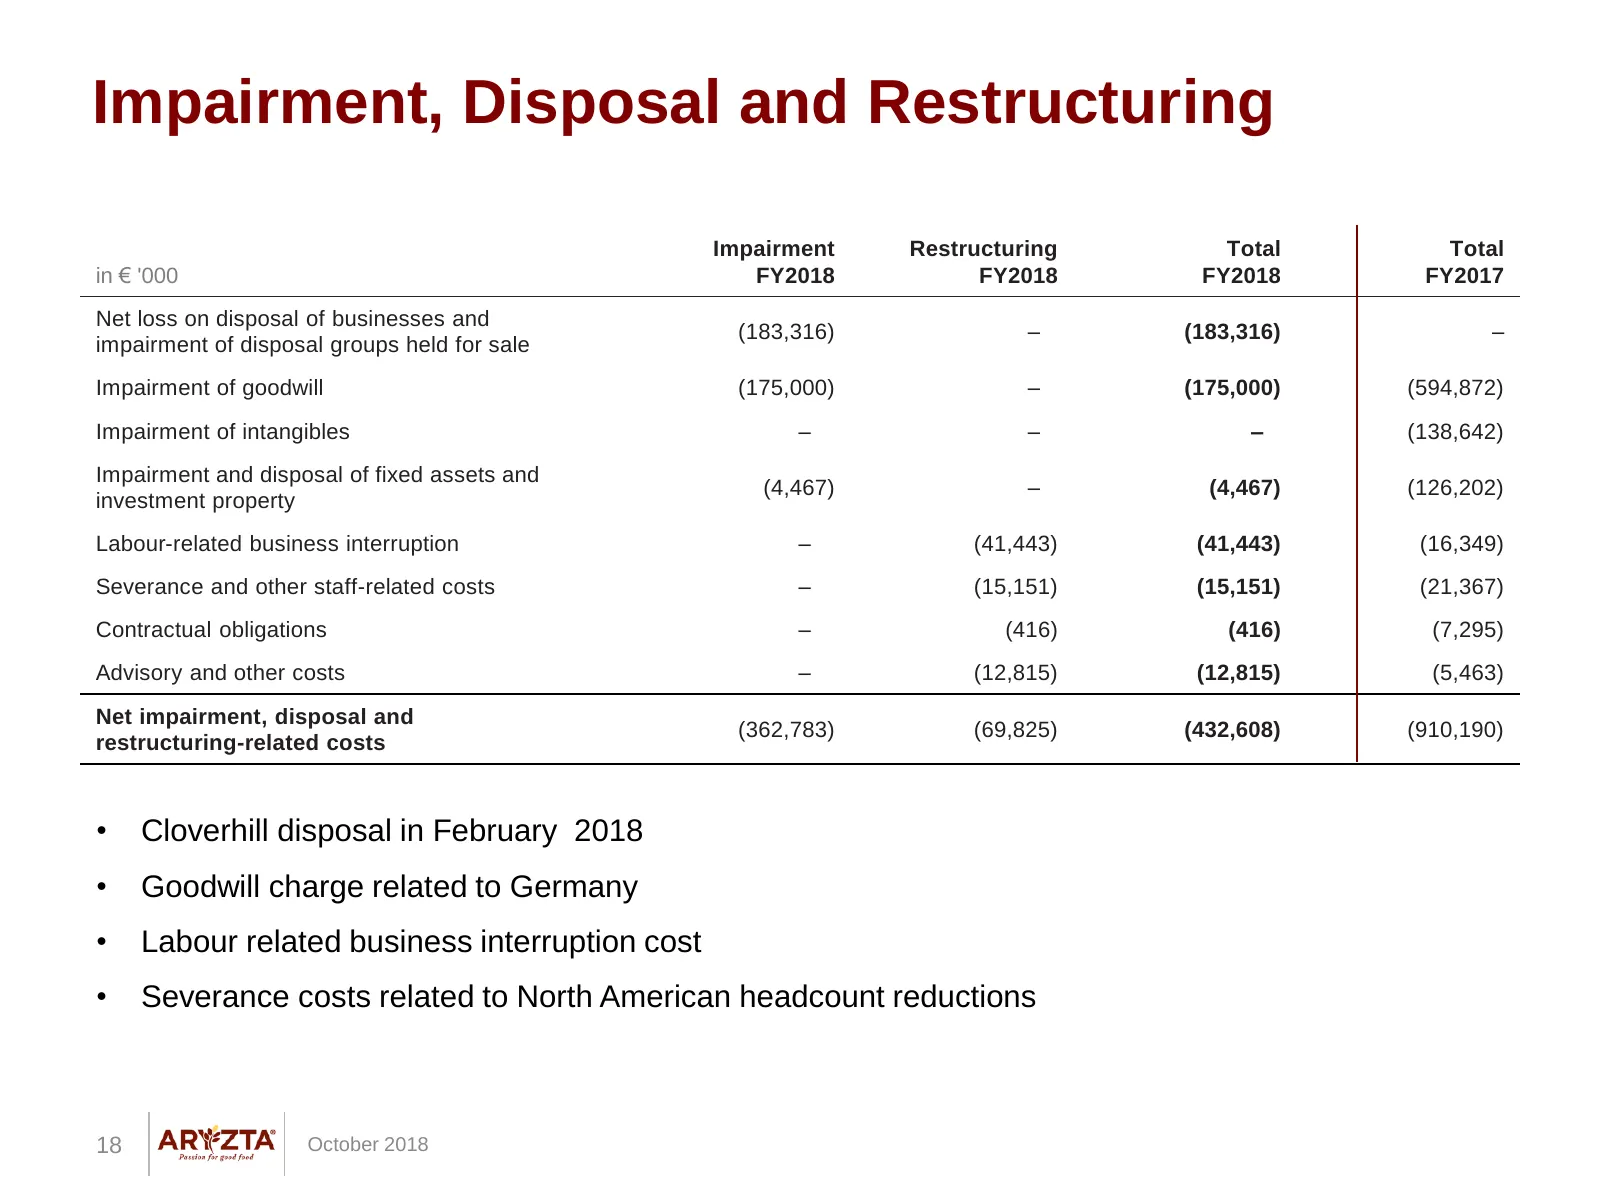
Impairment, Disposal and Restructuring Impairment Restructuring Total Total in € '000 FY2018 FY2018 FY2018 FY2017 Net loss on disposal of businesses and (183,316) – (183,316) – impairment of disposal groups held for sale Impairment of goodwill (175,000) – (175,000) (594,872) Impairment of intangible
Slide 19: Cash Generation
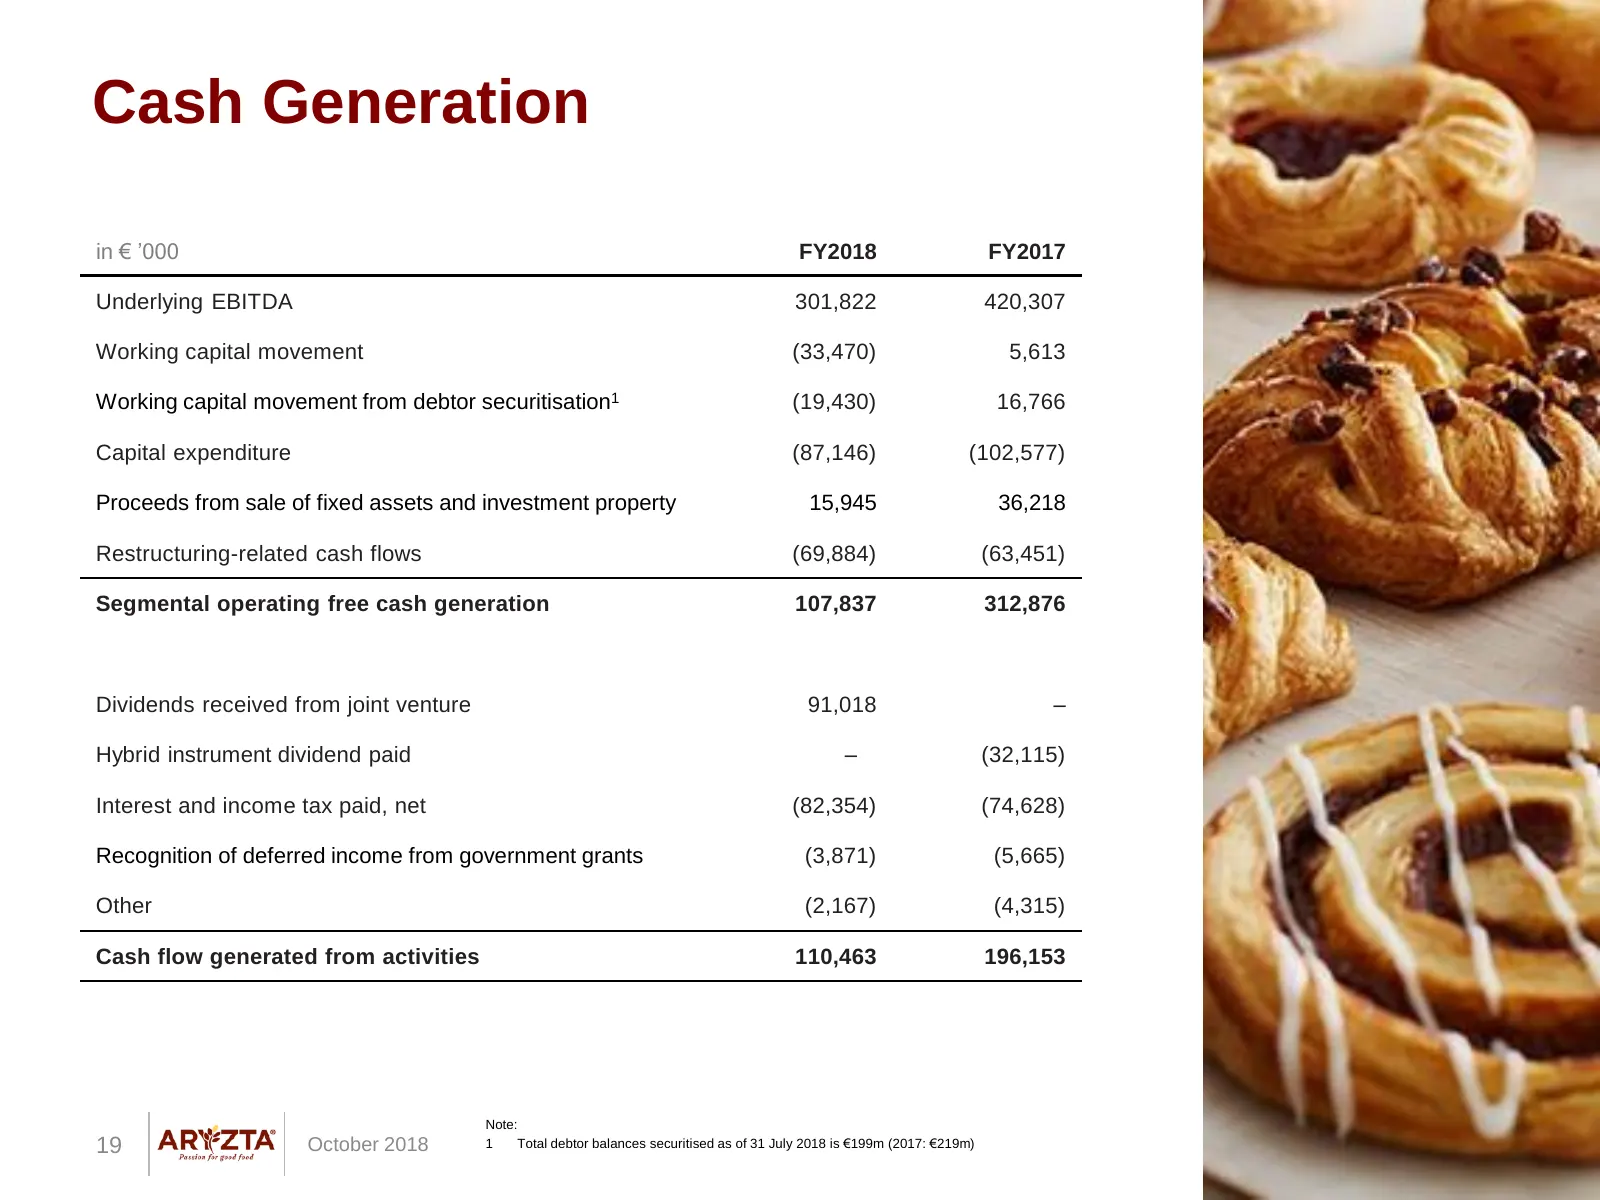
Cash Generation in € ’000 FY2018 FY2017 Underlying EBITDA 301,822 420,307 Working capital movement (33,470) 5,613 Working capital movement from debtor securitisation1 (19,430) 16,766 Capital expenditure (87,146) (102,577) Proceeds from sale of fixed assets and investment property 15,945 36,218 Restr
Slide 20: Group Financing
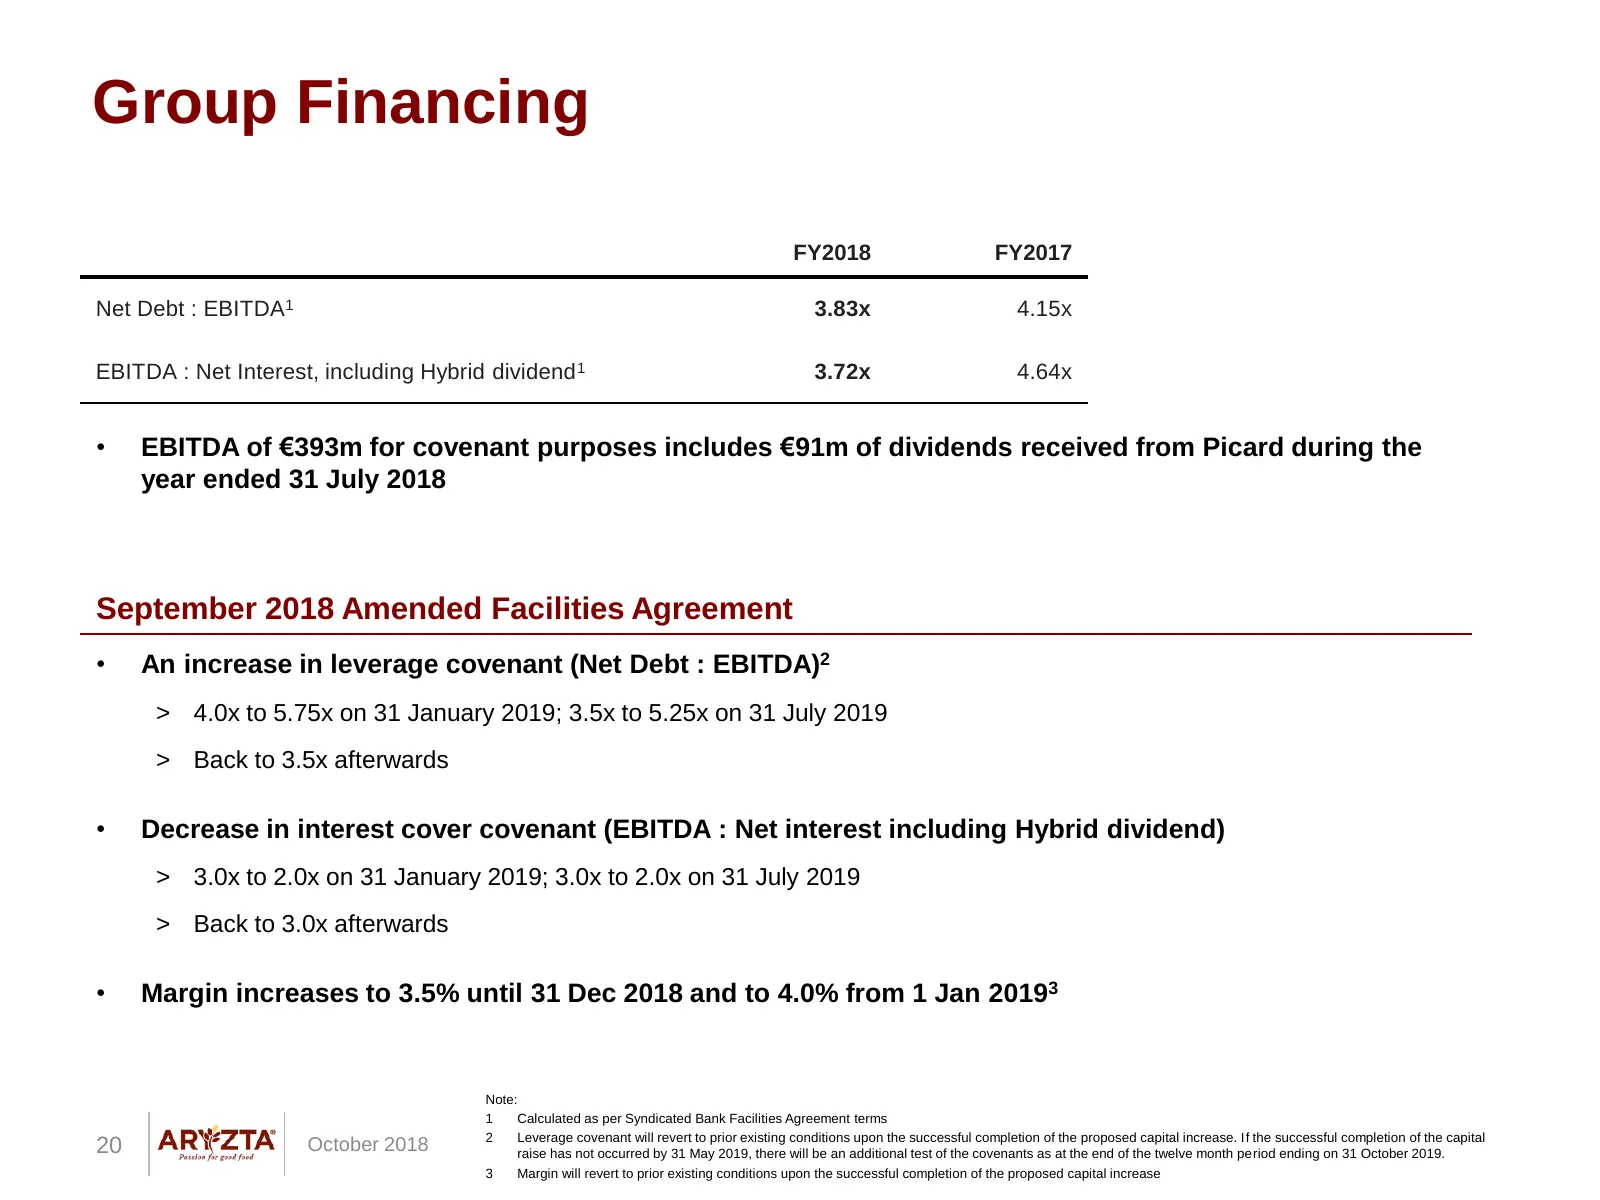
Group Financing FY2018 FY2017 Net Debt : EBITDA1 3.83x 4.15x EBITDA : Net Interest, including Hybrid dividend 1 3.72x 4.64x • EBITDA of €393m for covenant purposes includes €91m of dividends received from Picard during the year ended 31 July 2018 September 2018 Amended Facilities Agreement • An incr
Slide 21: Joint Ventures
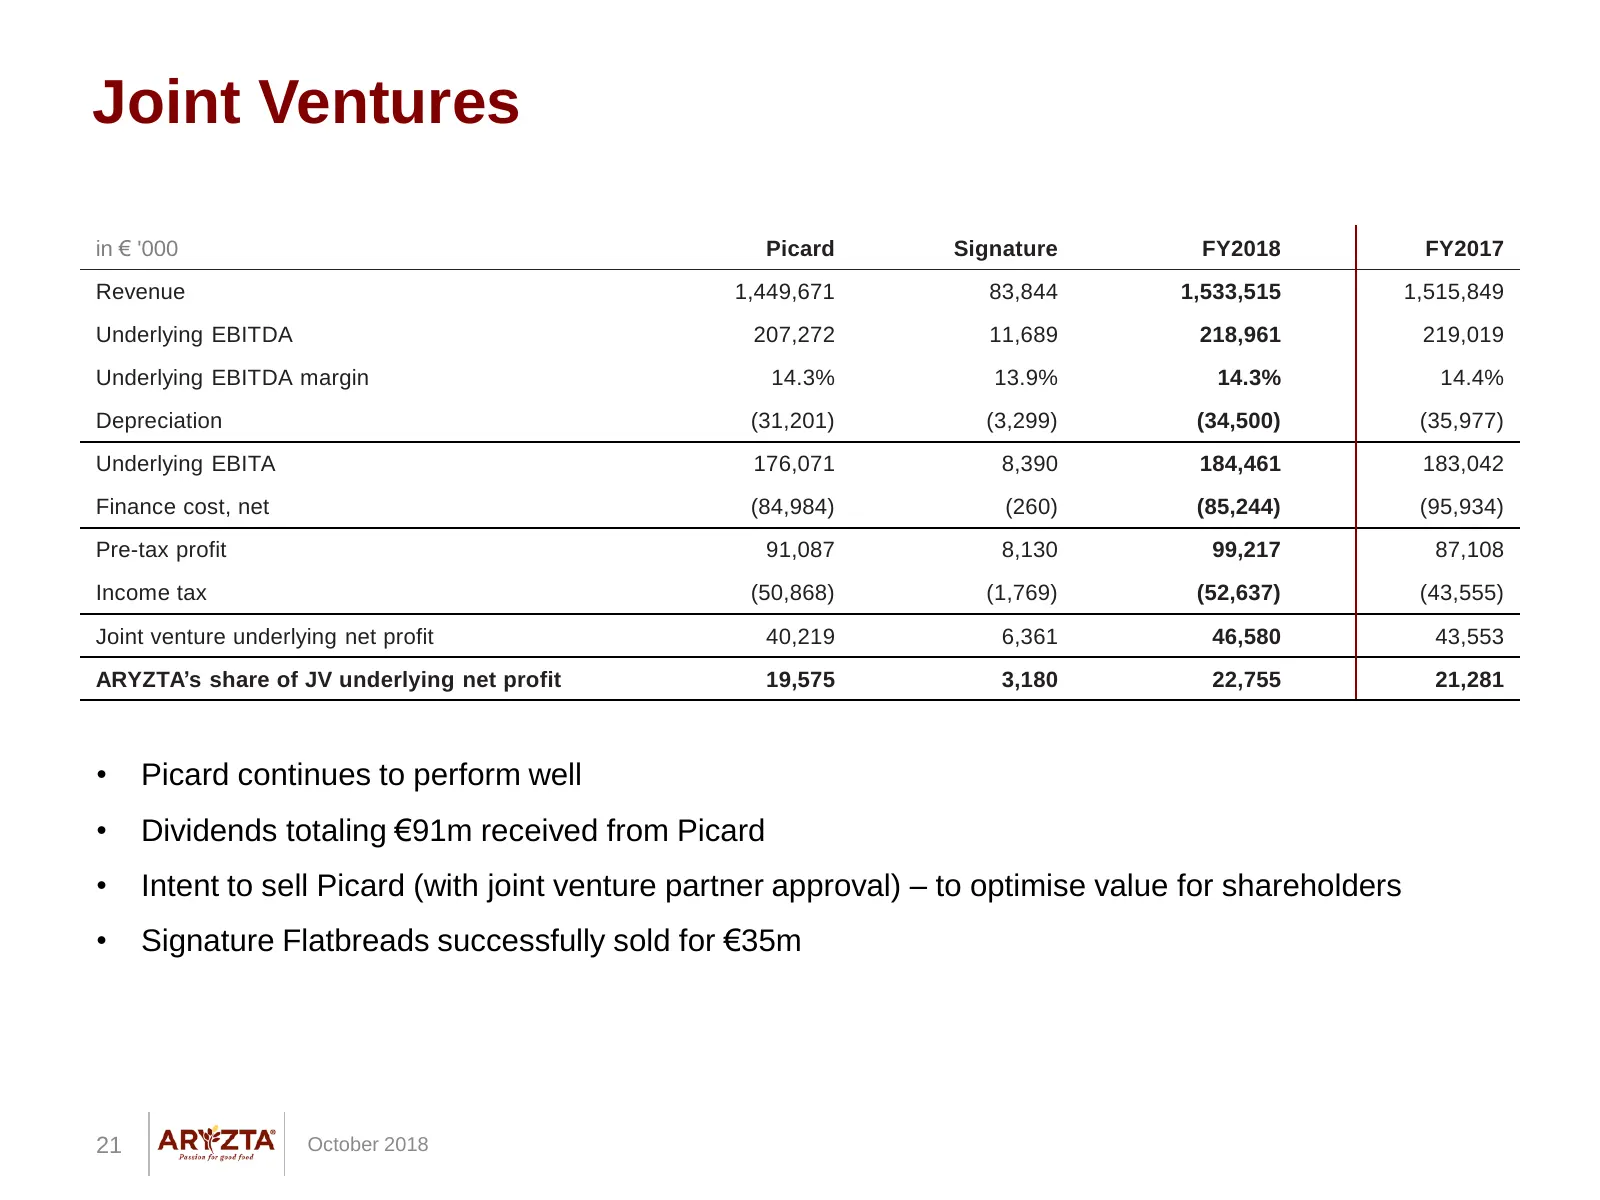
Joint Ventures in € '000 Picard Signature FY2018 FY2017 Revenue 1,449,671 83,844 1,533,515 1,515,849 Underlying EBITDA 207,272 11,689 218,961 219,019 Underlying EBITDA margin 14.3% 13.9% 14.3% 14.4% Depreciation (31,201) (3,299) (34,500) (35,977) Underlying EBITA 176,071 8,390 184,461 183,042 Financ
Slide 22: Improved Financial Controls
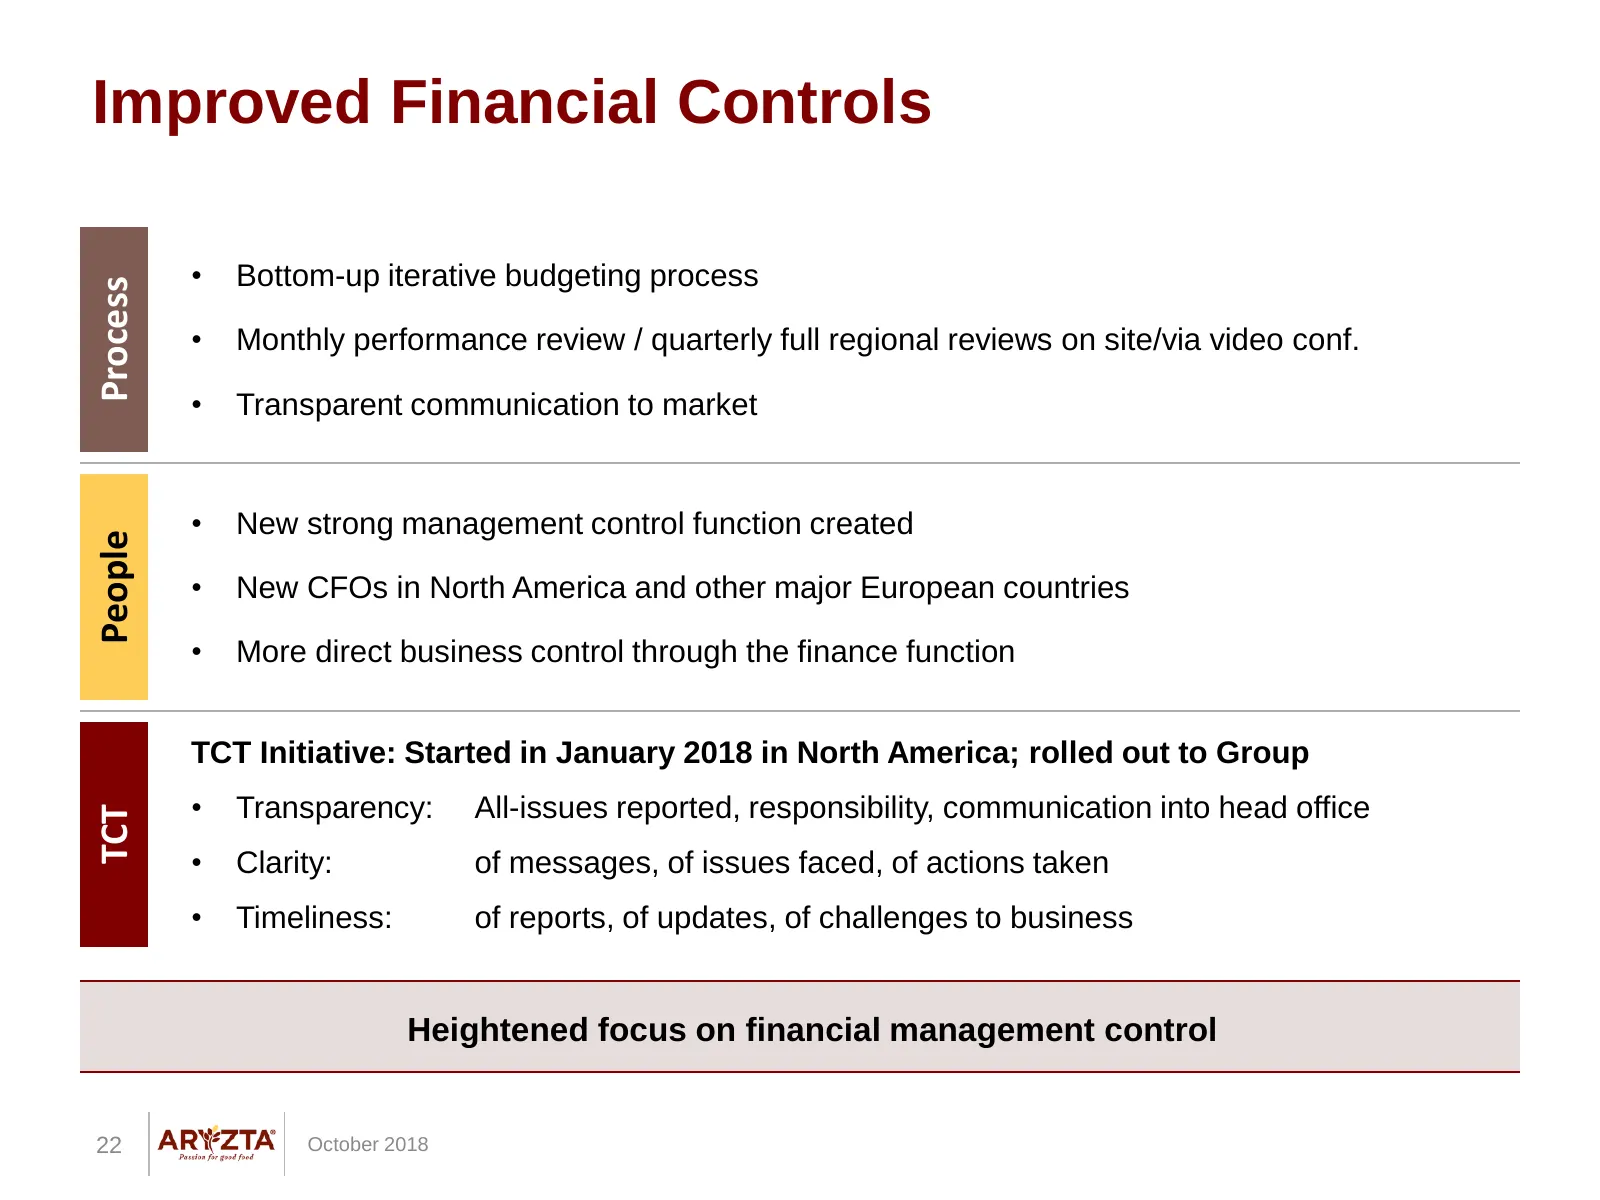
Improved Financial Controls • Bottom-up iterative budgeting process Process • Monthly performance review / quarterly full regional reviews on site/via video conf. • Transparent communication to market • New strong management control function created People • New CFOs in North America and other major
Slide 23: Delivering Strategic and Financial Flexibility
DELIVERING STRATEGIC AND FINANCIAL FLEXIBILITY 23 October 2018
Slide 24: Capital Structure
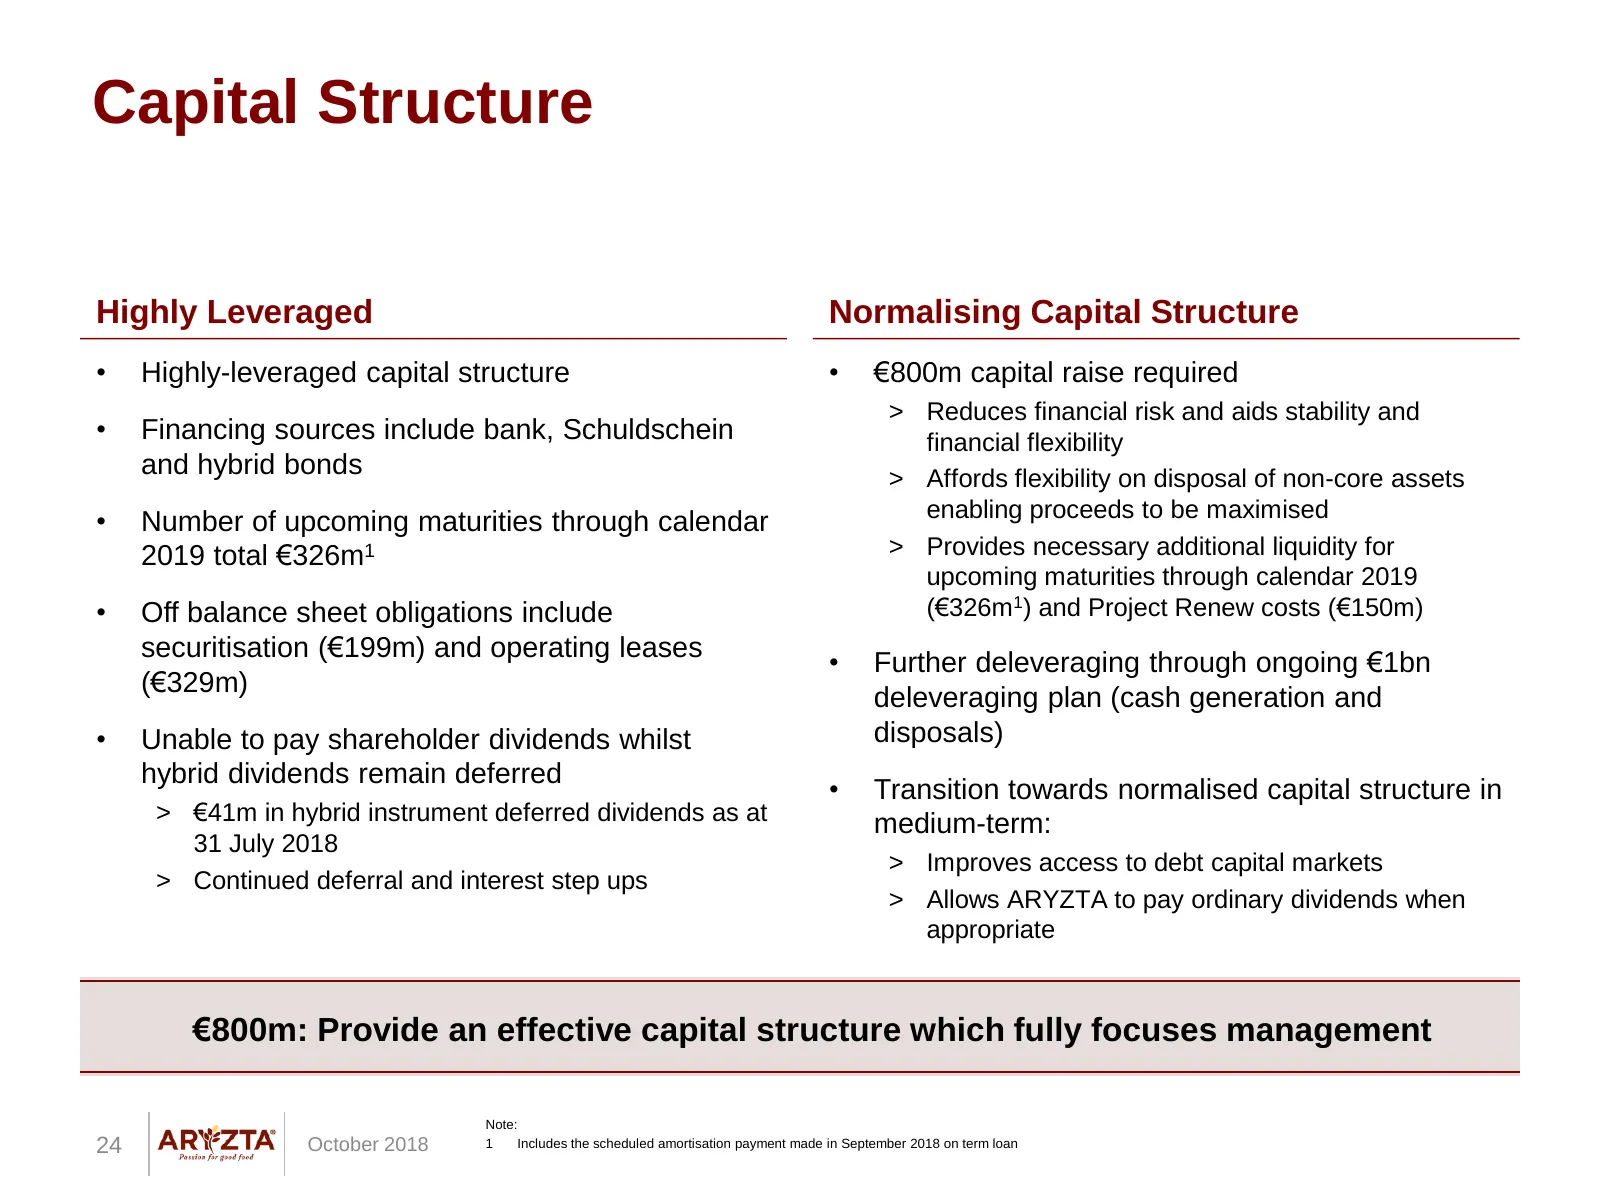
Capital Structure Highly Leveraged Normalising Capital Structure • Highly-leveraged capital structure • €800m capital raise required > Reduces financial risk and aids stability and • Financing sources include bank, Schuldschein financial flexibility and hybrid bonds > Affords flexibility on disposal
Slide 25: Gross Debt
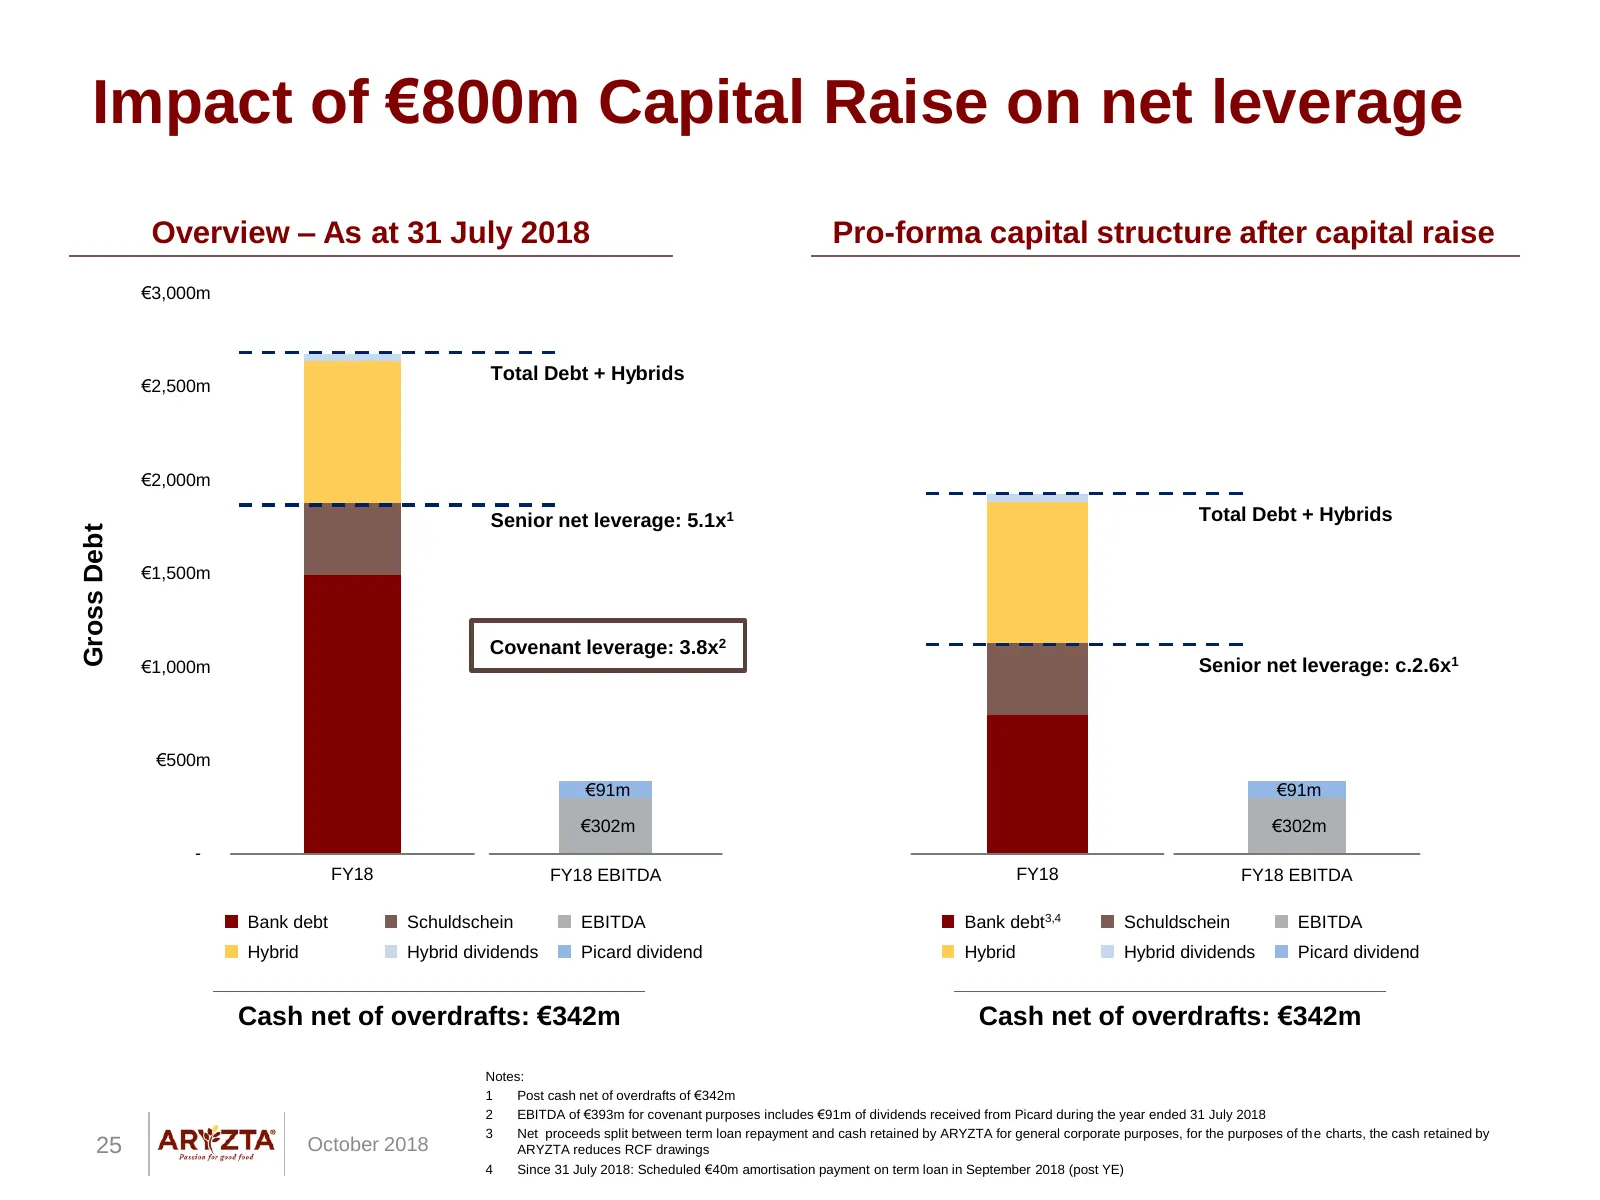
Impact of €800m Capital Raise on net leverage Overview – As at 31 July 2018 Pro-forma capital structure after capital raise €3,000m Total Debt + Hybrids €2,500m €2,000m Senior net leverage: 5.1x1 Total Debt + Hybrids Gross Debt €1,500m Covenant leverage: 3.8x2 €1,000m Senior net leverage: c.2.6x1 €5
Slide 26: Liquidity Needs
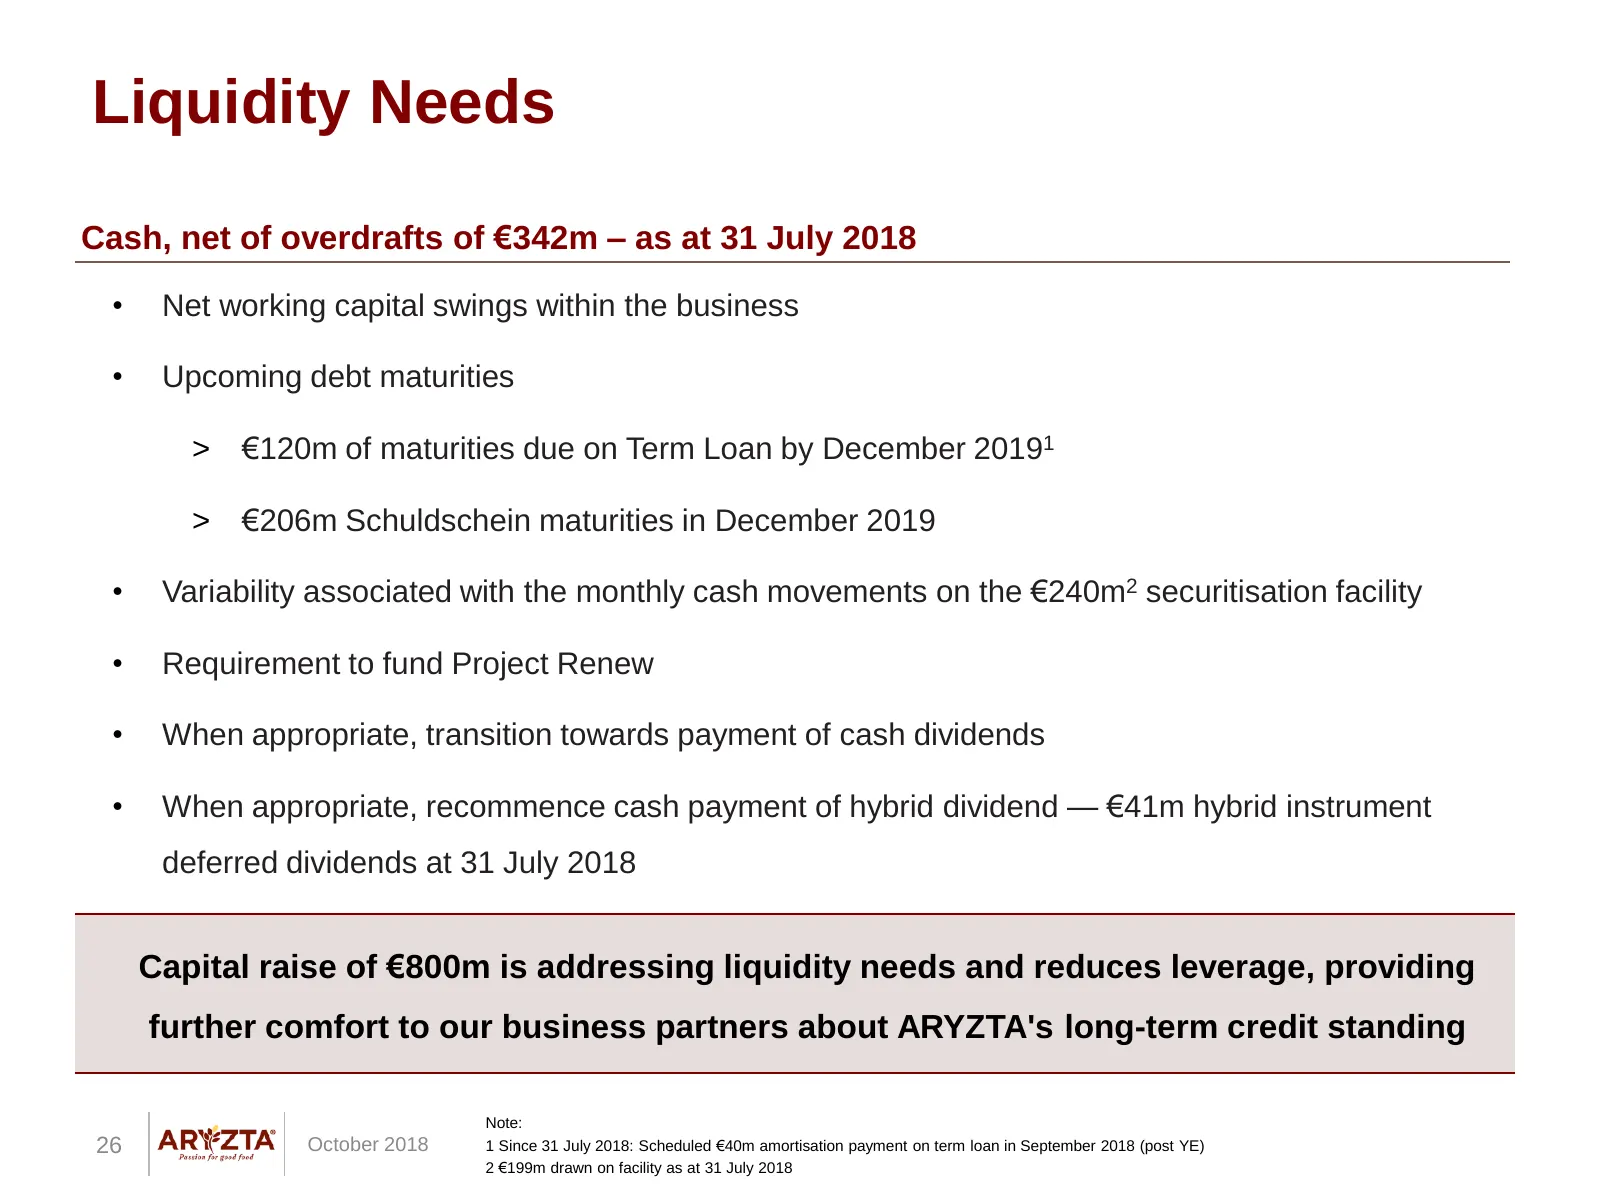
Liquidity Needs Cash, net of overdrafts of €342m – as at 31 July 2018 • Net working capital swings within the business • Upcoming debt maturities > €120m of maturities due on Term Loan by December 20191 > €206m Schuldschein maturities in December 2019 • Variability associated with the monthly cash m
Slide 27: Indicative Timetable of Capital Raise
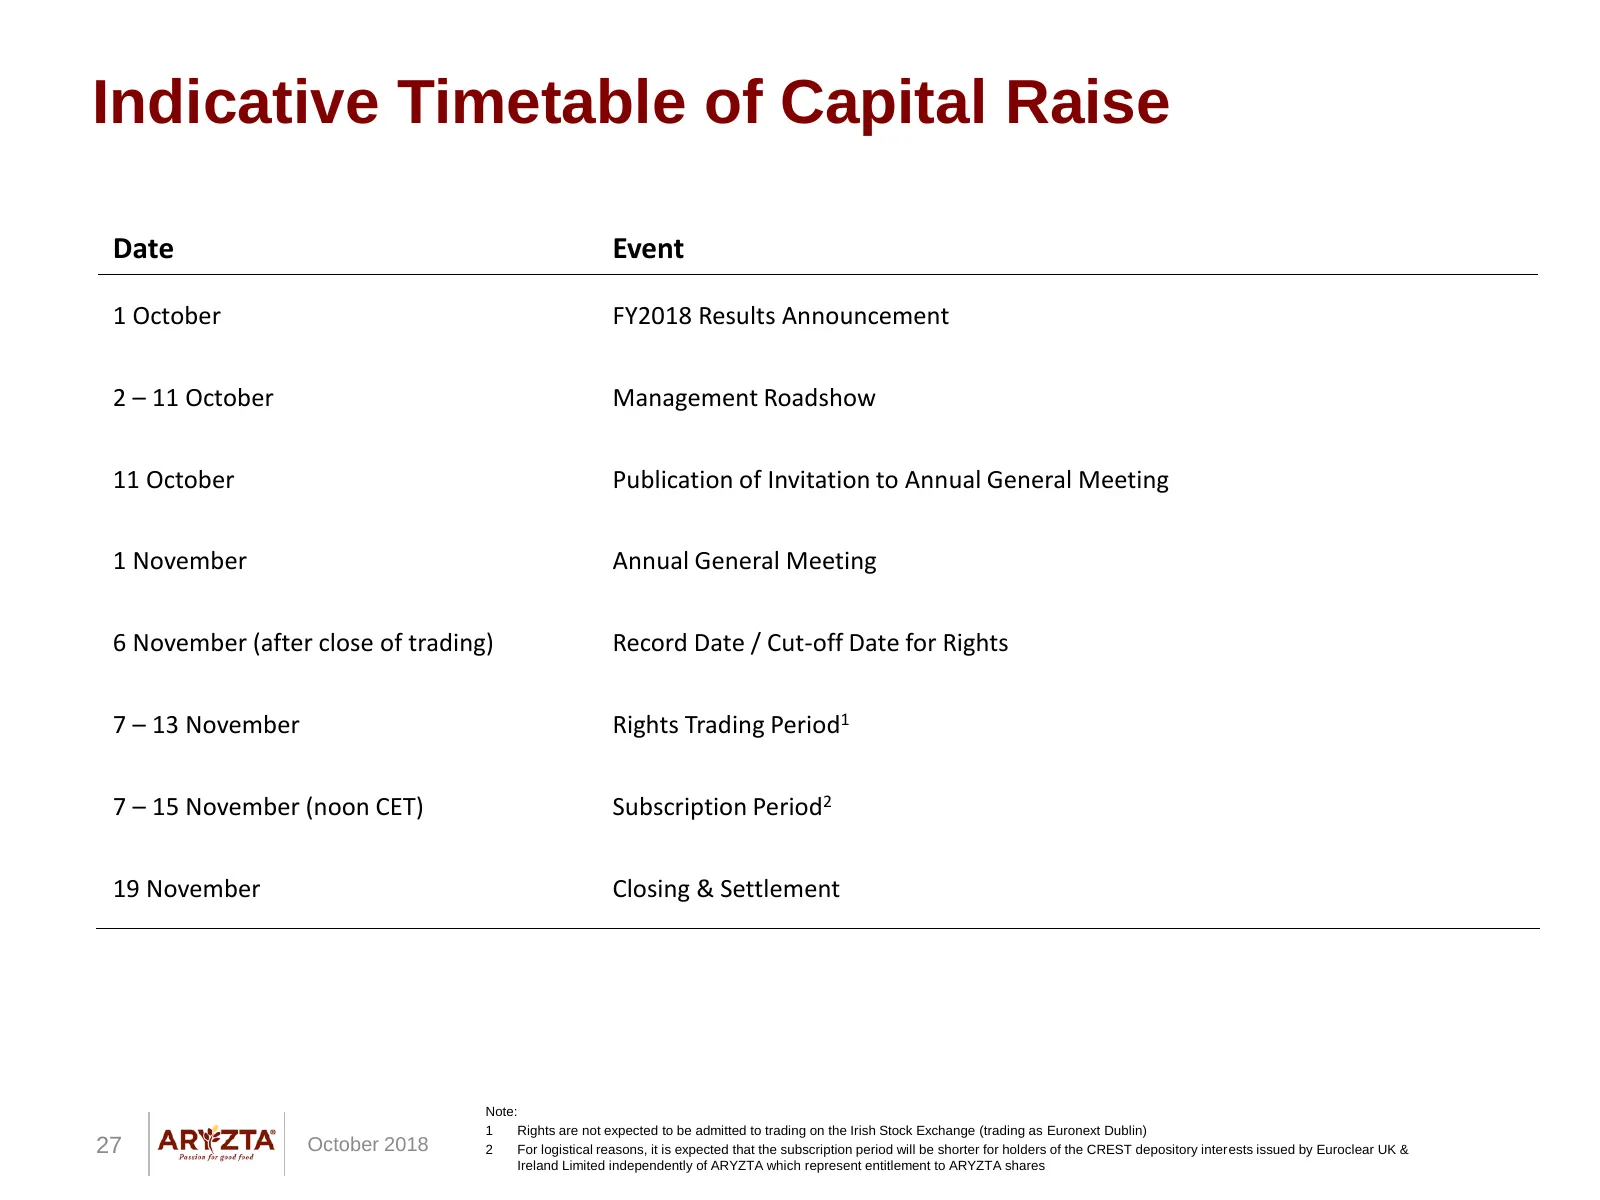
Indicative Timetable of Capital Raise Date Event 1 October FY2018 Results Announcement 2 – 11 October Management Roadshow 11 October Publication of Invitation to Annual General Meeting 1 November Annual General Meeting 6 November (after close of trading) Record Date / Cut-off Date for Rights 7 – 13
Slide 28: Cash Proceeds from Disposal of Non-core Businesses & JVs
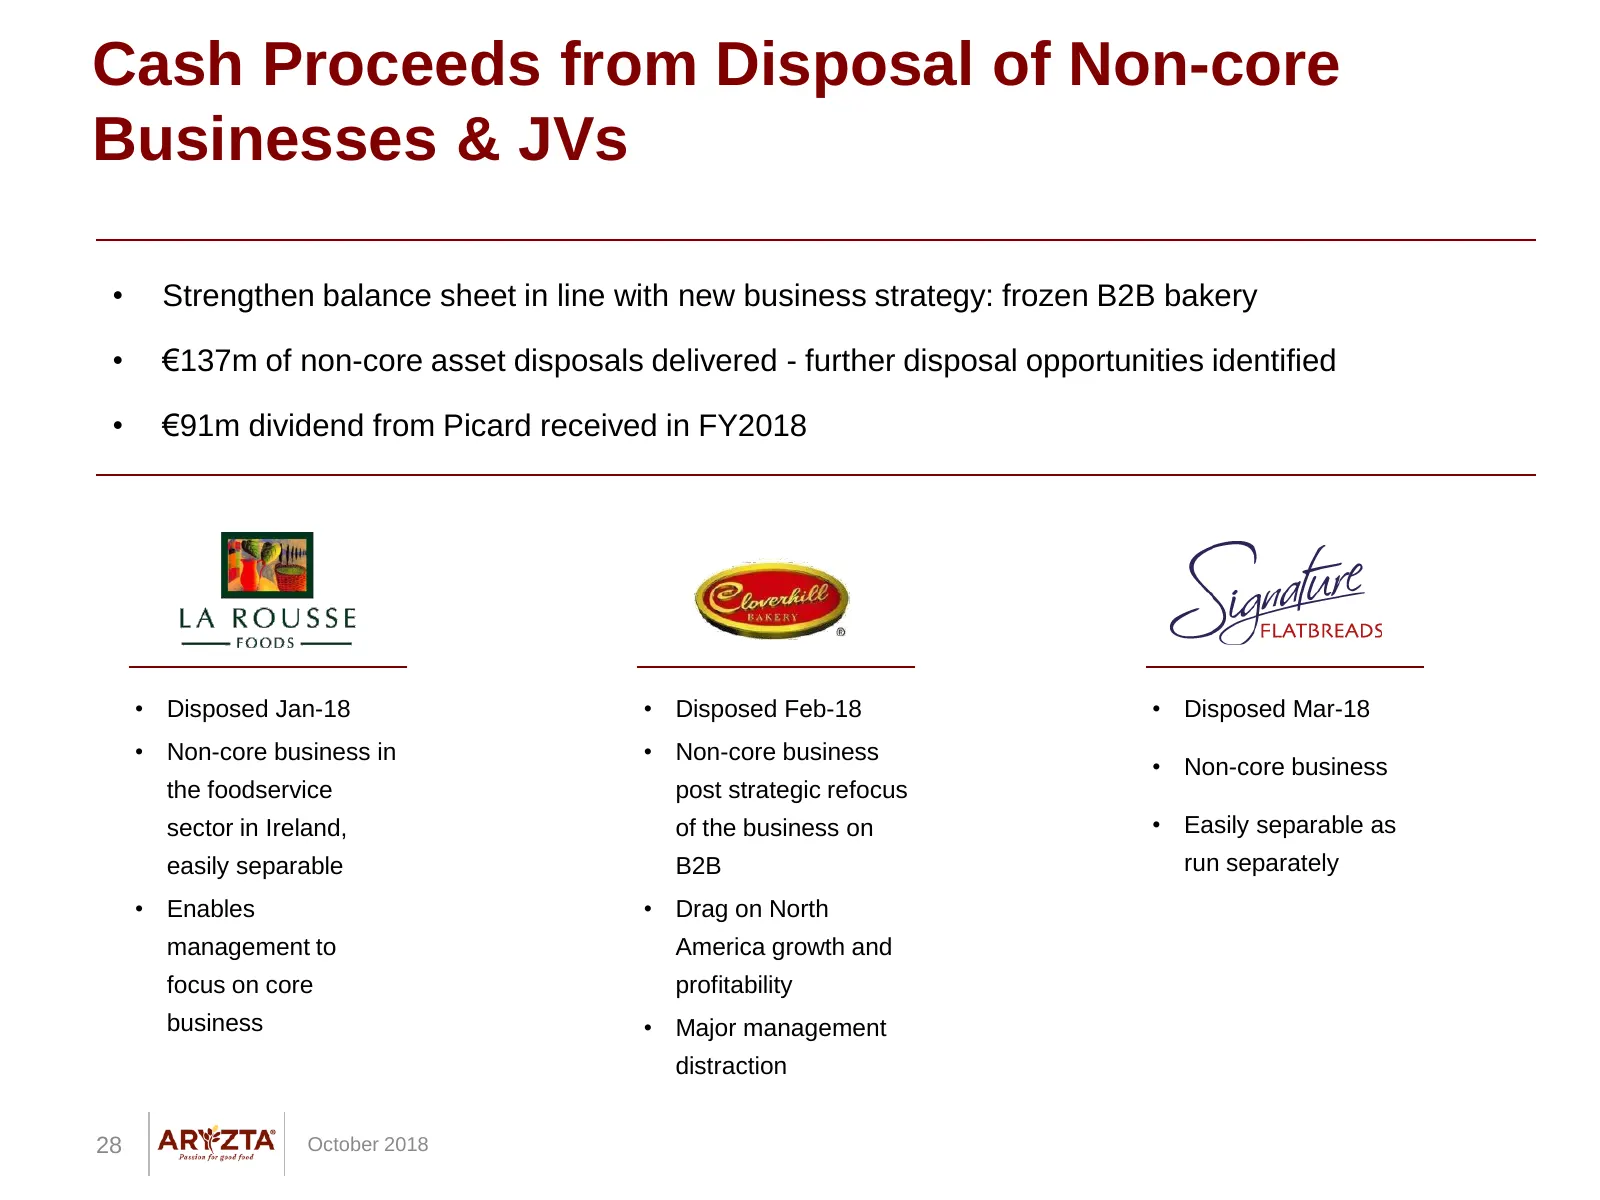
Cash Proceeds from Disposal of Non-core Businesses & JVs • Strengthen balance sheet in line with new business strategy: frozen B2B bakery • €137m of non-core asset disposals delivered - further disposal opportunities identified • €91m dividend from Picard received in FY2018 • Disposed Jan-18 • Dispo
Slide 29: Picard
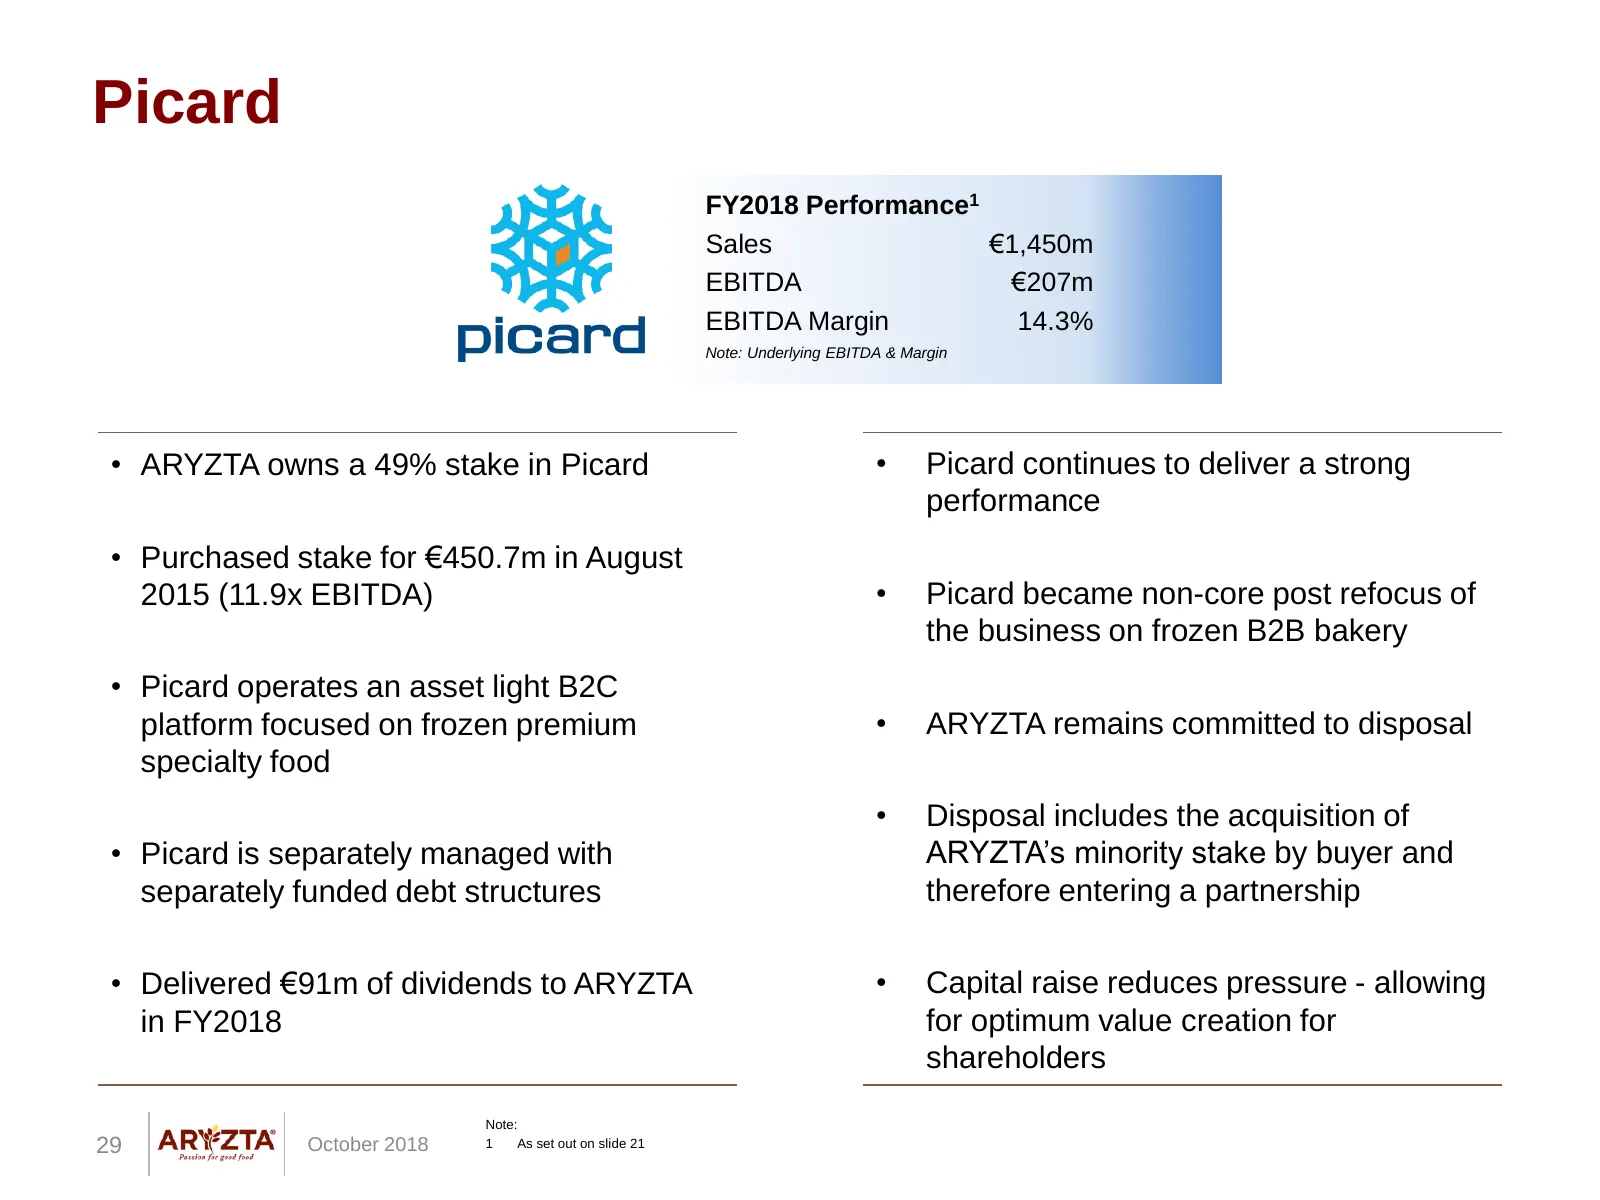
Picard FY2018 Performance1 Sales €1,450m EBITDA €207m EBITDA Margin 14.3% Note: Underlying EBITDA & Margin • ARYZTA owns a 49% stake in Picard • Picard continues to deliver a strong performance • Purchased stake for €450.7m in August 2015 (11.9x EBITDA) • Picard became non-core post refocus of the b
Slide 30: Delivering Stability, Performance & Growth
DELIVERING STABILITY, PERFORMANCE & GROWTH 30 October 2018
Slide 31: New, Focused Management Team
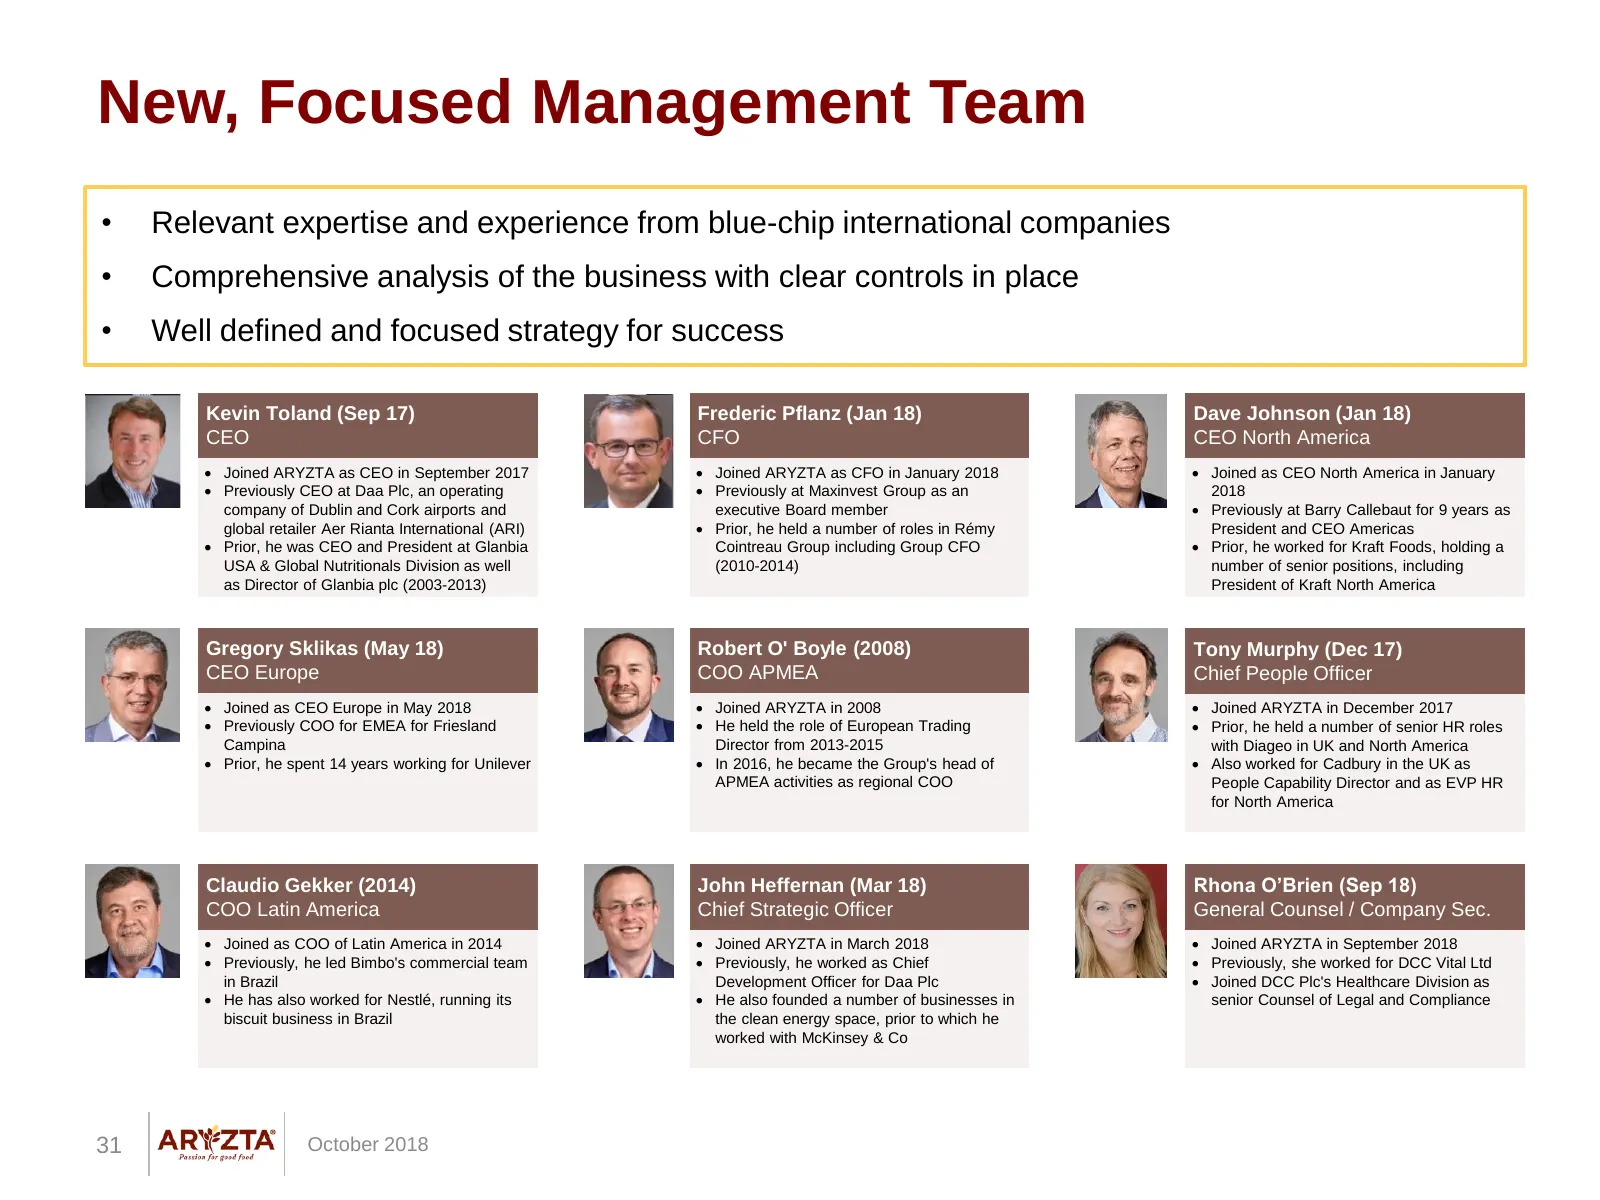
New, Focused Management Team • Relevant expertise and experience from blue-chip international companies • Comprehensive analysis of the business with clear controls in place • Well defined and focused strategy for success Kevin Toland (Sep 17) Frederic Pflanz (Jan 18) Dave Johnson (Jan 18) CEO CFO C
Slide 32: ARYZTA Operates in a Growing Frozen Bakery Market
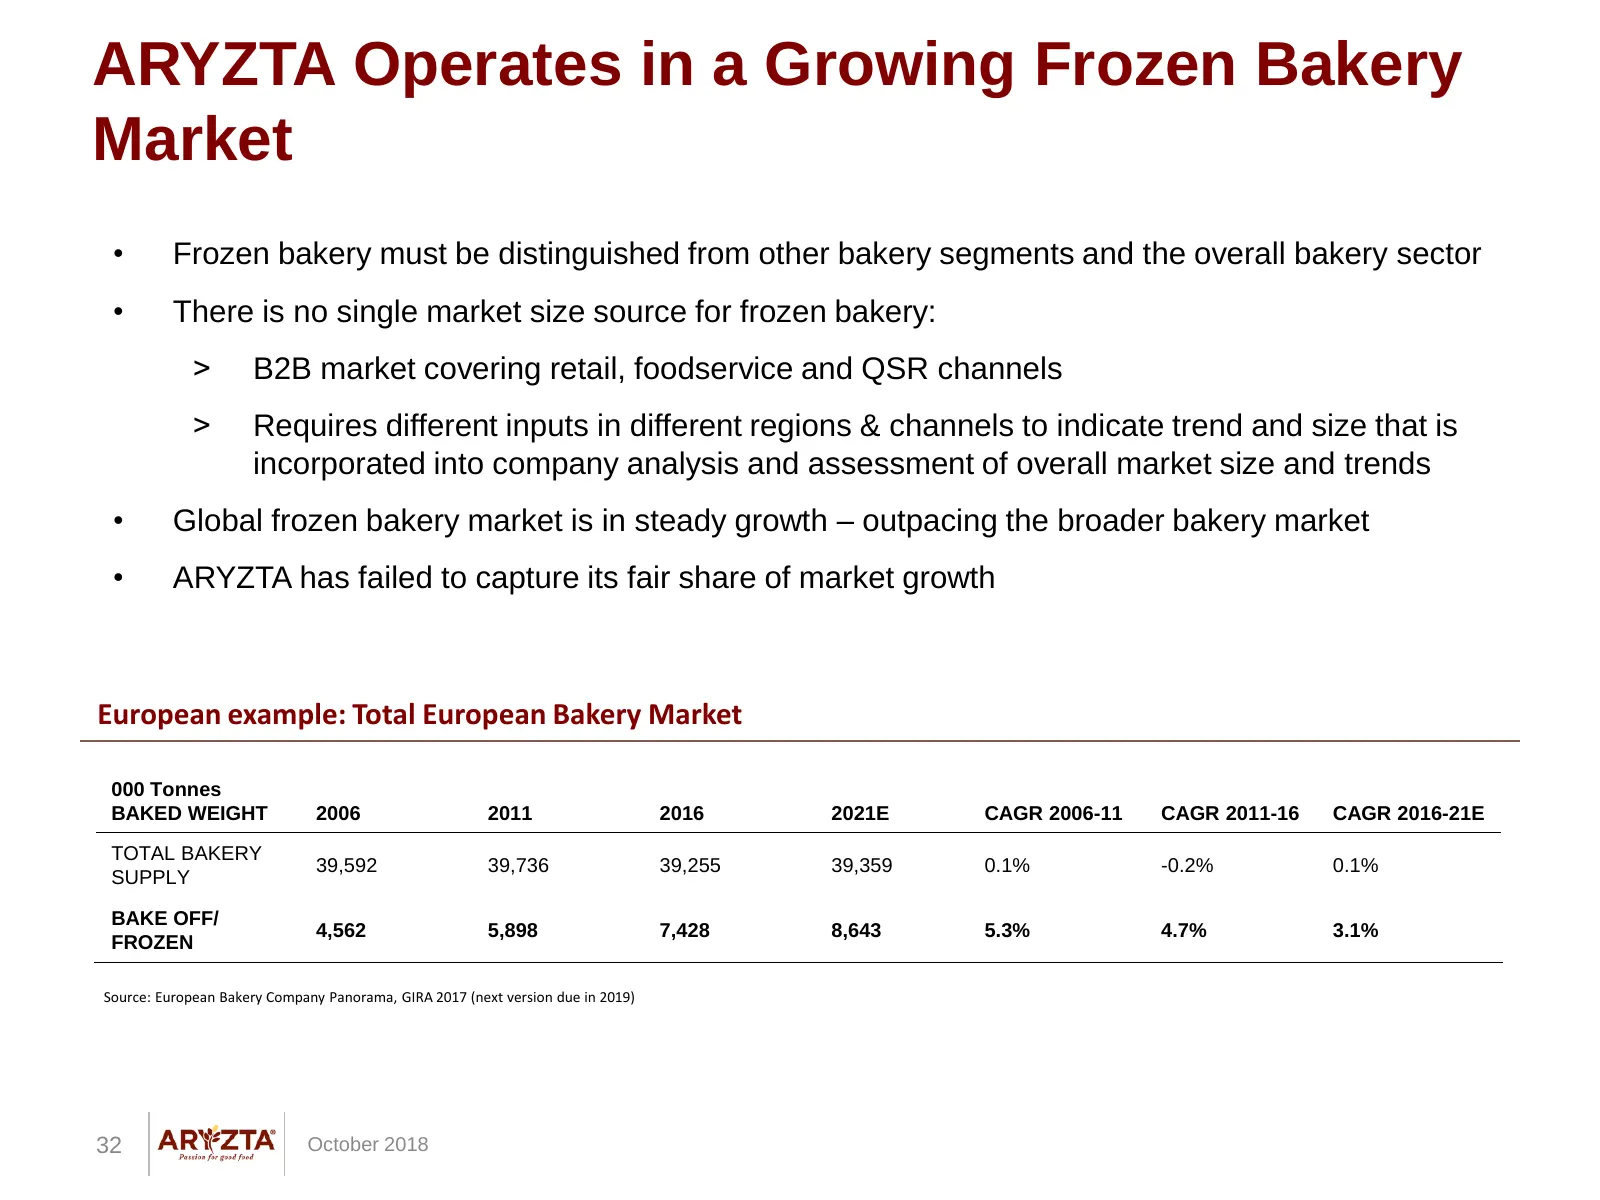
ARYZTA Operates in a Growing Frozen Bakery Market • Frozen bakery must be distinguished from other bakery segments and the overall bakery sector • There is no single market size source for frozen bakery: ˃ B2B market covering retail, foodservice and QSR channels ˃ Requires different inputs in differ
Slide 33: Frozen Bakery | Large & Growing
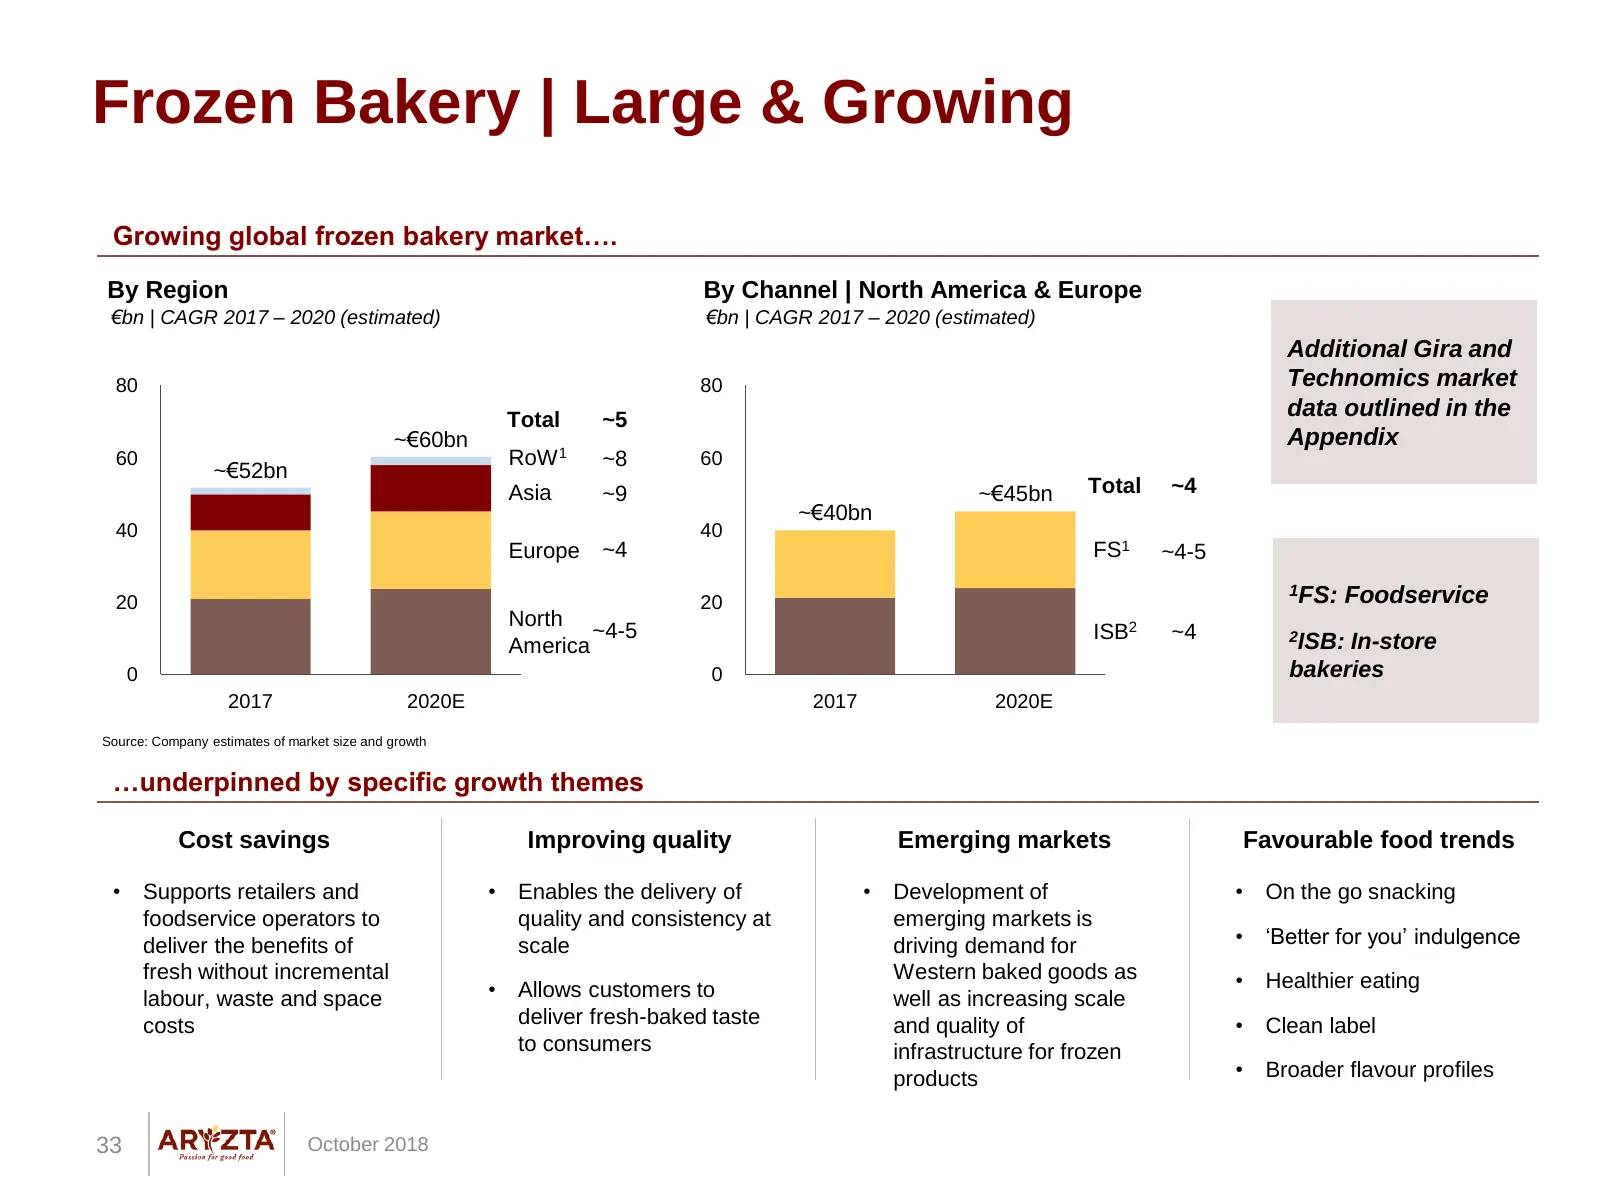
Frozen Bakery | Large & Growing Growing global frozen bakery market…. By Region By Channel | North America & Europe €bn | CAGR 2017 – 2020 (estimated) €bn | CAGR 2017 – 2020 (estimated) Additional Gira and 80 80 Technomics market Total ~5 data outlined in the ~€60bn Appendix 60 RoW 1 ~8 60 ~€52bn As
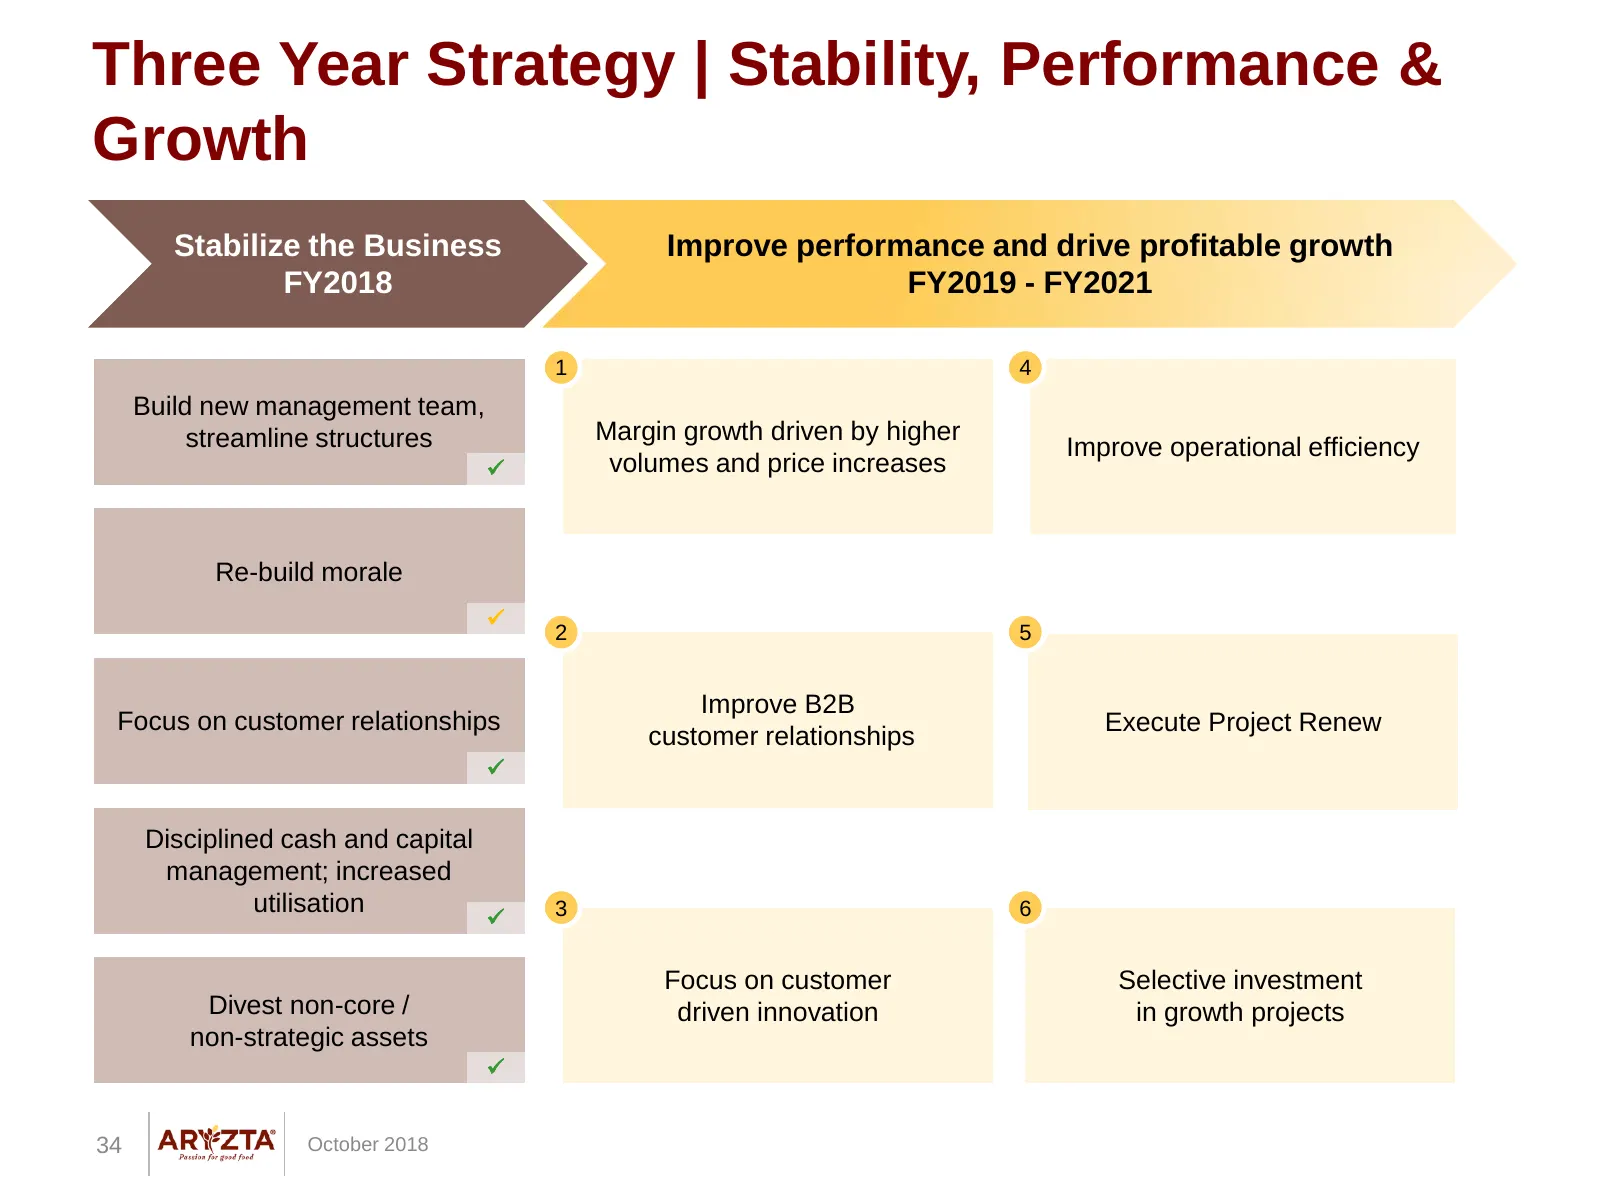
Slide 34: Three Year Strategy | Stability, Performance & Growth
Three Year Strategy | Stability, Performance & Growth Stabilize the Business Improve performance and drive profitable growth FY2018 FY2019 - FY2021 1 4 Build new management team, streamline structures Margin growth driven by higher Improve operational efficiency volumes and price increases Re-buil
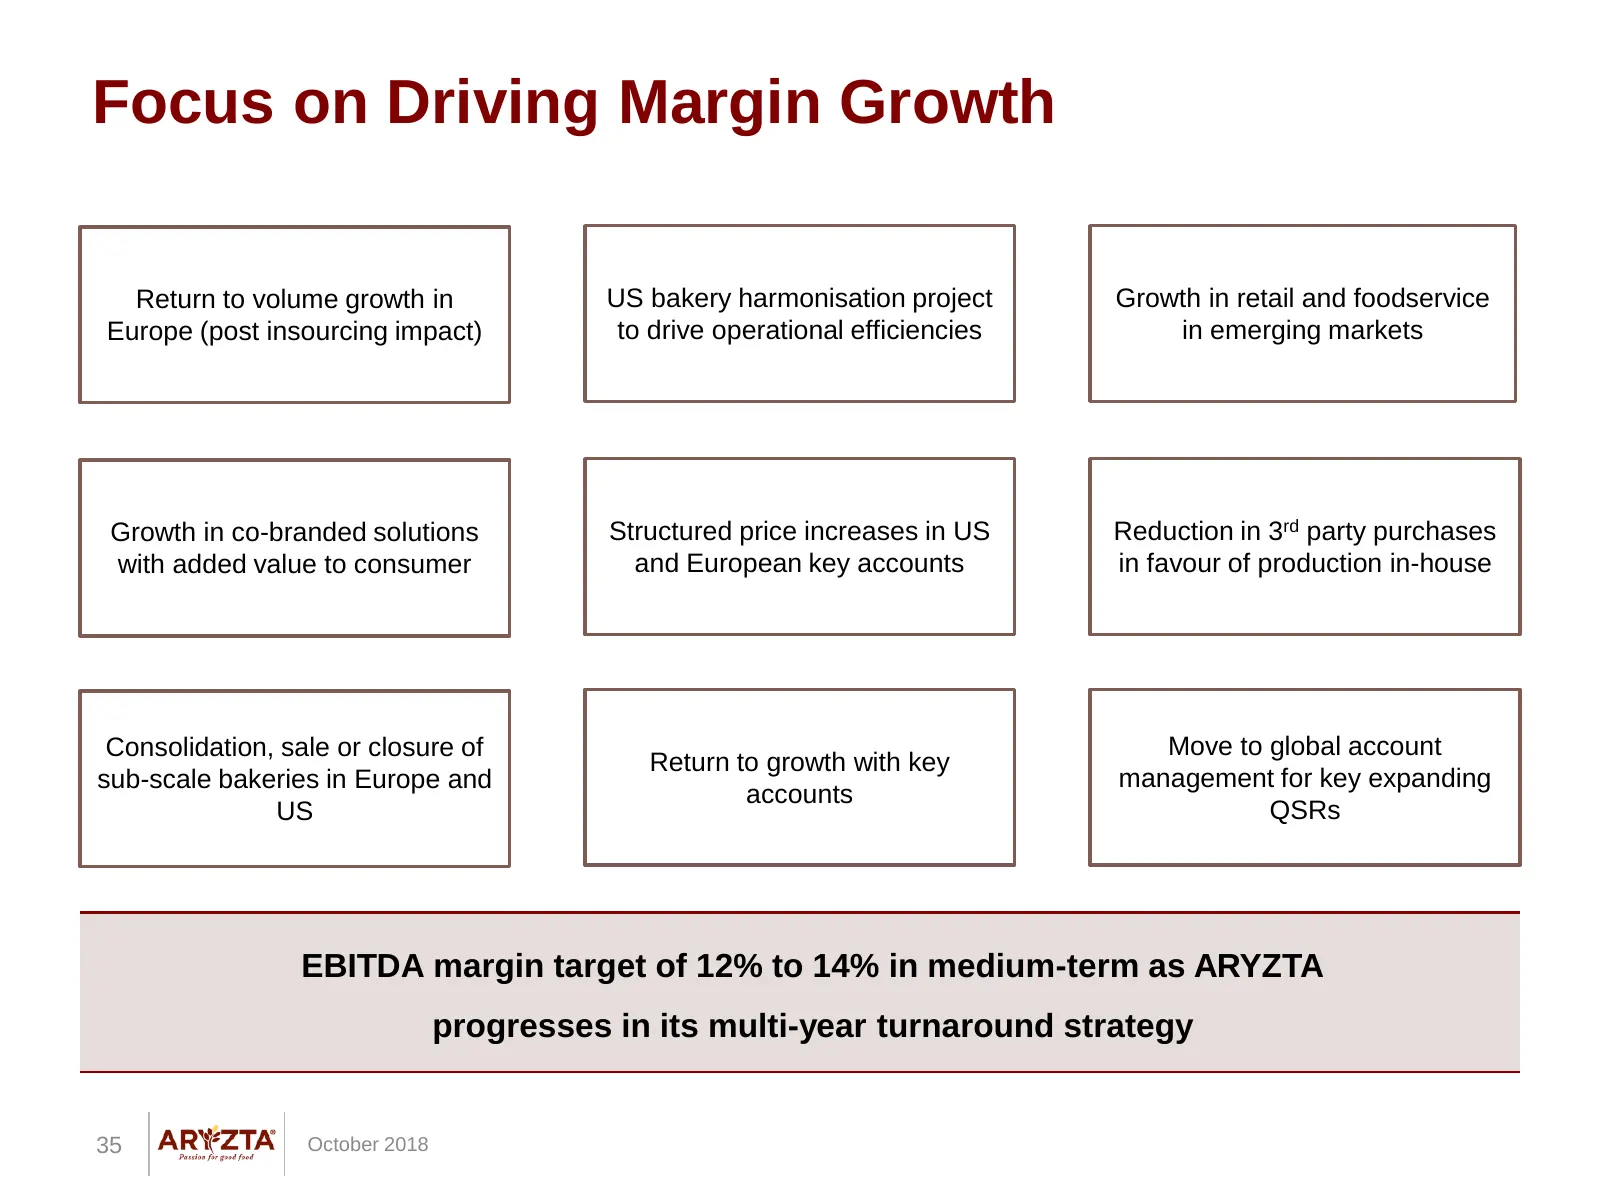
Slide 35: Focus on Driving Margin Growth
Focus on Driving Margin Growth Return to volume growth in US bakery harmonisation project Growth in retail and foodservice Europe (post insourcing impact) to drive operational efficiencies in emerging markets Growth in co-branded solutions Structured price increases in US Reduction in 3rd party purc
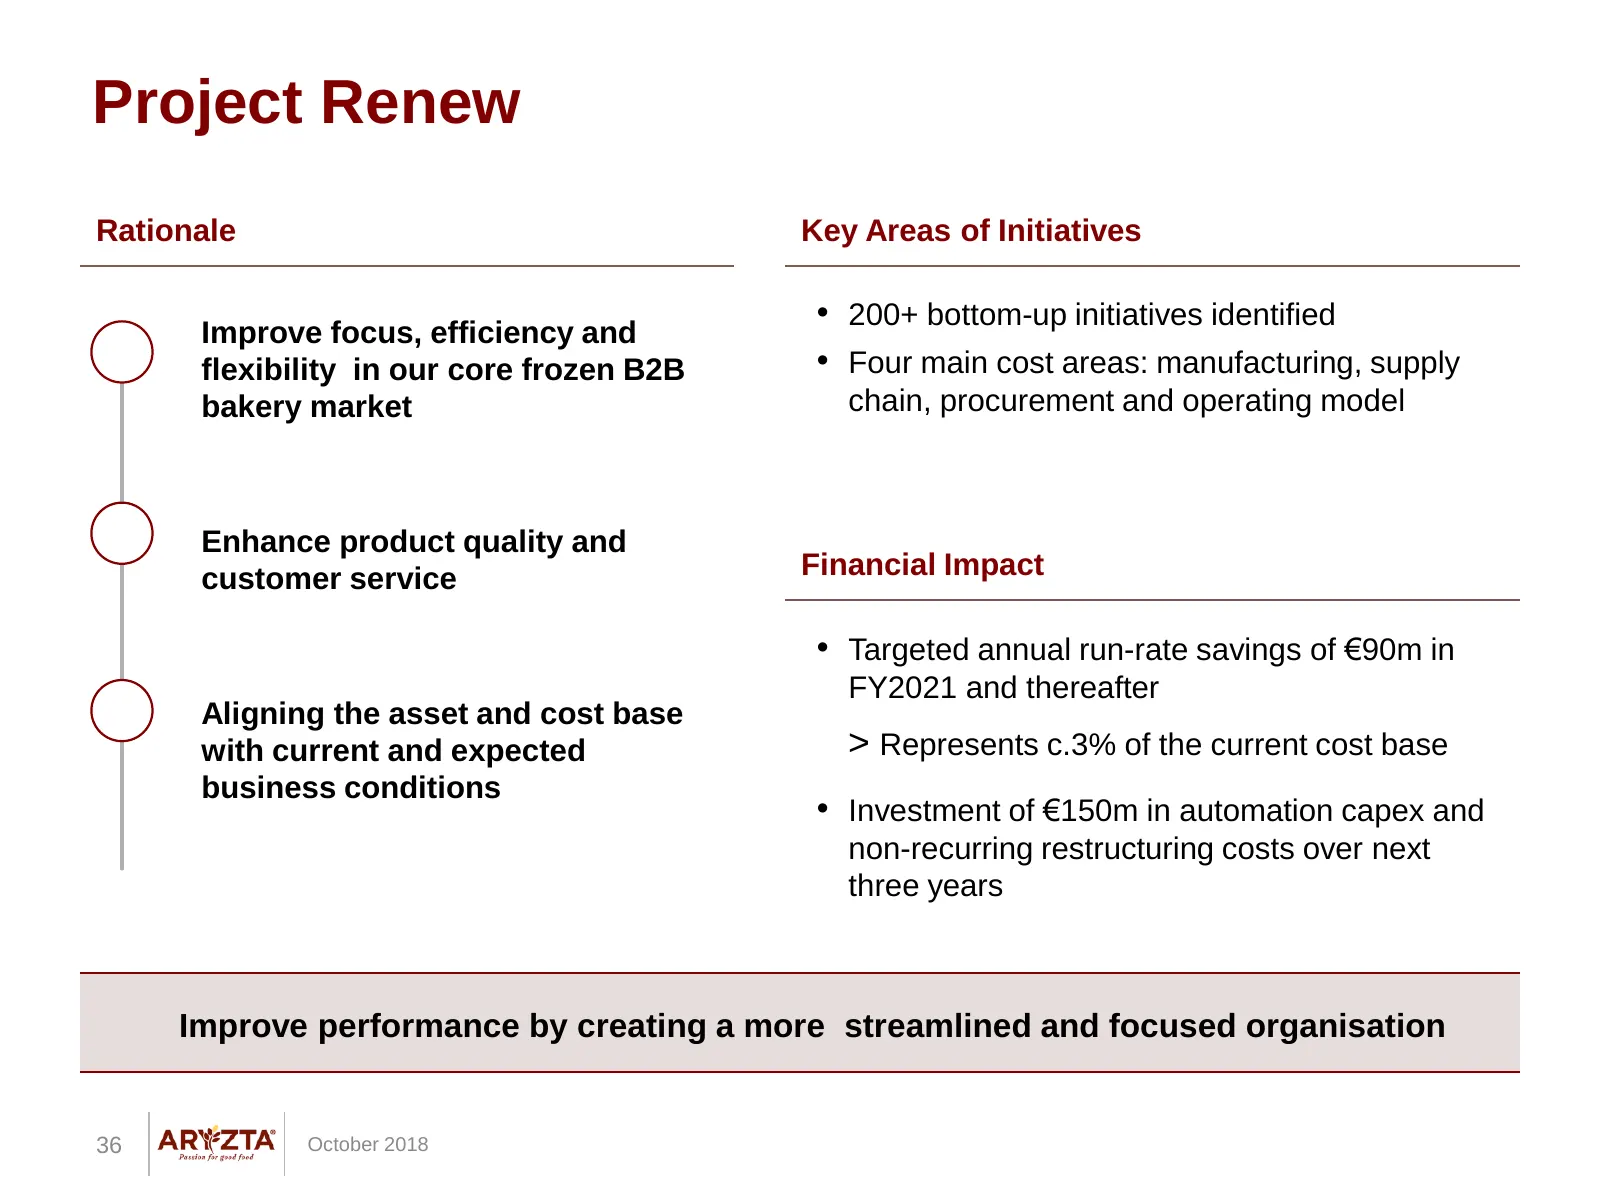
Slide 36: Project Renew
Project Renew Rationale Key Areas of Initiatives Improve focus, efficiency and • 200+ bottom-up initiatives identified flexibility in our core frozen B2B • Four main cost areas: manufacturing, supply bakery market chain, procurement and operating model Enhance product quality and customer service Fi
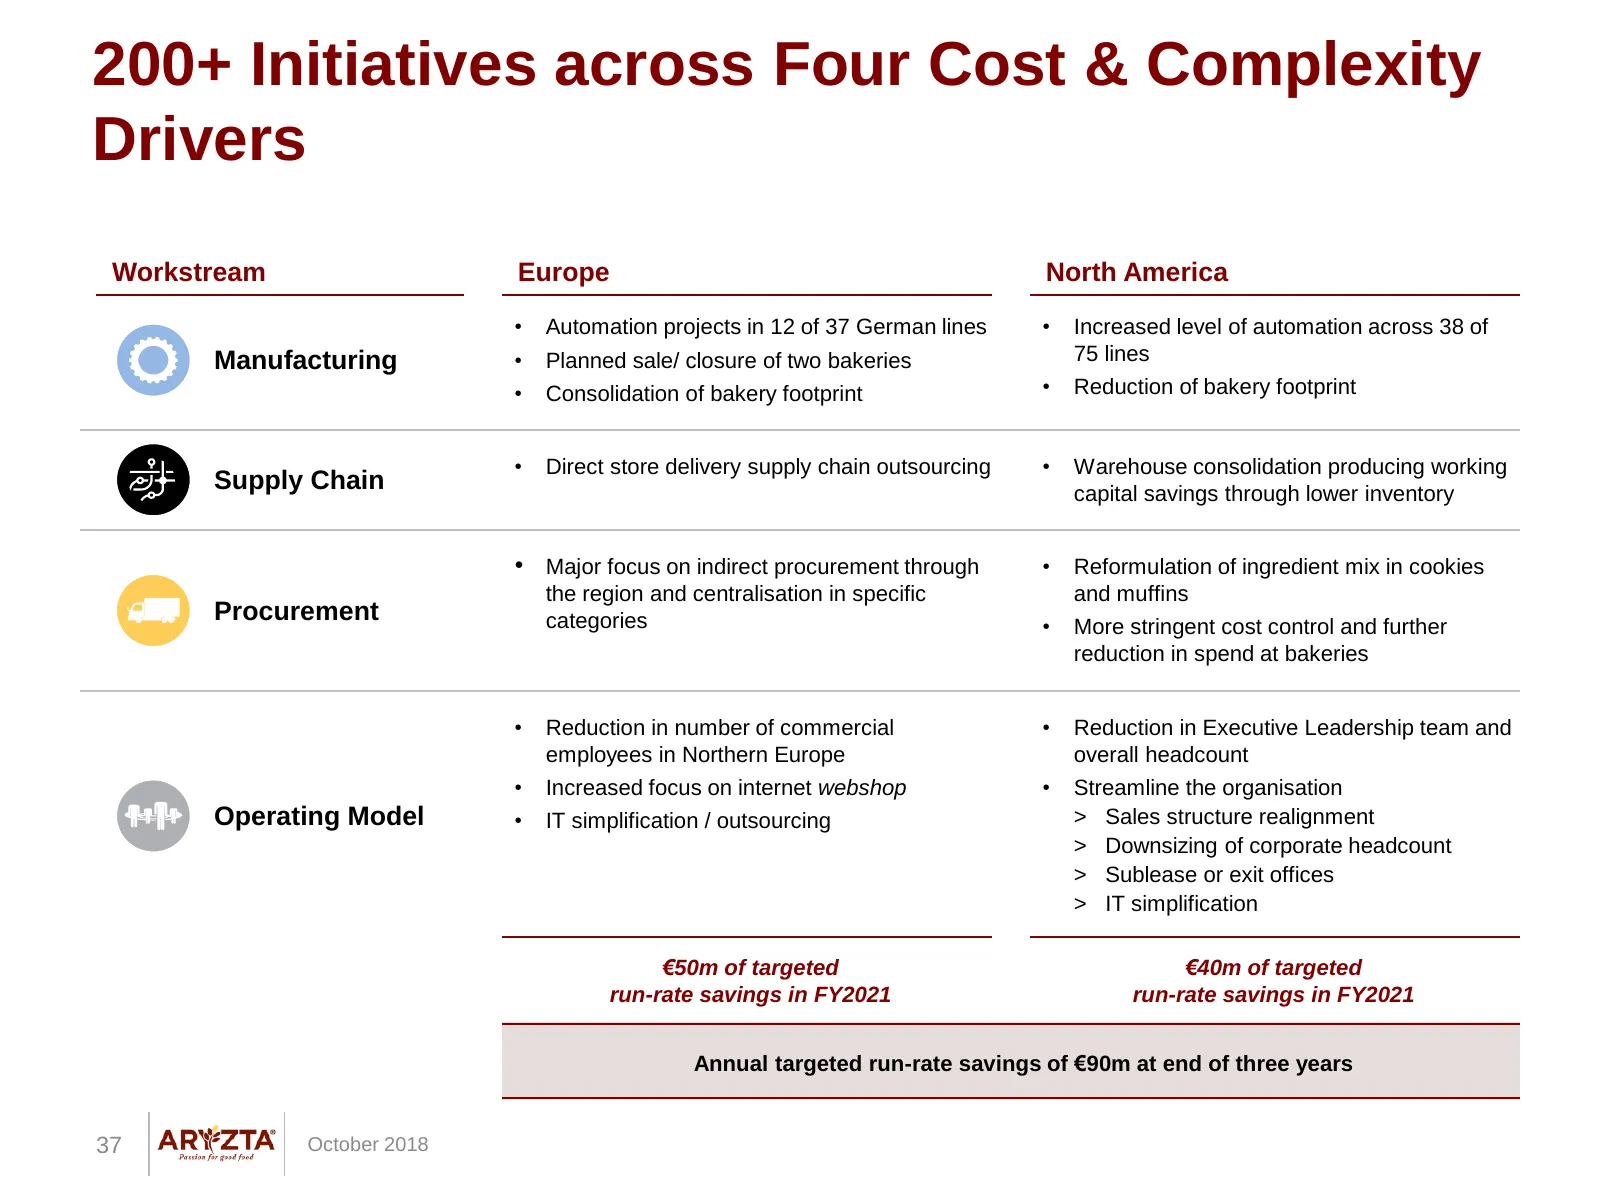
Slide 37: 200+ Initiatives across Four Cost & Complexity Drivers
200+ Initiatives across Four Cost & Complexity Drivers Workstream Europe North America • Automation projects in 12 of 37 German lines • Increased level of automation across 38 of Manufacturing • Planned sale/ closure of two bakeries 75 lines • Consolidation of bakery footprint • Reduction of bakery
Slide 38: Project Renew | Case Studies
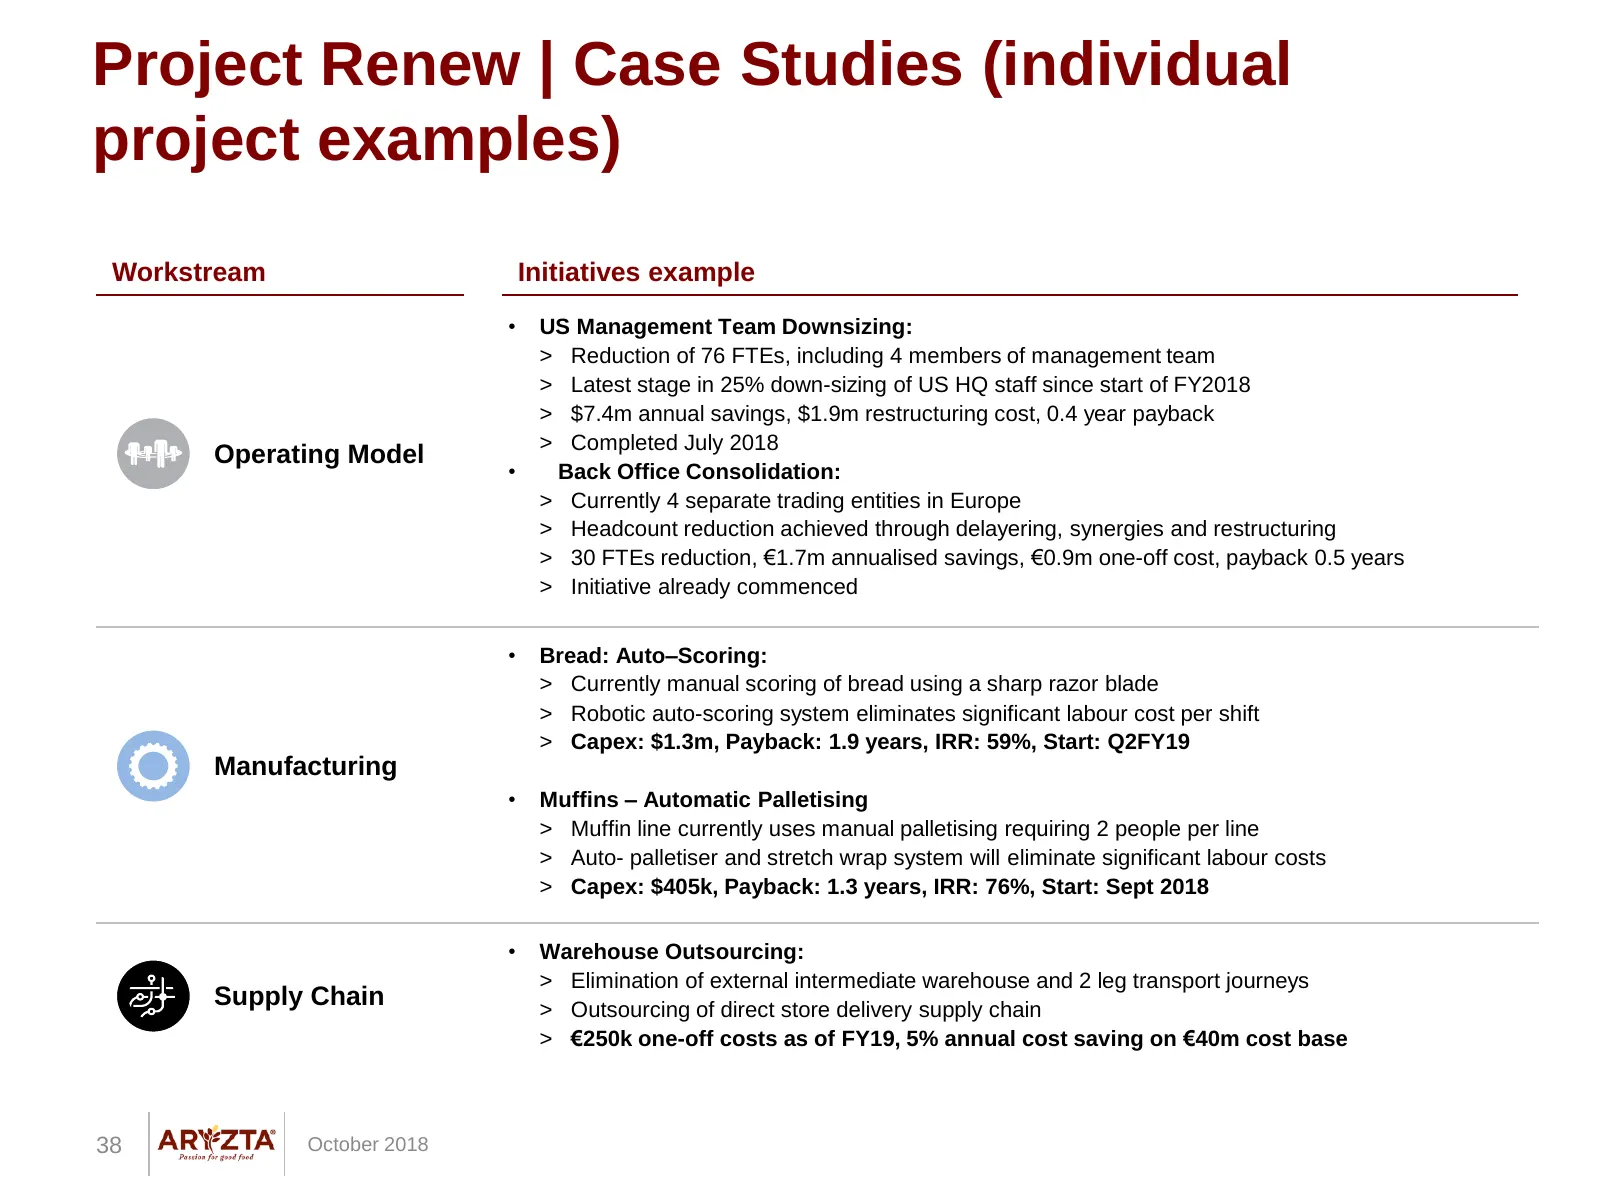
Project Renew | Case Studies (individual project examples) Workstream Initiatives example • US Management Team Downsizing: > Reduction of 76 FTEs, including 4 members of management team > Latest stage in 25% down-sizing of US HQ staff since start of FY2018 > $7.4m annual savings, $1.9m restructuring
Slide 39: Three Year Plan | Targeting €90m annual run-rate savings
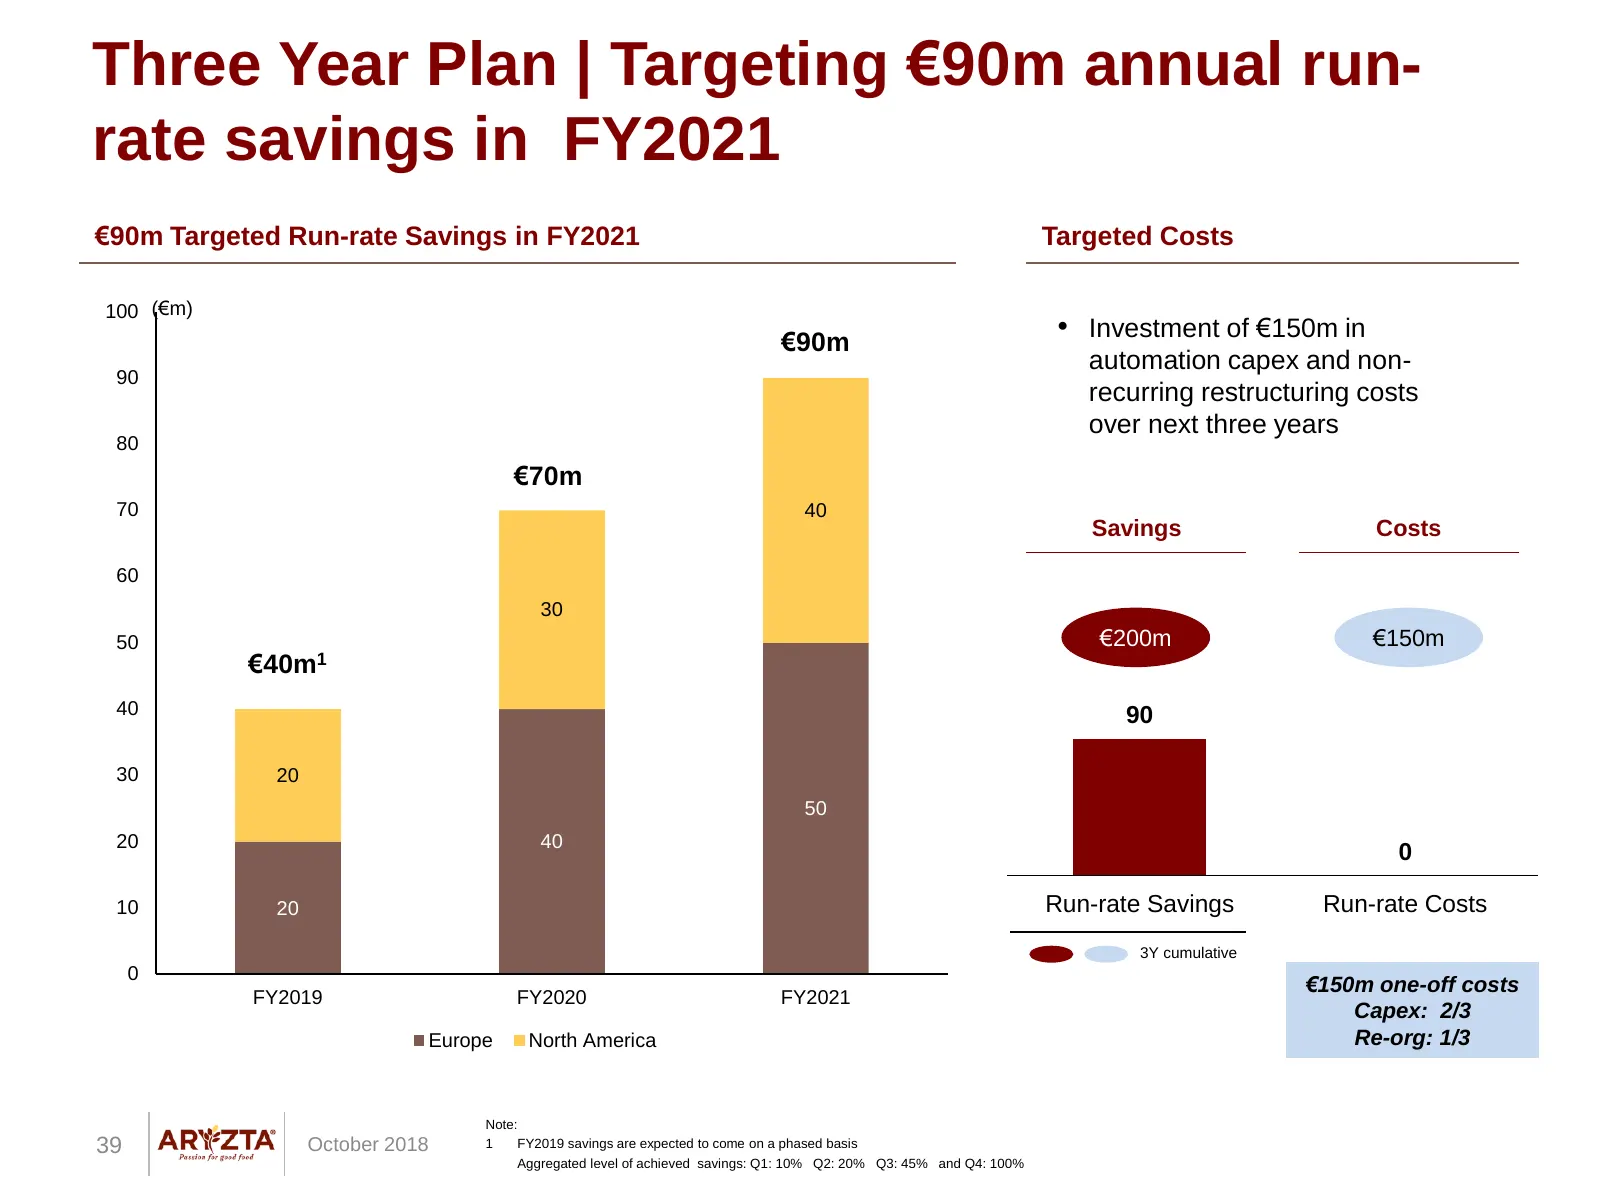
Three Year Plan | Targeting €90m annual run- rate savings in FY2021 €90m Targeted Run-rate Savings in FY2021 Targeted Costs 100 (€m) €90m • Investment of €150m in automation capex and non- 90 recurring restructuring costs over next three years 80 €70m 70 40 Savings Costs 60 30 50 €200m €150m €40m1 4
Slide 40: Selective Investment in Growth | Examples
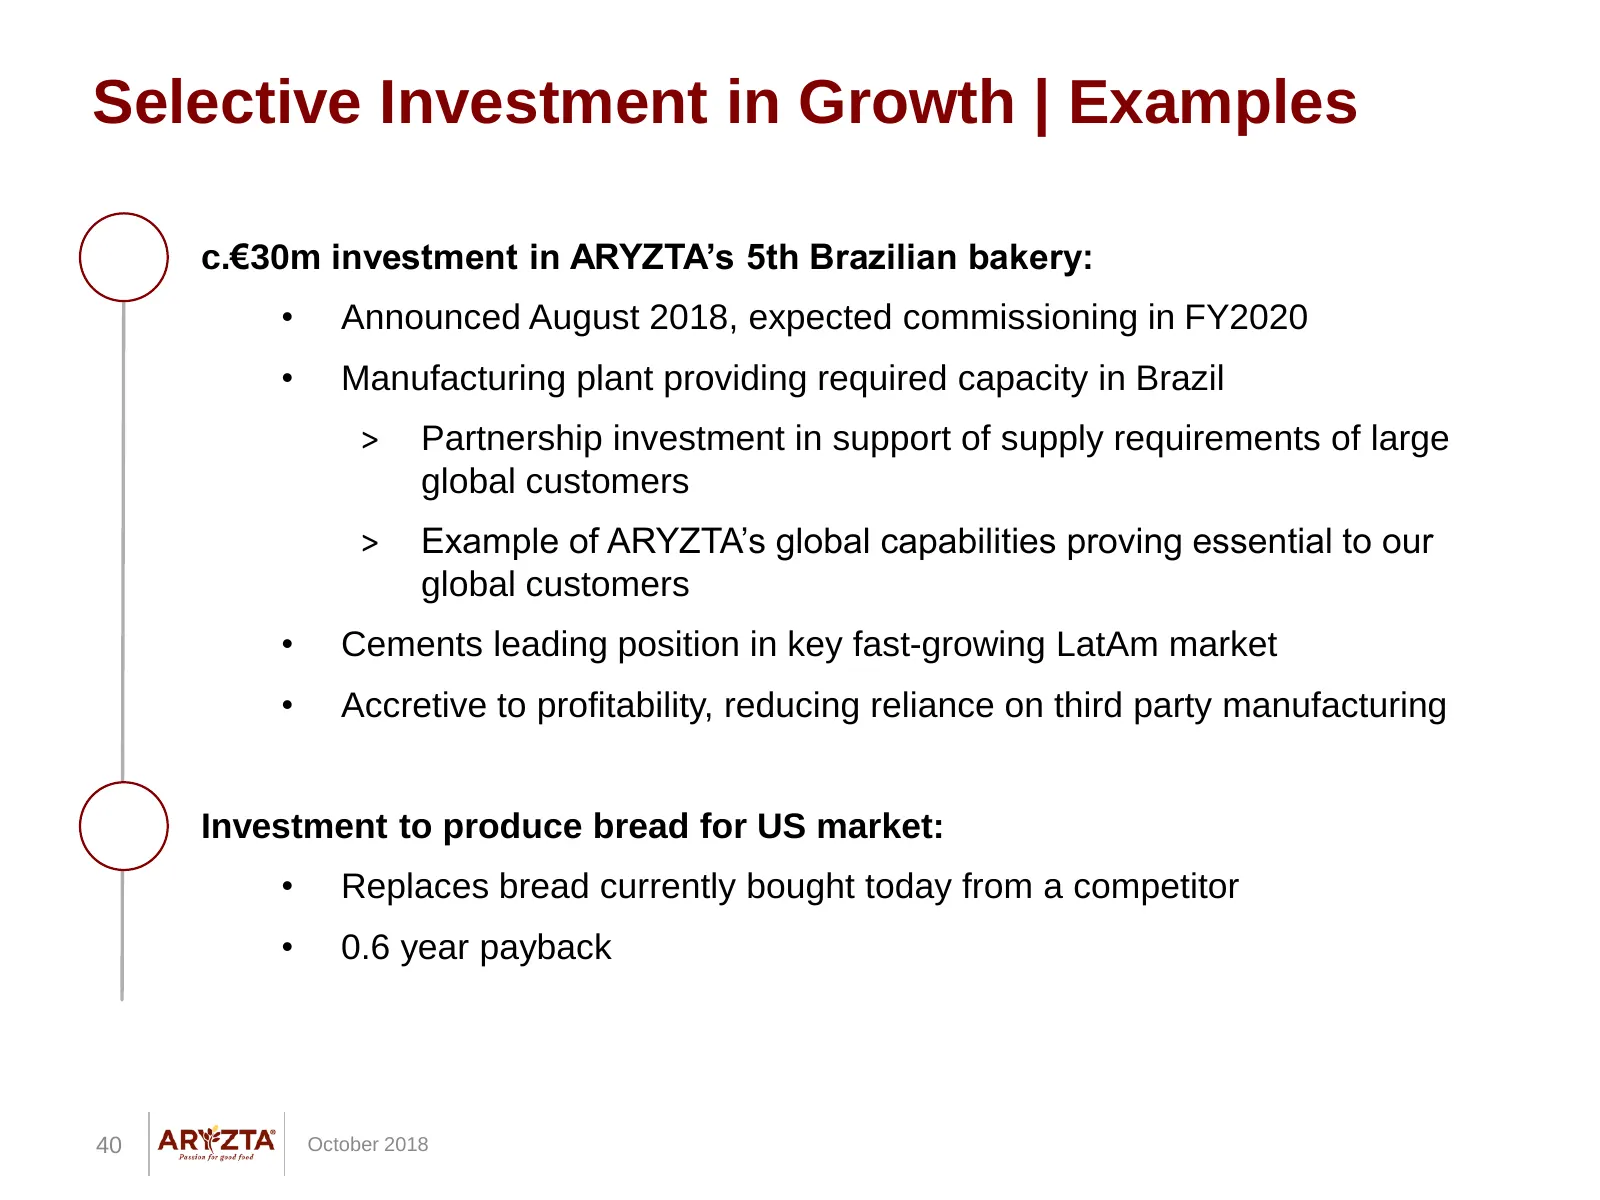
Selective Investment in Growth | Examples c.€30m investment in ARYZTA’s 5th Brazilian bakery: • Announced August 2018, expected commissioning in FY2020 • Manufacturing plant providing required capacity in Brazil > Partnership investment in support of supply requirements of large global customers > E
Slide 41: Outlook and Investment Case
OUTLOOK AND INVESTMENT CASE 41 October 2018
Slide 42: Medium-Term Targets
Medium-Term Targets • Frozen B2B is a growing market • ARYZTA is positioning itself to fully participate in this growing market in future • ARYZTA is targeting EBITDA margins in the medium-term in a range of 12% to 14% as it progresses in its multi-year turnaround strategy • Capital expenditure in m
Slide 43: FY2019 & Guidance
FY2019 & Guidance • FY2019 budget planned capex is €120m • €45m expected additional capex investment in Project Renew to enable progress • The company expects mid- to high single digit organic EBITDA growth for FY2019 (applying Budget FY2019 exchange rates on a like-for-like basis and excluding disp
Slide 44: Investment Case
Investment Case • ARYZTA is a global leader in frozen B2B bakery • Attractive opportunity in a growing market • Clear turnaround strategy and plans in place to deliver stability, performance and growth > Clear strategic priorities > Strong management team > Focus on operational improvement > Project
Slide 45: Appendix
APPENDIX 45 | ARYWZTA october 2018
Slide 46: Gira Market Data for Europe Bakery
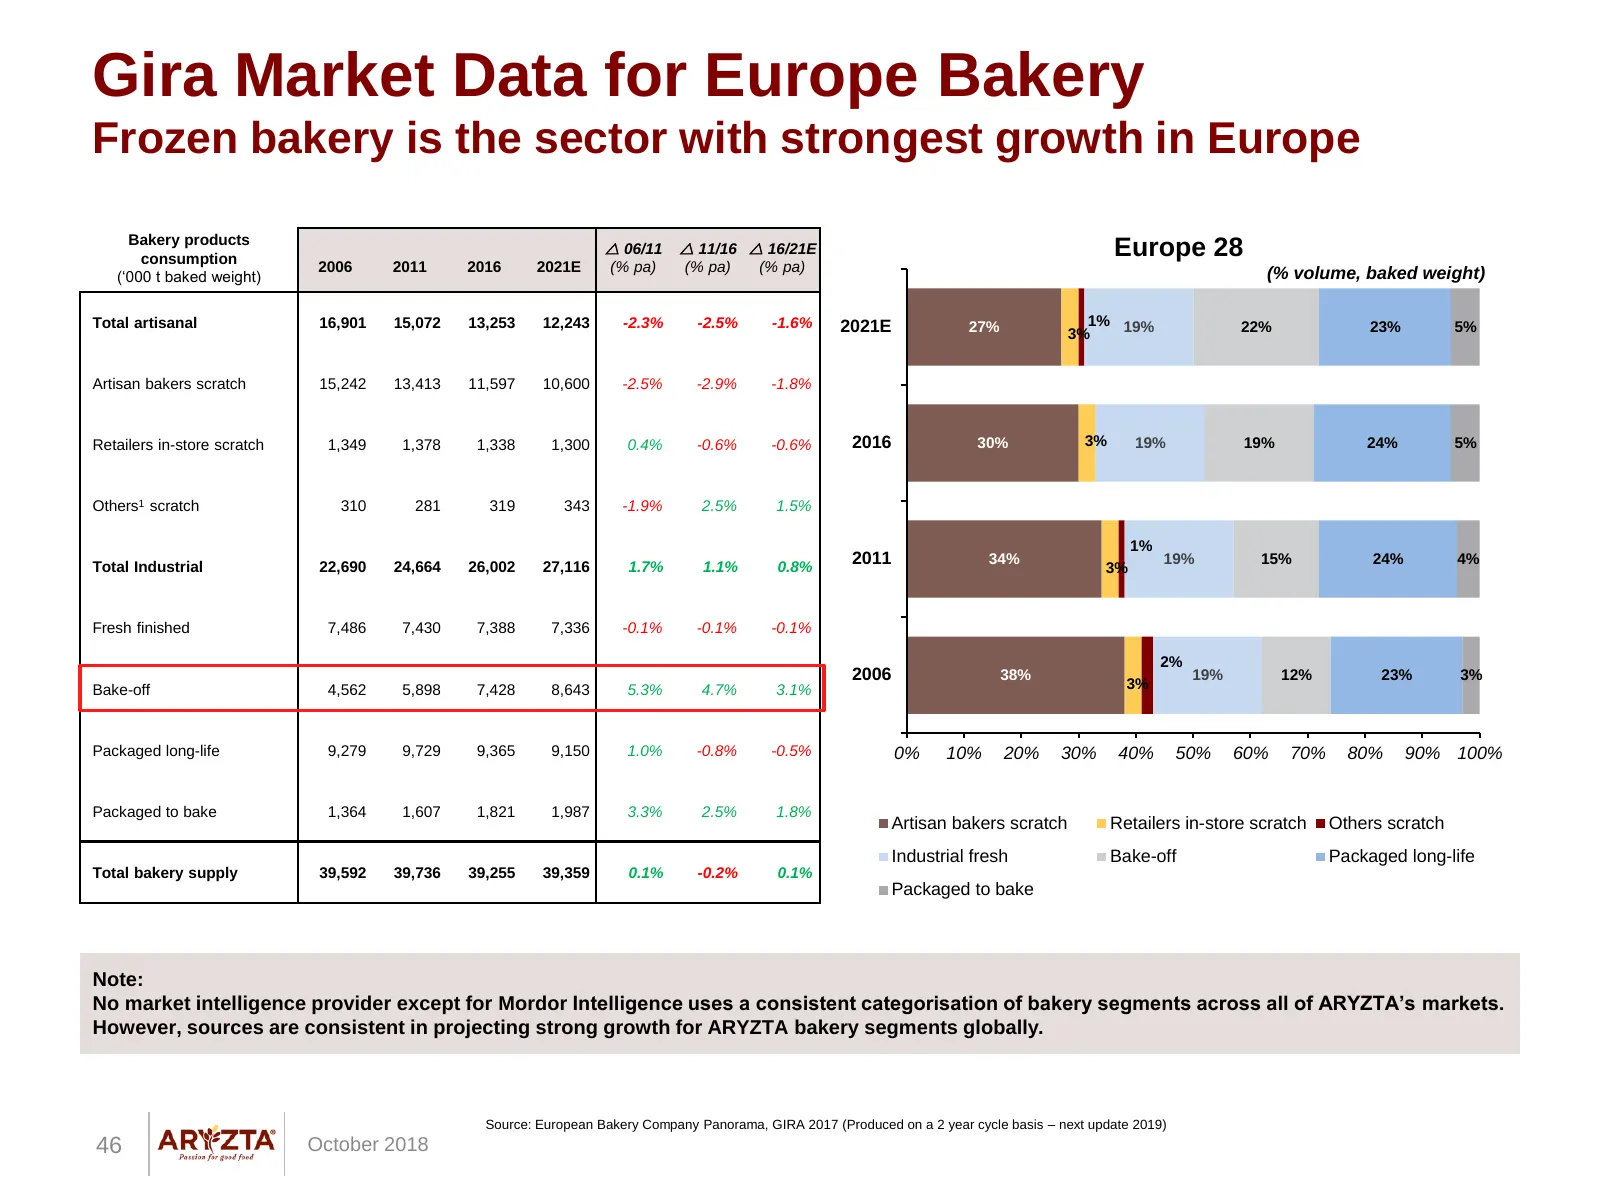
Gira Market Data for Europe Bakery Frozen bakery is the sector with strongest growth in Europe Bakery products consumption 06/11 11/16 16/21E Europe 28 2006 2011 2016 2021E (% pa) (% pa) (% pa) (% volume, baked weight) (‘000 t baked weight) Total artisanal 16,901 15,072 13,253 12,243 -2.3% -2.
Slide 47: Technomics Market Data for US Bakery
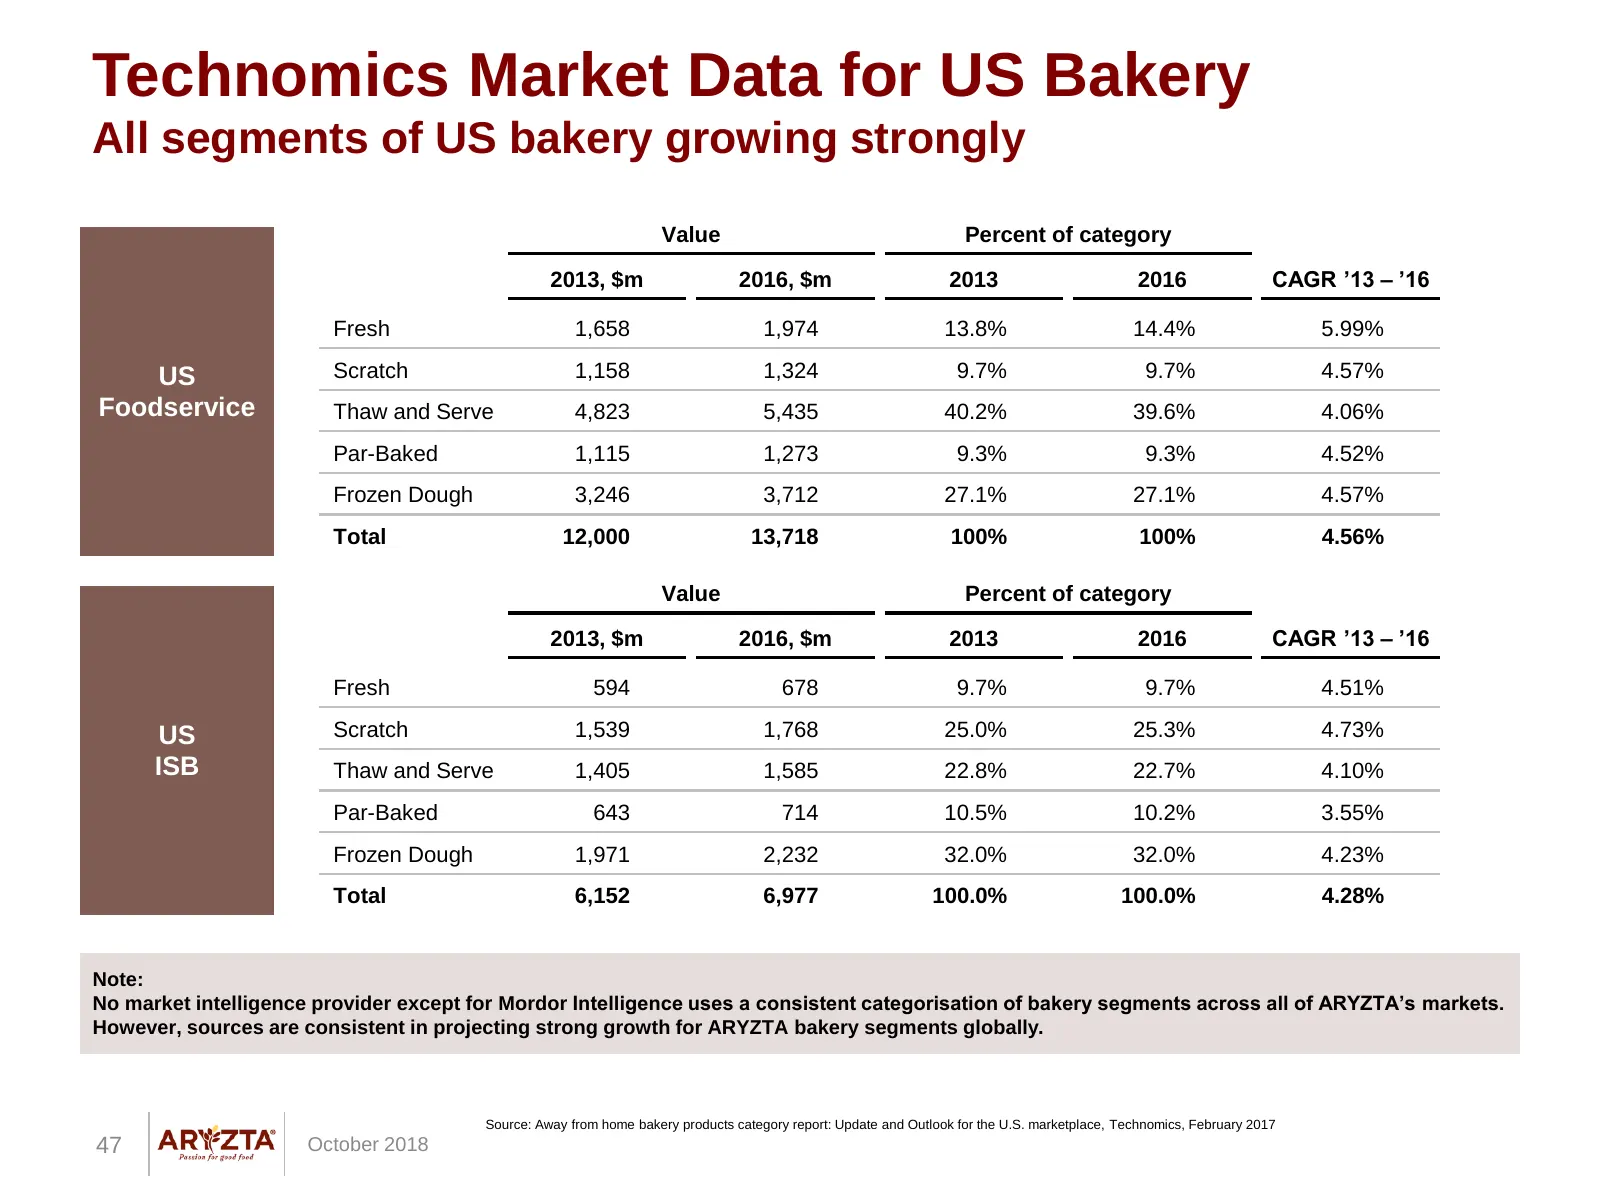
Technomics Market Data for US Bakery All segments of US bakery growing strongly Value Percent of category 2013, $m 2016, $m 2013 2016 CAGR ’13 – ’16 Fresh 1,658 1,974 13.8% 14.4% 5.99% US Scratch 1,158 1,324 9.7% 9.7% 4.57% Foodservice Thaw and Serve 4,823 5,435 40.2% 39.6% 4.06% Par-Baked 1,115 1,2
Slide 48: Global Frozen Bakery
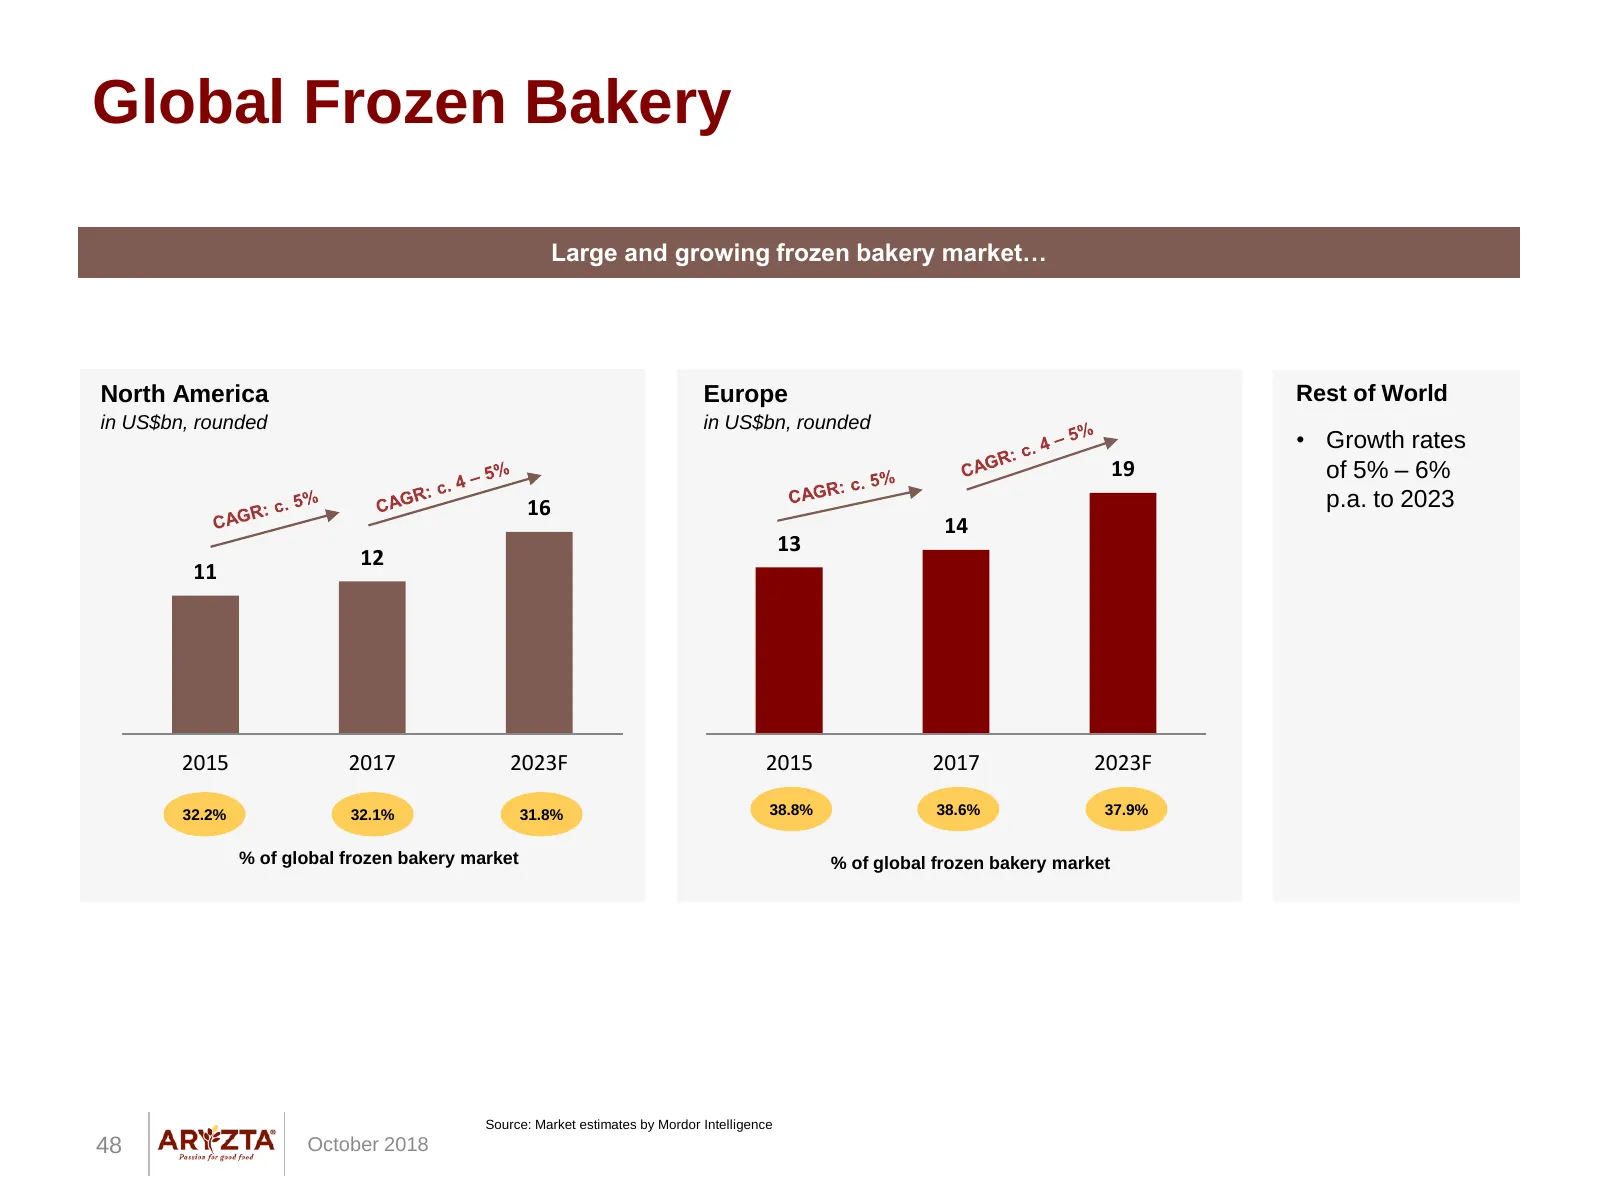
Global Frozen Bakery Large and growing frozen bakery market… North America Europe Rest of World in US$bn, rounded in US$bn, rounded • Growth rates 19 of 5% – 6% 16 p.a. to 2023 14 13 12 11 2015 2017 2023F 2015 2017 2023F 32.2% 32.1% 31.8% 38.8% 38.6% 37.9% % of global frozen bakery market % of globa
Slide 49: Improve B2B Customer Relationships
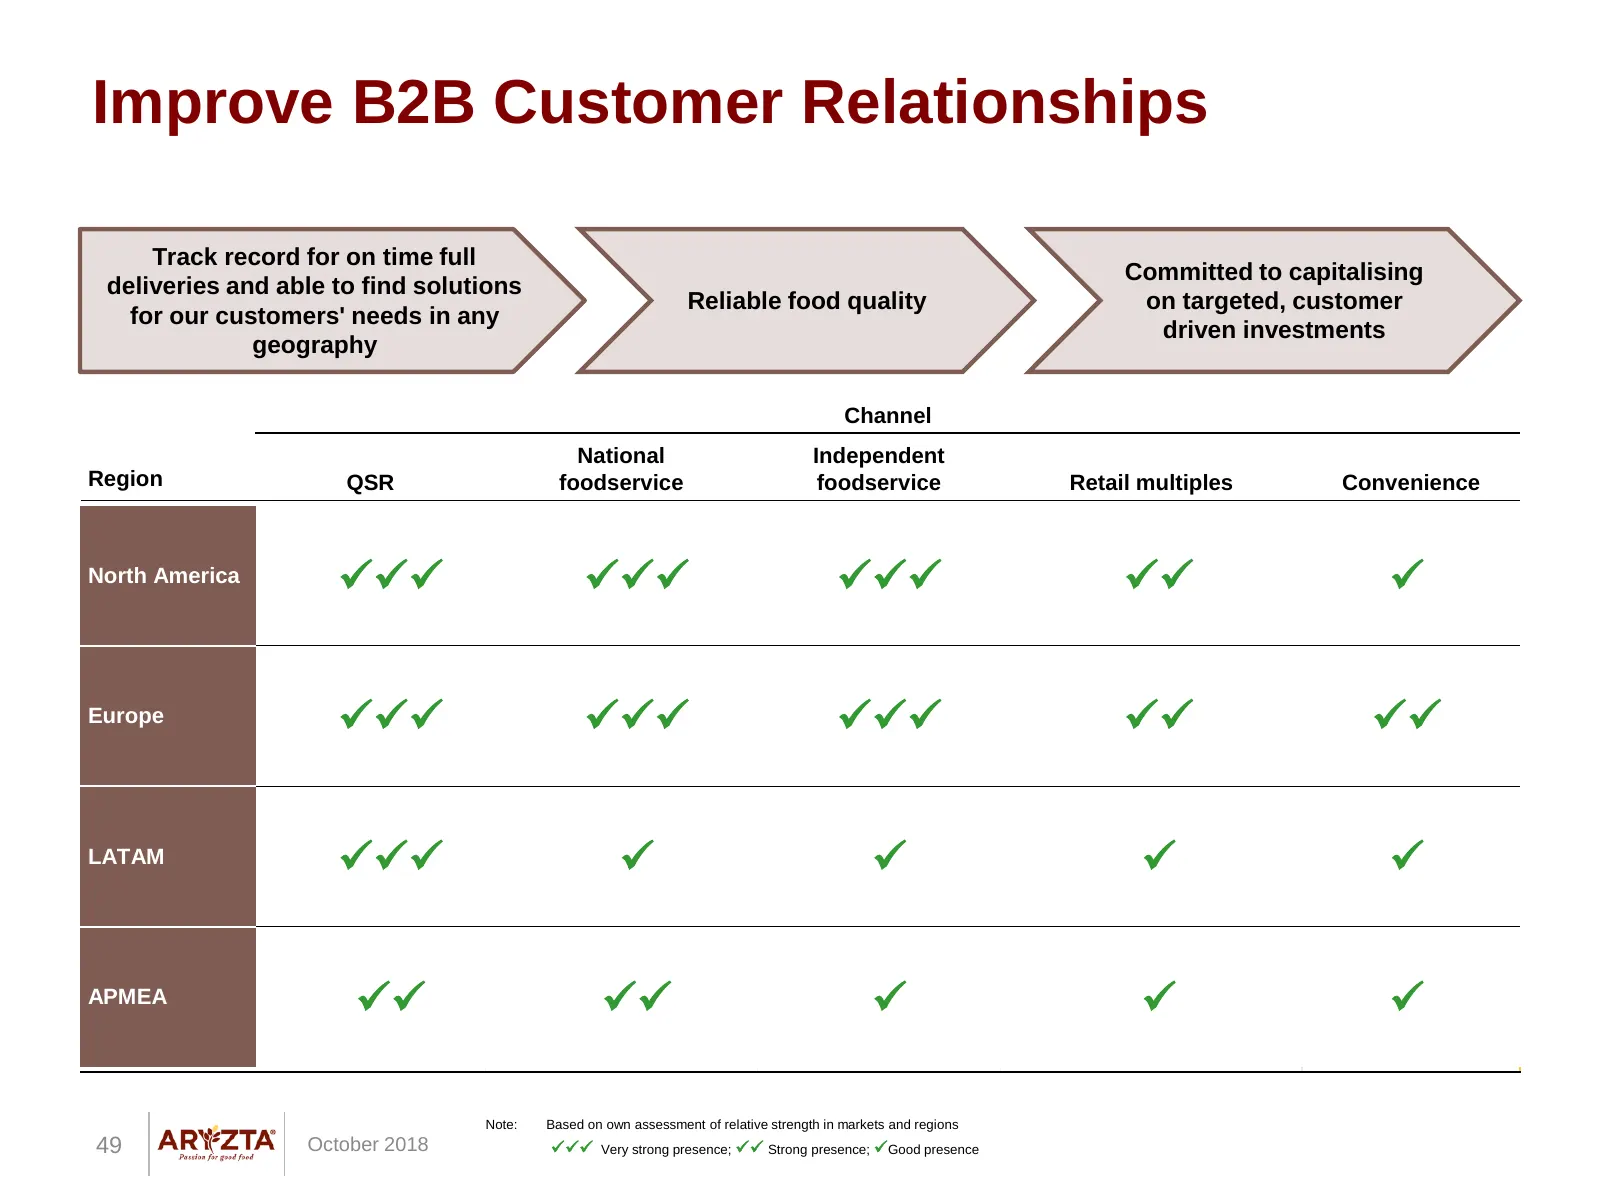
Improve B2B Customer Relationships Track record for on time full Committed to capitalising deliveries and able to find solutions Reliable food quality on targeted, customer for our customers' needs in any driven investments geography Channel National Independent Region QSR foodservice foodservice Re
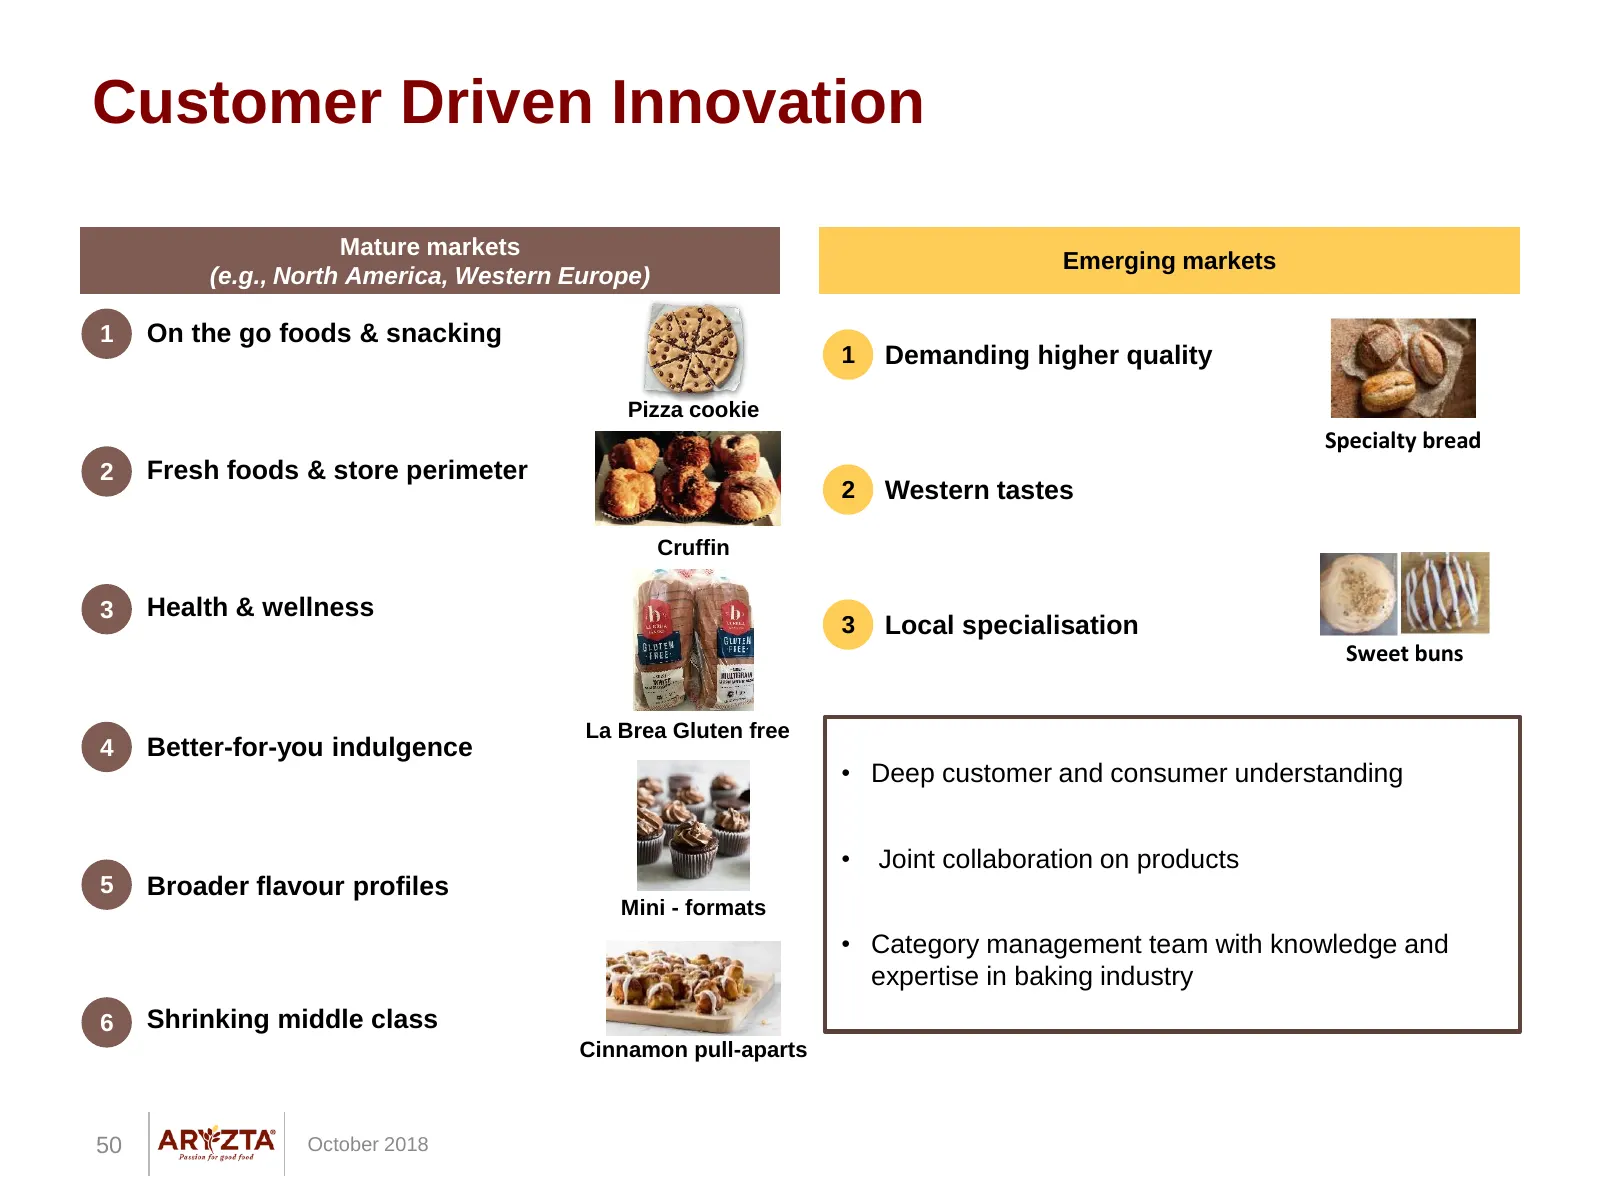
Slide 50: Customer Driven Innovation
Customer Driven Innovation Mature markets Emerging markets (e.g., North America, Western Europe) 1 On the go foods & snacking 1 Demanding higher quality Pizza cookie Specialty bread 2 Fresh foods & store perimeter 2 Western tastes Cruffin 3 Health & wellness 3 Local specialisation Sweet buns La Brea
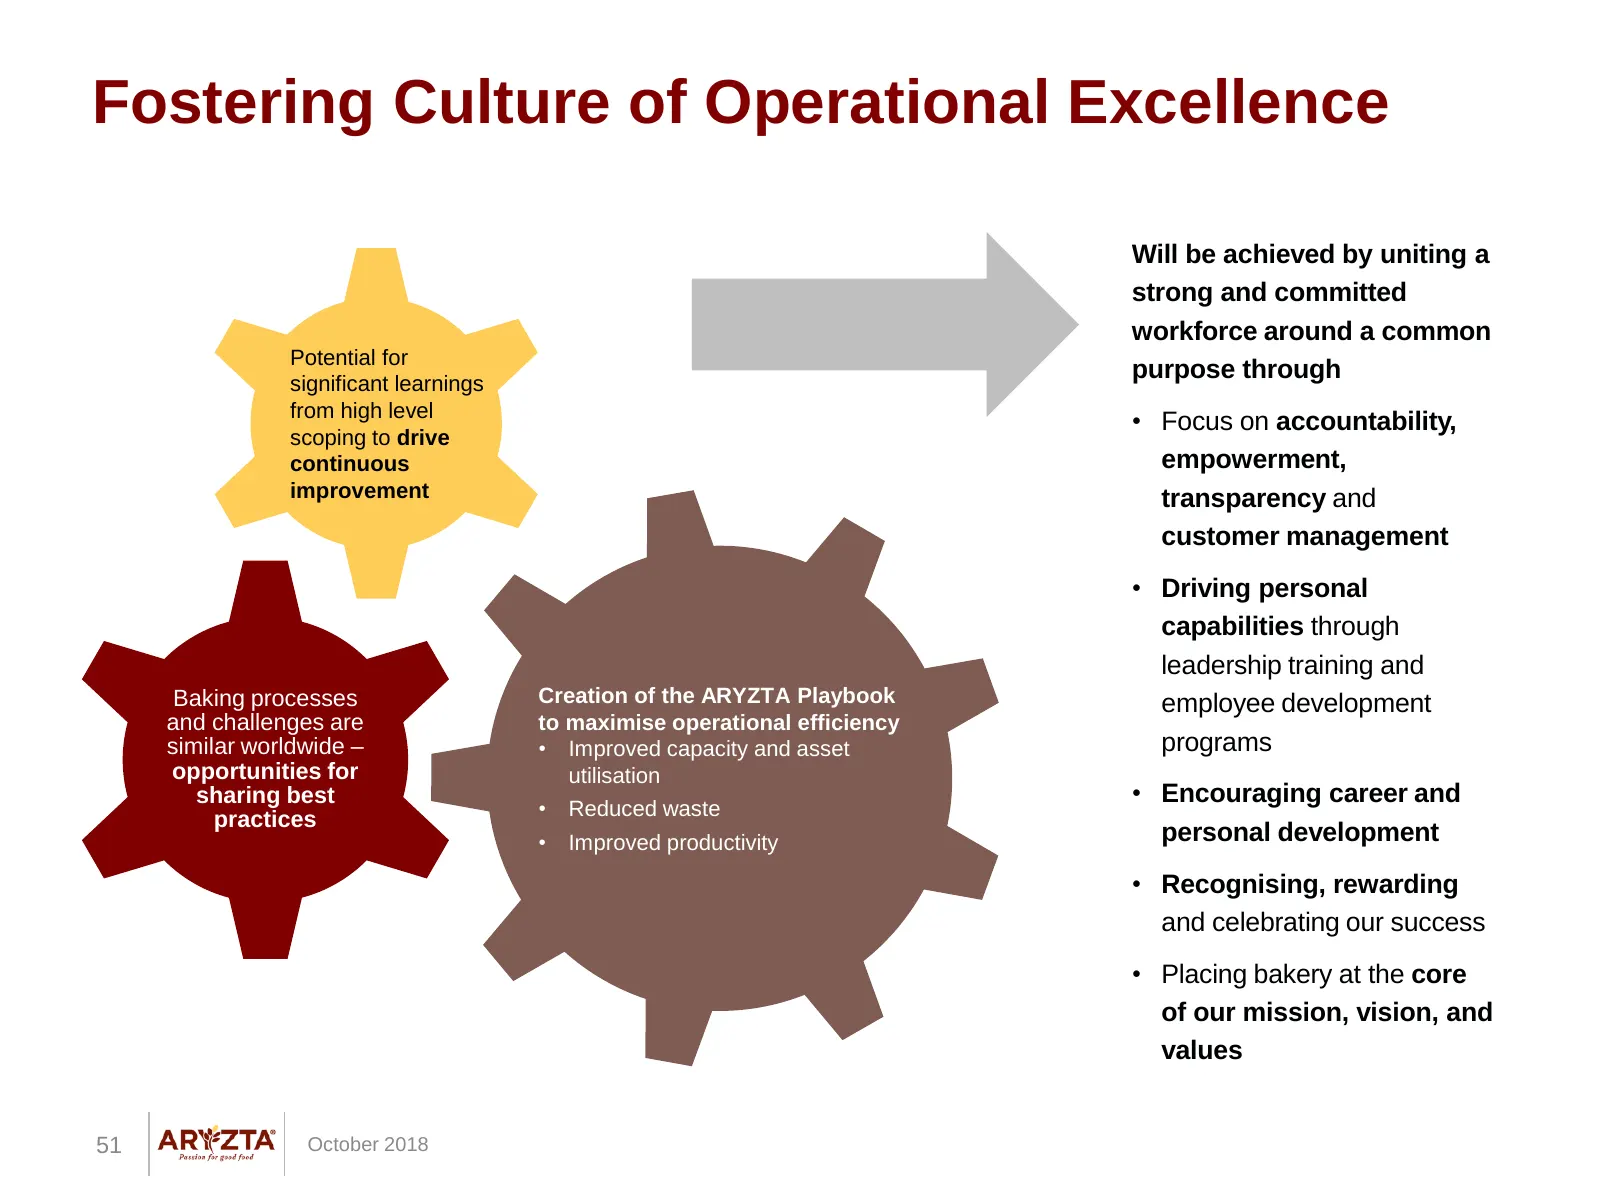
Slide 51: Fostering Culture of Operational Excellence
Fostering Culture of Operational Excellence Will be achieved by uniting a strong and committed workforce around a common Potential for significant learnings purpose through from high level • Focus on accountability, scoping to drive continuous empowerment, improvement transparency and customer manag
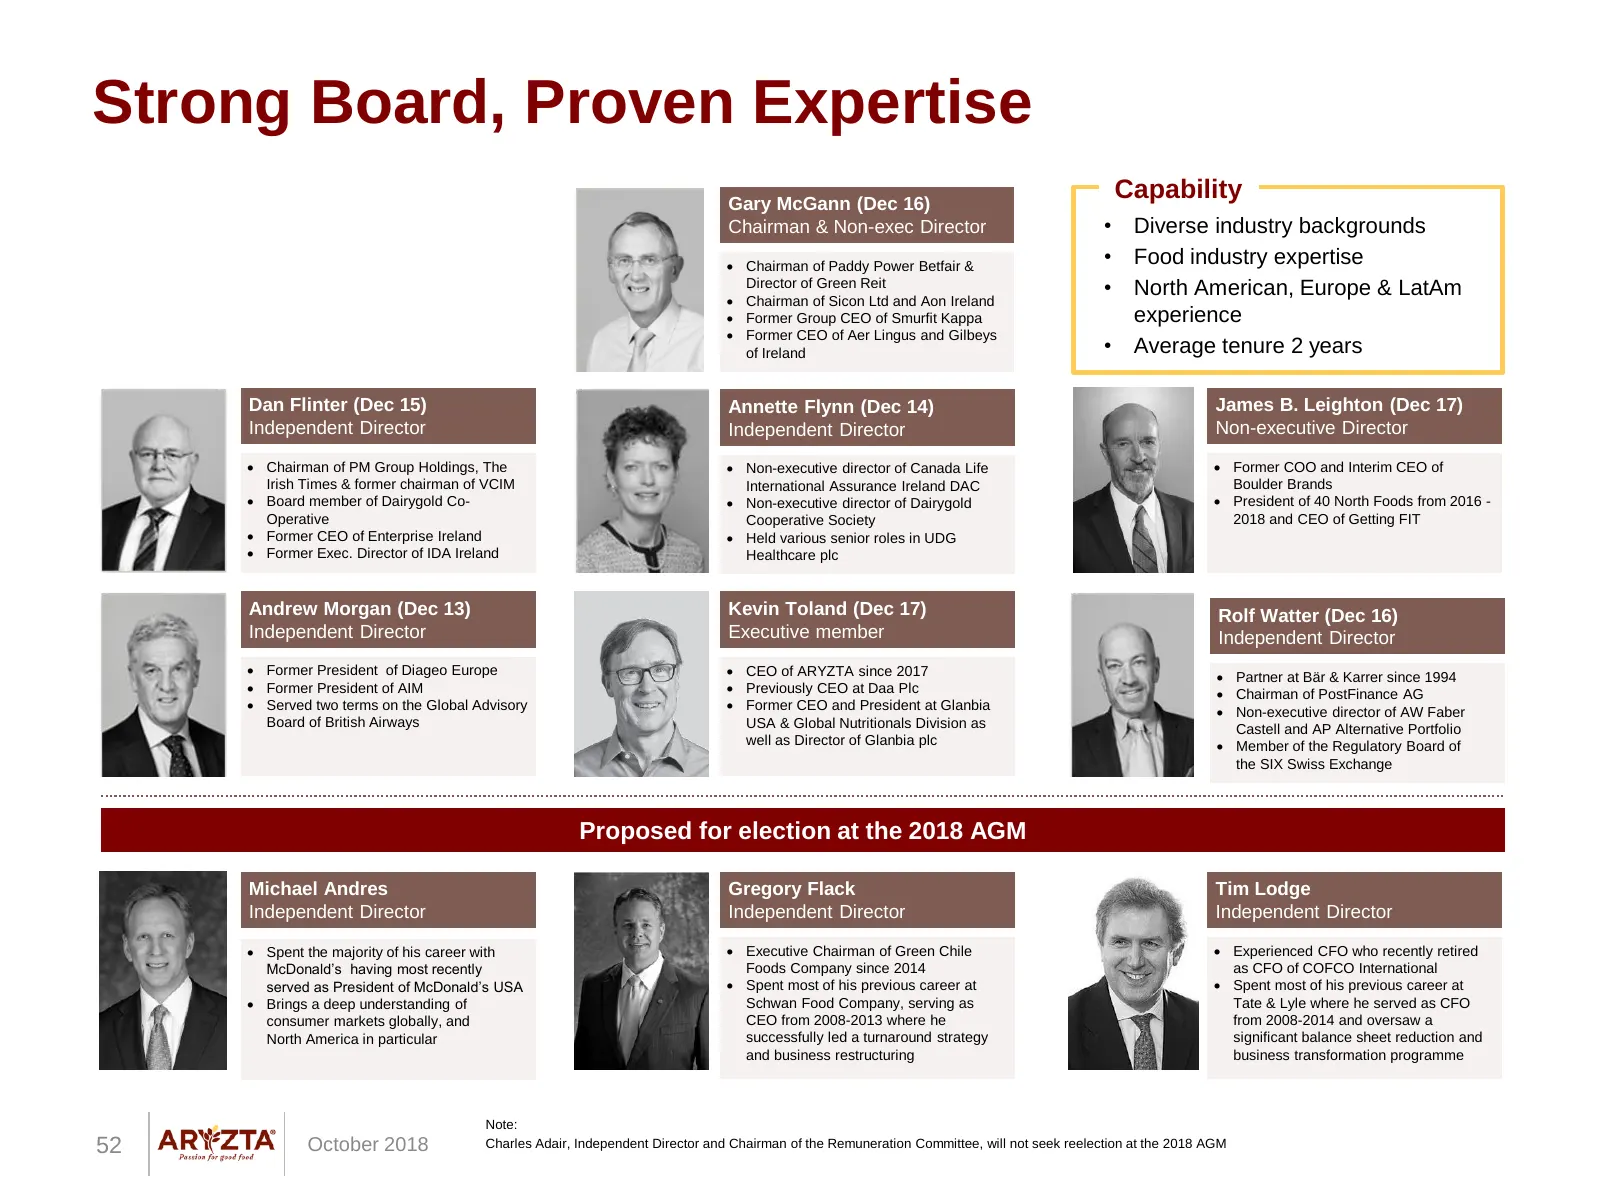
Slide 52: Strong Board, Proven Expertise
Strong Board, Proven Expertise Gary McGann (Dec 16) Capability Chairman & Non-exec Director • Diverse industry backgrounds Chairman of Paddy Power Betfair & • Food industry expertise Director of Green Reit Chairman of Sicon Ltd and Aon Ireland • North American, Europe & LatAm Former Group CEO
Slide 53: Additional FY2018 Financial Details
ADDITIONAL FY2018 FINANCIAL DETAILS 53 October 2018
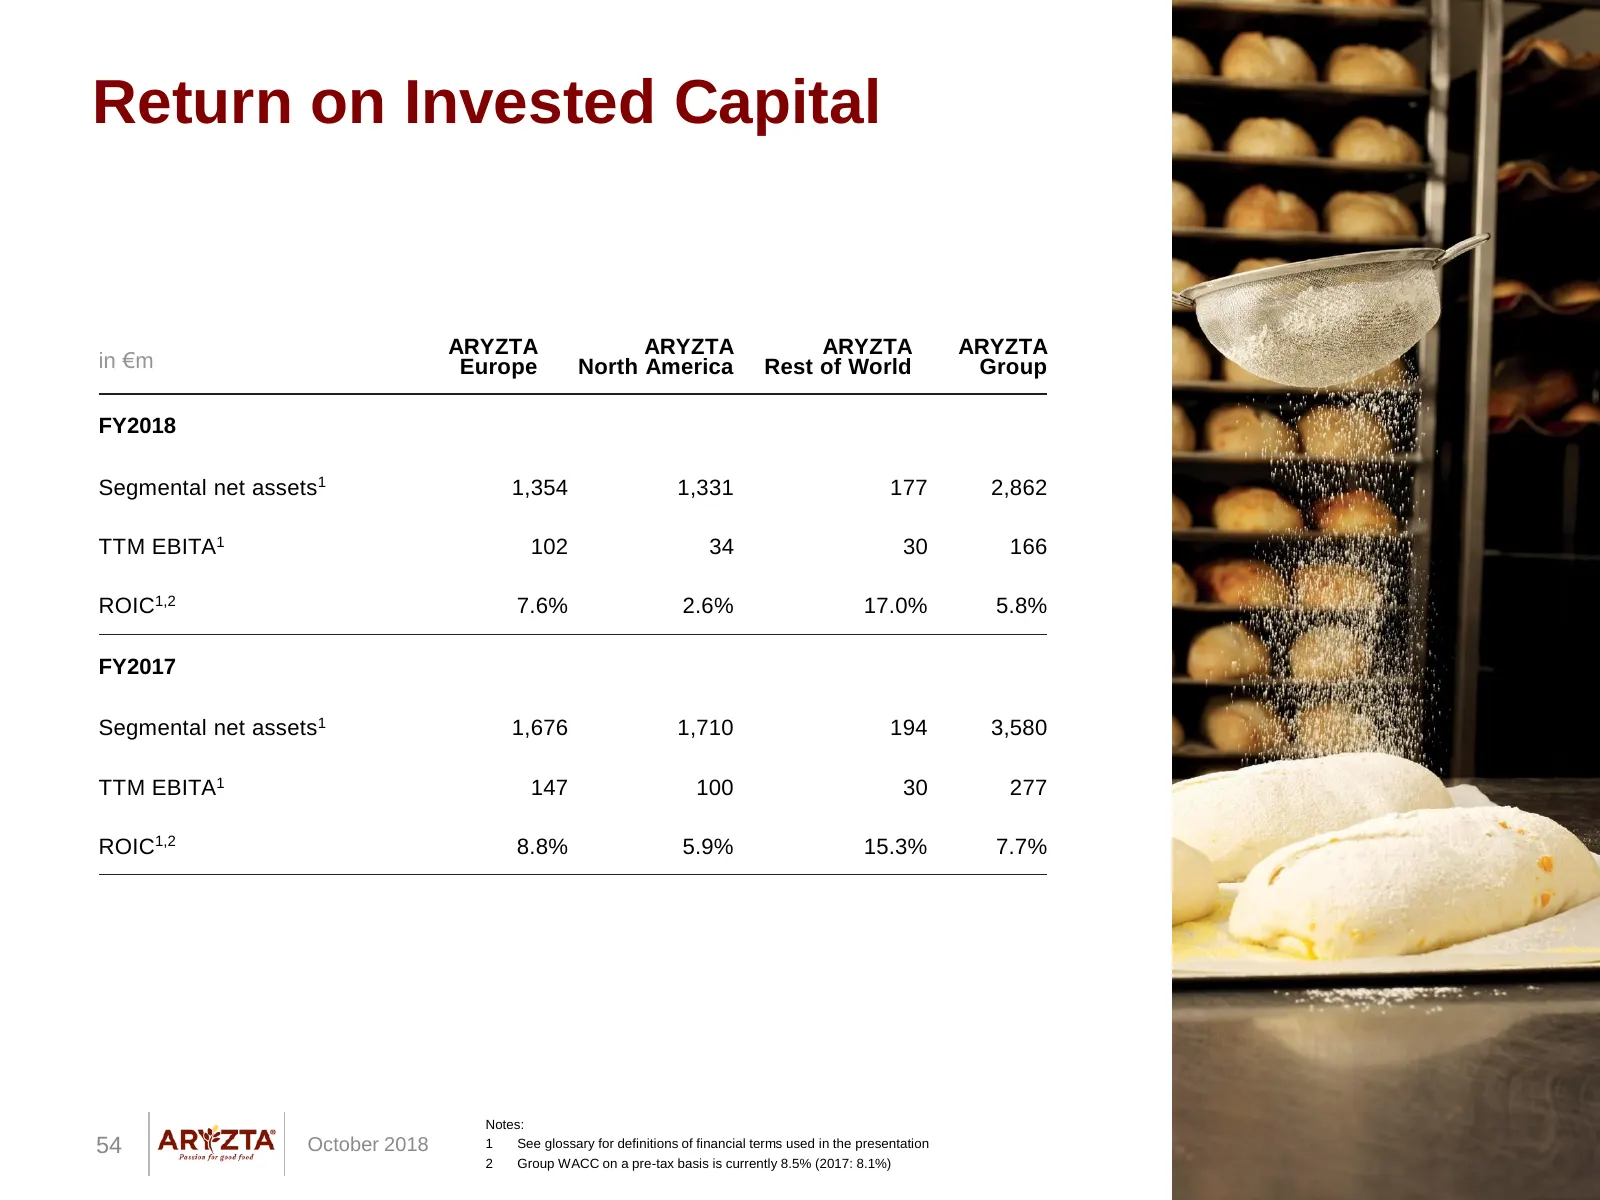
Slide 54: Return on Invested Capital
Return on Invested Capital ARYZTA ARYZTA ARYZTA ARYZTA in €m Europe North America Rest of World Group FY2018 Segmental net assets1 1,354 1,331 177 2,862 TTM EBITA1 102 34 30 166 ROIC1,2 7.6% 2.6% 17.0% 5.8% FY2017 Segmental net assets1 1,676 1,710 194 3,580 TTM EBITA1 147 100 30 277 ROIC1,2 8.8% 5.9
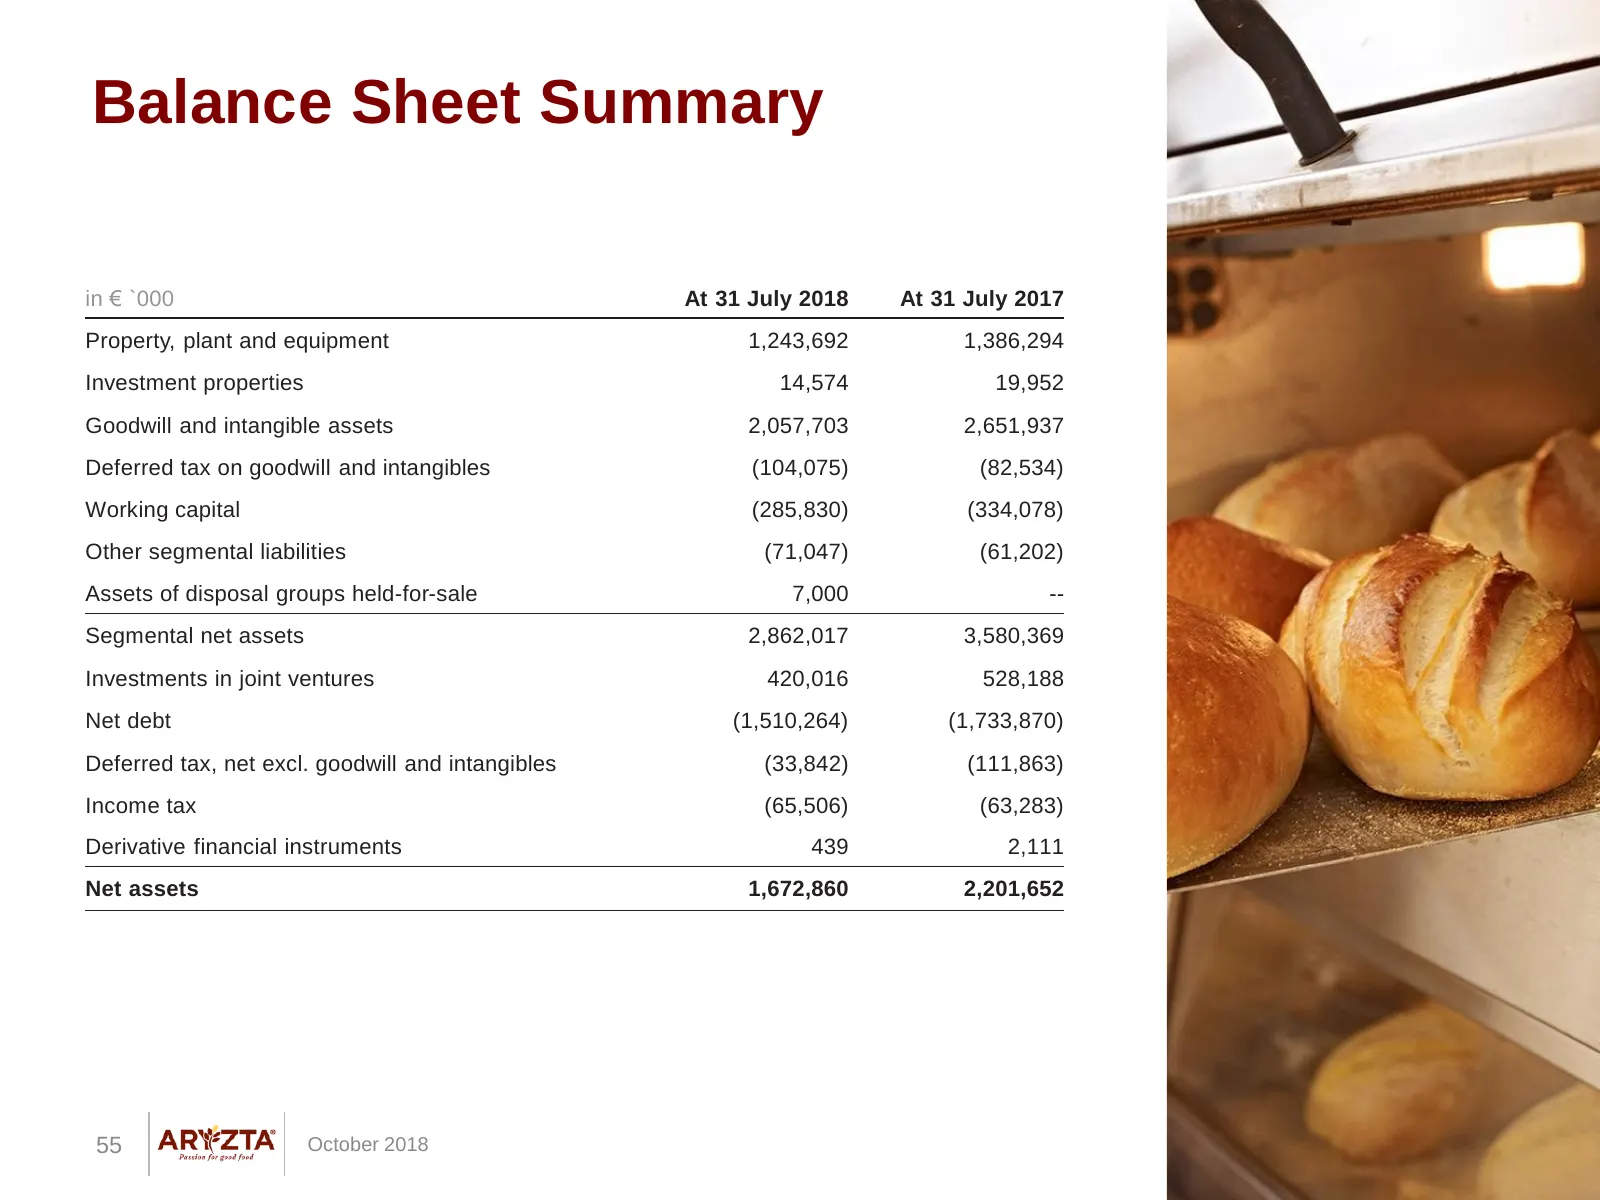
Slide 55: Balance Sheet Summary
Balance Sheet Summary in € `000 At 31 July 2018 At 31 July 2017 Property, plant and equipment 1,243,692 1,386,294 Investment properties 14,574 19,952 Goodwill and intangible assets 2,057,703 2,651,937 Deferred tax on goodwill and intangibles (104,075) (82,534) Working capital (285,830) (334,078) Oth
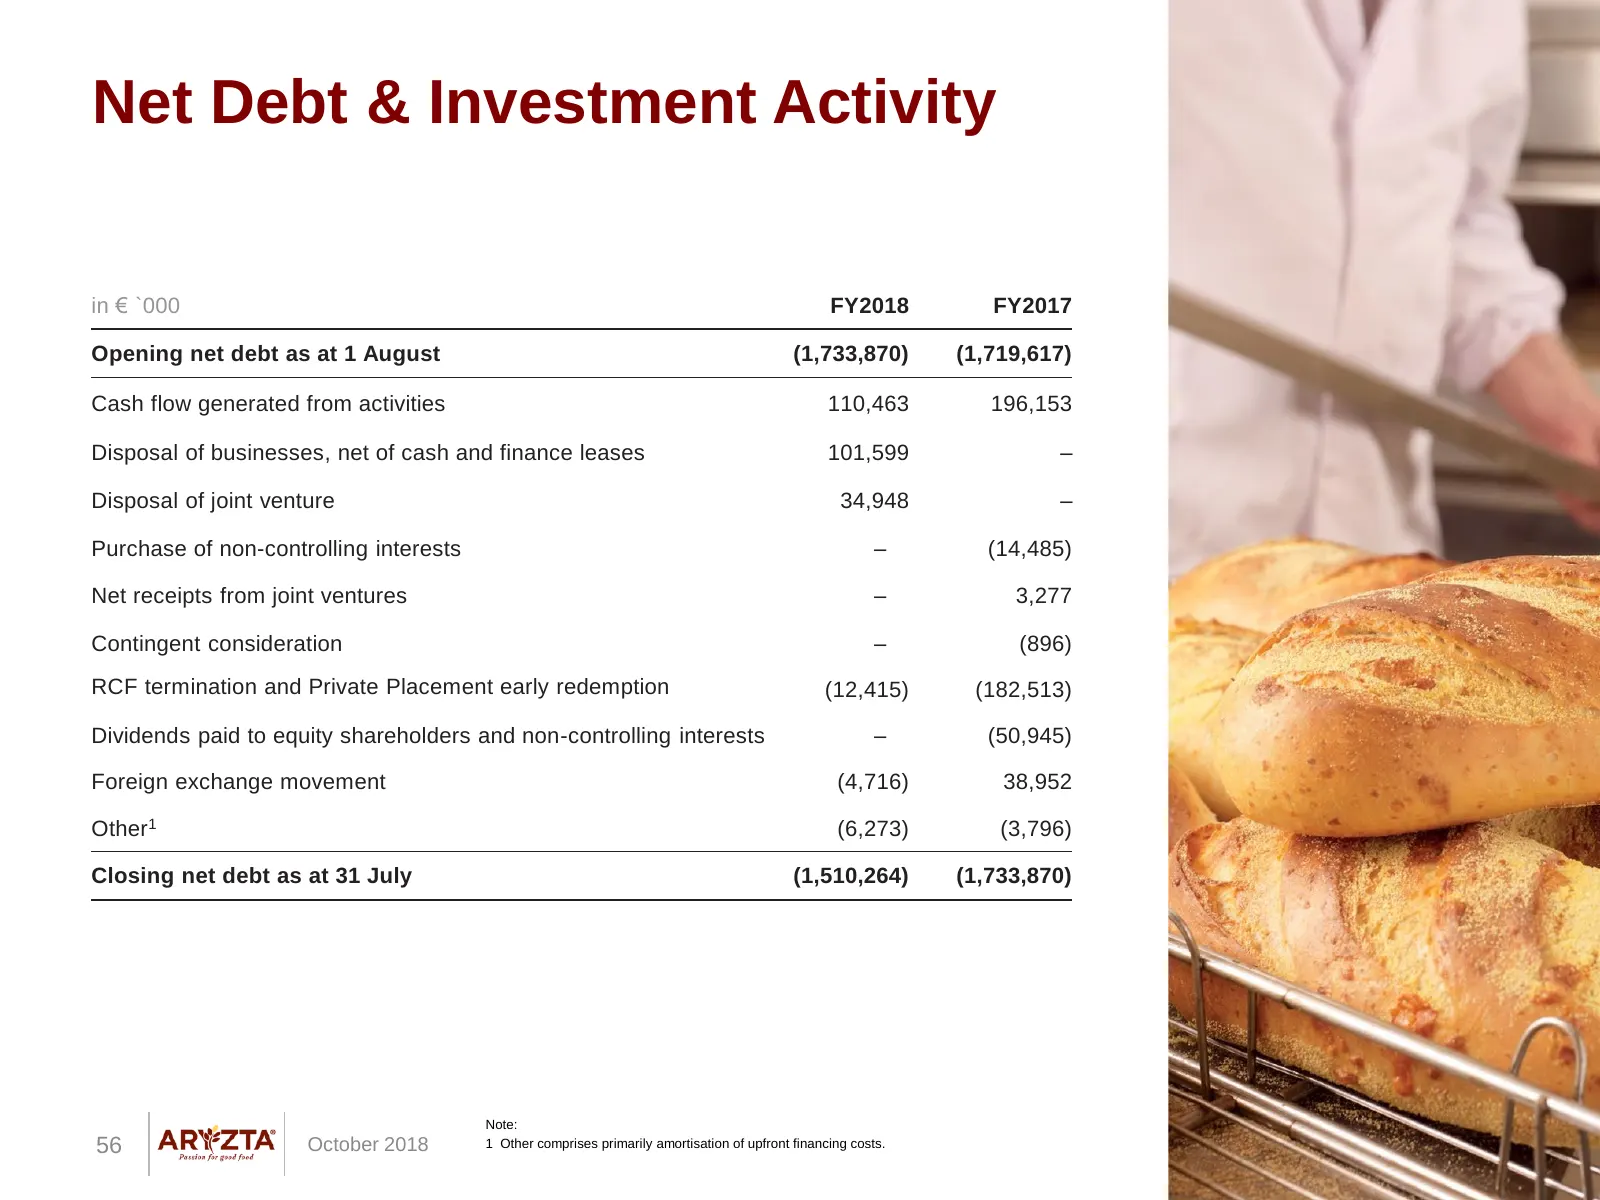
Slide 56: Net Debt & Investment Activity
Net Debt & Investment Activity in € `000 FY2018 FY2017 Opening net debt as at 1 August (1,733,870) (1,719,617) Cash flow generated from activities 110,463 196,153 Disposal of businesses, net of cash and finance leases 101,599 – Disposal of joint venture 34,948 – Purchase of non-controlling interests
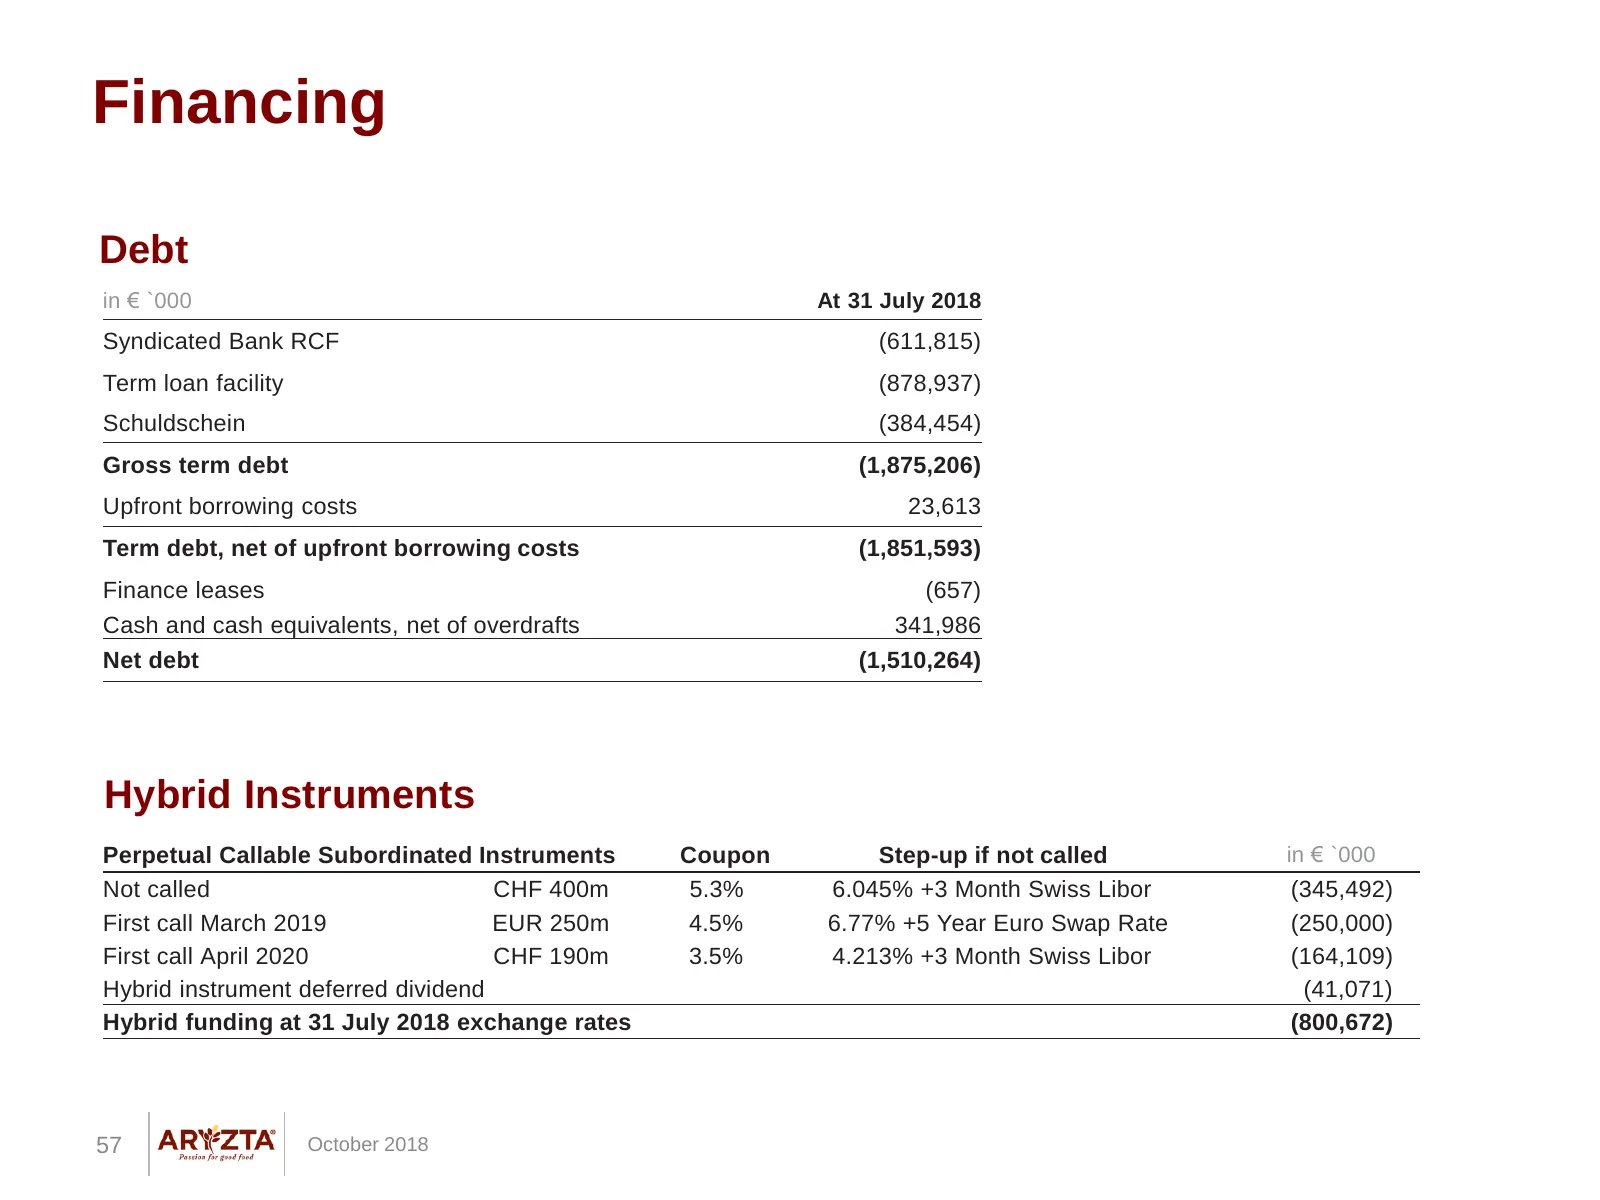
Slide 57: Financing
Financing Debt in € `000 At 31 July 2018 Syndicated Bank RCF (611,815) Term loan facility (878,937) Schuldschein (384,454) Gross term debt (1,875,206) Upfront borrowing costs 23,613 Term debt, net of upfront borrowing costs (1,851,593) Finance leases (657) Cash and cash equivalents, net of overdraft
Slide 58: EUR Closing and Average Rates
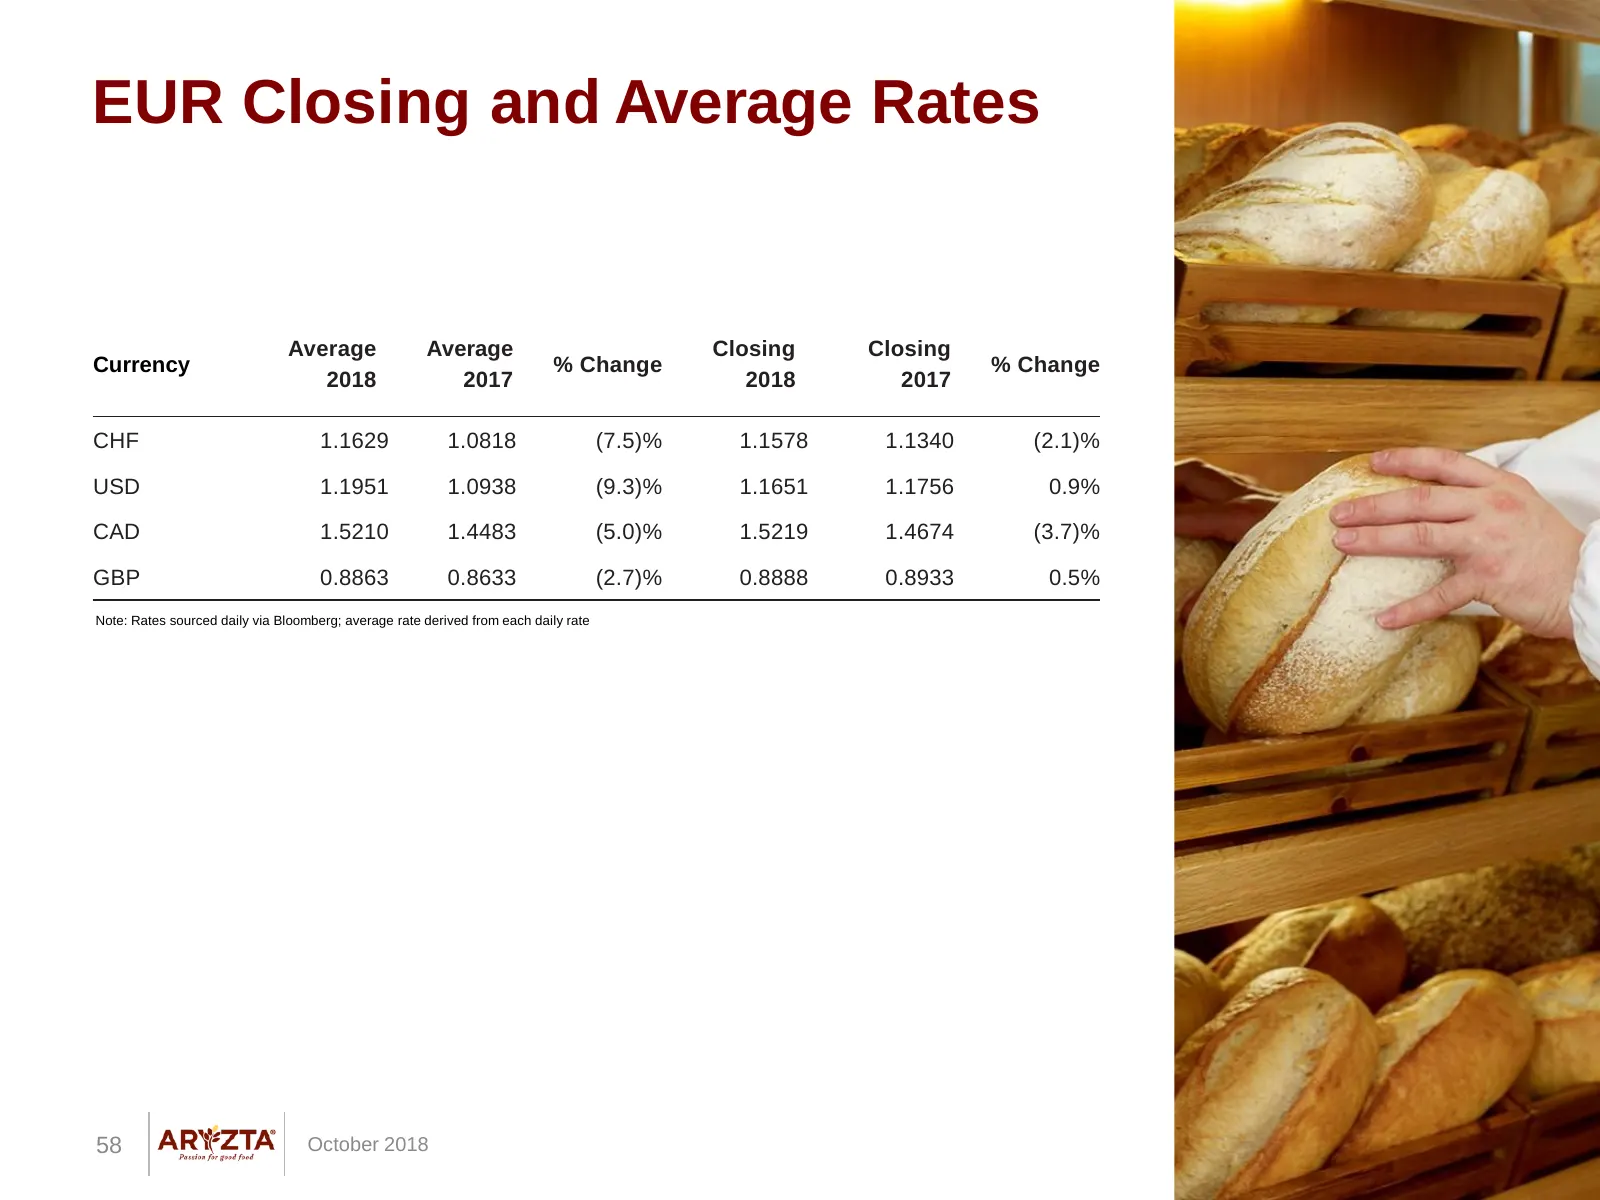
EUR Closing and Average Rates Average Average Closing Closing Currency % Change % Change 2018 2017 2018 2017 CHF 1.1629 1.0818 (7.5)% 1.1578 1.1340 (2.1)% USD 1.1951 1.0938 (9.3)% 1.1651 1.1756 0.9% CAD 1.5210 1.4483 (5.0)% 1.5219 1.4674 (3.7)% GBP 0.8863 0.8633 (2.7)% 0.8888 0.8933 0.5% Note: Rates
Slide 59: Presentation Glossary
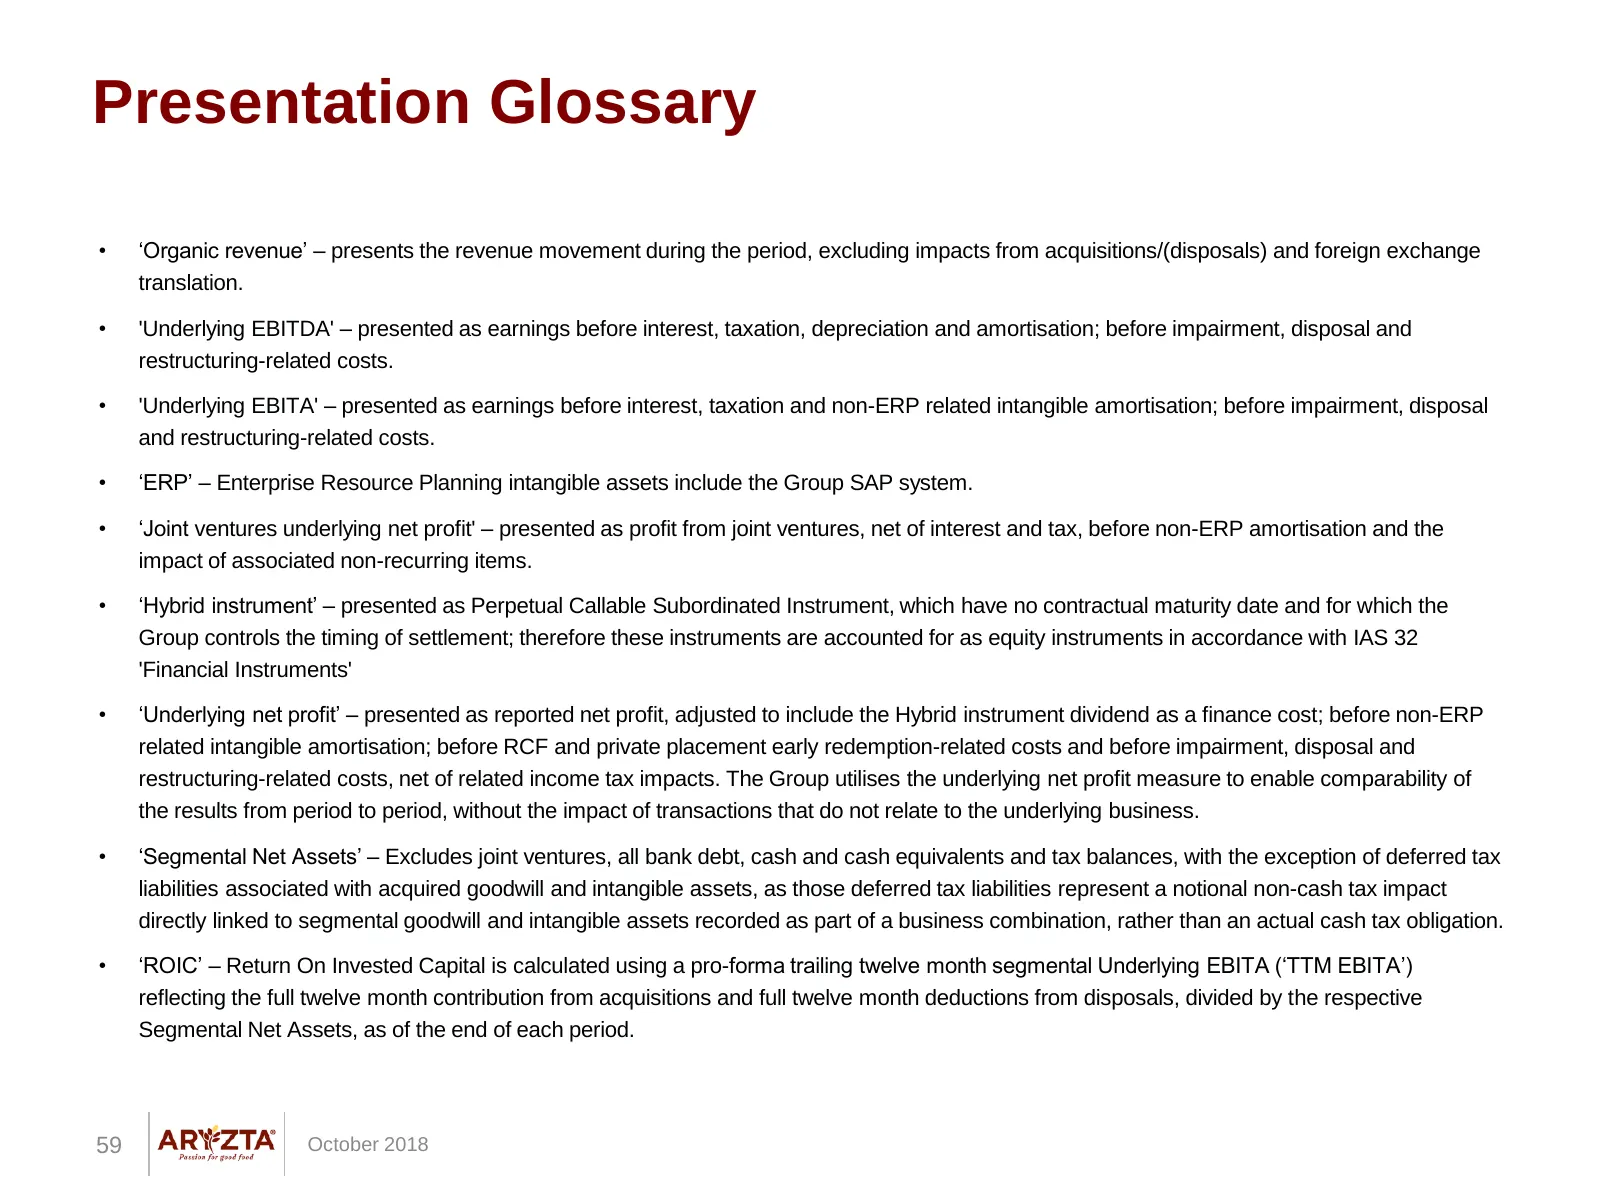
Presentation Glossary • ‘Organic revenue’ – presents the revenue movement during the period, excluding impacts from acquisitions/(disposals) and foreign exchange translation. • 'Underlying EBITDA' – presented as earnings before interest, taxation, depreciation and amortisation; before impairment, di
Source: Internet Archive copy of aryzta.com
More decks from Aryzta AG
 H1 2026 Earnings Presentation32 slides · Aug 10, 2026
 FY2025 Earnings Presentation7 slides · Jan 22, 2026
 Q3 2025 Earnings Presentation15 slides · Oct 20, 2025
 H1 2025 Earnings Presentation34 slides · Aug 11, 2025
 Investor Day (May 2025)48 slides · May 7, 2025
 Q1 2025 Earnings Presentation35 slides · Mar 2, 2025