Duke Realty — REIT Week: 2013 NAREIT Investor Forum
42 slides from Duke Realty's conference presentation, Jun 5, 2013
Slide 1: REIT WEEK: 2013 NAREIT Investor Forum
Exhibit 99.1 REIT WEEK: 2013 NAREIT Investor Forum June 5-6, 2013
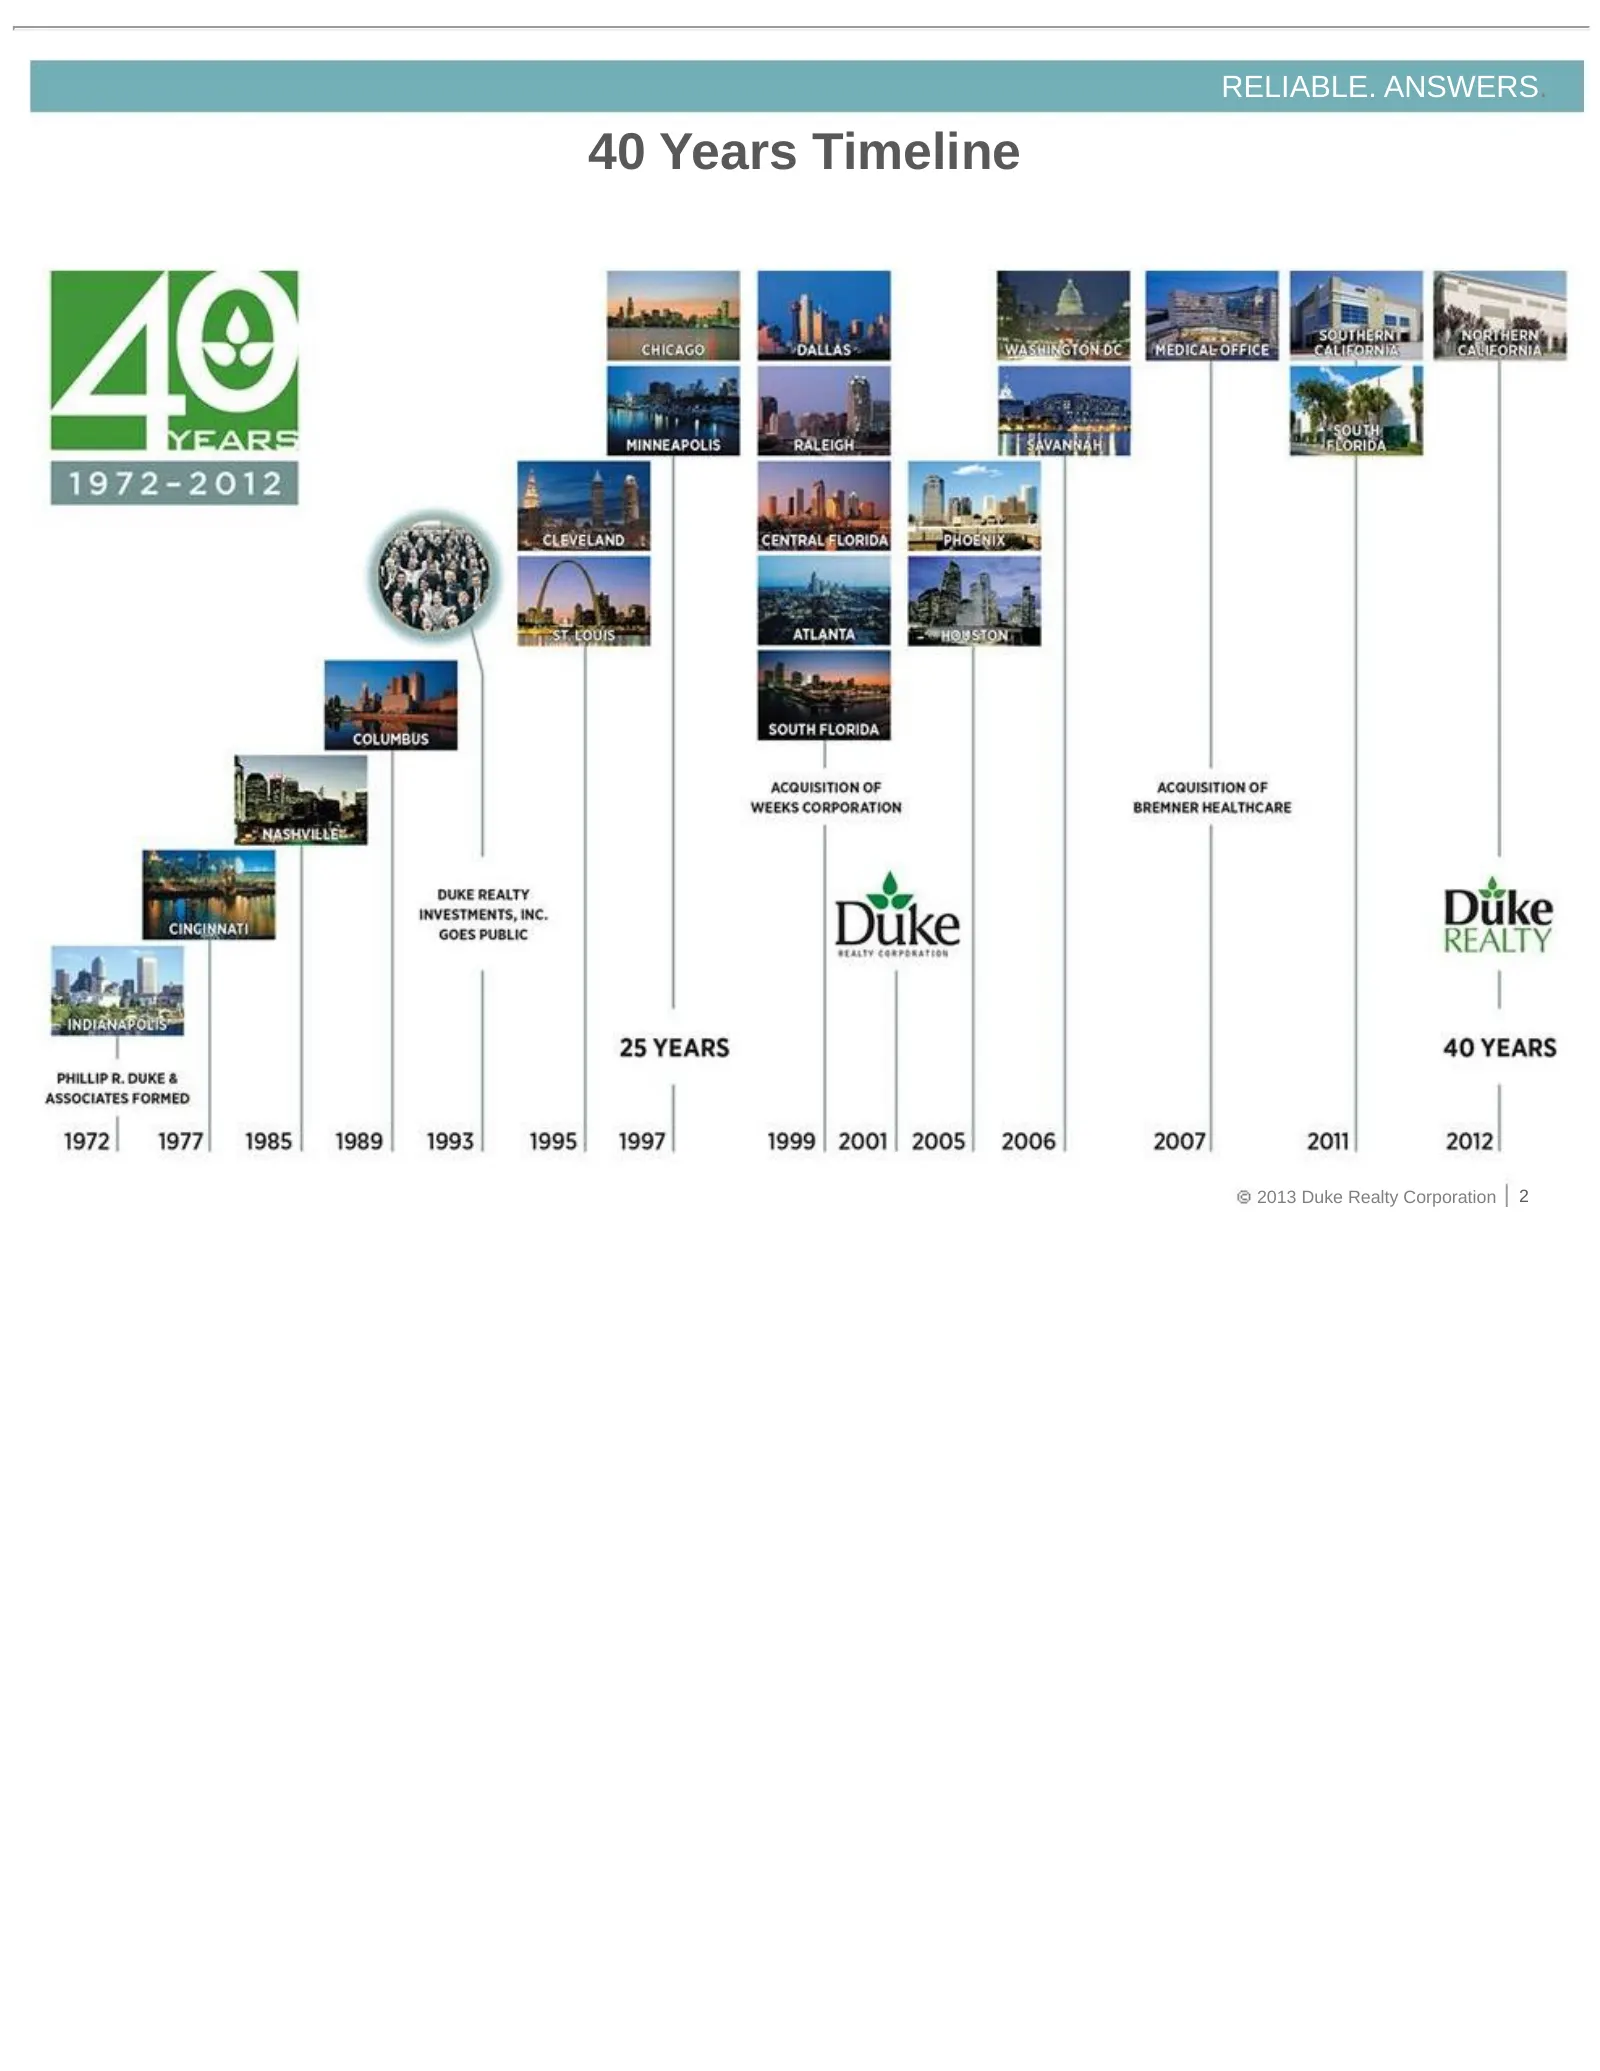
Slide 2: 40 Years Timeline
RELIABLE. ANSWERS. 40 Years Timeline 2013 Duke Realty Corporation 2
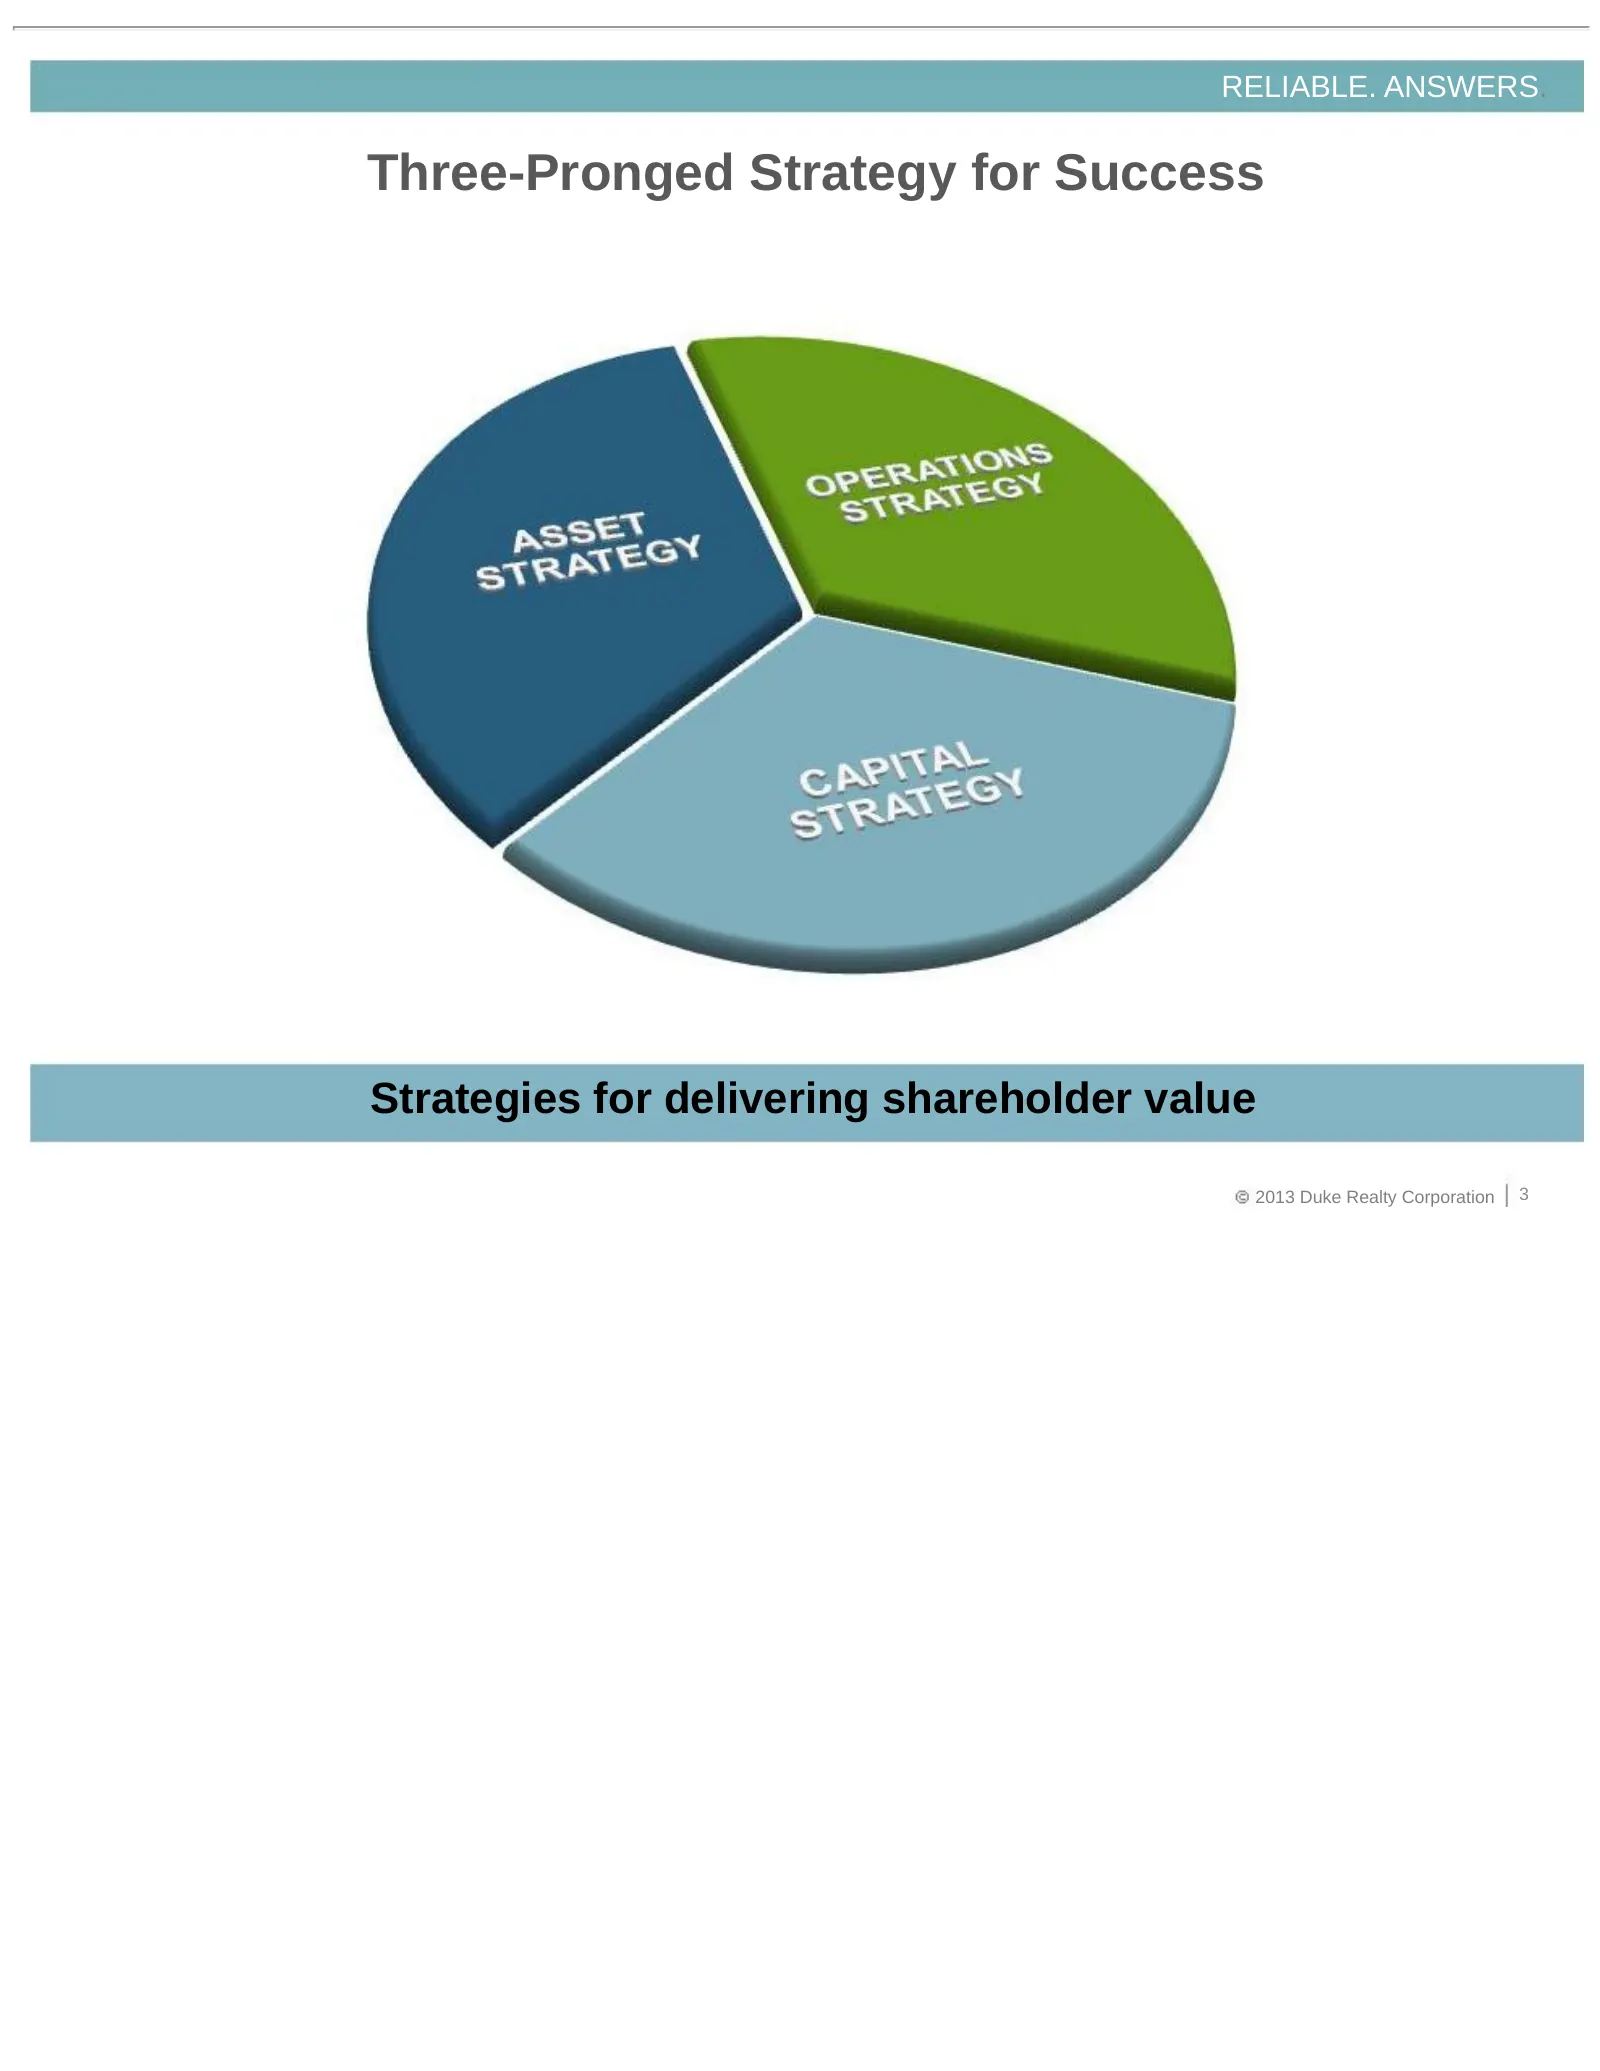
Slide 3: Three-Pronged Strategy for Success
RELIABLE. ANSWERS. Three-Pronged Strategy for Success Strategies for delivering shareholder value 2013 Duke Realty Corporation 3
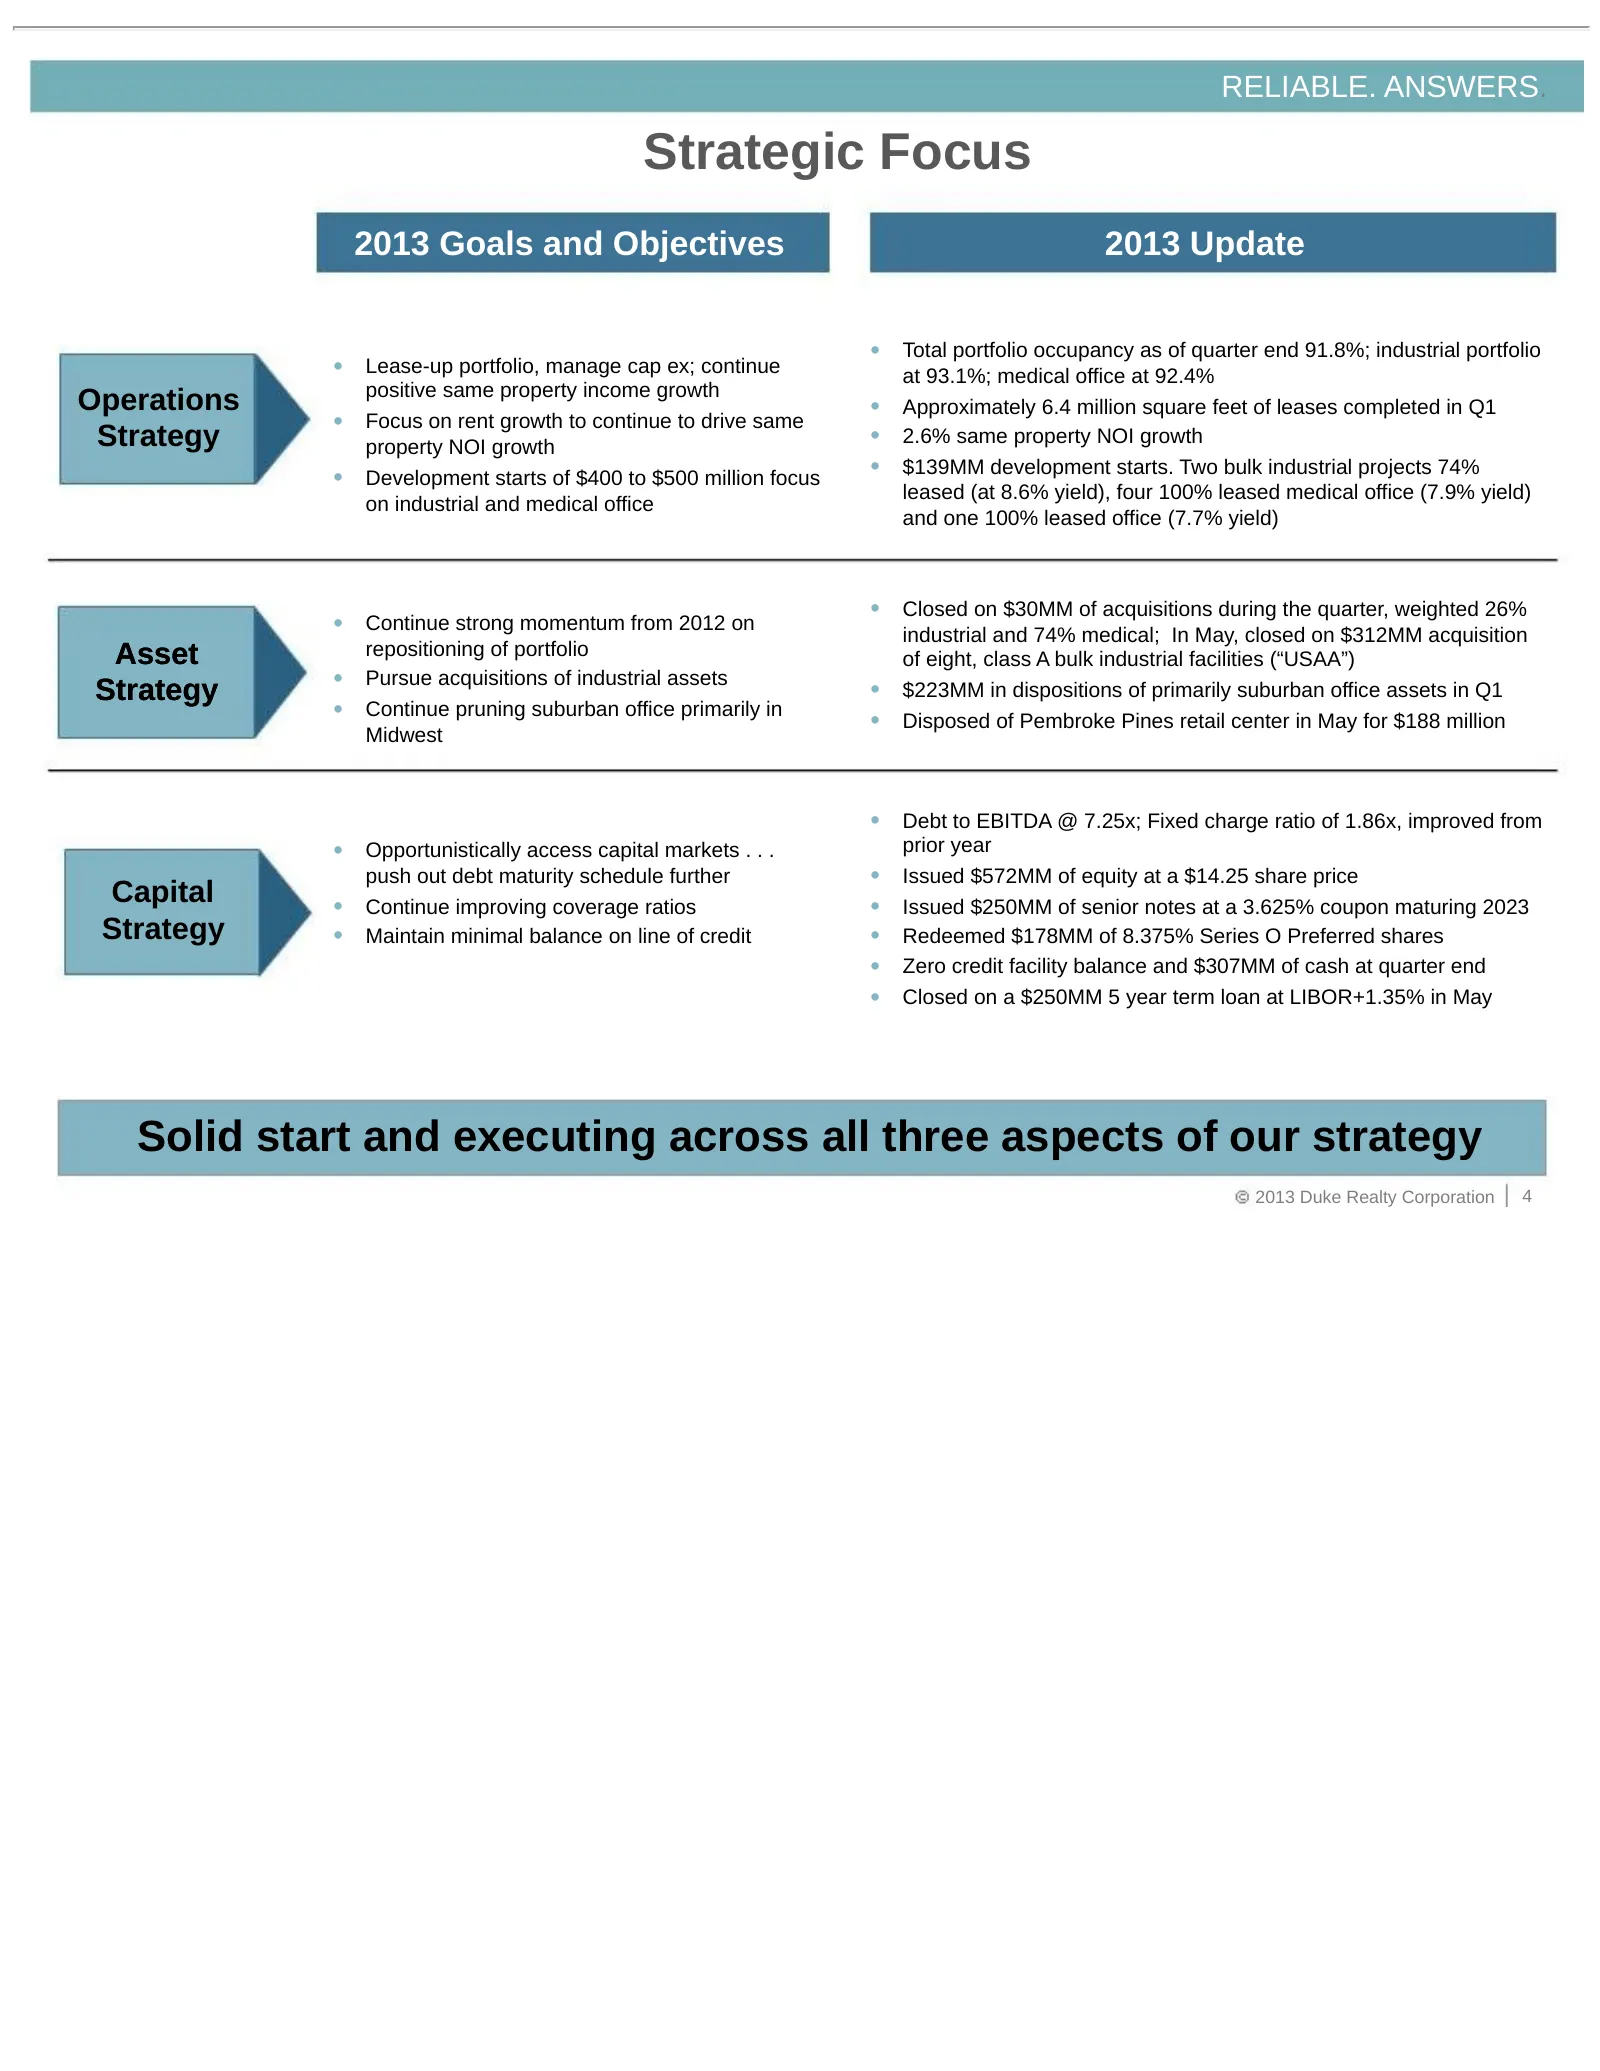
Slide 4: Strategic Focus
RELIABLE. ANSWERS. Strategic Focus 2013 Goals and Objectives 2013 Update • Total portfolio occupancy as of quarter end 91.8%; industrial portfolio • Lease-up portfolio, manage cap ex; continue at 93.1%; medical office at 92.4% positive same property income growth Operations • Approximately 6.4 milli

Slide 5: Operations Strategy
OPERATIONS STRATEGY 2013 Duke Realty Corporation 5
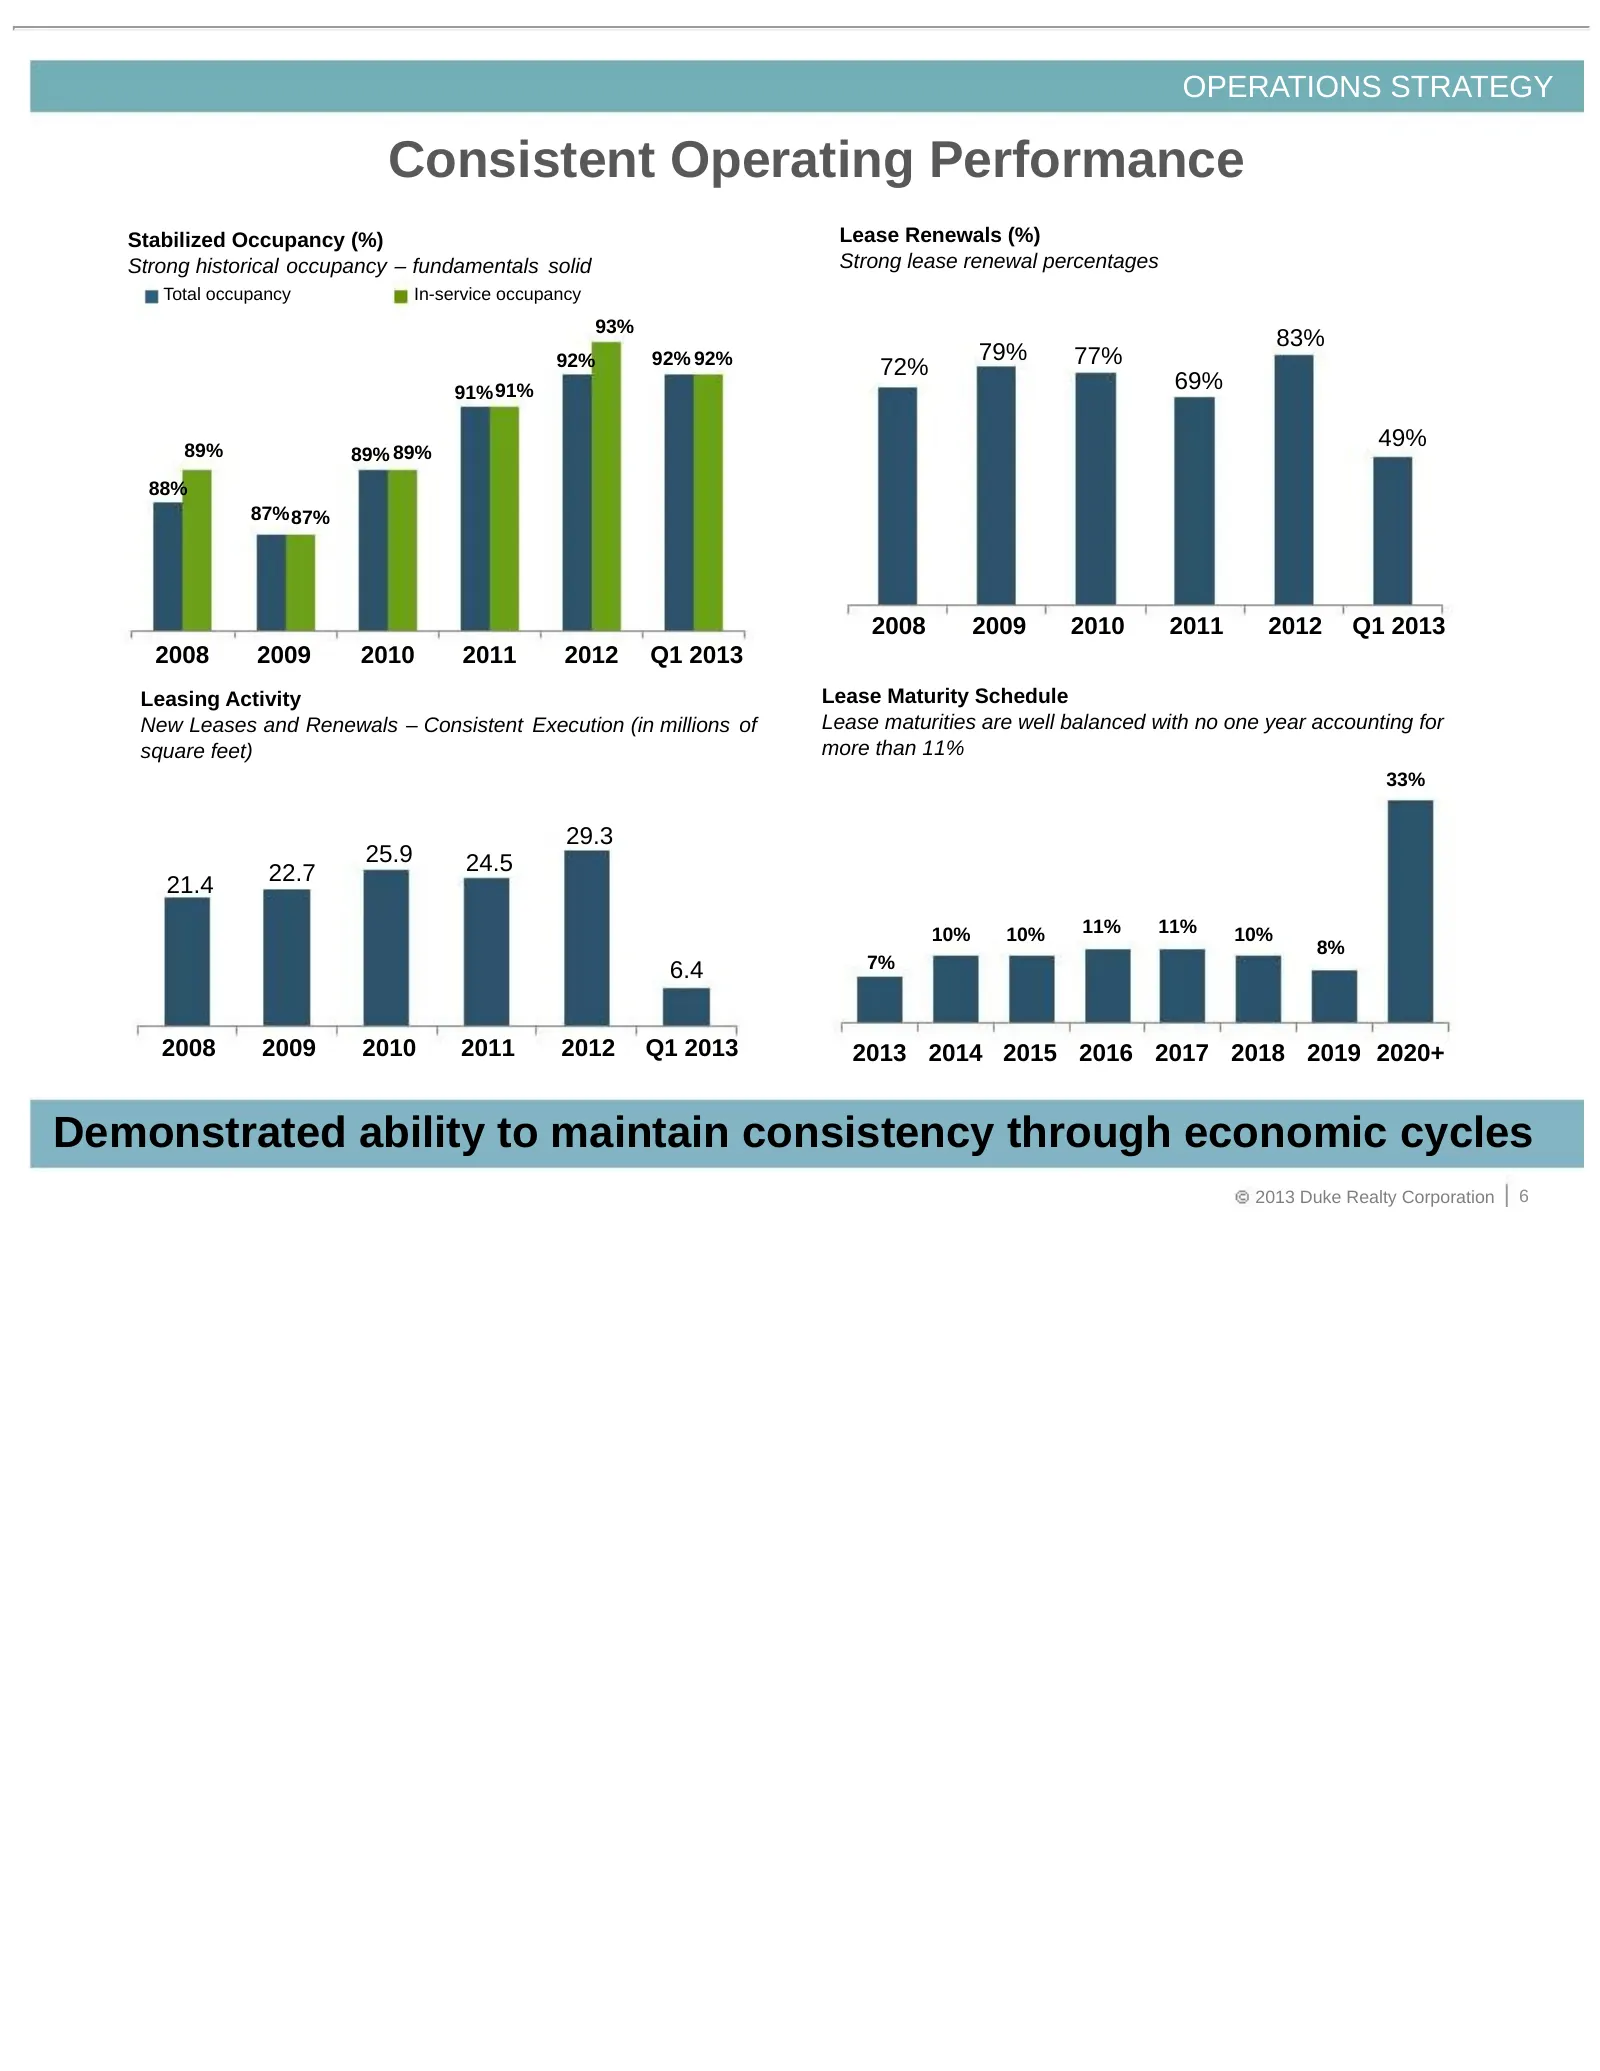
Slide 6: Consistent Operating Performance
OPERATIONS STRATEGY Consistent Operating Performance Stabilized Occupancy (%) Lease Renewals (%) Strong historical occupancy – fundamentals solid Strong lease renewal percentages Total occupancy In-service occupancy 93% 83% 92% 92% 92% 79% 77% 72% 91% 91% 69% 89% 49% 89% 89% 88% 87% 87% 2008 2009 20
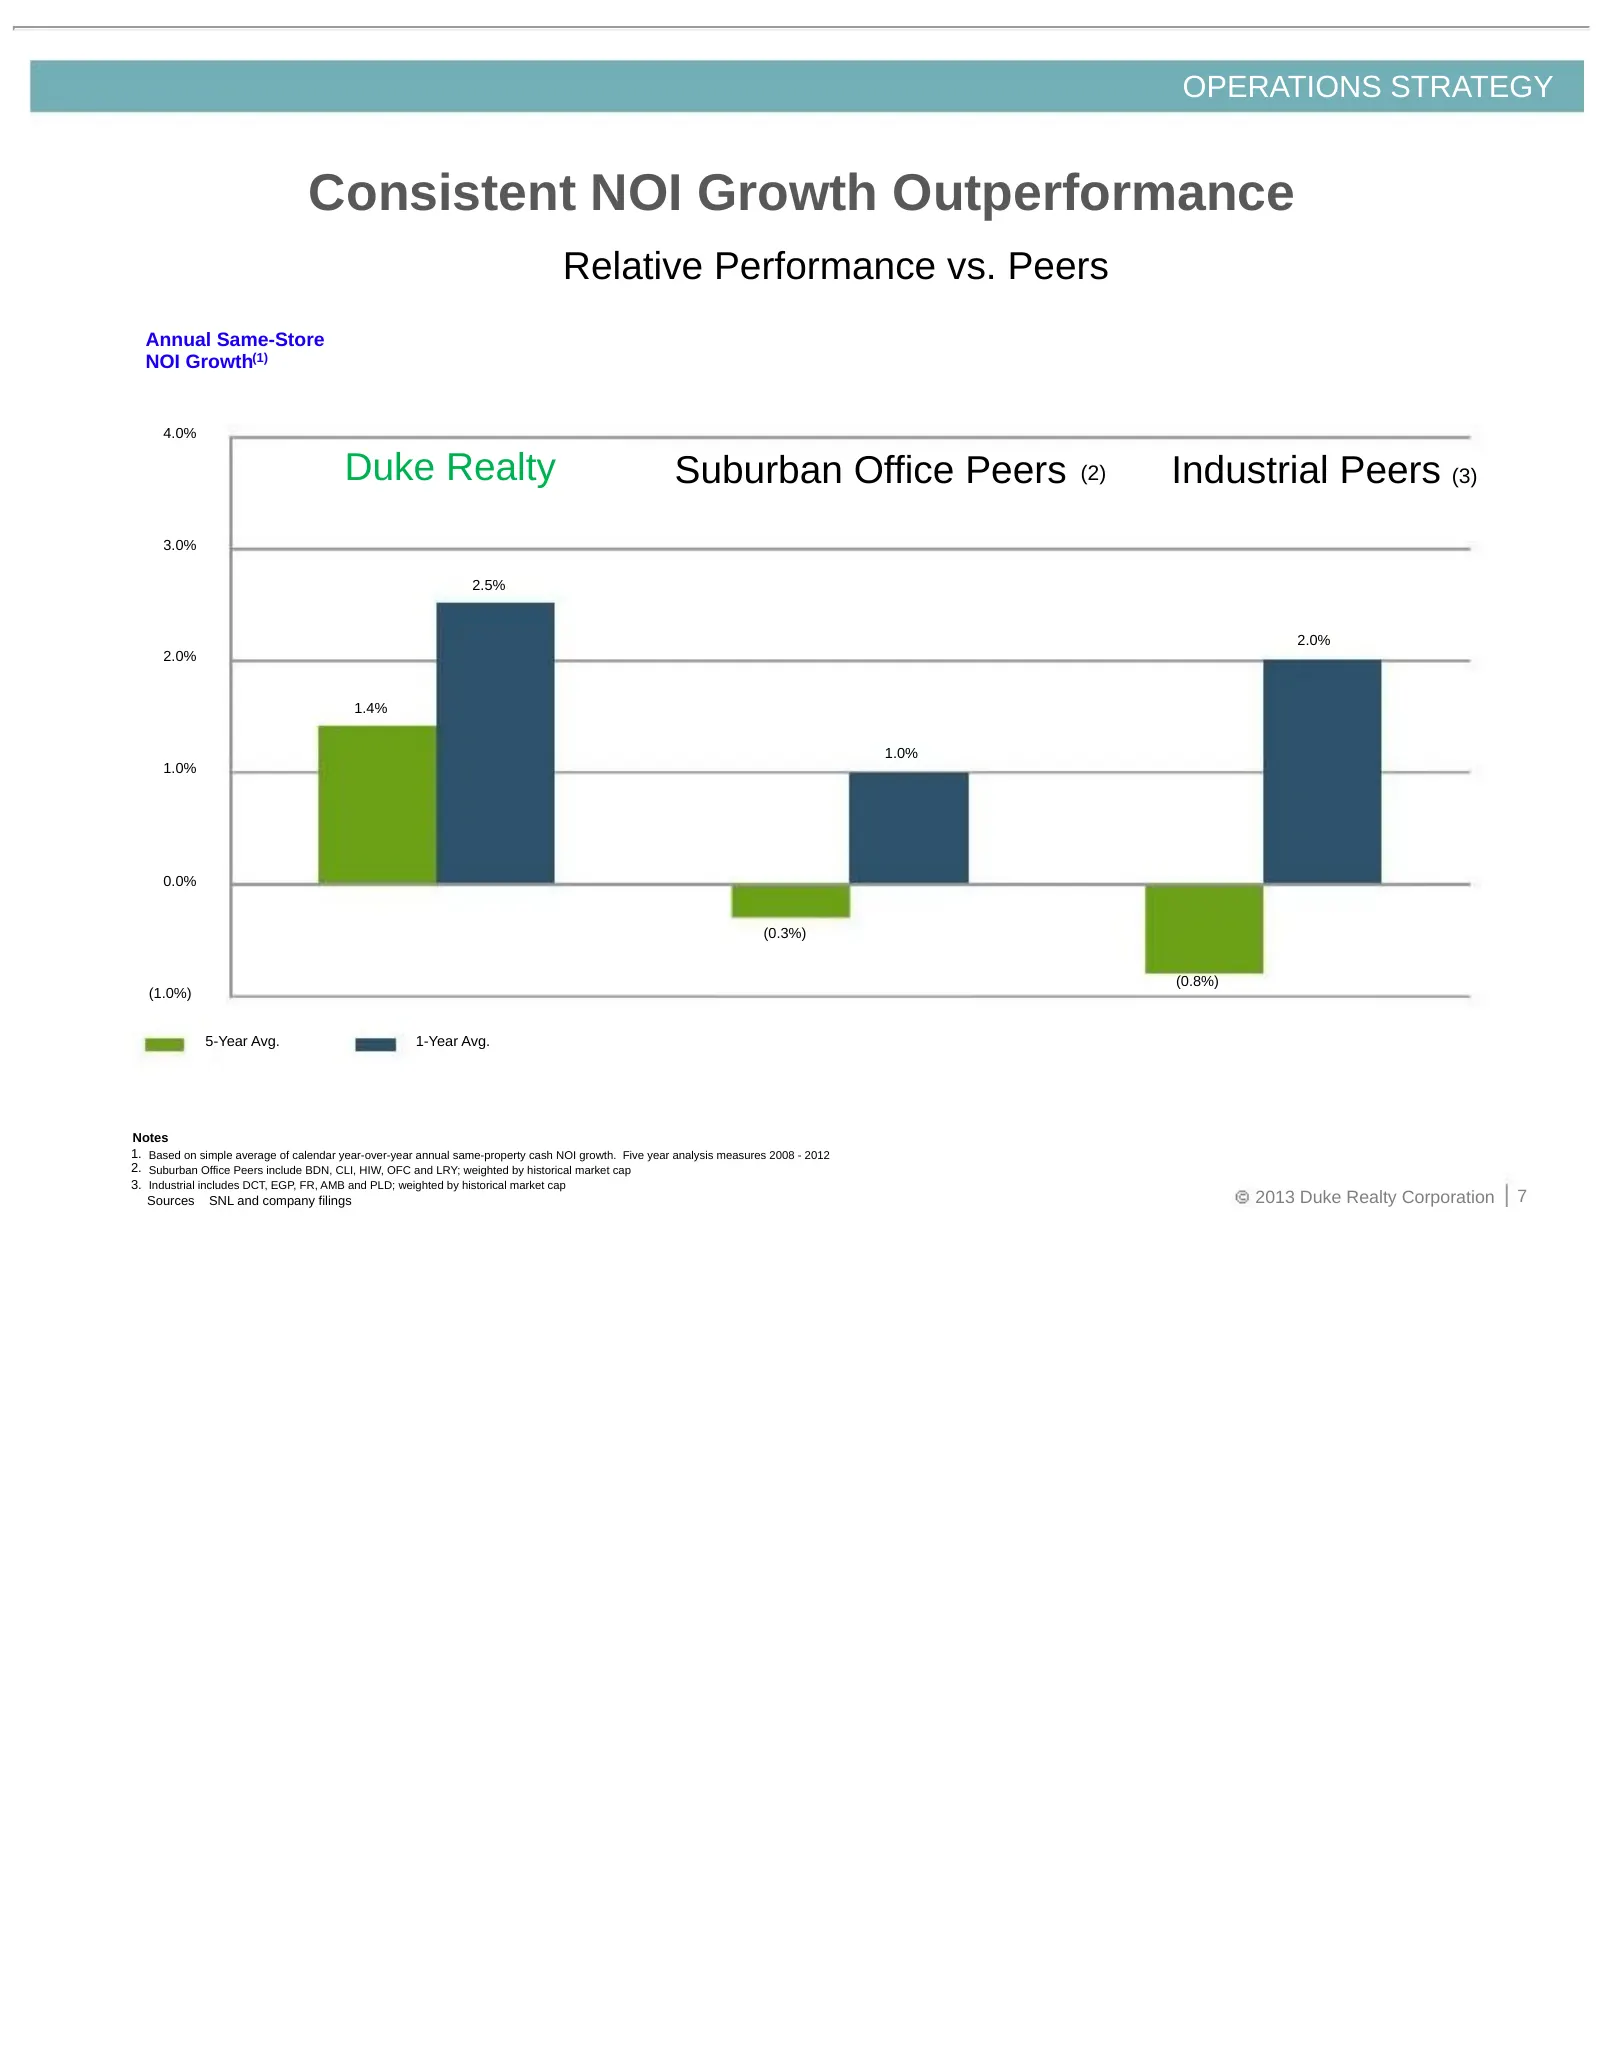
Slide 7: Consistent NOI Growth Outperformance
OPERATIONS STRATEGY Consistent NOI Growth Outperformance Relative Performance vs. Peers Annual Same-Store NOI Growth(1) 4.0% Duke Realty Suburban Office Peers (2) Industrial Peers (3) 3.0% 2.5% 2.0% 2.0% 1.4% 1.0% 1.0% 0.0% (0.3%) (0.8%) (1.0%) 5-Year Avg. 1-Year Avg. Notes 1. Based on simple averag
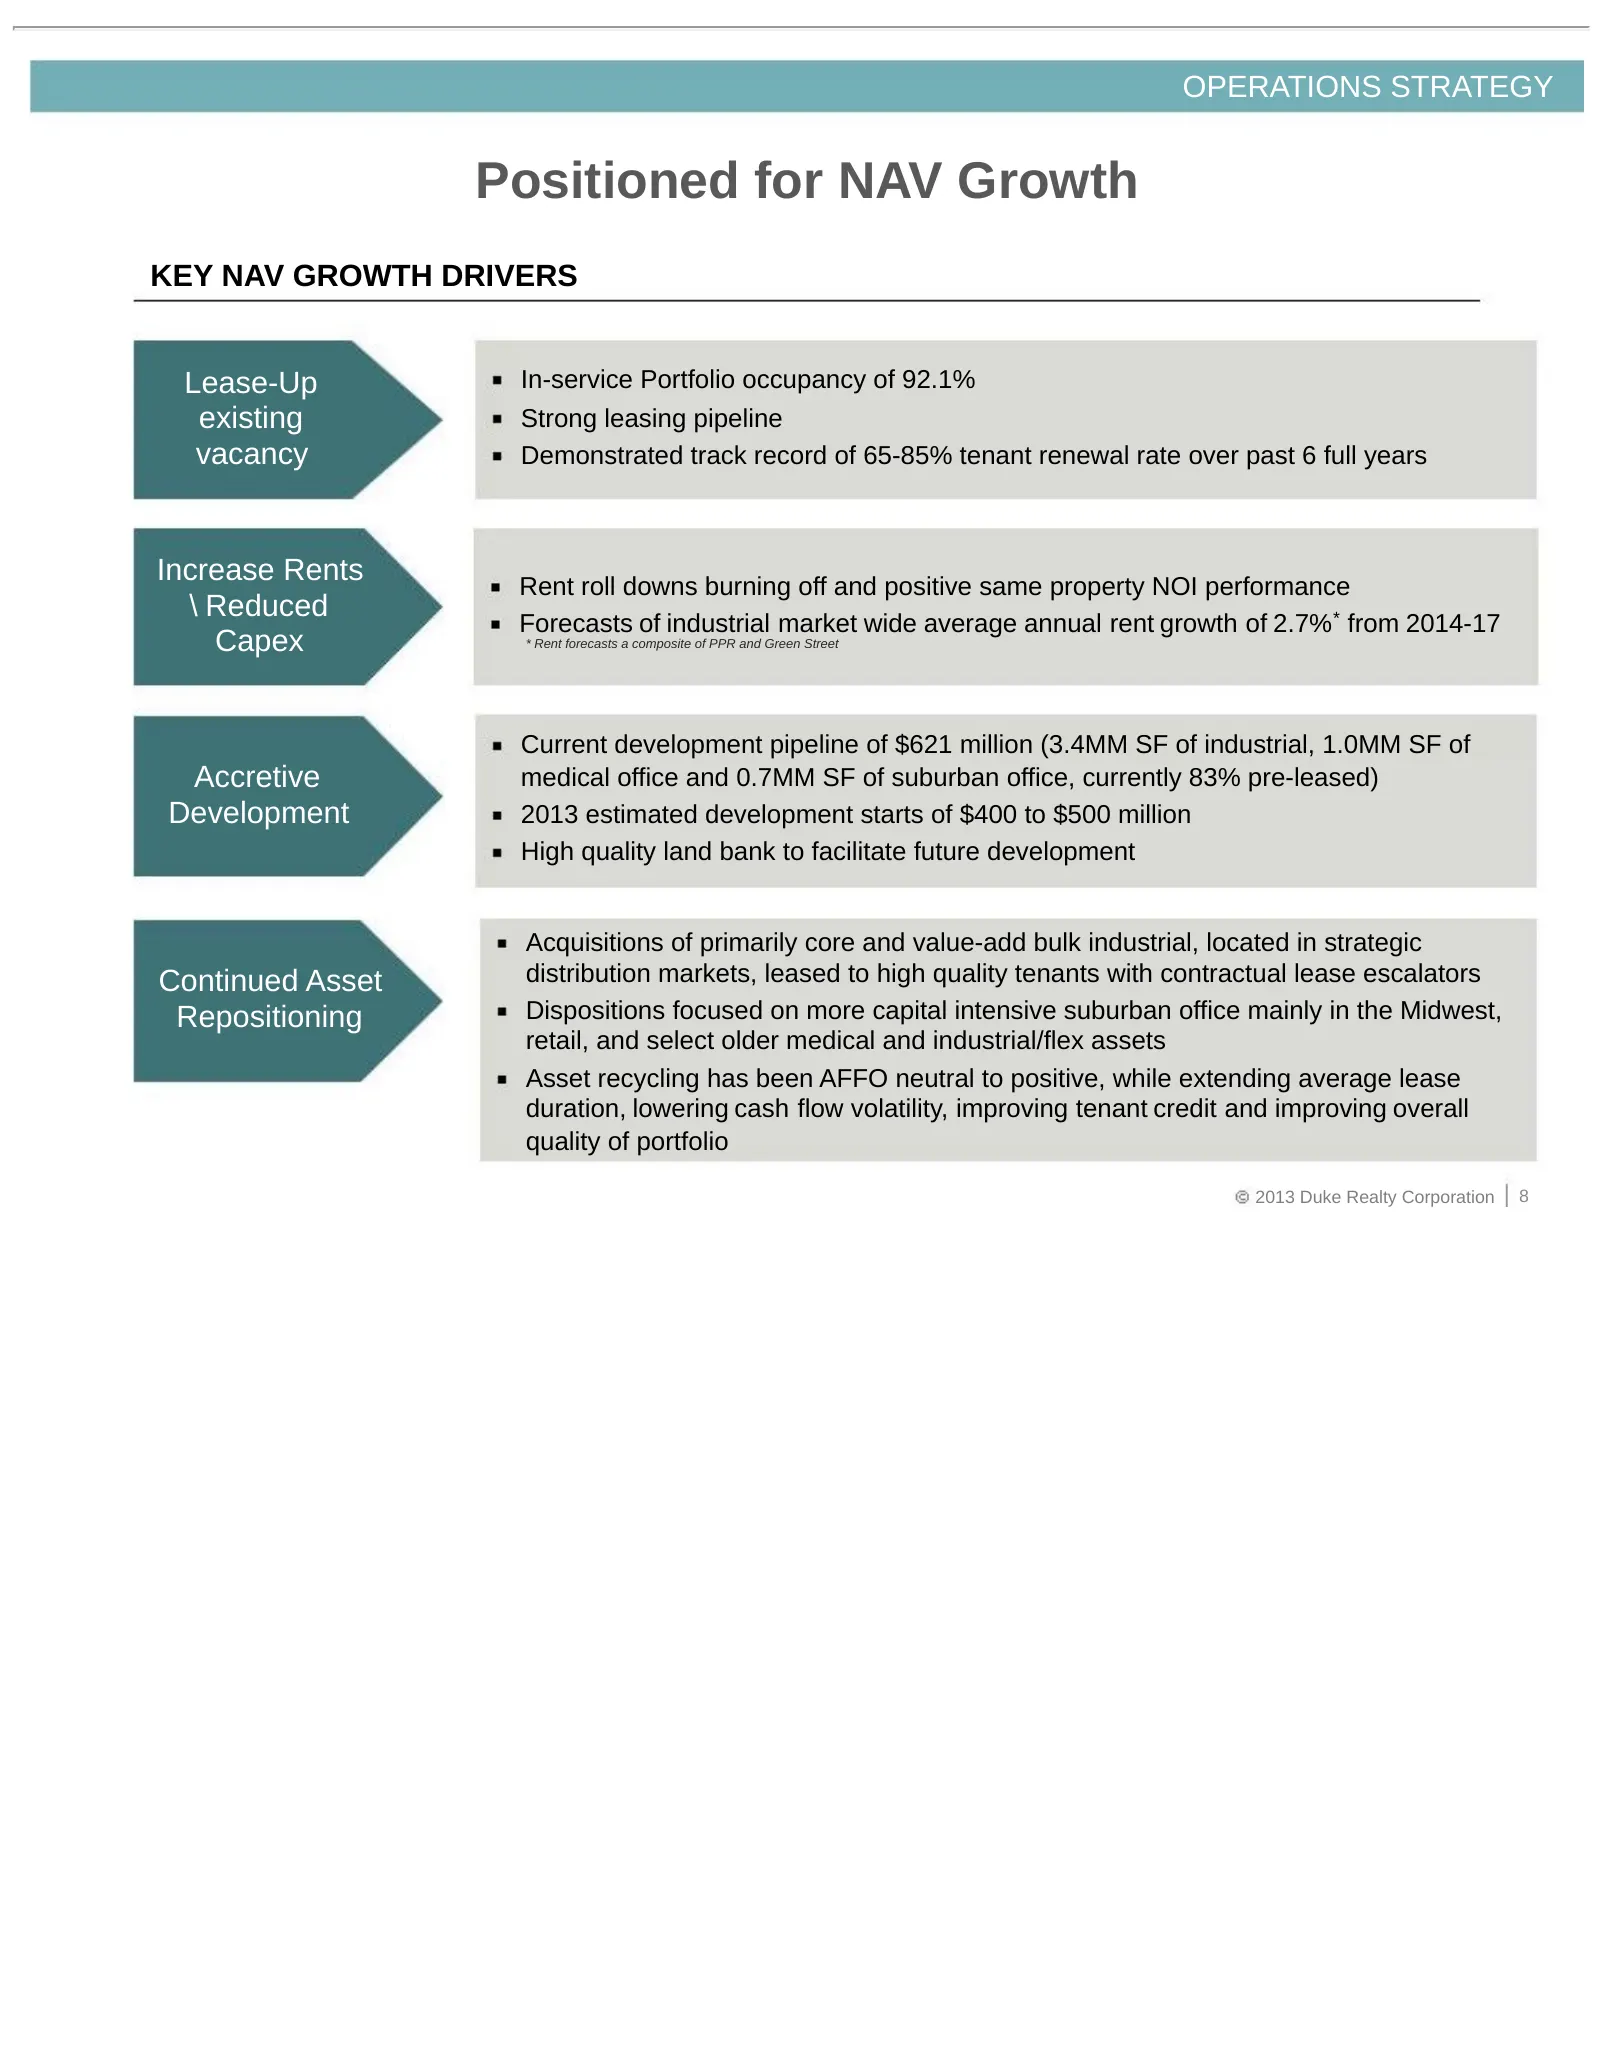
Slide 8: Positioned for NAV Growth
OPERATIONS STRATEGY Positioned for NAV Growth KEY NAV GROWTH DRIVERS Lease-Up In-service Portfolio occupancy of 92.1% existing Strong leasing pipeline vacancy Demonstrated track record of 65-85% tenant renewal rate over past 6 full years Increase Rents Rent roll downs burning off and positive same p
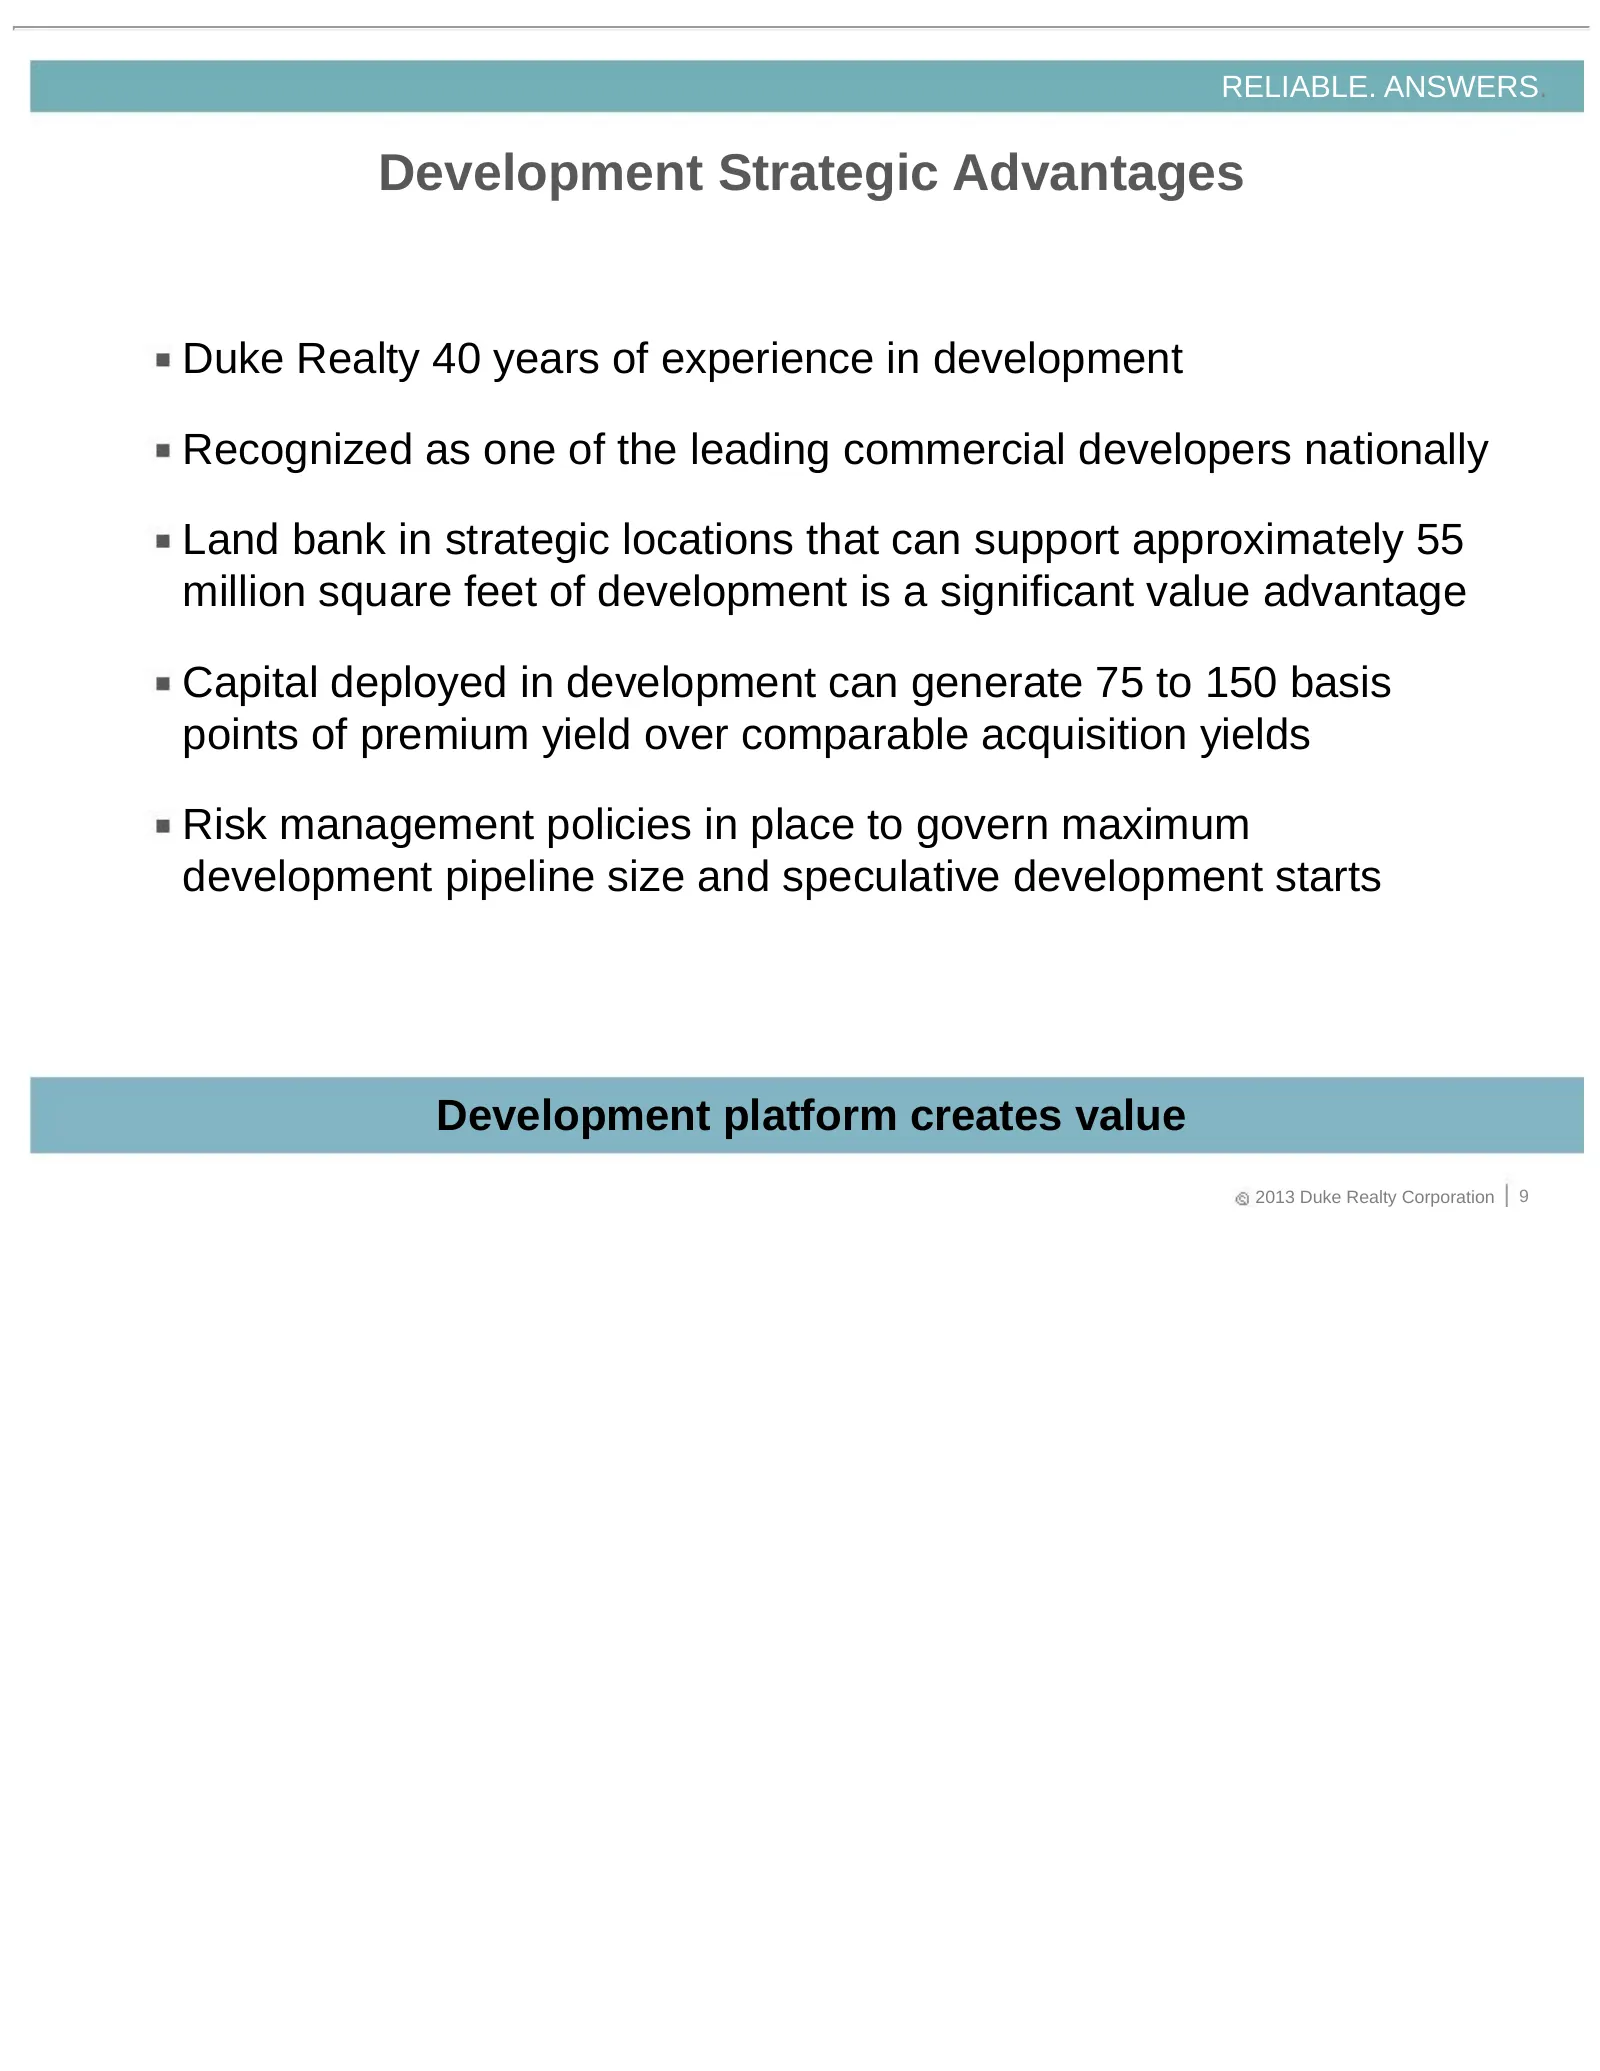
Slide 9: Development Strategic Advantages
RELIABLE. ANSWERS. Development Strategic Advantages Duke Realty 40 years of experience in development Recognized as one of the leading commercial developers nationally Land bank in strategic locations that can support approximately 55 million square feet of development is a significant value advanta
Slide 10: Land and Development Capabilities
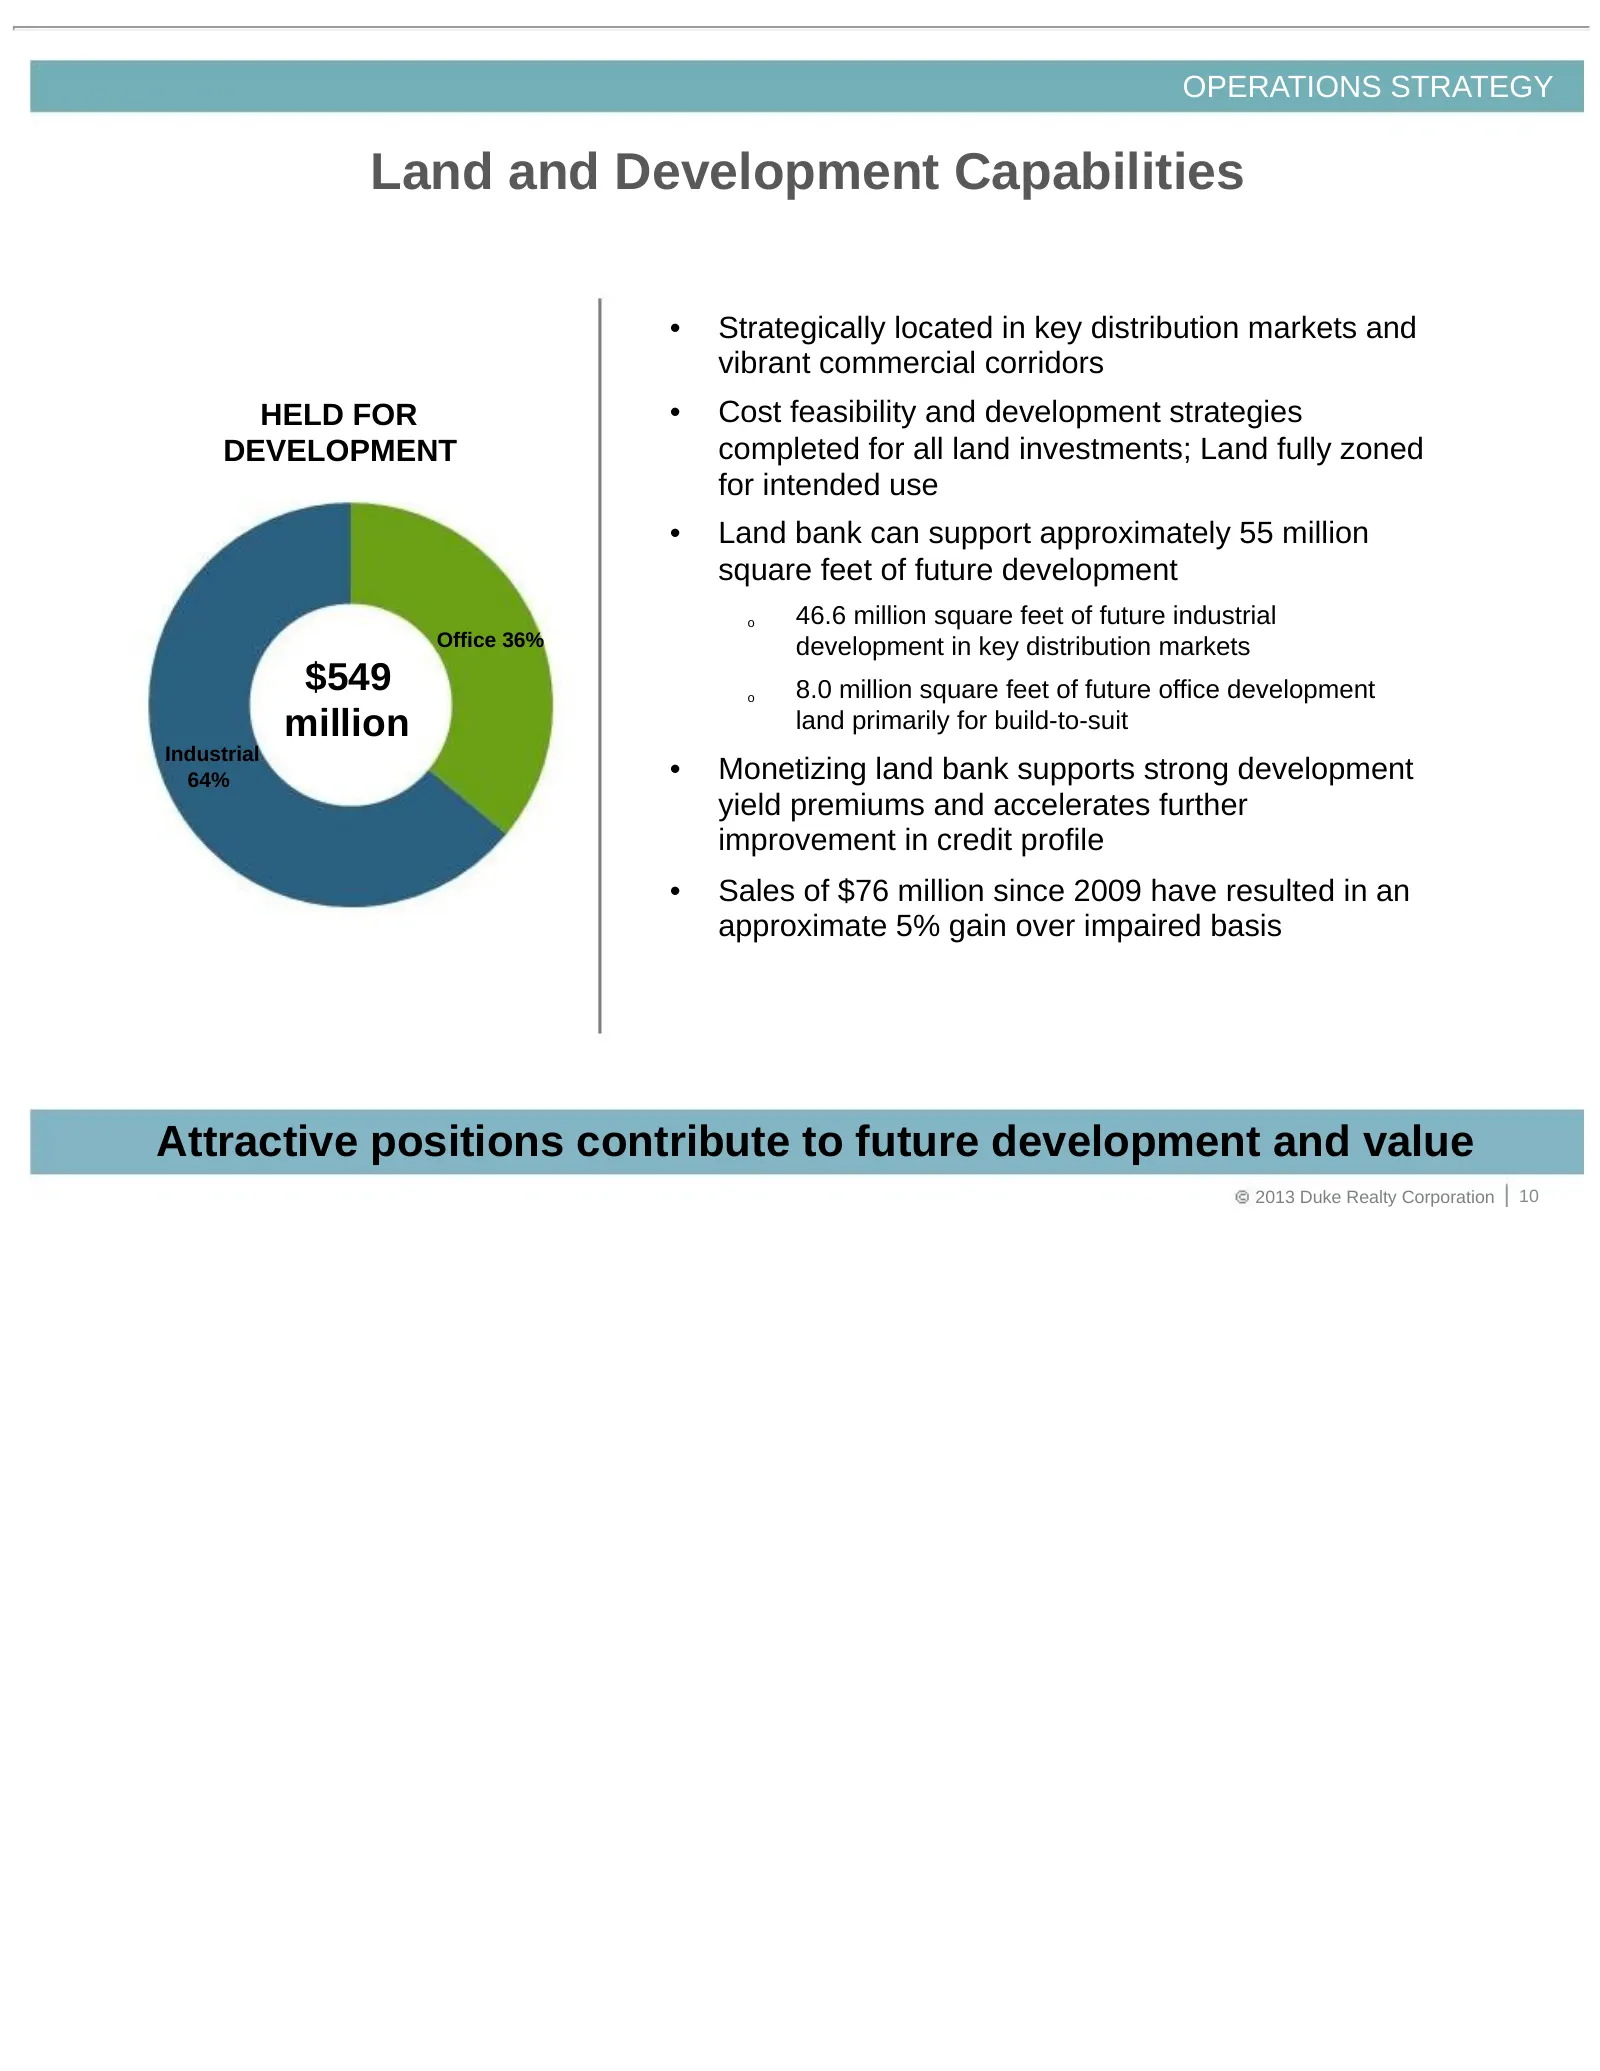
OPERATIONS STRATEGY Land and Development Capabilities • Strategically located in key distribution markets and vibrant commercial corridors HELD FOR • Cost feasibility and development strategies DEVELOPMENT completed for all land investments; Land fully zoned for intended use • Land bank can support
Slide 11: Historical Development Starts
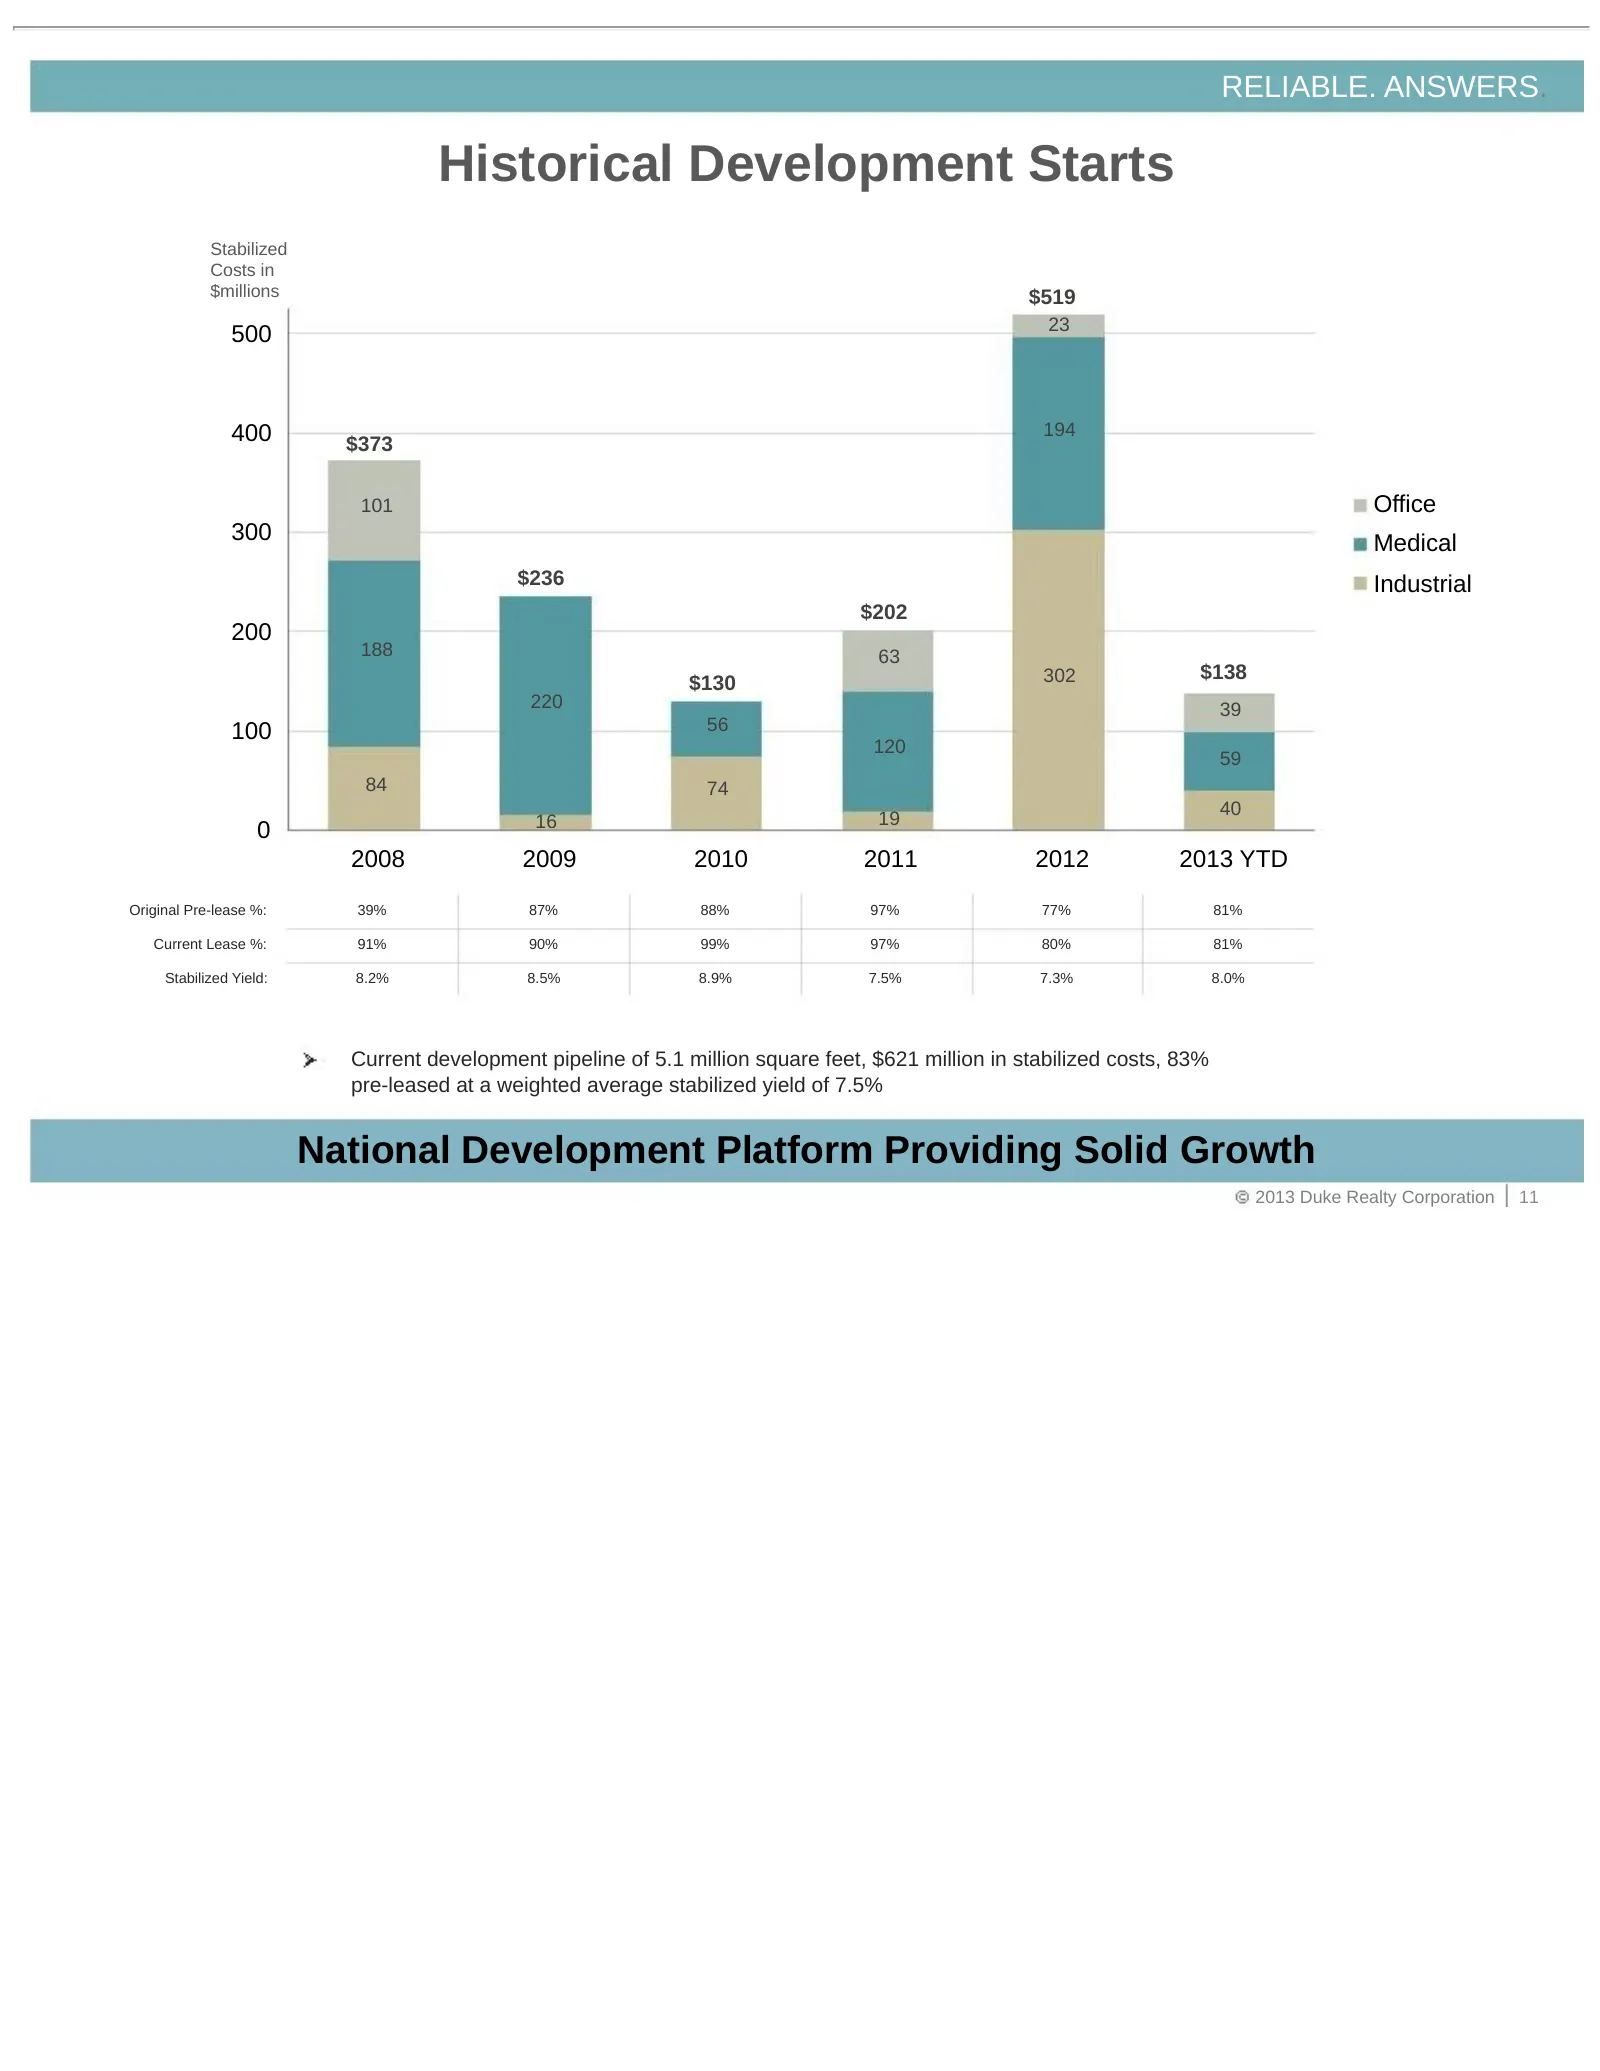
RELIABLE. ANSWERS. Historical Development Starts Stabilized Costs in $millions $519 23 500 400 194 $373 101 Office 300 Medical $236 Industrial $202 200 188 63 302 $138 $130 220 39 100 56 120 59 84 74 19 40 0 16 2008 2009 2010 2011 2012 2013 YTD Original Pre-lease %: 39% 87% 88% 97% 77% 81% Current L
Slide 12: Select 2012 Industrial Development Starts
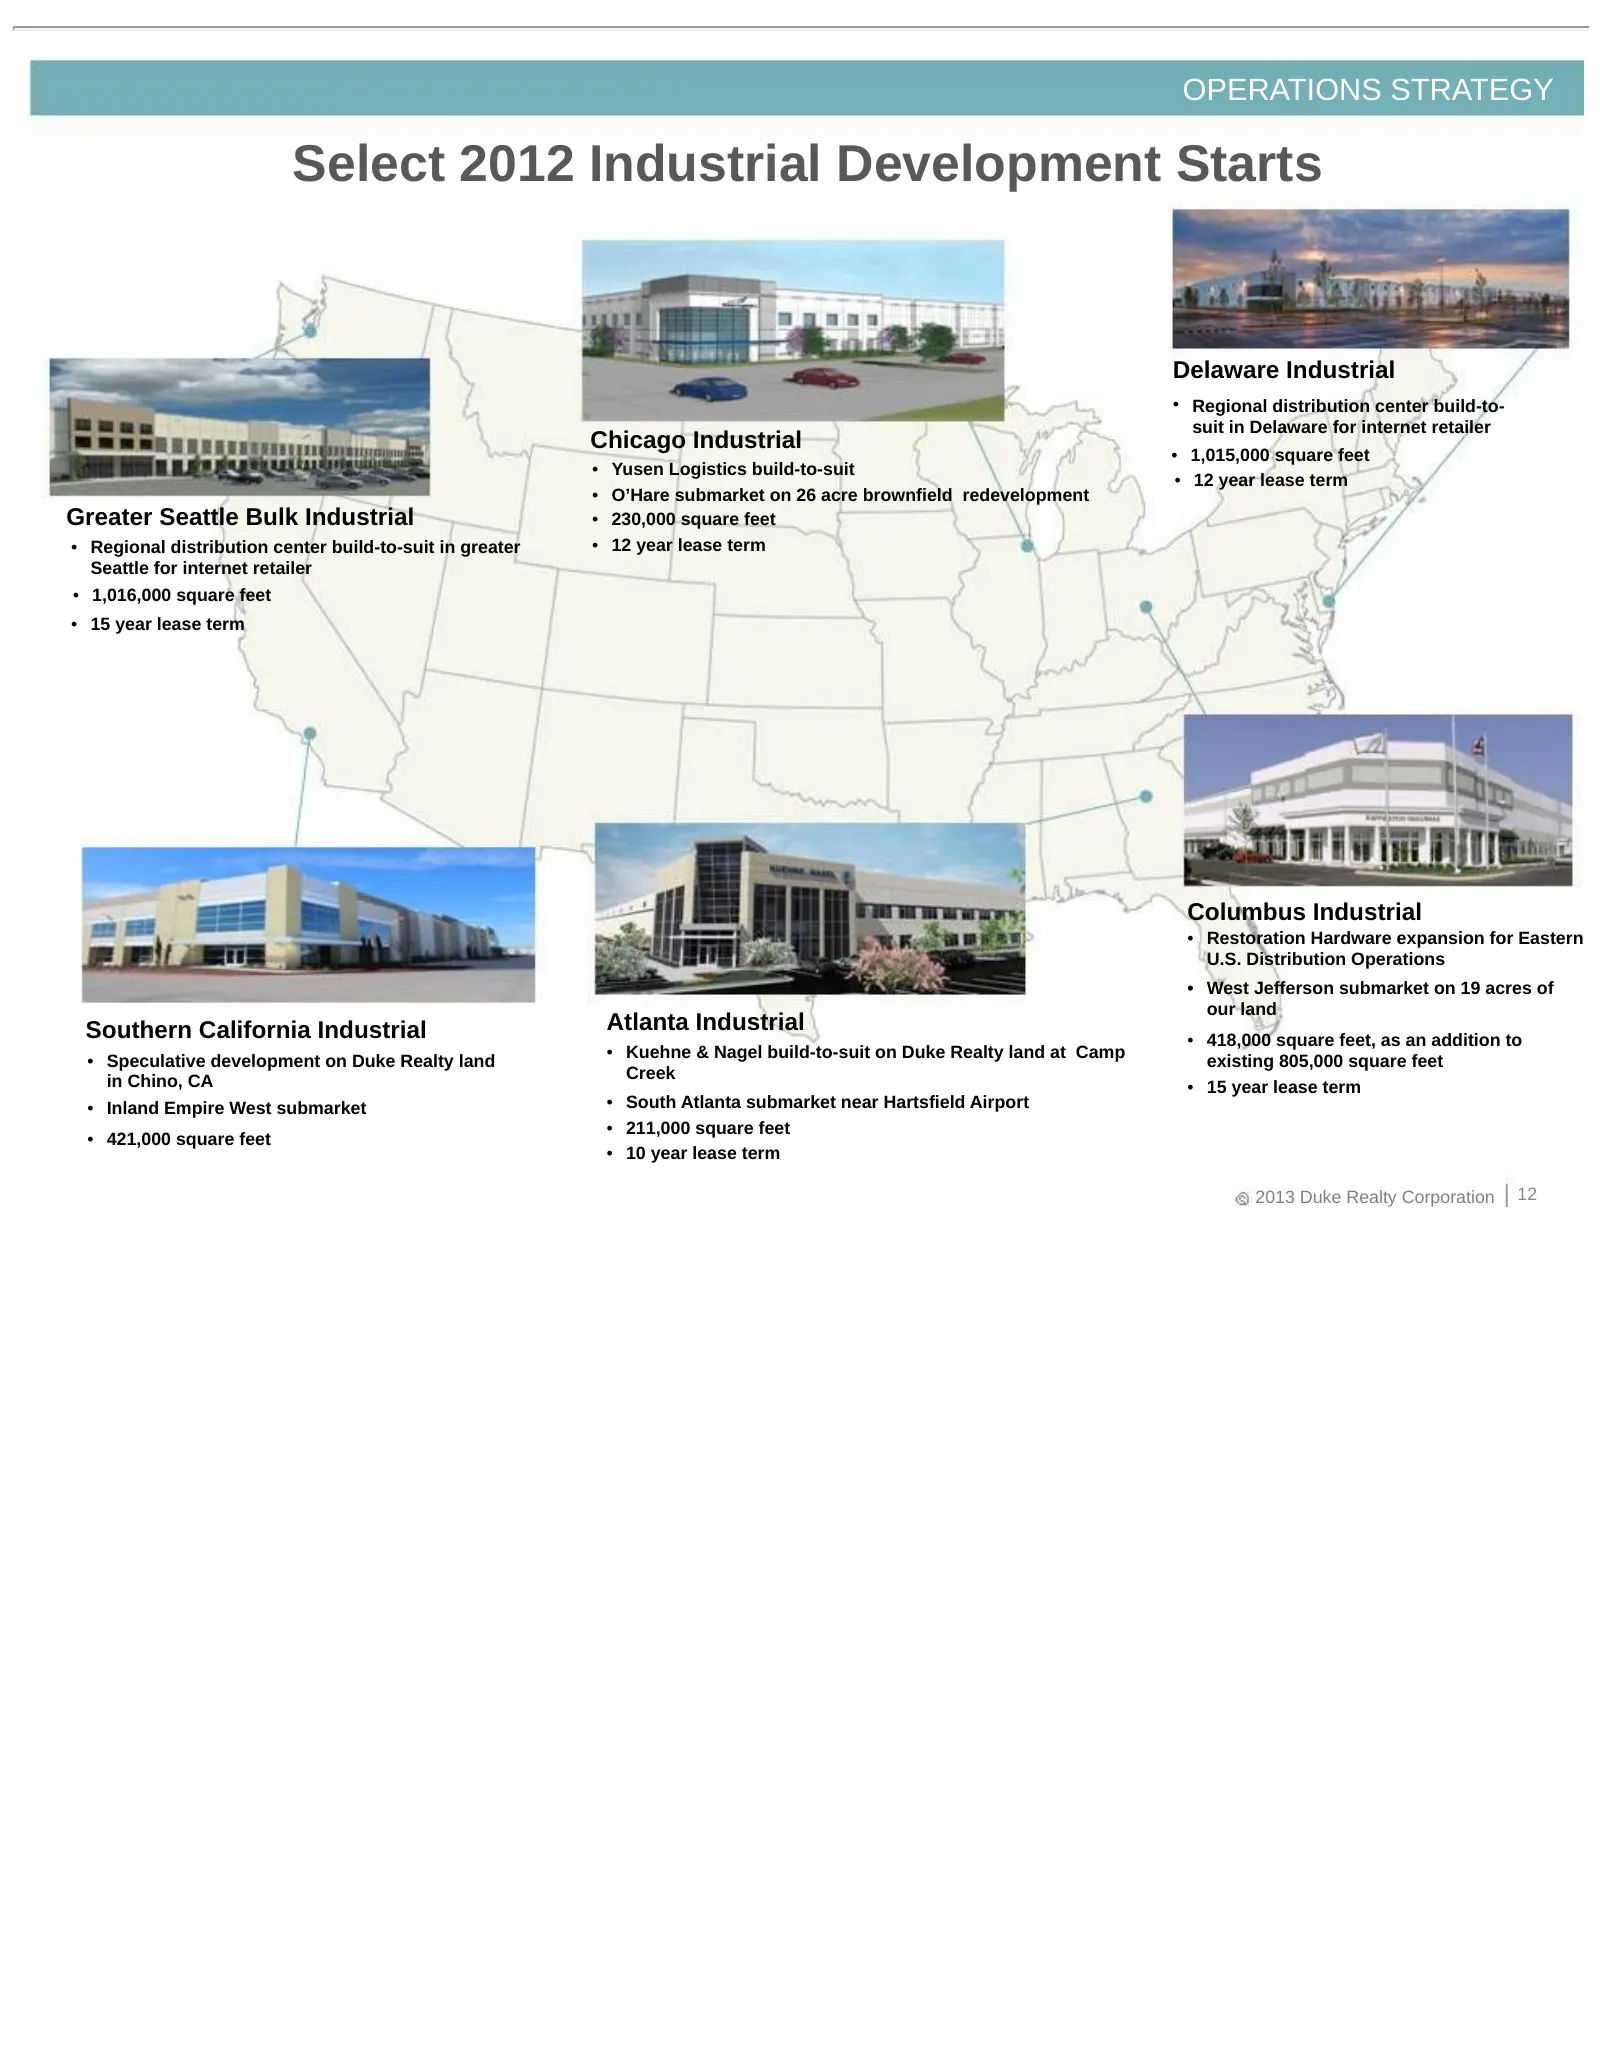
OPERATIONS STRATEGY Select 2012 Industrial Development Starts Delaware Industrial • Regional distribution center build-to- suit in Delaware for internet retailer Chicago Industrial • 1,015,000 square feet • Yusen Logistics build-to-suit • 12 year lease term • O’Hare submarket on 26 acre brownfield r
Slide 13: 2013 YTD Development Starts
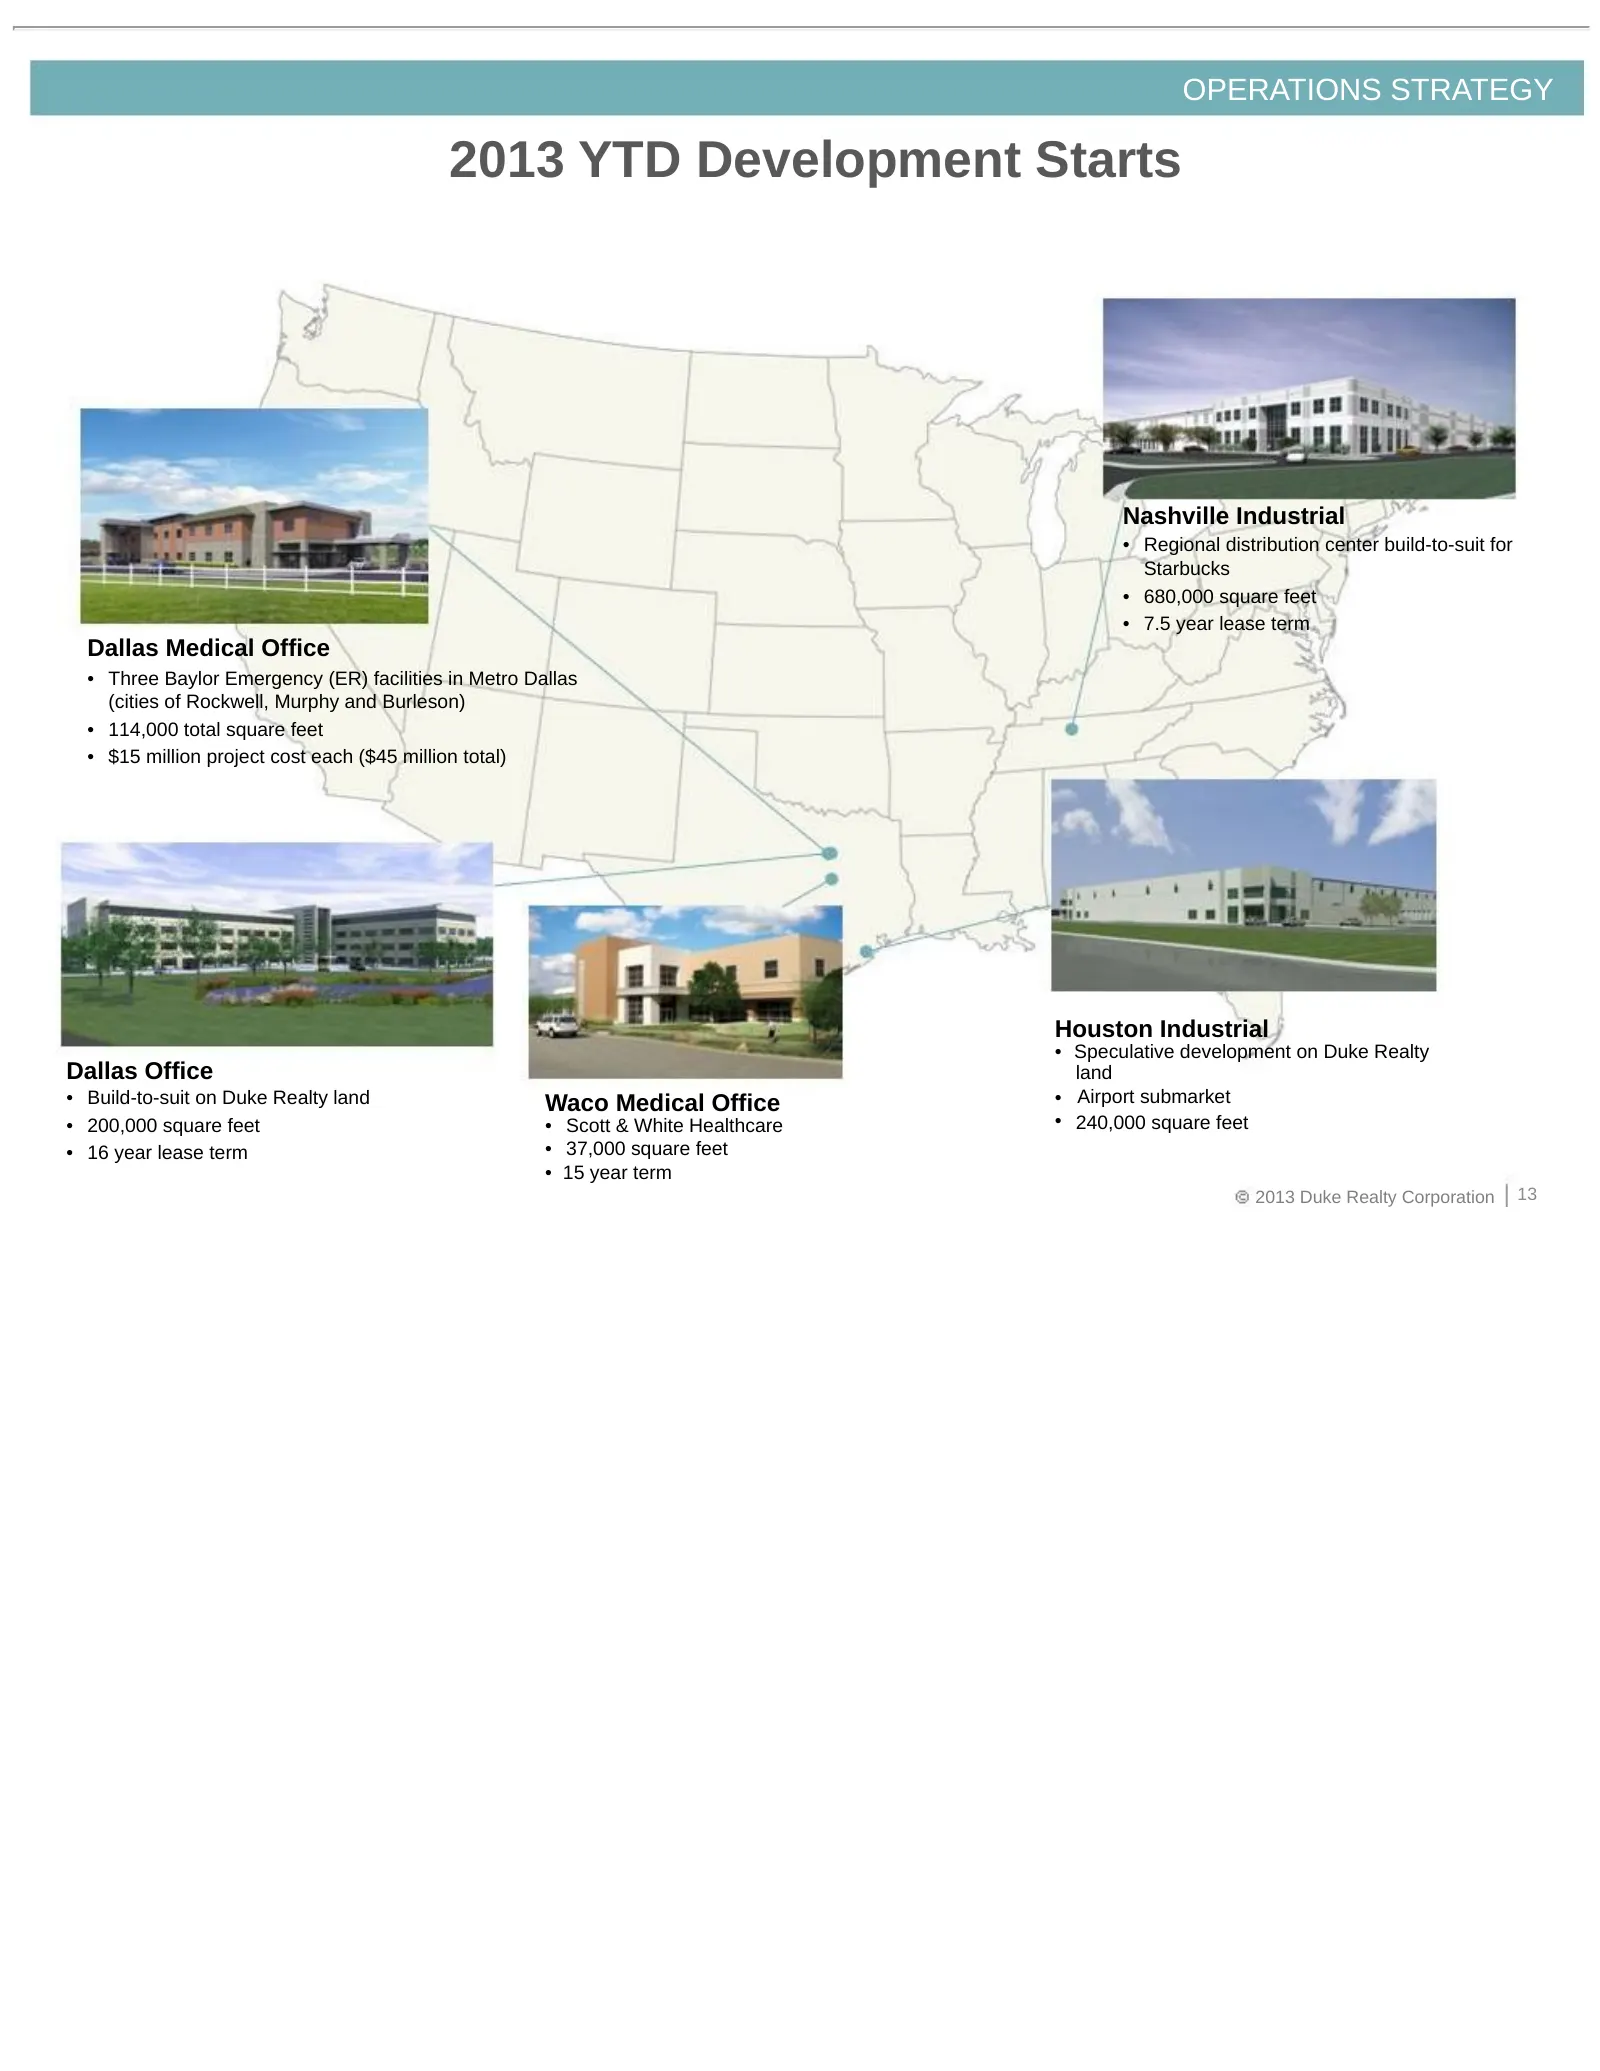
OPERATIONS STRATEGY 2013 YTD Development Starts Nashville Industrial • Regional distribution center build-to-suit for Starbucks • 680,000 square feet • 7.5 year lease term Dallas Medical Office • Three Baylor Emergency (ER) facilities in Metro Dallas (cities of Rockwell, Murphy and Burleson) • 114,0
Slide 14: Asset Strategy
ASSET STRATEGY 2013 Duke Realty Corporation 14
Slide 15: Asset Strategy
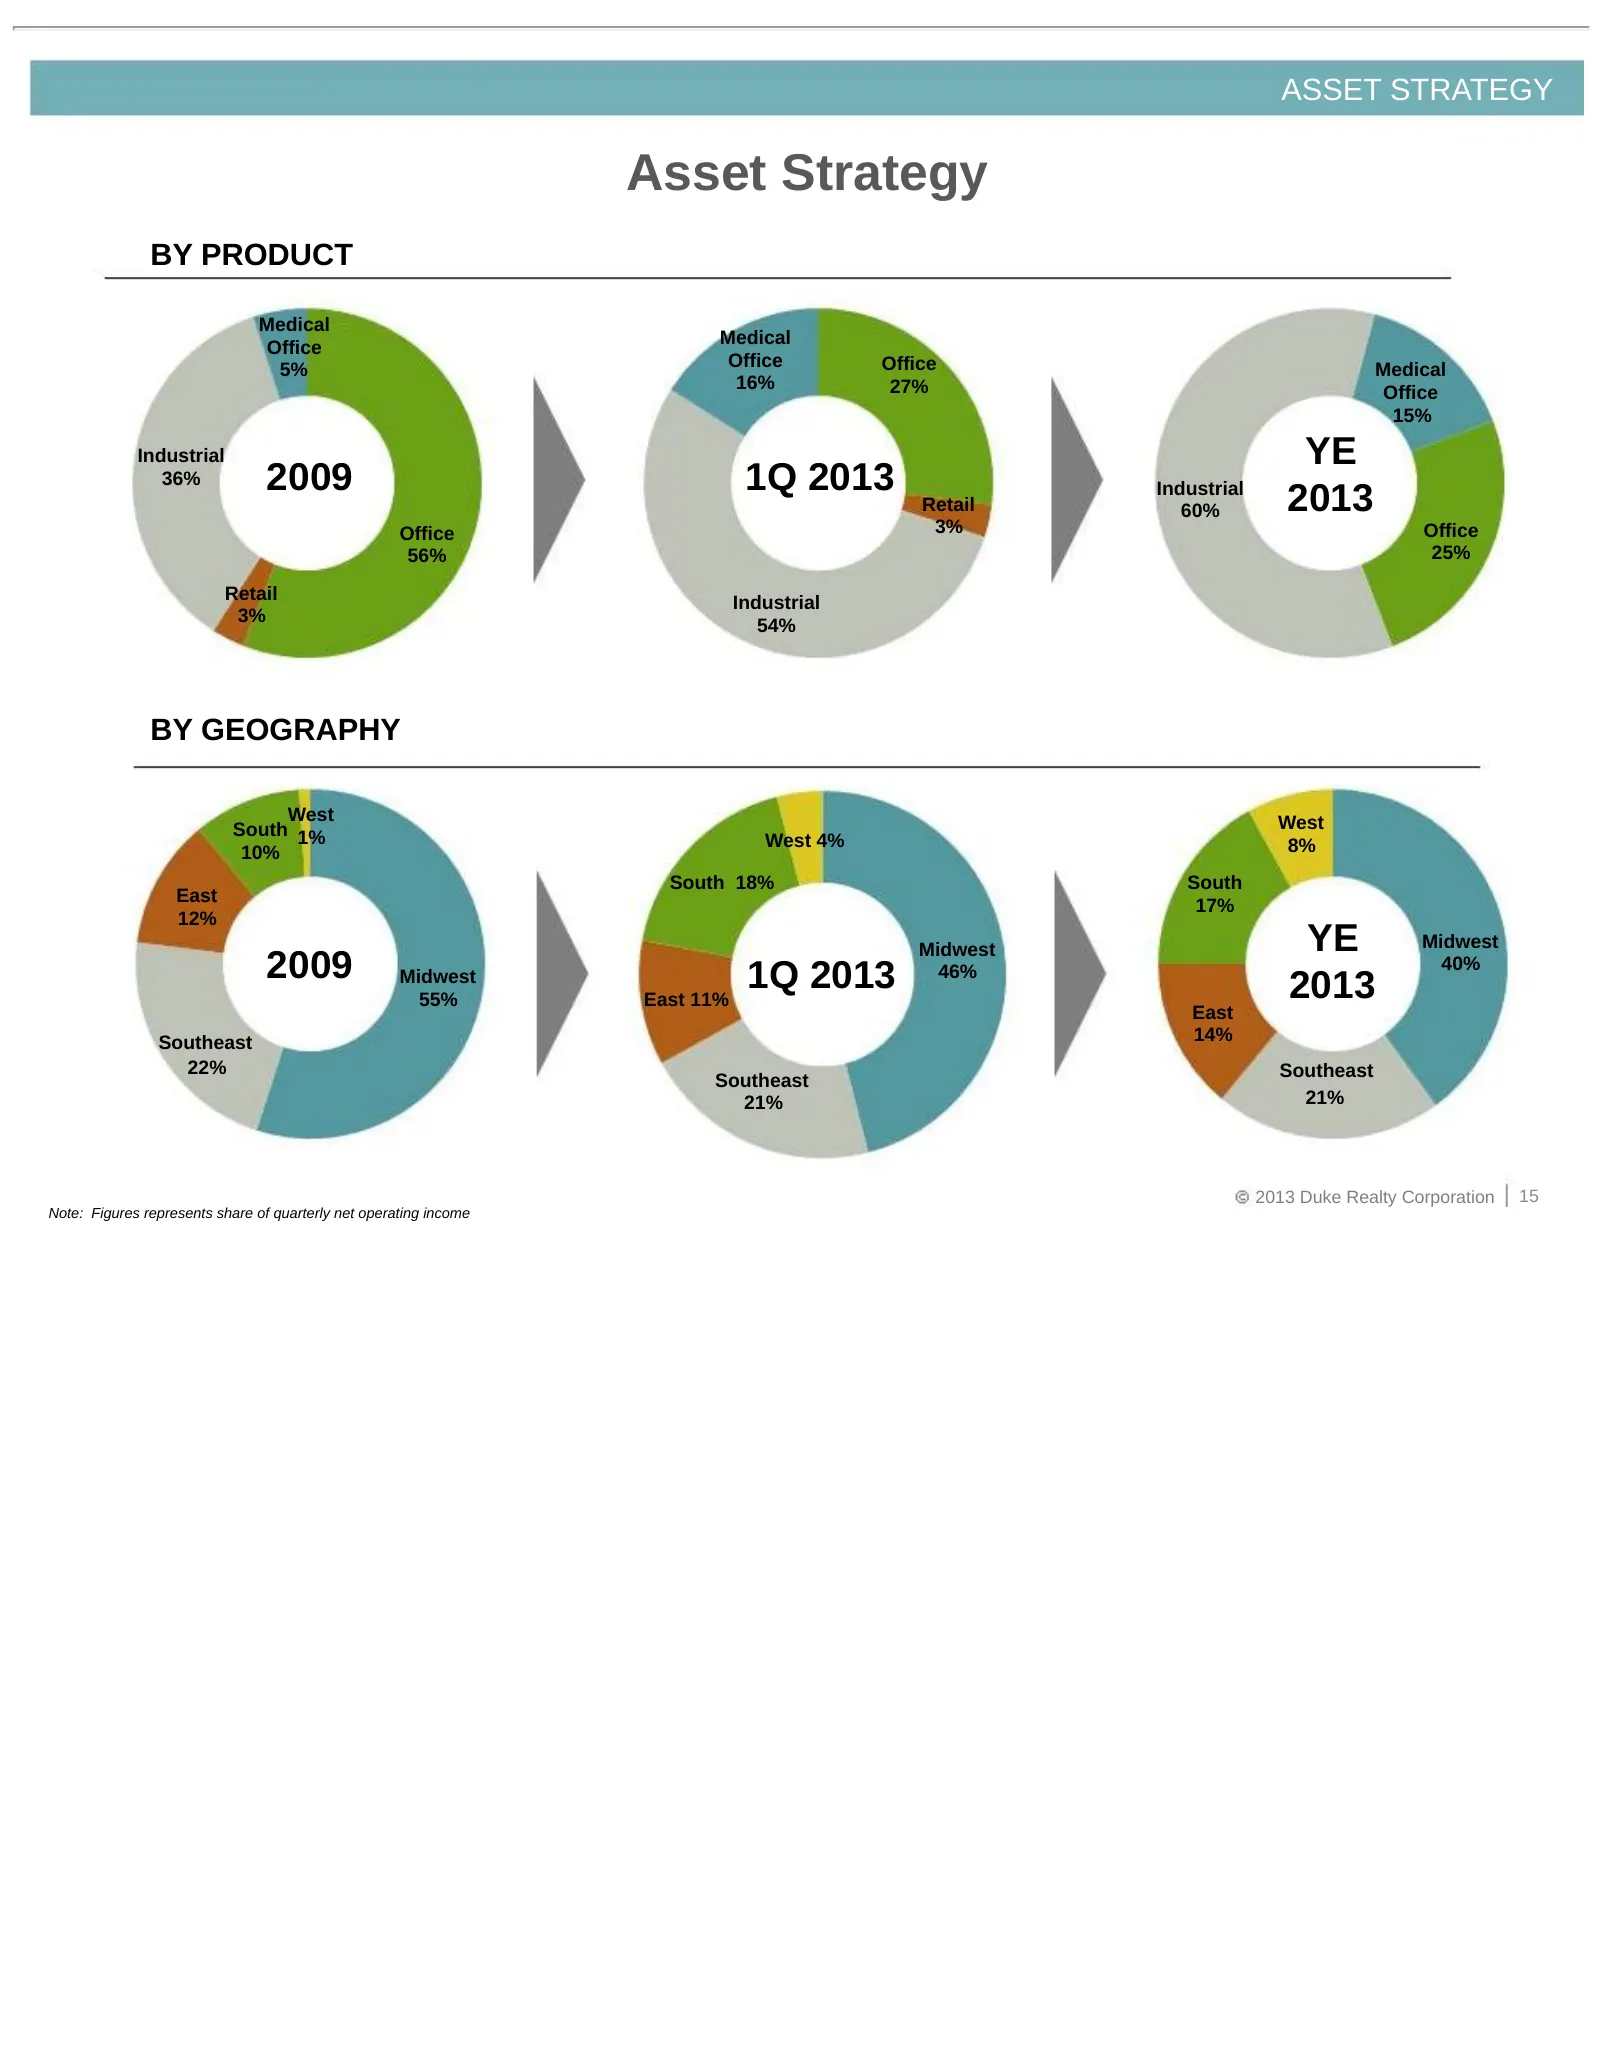
ASSET STRATEGY Asset Strategy BY PRODUCT Medical Office Medical 5% Office Office Medical 16% 27% Office 15% Industrial YE 36% 2009 1Q 2013 Retail Industrial 60% 2013 Office 3% Office 56% 25% Retail Industrial 3% 54% BY GEOGRAPHY West West South 1% West 4% 8% 10% South 18% South East 17% 12% Midwest
Slide 16: New, High Quality Portfolio with Long-term Leases
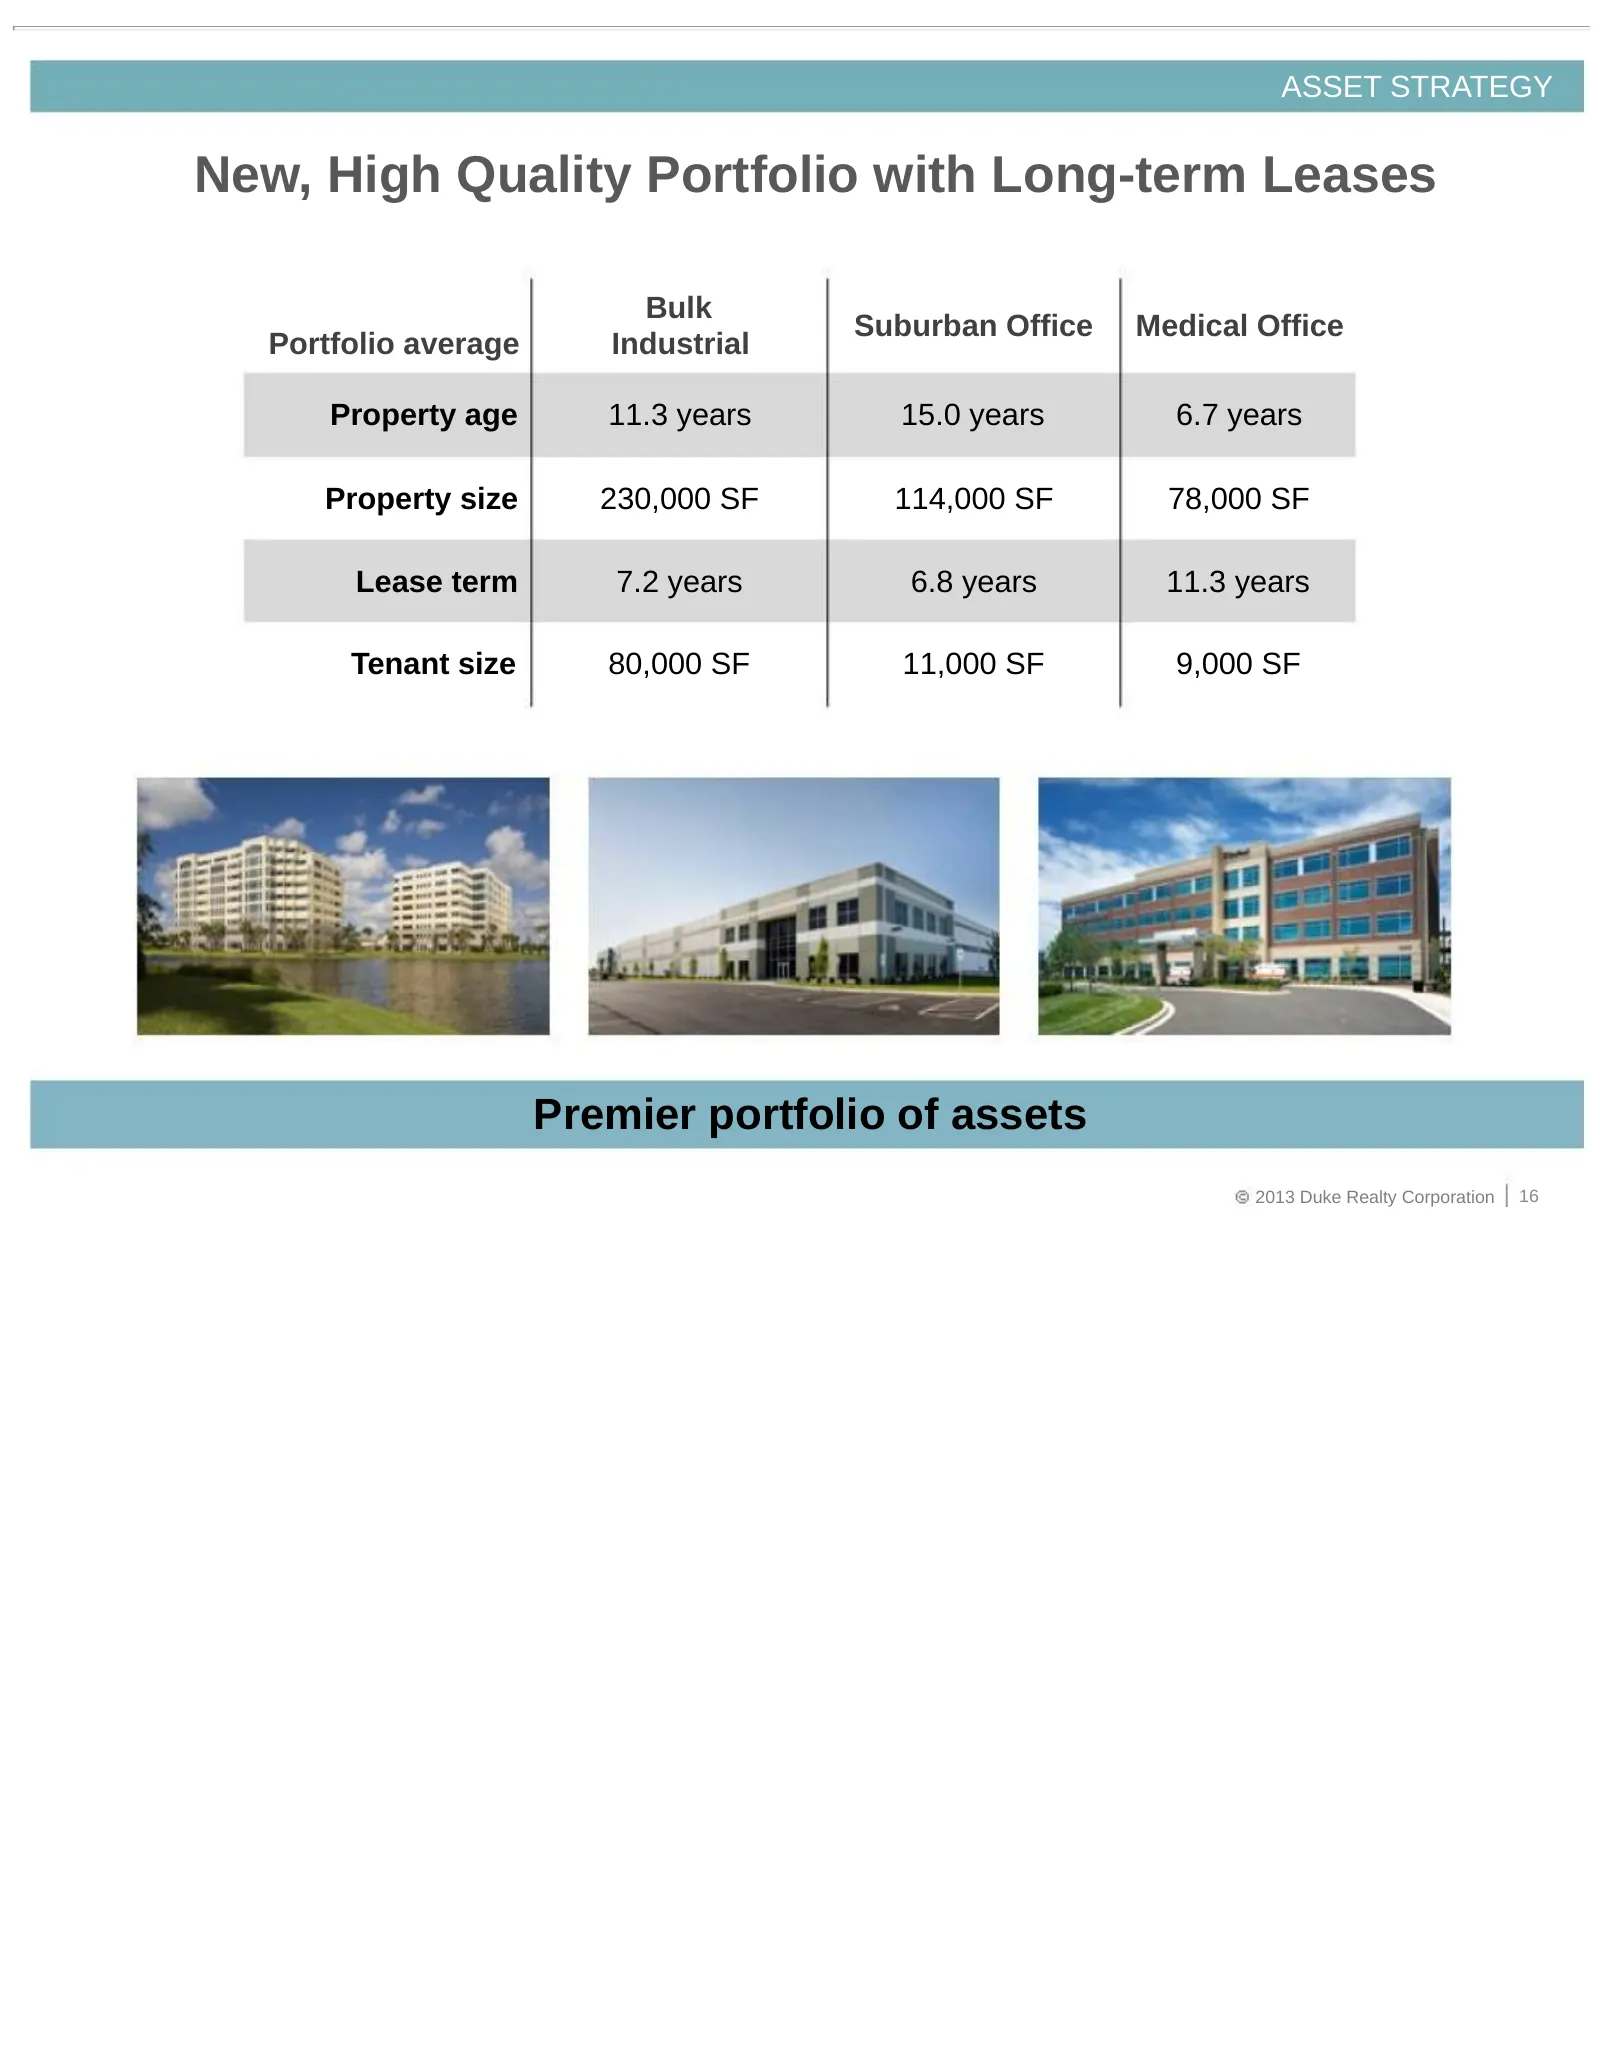
ASSET STRATEGY New, High Quality Portfolio with Long-term Leases Bulk Suburban Office Medical Office Portfolio average Industrial Property age 11.3 years 15.0 years 6.7 years Property size 230,000 SF 114,000 SF 78,000 SF Lease term 7.2 years 6.8 years 11.3 years Tenant size 80,000 SF 11,000 SF 9,000
Slide 17: Premier Quality Industrial Portfolio
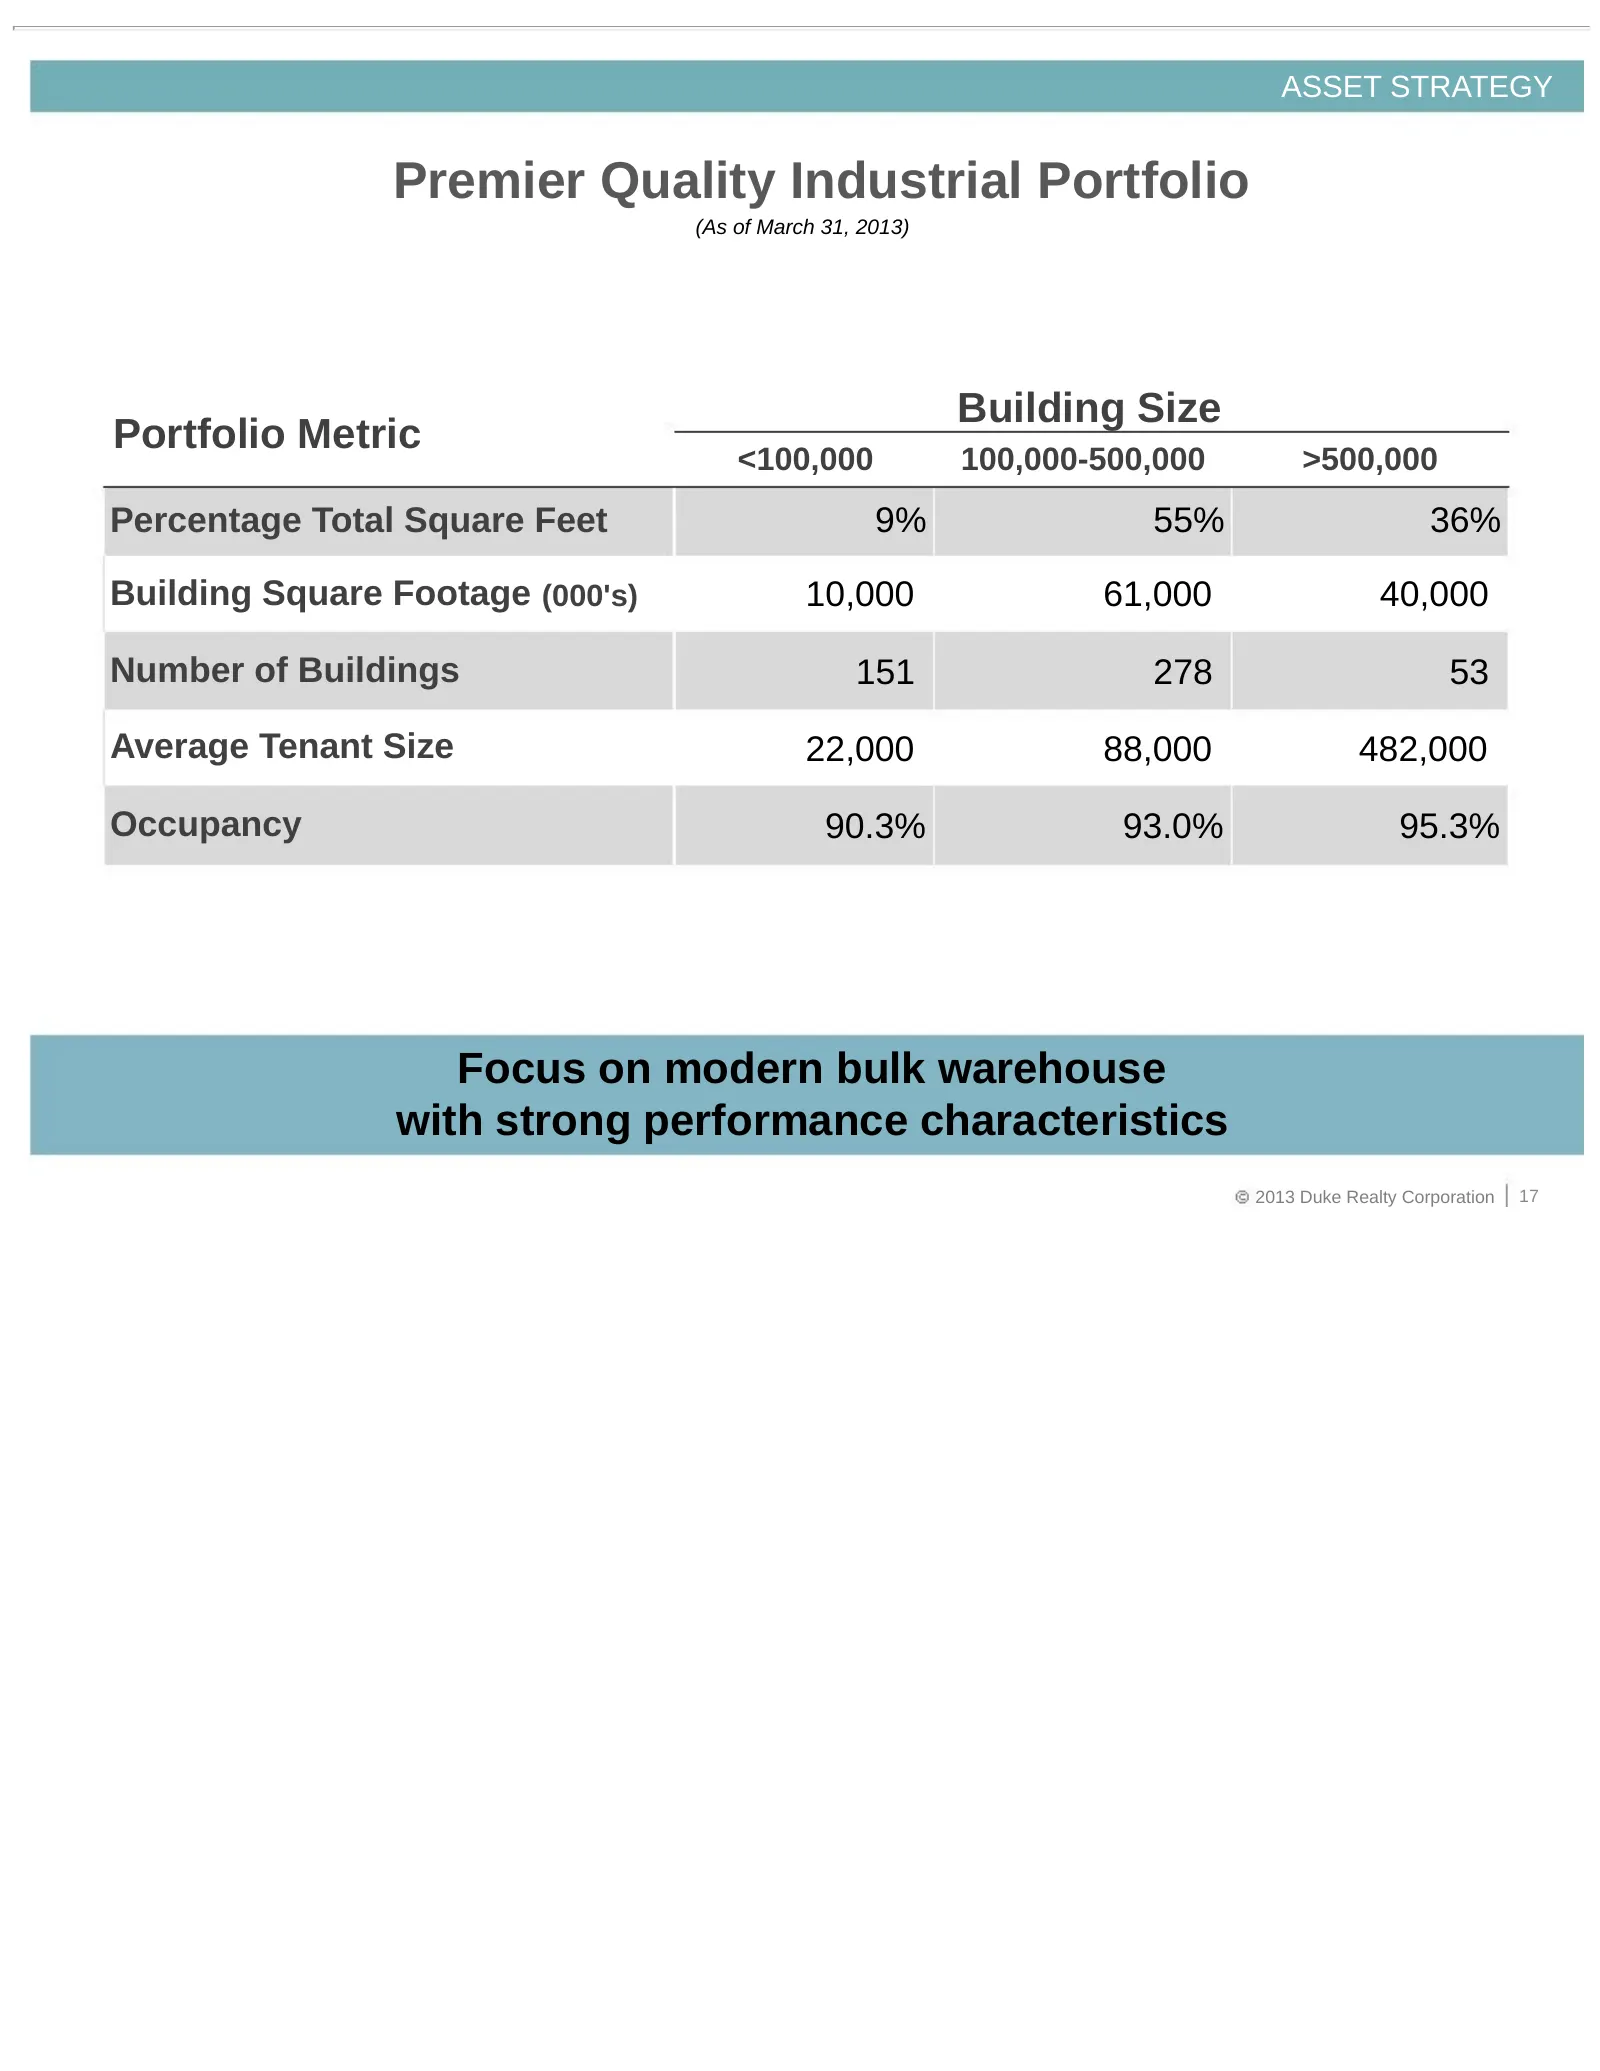
ASSET STRATEGY Premier Quality Industrial Portfolio (As of March 31, 2013) Building Size Portfolio Metric <100,000 100,000-500,000 >500,000 Percentage Total Square Feet 9% 55% 36% Building Square Footage (000's) 10,000 61,000 40,000 Number of Buildings 151 278 53 Average Tenant Size 22,000 88,000 48
Slide 18: 2013 Notable Dispositions
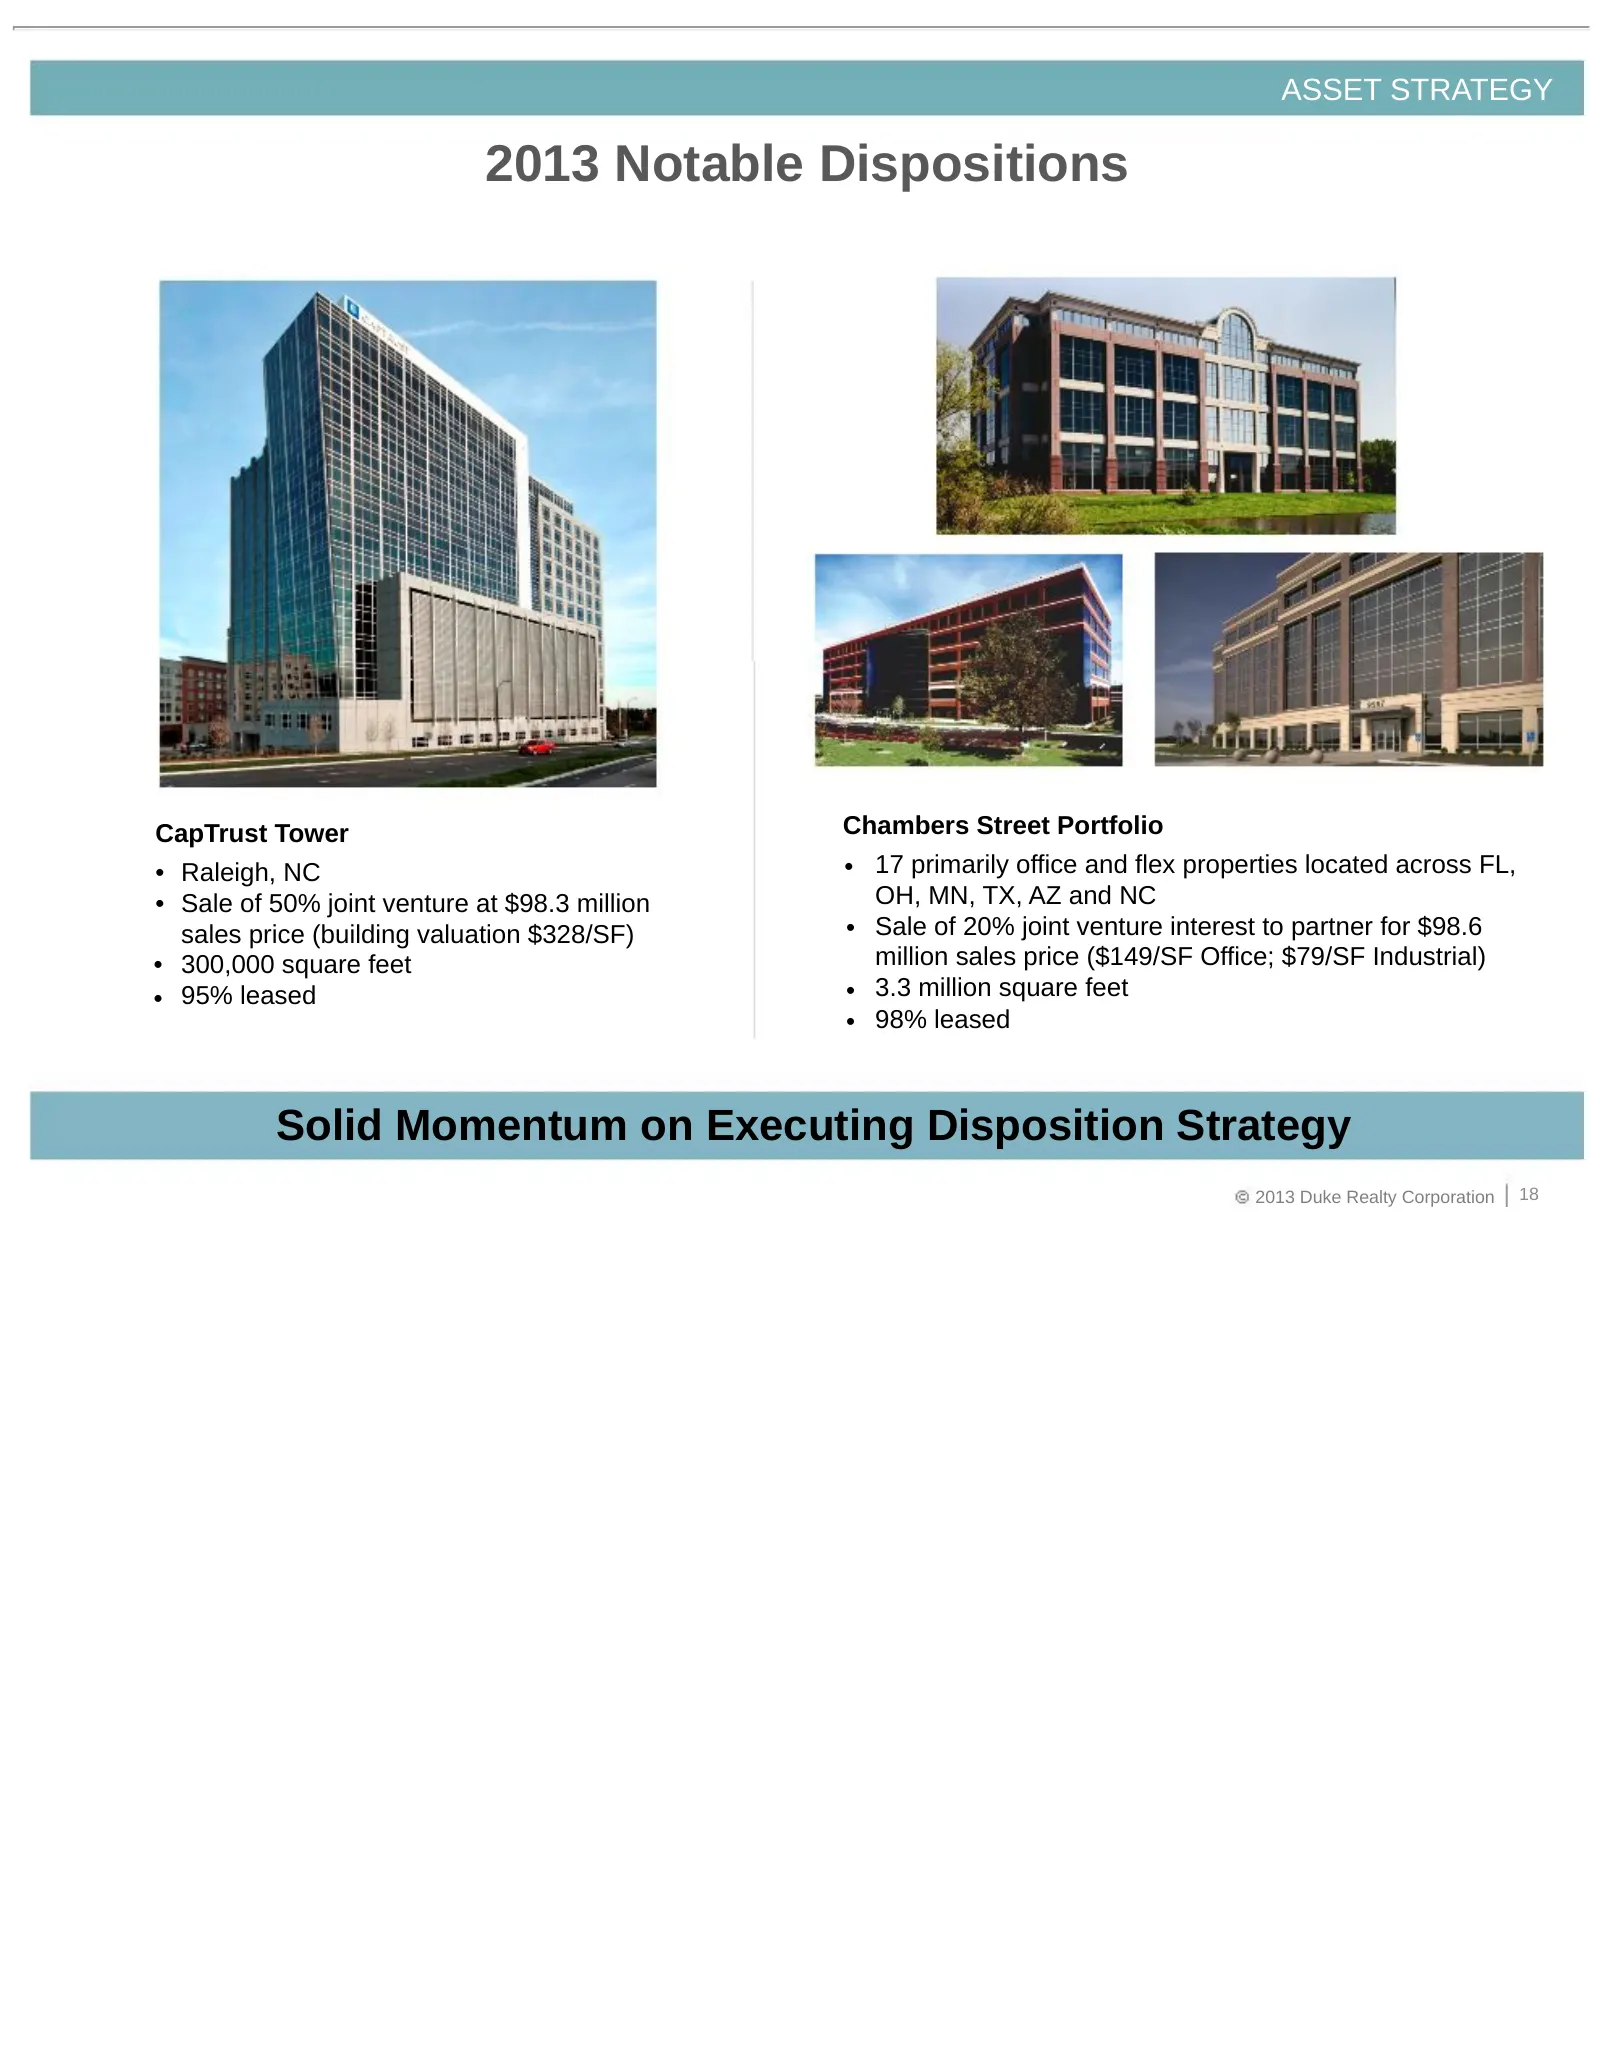
ASSET STRATEGY 2013 Notable Dispositions CapTrust Tower Chambers Street Portfolio • Raleigh, NC • 17 primarily office and flex properties located across FL, • Sale of 50% joint venture at $98.3 million OH, MN, TX, AZ and NC sales price (building valuation $328/SF) • Sale of 20% joint venture interes
Slide 19: Pembroke Pines Retail Disposition
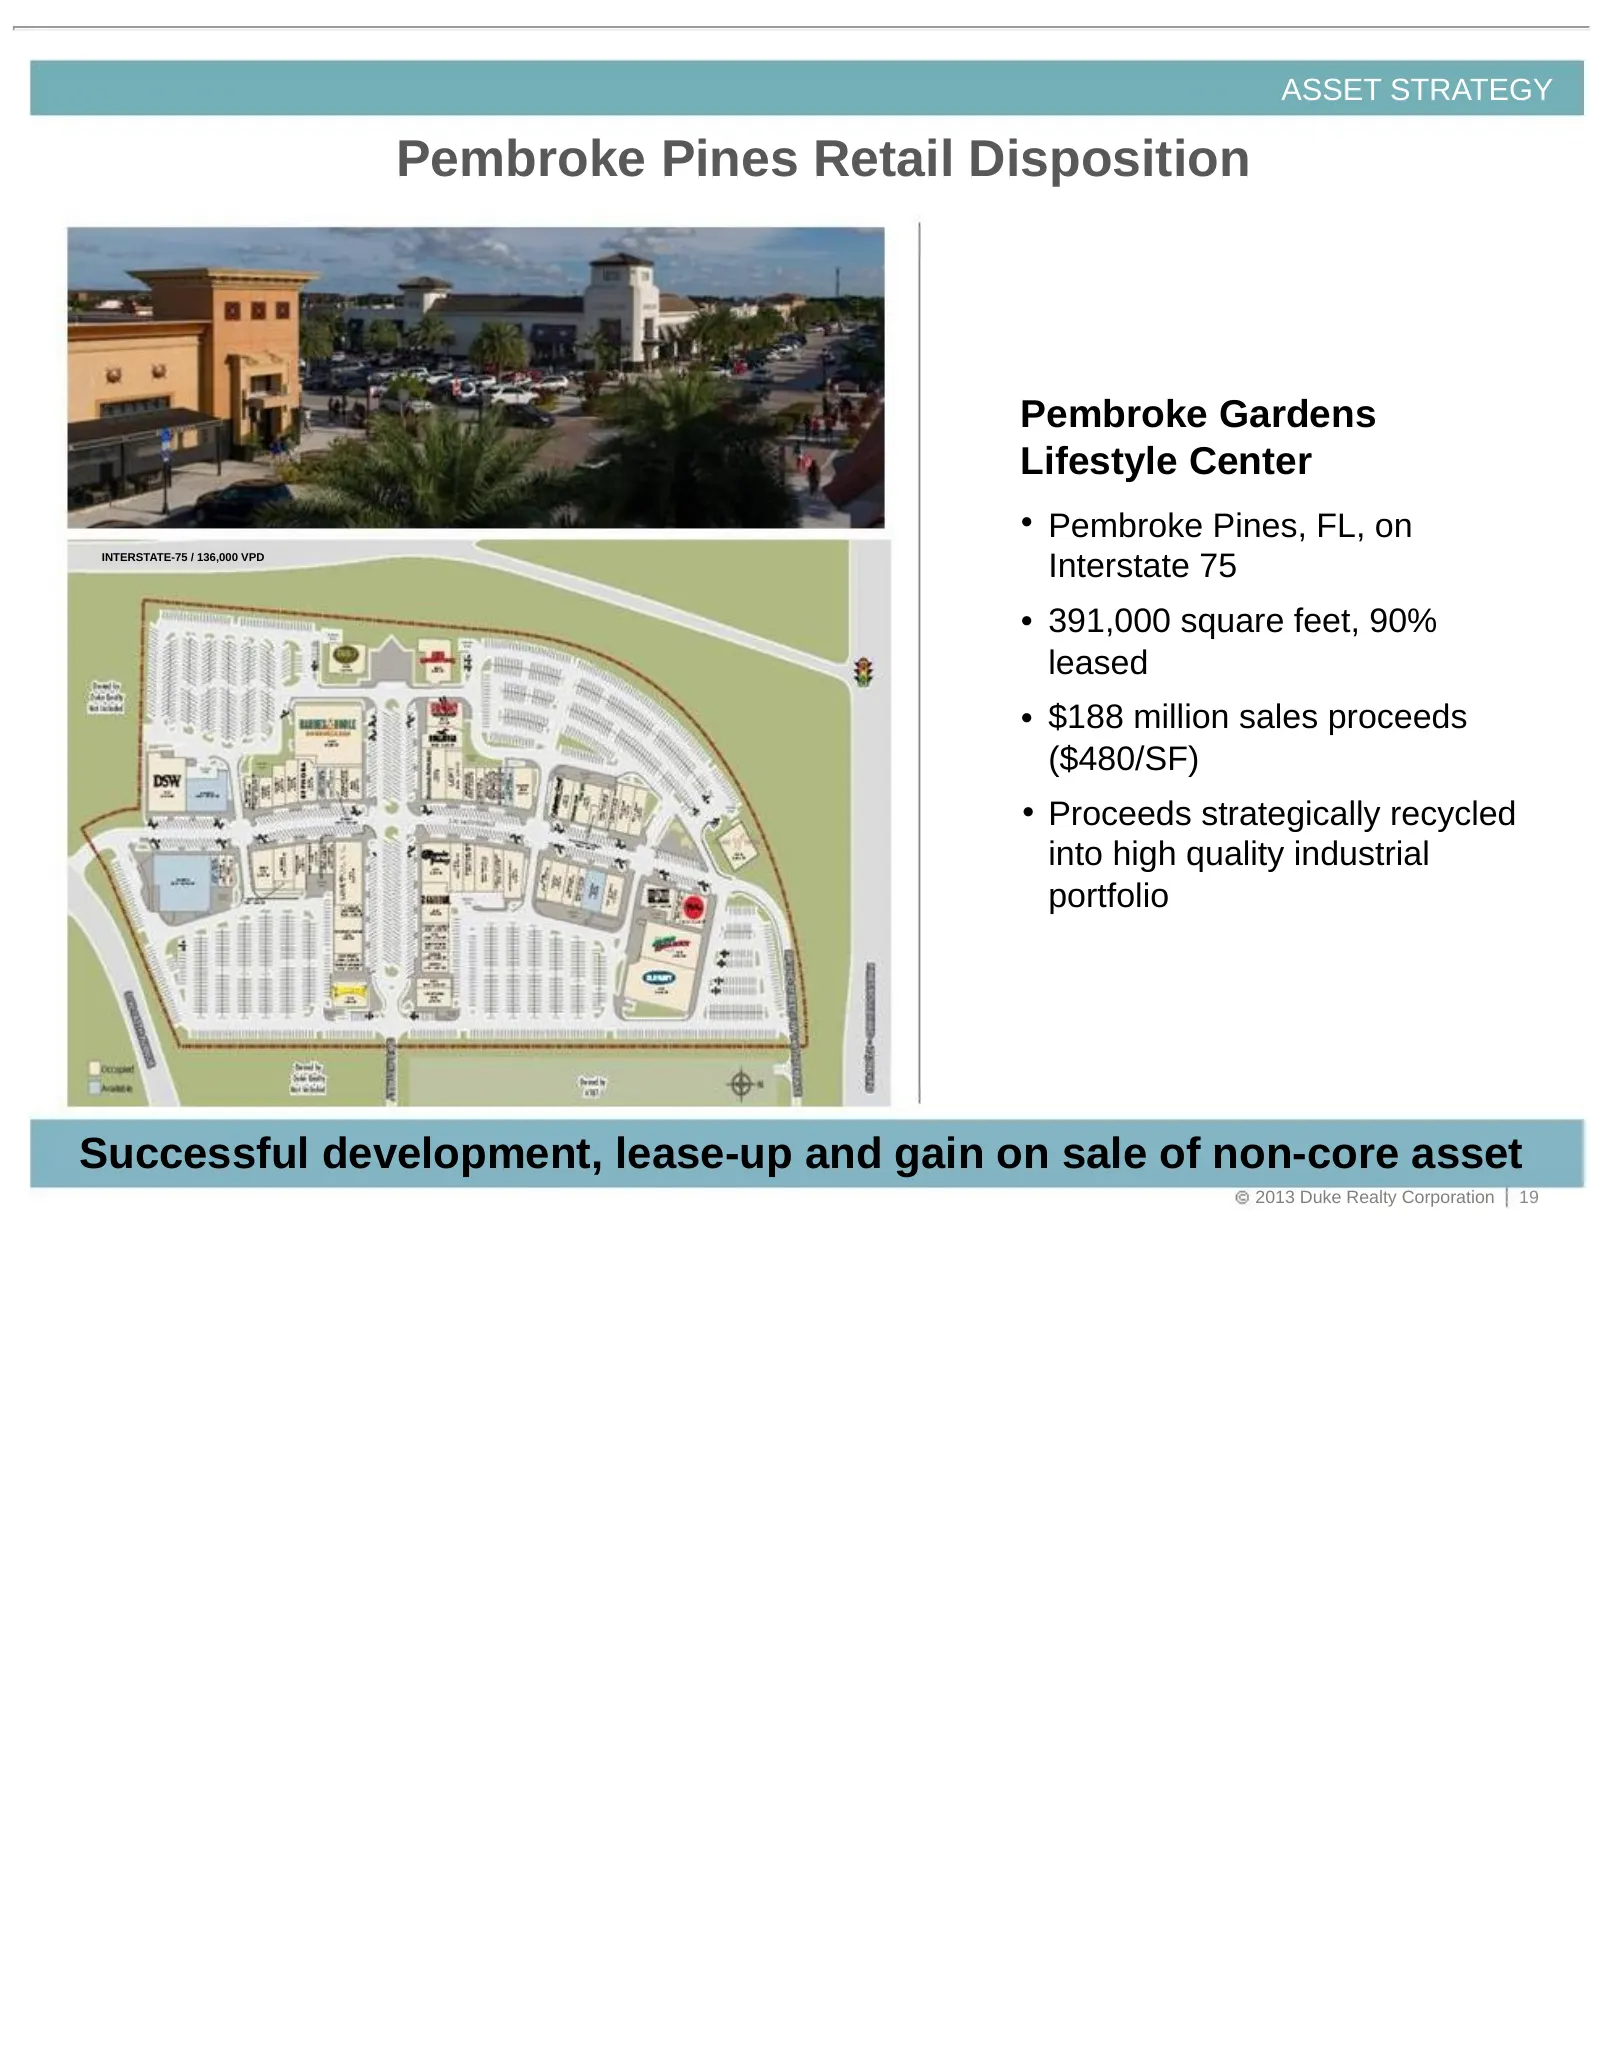
ASSET STRATEGY Pembroke Pines Retail Disposition Pembroke Gardens Lifestyle Center • Pembroke Pines, FL, on INTERSTATE-75 / 136,000 VPD Interstate 75 • 391,000 square feet, 90% leased • $188 million sales proceeds ($480/SF) • Proceeds strategically recycled into high quality industrial portfolio Suc
Slide 20: USAA Portfolio Industrial Acquisition
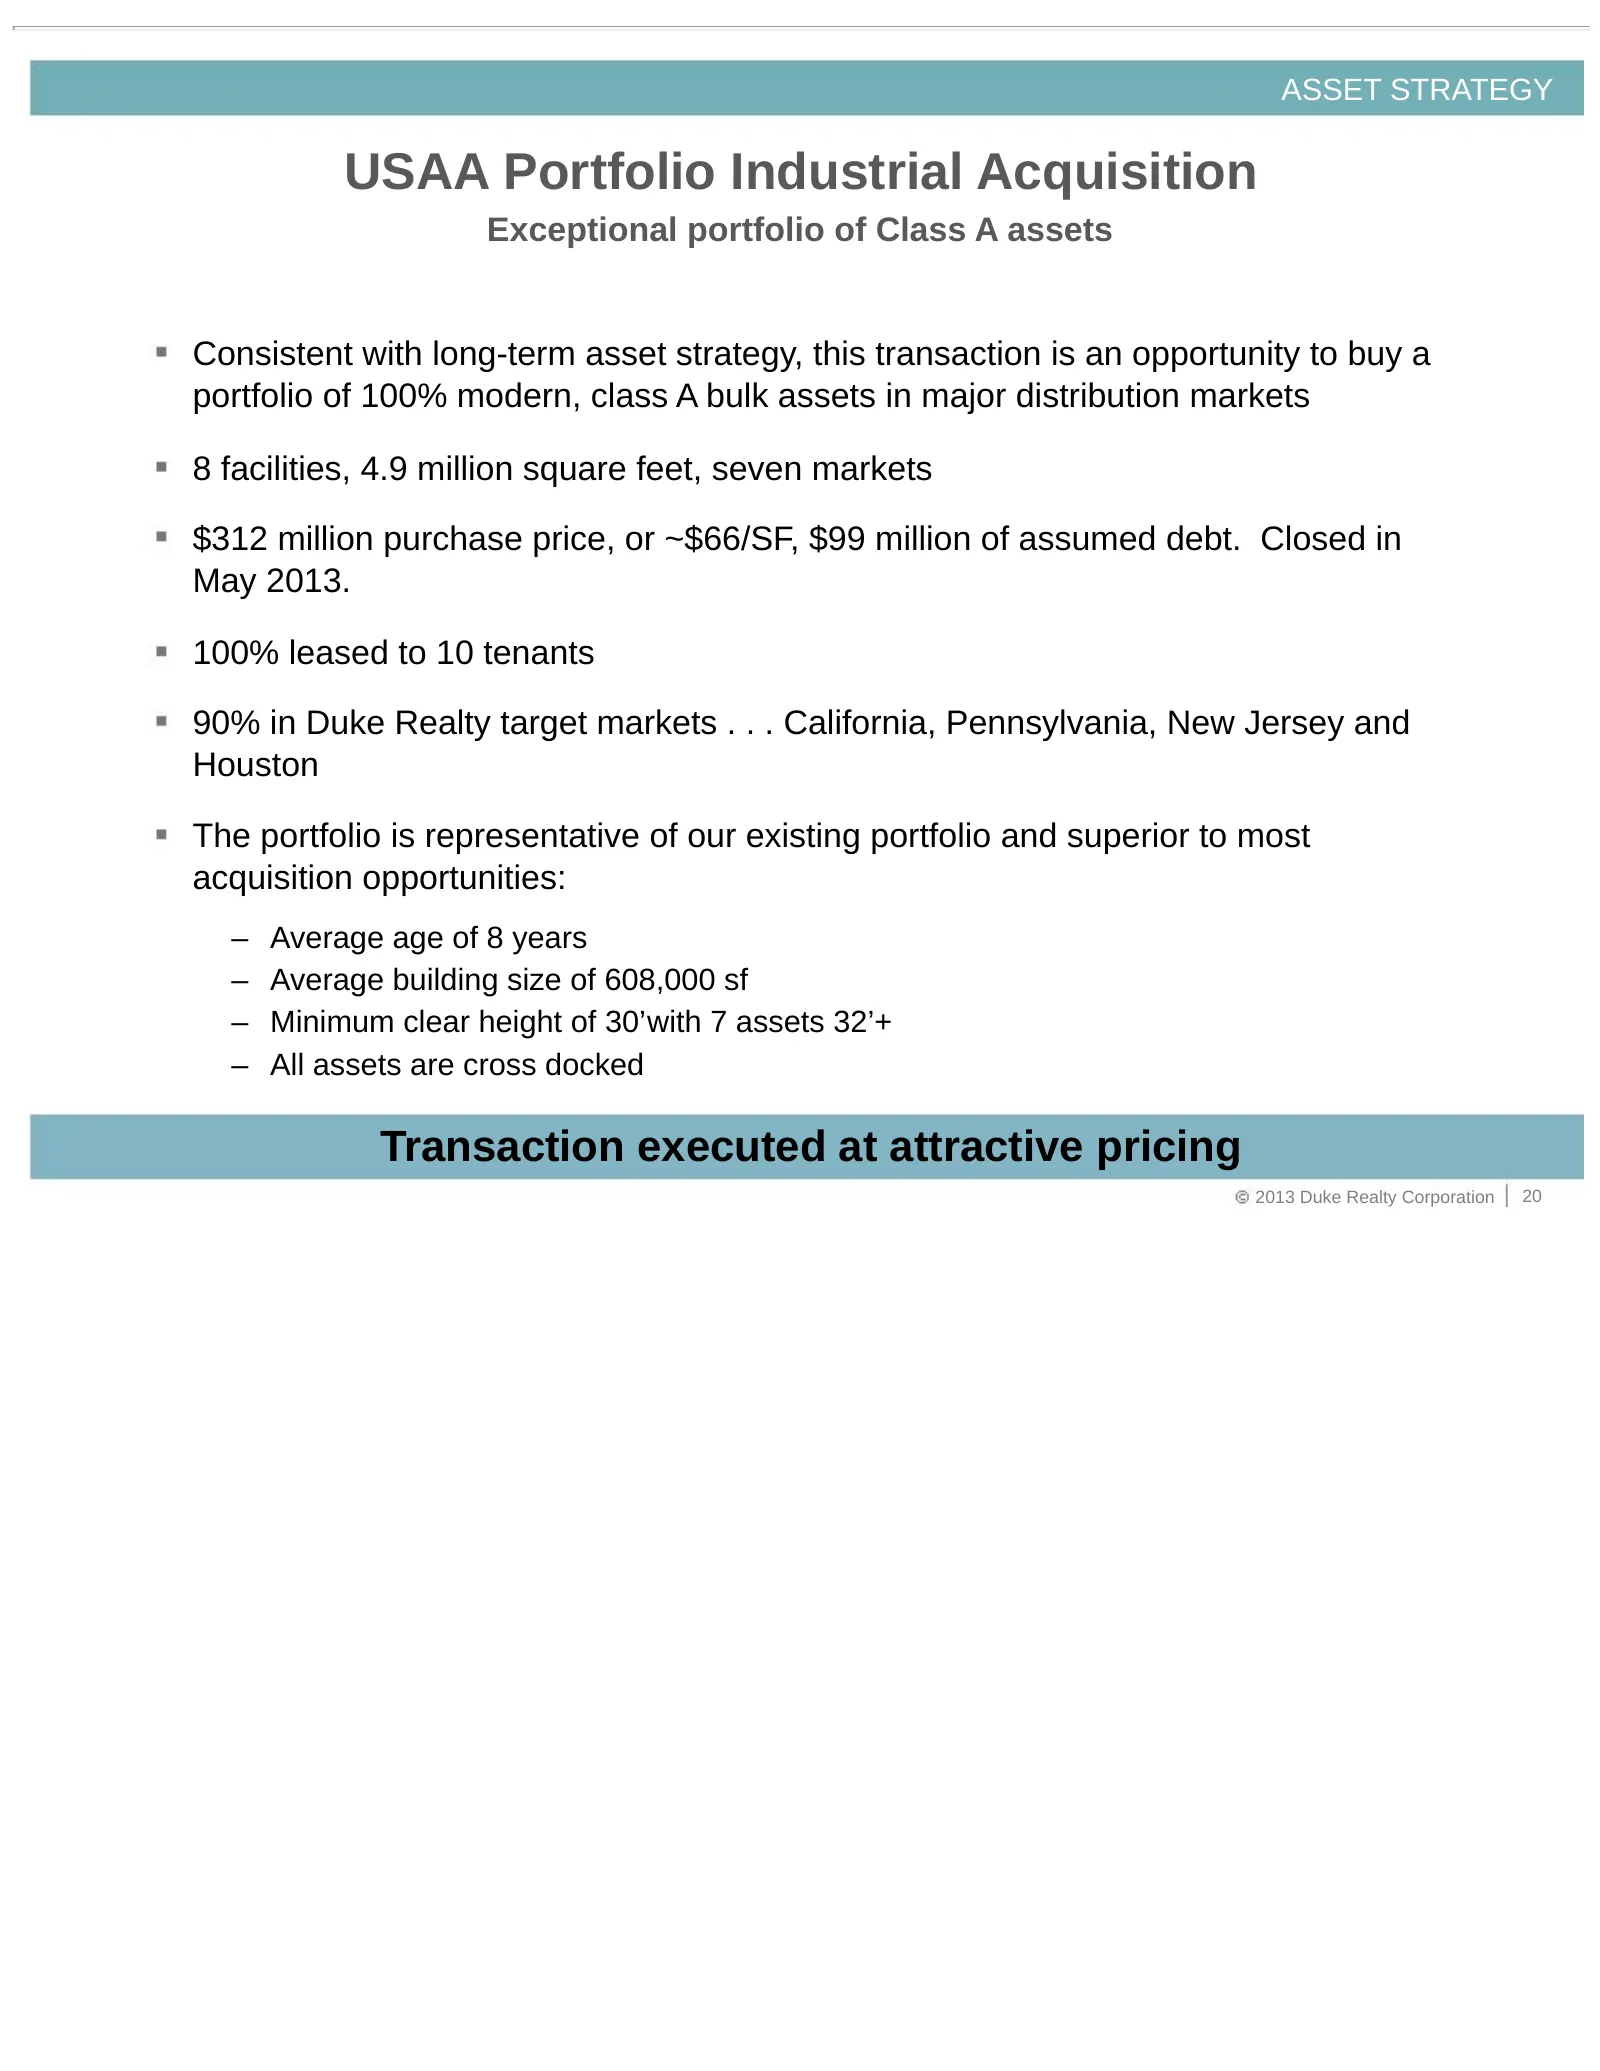
ASSET STRATEGY USAA Portfolio Industrial Acquisition Exceptional portfolio of Class A assets Consistent with long-term asset strategy, this transaction is an opportunity to buy a portfolio of 100% modern, class A bulk assets in major distribution markets 8 facilities, 4.9 million square feet, seven
Slide 21: USAA Portfolio Acquisition
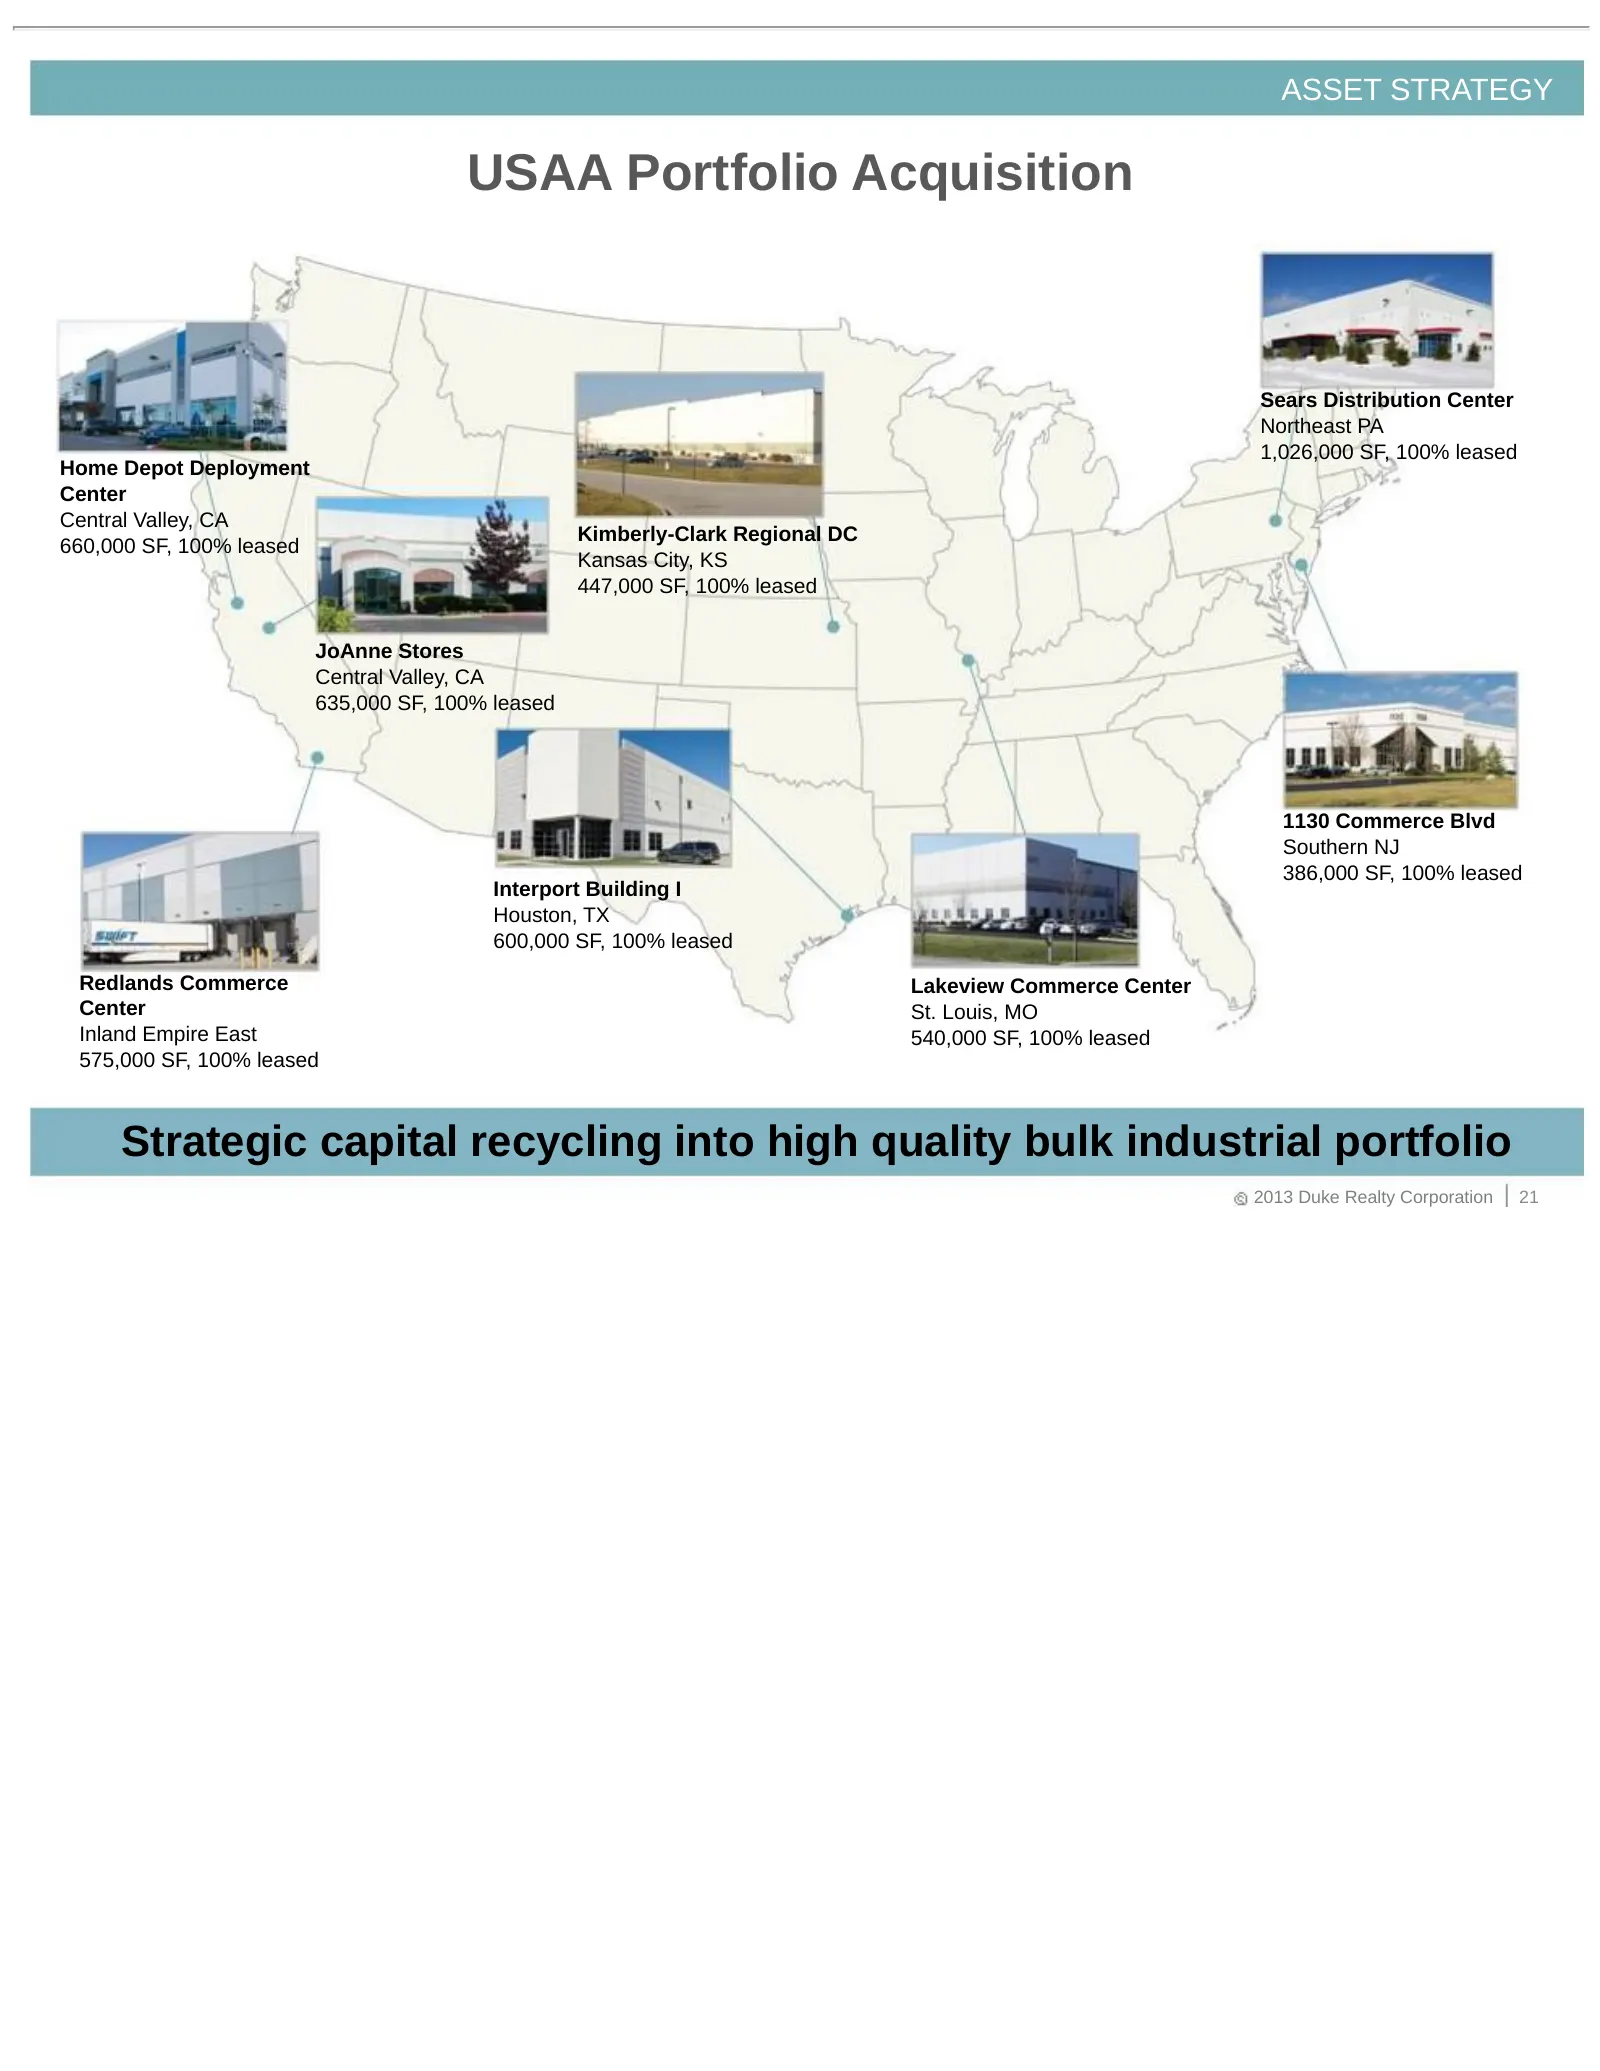
ASSET STRATEGY USAA Portfolio Acquisition Sears Distribution Center Northeast PA 1,026,000 SF, 100% leased Home Depot Deployment Center Central Valley, CA Kimberly-Clark Regional DC 660,000 SF, 100% leased Kansas City, KS 447,000 SF, 100% leased JoAnne Stores Central Valley, CA 635,000 SF, 100% leas
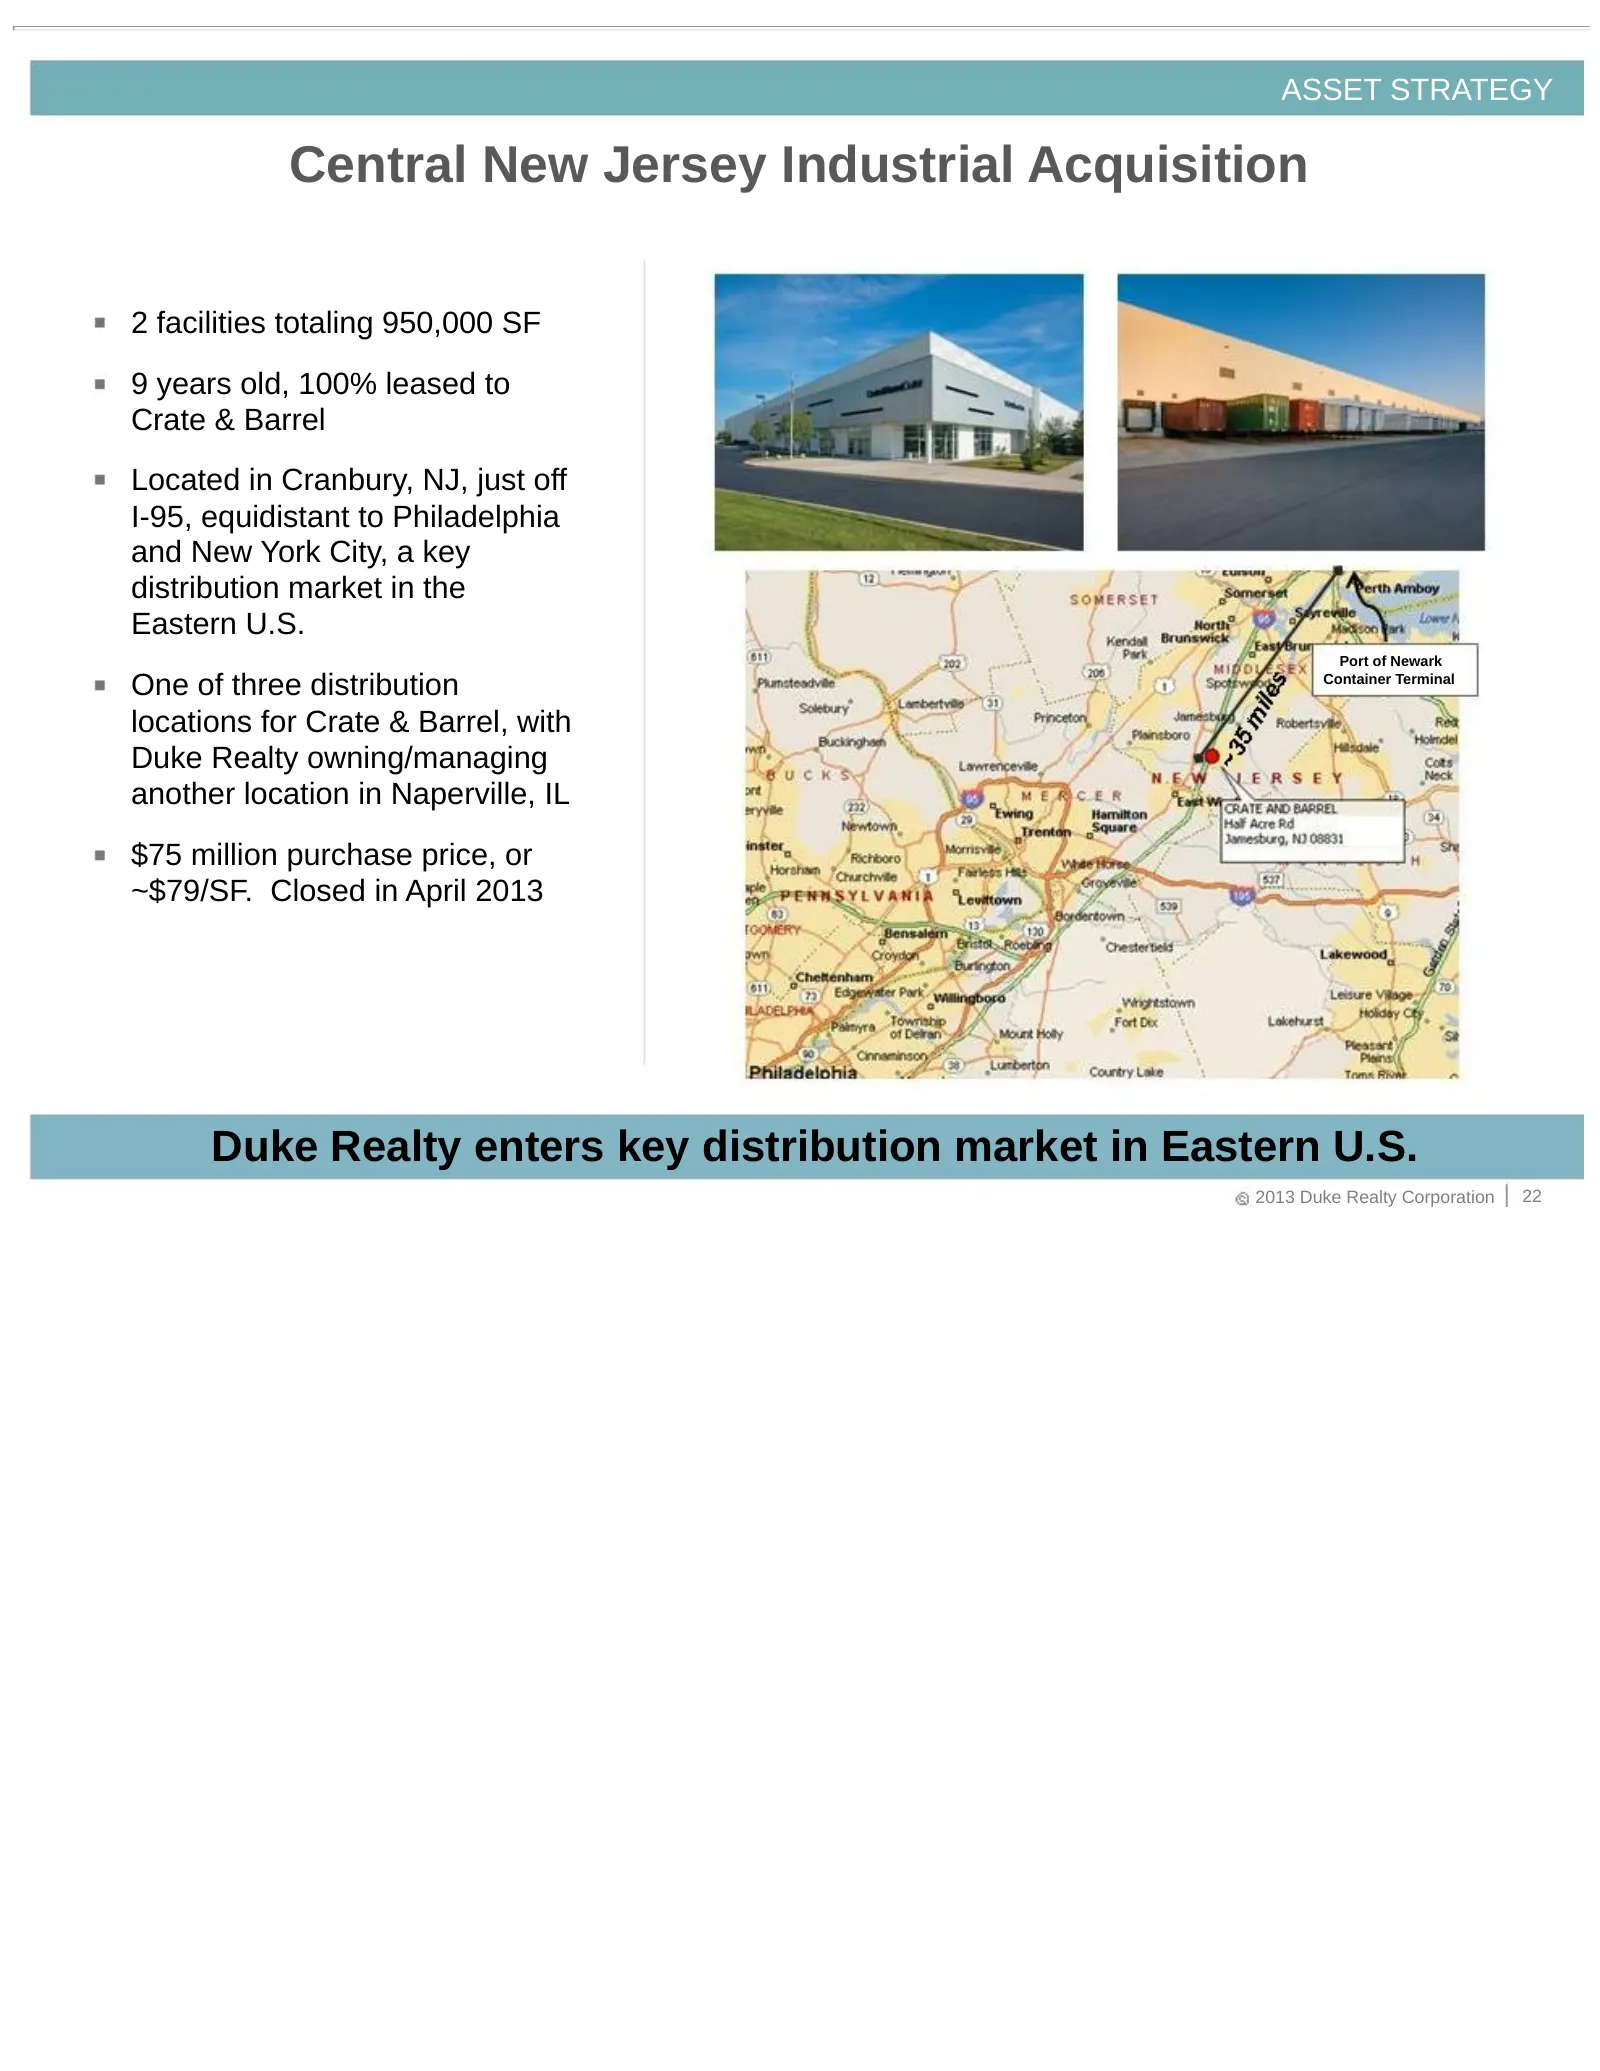
Slide 22: Central New Jersey Industrial Acquisition
ASSET STRATEGY Central New Jersey Industrial Acquisition 2 facilities totaling 950,000 SF 9 years old, 100% leased to Crate & Barrel Located in Cranbury, NJ, just off I-95, equidistant to Philadelphia and New York City, a key distribution market in the Eastern U.S. Port of Newark One of three distri
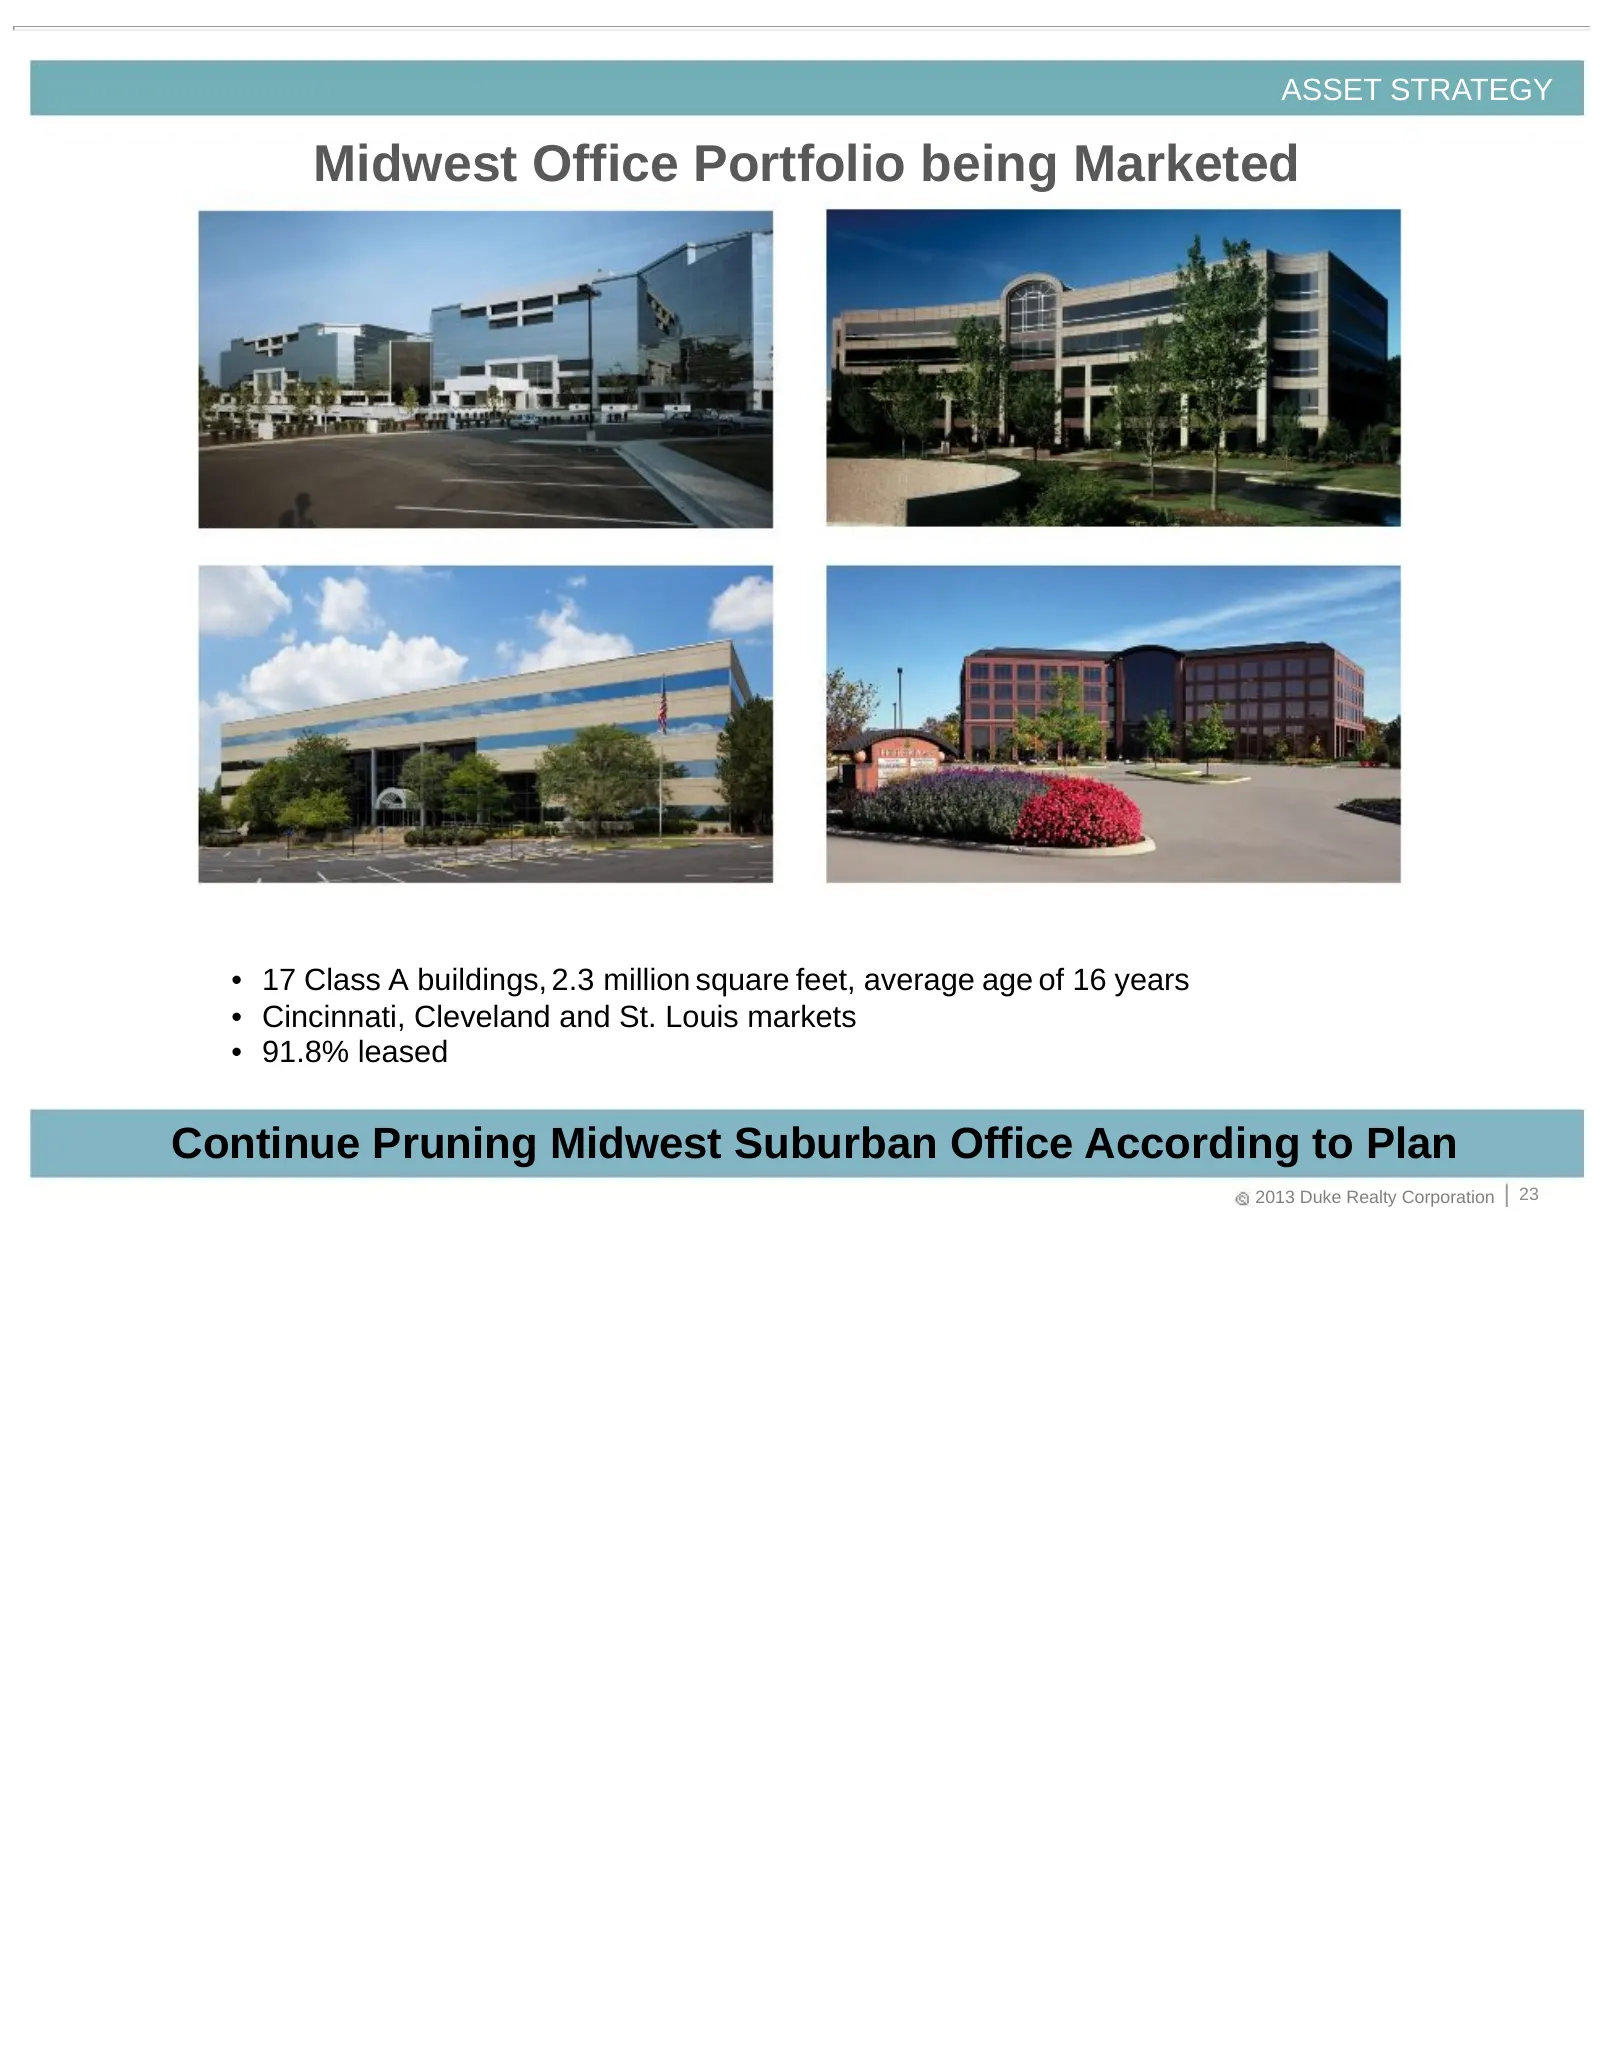
Slide 23: Midwest Office Portfolio being Marketed
ASSET STRATEGY Midwest Office Portfolio being Marketed • 17 Class A buildings, 2.3 million square feet, average age of 16 years • Cincinnati, Cleveland and St. Louis markets • 91.8% leased Continue Pruning Midwest Suburban Office According to Plan 2013 Duke Realty Corporation 23
Slide 24: Medical Office Strategy
MEDICAL OFFICE STRATEGY 2013 Duke Realty Corporation 24
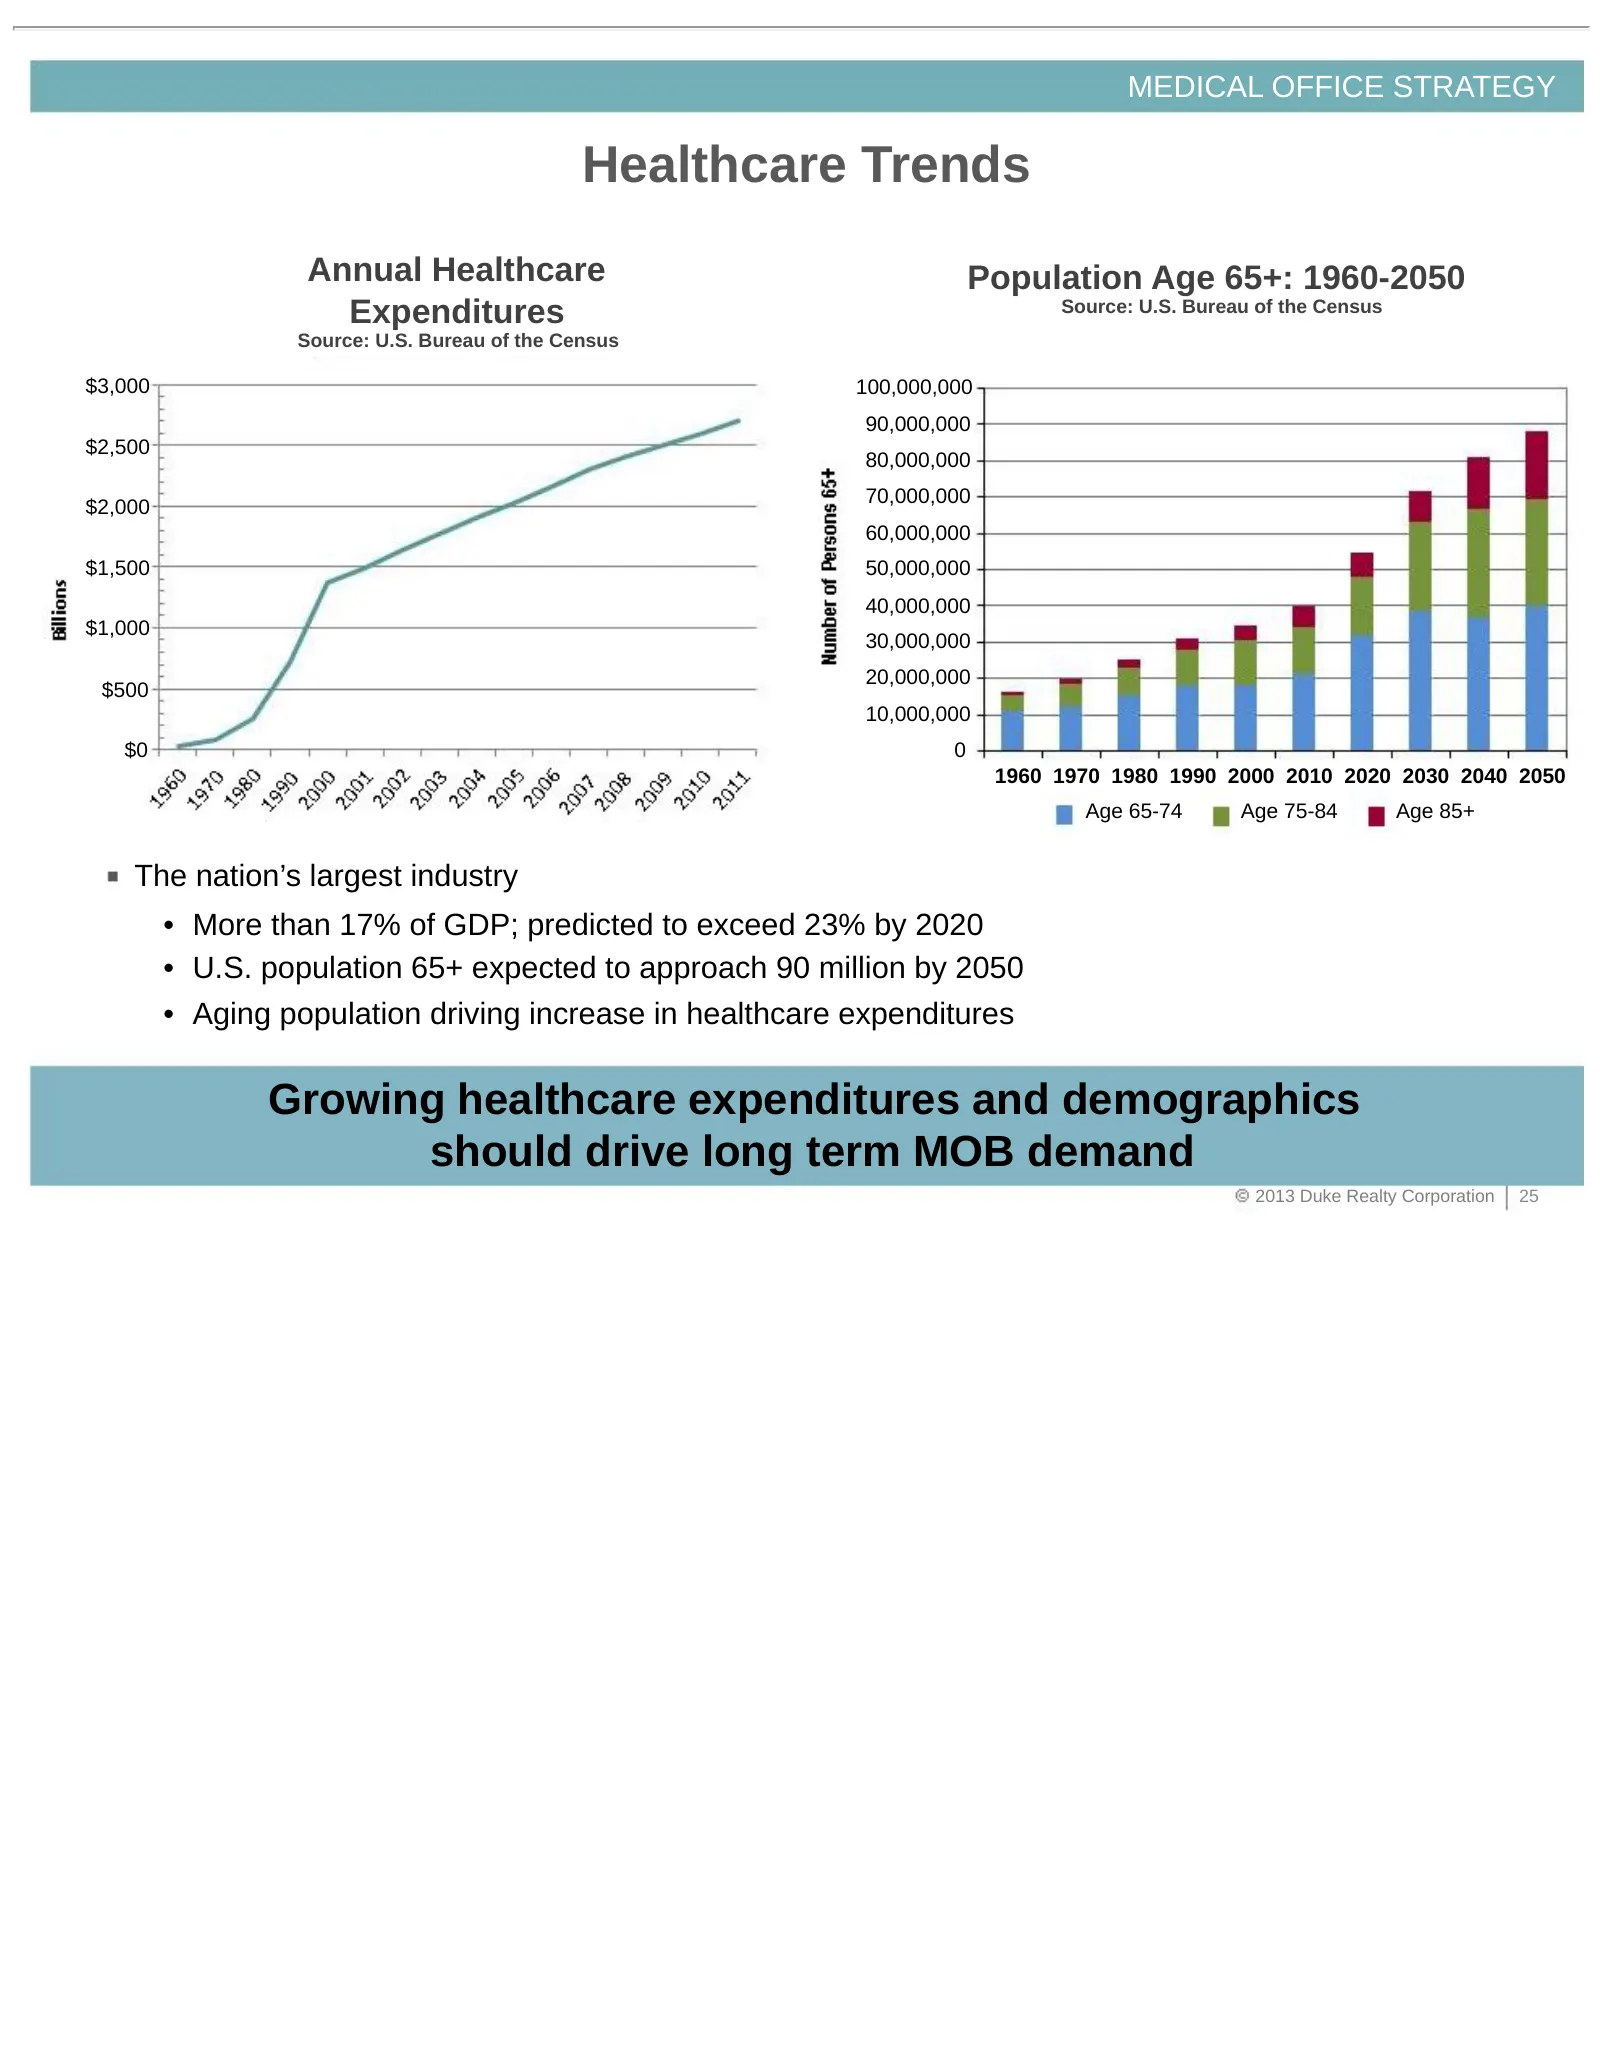
Slide 25: Healthcare Trends
MEDICAL OFFICE STRATEGY Healthcare Trends Annual Healthcare Population Age 65+: 1960-2050 Expenditures Source: U.S. Bureau of the Census Source: U.S. Bureau of the Census $3,000 100,000,000 90,000,000 $2,500 80,000,000 70,000,000 $2,000 60,000,000 $1,500 50,000,000 40,000,000 $1,000 30,000,000 20,00
Slide 26: Healthcare Trends
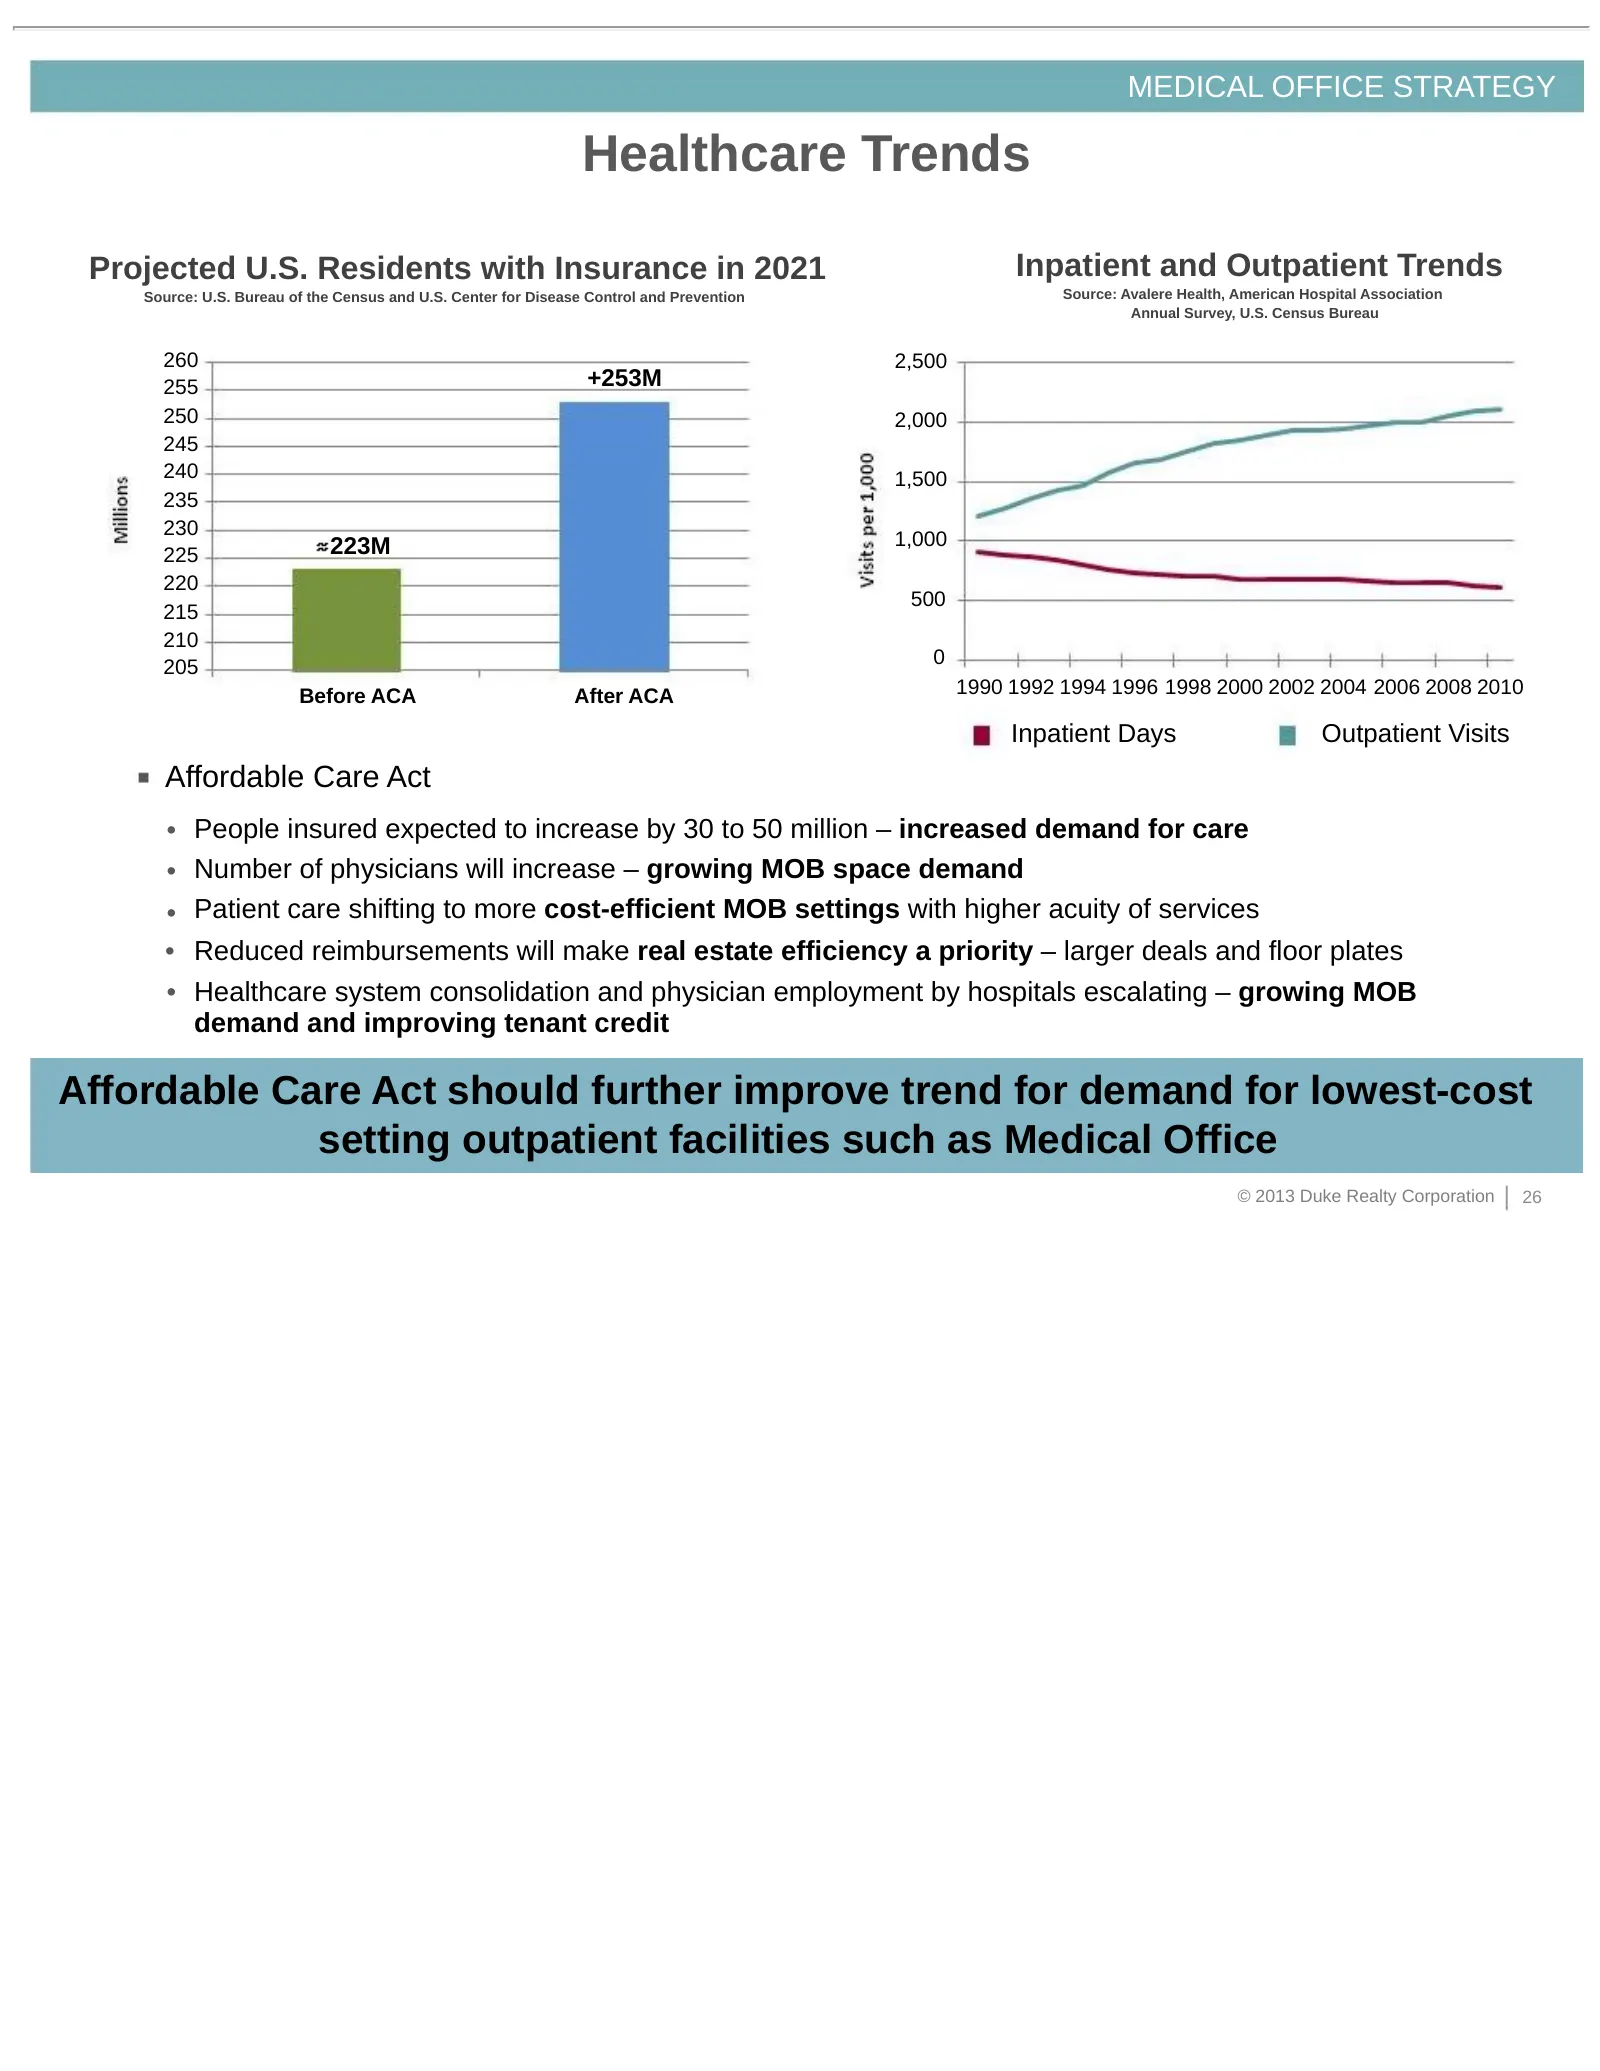
MEDICAL OFFICE STRATEGY Healthcare Trends Projected U.S. Residents with Insurance in 2021 Inpatient and Outpatient Trends Source: U.S. Bureau of the Census and U.S. Center for Disease Control and Prevention Source: Avalere Health, American Hospital Association Annual Survey, U.S. Census Bureau 260 2
Slide 27: Goal: Grow Medical Office Primarily through Development
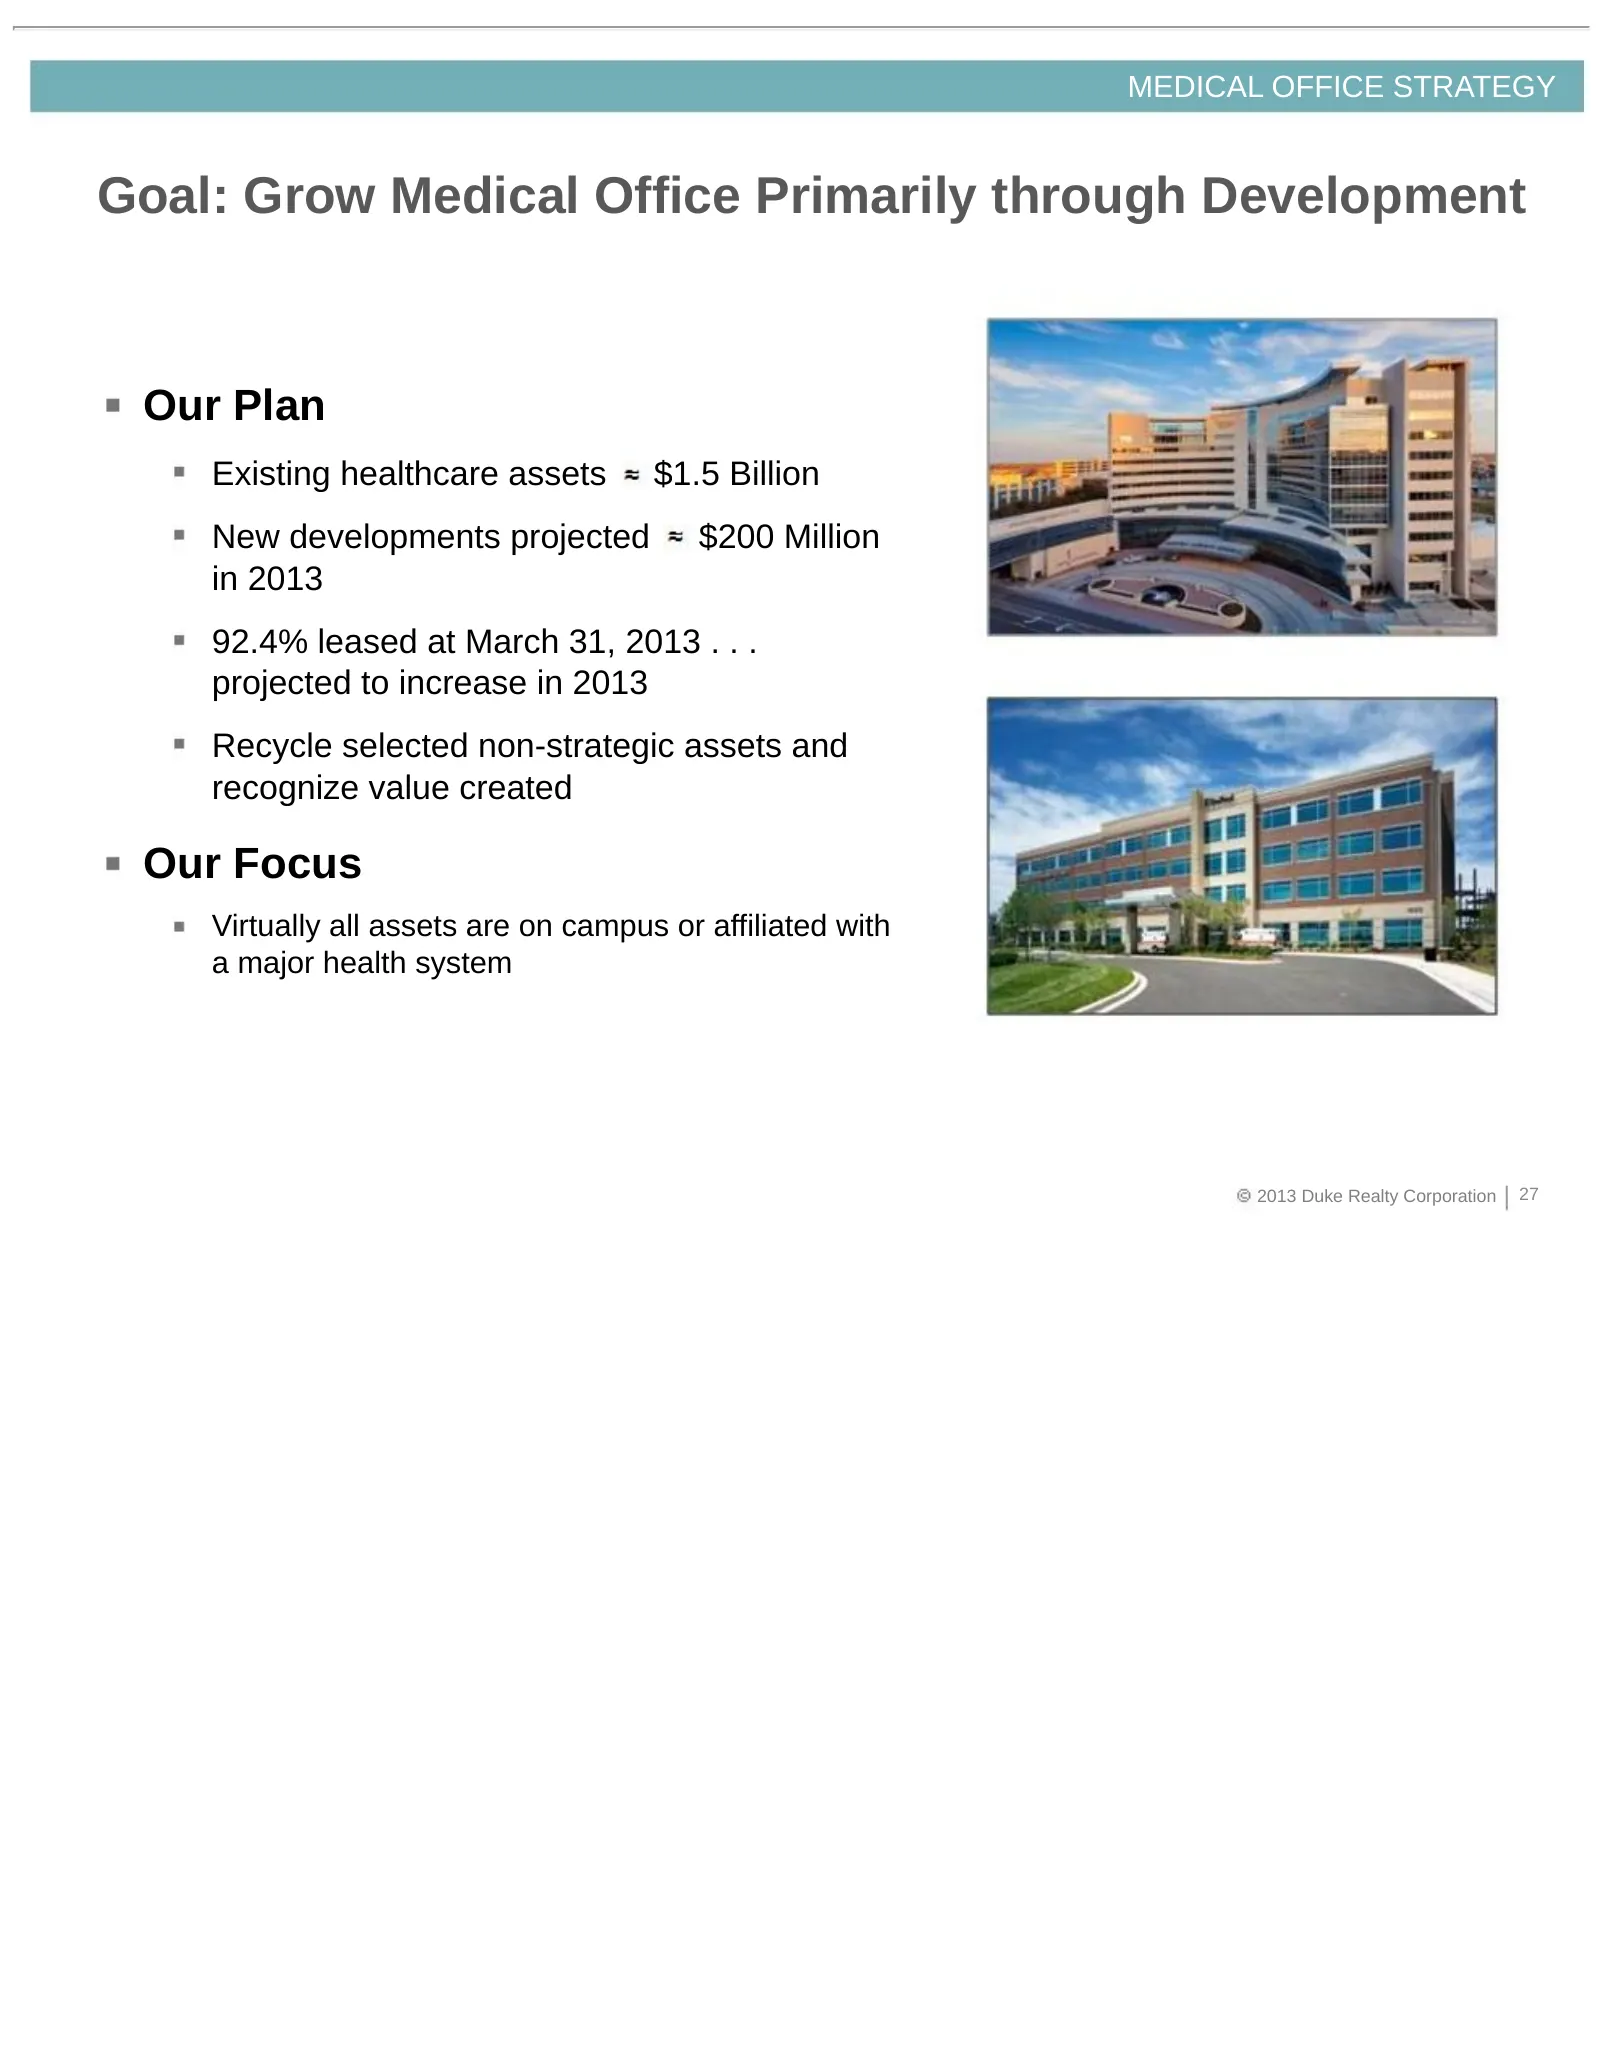
MEDICAL OFFICE STRATEGY Goal: Grow Medical Office Primarily through Development Our Plan Existing healthcare assets $1.5 Billion New developments projected $200 Million in 2013 92.4% leased at March 31, 2013 . . . projected to increase in 2013 Recycle selected non-strategic assets and recognize valu
Slide 28: Medical Office Portfolio at March 31, 2013
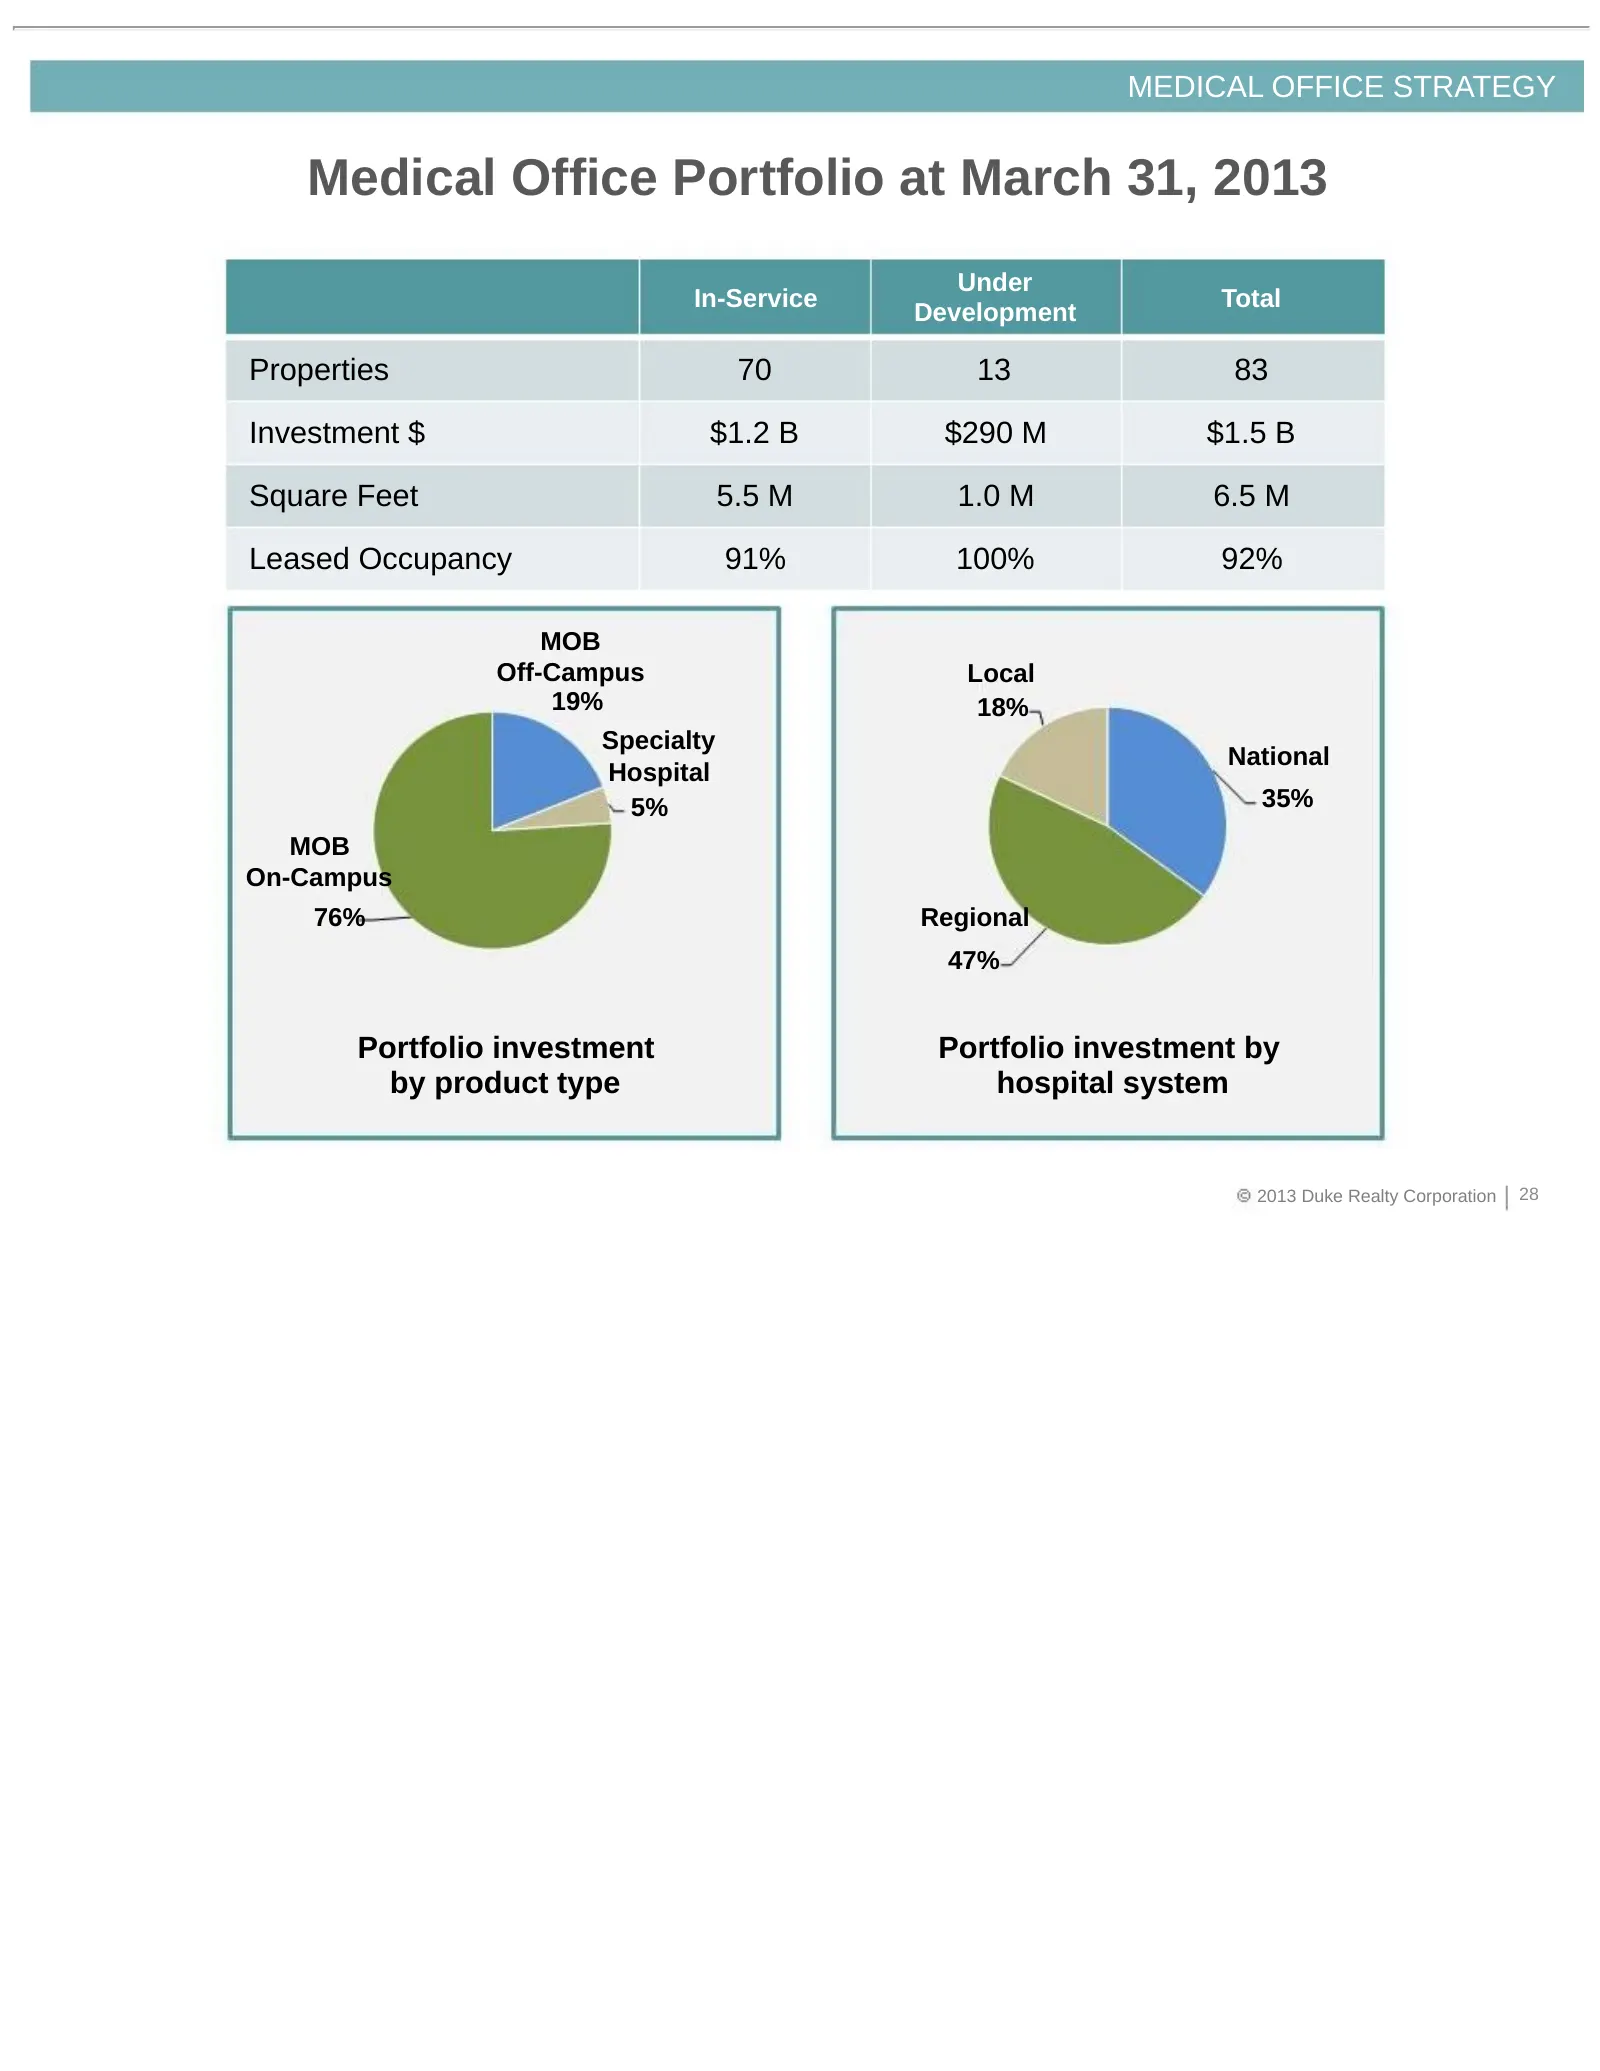
MEDICAL OFFICE STRATEGY Medical Office Portfolio at March 31, 2013 Under In-Service Total Development Properties 70 13 83 Investment $ $1.2 B $290 M $1.5 B Square Feet 5.5 M 1.0 M 6.5 M Leased Occupancy 91% 100% 92% MOB Off-Campus Local 19% 18% Specialty National Hospital 5% 35% MOB On-Campus 76% Re
Slide 29: Healthcare Development Pipeline
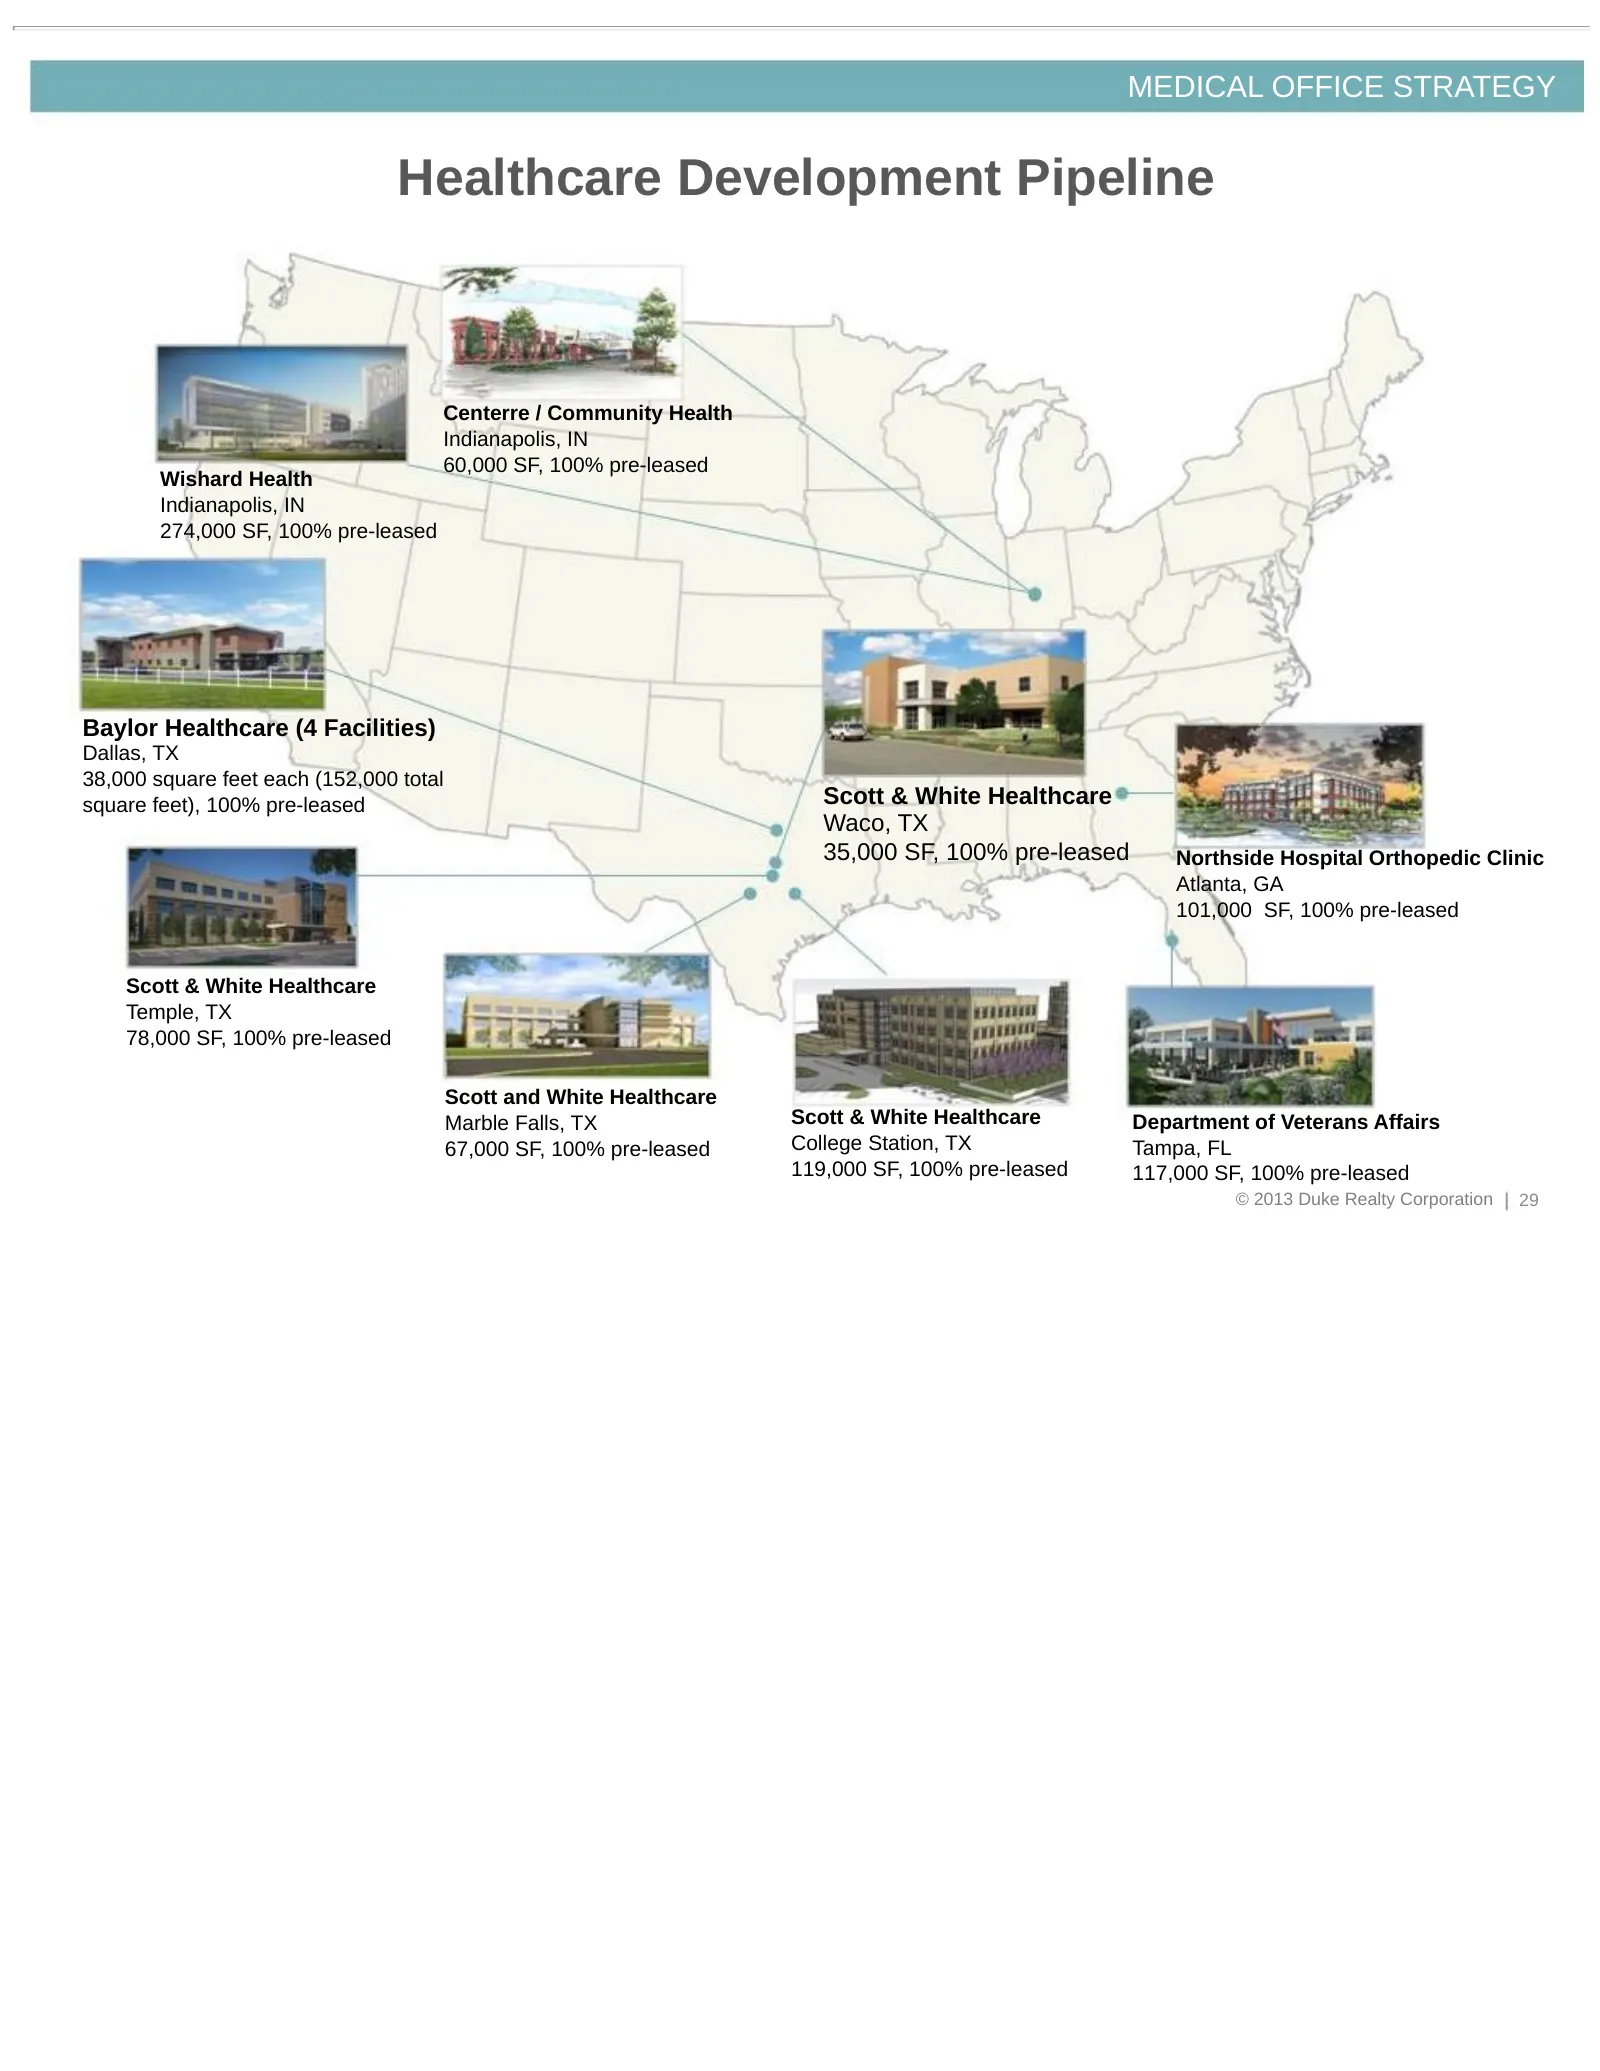
MEDICAL OFFICE STRATEGY Healthcare Development Pipeline Centerre / Community Health Indianapolis, IN 60,000 SF, 100% pre-leased Wishard Health Indianapolis, IN 274,000 SF, 100% pre-leased Baylor Healthcare (4 Facilities) Dallas, TX 38,000 square feet each (152,000 total square feet), 100% pre-leased
Slide 30: Top Health System Relationships
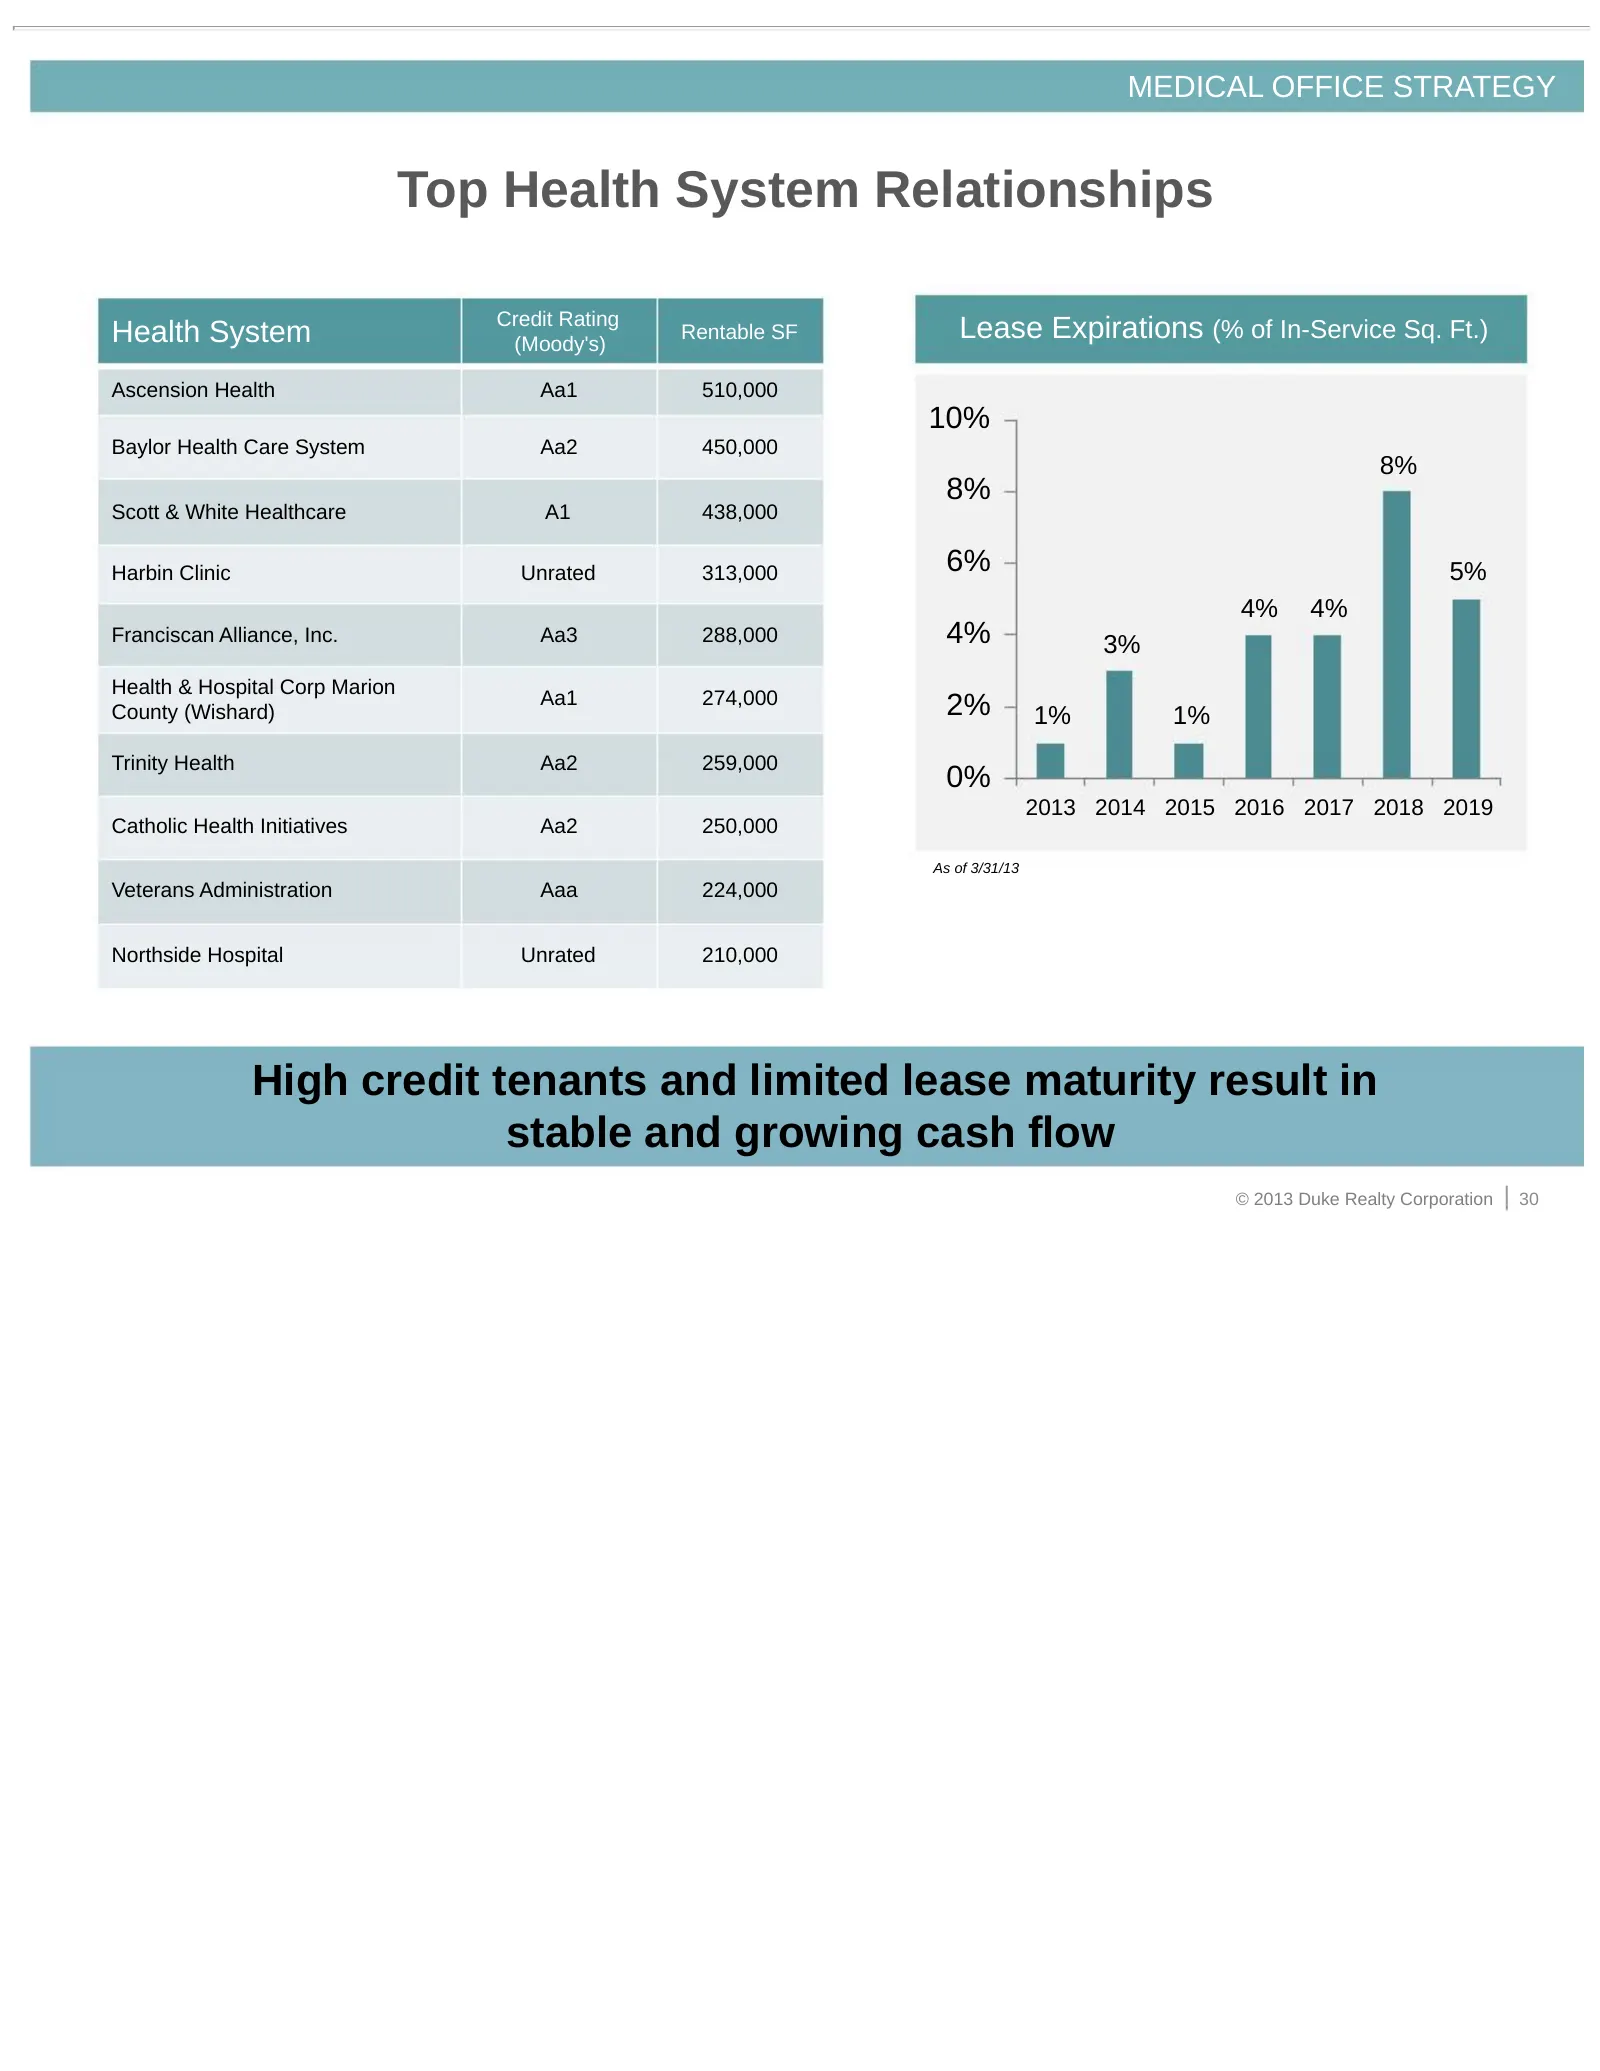
MEDICAL OFFICE STRATEGY Top Health System Relationships Credit Rating Health System (Moody's) Rentable SF Lease Expirations (% of In-Service Sq. Ft.) Ascension Health Aa1 510,000 10% Baylor Health Care System Aa2 450,000 8% 8% Scott & White Healthcare A1 438,000 Harbin Clinic Unrated 313,000 6% 5% 4
Slide 31: Strategic Benefits to Duke Realty
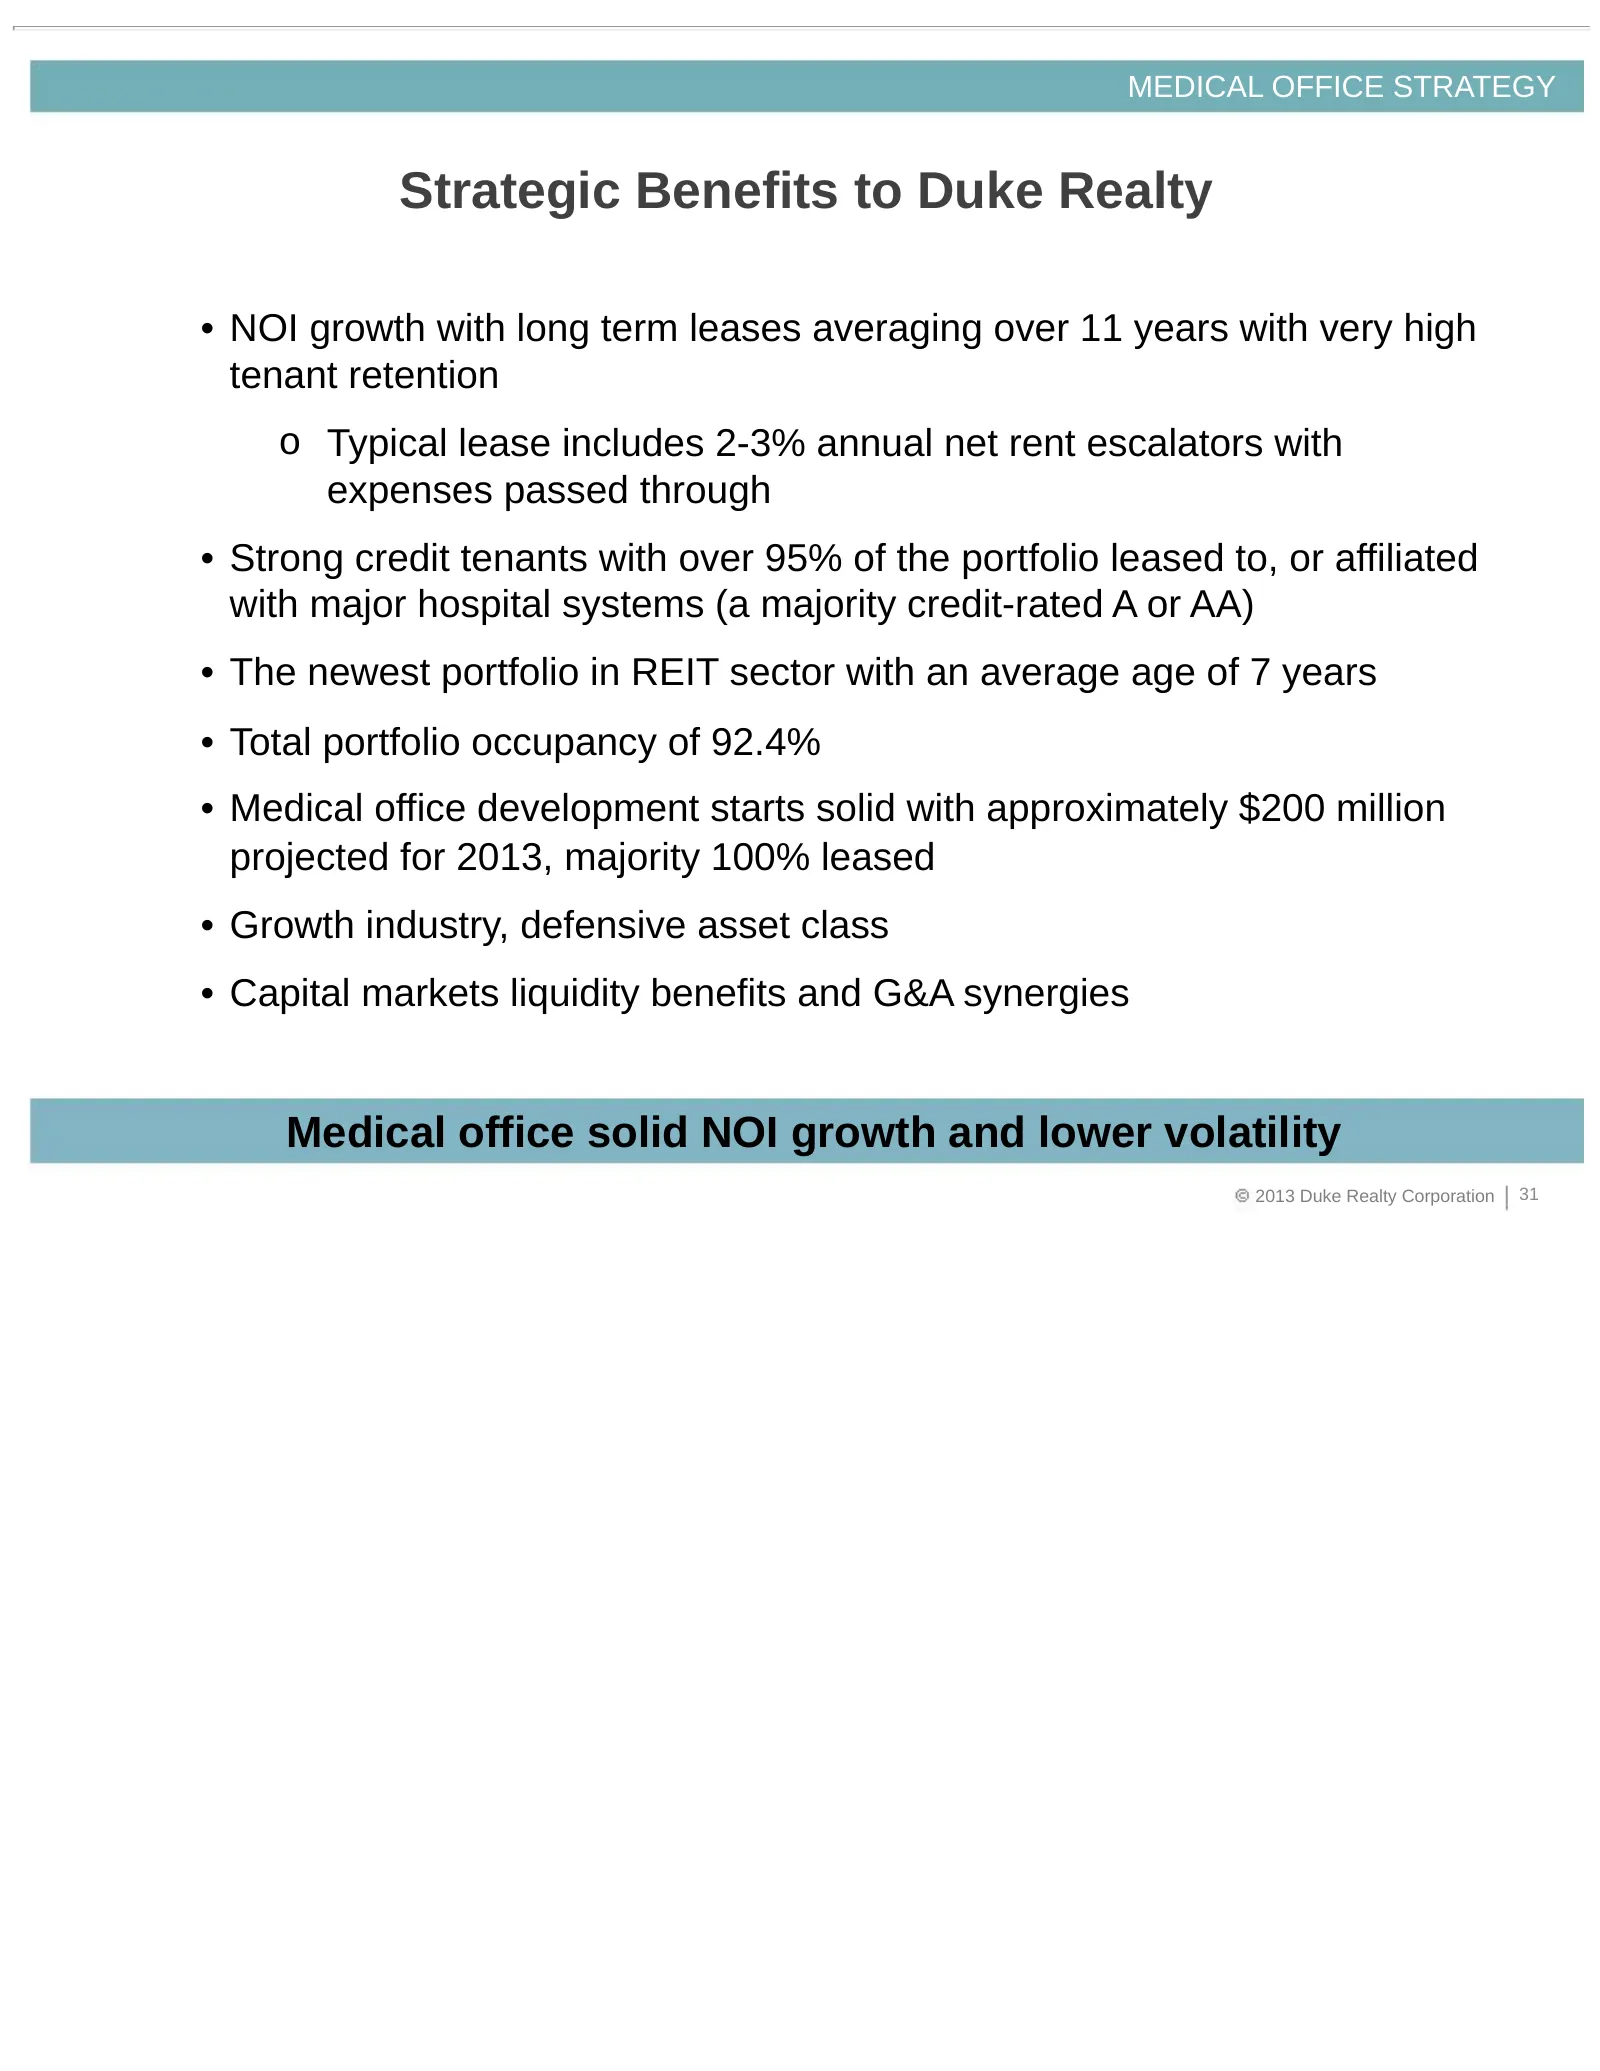
MEDICAL OFFICE STRATEGY Strategic Benefits to Duke Realty • NOI growth with long term leases averaging over 11 years with very high tenant retention o Typical lease includes 2-3% annual net rent escalators with expenses passed through • Strong credit tenants with over 95% of the portfolio leased to,
Slide 32: Capital Strategy and 2013 Guidance
CAPITAL STRATEGY AND 2013 GUIDANCE 2013 Duke Realty Corporation 32
Slide 33: Capital Strategy Focus
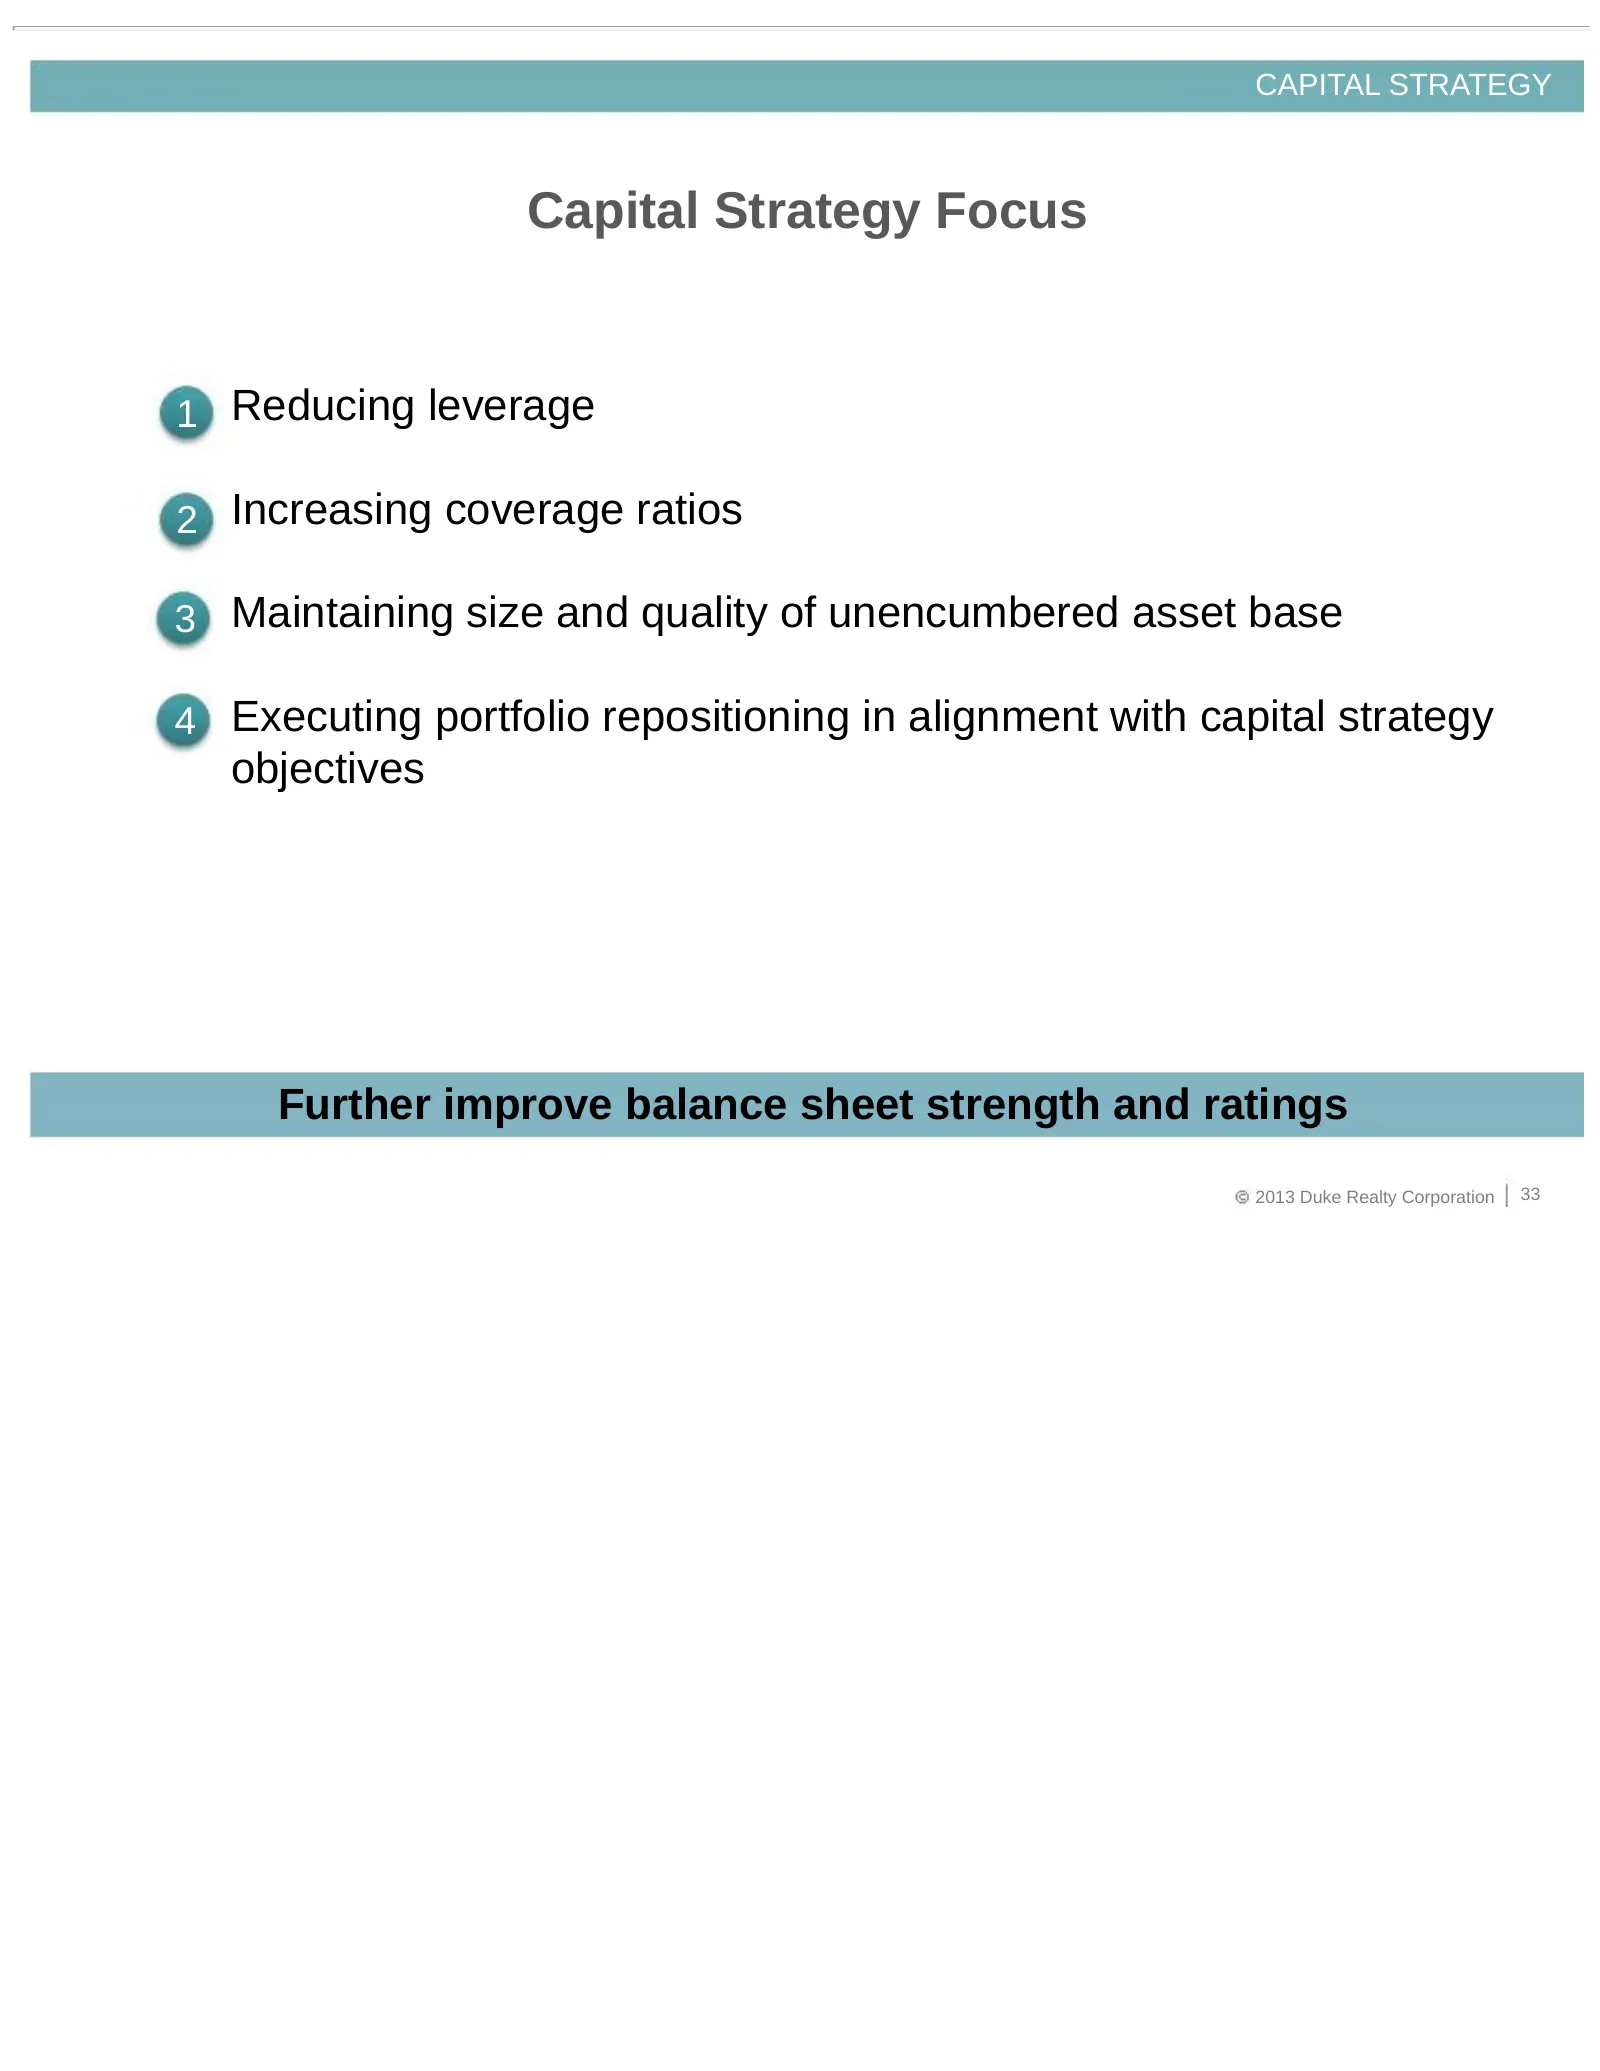
CAPITAL STRATEGY Capital Strategy Focus 1 Reducing leverage 2 Increasing coverage ratios 3 Maintaining size and quality of unencumbered asset base 4 Executing portfolio repositioning in alignment with capital strategy objectives Further improve balance sheet strength and ratings 2013 Duke Realty Cor
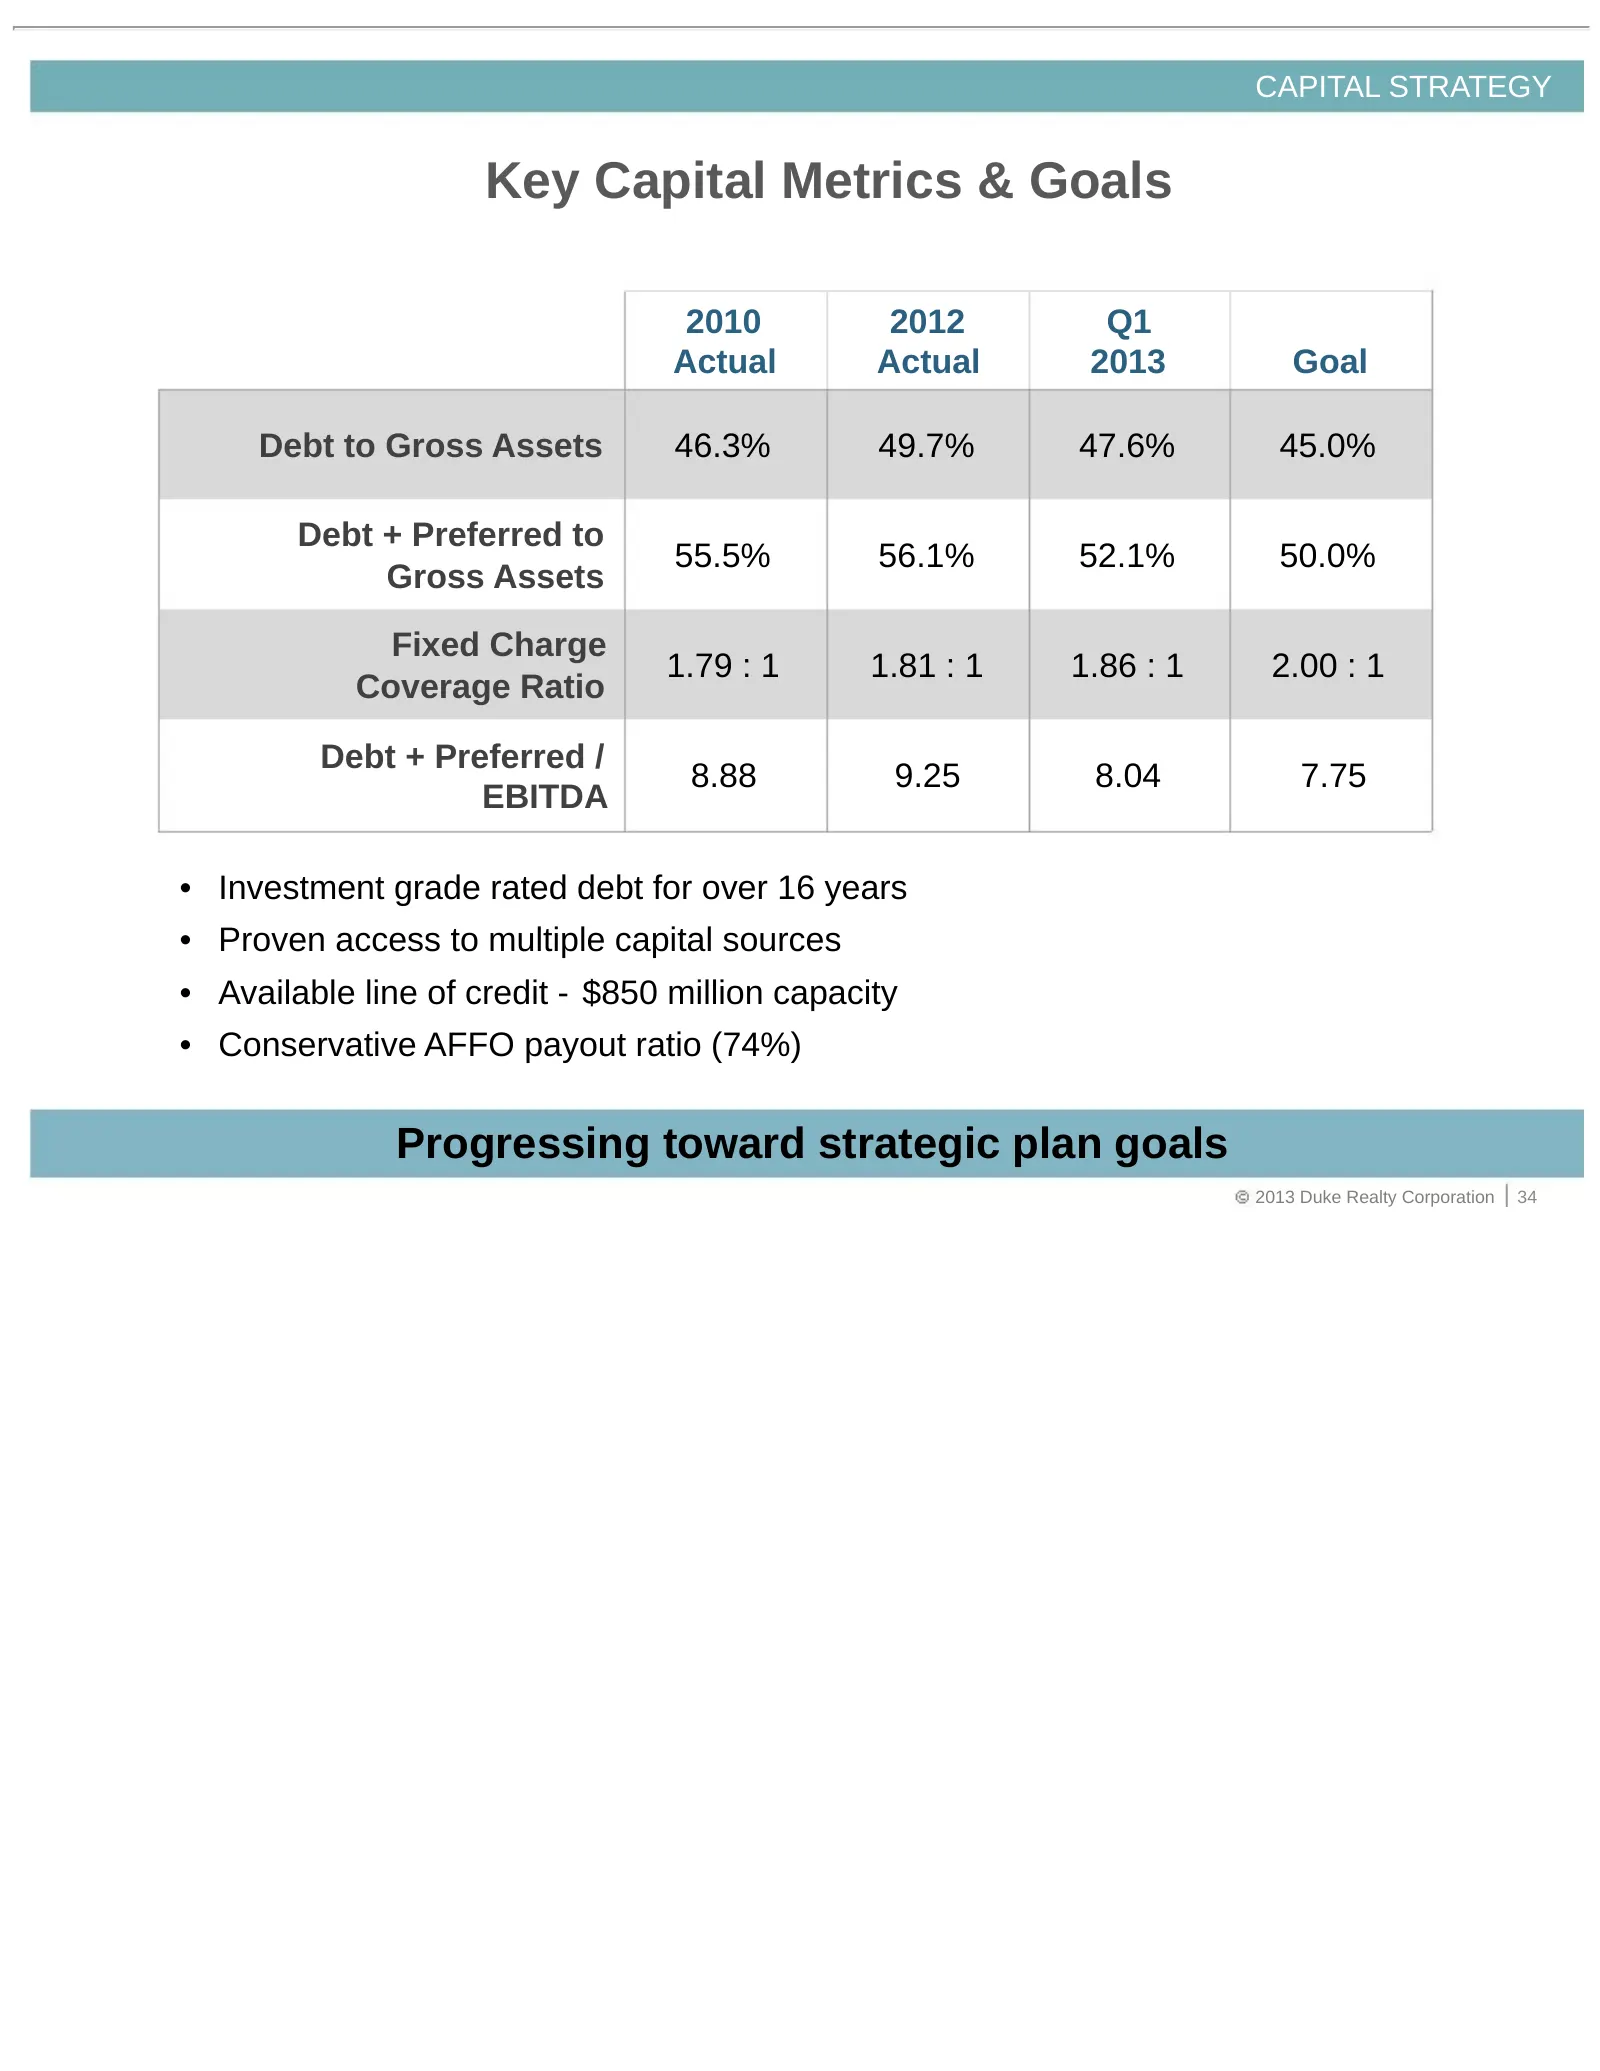
Slide 34: Key Capital Metrics & Goals
CAPITAL STRATEGY Key Capital Metrics & Goals 2010 2012 Q1 Actual Actual 2013 Goal Debt to Gross Assets 46.3% 49.7% 47.6% 45.0% Debt + Preferred to 55.5% 56.1% 52.1% 50.0% Gross Assets Fixed Charge 1.79 : 1 1.81 : 1 1.86 : 1 2.00 : 1 Coverage Ratio Debt + Preferred / 8.88 9.25 8.04 7.75 EBITDA • Inve
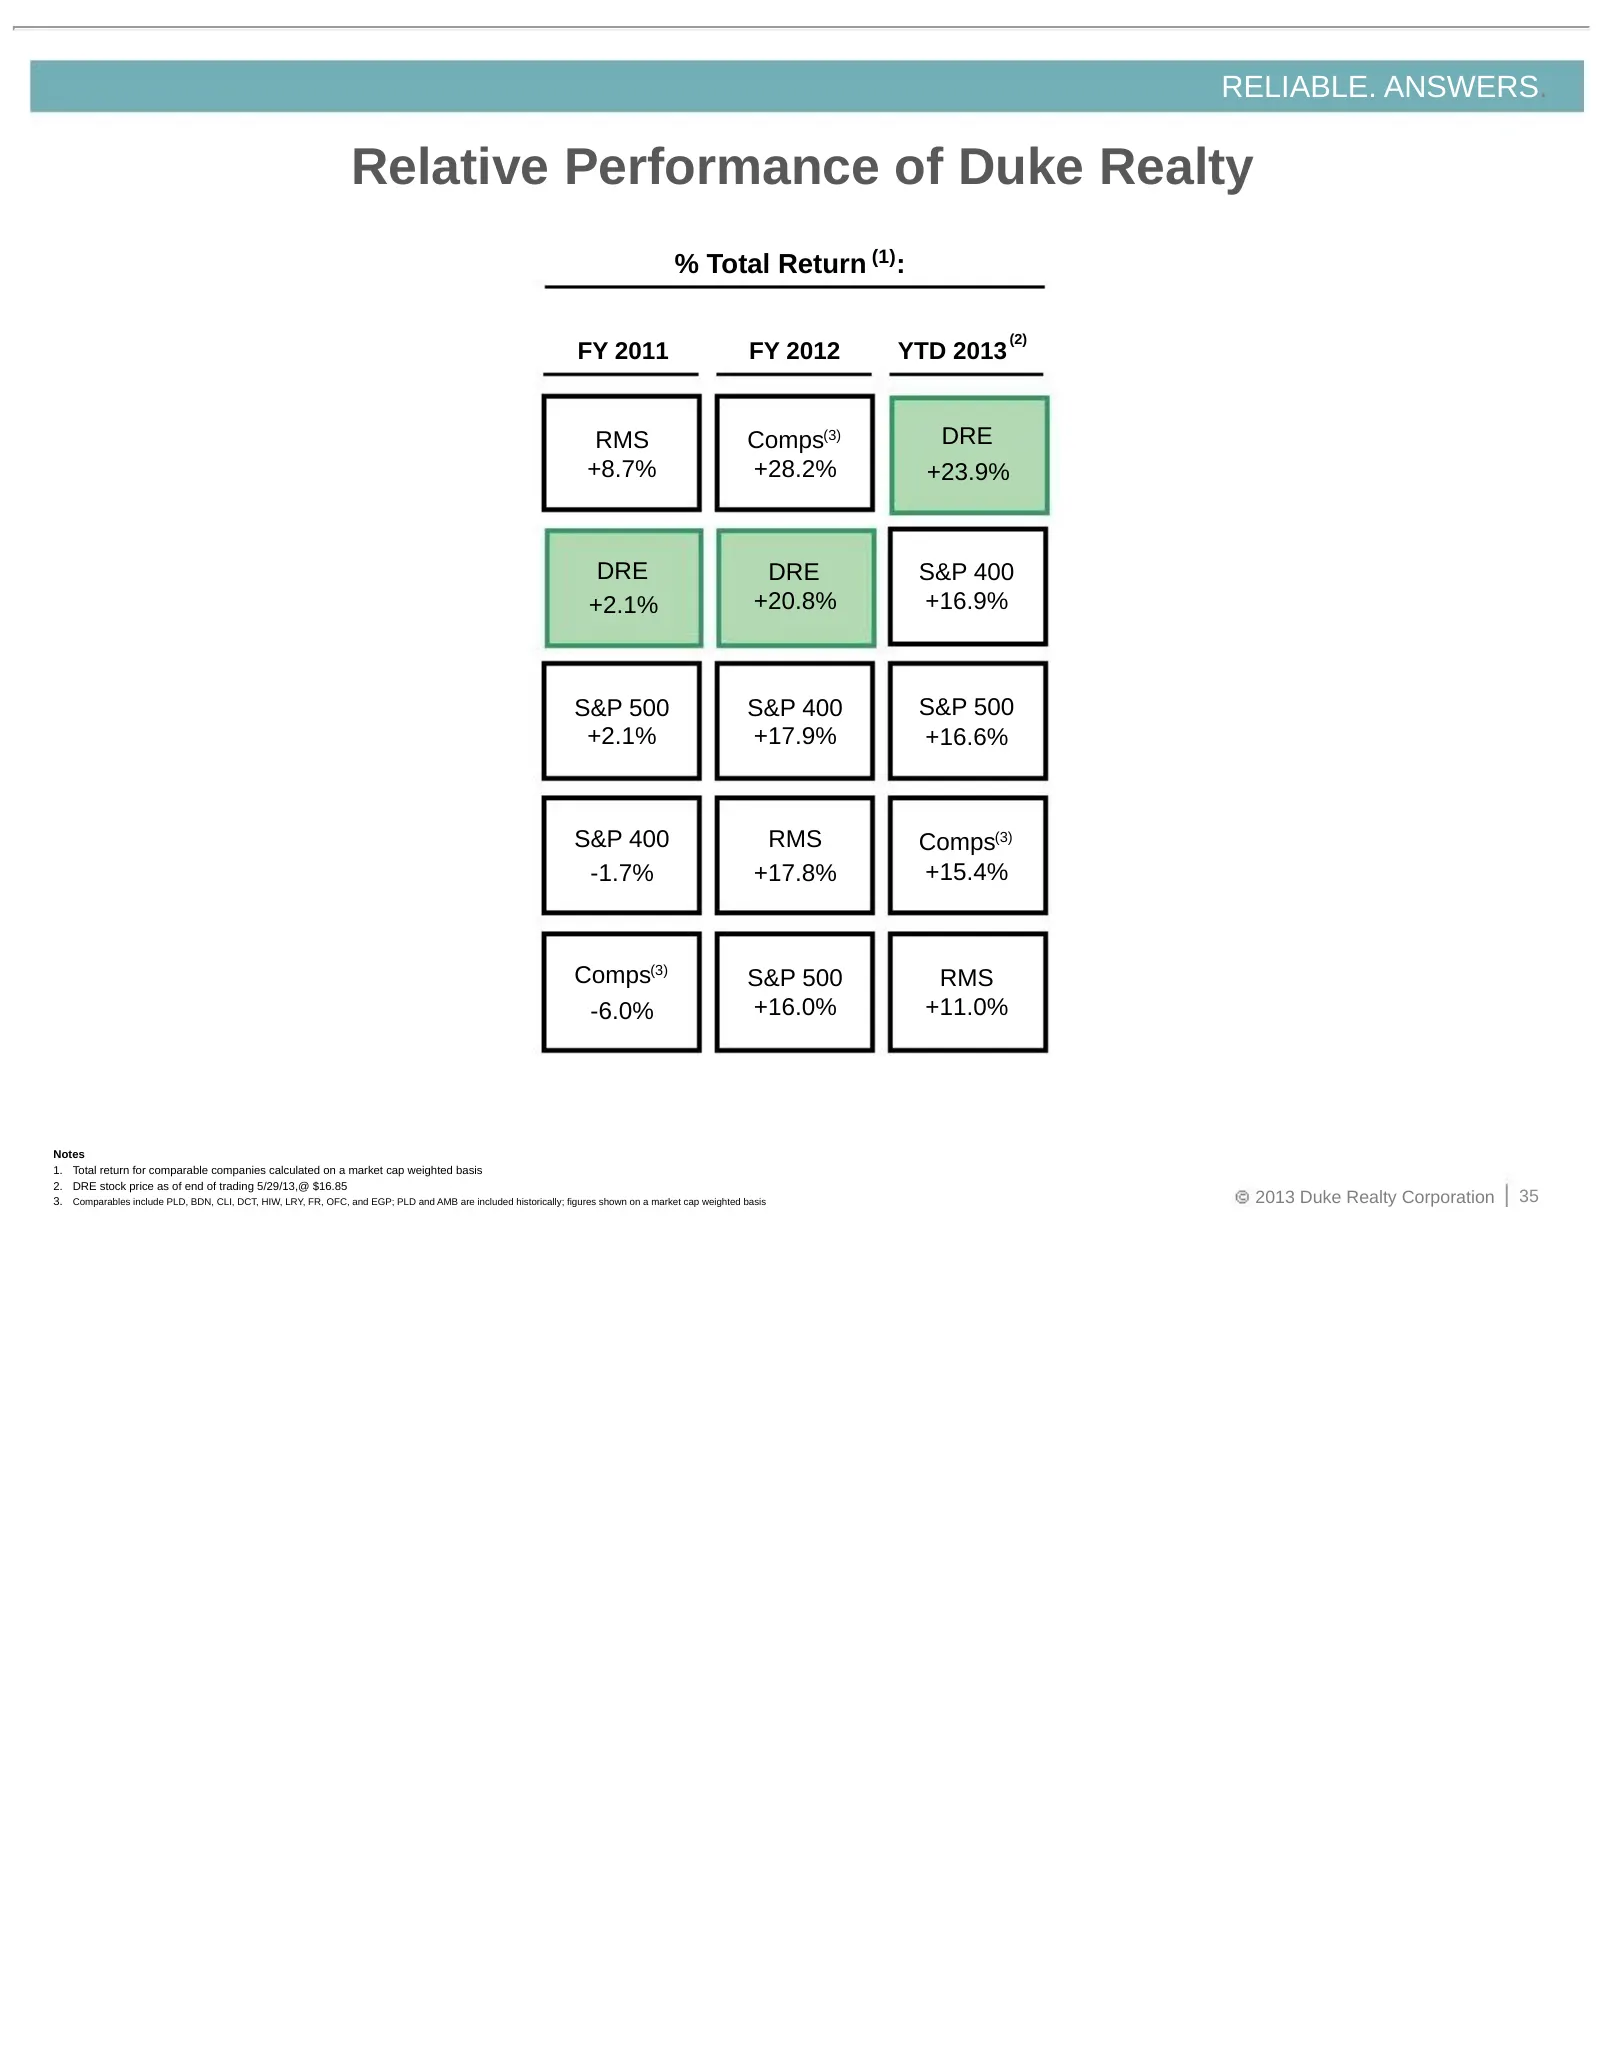
Slide 35: Relative Performance of Duke Realty
RELIABLE. ANSWERS. Relative Performance of Duke Realty % Total Return (1): (2) FY 2011 FY 2012 YTD 2013 RMS Comps(3) DRE +8.7% +28.2% +23.9% DRE DRE S&P 400 +2.1% +20.8% +16.9% S&P 500 S&P 400 S&P 500 +2.1% +17.9% +16.6% S&P 400 RMS Comps(3) -1.7% +17.8% +15.4% Comps(3) S&P 500 RMS -6.0% +16.0% +11.
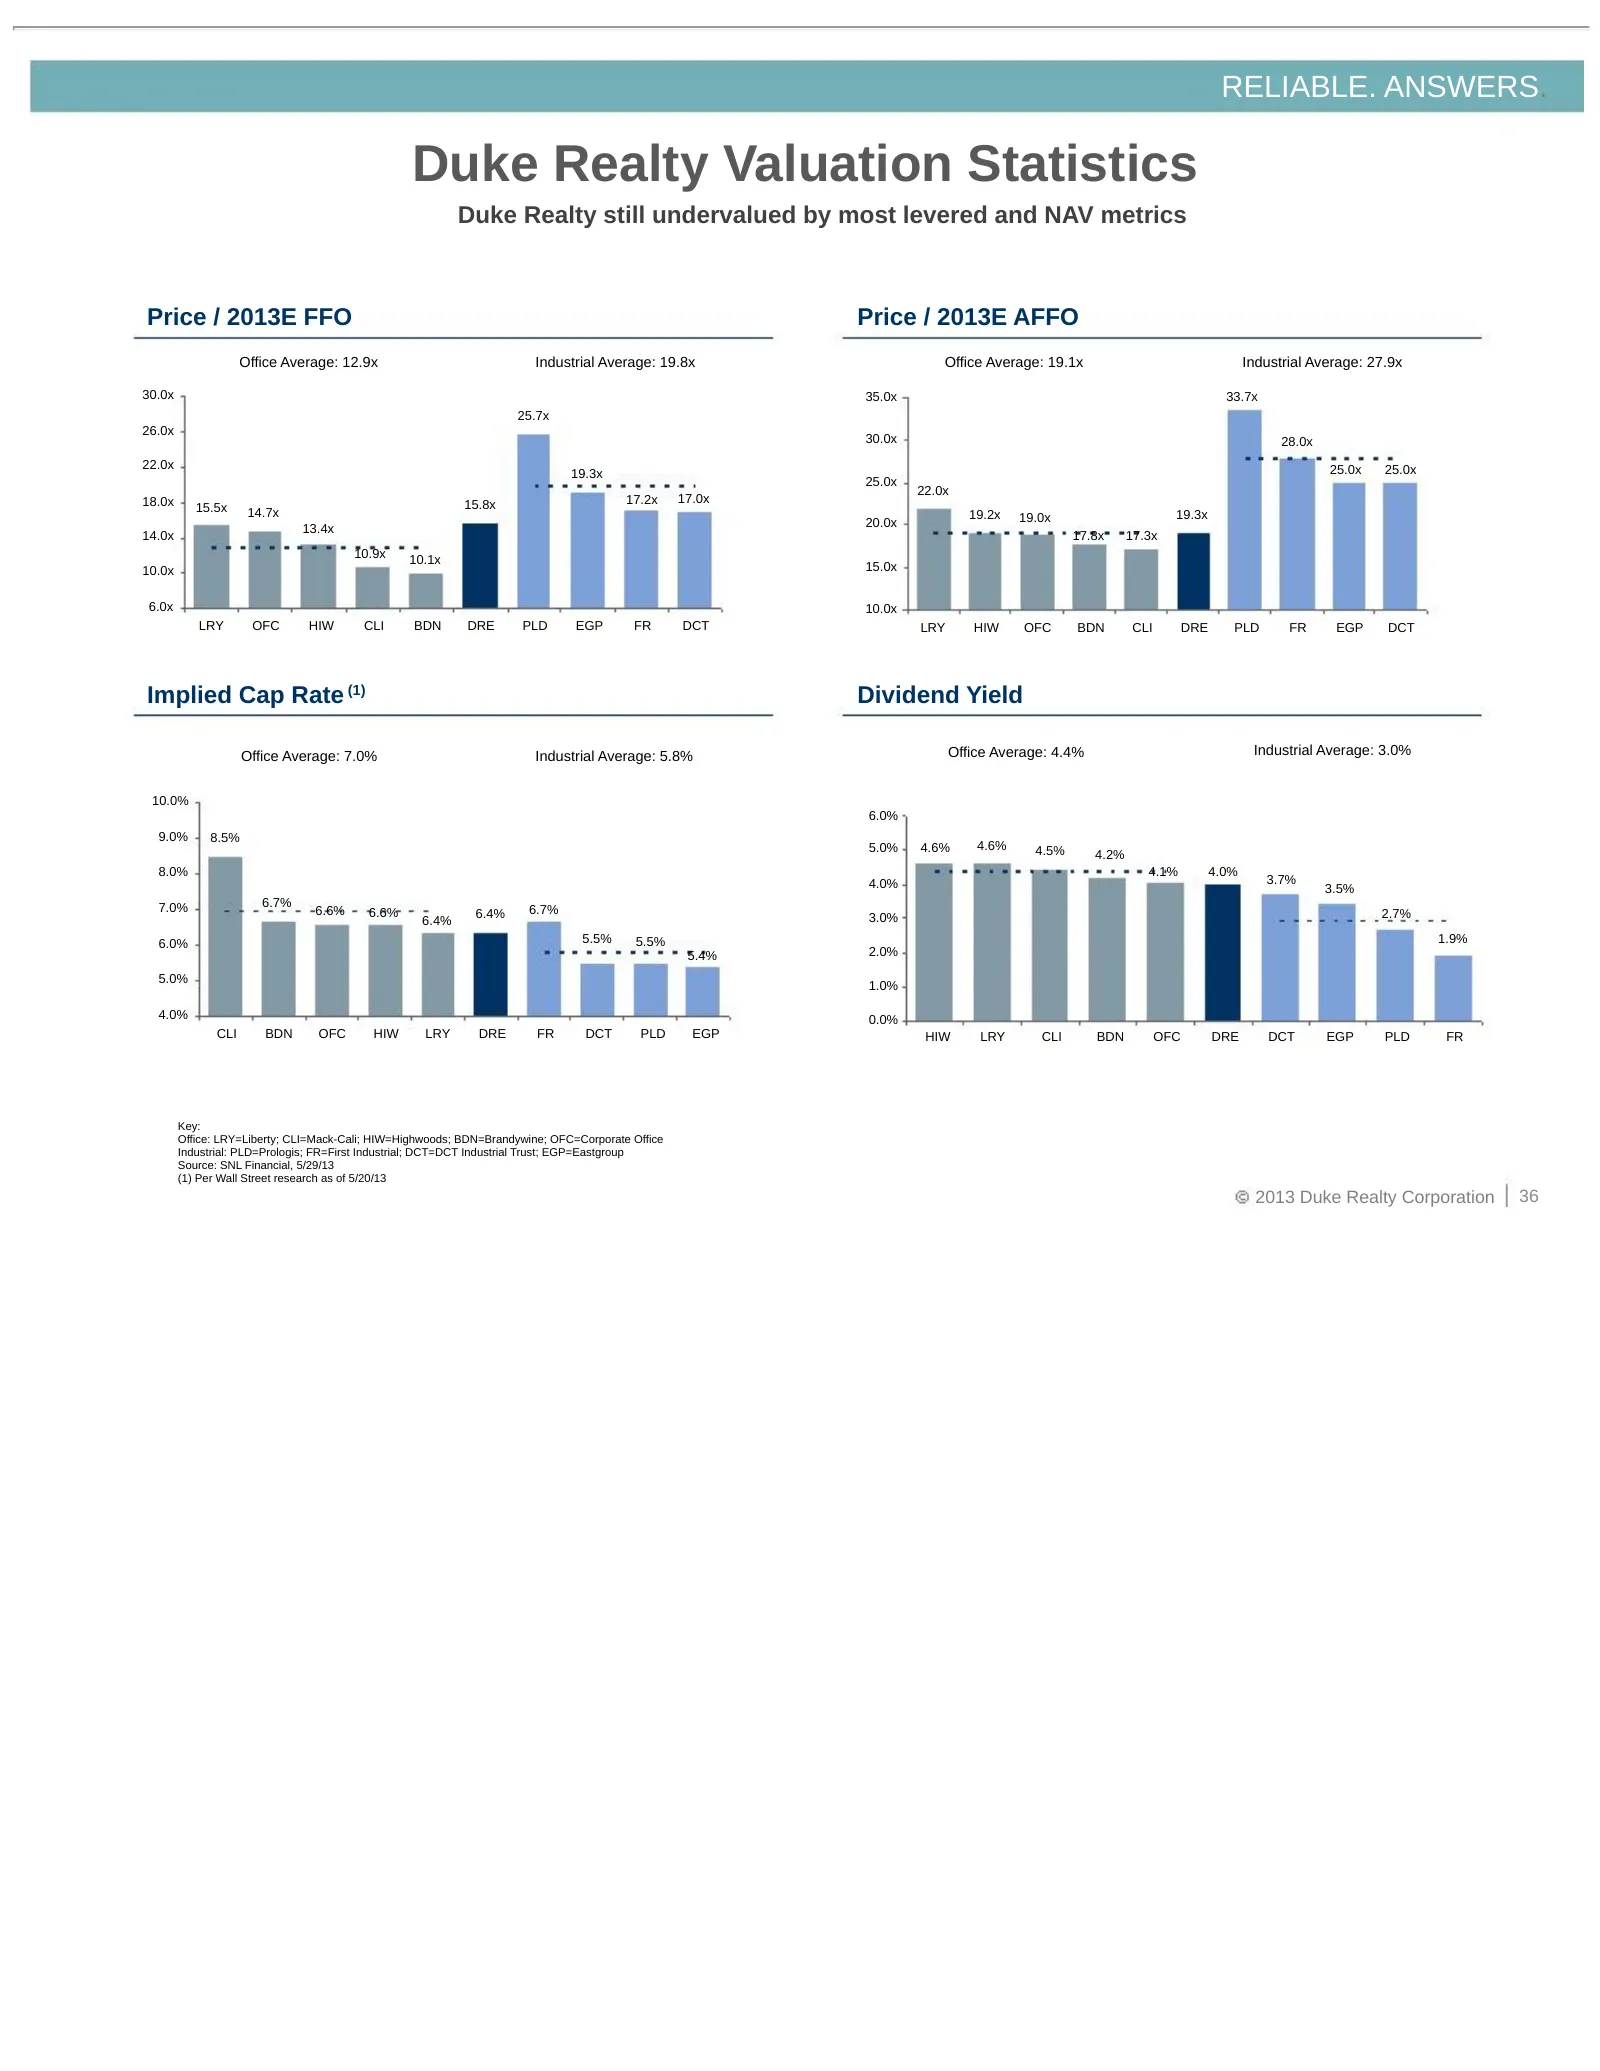
Slide 36: Duke Realty Valuation Statistics
RELIABLE. ANSWERS. Duke Realty Valuation Statistics Duke Realty still undervalued by most levered and NAV metrics Price / 2013E FFO Price / 2013E AFFO Office Average: 12.9x Industrial Average: 19.8x Office Average: 19.1x Industrial Average: 27.9x 30.0x 35.0x 33.7x 25.7x 26.0x 30.0x 28.0x 22.0x 25.0x
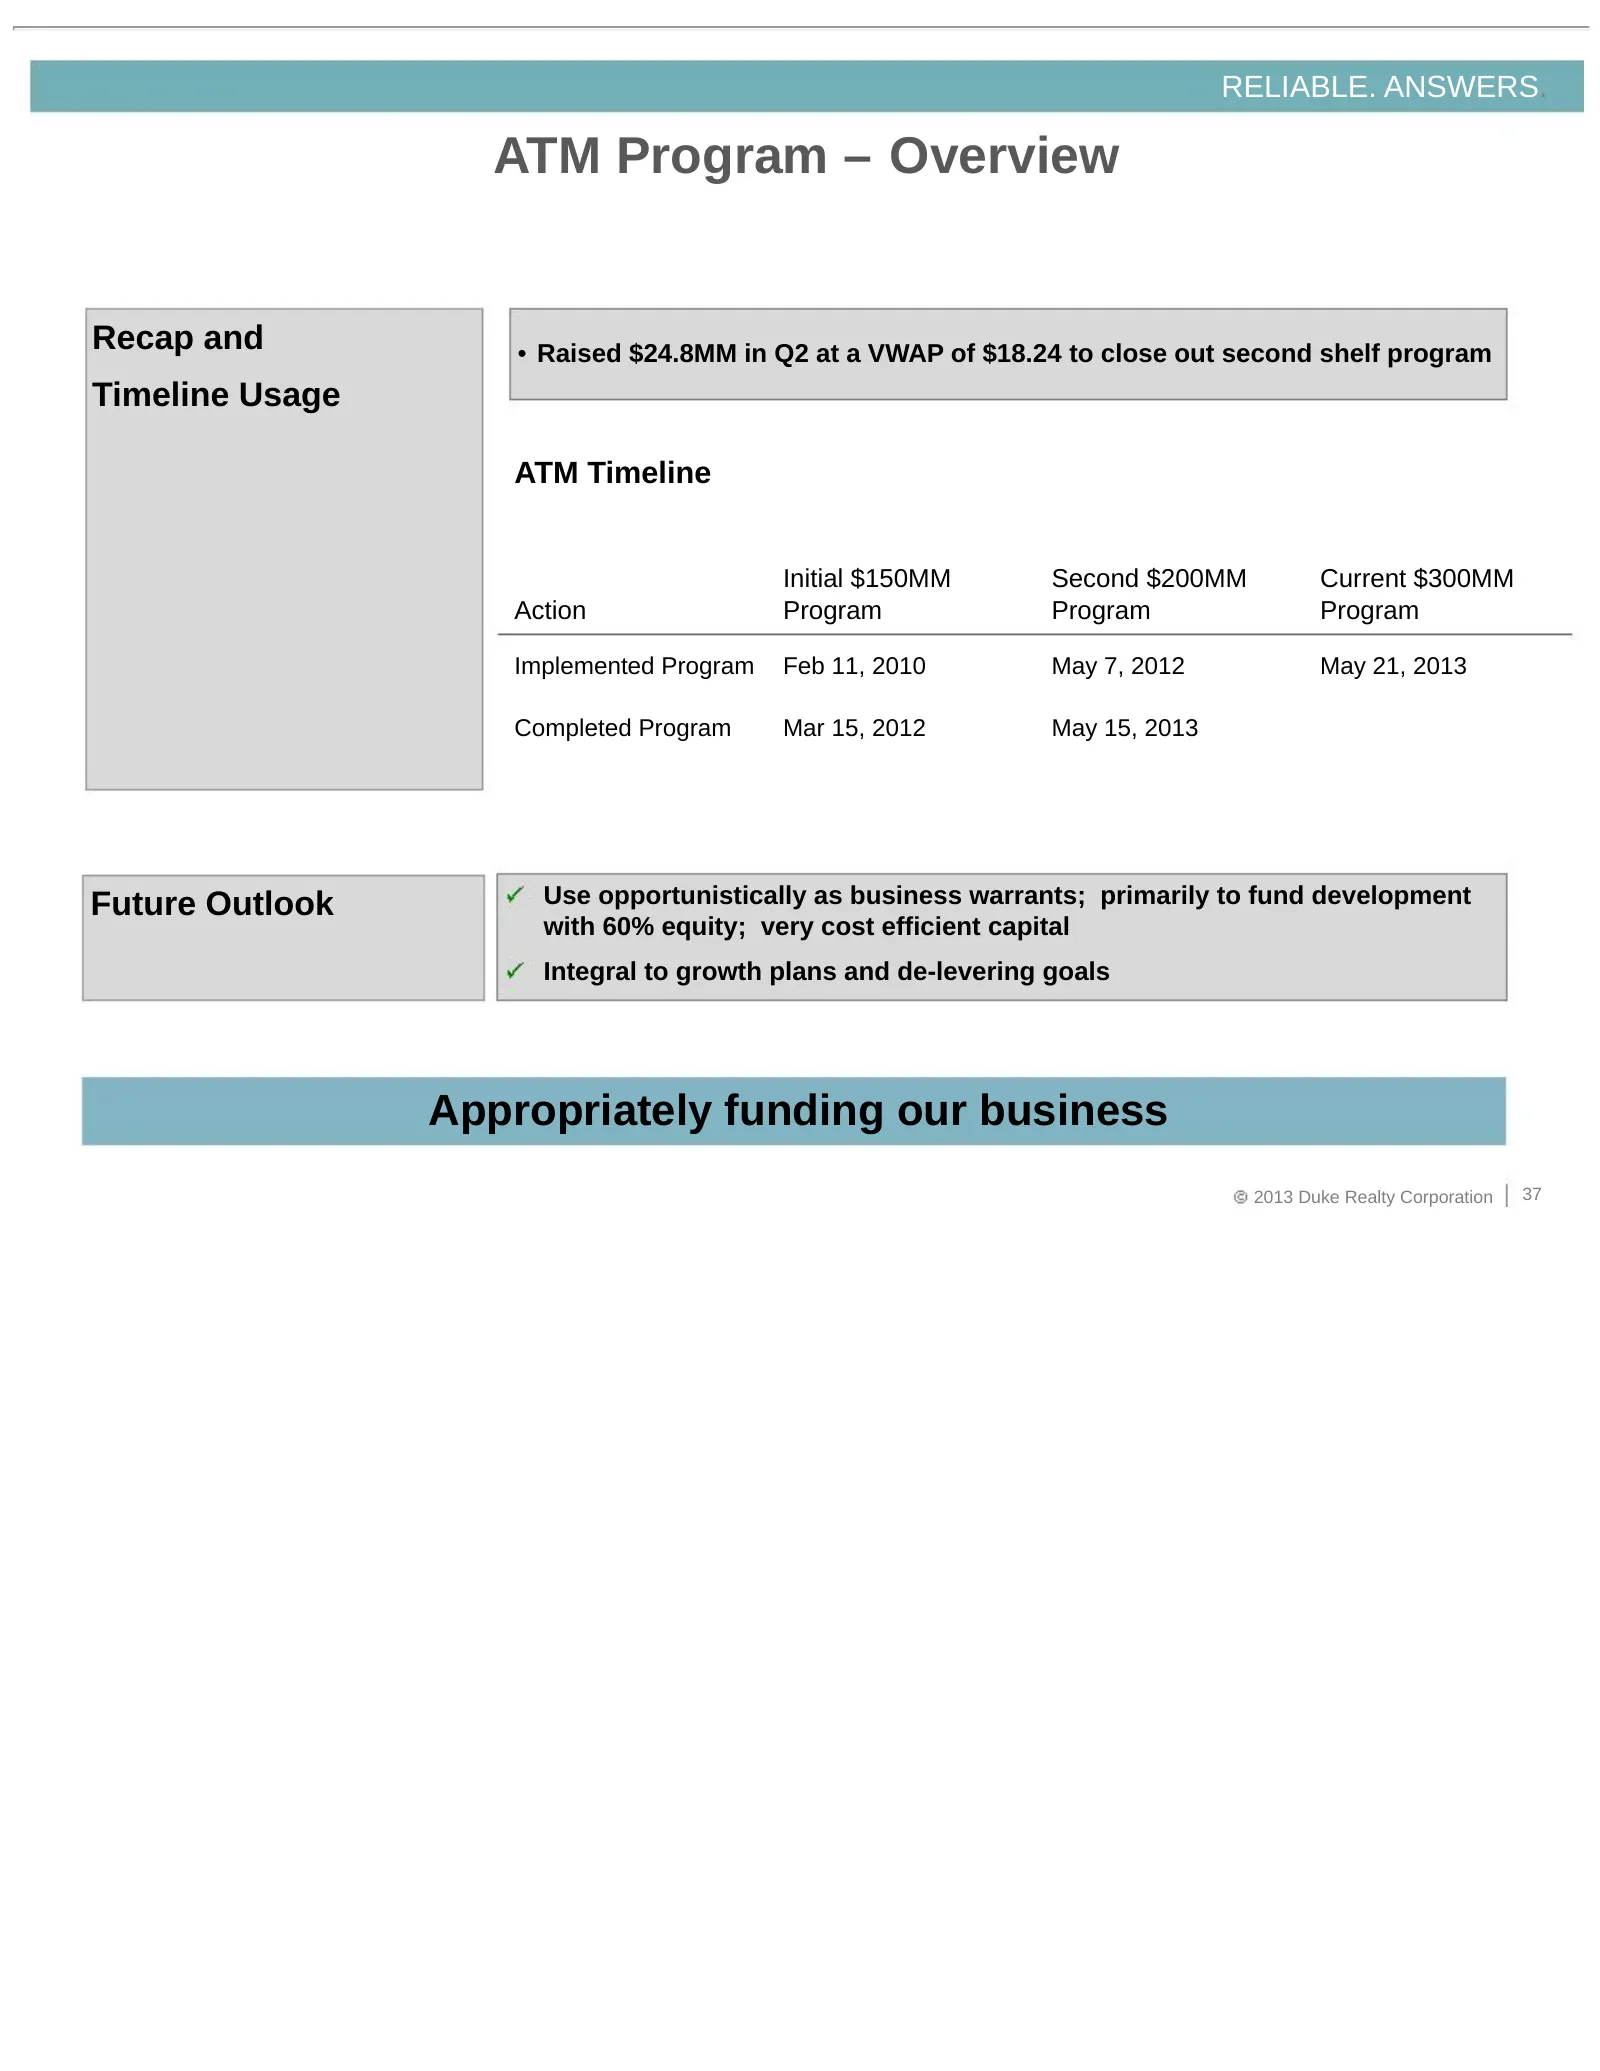
Slide 37: ATM Program – Overview
RELIABLE. ANSWERS. ATM Program – Overview Recap and • Raised $24.8MM in Q2 at a VWAP of $18.24 to close out second shelf program Timeline Usage ATM Timeline Initial $150MM Second $200MM Current $300MM Action Program Program Program Implemented Program Feb 11, 2010 May 7, 2012 May 21, 2013 Completed
Slide 38: Liquidity Position
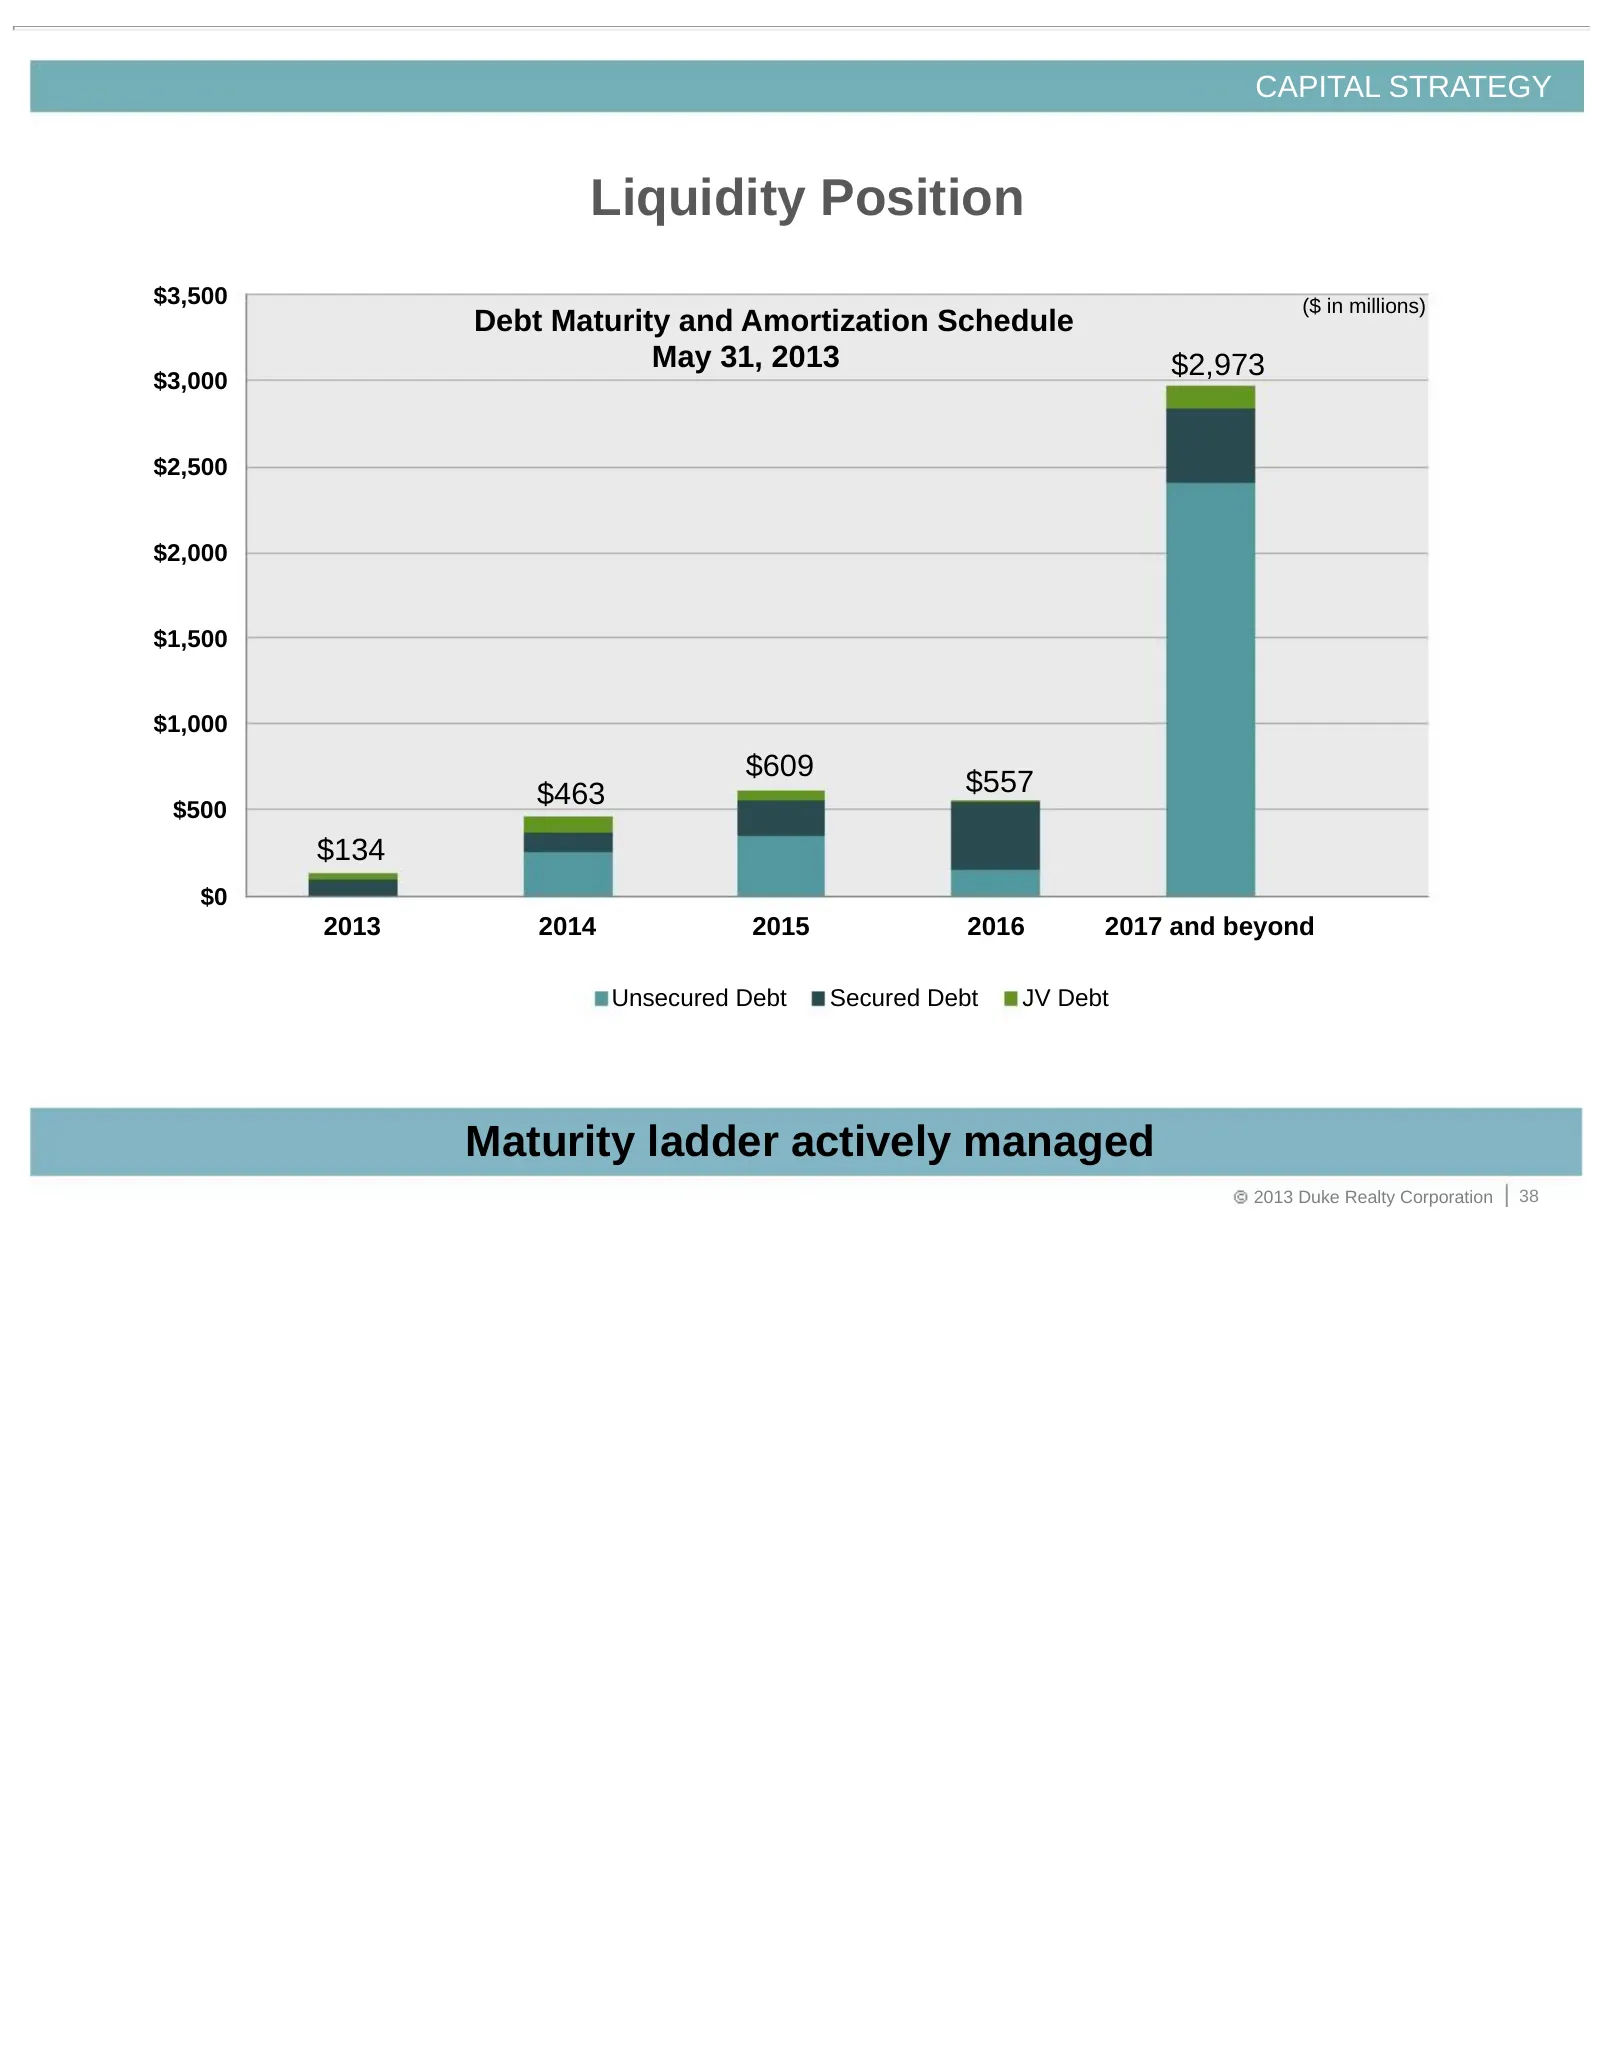
CAPITAL STRATEGY Liquidity Position $3,500 ($ in millions) Debt Maturity and Amortization Schedule May 31, 2013 $2,973 $3,000 $2,500 $2,000 $1,500 $1,000 $609 $463 $557 $500 $134 $0 2013 2014 2015 2016 2017 and beyond Unsecured Debt Secured Debt JV Debt Maturity ladder actively managed 2013 Duke Rea
Slide 39: 2013 Range of Estimates
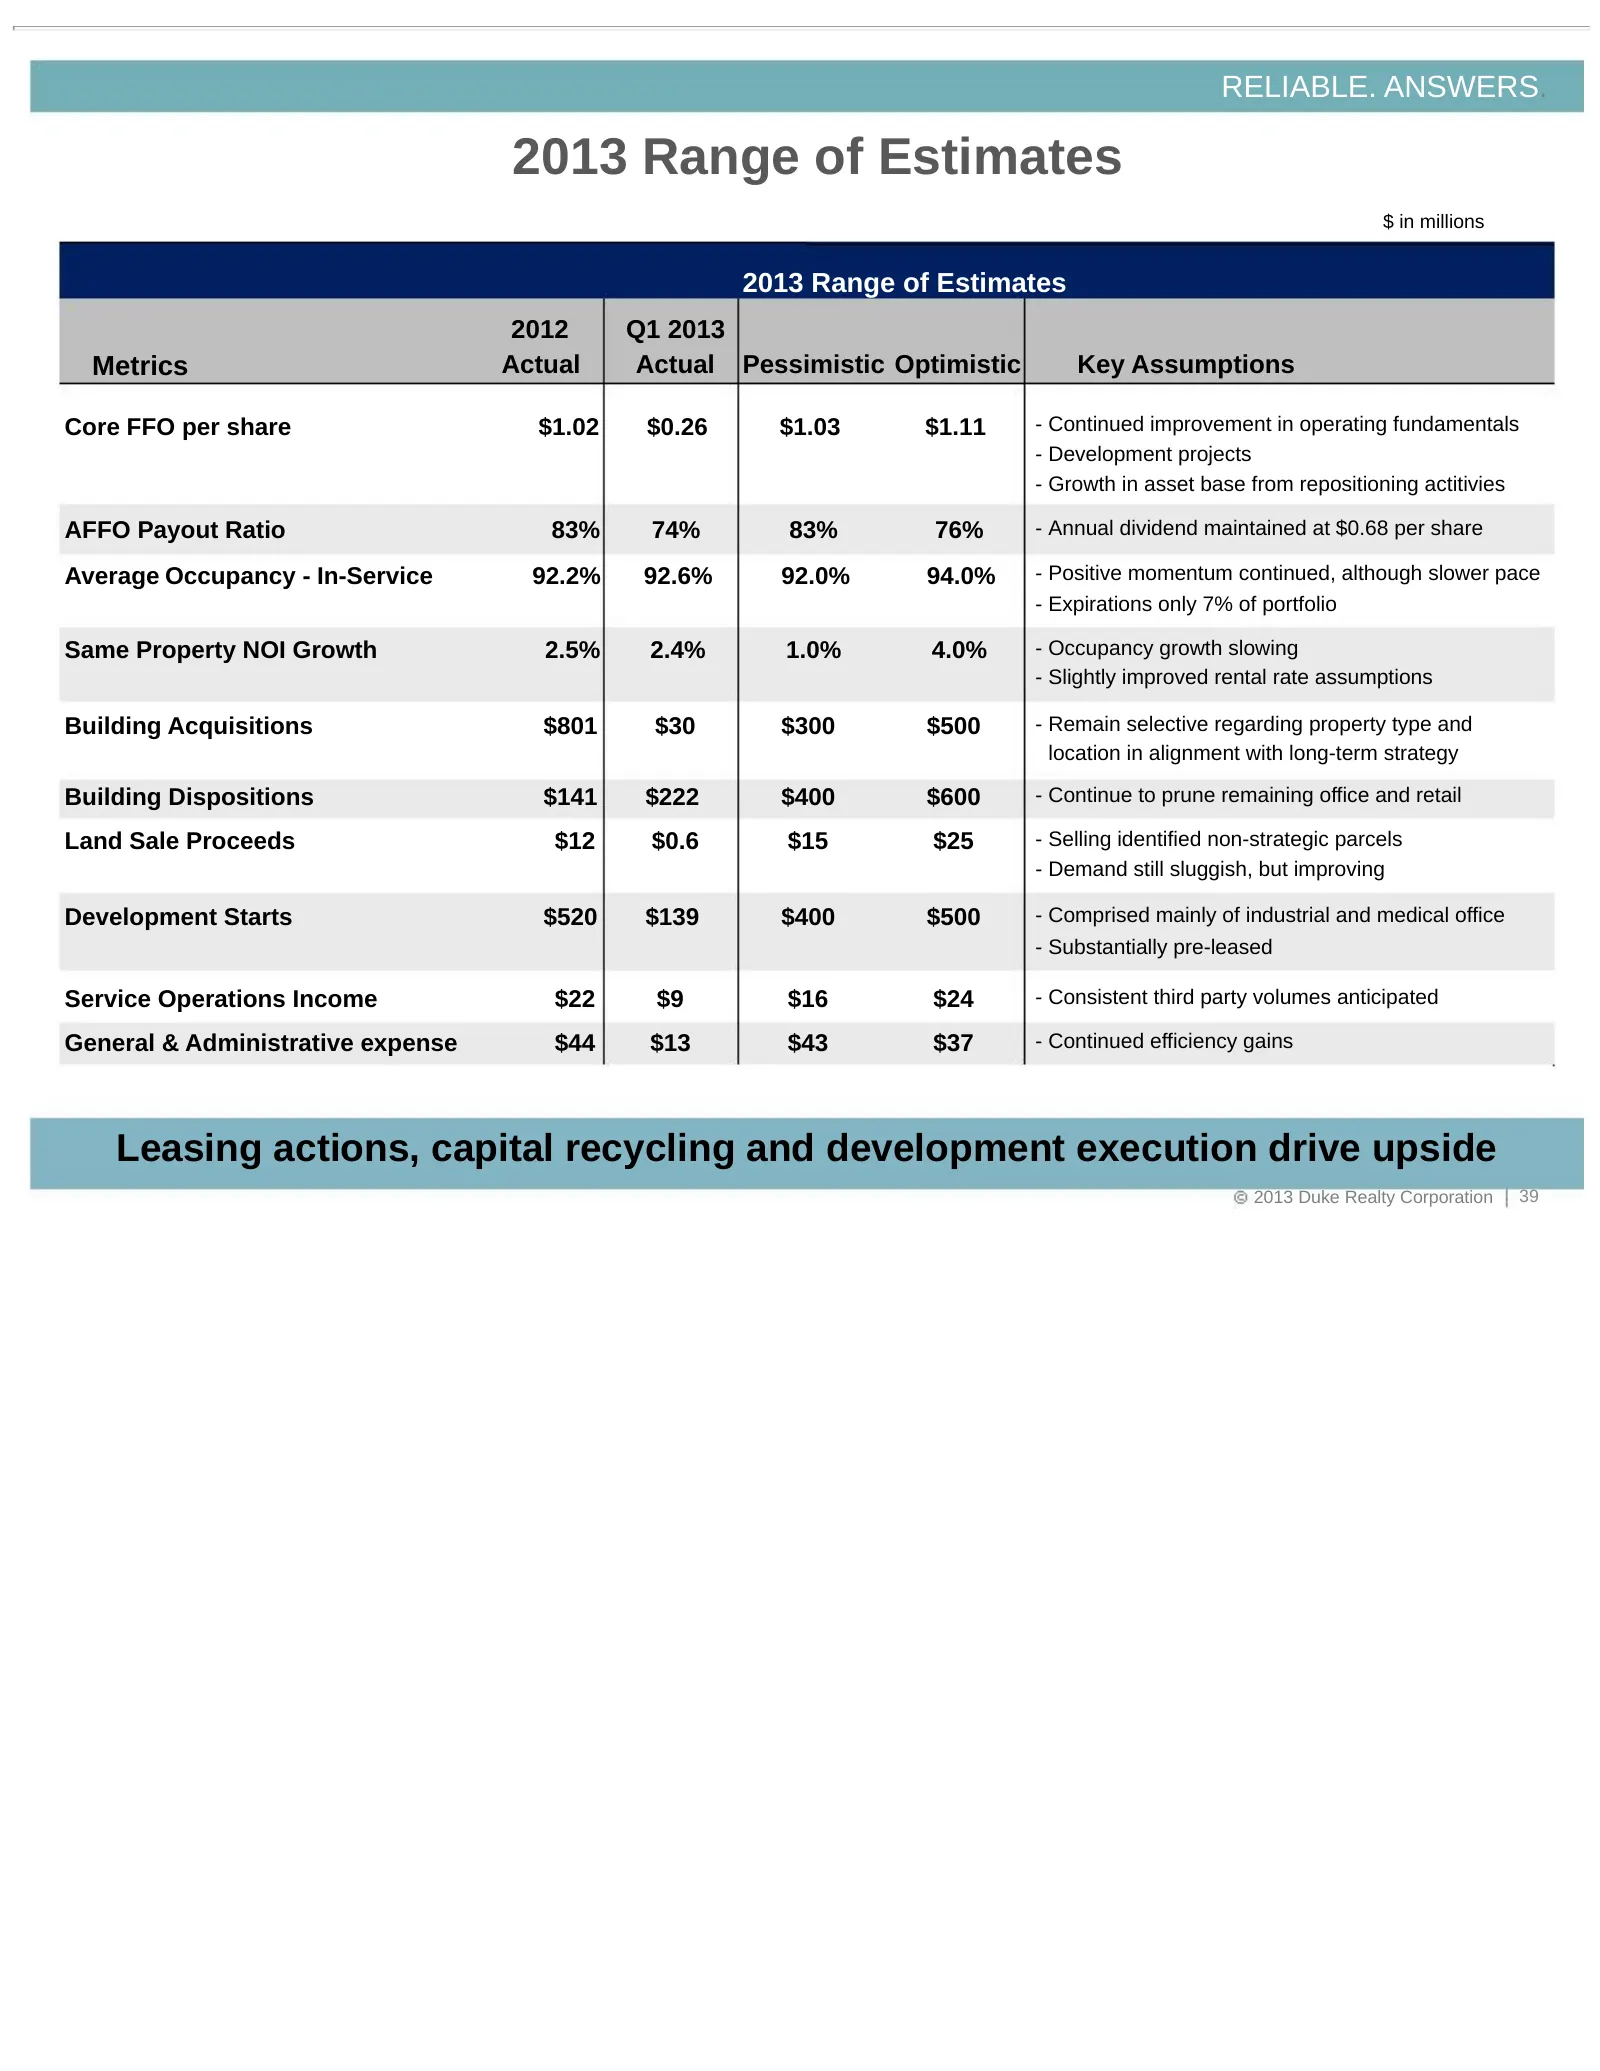
RELIABLE. ANSWERS. 2013 Range of Estimates $ in millions 2013 Range of Estimates 2012 Q1 2013 Metrics Actual Actual Pessimistic Optimistic Key Assumptions Core FFO per share $1.02 $0.26 $1.03 $1.11 - Continued improvement in operating fundamentals - Development projects - Growth in asset base from r
Slide 40: Why Duke Realty?
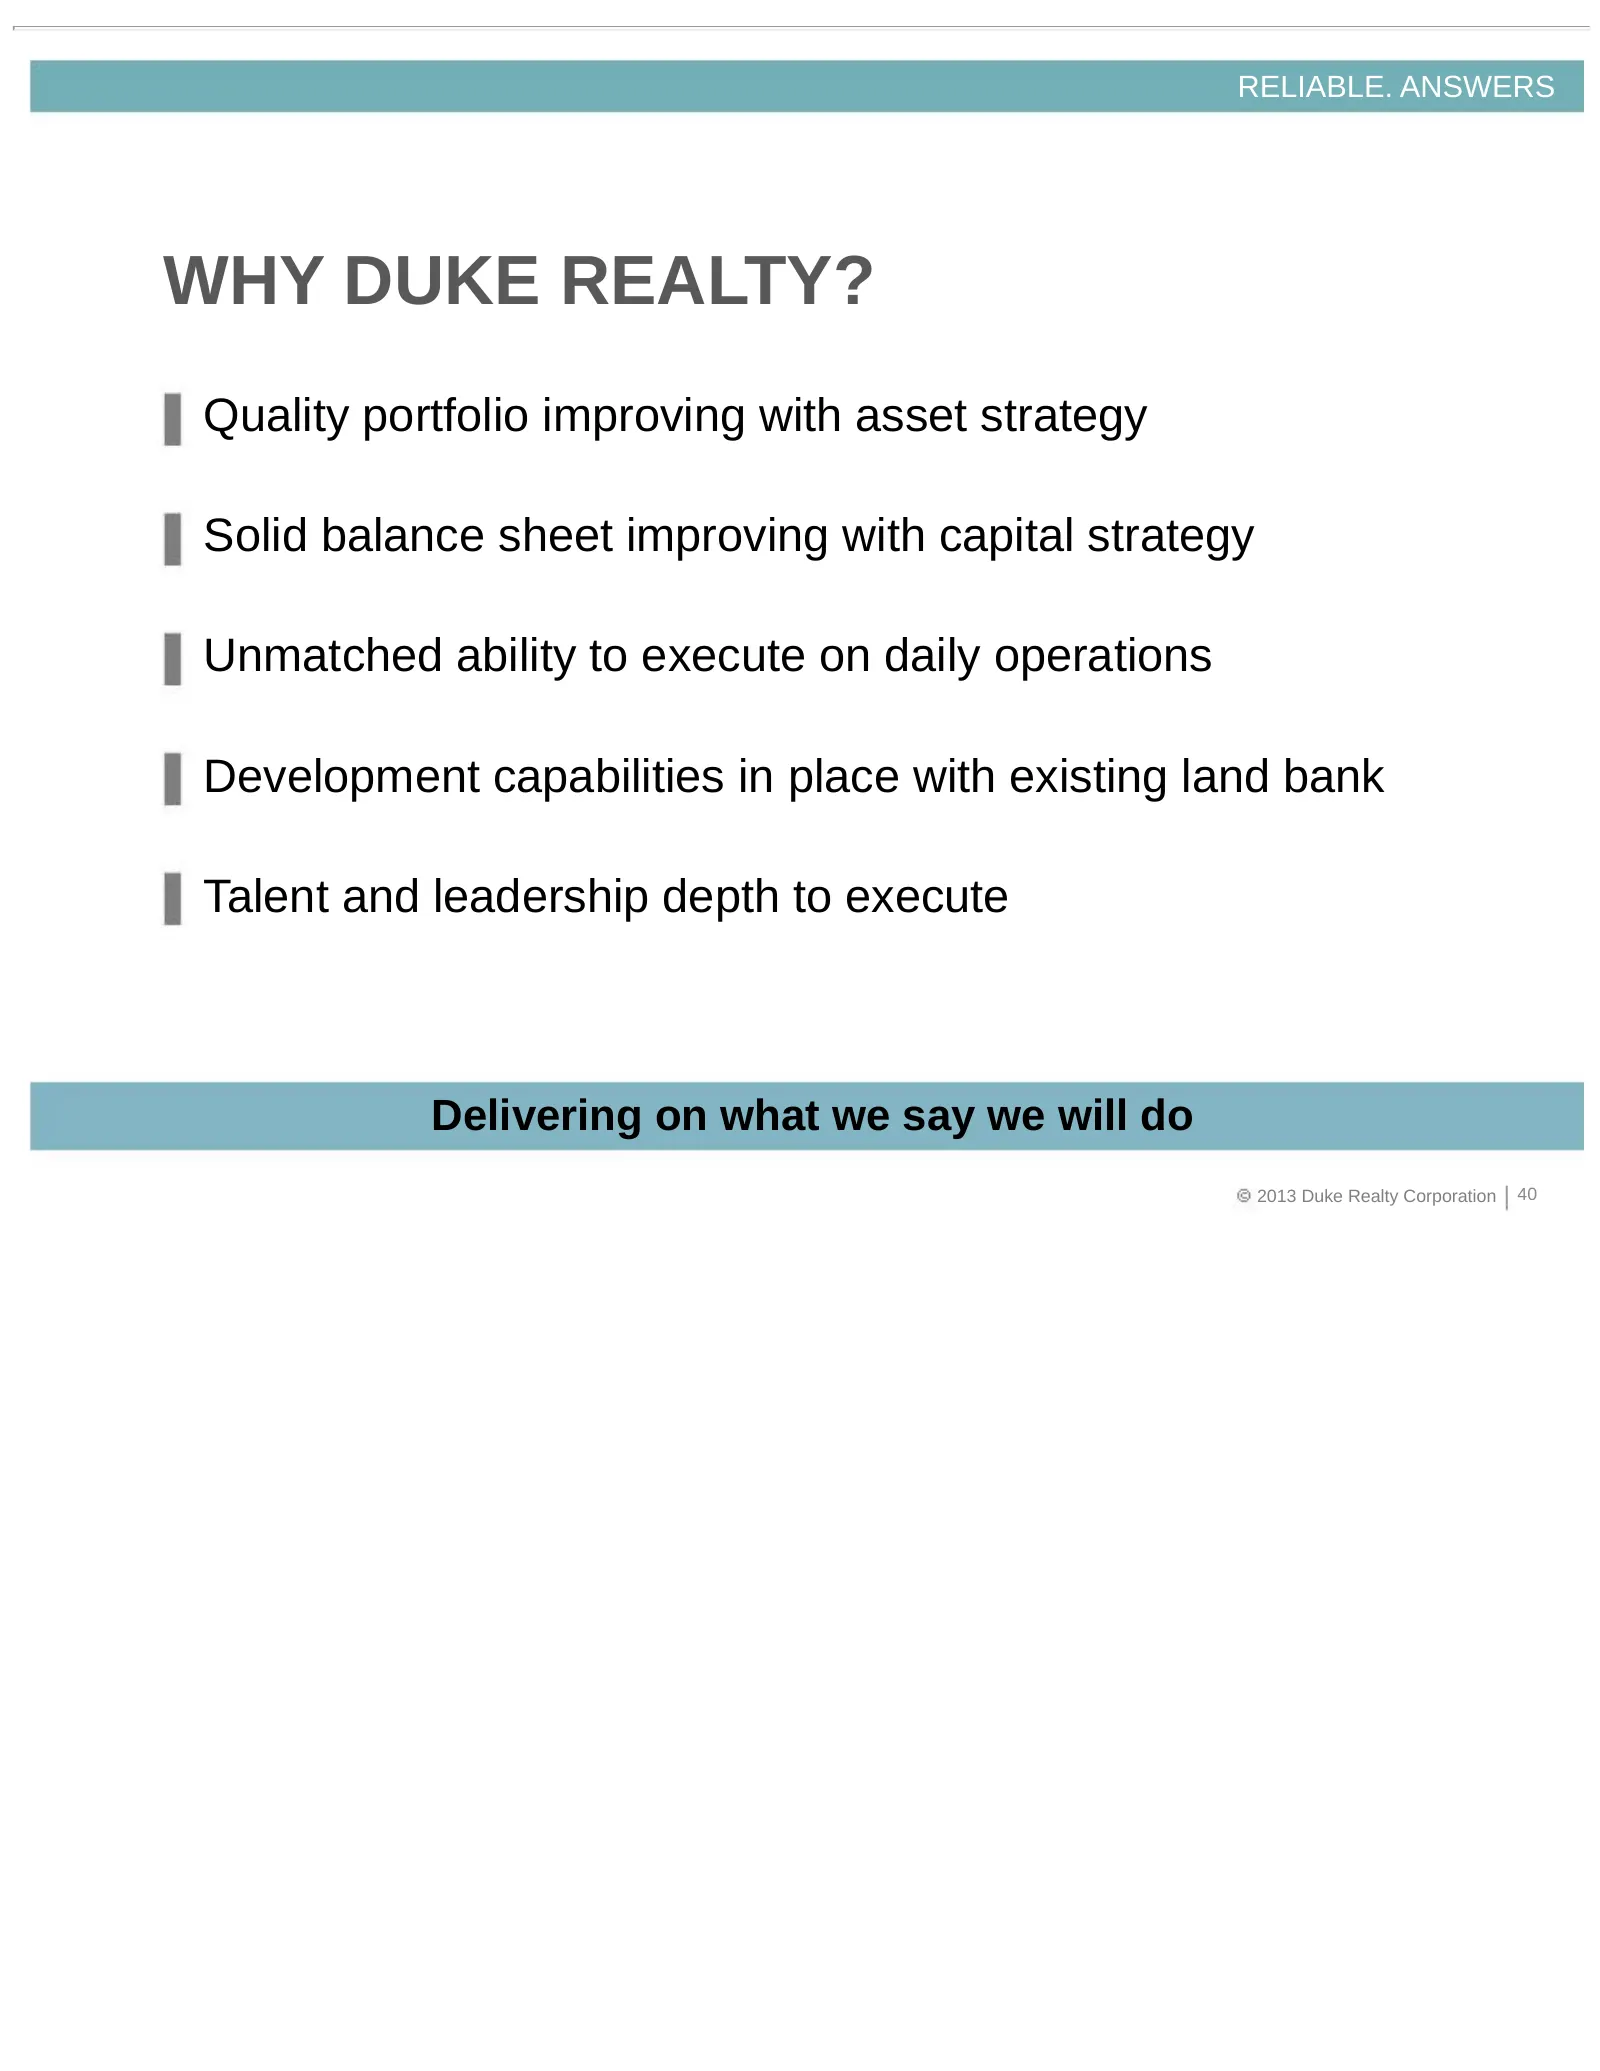
RELIABLE. ANSWERS WHY DUKE REALTY? Quality portfolio improving with asset strategy Solid balance sheet improving with capital strategy Unmatched ability to execute on daily operations Development capabilities in place with existing land bank Talent and leadership depth to execute Delivering on what
Slide 41: 40 Years of Reliability
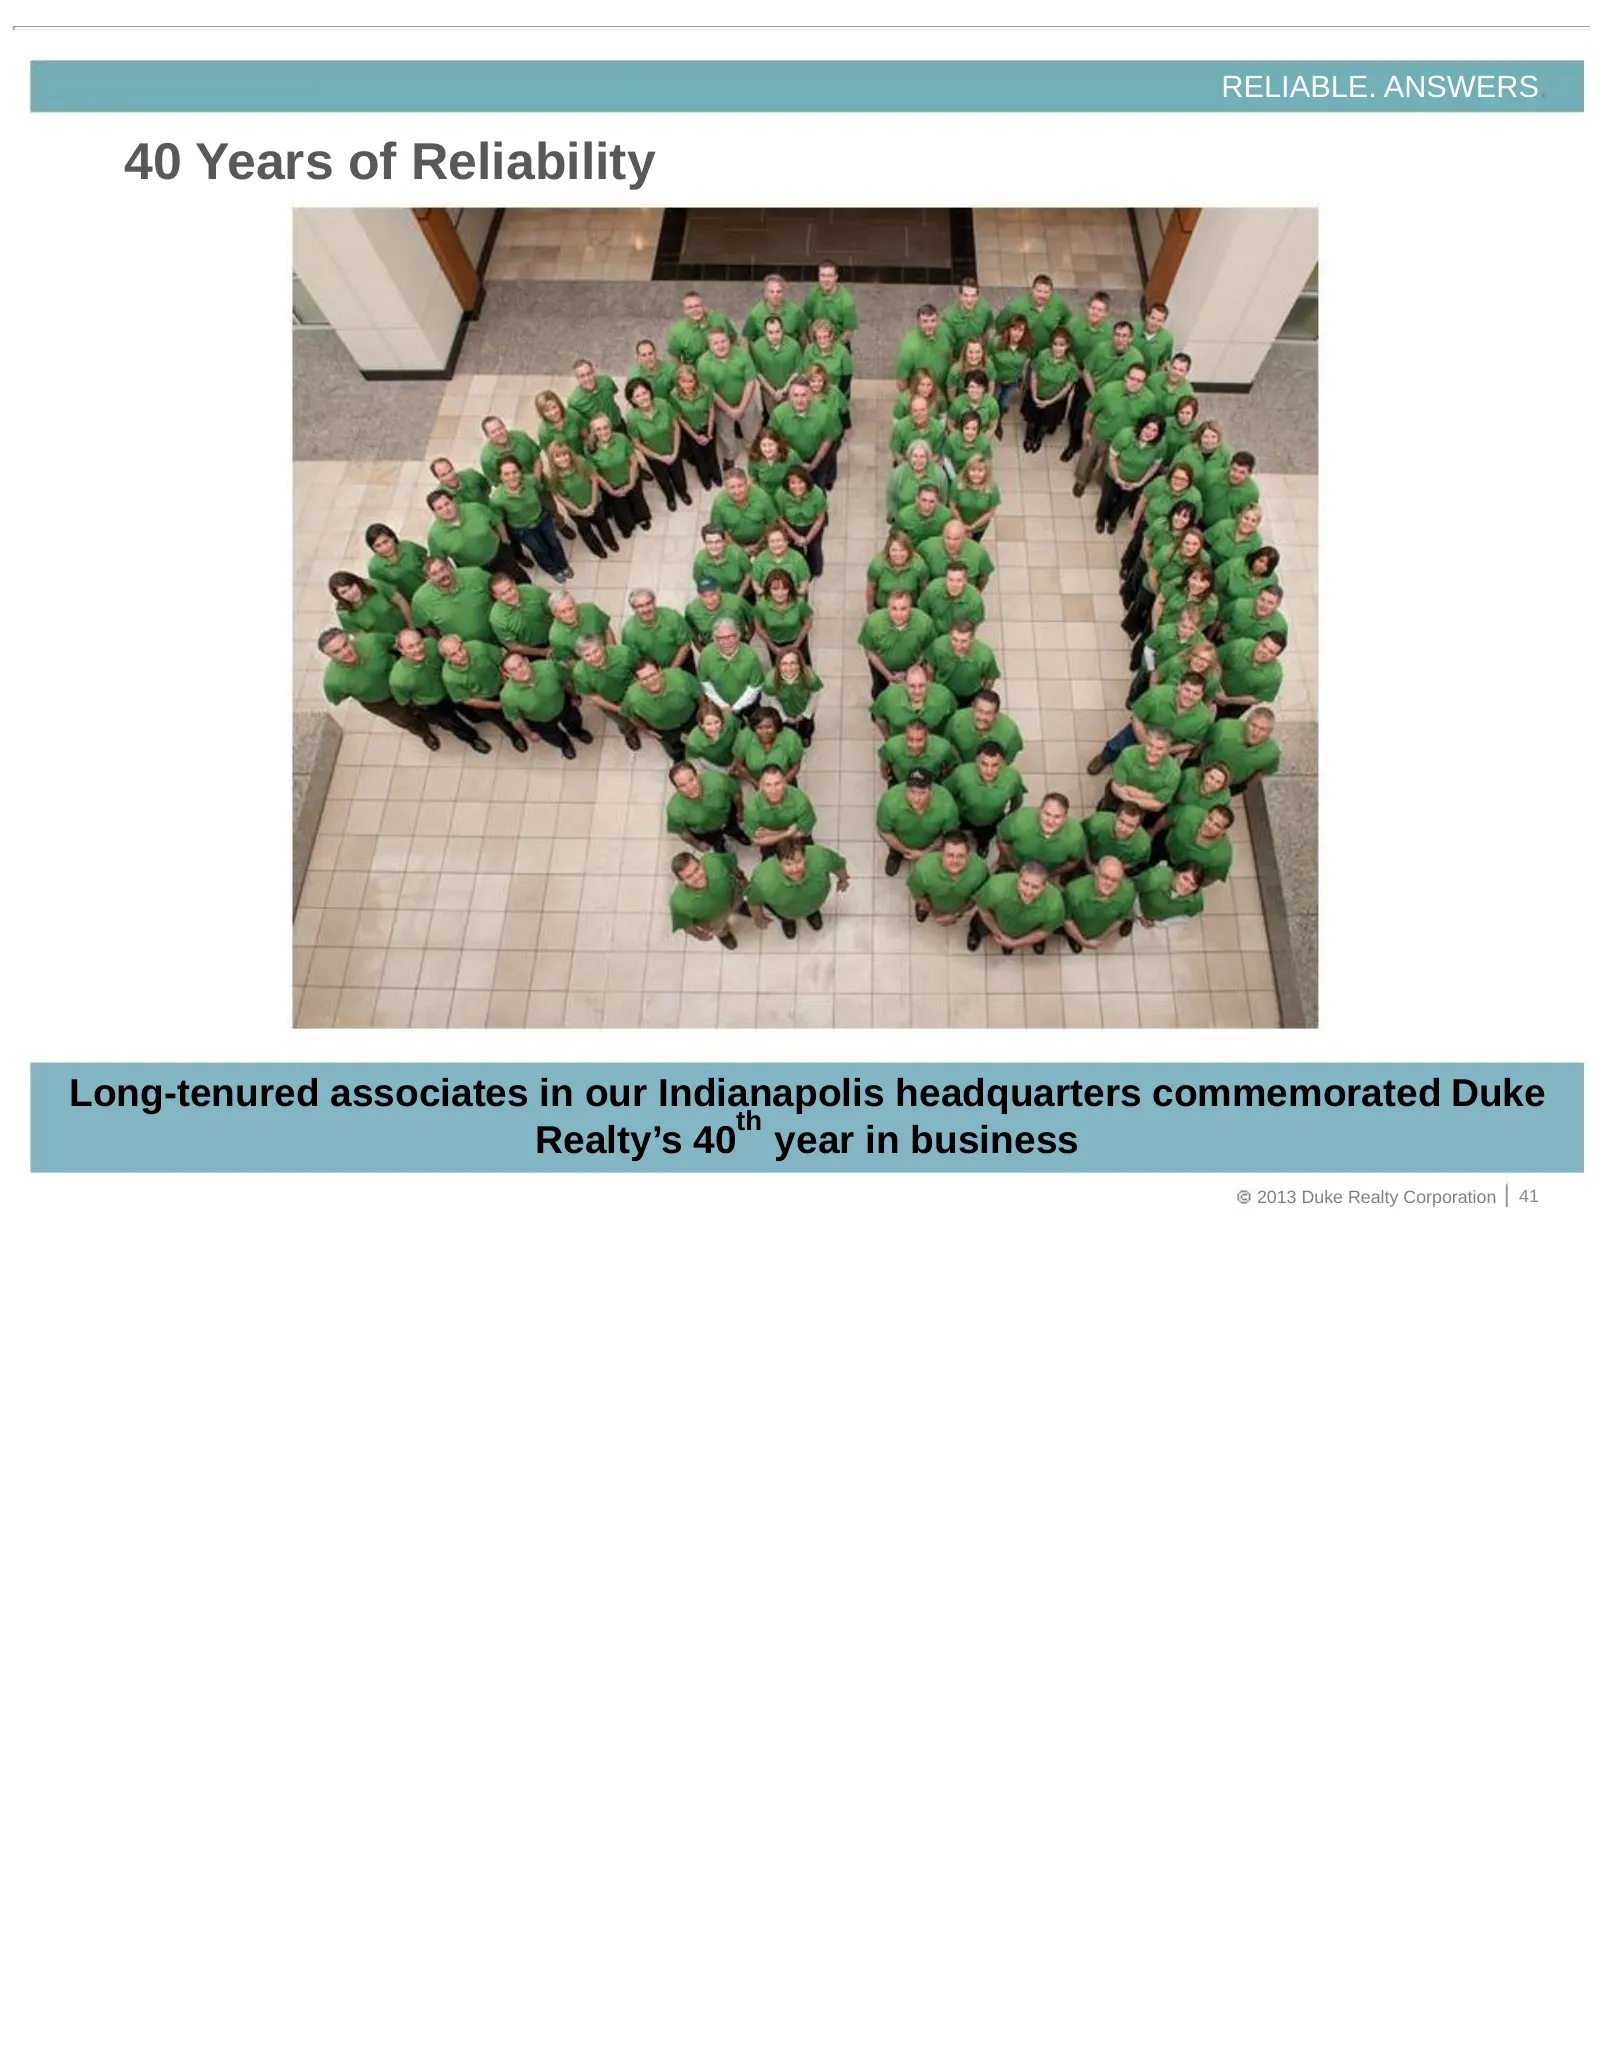
RELIABLE. ANSWERS. 40 Years of Reliability Long-tenured associates in our Indianapolis headquarters commemorated Duke th Realty’s 40 year in business 2013 Duke Realty Corporation 41
Slide 42: Forward-Looking Statement
RELIABLE. ANSWERS. Forward-Looking Statement This slide presentation contains statements that constitute “forward-looking statements” within the meaning of the Securities Act of 1933 and the Securities Exchange Act of 1934 as amended by the Private Securities Litigation Reform Act of 1995. These for
Source: SEC EDGAR · 8-K filed Jun 5, 2013
More decks from Duke Realty Corporation
 Merger or Acquisition (June 2022)14 slides · Jun 13, 2022
 Investor Presentation (June 2021)58 slides · Jun 7, 2021
 Investor Presentation (May 2021)44 slides · May 10, 2021
 Investor Presentation (February 2021)58 slides · Feb 22, 2021
 NAREIT REITworld Virtual Investor Conference 202056 slides · Nov 16, 2020
 B of A Securities 2020 Global Real Estate Conference56 slides · Sep 15, 2020